aide: an automatic user navigation system for interactive...
TRANSCRIPT
AIDE: An Automatic User Navigation System forInteractive Data Exploration
Yanlei Diao±, Kyriaki Dimitriadou∗, Zhan Li∗, Wenzhao Liu±,Olga Papaemmanouil∗, Kemi Peng∗, Liping Peng±
±{yanlei, wenzhao, lppeng}@cs.umass.edu, ∗{kiki, zhanli, kermit, olga}@cs.brandeis.edu±UMass Amherst, ∗Brandeis University
ABSTRACTData analysts often engage in data exploration tasks to discover in-teresting data patterns, without knowing exactly what they are look-ing for. Such exploration tasks can be very labor-intensive becausethey often require the user to review many results of ad-hoc queriesand adjust the predicates of subsequent queries to balance the trade-off between collecting all interesting information and reducing thesize of returned data. In this demonstration we introduce AIDE,a system that automates these exploration tasks. AIDE steers theuser towards interesting data areas based on her relevance feedbackon database samples, aiming to achieve the goal of identifying alldatabase objects that match the user interest with high efficiency.In our demonstration, conference attendees will see AIDE in ac-tion for a variety of exploration tasks on real-world datasets.
1. INTRODUCTIONTraditional DBMSs are suited for applications in which the ques-
tions to be asked are already well understood. There is, however,a class of Interactive Data Exploration (IDE) applications in whichthis is not the case. Examples of such interactive applications in-clude, but are not limited to, scientific computing, financial analy-sis, evidence-based medicine, and genomics.
IDE is fundamentally a long-running, multi-step process withend-goals not stated explicitly. Users try to make sense of the un-derlying data space by navigating through it. The process includesa great deal of experimentation with queries, backtracking on thebasis of query results, and revision of results at various points inthe process. To make the most of the increasingly complex big datasets, users need an automated service to effectively and efficientlyguide them through the data space. One example can be foundin scientific applications (e.g., LSST [3], SDSS [4]) which collectenormous data sets periodically. Here, as data volumes and the usercommunity continue to grow, there is a strong need for interactivedata exploration: that is, when a scientist connects to an extremelylarge database, she may not be able to express her data interestsprecisely. Instead, she may want to navigate through a subspace ofthe data set (e.g., a region of the sky) to find the objects of interest,
This work is licensed under the Creative Commons Attribution-NonCommercial-NoDerivs 3.0 Unported License. To view a copy of this li-cense, visit http://creativecommons.org/licenses/by-nc-nd/3.0/. Obtain per-mission prior to any use beyond those covered by the license. Contactcopyright holder by emailing [email protected]. Articles from this volumewere invited to present their results at the 41st International Conference onVery Large Data Bases, August 31st - September 4th 2015, Kohala Coast,Hawaii.Proceedings of the VLDB Endowment, Vol. 8, No. 12Copyright 2015 VLDB Endowment 2150-8097/15/08.
Relevant Samples, Dr
Irrelevant Samples, Dnr
!"#"$$
%&"''()*"+,-$
./"*0$
12/&,3"+,-$
."4/&0$$
12#3"*+,-$
Unlabeled
Samples, Si
User
Model, Ci
!56.$
7'03$8009:"*;$
Queries
Samples
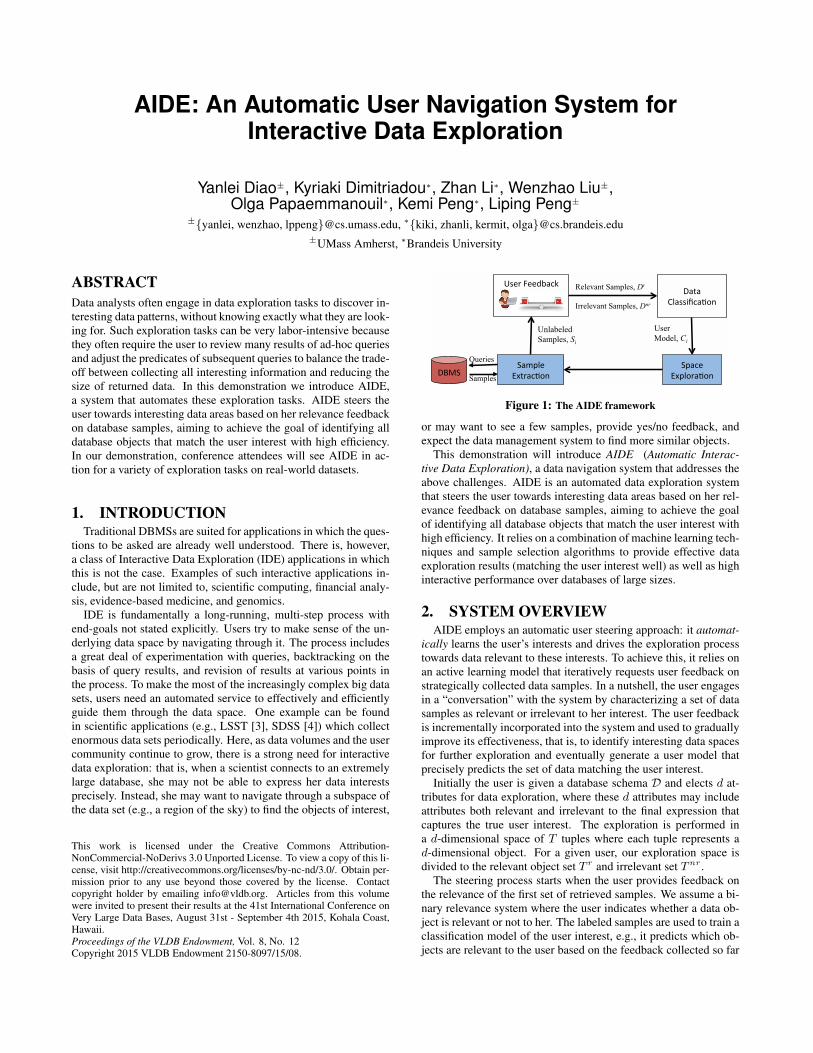
Figure 1: The AIDE framework
or may want to see a few samples, provide yes/no feedback, andexpect the data management system to find more similar objects.
This demonstration will introduce AIDE (Automatic Interac-tive Data Exploration), a data navigation system that addresses theabove challenges. AIDE is an automated data exploration systemthat steers the user towards interesting data areas based on her rel-evance feedback on database samples, aiming to achieve the goalof identifying all database objects that match the user interest withhigh efficiency. It relies on a combination of machine learning tech-niques and sample selection algorithms to provide effective dataexploration results (matching the user interest well) as well as highinteractive performance over databases of large sizes.
2. SYSTEM OVERVIEWAIDE employs an automatic user steering approach: it automat-
ically learns the user’s interests and drives the exploration processtowards data relevant to these interests. To achieve this, it relies onan active learning model that iteratively requests user feedback onstrategically collected data samples. In a nutshell, the user engagesin a “conversation” with the system by characterizing a set of datasamples as relevant or irrelevant to her interest. The user feedbackis incrementally incorporated into the system and used to graduallyimprove its effectiveness, that is, to identify interesting data spacesfor further exploration and eventually generate a user model thatprecisely predicts the set of data matching the user interest.
Initially the user is given a database schema D and elects d at-tributes for data exploration, where these d attributes may includeattributes both relevant and irrelevant to the final expression thatcaptures the true user interest. The exploration is performed ina d-dimensional space of T tuples where each tuple represents ad-dimensional object. For a given user, our exploration space isdivided to the relevant object set T r and irrelevant set Tnr .
The steering process starts when the user provides feedback onthe relevance of the first set of retrieved samples. We assume a bi-nary relevance system where the user indicates whether a data ob-ject is relevant or not to her. The labeled samples are used to train aclassification model of the user interest, e.g., it predicts which ob-jects are relevant to the user based on the feedback collected so far
(Data Classification). The User Model may use any subset of the dattributes of the exploration space to characterize user interests.
Each iteration i refines the characterization of the user interestby exploring further the data space. Specifically, we leverage theprevious user model Ci−1 to identify promising data areas to besampled further (Space Exploration) and to retrieve the next sampleset Si ⊆ T to show to the user (Sample Extraction). Based on thecollected labeled samples up to the i-th iteration, a new user modelCi is generated.
The above steps are executed iteratively towards convergence toa user model that captures the user interest, i.e., eliminating irrel-evant objects while identifying all or most relevant to the user ob-jects. The steering process is completed when the user terminatesthe process explicitly, e.g., when reaching a satisfactory set of rel-evant objects or when she does not wish to label more samples.Hence, the user decides on the effort she is willing to invest (i.e.,number of samples she labels) while the system leverages her feed-back to maximize the accuracy of her user interest model.
Our exploration approach, first introduced in [8], fundamentallydiffers from active learning theory (e.g., [6]) which often requiressearching the entire database to find the “best” sample to show tothe user next. Such exhaustive search is infeasible for ever-growingdatabases sizes and precludes any interactive performance. Instead,AIDE seeks to identify promising subareas of the data space andsamples in those areas that will quickly increase the accuracy of ourmodel, leading to both effective and highly efficient exploration.
2.1 Discovering Linear PatternsIn [8] we introduced a number of data exploration techniques for
discovering linear patterns, i.e., interests captured by conjunctionand/or disjunction of linear (range) predicates. We refer to suchinterests as relevant areas in the d-dimensional exploration space.
To identify linear patterns, our system relies on decision treeclassifiers and includes three exploration phases which are de-signed to improve the F -measure of the final decision treeC on thetotal data space T , defined as F (T ) = 2×precision(T )×recall(T )
precision(T )+recall(T ),
while offering interactive performance to the user. This effective-ness measure captures the trade-off between collecting all relevantinformation and reducing the size of returned data. Next we high-light our exploration techniques. More details can be found in [8].
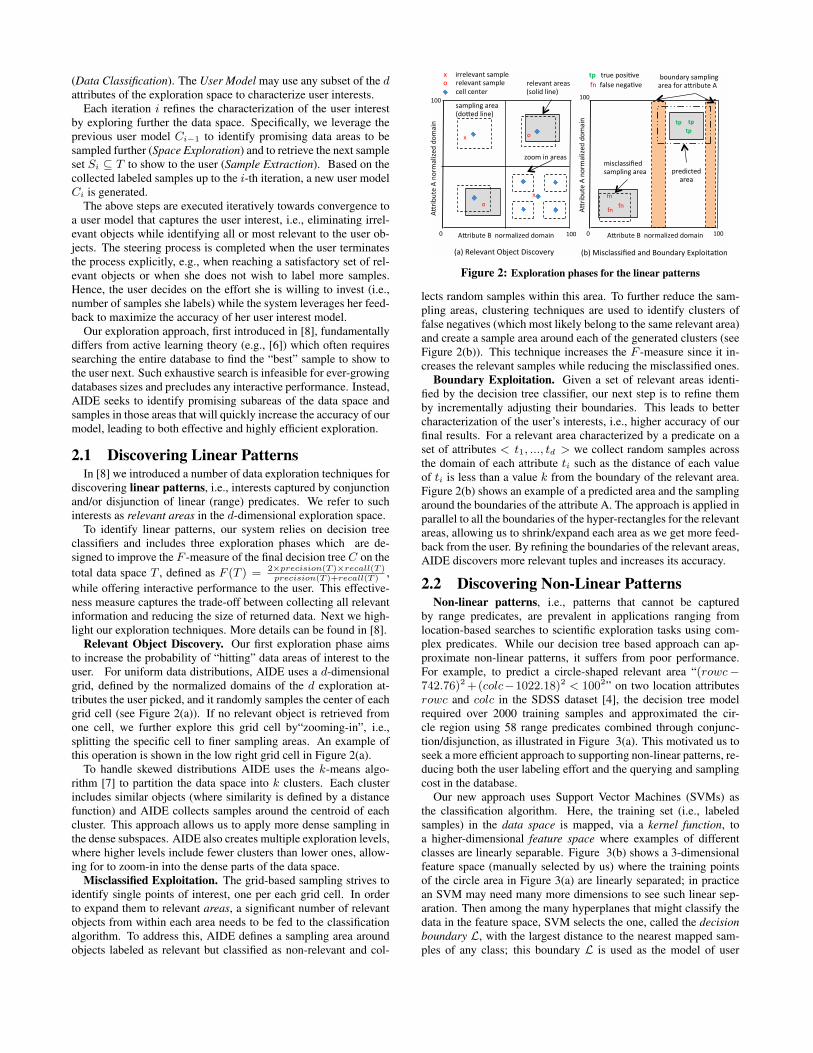
Relevant Object Discovery. Our first exploration phase aimsto increase the probability of “hitting” data areas of interest to theuser. For uniform data distributions, AIDE uses a d-dimensionalgrid, defined by the normalized domains of the d exploration at-tributes the user picked, and it randomly samples the center of eachgrid cell (see Figure 2(a)). If no relevant object is retrieved fromone cell, we further explore this grid cell by“zooming-in”, i.e.,splitting the specific cell to finer sampling areas. An example ofthis operation is shown in the low right grid cell in Figure 2(a).
To handle skewed distributions AIDE uses the k-means algo-rithm [7] to partition the data space into k clusters. Each clusterincludes similar objects (where similarity is defined by a distancefunction) and AIDE collects samples around the centroid of eachcluster. This approach allows us to apply more dense sampling inthe dense subspaces. AIDE also creates multiple exploration levels,where higher levels include fewer clusters than lower ones, allow-ing for to zoom-in into the dense parts of the data space.
Misclassified Exploitation. The grid-based sampling strives toidentify single points of interest, one per each grid cell. In orderto expand them to relevant areas, a significant number of relevantobjects from within each area needs to be fed to the classificationalgorithm. To address this, AIDE defines a sampling area aroundobjects labeled as relevant but classified as non-relevant and col-
!"#$%&'()!)*+#,
-.$/(0)0+,-$*))
!"#$%&'()1))*+#,-.$/(0)0+,-$*)
2(..)2(*'(#)
+)))))#(.(3-*')4-,5.()
6)
6)))))$##(.(3-*')4-,5.()
6)
+)
)7) )877)
)877)
!"#$%&'()!)*+#,
-.$/(0)0+,-$*))
!"#$%&'()1))*+#,-.$/(0)0+,-$*)
9*)
)7) )877)
)877)
/++,)$*)-#(-4)
:-;)<(.(3-*')=%>(2')?$42+3(#@)
#(.(3-*')-#(-4)
:4+.$0).$*(;)
+)
9*))9-.4()*(A-B3()
,$42.-44$C(0)
4-,5.$*A)-#(-)
:%;)D$42.-44$C(0)-*0)1+&*0-#@)E65.+$'-B+*)
9*)
9*)
4-,5.$*A)-#(-)
:0+"(0).$*(;)
5#(0$2'(0))
-#(-)
)))%+&*0-#@)4-,5.$*A))
))-#(-)9+#)-"#$%&'()!)
!")
!")
!")
!")))'#&()5+4$B3()
Figure 2: Exploration phases for the linear patterns
lects random samples within this area. To further reduce the sam-pling areas, clustering techniques are used to identify clusters offalse negatives (which most likely belong to the same relevant area)and create a sample area around each of the generated clusters (seeFigure 2(b)). This technique increases the F -measure since it in-creases the relevant samples while reducing the misclassified ones.
Boundary Exploitation. Given a set of relevant areas identi-fied by the decision tree classifier, our next step is to refine themby incrementally adjusting their boundaries. This leads to bettercharacterization of the user’s interests, i.e., higher accuracy of ourfinal results. For a relevant area characterized by a predicate on aset of attributes < t1, ..., td > we collect random samples acrossthe domain of each attribute ti such as the distance of each valueof ti is less than a value k from the boundary of the relevant area.Figure 2(b) shows an example of a predicted area and the samplingaround the boundaries of the attribute A. The approach is applied inparallel to all the boundaries of the hyper-rectangles for the relevantareas, allowing us to shrink/expand each area as we get more feed-back from the user. By refining the boundaries of the relevant areas,AIDE discovers more relevant tuples and increases its accuracy.
2.2 Discovering Non-Linear PatternsNon-linear patterns, i.e., patterns that cannot be captured
by range predicates, are prevalent in applications ranging fromlocation-based searches to scientific exploration tasks using com-plex predicates. While our decision tree based approach can ap-proximate non-linear patterns, it suffers from poor performance.For example, to predict a circle-shaped relevant area “(rowc−742.76)2 +(colc−1022.18)2 < 1002” on two location attributesrowc and colc in the SDSS dataset [4], the decision tree modelrequired over 2000 training samples and approximated the cir-cle region using 58 range predicates combined through conjunc-tion/disjunction, as illustrated in Figure 3(a). This motivated us toseek a more efficient approach to supporting non-linear patterns, re-ducing both the user labeling effort and the querying and samplingcost in the database.
Our new approach uses Support Vector Machines (SVMs) asthe classification algorithm. Here, the training set (i.e., labeledsamples) in the data space is mapped, via a kernel function, toa higher-dimensional feature space where examples of differentclasses are linearly separable. Figure 3(b) shows a 3-dimensionalfeature space (manually selected by us) where the training pointsof the circle area in Figure 3(a) are linearly separated; in practicean SVM may need many more dimensions to see such linear sep-aration. Then among the many hyperplanes that might classify thedata in the feature space, SVM selects the one, called the decisionboundary L, with the largest distance to the nearest mapped sam-ples of any class; this boundary L is used as the model of user

���
���
����
����
����
��� ��� ��� ���
����
����
(a) A circle area (green area) approxi-mated by decision trees (blue area), withtraining points in 2-D data space (red: Y,green: N).
������
��������
��������
����
����
����
����
��
��
����
����
����
����
��
(b) Linear separation of training pointsin a 3-D feature space using SVM (red:Y, green: N).
!"#$%%&'()*+),% !"#$%%-.,,/+01'+%
!"#$%
&'()*+,-*.%
/012,)03,-*.%4+5)56,.7%*891:%1,;()0.<%,+5,1=%
&'()*+,-*.%$(,>5%
/012,)03,-*.%4?*;,0.%0.@*:%1>A5;,=%%
B55?8,>C%D*))5>-*.%
#*?5)%%
E5,+.0.<%%
4?5>010*.%7+55:%$/#=%%
$(,>5%%
&'()*+,-*.%
$,;()5%%
D*))5>-*.%
B55?8,>C%
&'()*+,-*.%
!,7,%
FG+08275%
$5)5>-*.%
H5)56,.>5%%
B55?8,>C%
&'()*+,-*.%%
/05I%
(c) AIDE architecture.
Figure 3: (a-b) SVM for learning a non-linear (circle) relevant area and (c) the AIDE architecture.
interest as it separates relevant from irrelevant objects. The mainchallenge here is to identify at each iteration of the exploration pro-cess, the next to-be-labeled sample that can quickly improve theaccuracy of the current user model L.
Recent active learning theory [6] proposed to choose the exam-ple closest to the current decision boundary. However, they suggesta search through the entire dataset in each iteration, which is pro-hibitively expensive. AIDE puts active learning theory into prac-tice: we find the unlabeled example closest to the current decisionboundary L without retrieving all the tuples and evaluating theirdistances to L. AIDE includes the following two techniques foridentifying samples to show to the user in each iteration.
Bounding the search area using decision trees. We define aδ-region around the current SVM decision boundary L and form atwo-class training dataset such that points inside the δ-region arethe relevant class and points outside the δ-region are not. Then adecision tree can be trained to approximate the δ-region and can beeasily translated to an exploration query, Q, to send to the databaseD. Finally given the query result Q(D) ⊆ D, we iterate over thisset and find the example closest to L. Note that δ can be set tobalance two trends: a too small δ can lead to too few training pointsin the relevant class while a too large δ may result in Q(D) = D.
Branch and bound search. AIDE also builds indexes such asR-trees [5] and CF trees [9] over the database, and perform fastbranch-and-bound search over these indexes. Take R-tree for ex-ample. Each R-tree node offers a hyper-rectangle, [aj , bj ], j =1, . . . , d, as a minimum bounding box of all the data points reach-able from this node. Given the current SVM decision boundaryL, we search the R-tree top-down in a depth-first fashion and al-ways maintain the current closest tuple, x∗, and its distance to L,f(x∗,L)
def= f∗. Note that f∗ = +∞ before any leaf node is vis-
ited. For each intermediate node visited, we dynamically computea lower bound of the distance from any point in its hyper-rectangleto L by calling a constrained optimization solver: minx f(x,L)
s.t. aj ≤ x(j) ≤ bj , j = 1, . . . , d. If the lower bound is alreadyhigher than f∗, we can prune the entire subtree rooted at this node.Once we reach a leaf node, we can update x∗ and f∗ accordingly.Then the final x∗ is the closest tuple to L in the entire database.
3. USER INTERFACEOur AIDE prototype is designed on top of a traditional relational
database system and its architecture (shown in Figure 3(c)) includesthree software layers: (1) an interactive visualization front-end, (2)the AIDE middleware that implements all our exploration tech-niques as detailed in §2.1 to §2.2, and (3) a database backend sup-porting our data exploration techniques.
Our visualization front-end provides several functionalities. The
user is initially presented with the database schema and she can se-lect an initial subset of attributes of interest, which will be refinedlater by the data exploration. Our front-end can also visualize do-main distributions of each attribute to further allow the user to filterattributes based on the domain characteristics and restrict the valueranges of the relevant attributes for consideration (e.g., focus on adense region or a region close to a landmark). Users can select be-tween different types of plots of the underlying data distributions,such as histograms and heat maps. Figure 4(a) shows a histogramexample on an attribute in the SDSS [4] dataset.
In the next step the system starts a series of iterations of samplelabeling, model learning and space exploration. The visualizationfront-end supports this process by visualizing various subspaces ofthe exploration attributes, presenting data samples to the user, col-lecting yes/no labels from the user regarding the relevance of theshown samples and showing the locations of labeled samples in theexploration space. Figure 4(b) shows an example of this interface.
Sitting below the visualization front-end is the “automatic usersteering” layer (AIDE middleware in Figure 3(c)), which is theheart of our system. This component is implemented in Java, witha few machine learning libraries integrated in the system. At eachiteration it incorporates the newly collected labeled samples andgenerates a new classification model. At any point the user can re-quest a visualization of the current user model (i.e., decision treeor SVM decision boundary) which entails highlighting the objectsclassified as relevant to the user. The user can then decide to stopthe exploration (if she is satisfied with the current set of identifiedobjects) or to proceed to the next round of exploration.
The database backend uses PostgreSQL. The database engine in-cludes various sampling techniques implemented as stored proce-dures. These techniques are designed to support the explorationapproaches we discussed in §2.1 to §2.2. For example one proce-dure supports the decision tree approach to learning linear patterns(§2.1) by selecting a predefined number of random samples withina given distance from the center of a d-dimensional area, whileother procedures support random and weighted sampling.
4. DEMONSTRATIONIn our demonstration attendees will be able to explore the fol-
lowing real world datasets.1. AuctionMark [1]: It includes information on action items and
their bids (e.g., the initial/current price, number of bids, andnumber of days an item in an auction). We expect that atten-dees will have a sufficient understanding of this domain andwill be able to easily formulate ad-hoc, intuitive, explorationtasks (e.g., “identify auction items that are good deals”). Thisdataset has size of 1.77GB.

(a) Histogram visualization for exploration attributes. (b) Exploration visualization (learned areas, labeled samples).Figure 4: AIDE Frontend Interface
2. Sloan Digital Sky Survey [4]: This is a scientific data setgenerated by digital surveys of stars and galaxies and it isoften used by astronomers to find “observations” of interest-ing sky objects. It has a complex schema and a large datasize. We will use it to demonstrate the efficiency of our opti-mizations. Furthermore, this dataset includes attributes withdifferent value distributions, allowing us to experiment withboth skewed and uniform exploration spaces. We will usevarious datasets with size of 1GB-100GB.
We are also investigating alternative datasets that include bothnumerical and categorical domains (e.g., US housing and used carsdatasets available through the DAIDEM Lab [2]).
During the demonstration, we will run AIDE on two laptop ma-chines and our backend will use the PostgreSQL database engine.Smaller datasets will be stored on the local disk and an externalhard drive will be used for our largest datasets.
Our audience will observe the following demonstration scenar-ios for predicting both linear and non linear patterns of user in-terests. Specifically, we will demonstrate the effectiveness of thedecision tree based techniques described in §2.1 for predicting lin-ear patterns, while we will demonstrate the SVM-based techniquesdescribed in §2.2 by predicting non linear patterns.
Scenario 1: System utility In this scenario, attendees will ex-plore our system’s utility by comparing it to the traditional manualexploration approach. Specifically, they can pick a dataset and a setof exploration attributes, and then start an ad-hoc search for “inter-esting” areas (e.g., search for “good deals” in the Auctions [1]”) bywriting their own series of SQL queries that potential captures thatinterest. After reviewing their results they can adjust their querypredicates aiming to collect only relevant objects. This iterativeprocess will continue until the users are satisfied with their queryoutput. The results of final query will be then treated as the user’sinterest, i.e., her relevant objects, and we will use AIDE to automat-ically identify them. Using AIDE attendees will review and providerelevance feedback only on a few selected samples. Attendees willobserve that through AIDE their relevant objects can be identifiedwith significant less reviewing effort and user wait time, similar tothe results of our user study [8].
Scenario 2: System step-through In this scenario we willdemonstrate to attendees the exploration techniques used by oursystem. Attendees can start searching for interesting areas usingAIDE and at each iteration, they will observe through our front-end: (a) the collected relevance feedback on data samples, (b) theprediction of the current classification model, and (c) the samplingareas for collecting the next set of samples. Using our visualiza-tion interface we will guided them step-be-step through each of the
techniques described in §2.1 to §2.2, demonstrating how they leadto the selection of the sampling areas for the next iteration. Thisscenario will work with either pre-defined relevant areas (i.e., forwhich the relevance feedback is known a-priori) or ad-hoc relevantareas that the attendees have highlighted for us through the visual-ization interface. In both cases, the target set of relevant objects areknown in advance which will allow attendees to confirm that AIDEimproves its accuracy in each iteration.
Scenario 3: Optimization effectiveness This scenario will usepre-defined relevant areas and attendees will be able to observe var-ious real-time experiments with a range of queries and explorationspaces by adjusting various “knobs” such as the data size, the num-ber of exploration attributes, and data distributions (i.e., degree ofskewness). They will also be able to change the configuration ofrelevant areas (i.e., “large” vs “small” areas, the number of rele-vant areas) and observe the effects on our system effectiveness andefficiency. In addition, attendees will be able to select the explo-ration techniques and optimizations that AIDE applies and observethe impact on the user wait time and accuracy.
5. CONCLUSIONThrough our demonstration of AIDE we will illustrate that (a) it
is feasible to automate the labor-intensive task of data exploration,and (b) combining machine learning algorithms and data manage-ment optimizations can lead to interactive exploration performanceand reduction of the user exploration and data reviewing effort.
6. ACKNOWLEDGMENTSThis work was funded in part by NSF under grants IIS-1253196
and IIS-1218524 and a gift from HP Labs.
7. REFERENCES[1] AuctionMark Benchmark, http://hstore.cs.brown.edu/projects/auctionmark/.[2] DIADEM Lab, University of Oxford,
https://www.cs.ox.ac.uk/projects/DIADEM/.[3] Large Synoptic Survey Telescope, http://http:/www.lsst.org/.[4] Sloan Digital Sky Survey, http://www.sdss.org/.[5] N. Beckmann, H.-P. Kriegel, et al. The R*-Tree: An Efficient and Robust Access
Method for Points and Rectangles. In SIGMOD, 1990.[6] A. Bordes, S. Ertekin, et al. Fast kernel classifiers with online and active
learning. J. Mach. Learn. Res., 6:1579–1619, Dec. 2005.[7] L. Breiman, J. H. Friedman, et al. Classification and Regression Trees. Chapman
and Hall/CRC, 1984.[8] K. Dimitriadou, O. Papaemmanouil, and Y. Diao. Explore-by-Example: An
Automatic Query Steering Framework for Interactive Data Exploration. InSIGMOD, 2014.
[9] T. Zhang, R. Ramakrishnan, and M. Livny. BIRCH: An Efficient Data ClusteringMethod for Very Large Databases. In SIGMOD, 1996.