ahlstrom · sales (€'m) 1490 1553 1169 1210 ebit 82 99 77 73 ... production converter...
TRANSCRIPT
1
AhlstromThe global source for fiber-based materials
SEB Enskilda Nordic SeminarCopenhagen, January 10, 2007
Jari Mäntylä, CFO

2
Table of contents
I Ahlstrom in briefII Achieving profitable growthIII Improving competitiveness IV Financial performance

3
Section I
Ahlstrom in brief

4
Investment highlights
Investment highlights Financial overview (1)
1) Continuing business excluding non-recurring items IFRSNotes:
Sales split, 2005
Europe64 %
Others5 %Asia
9 %
North America
22 %
Q1-Q3 Q1-Q3
2004 2005 2005 2006
Sales (€'m) 1490 1553 1169 1210
EBIT 82 99 77 73
EBIT margin % 5.5 % 6.4 % 6.6 % 6.0 %
Asset turnover 1.6 1.6 1.6 1.7
ROCE % 9.1% 10.5% 10.8 % 10.4 %
• Leading specialty materials supplier
• Operating in global growth businesses
• Innovative products with leading market positions
• Well positioned for growth outside Europe
• Efficient use of capital
• Attractive dividend policy
5
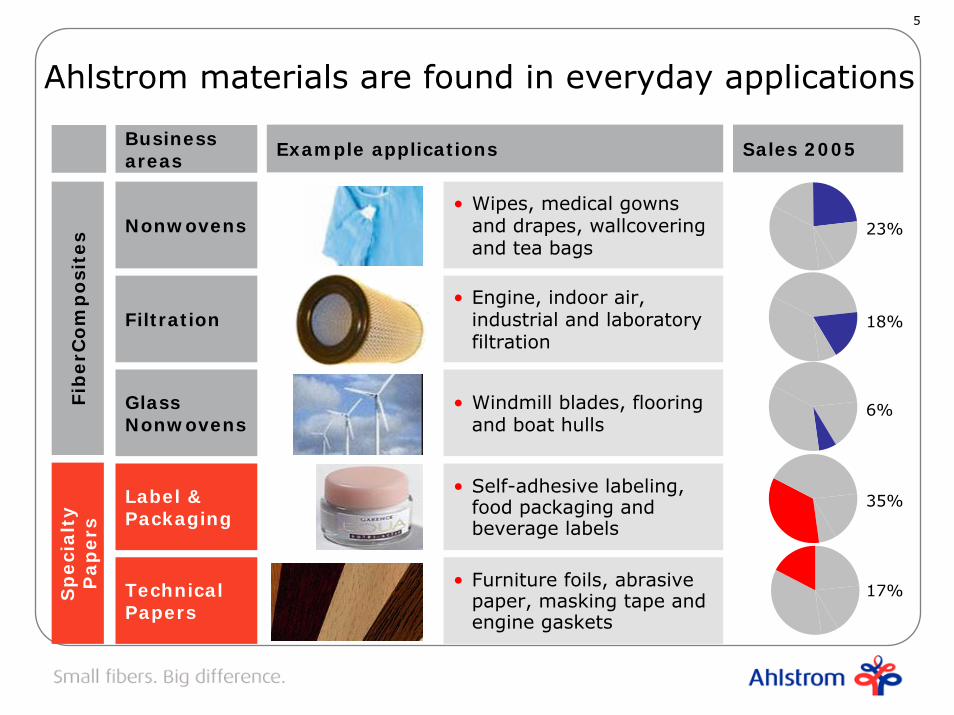
Nonwovens
Example applicationsBusiness areas
Filtration
Glass Nonwovens
Label & Packaging
Technical Papers
Sales 2005
Fib
erC
om
po
site
sS
peci
alt
y
Pap
ers
23%
18%
6%
35%
17%
Ahlstrom materials are found in everyday applications
• Wipes, medical gowns and drapes, wallcoveringand tea bags
• Engine, indoor air, industrial and laboratory filtration
• Windmill blades, flooring and boat hulls
• Self-adhesive labeling, food packaging and beverage labels
• Furniture foils, abrasive paper, masking tape and engine gaskets

6
Roll goodsproducer
Pulp producers
Synthetic fiber producers(PET, PP, glass)
Chemicalsuppliers
Healthcare and consumer goods suppliers
Transportation industrysuppliers
Air and liquid filter manufacturers
Packaging industry
Printers and siliconizers (label, decor, poster, wallcover)
Consumer or industrial brands
Raw materialsupplier
Primaryproduction Converter
Marketer/seller
Consumers
Industrial customers
Naturalfibers (wood,cotton, hemp)
Oil/petro-chemicals Other roll
goods producers:
BBAPGIArjo Wiggins
Ahlstrom has a clear focus in the value chain

7
Specialty papers market positions(1)
Wausau-Mosinee
Cham Paper Group
UPM
Felix-Schoeller
August Koehler
Arjo Wiggins
IP
Stora Enso
Mead Westvaco
Ahlstrom
050010001500
Tons'000
Leading specialty materials supplier in the world
(2)
Nonwovens market positions(3)
Owens-Corning
Companhia Providencia
Buckeye
Johns Manville
Ahlstrom
PGI
BBA
Kimberly-Clark
Freudenberg
DuPont
0 500 1000 1500$'m
1) Source: Jaakko Pöyry ConsultingNotes:2) Ahlstrom Specialty Papers volume3) Source: Nonwovens Industry 2006
8
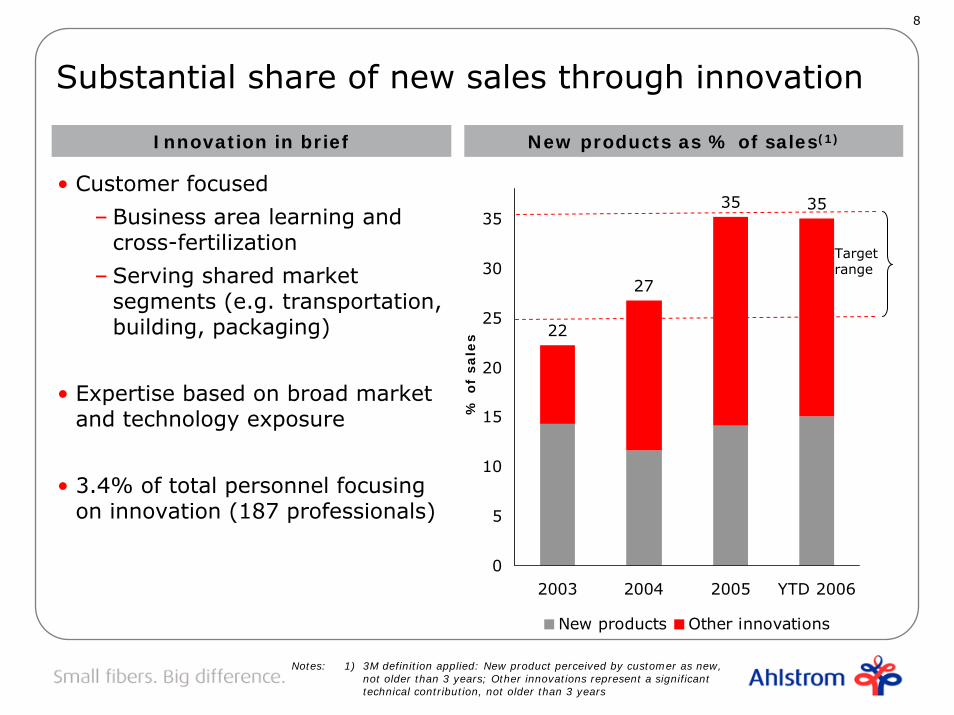
22
27
35 35
0
5
10
15
20
25
30
35
2003 2004 2005 YTD 2006
% o
f sa
les
New products Other innovations
• Customer focused
– Business area learning and cross-fertilization
– Serving shared market segments (e.g. transportation, building, packaging)
• Expertise based on broad market and technology exposure
• 3.4% of total personnel focusing on innovation (187 professionals)
Substantial share of new sales through innovation
Innovation in brief New products as % of sales(1)
1) 3M definition applied: New product perceived by customer as new,not older than 3 years; Other innovations represent a significant technical contribution, not older than 3 years
Notes:
Target range
9
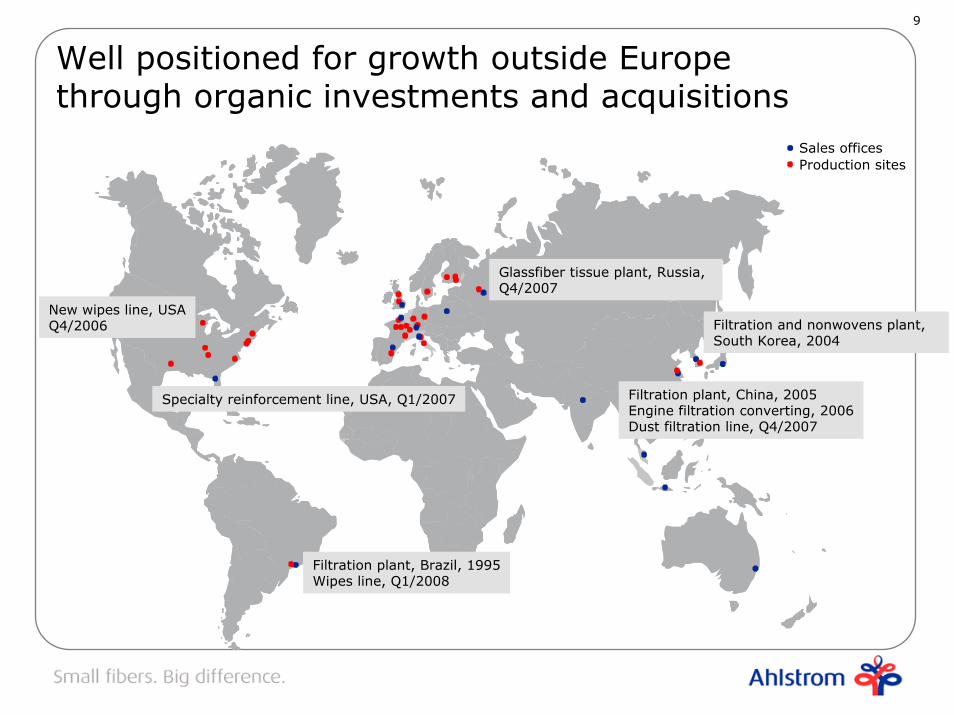
Well positioned for growth outside Europethrough organic investments and acquisitions
Sales officesProduction sites
Glassfiber tissue plant, Russia, Q4/2007
Filtration plant, China, 2005Engine filtration converting, 2006Dust filtration line, Q4/2007
Filtration and nonwovens plant,South Korea, 2004
Filtration plant, Brazil, 1995Wipes line, Q1/2008
Specialty reinforcement line, USA, Q1/2007
New wipes line, USAQ4/2006

10
Section II
Achieving profitable growth

11
Operating in businesses with high growth
FiberComposites Specialty papers
3-4% growth
• Driven by growth in release base and décor paper
– Increased demand of product labelling in Eastern Europe and Asia
– Interior decoration boom (i.e. IKEA type of furniture)
6-7% growth
• Substitution of products traditionally made from textiles, paper or plastic
• Convenience and hygiene
• Product development and new applications
High growth areas are wiping fabrics, filtration media, glass non-woven for marine and windmill markets and release base and décorpapers
On average Ahlstrom markets are growing 4-5% per year
Drivers
Growth
12
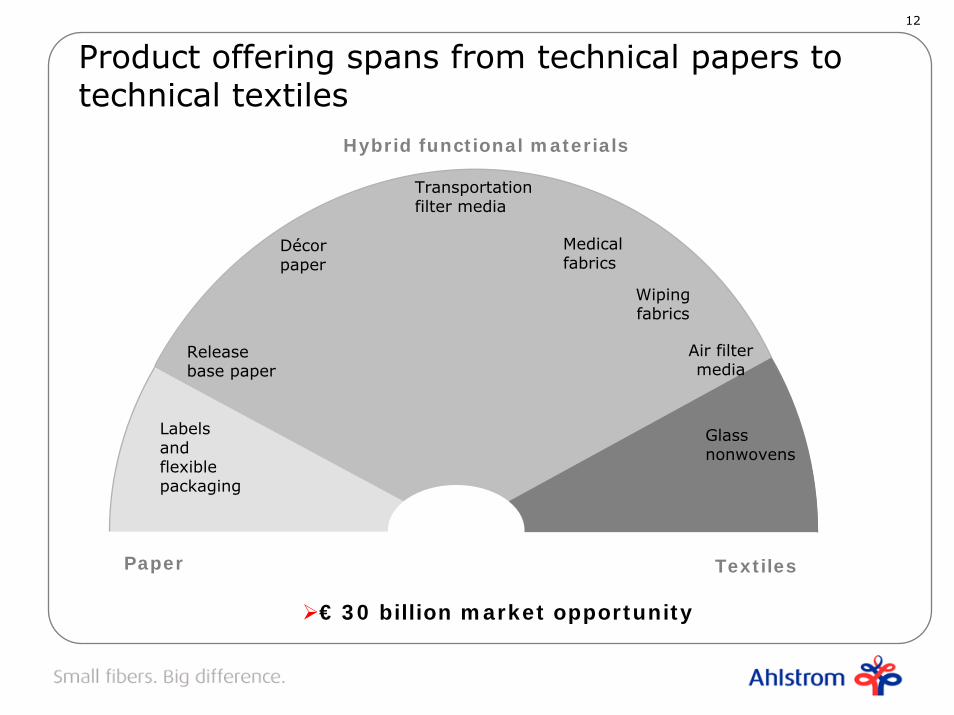
Product offering spans from technical papers to technical textiles
€ 30 billion market opportunity
Hybrid functional materials
Paper Textiles
Release base paper
Décor paper
Transportation filter media
Wiping fabrics
Medical fabrics
Labels and flexible packaging
Air filter media
Glass nonwovens

13
Volume growth yOy1
Organic investments driving future sales growth
1) Source for FiberComposites and Specialty Papers annual volume growth: Inda/Edana, Pira International, JEC Group and Ahlstrom management
Notes:
9-10%
5-7%
Wipes
Glassfiber reinforcements
Release base paper
Windmill + 10%
Marine +5%
2%-4%
5%Air & liquid filtration
Transport filtration
Ahlstrom actions
New plant, Brazil, 2008New lines, USA, 2004, 2006Acquisition of Greenbay, USA 2004
Expansion, Finland, 2006 New line, USA, 2007
Capacity increase, Italy, 2004 , 2006 France, 2007
Korea and Turin expansion, 2004, Brazil, 2003
New line, China, 2007Acquisitions: Hollinee, 2004, Lantor2005, HRS Textiles 2005
Glassfiber tissue**Russia 10%
Machine speed-up, Finland, 2005New plant, Russia, 2007
Industrial nonwovens7% New line, France, 2007
5%Infusion products
New line, UK, 2008

14
Investments in implementation phase
Investment commitment of approximately EUR 120 million
Investment criteria:1.5 x investment in net sales in 3-5 years13 % ROCE target
Investment Business area Start-up
Darlington, USA, specialty glassfiber reinforcement plant Glass nonwovens Q1/2007
La Gère, France, releaseliner capacity expansion Label & packaging Q2/2007
Wuxi, China, needlepunch line for dust filtration Filtration Q3/2007
Tver, Russia, glassfiber tissue plant Glass nonwovens Q4/2007
Brignoud, France, needlepunch line for industrial nonwovens Nonwovens Q4/2007
Louveira, Brazil, spunlace line for wipes Nonwovens Q1/2008
Chirnside, UK, spunmelt line for infusion materials Nonwovens Q4/2008

15
Ahlstrom shared platform• Roll goods- technical papers to technical textiles• Shared manufacturing processes• Global sales network• Centralized raw material purchasing• Common IT solutions• Performance excellence- sharing of best practices
Leveraging advantages of scale
Fiber-based specialty materials−Serving growing market of €30 billion
Platform available to add synergistic businesses through organicand acquisitive growth
16
Section III
Improving competitiveness

17
ROCE target of 13%
Growing topline
Improving capital efficiency
Improving margins
Target ROCE 13%
Q1-Q3 2006 ROCE*:10.4%
EBIT range 6%-9% over cycle
Asset turnover minimum 1.7x
* excluding non-recurring items
18
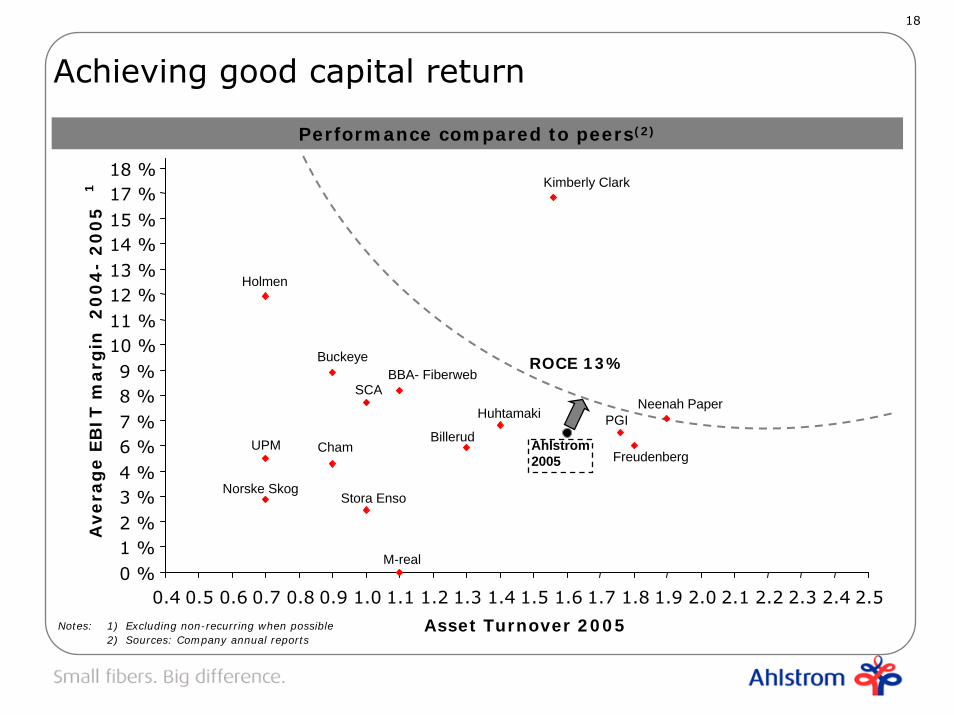
Performance compared to peers(2)
Notes: 1) Excluding non-recurring when possible2) Sources: Company annual reports
Achieving good capital return
Huhtamaki
Stora EnsoNorske Skog
UPM
BBA- FiberwebBuckeye
Holmen
ChamBillerud
SCA
M-real
Kimberly Clark
Neenah PaperPGI
FreudenbergAhlstrom 2005
ROCE 13%
0 %1 %2 %3 %4 %6 %7 %8 %9 %
10 %11 %12 %13 %14 %15 %17 %18 %
0.4 0.5 0.6 0.7 0.8 0.9 1.0 1.1 1.2 1.3 1.4 1.5 1.6 1.7 1.8 1.9 2.0 2.1 2.2 2.3 2.4 2.5
Asset Turnover 2005
Avera
ge E
BIT
marg
in
20
04
-2
00
51

19
Slightly counter cyclical to commodities
0
20
40
60
80
100
120
140
Q197
Q397
Q198
Q398
Q199
Q399
Q100
Q300
Q101
Q301
Q102
Q302
Q103
Q303
Q104
Q304
Q105
Q305
Q106
Q306
Pulp price Gross margin
Natural fibers46 %
Synthetic fibers11 %
Chemicals25 %
Energy16 %
Other2 %
Please note: Raw material and energy split based on 2005 financials

20
• Closing non-competitive plants when cash flow dries out
• Minimum investment in low growth businesses
Recent actions:
• Nümbrecht plant closure, Germany, Q2/2007
• Converting of liquid filtration moved to South Carolina, Q1/2007
• Three sites in Europe with close to zero book value
“Cutting tail”

21
• Continuous performance improvement program “aPlus” (Kaitzen) since 2002
– Rolled out to all sites by 2005
– Involving 1000 teams by end of 2006
Achievements:
– Avoiding unnecessary investments
– Optimizing working capital
– Reducing direct costs and waste
– Freeing capacity on production lines
Improving competitiveness
Full effect of the program yet to be seen
22
Section IV
Financial performance
23
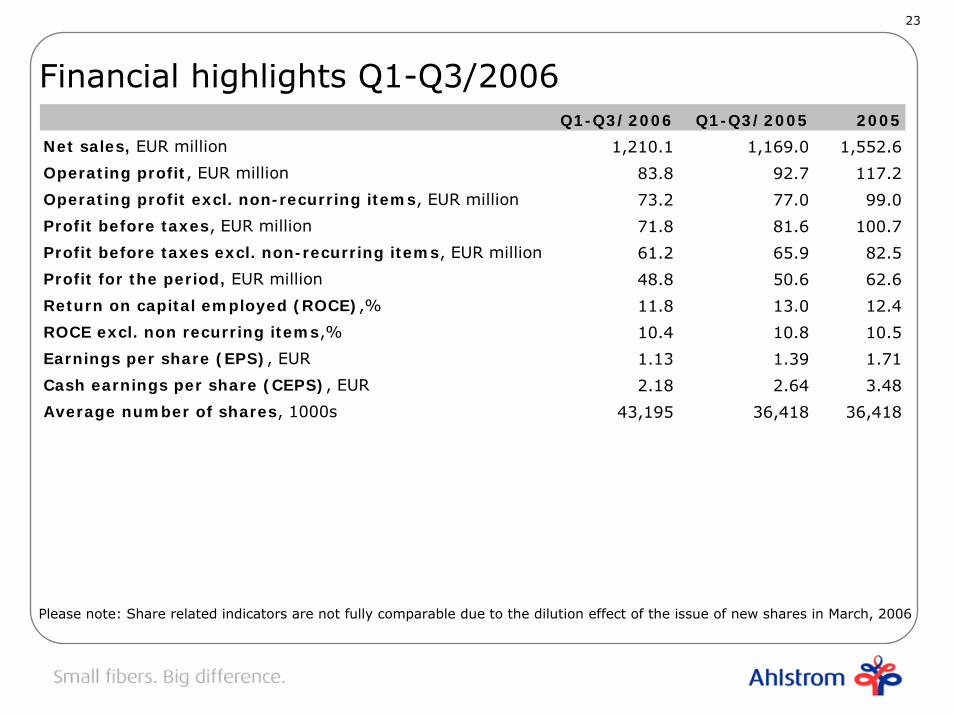
Financial highlights Q1-Q3/2006
Please note: Share related indicators are not fully comparable due to the dilution effect of the issue of new shares in March, 2006
Q1-Q3/2006 Q1-Q3/2005 2005
Net sales, EUR million 1,210.1 1,169.0 1,552.6
Operating profit, EUR million 83.8 92.7 117.2
Operating profit excl. non-recurring items, EUR million 73.2 77.0 99.0
Profit before taxes, EUR million 71.8 81.6 100.7
Profit before taxes excl. non-recurring items, EUR million 61.2 65.9 82.5
Profit for the period, EUR million 48.8 50.6 62.6
Return on capital employed (ROCE),% 11.8 13.0 12.4
ROCE excl. non recurring items,% 10.4 10.8 10.5
Earnings per share (EPS), EUR 1.13 1.39 1.71
Cash earnings per share (CEPS), EUR 2.18 2.64 3.48
Average number of shares, 1000s 43,195 36,418 36,418
24
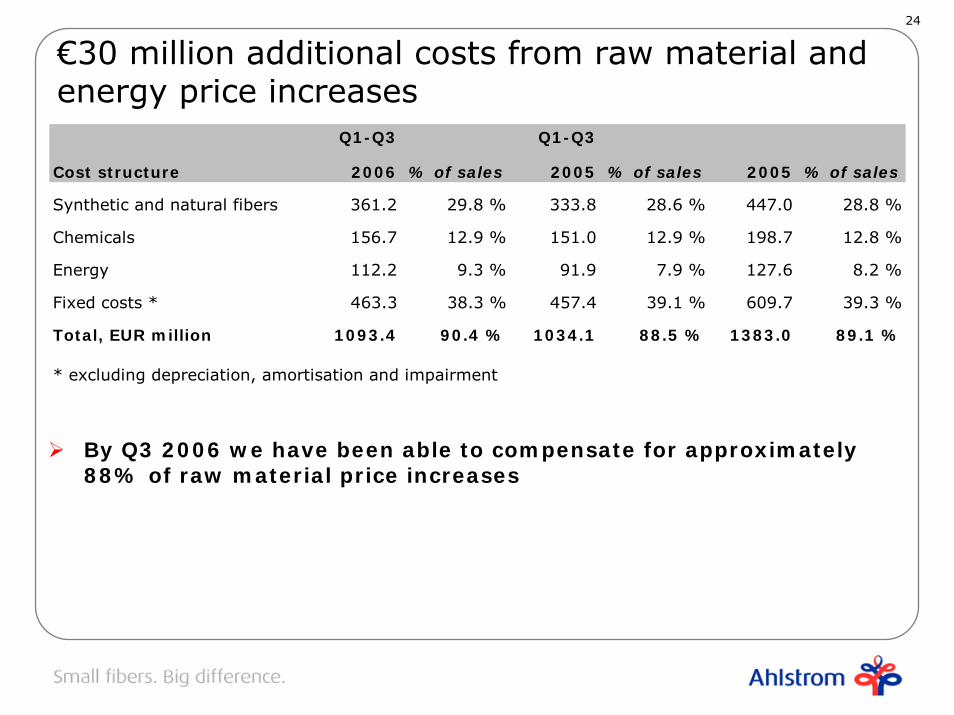
€30 million additional costs from raw material and energy price increases
By Q3 2006 we have been able to compensate for approximately 88% of raw material price increases
Q1-Q3 Q1-Q3
Cost structure 2006 % of sales 2005 % of sales 2005 % of sales
Synthetic and natural fibers 361.2 29.8 % 333.8 28.6 % 447.0 28.8 %
Chemicals 156.7 12.9 % 151.0 12.9 % 198.7 12.8 %
Energy 112.2 9.3 % 91.9 7.9 % 127.6 8.2 %
Fixed costs * 463.3 38.3 % 457.4 39.1 % 609.7 39.3 %
Total, EUR million 1093.4 90.4 % 1034.1 88.5 % 1383.0 89.1 %
* excluding depreciation, amortisation and impairment

25
Current focus areas
•Improving profit of associated companies
•Reducing net financial expenses
•Reducing income taxes
−Tax rate for 2006 estimated to be 32%
−Long term effective tax rate target is 33-35%
•Decreasing future pension liabilities
−Adopting defined contribution plans where applicable e.g. UK in 2007
Improving `bottom line´
26
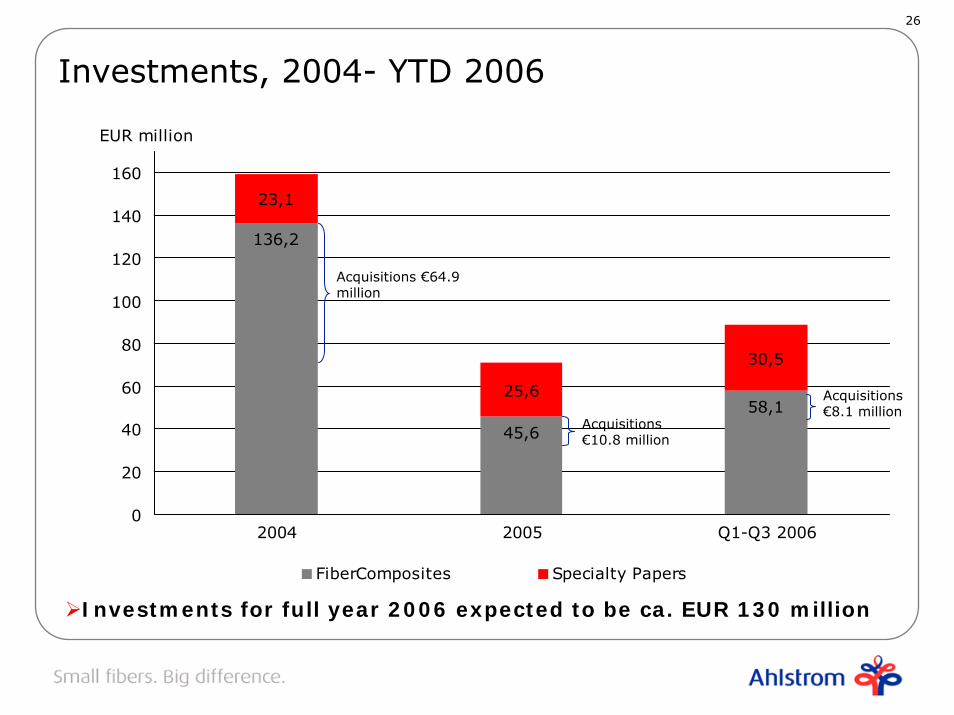
Investments, 2004- YTD 2006
136,2
45,6
58,1
23,1
25,6
30,5
0
20
40
60
80
100
120
140
160
2004 2005 Q1-Q3 2006
EUR million
FiberComposites Specialty Papers
Acquisitions €10.8 million
Acquisitions €64.9million
Acquisitions €8.1 million
Investments for full year 2006 expected to be ca. EUR 130 million

27
• ROCE minimum 13%
• Gearing 50-80%
• Dividend payout ratio at least 50%
Financial targets

28
Investment summary
• Operating in global growth businesses
• Innovative functional materials with leading market positions
• Well positioned for growth outside Europe through organic investments or acquisitions
• Efficient use of capital
• Attractive dividend policy