agu 12/11/06 determining local magnetic field strength on location and predicting the dancing...
TRANSCRIPT
AGU 12/11/06
Determining Local Magnetic Field Strength on Location
And Predicting The Dancing Auroras at School settings
N. CraigL. M. Peticolas
Space Science Laboratory
http://ds9.ssl.berkeley.edu/themis
Vic TrautmanPetersburg Schools, Petersburg AK
A Quest to Understand the Dancing Light of Auroras

AGU 12/11/06
Magnetometer Schools in 10 States
Petersburg City Schools: Victor Trautman ……………………………… Petersburg, AlaskaChippewa Hills High School: Cris DeWolf Remus, MichiganHot Springs High School: Sean Estill………………………………………. Hot Springs, MontanaWestern Nevada Community College: Terry Parent; Robert Collier Carson City, NevadaFort Yates Public School: Frank Martin; Harriet Howe ……………..…… Fort Yates, North DakotaUkiah School: Laura Orr Ukiah, Oregon Northern Bedford County High School: Keith Little ……………………… Loysburg, PennsylvaniaRed Cloud High School: Wendell Gehman Pine Ridge, South DakotaShawano Community High School: Wendy Esch ………………………… Shawano, WisconsinNorth County Union Jr. High School: Holly Willey Vermont

AGU 12/11/06
Cartoon of Instrument Setup
Main AC Power
GMAG sensor
Buried under the ground
Iridium Satellite Phone GPS
All Sky Imager in Enclosure
Observatory Support Electronics
Roof of Building
Inside of Building
Internet connection
|-- 4 inch --|
|-- 5 inch --|
|-- 5 inch --|
|---- 8 inch ----|
|------- 26 inch --------|
|---
- 8
inch
---
--|
|---
----
----
- 24
inch
---
----
----
|
|---
6 in
ch -
--|
|---
----
----
----
----
----
-- 4
0 in
ch -
----
----
----
----
----
----
----
-|
|---
-- 2
8 in
ch -
----
--|
AGU 12/11/06
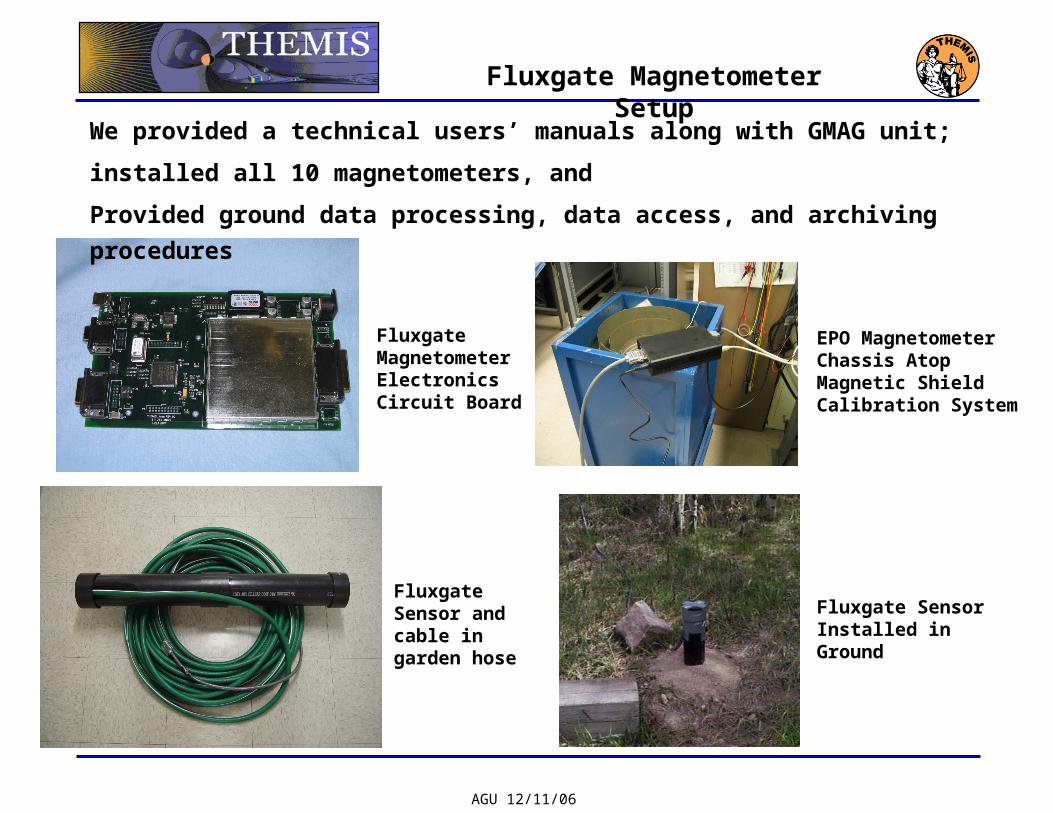
Fluxgate Magnetometer Setup
Fluxgate Sensor Installed in Ground
EPO Magnetometer Chassis Atop Magnetic Shield Calibration System
We provided a technical users’ manuals along with GMAG unit;
installed all 10 magnetometers, and
Provided ground data processing, data access, and archiving procedures
Fluxgate Sensor and cable in garden hose
Fluxgate Magnetometer Electronics Circuit Board

AGU 12/11/06
Summary• Magnetometers in 13 schools
in 10 states• 14+ teachers involved• Data on the web• Mostly high school classes• Students excited by wiggles
and spectrograms• Student research
Magnetometer data in school

AGU 12/11/06
Research Questions
How do you determine the Intensity of the Total Local Magnetic Field using School Magnetometer data?
How can you predict the onset of aurora using the data from the Magnetometer?
22:36:46 UT 12/02/2005 (30 min plot)23:06:46 PM 12/02/2005 Shawano

AGU 12/11/06
The GEONS Data Vector Addition
X: the strength in nT of the magnetic field in the direction of magnetic north pole
Y: the strength in nT of the magnetic field in the magnetic east direction
Z: the strength in nT of the magnetic field pointing down
Z (down)
YD(magnetic east)
XH (magnetic north)
Not to scale
21615 nT
-550 nT
45175 nTB represents the total strength of the magnetic field in the region.

AGU 12/11/06
Quiet DayActive DayGreater than 50 nT difference between X max and X min
12/12/05 Petersburg AK
Less than 50 nT difference between X max and X min
12/07/05 Petersburg AK
K index nT diff.
0 0-5
1 5-10
2 10-20
3 20-40
4 40-70
5 70-120
6 120-200
7 200-330
8 330-500
9 >500

AGU 12/11/06
Data Collection
1. Print off a days XYZ data.
2. Using a clear metric ruler 15 mm length, align the start of the ruler with the left side of the X scale.
3. Using a sharp pencil select the highest reading of the X component and draw a line to the X component scale.
4. Repeat drawing a line on the X component minimum reading.
5. Using the metric ruler measure the difference in mm, the scale is very close to 1mm = 5 nT.

AGU 12/11/06
Petersburg K vs Loysburg K
0
1
2
3
4
5
6
7
8
1 6 11 16 21 26 31 36 41 46 51 56 61 66 71 76 81 86 91 96 101 106 111 116 121 126 131 136
Days
K in
dex
Petersburg K index
Loysburg K index
All values above K = 7 are estimates
Charted from 11/1/05 to 6/3/06 Each mark represents a day's data

AGU 12/11/06
Determining Your Kp index needed for an Aurora Display
The actual map (on the web) will give you the Latitude-Longitude position for each location.http://www.sec.noaa.gov/Aurora/index.htmlhttp://spaceweather.com/glossary/kp.html

AGU 12/11/06
Teacher Professional Development Programs