agronomy of crops and pastures hamilton, victoria 24th july …€¦ · · 2014-12-14agronomy of...
TRANSCRIPT

Agronomy of crops and pasturesHamilton, Victoria 24th July 2014
Derrick Moot

Phot
o: D
rW.R
. Sco
tt

Phot
o of
DrW
.R. S
cott
by
the
rem
ains
of t
he
Fam
ous G
ouse
Pub,
Linc
oln,
NZ
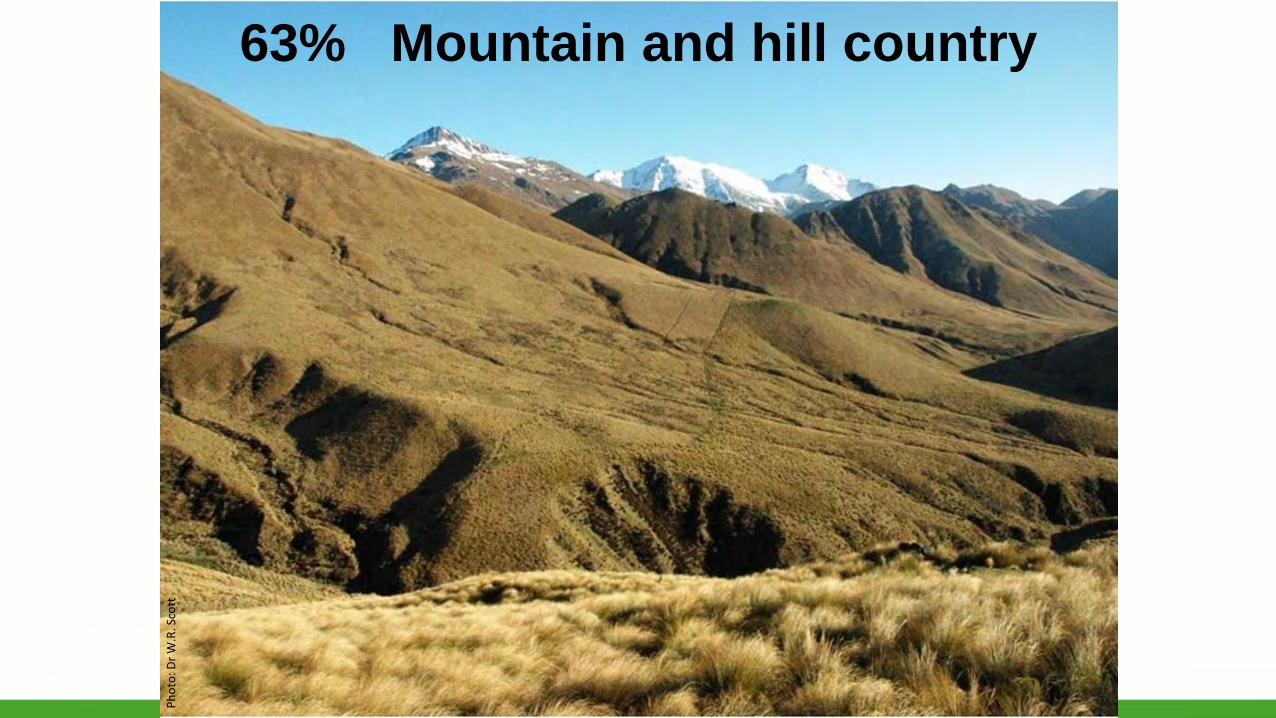
63% Mountain and hill country
Phot
o: D
rW.R
. Sco
tt
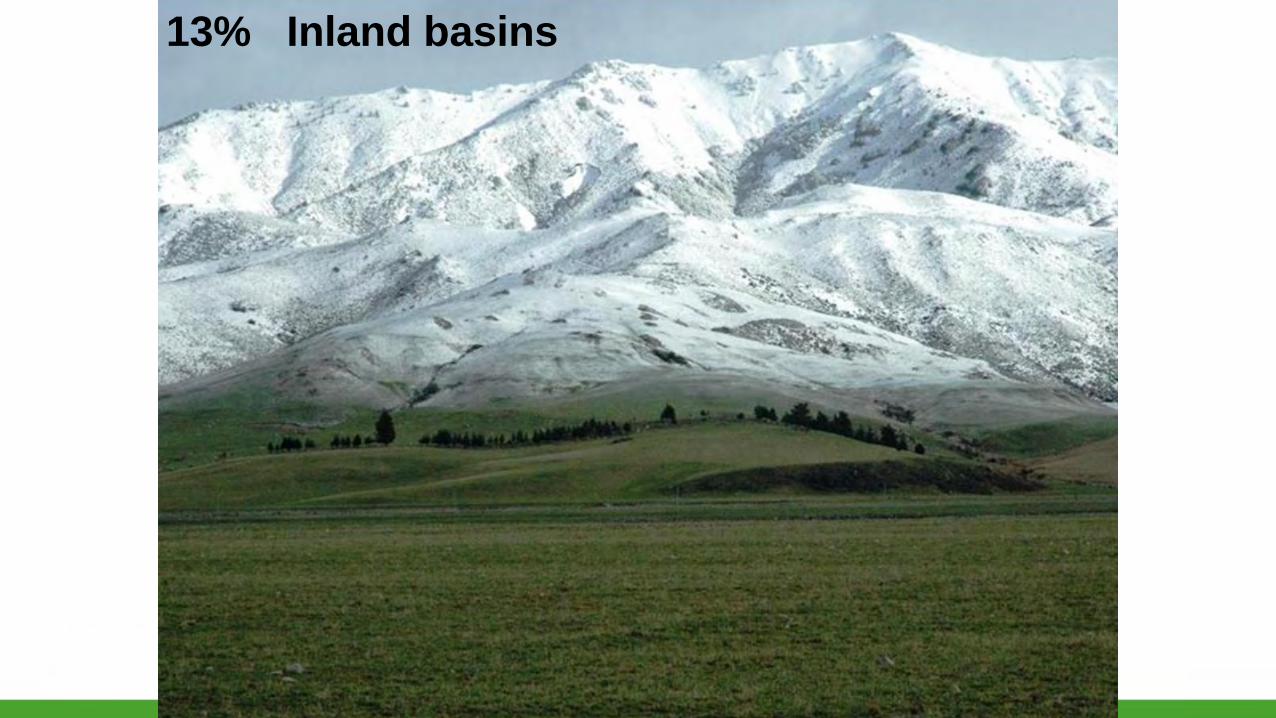
13% Inland basins
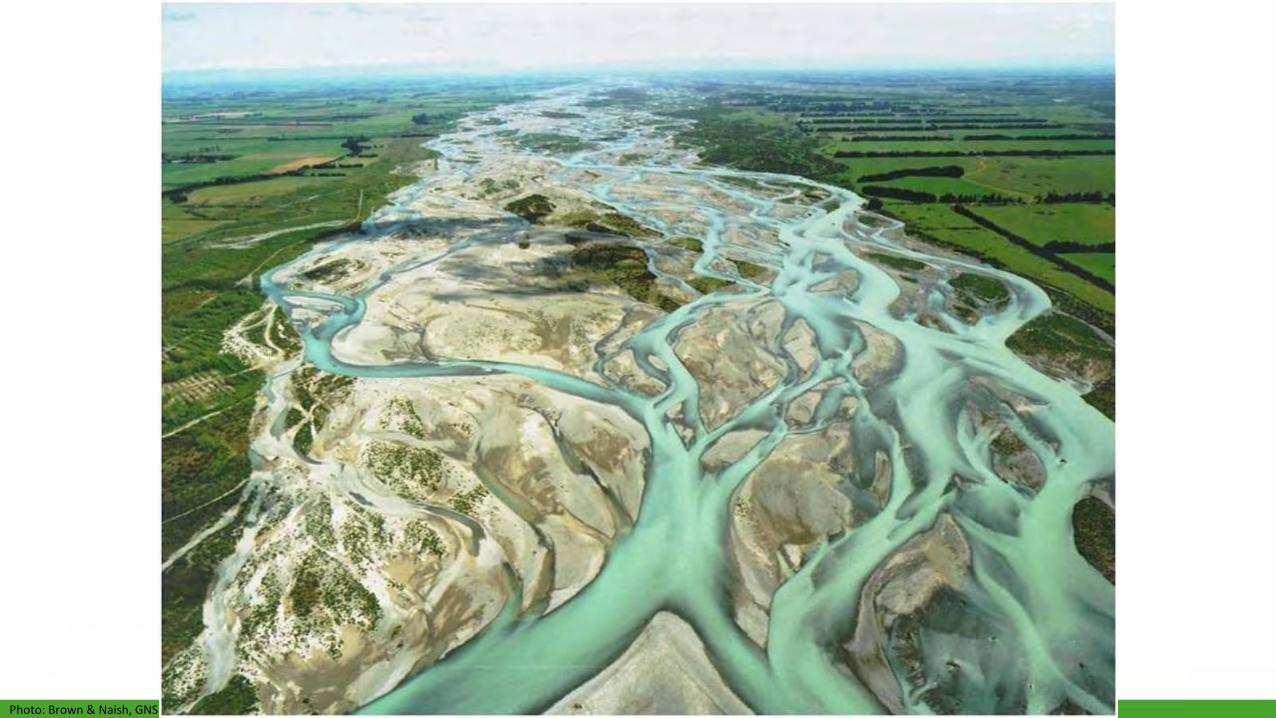
Photo: Brown & Naish, GNS
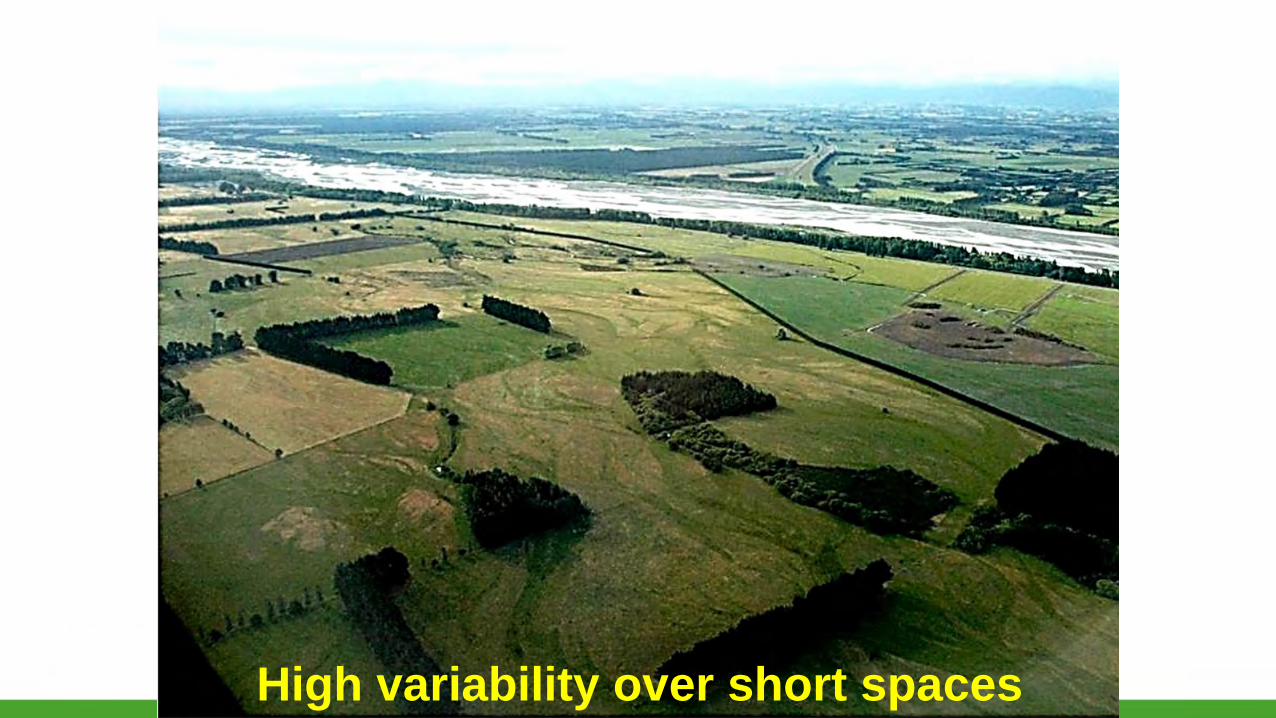
High variability over short spaces

The sediment load of Canterbury rivers is 10x the global average

Phot
o: su
pplie
d Li
ncol
n U
nive
rsity
Soi
ls De
part
men
t
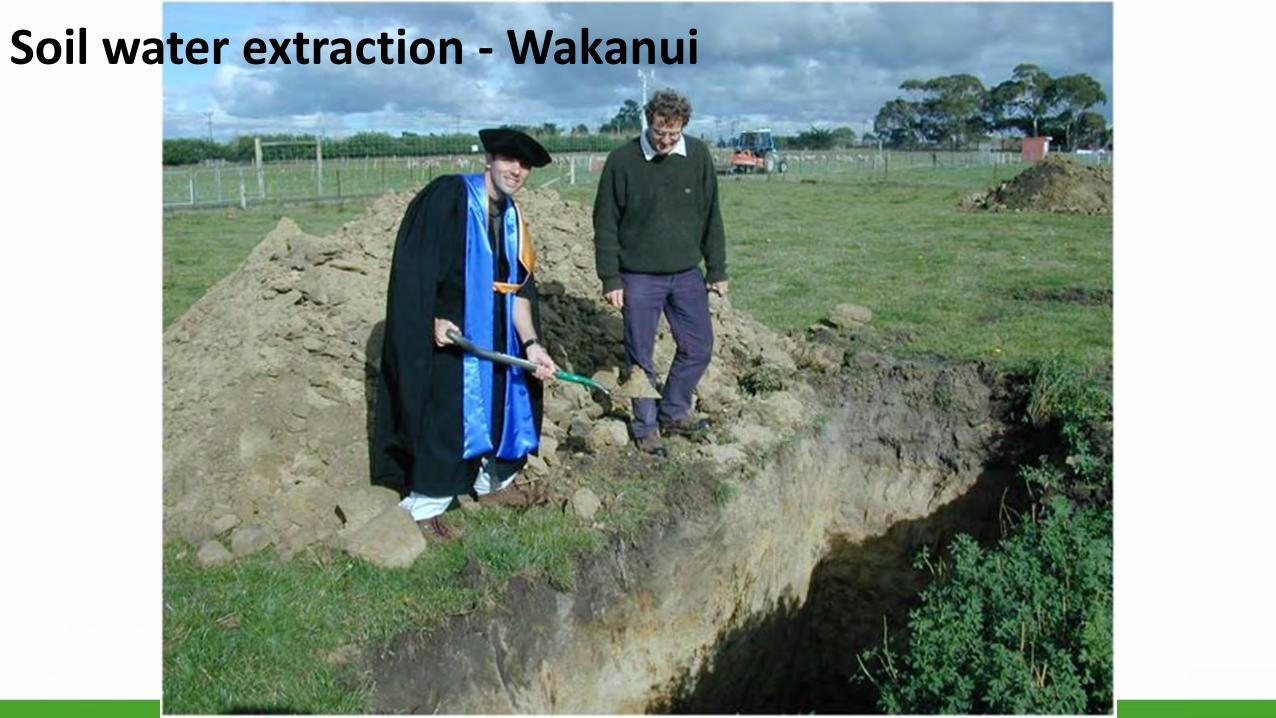
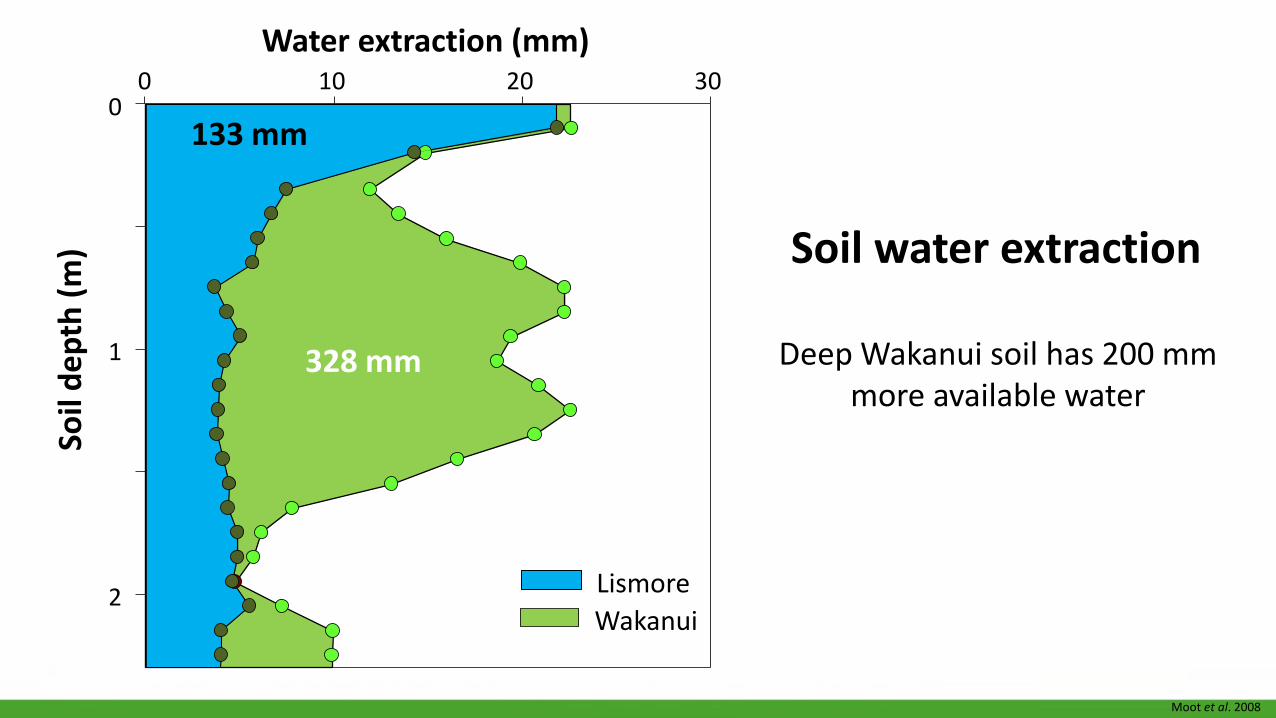
Soil water extraction - Wakanui
0 10 20 30So
il de
pth
(m)
0
1
2
Water extraction (mm)
WakanuiLismore
133 mm
328 mm
Soil water extraction
Deep Wakanui soil has 200 mm more available water
Moot et al. 2008

Source: Climate ExplorerNIWA, 2010
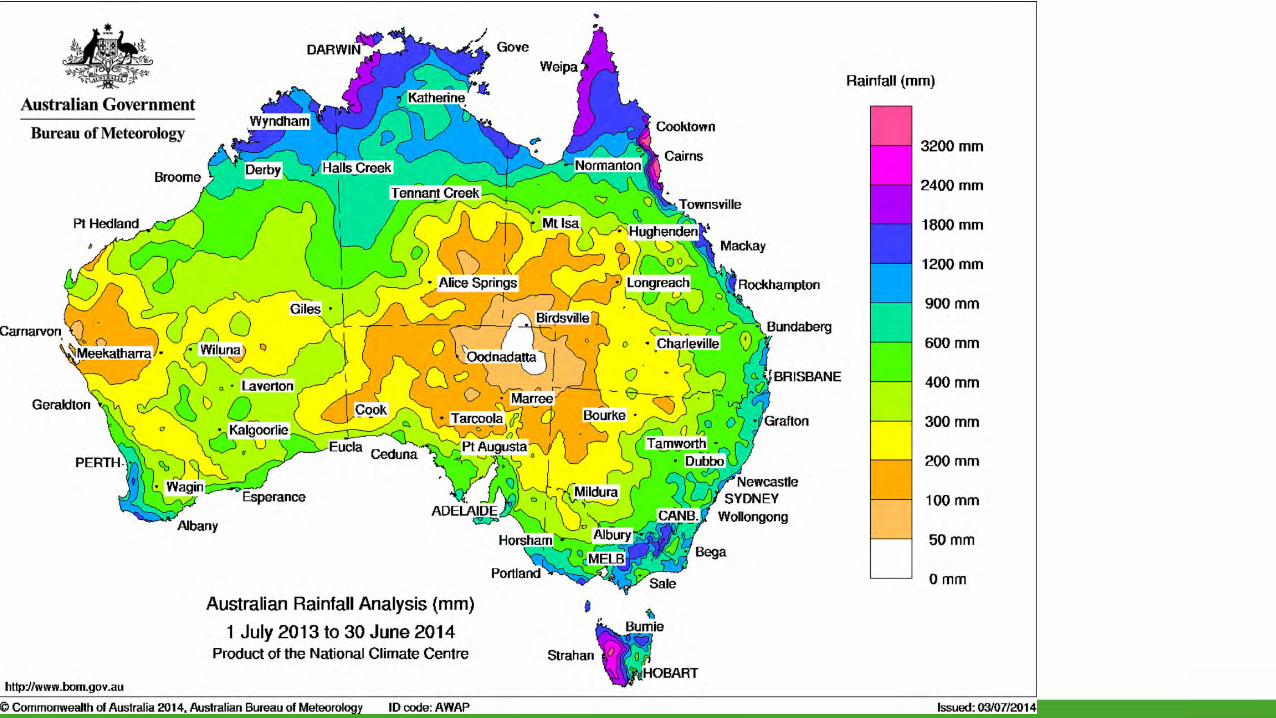
Climate
Median rainfall (mm)(1971-2000)
2000140012001000900800700600500
mm
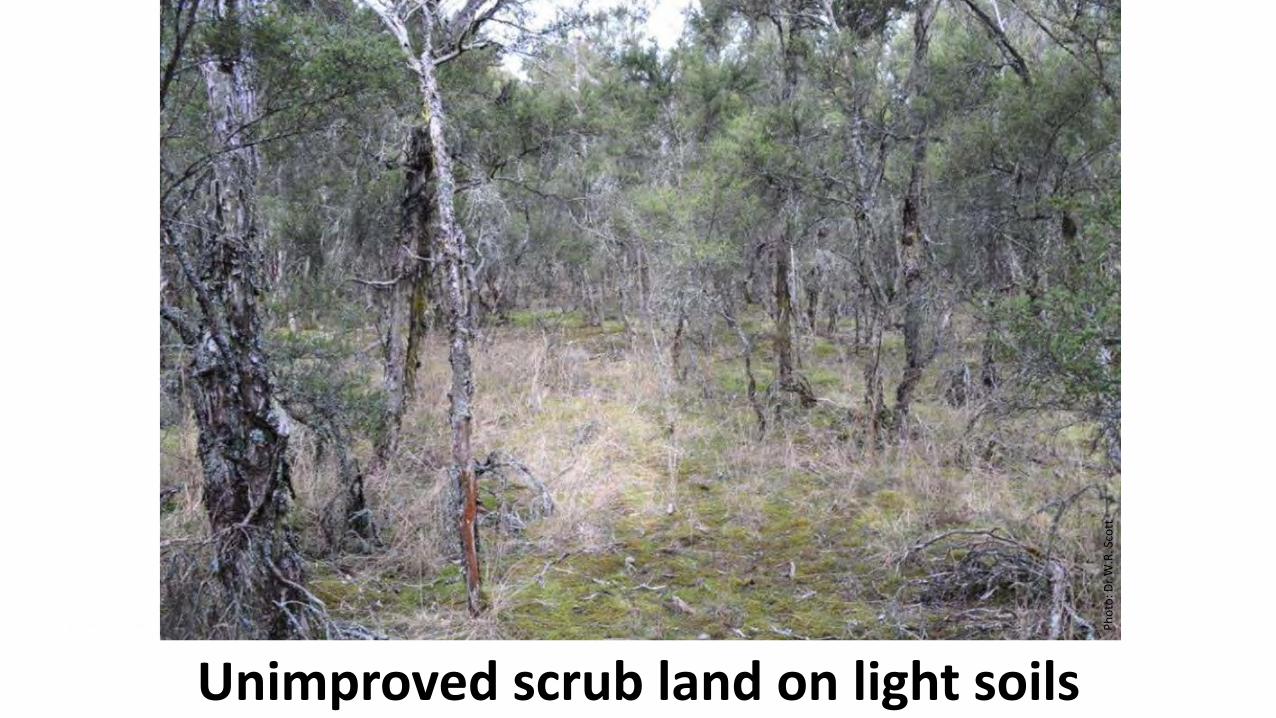
Unimproved scrub land on light soils
Phot
o: D
r W.R
. Sco
tt
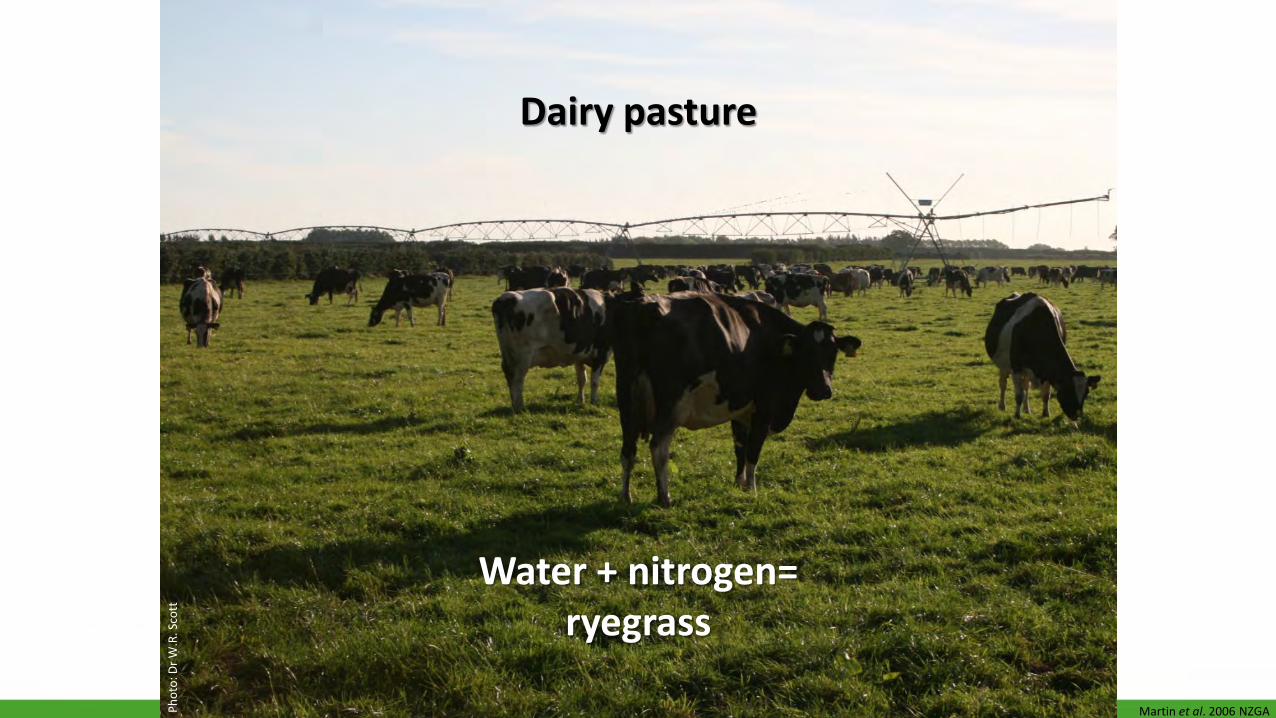
Martin et al. 2006 NZGA
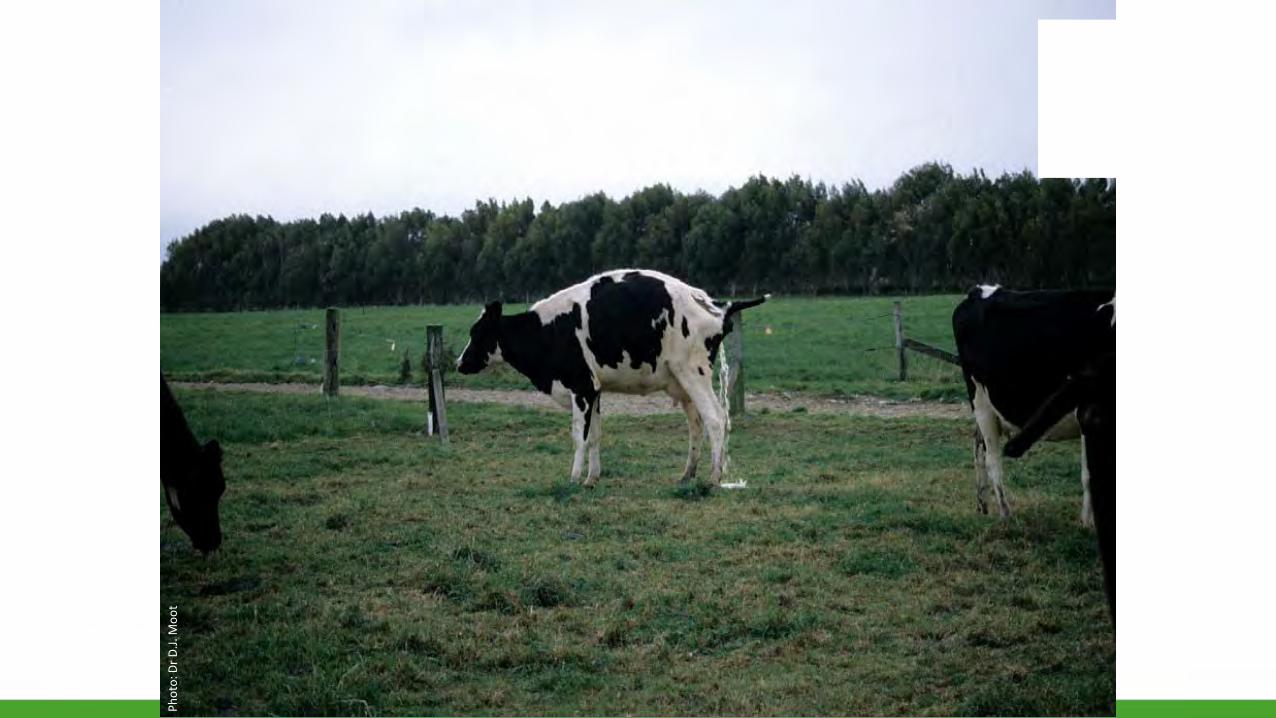
Dairy pasture
Water + nitrogen= ryegrass
Phot
o: D
r W.R
. Sco
tt

Source: Department of Statistics
The population...deer & cattle
Year1990 1995 2000 2005 2010
Sto
ck n
umbe
rs (m
illion
s)
0.0
0.2
0.4
0.6
0.8
1.0Beef cattle Dairy cattleDeer
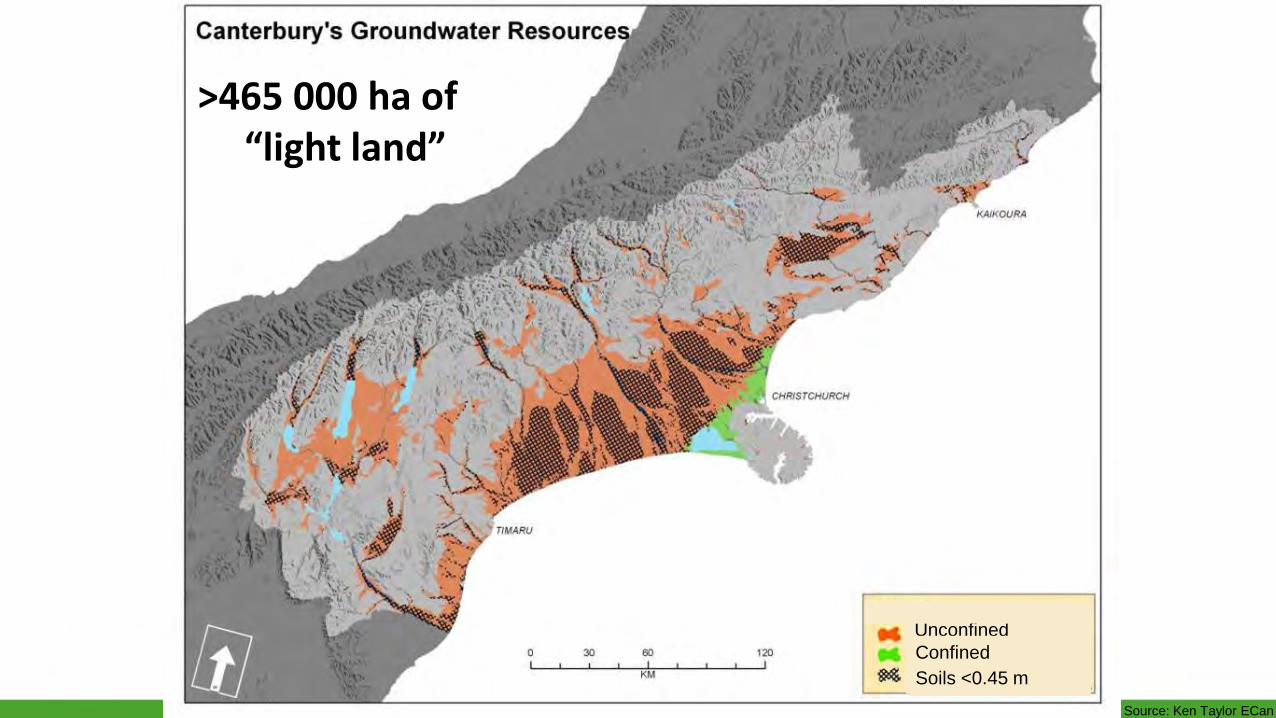
Source: Ken Taylor ECan
>465 000 ha of “light land”
UnconfinedConfinedSoils <0.45 m
Phot
o: D
r D.J.
Moo
t

Nitrate concentration g/m3
DairySheep SheepForest Crops
Introduction of dairy farming changes the amount & distribution of nitrate in the aquifer.
Input average = 8.3 Surface waters = 2.9
Bidwell et al., 2009

21% Flat undulating floodplain (fluvial megafans)
Phot
o: D
r W.R
. Sco
tt
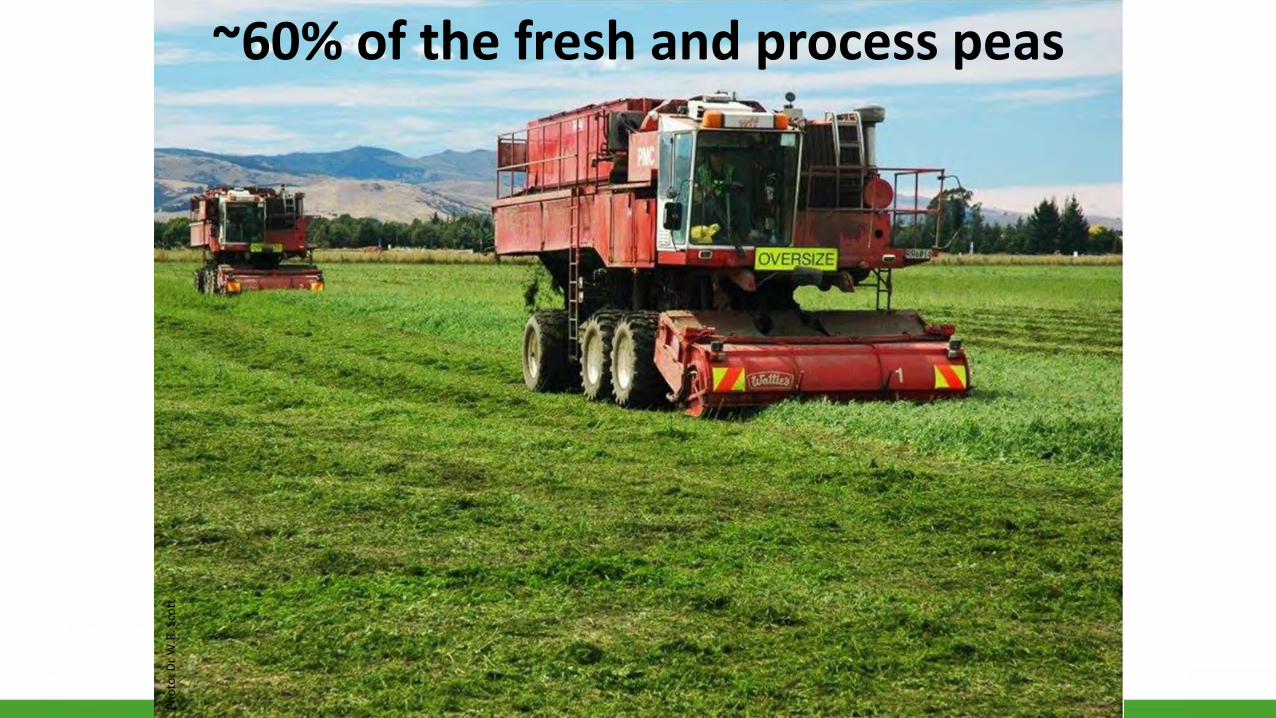
~60% of the fresh and process peas
Phot
o: D
r W.R
. Sco
tt
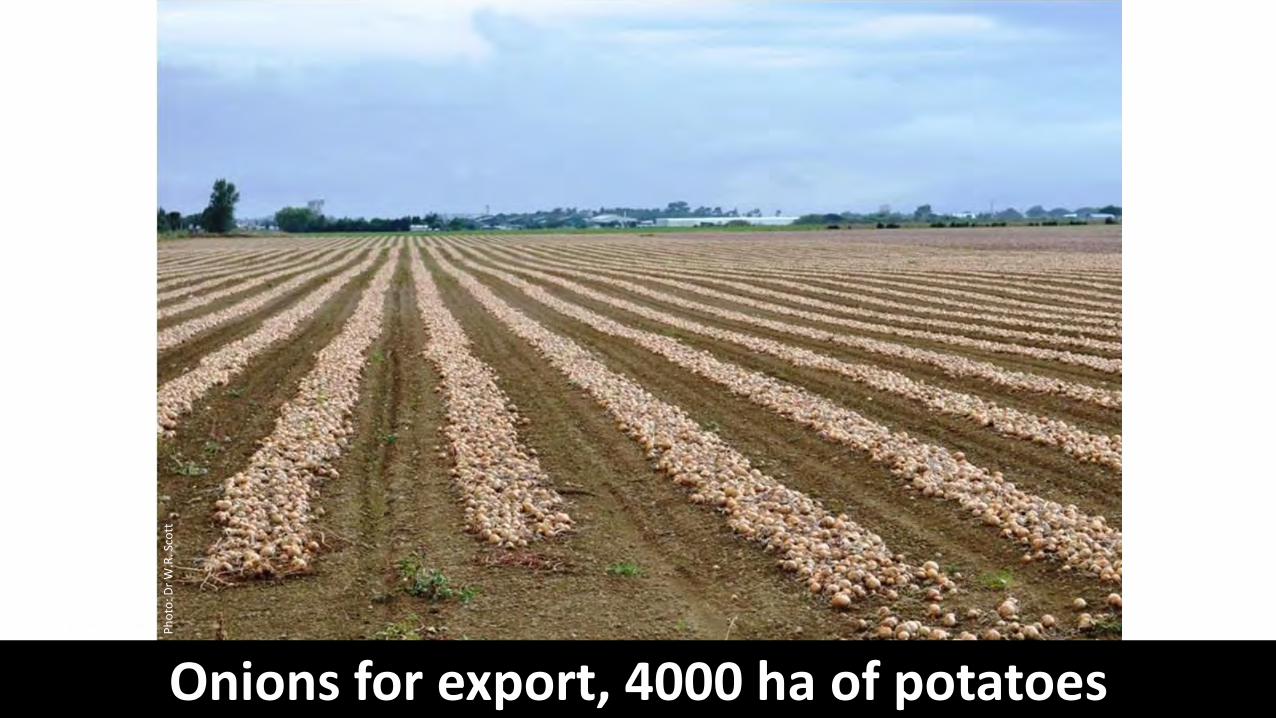
Onions for export, 4000 ha of potatoes
Phot
o: D
r W.R
. Sco
tt
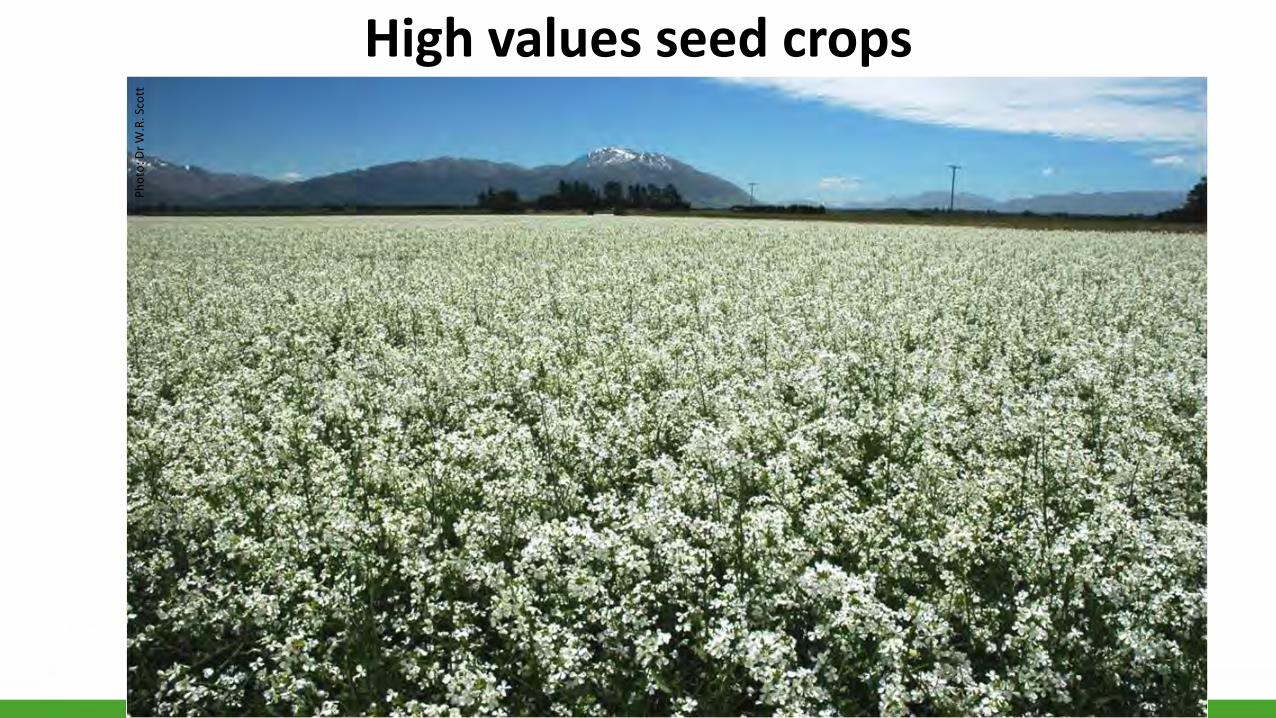
High values seed cropsPh
oto:
Dr W
.R. S
cott
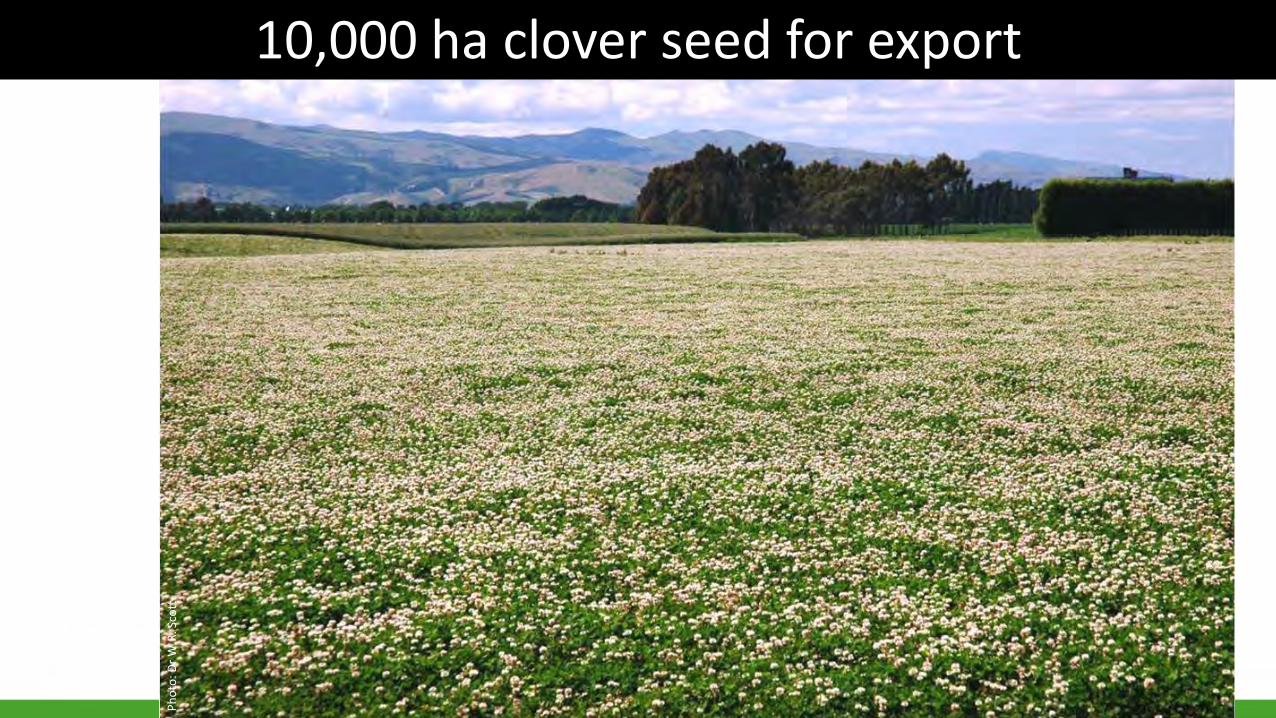
10,000 ha clover seed for export
Phot
o: D
r W.R
. Sco
tt
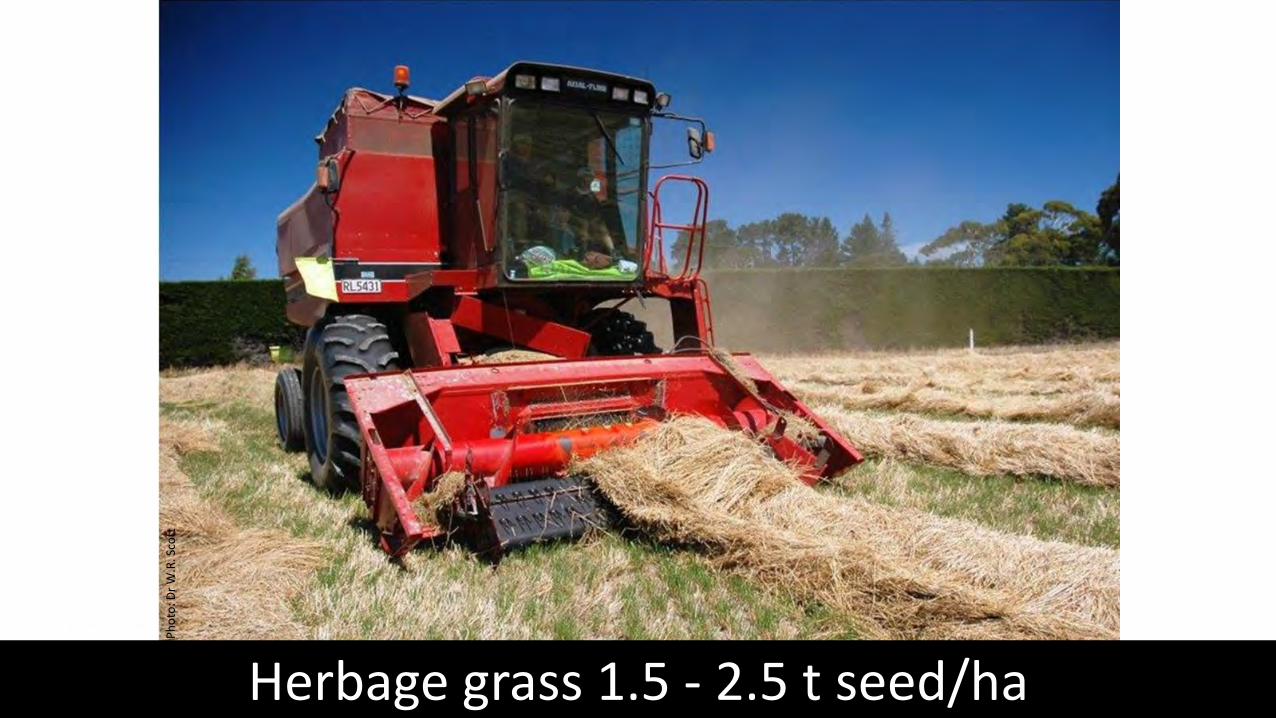
Herbage grass 1.5 - 2.5 t seed/ha
Phot
o: D
r W.R
. Sco
tt
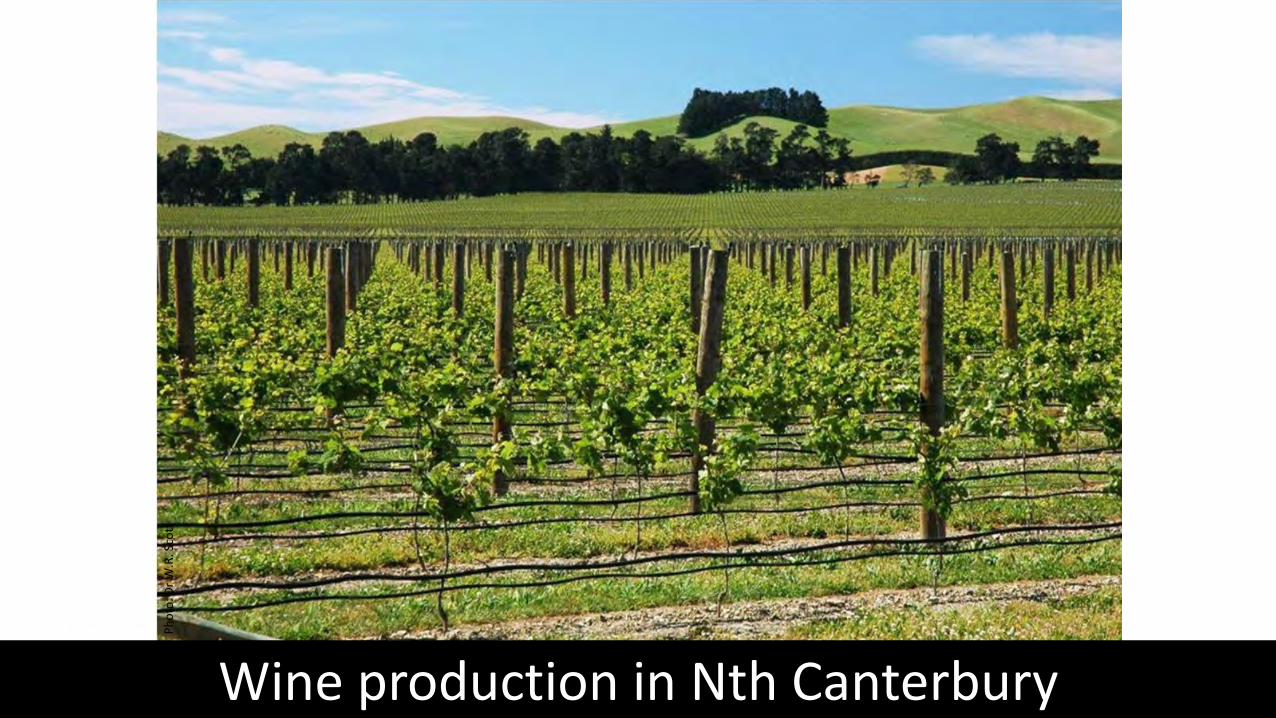
Wine production in Nth Canterbury
Phot
o: D
r W.R
. Sco
tt

Policy & management questions
• What types of land uses, and
• How intensive can they be without exceeding a groundwater system’s limits? – nitrogen mgmt
• How might land be managed to maximize profitability and remain within the N limits?
i.e. How many dairy farms, potato farms, onion paddocks, market gardens, sheep paddocks… should be allowed on a “catchment”?

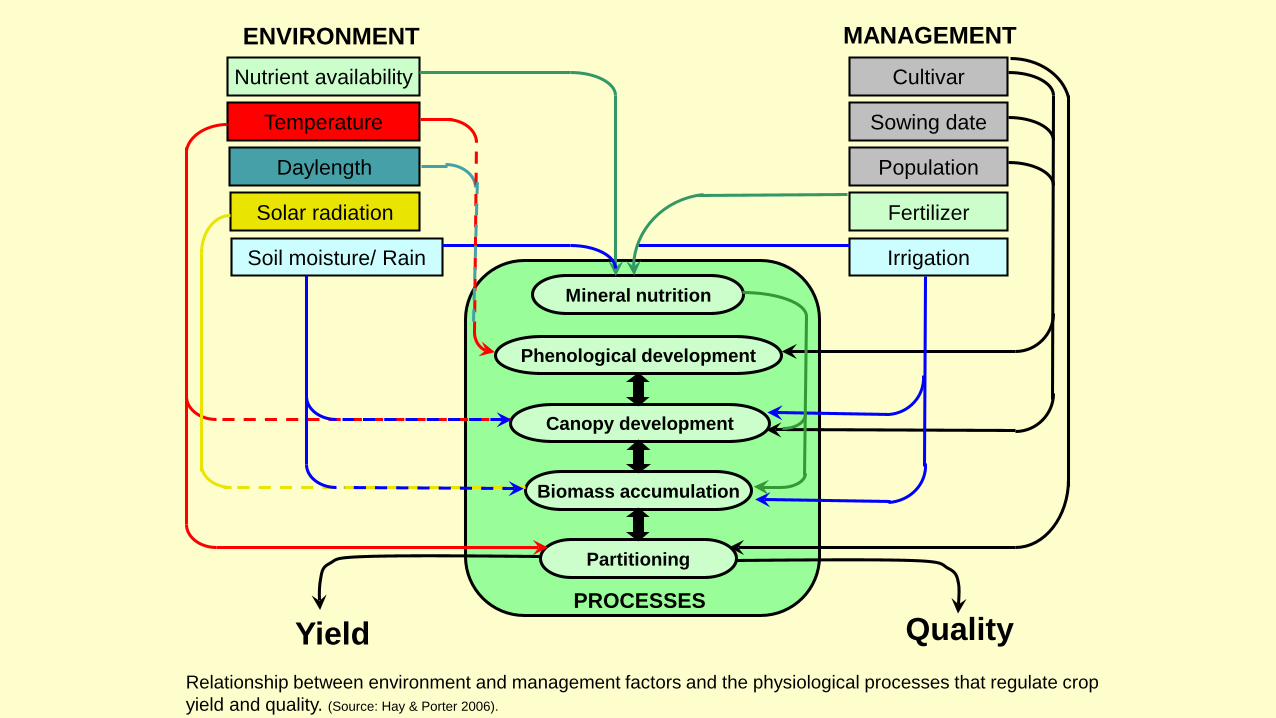
Nutrient availability
Temperature
Daylength
Solar radiation
Soil moisture/ Rain Irrigation
Fertilizer
Population
Sowing date
Cultivar
Mineral nutrition
Phenological development
Canopy development
Biomass accumulation
Partitioning
Yield QualityPROCESSES
ENVIRONMENT MANAGEMENT
Relationship between environment and management factors and the physiological processes that regulate crop yield and quality. (Source: Hay & Porter 2006).

Growth vs DevelopmentGrowth: an irreversible increase in DM
- function of light interception and - photosynthesis and then - assimilate partitioning
Development: irreversible change in the state of an organism
- fixed pattern and reversion is raree.g. silking,
pod initiation, dough development

Measurements Light
environment
Photosynthesis
Soil moisture
Chemical Analysis:-N (shoots and roots)-Starch in roots-Soluble sugars in roots
Temperature- Air and soil

Taiz & Zeiger, 2010

The canopy: the energy capture device

Crop Growth and Yield
1) C = E*Q C = daily rate of DM prod.E = radiation use efficiencyQ = PAR intercepted
2) Y = HI*C*dt Y = seed yield/unit areaHI = harvest index
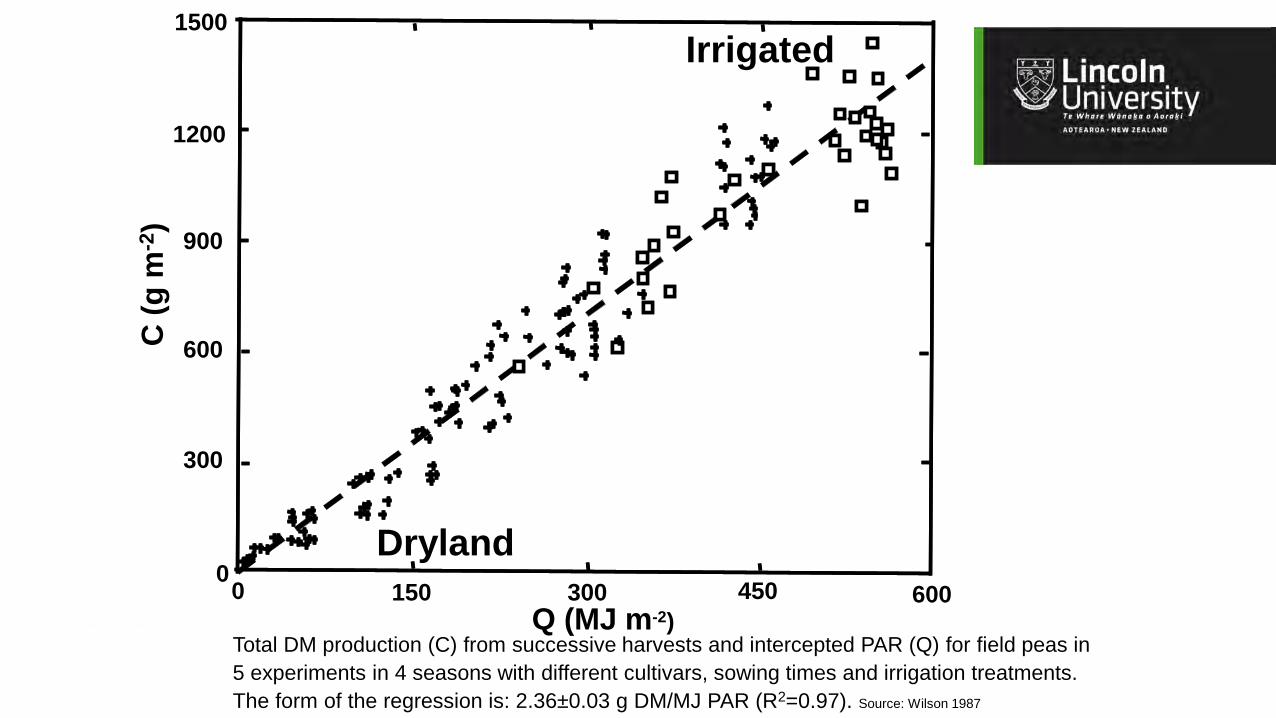
Dryland
Irrigated
Total DM production (C) from successive harvests and intercepted PAR (Q) for field peas in5 experiments in 4 seasons with different cultivars, sowing times and irrigation treatments.The form of the regression is: 2.36±0.03 g DM/MJ PAR (R2=0.97). Source: Wilson 1987
C (g
m-2
)
0 300
300
600
600
150 450
900
1200
1500
Q (MJ m-2)
0

Light
- photosynthesis to produce CHO’s for growth.
- Photosynthetically active radiation (PAR) is in the visible range (400-700nm).
- Conversion of PAR to DM ~2.5 g DM /MJ/m2 for C3 plants~3.8 g DM /MJ/m2 for C4 plants

Potato
0 1 2 3 4 5 6
Prop
ortio
n of
inci
dent
PAR
inte
rcep
ted
(%)
90
70
50
30
10
Green Area Index
Critical GAI
(Source: Khurana & McLaren 1982)

Light
Complex & dynamic signal
Quantity of lightphotons falling /area/time
Quality of lightplant responses

A) Vegetative
• Emergence and - temperature
• Leaf appearance rates (phyllochron)- temperature
B) Reproductive
• Time of flowering (anthesis), Temperature and photoperiod
• Duration of grain fill -temperature
Driven by temperature modified by photoperiod and vernalization
Plant development

Temperature
• Tt = Thermal time (°Cd)
= Tmax + Tmin - Tb
2
• Growing degree days (GDD) • Heat units (HU)

Sowing to emergence
Thermal time - soil temperature~ 125-150 °Cd

Phot
o: D
r W.R
. Sco
tt

Grain-filling: constant in thermal time – air temperature
Phot
o: D
r W.R
. Sco
tt
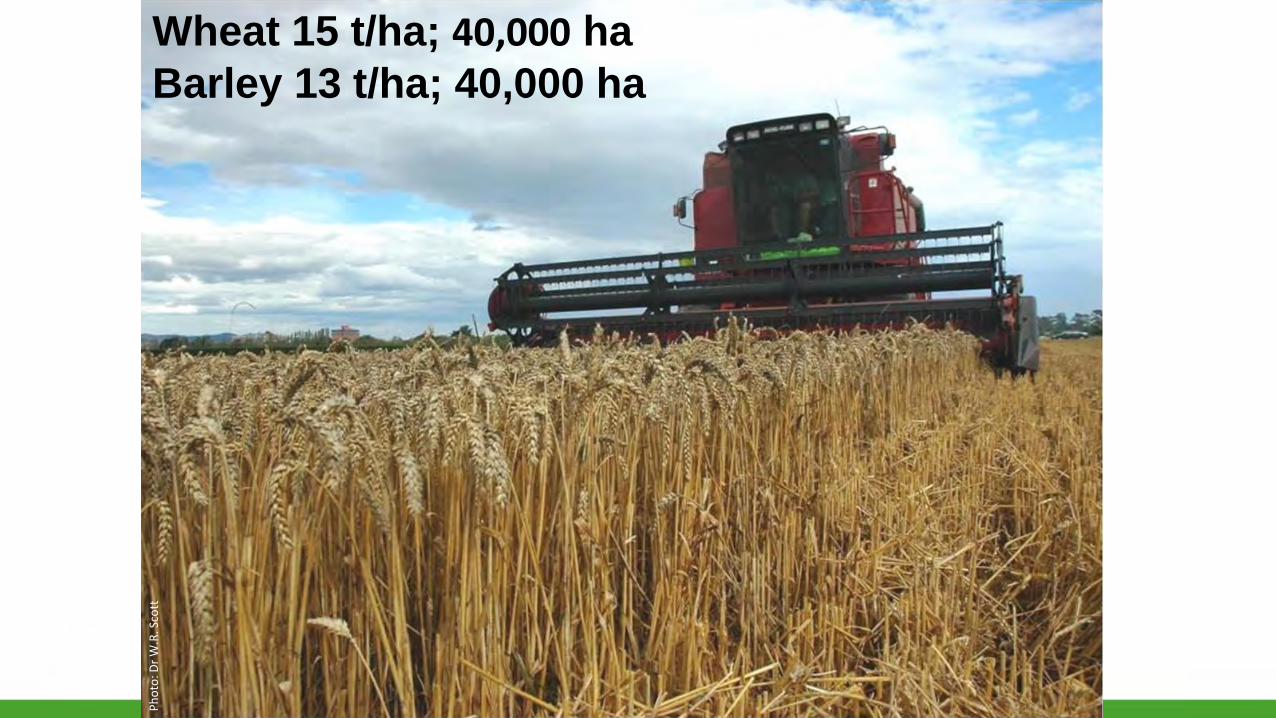
Wheat 15 t/ha; 40,000 haBarley 13 t/ha; 40,000 ha
Phot
o: D
r W.R
. Sco
tt

Year
1998 2000 2002 2004 2006 2008 2010 2012 2014
Yiel
d (t
grai
n/ha
)
0
2
4
6
8
10
12
Wheat grain yields in Canterbury
Source: Cereal performance trialsFAR, Canterbury
Wheat yield = 0.2x – 391R2 = 0.81
Nutrient availability
Temperature
Daylength
Solar radiation
Soil moisture/ Rain Irrigation
Fertilizer
Population
Sowing date
Cultivar
Mineral nutrition
Phenological development
Canopy development
Biomass accumulation
Partitioning
Yield QualityPROCESSES
ENVIRONMENT MANAGEMENT
Relationship between environment and management factors and the physiological processes that regulate crop yield and quality. (Source: Hay & Porter 2006).
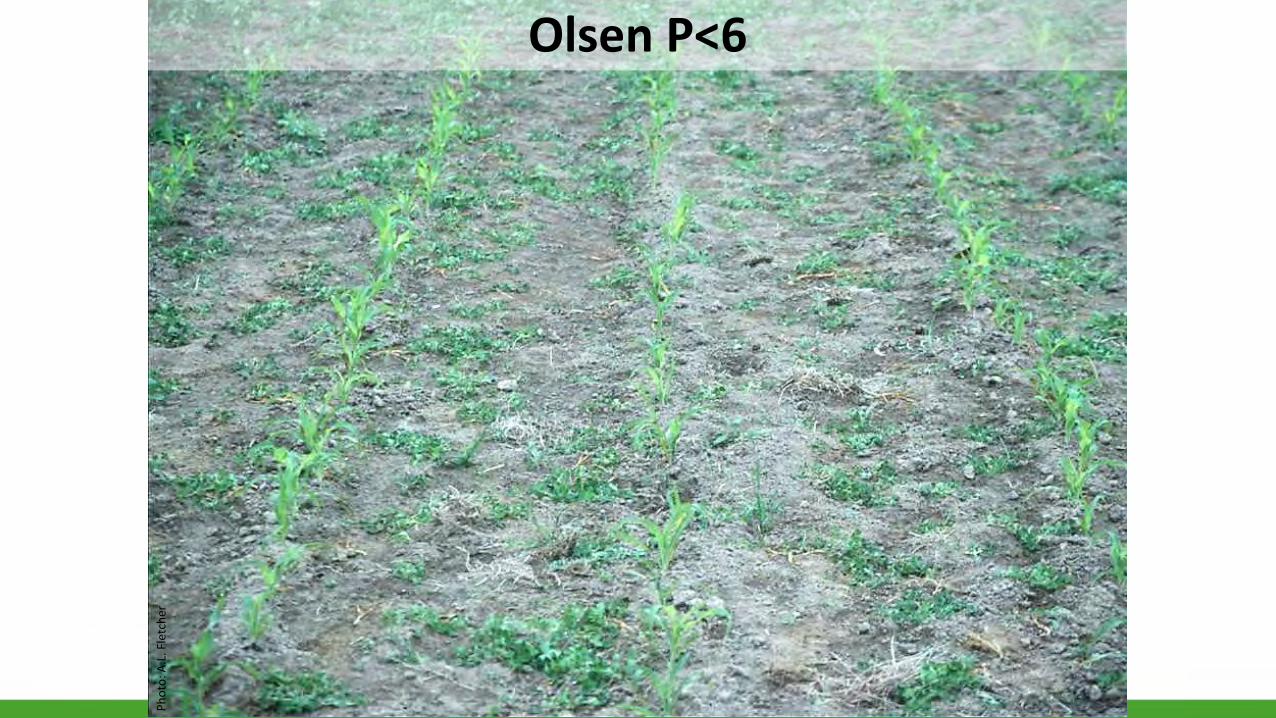
Olsen P<6
Phot
o: A
.L. F
letc
her
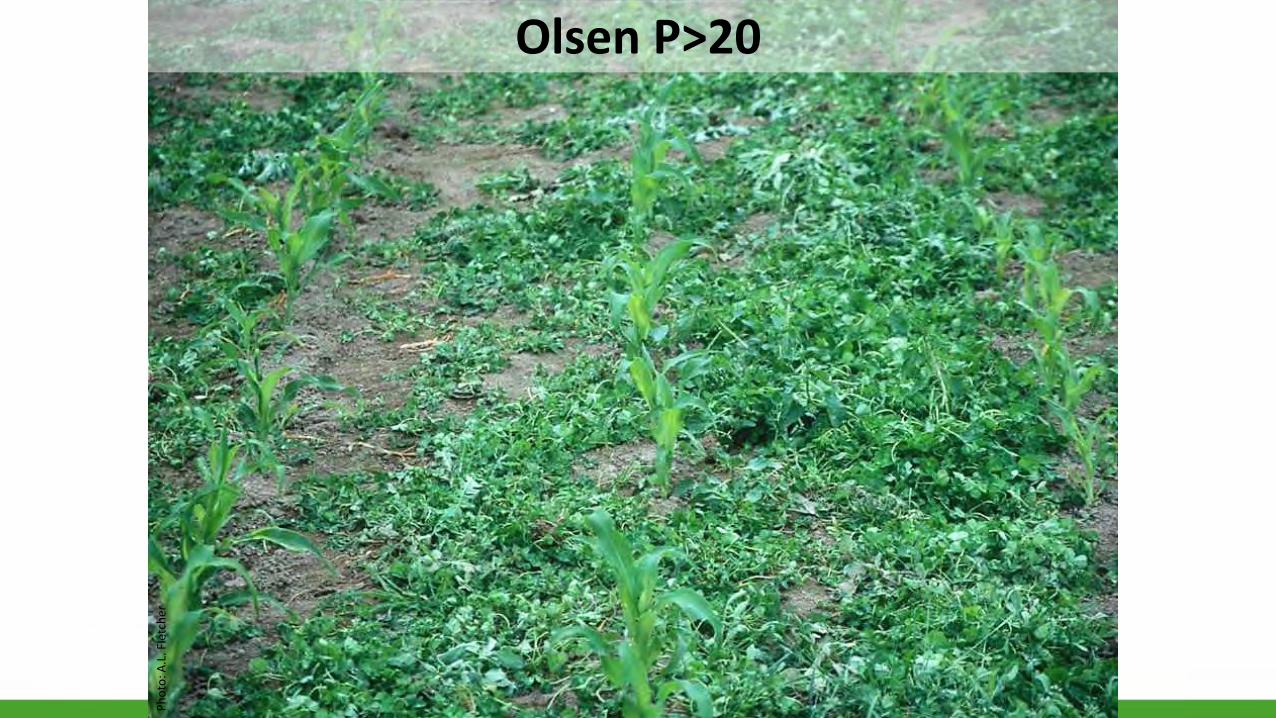
Olsen P>20
Phot
o: A
.L. F
letc
her

Drilling seed with fertiliserDirect drilling = seed + fertiliser
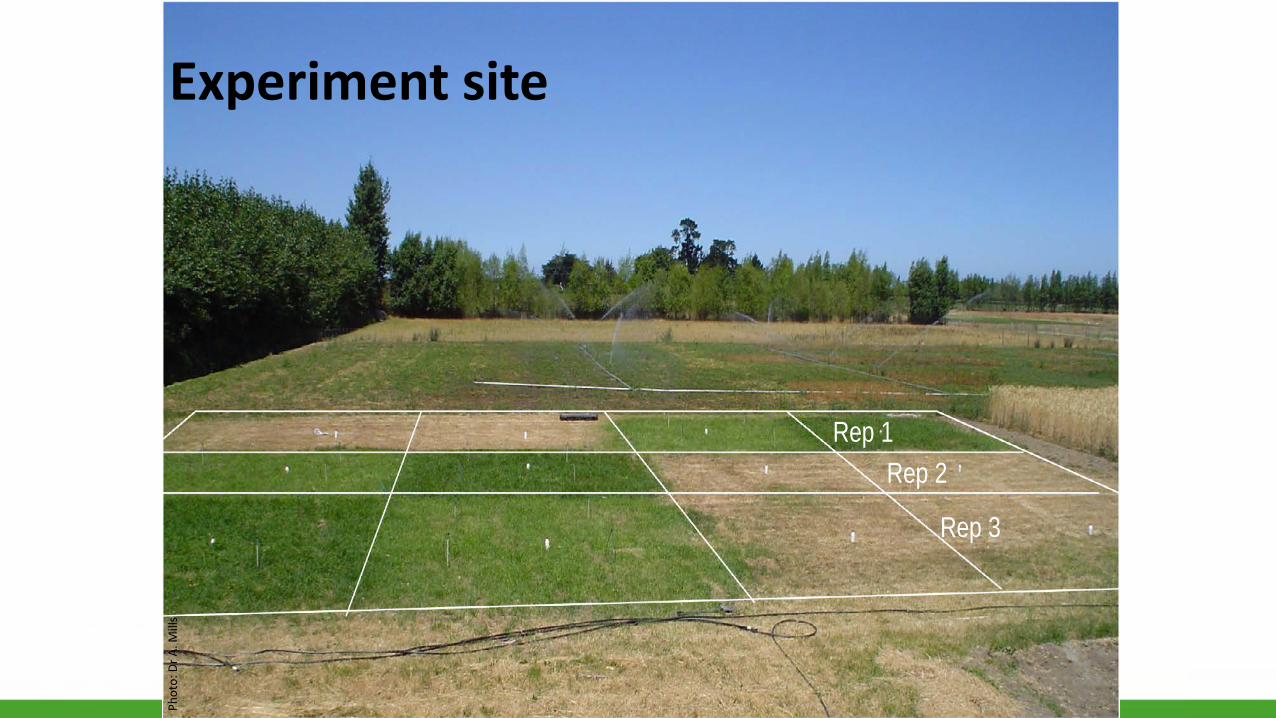
Rep 1Rep 2
Rep 3
Experiment sitePh
oto:
Dr A
. Mill
s

MonthJ A S O N D J F M A M J J
Gro
wth
rate
(kg/
ha/d
)
0
30
60
90
120 I +N 21.9 t/ha
I -N
9.8 t/ha
15.7 t/ha
D+N
6.3 t/ha
D-N
Growth rates (2 year means)
Mills et al. 2006
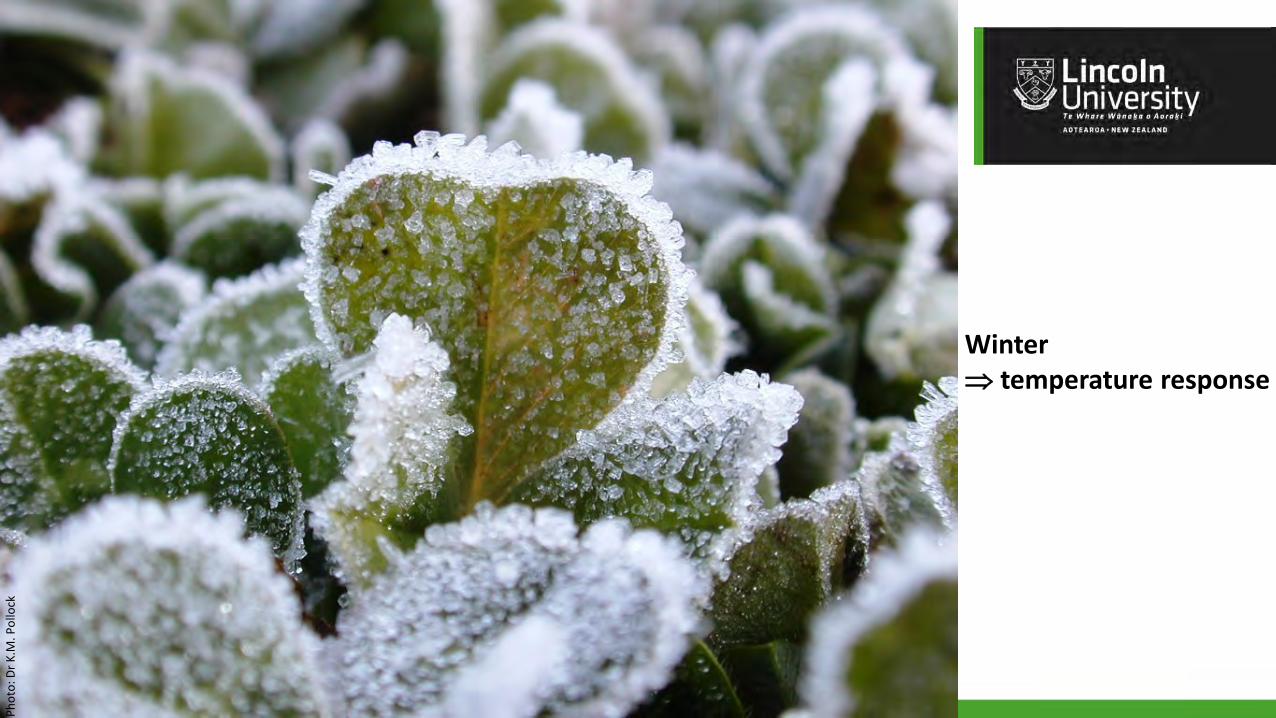
Winter ⇒ temperature response
Phot
o: D
r K.M
. Pol
lock
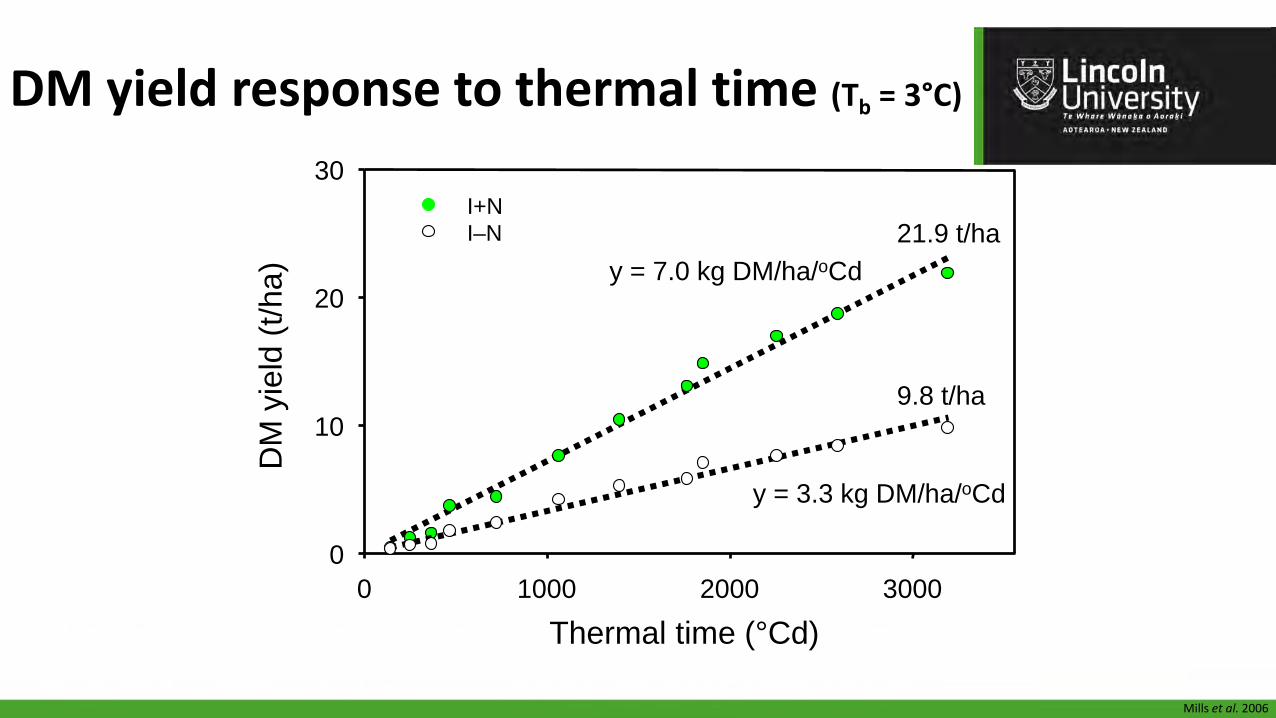
DM yield response to thermal time (Tb = 3°C)
Thermal time (°Cd)0 1000 2000 3000
DM
yie
ld (t
/ha)
0
10
20
30I+N
y = 7.0 kg DM/ha/oCdI–N
y = 3.3 kg DM/ha/oCd
21.9 t/ha
9.8 t/ha
Mills et al. 2006

Summer
⇒ moisture response
Mills 2007Phot
o: D
r A. M
ills
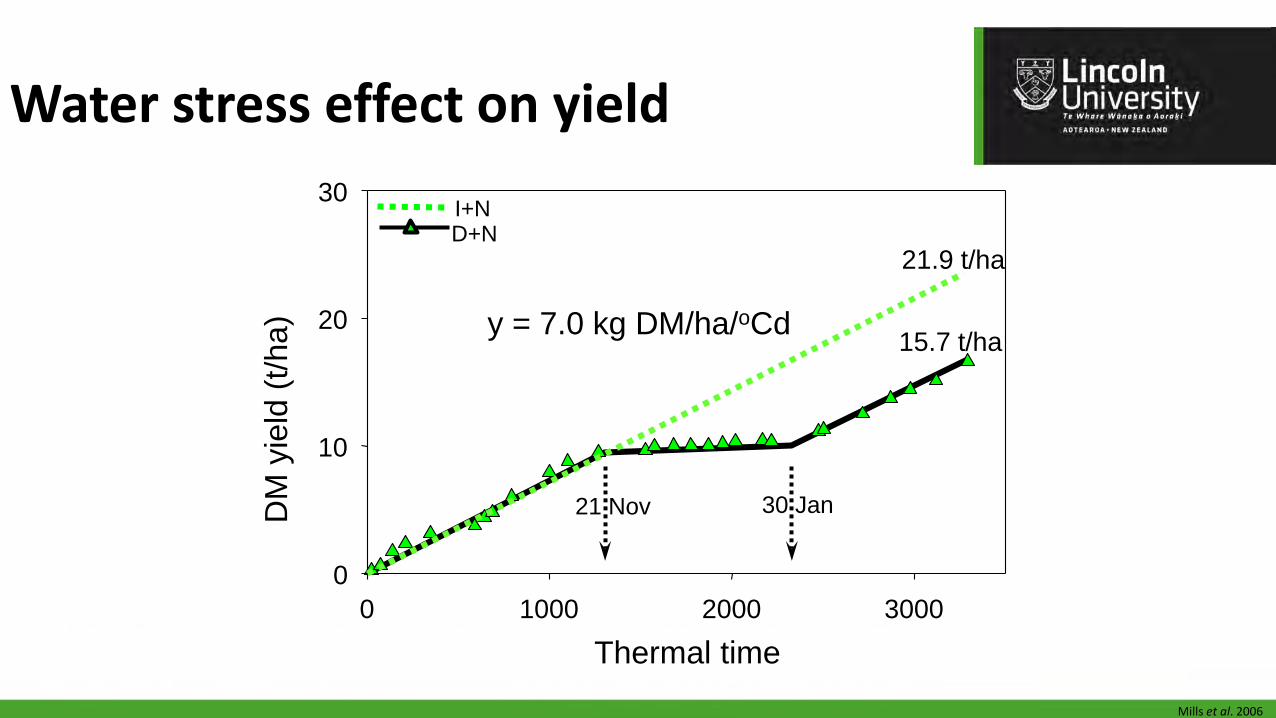
D+N
15.7 t/ha
21 Nov 30 Jan
Water stress effect on yield
Thermal time0 1000 2000 3000
DM
yie
ld (t
/ha)
0
10
20
30 I+N
y = 7.0 kg DM/ha/oCd
21.9 t/ha
Mills et al. 2006
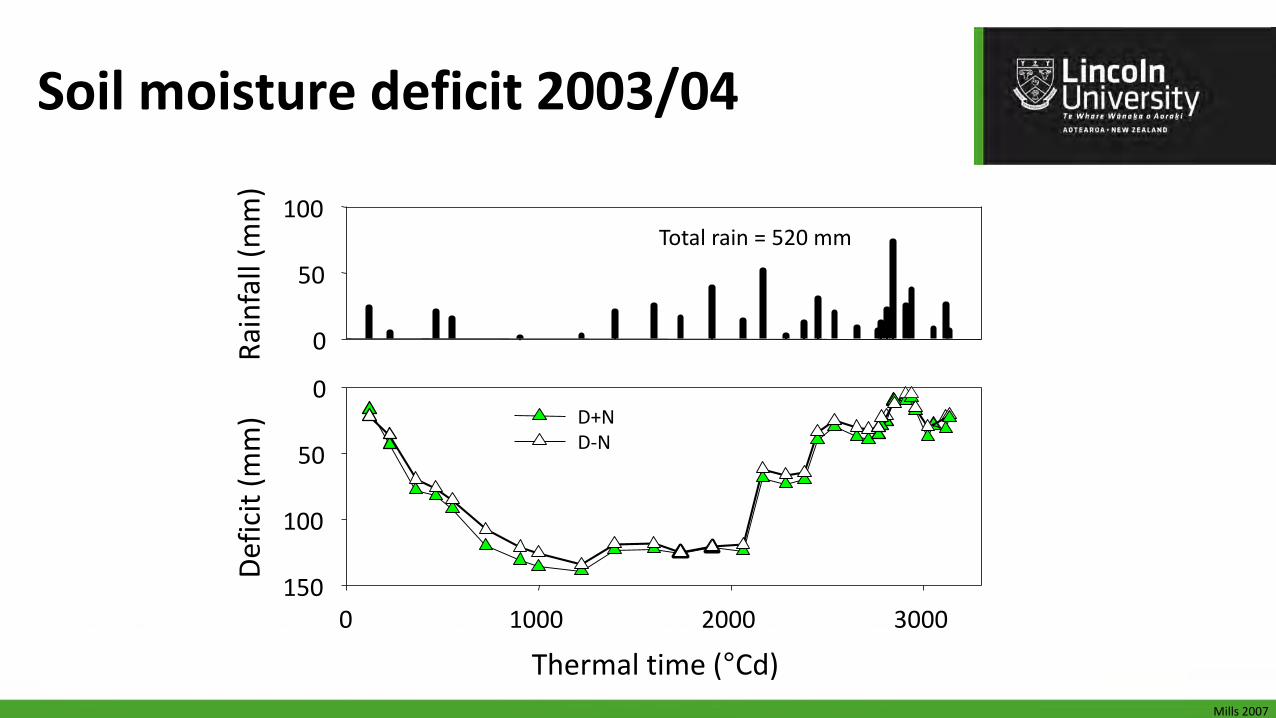
Rain
fall
(mm
)
0
50
100
Thermal time (°Cd)0 1000 2000 3000
Defic
it (m
m)
0
50
100
150
D+ND-N
Total rain = 520 mm
Soil moisture deficit 2003/04
Mills 2007
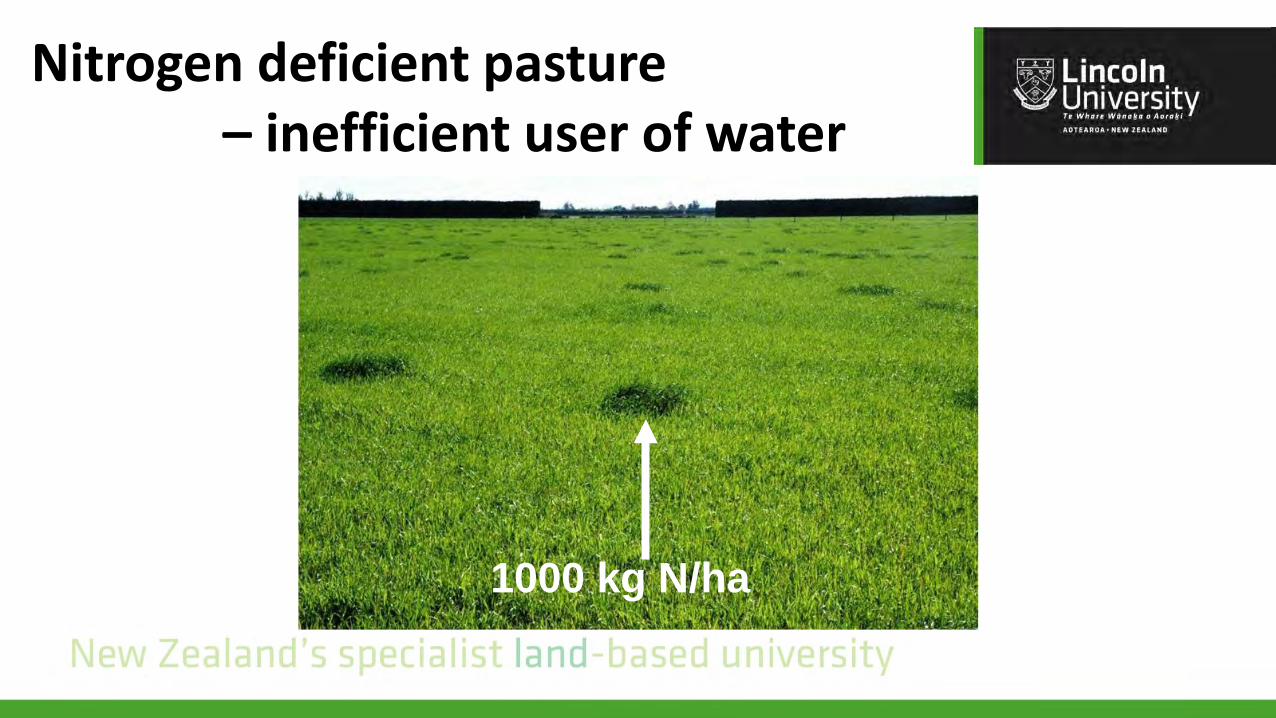
Nitrogen deficient pasture – inefficient user of water
1000 kg N/ha
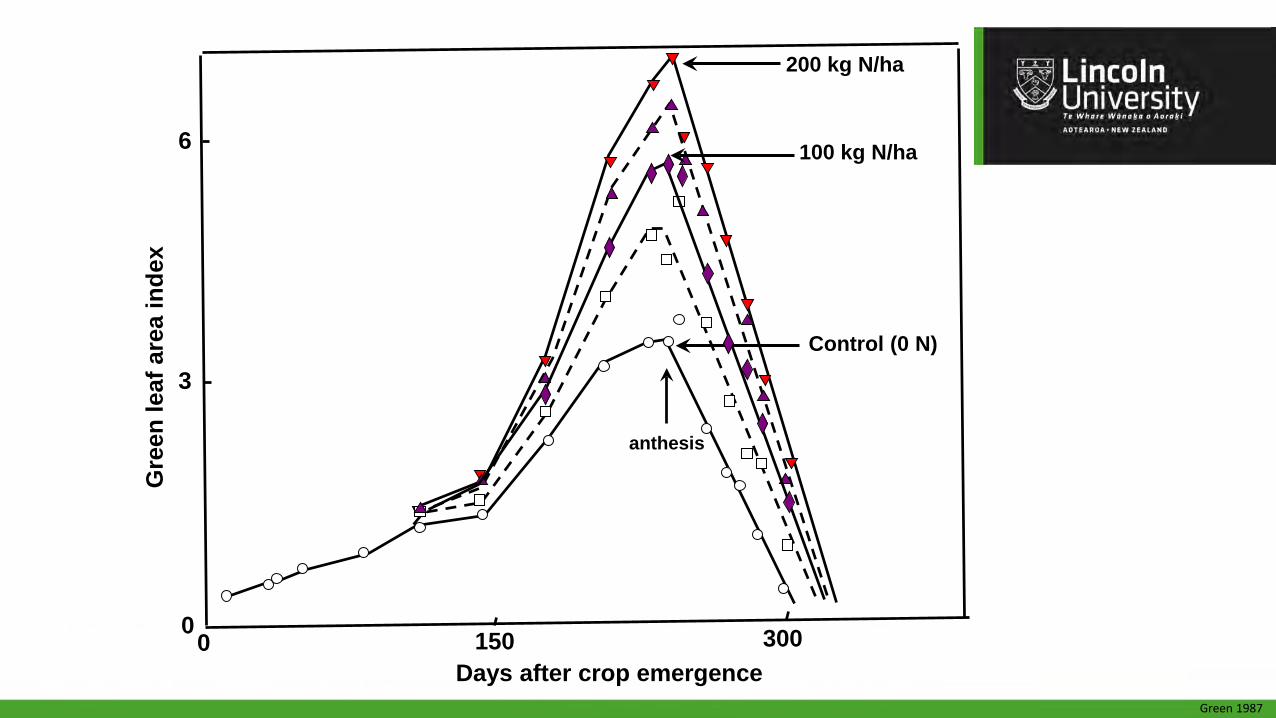
150
200 kg N/ha
anthesis
Control (0 N)
Days after crop emergence
Gre
en le
af a
rea
inde
x6
3
00 300
100 kg N/ha
Green 1987
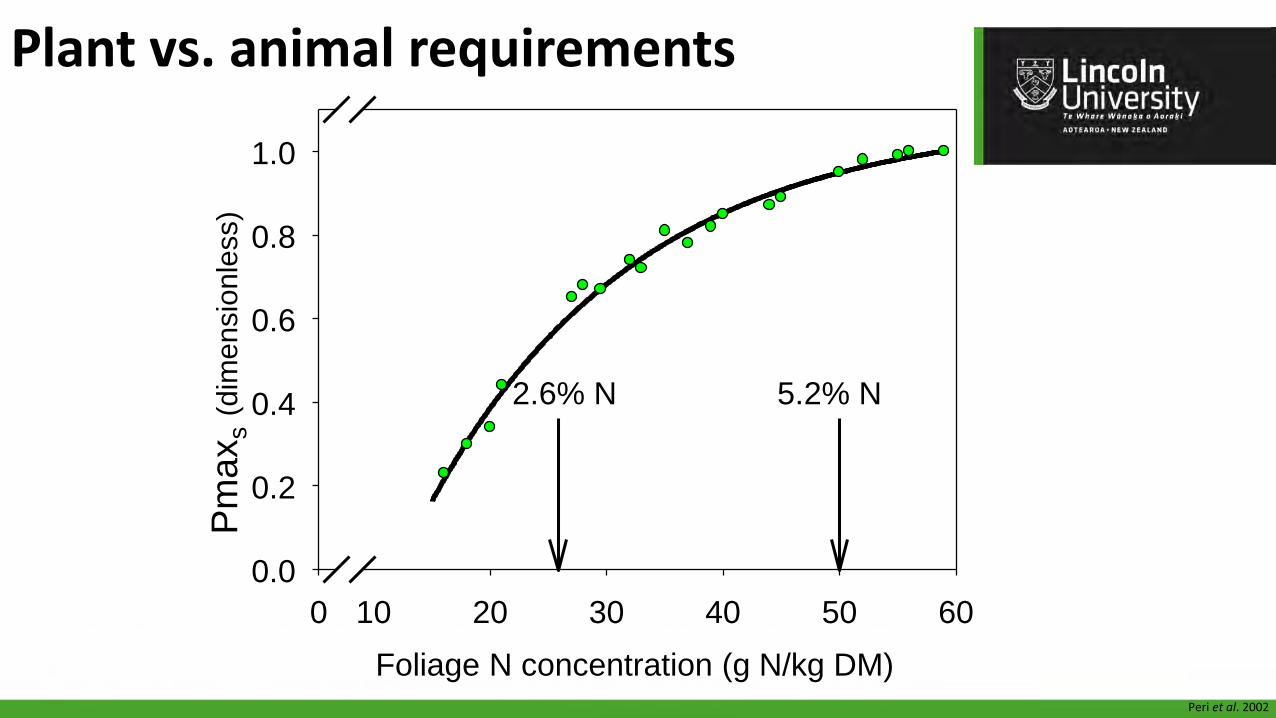
Foliage N concentration (g N/kg DM)0 10 20 30 40 50 60
0.0
0.2
0.4
0.6
0.8
1.0
2.6% N 5.2% N
Pmax
s(d
imen
sion
less
)
Peri et al. 2002
Plant vs. animal requirements

Nitrogen fertiliser use
New Zealand Fertiliser Manufacturers' Research Association
N a
pplie
d (1
000'
s of
t)
0
100
200
300
400
1960/611965/66
1970/711975/66
1980/811985/86
1990/911995/96
2000/012005/06
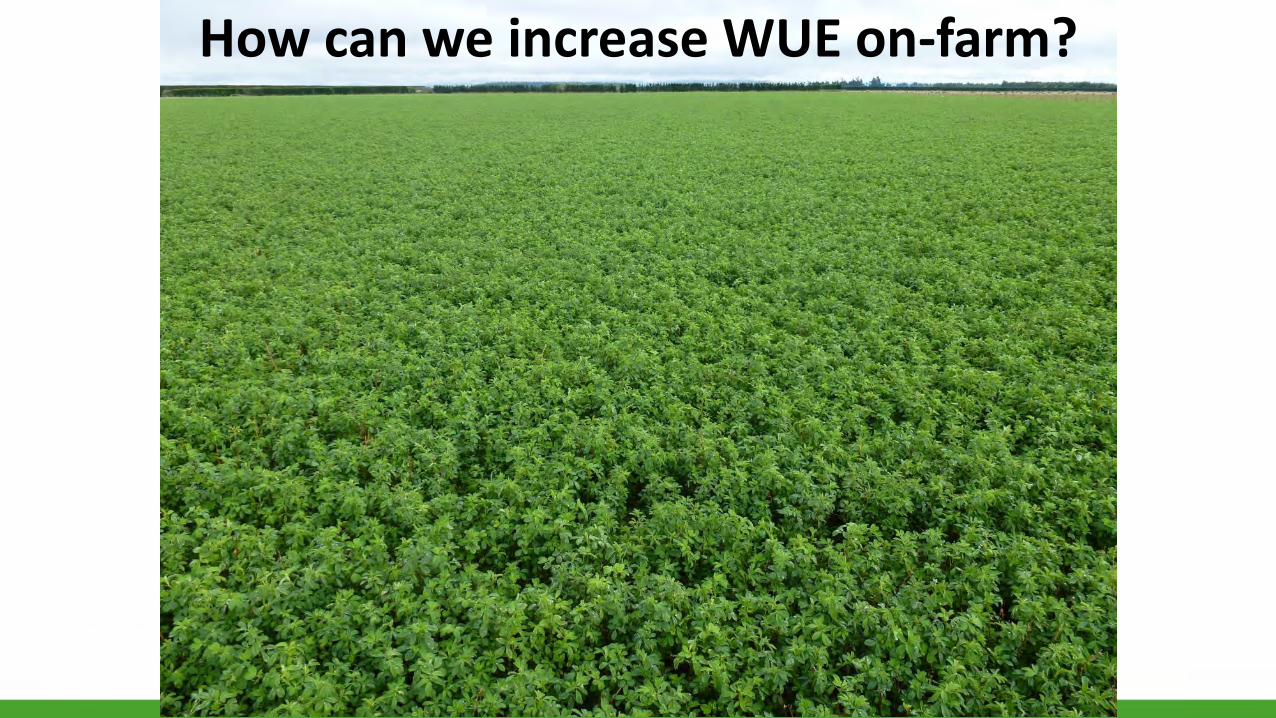
How can we increase WUE on-farm?

20 kg DM/ha/mm
28 kg DM/ha/mm
Ryegrass onlyRyegrass / cloverLucerne
13 kg DM/ha/mm
Spring WUE: legume = (nitrogen)
Water use (mm)0 100 200 300
Accu
mul
ated
DM
(t D
M/h
a)
0
2
4
6
Moot et al. 2008

‘Rosabrook’ subterranean clover
Phot
o: D
r A.D
. Bla
ck(t
aken
at B
og R
oy S
tatio
n)
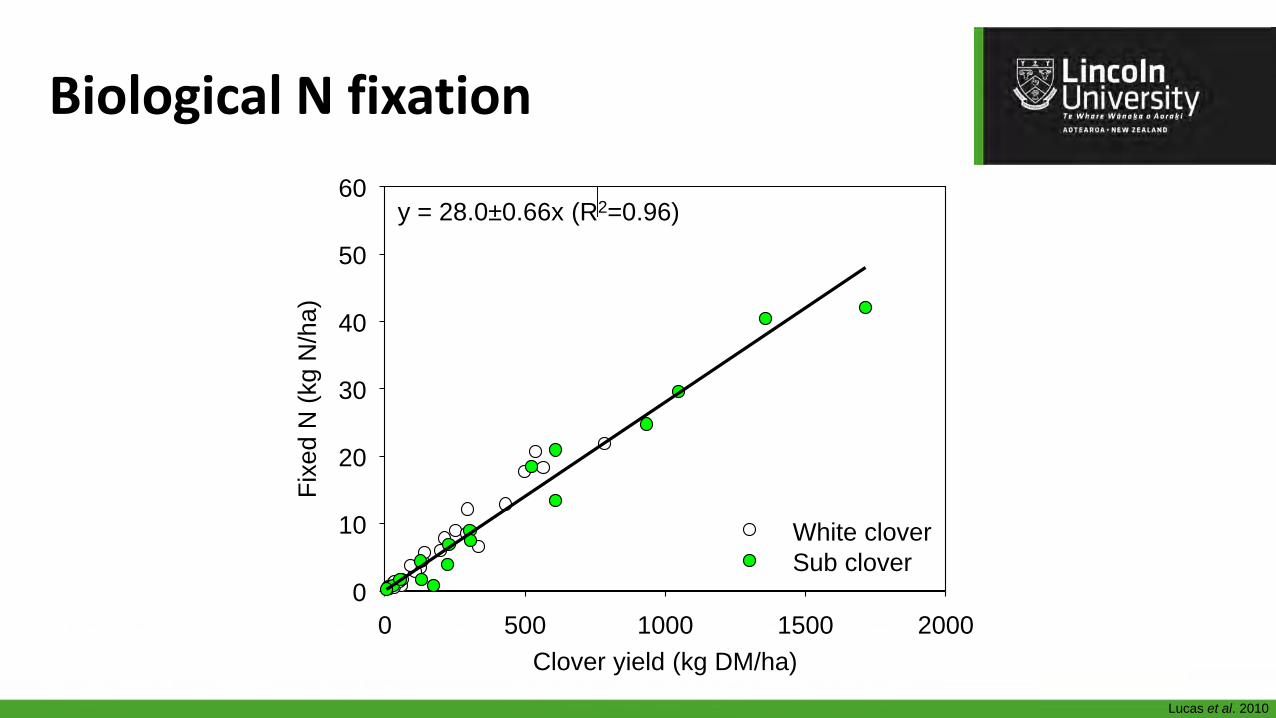
Clover yield (kg DM/ha)0 500 1000 1500 2000
Fixe
d N
(kg
N/h
a)
0
10
20
30
40
50
60
White cloverSub clover
Biological N fixation
y = 28.0±0.66x (R2=0.96)
Lucas et al. 2010
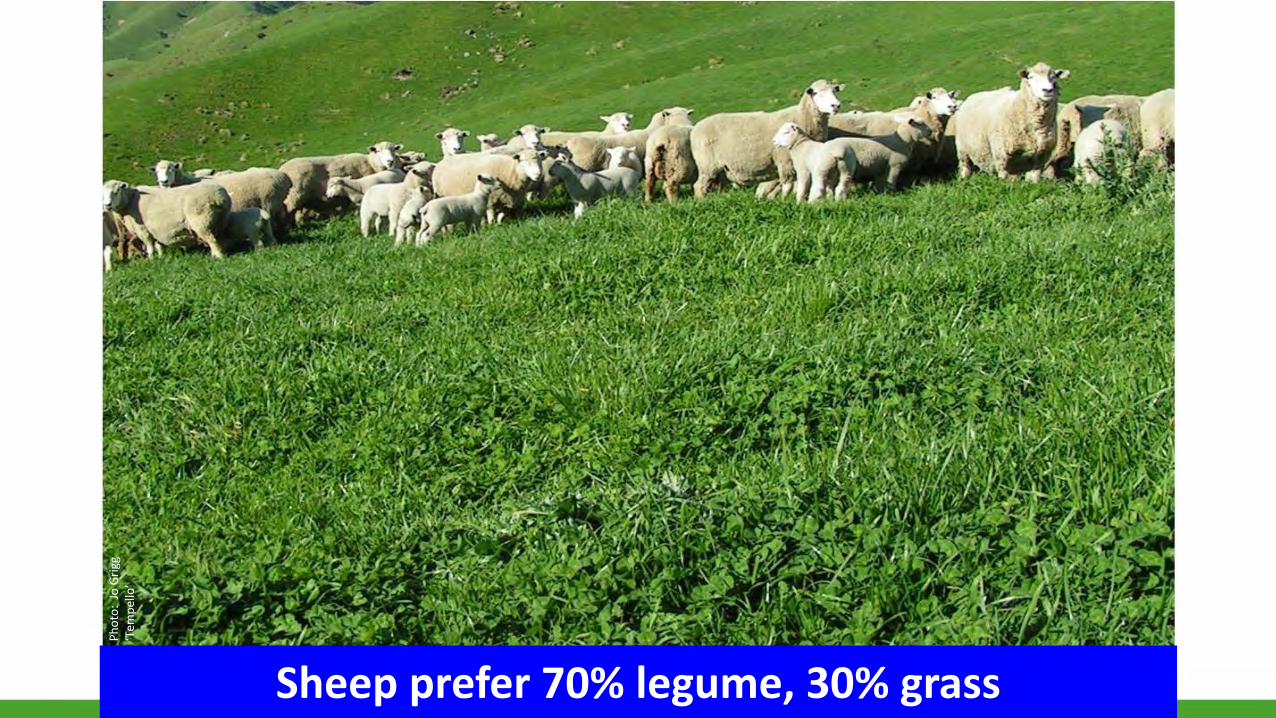
Sheep prefer 70% legume, 30% grass
Phot
o: J
o Gr
igg
‘Tem
pello
’
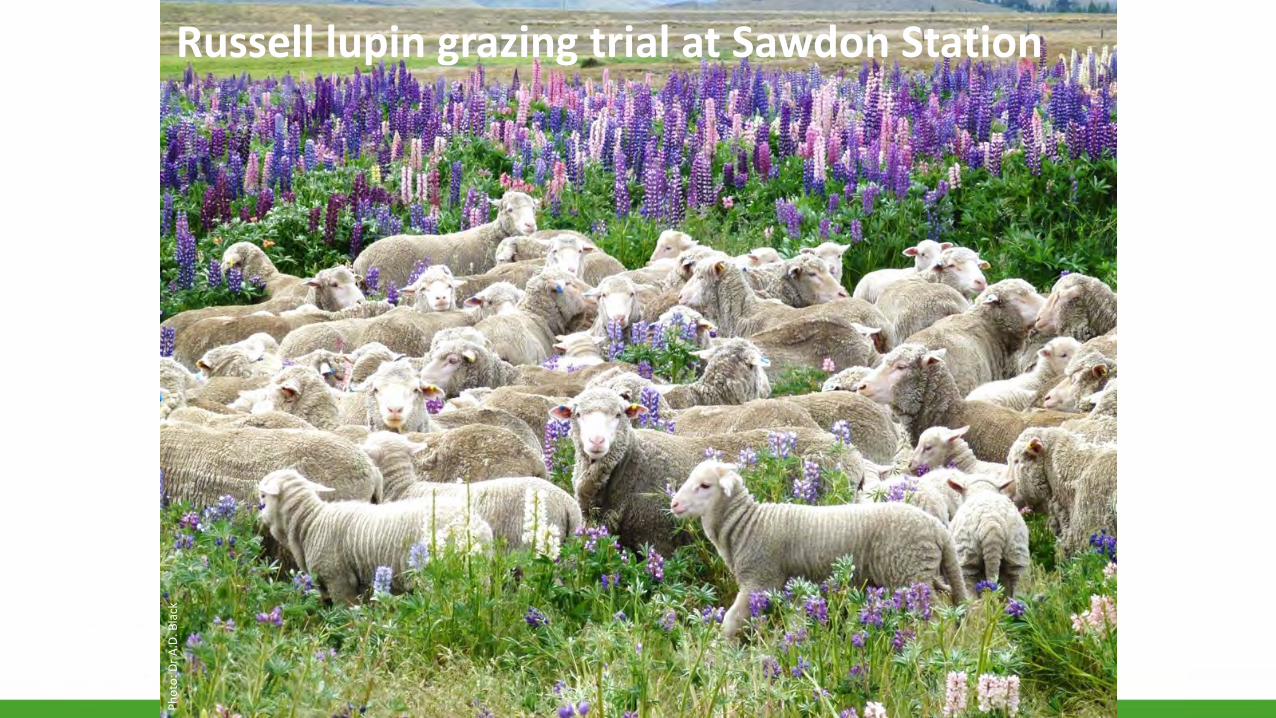
Russell lupin grazing trial at Sawdon Station
Phot
o: D
r A.D
. Bla
ck

Conclusions
• Light interception drives dry matter production• Temperature (air and soil) affect crop development• NTW water affect leaf area expansion and Ps. • Spring gives highest WUE• Agronomists role is to balance nitrogen and water• WHICH LEGUME? – When to use urea?• Optimize production with minimal footprint

ReferencesWebsite: www.lincoln.ac.nz/drylandDryland pastures blog: http://www.lincoln.ac.nz/conversation/drylandpastures/
Bidwell, V., Lilburne, L., Thorley, M. and Scott, D. 2009. Nitrate discharge to groundwater from agricultural land use: An initial assessment for the Canterbury Plains. Report prepared by Lincoln Ventures Limited, Landcare Research, and Environment Canterbury, 16 pp.
Black, A. D. and Murdoch, H. M. 2013. Yield and water use of a ryegrass/white clover sward under different nitrogen and irrigation regimes. Proceedings of the New Zealand Grassland Association, 75, 157-164.
Brown, G., Naish, T. (not specified). The late Quaternary sequence architecture of Canterbury Blight and adjacent plains - http://www.gns.cri.nz/. (Presentation) Department of Statistics. 2010. Agriculture Variable by Regional Council. Date Accessed: 24/9/2010. http://www.stats.govt.nz/infoshare/ViewTable.aspx?pxID=26fc4a72-
0332-4600-b52f-986a9857f17a. Last Updated: Not Specified.Green, C. F. 1987. Nitrogen nutrition and wheat growth in relation to absorbed solar radiation. Agricultural and Forest Meteorology, 41, 207-248.Hay, R. J. M. and Porter, J. R. 2006. The Physiology of Crop Yield (2nd Ed). Oxford: Blackwell Publishing Ltd. 314 pp.Khurana, S. C. and McLaren, J. S. 1982. The influence of leaf area, light interception and season on potato growth and yield. Potato Research, 25, 329-342.Lucas, R. J., Smith, M. C., Jarvis, P., Mills, A. and Moot, D. J. 2010. Nitrogen fixation by subterranean and white clovers in dryland cocksfoot pastures. Proceedings of the New
Zealand Grassland Association, 72, 141-146.Mills, A. 2007. Understanding constraints to cocksfoot (Dactylis glomerata L.) based pasture production, PhD thesis, Lincoln University, Canterbury. 202 pp.Mills, A., Moot, D. J. and McKenzie, B. A. 2006. Cocksfoot pasture production in relation to environmental variables. Proceedings of the New Zealand Grassland Association,
68, 89-94.Moot, D. J., Brown, H. E., Pollock, K. and Mills, A. 2008. Yield and water use of temperate pastures in summer dry environments. Proceedings of the New Zealand Grassland
Association, 70, 51-57.New Zealand Fertiliser Manufacturers' Research Association. 2011. Annual update (New Zealand Fertiliser Manufacturers' Research Association). 15 pp. Date Accessed:
5/5/2011. http://www.fertresearch.org.nz/resource-centre/annual-updates. Last Updated: Dec 2009.NIWA. 2010. Climate Explorer – Canterbury Regional Median Annual Rainfall Map. Date Accessed: 1/10/2010. http://climate-explorer.niwa.co.nz. Last Updated: 1/10/2010.Peri, P. L., Moot, D. J., McNeil, D. L., Varella, A. C. and Lucas, R. J. 2002. Modelling net photosynthetic rate of field-grown cocksfoot leaves under different nitrogen, water and
temperature regimes. Grass and Forage Science, 57, 61-71.Taiz, L. and Zeiger, E. 2010. Plant Physiology (5th Ed.). Massachusetts: Sinauer Associates Inc. 782 pp. Companion website: www.plantphys.net.Wilson, D. R. 1987. New approaches to understanding the growth and yield of pea crops. Special Publication, Agronomy Society of New Zealand, 23-28.