agronomy field research 2006 - home | agronomy | … · · 2016-08-31agronomy field research 2006...
TRANSCRIPT

2006
This publication from the Kansas State University Agricultural Experiment Station and Cooperative Extension Service has been archived. Current information is available from http://www.ksre.ksu.edu.
Agronomy Field Research 2006 Contents Kansas River Valley Introduction, Soil Description, Weather Information . . . . . . . . . . . . . . . . . . . . . . KRV-1 Corn Herbicide Performance Test . . . . . . . . . . . . . . . . . . . . . . . . . . . . . . . . . . . . . KRV-2 Soybean Herbicide Performance Test . . . . . . . . . . . . . . . . . . . . . . . . . . . . . . . . . . . KRV-5 Macronutrient Fertility on Irrigated Corn and Soybeans in a Corn/Soybean Rotation . . . . . . . . . . . . . . . . . . . . . . . . . . . . . . . . . . . . . . . . . . . . . . . . . . . . . . . . . . KRV-7 East Central Introduction, Soil Description, Weather Information . . . . . . . . . . . . . . . . . . . . . . . EC-1 Strip-till and No-till Tillage Fertilization Systems Evaluated for Corn . . . . . . . . . . EC-2 Performance Trials with Double-crop Soybeans Planted No-till following Wheat EC-8 Evaluation of Lumax and Camix on Grain Sorghum . . . . . . . . . . . . . . . . . . . . . . . . EC-10 Harvey County Experiment Field Introduction, Soil Description, 2004/2005 Weather Information . . . . . . . . . . . . . . . HC-1 Reduced Tillage and Crop Rotation Systems with Wheat, Grain Sorghum, Corn, and Soybean . . . . . . . . . . . . . . . . . . . . . . . . . . . . . . . . . . . . . . . . . . .HC-3 No-till Crop Rotation Effects on Wheat, Corn, Grain Sorghum, Soybean, and Sunflower . . . . . . . . . . . . . . . . . . . . . . . . . . . . . . . . . . . . . . . . . . . . . . . HC-9 Effects of Late-Maturing Soybean and Sunn Hemp Summer Cover Crops and Nitrogen Rate on No-till Grain Sorghum after Wheat . . . . . . . . . . . . . . HC-16 Effects of Chloride Rate on No-till Continuous Wheat and Grain Sorghum . . . . . HC-20 Planting Date, Hybrid Maturity, and Plant Population Effects in No-till Corn . . . . HC-23 Soybean for Forage . . . . . . . . . . . . . . . . . . . . . . . . . . . . . . . . . . . . . . . . . . . . . . . . . HC-27 Herbicides for Weed Control in Corn . . . . . . . . . . . . . . . . . . . . . . . . . . . . . . . . . . . HC-30 Irrigation and North Central Kansas Experiment Fields Introduction, Soil Description, 2004 Weather Information . . . . . . . . . . . . . . . . . . . NC-1 Use of Strip Tillage for Corn Production in Kansas. . . . . . . . . . . . . . . . . . . . . . . . . NC-2 Use of Foliar Potassium for Soybean Production in Reduced-tillage Systems . . . . NC-9 Controlled-release Urea for Irrigated Corn Production . . . . .. . . . . . . . . . . . . . . . . NC-11 Maximizing Irrigated Soybean Yields in the Great Plains . . . . . . . . . . . . . . . . … NC-14 Manganese Nutrition of Glyphosate-resistant and Conventional Soybean . . . . . . . NC-17 Management Systems for Grain Sorghum Production Under Dryland and Irrigated Conditions . . . . . . . . . . . . . . . . . . . . . . . . . . . . . . . . . . . . . . . . . . . . . NC-20 South Central Kansas Experiment Field Introduction, Soil Description, Weather Information . . . . . . . . . . . . . . . . . . . . . . . . . SC-1 Crop Performance Tests . . . . . . . . . . . . . . . . . . . . . . . . . . . . . . . . . . . . . . . . . . . . . . . SC-3 Effects of Nitrogen Rate and Previous Crop on Grain Yield in Continuous Wheat and Alternative Cropping Systems in South Central Kansas . . . . . . . . . . . . . SC-4 Effects of Termination Date of Austrian Winter Pea Winter Cover Crop and Nitrogen Rates On Grain Sorghum and Wheat Yields . . . . . . . . . . . . . . . . . . . SC-14 Evaluation of Spring Small Grains for the Production of Grain and Forage . . . . . . SC-18 Effects of Row Spacing and Seeding Rate on Summer Annual Forage Dry Matter Yield . . . . . . . . . . . . . . . . . . . . . . . . . . . . . . . . . . . . . . . . . . . . . . . . . . . .SC-22
This publication from the Kansas State University Agricultural Experiment Station and Cooperative Extension Service has been archived. Current information is available from http://www.ksre.ksu.edu.

Agronomy Field Research 2006 Contents, continued Northwest Kansas Research-Extension County Comparisons of No-Till to Tilled Wheat in Northwest Kansas . . . . . . . . . . NW-1 Dryland Strip-Till in Western Kansas . . . . . . . . . . . . . . . . . . . . . . . . . . . . . . . . . . . . .NW-5 PMDI Field Test Results from Sheridan County . . . . . . . . . . . . . . . . . . . . . . . . . . . . NW-8
This publication from the Kansas State University Agricultural Experiment Station and Cooperative Extension Service has been archived. Current information is available from http://www.ksre.ksu.edu.
i
TABLE OF CONTENTS - KANSAS RIVER VALLEY
Introduction . . . . . . . . . . . . . . . . . . . . . . . . . . . . . . . . . . . . . . . . . . . . . . . . . . . . . . . . . . . . KRV-1
Soil Description . . . . . . . . . . . . . . . . . . . . . . . . . . . . . . . . . . . . . . . . . . . . . . . . . . . . . . . . . KRV-1
Weather Information . . . . . . . . . . . . . . . . . . . . . . . . . . . . . . . . . . . . . . . . . . . . . . . . . . . . . KRV-1
Corn Herbicide Performance Test . . . . . . . . . . . . . . . . . . . . . . . . . . . . . . . . . . . . . . . . . . . KRV-2 Soybean Herbicide Performance Test . . . . . . . . . . . . . . . . . . . . . . . . . . . . . . . . . . . . . . . . KRV-5
Macronutrient Fertility on Irrigated Corn and Soybeans in a Corn/Soybean Rotation . . . KRV-7
EXPERIMENT FIELD PERSONNEL
Dr. Larry D. Maddux, Agronomist in ChargeCharles Clark, Plant Science Technician IIWilliam Riley, Plant Science Technician I
TABLE OF CONTENTS - EAST CENTRAL
Introduction . . . . . . . . . . . . . . . . . . . . . . . . . . . . . . . . . . . . . . . . . . . . . . . . . . . . . . . . . . . . . EC-1
Soil Description . . . . . . . . . . . . . . . . . . . . . . . . . . . . . . . . . . . . . . . . . . . . . . . . . . . . . . . . . . EC-1
Weather Information . . . . . . . . . . . . . . . . . . . . . . . . . . . . . . . . . . . . . . . . . . . . . . . . . . . . . . EC-1
Strip-till and No-till Tillage Fertilization Systems Evaluated for Corn . . . . . . . . . . . . . . . . EC-2
Performance Trials with Double-crop Soybeans Planted No-till Following Wheat . . . . . . EC-8
Evaluation of Lumax and Camix on Grain Sorghum . . . . . . . . . . . . . . . . . . . . . . . . . . . . . EC-10
EXPERIMENT FIELD PERSONNEL
Dr. Larry D. Maddux, Agronomist in ChargeDr. Keith A. Janssen, Soil Management and Conservation Specialist
James M. Kimball, Plant Science Technician IIKeith A. Brock, Student
This publication from the Kansas State University Agricultural Experiment Station and Cooperative Extension Service has been archived. Current information is available from http://www.ksre.ksu.edu.
KRV-1
KANSAS RIVER VALLEY EXPERIMENT FIELD
Introduction
The Kansas River Valley Experiment Field was established to study how to manage and useirrigation resources effectively for crop production in the Kansas River Valley. The Paramore Unitconsists of 80 acres located 3.5 miles east of Silver Lake on US 24, then one mile south of Kiro, and1.5 miles east on 17th street. The Rossville Unit consists of 80 acres located one mile east ofRossville or 4 miles west of Silver Lake on US 24.
Soil Description
Soils on the two fields are predominately in the Eudora series. Small areas of soils in the Sarpy,Kimo, and Wabash series also occur. The soils are well drained, except for small areas of Kimo andWabash soils in low areas. Soil texture varies from silt loam to sandy loam, and the soils aresubject to wind erosion. Most soils are deep, but texture and surface drainage vary widely.
2005 Weather Information
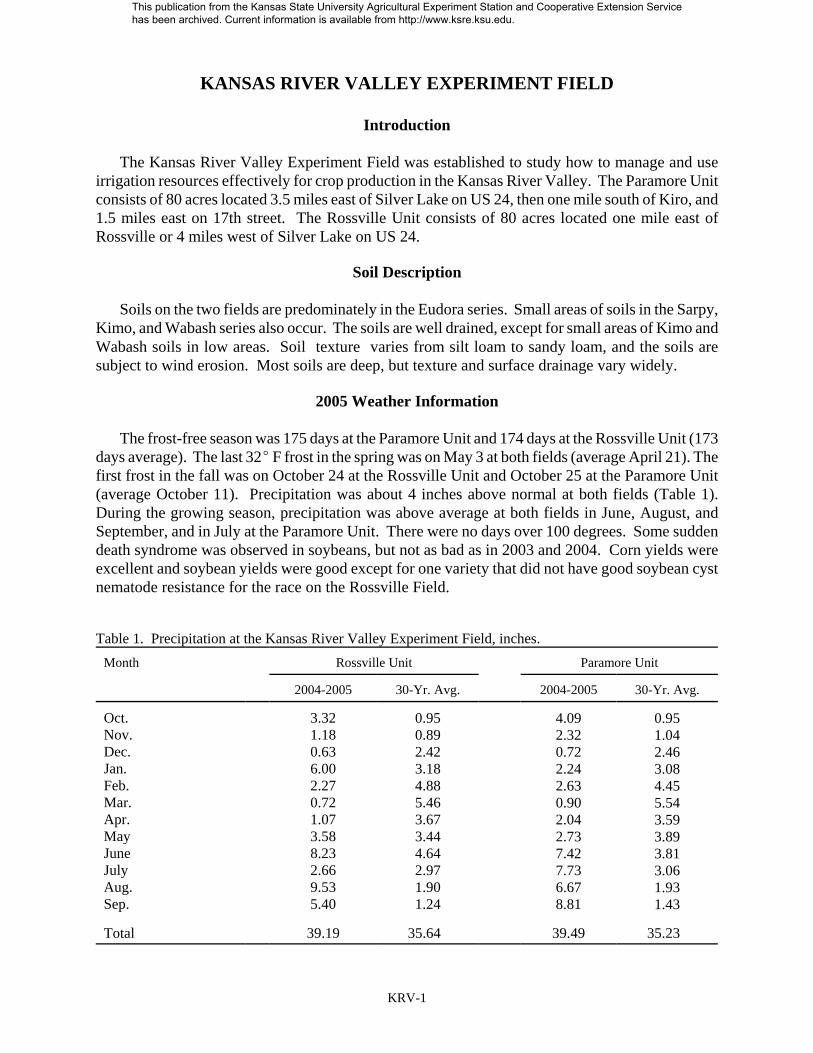
The frost-free season was 175 days at the Paramore Unit and 174 days at the Rossville Unit (173days average). The last 32E F frost in the spring was on May 3 at both fields (average April 21). Thefirst frost in the fall was on October 24 at the Rossville Unit and October 25 at the Paramore Unit(average October 11). Precipitation was about 4 inches above normal at both fields (Table 1).During the growing season, precipitation was above average at both fields in June, August, andSeptember, and in July at the Paramore Unit. There were no days over 100 degrees. Some suddendeath syndrome was observed in soybeans, but not as bad as in 2003 and 2004. Corn yields wereexcellent and soybean yields were good except for one variety that did not have good soybean cystnematode resistance for the race on the Rossville Field.
Table 1. Precipitation at the Kansas River Valley Experiment Field, inches.Month Rossville Unit Paramore Unit
2004-2005 30-Yr. Avg. 2004-2005 30-Yr. Avg.
Oct.Nov.Dec.Jan.Feb.Mar.Apr.MayJuneJulyAug.Sep.
3.321.180.636.002.270.721.073.588.232.669.535.40
0.950.892.423.184.885.463.673.444.642.971.901.24
4.092.320.722.242.630.902.042.737.427.736.678.81
0.951.042.463.084.455.543.593.893.813.061.931.43
Total 39.19 35.64 39.49 35.23
This publication from the Kansas State University Agricultural Experiment Station and Cooperative Extension Service has been archived. Current information is available from http://www.ksre.ksu.edu.

KRV-2
CORN HERBICIDE PERFORMANCE TEST
Larry Maddux
Summary
This study was conducted at the RossvilleUnit. Preemergence and two-pass herbicideapplications were compared with applicationsof glyphosate alone. One application ofglyphosate without a preemergence treatmentdid not give satisfactory weed control. Twoapplications gave good control of largecrabgrass, Palmer amaranth, and commonsunflower, but not ivyleaf morningglory. Itgenerally took a two-pass program to getgreater than 80% control of ivyleafmorningglory. Weed control withpreemergence treatments would probablybeen better if sufficient rainfall for activationhad been received sooner after theirapplication.
Introduction
Chemical weed control and cultivationhave been used to control weeds in row cropsto reduce weed competition which can reduceyields. Timeliness of application is a majorfactor in determining effective weed control.Twenty-four herbicide treatments includingp r e e m e r g e n c e , p r e e m e r g e n c e +postemergence, and glyphosate herbicidetreatments were compared. The weedsevaluated in this test were large crabgrass(lacg), palmer amaranth (paam), commonsunflower (cosf), and ivyleaf morningglory(ilmg)
Procedures
The test was conducted on a Eudora siltloam soil previously cropped to soybeans atthe Rossville Unit. It included fourpreemergence (PRE) treatments, sixteenpreemergence + postemergent (two-pass)treatments, and four glyphosate postemergenttreatments: early post (EP), mid-post (MP),
late post (LP), and early + late post. The testsite had a pH of 6.9 and an organic mattercontent of 1.1%. DeKalb DKC6381RR hybridcorn was planted April 27 at 30,000 seeds/a in30-inch rows. Anhydrous ammonia at 150 lbsN/a was applied preplant, and 120 lbs/a of 10-34-0 fertilizer was banded at planting.Herbicides were broadcast in 15 gal/a with8003XR flat fan nozzles at 17 psi. Theexperimental design was a randomizedcomplete block with three replications pertreatment. PRE applications were made April27. EP treatments were applied May 30 to 6leaf corn, seedling to 1" lacg, 1-3" paam, and1-6" cosf and 1-2" ilmg. The MP treatmentswere applied June 8 to 7 leaf corn, 1-2" lacg,2-5" paam, a few 2-8" cosf, and seedling ilmg.LP treatments were applied June 11 to 1-3"lacg, 1-5" paam, 3-10" cosf, and 1-3" ilmg.Populations of all four weed species weremoderate to heavy. However, weedpopulations were generally fairly light atpostemergence time in plots receiving apreemergence treatment. Plots were notcultivated. The weed control ratings reportedwere made July 19. The first significantrainfall after PRE herbicide application wason May 12 (2.65 inches). On the two daysfollowing PRE application, 0.15 inch of rainwas received. The plots were irrigated asneeded. The test was harvested September 21using a modified John Deere 3300 plotcombine.
Results
Rainfall of 0.15 inch occurred over thetwo days immediately after planting. Anadditional 0.10 inch was received on May 7 &8. It wasn’t until May 12 that a significantrainfall was received (2.65 inch) and anadditional 0.40 inch was received on May 13.No crop injury was observed. Excellentcontrol of paam and cosf was obtained with
This publication from the Kansas State University Agricultural Experiment Station and Cooperative Extension Service has been archived. Current information is available from http://www.ksre.ksu.edu.

KRV-3
all treatments (Table 2). Control of lacg wasbes t wi th t rea tments conta in ingpostemergence applications of Callisto orglyphosate treatments. It took twoapplications of Roundup Weathermax (whenno PRE was applied) to get acceptable weedcontrol, although the one MP applicationresulted in good control of lacg, paam, andcosf. Eighty percent or better control of ilmgwas only obtained with treatments containingLumax or Lexar (PRE) as well as Bicep IIMagnum (PRE) followed by (fb) Callisto +Aatrex or Touchdown Total, Fultime and
Keystone (PRE) fb Glyphomax XRT, HarnessExtra (PRE) fb Permit + Aim, and GuardsmanMax (PRE) fb Buctril + Atrazine. If sufficientactivating rainfall would have been receivedsooner after PRE application, the PREtreatments would probably have given betterlacg , and possibly ilmg, control. There wasa large variation in grain yield, but because ofthe large LSD (0.05) of 58 bu/a, there werefew significant differences attributable to theherbicide treatments. Soil variability wasconsidered to be the main contributing factorfor the large LSD.
This publication from the Kansas State University Agricultural Experiment Station and Cooperative Extension Service has been archived. Current information is available from http://www.ksre.ksu.edu.

KRV-4
Table 2. Effects of pre- and post-emergence herbicides on injury, weed control, and grain yield of corn, Kansas River Valley Experiment Field, Rossville, KS, 2005.
Treatment1 Rate,product/a
ApplTime2
Percent Weed Control, July 19 3 GrainYield,
bu/alacg paam cosf ilmg
Untreated check --- 0 0 0 0 71
LumaxLumax + AAtrexLexarLexar + Princep 4FLCamix fb Touchdown TotalLumax fb Touchdown TotalLexar fb Touchdown TotalCamix + Touchdown TotalLumax + Touchdown TotalLexar + Touchdown TotalDual II Magnum fb Touchdown TotalBicep II Magnum fb Callisto + AatrexBicep II Magnum fb Touchdown TotalLexar fb LexarFultime fb Glyphomax XRTKeystone fb Glyphomax XRTHarness Xtra 5.6 fb Permit + AimGuardsman Max fb Buctril + AtrazineHarness Xtra 5.6 fb Roundup WeathermaxRoundup WeathermaxRoundup WeathermaxRoundup WeathermaxRoundup Weathermax fb Roundup Weathermax
2.5 qt2.5 qt + 1.0 qt
3.0 qt3.0 qt + 1.0 qt
1.6 qt 24 oz2.0 qt24 oz2.26qt24 oz
1.6 qt + 24 oz2.0 qt + 24 oz2.26qt + 24 oz
1.33pt24 oz2.1 qt
3.0 oz + 0.5 qt1.75 qt24 oz1.5 qt
1.5 qt + 24 oz2.5 qt24 oz2.0 Qt24 oz
2.25 qt0.67 oz + 0.5 oz
2.0 qt2.0pt1.2 qt22 oz22 oz22 oz22 oz22 oz22 oz
PREPREPREPREPREMPPREMPPREMPEPEPEP
PREMPPREMPPREMPPREEP
PREMPPREMPPREMPPREMPPREMPEPMPLPEPLP
7068636378
78
75
82788278
87
80
93
85
87
77
62
90
73803095
9899999699
99
99
99999999
99
99
99
99
96
99
99
99
99999999
9999999999
99
99
99999999
99
99
99
99
96
99
99
99
99999999
6580585265
90
82
558280
0
82
83
95
90
92
85
95
65
27104057
158154189189164
152
177
209194179178
196
233
217
220
230
203
209
223
195169119151
LSD(.05) 10 3 2 28 581 2 Postemergence treatments had surfactants added as per label recommendations.2 PRE = preemergence; EP = early postemergence; MP = mid-postemergence; LP = late postemergence. 3 lacg = large crabgrass; paam = palmer amaranth; cosf = common sunflower; ilmg = ivyleaf morningglory.
This publication from the Kansas State University Agricultural Experiment Station and Cooperative Extension Service has been archived. Current information is available from http://www.ksre.ksu.edu.
KRV-5
SOYBEAN HERBICIDE PERFORMANCE TEST
Larry Maddux
Summary
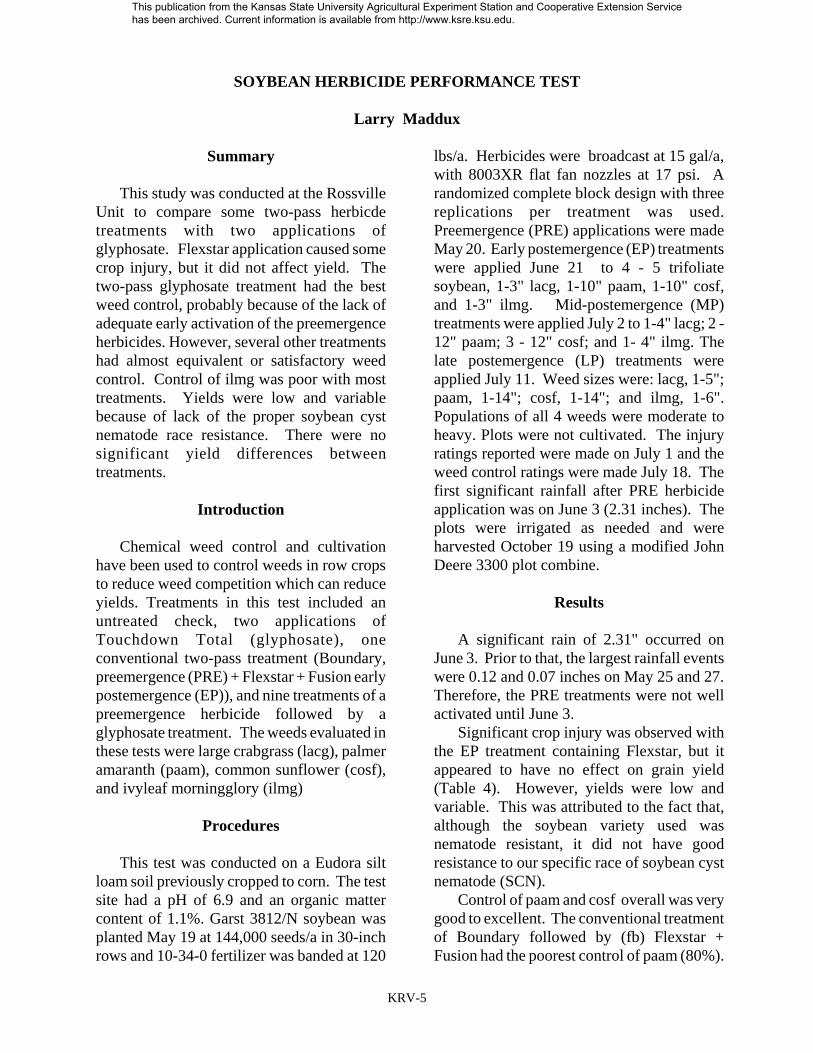
This study was conducted at the RossvilleUnit to compare some two-pass herbicdetreatments with two applications ofglyphosate. Flexstar application caused somecrop injury, but it did not affect yield. Thetwo-pass glyphosate treatment had the bestweed control, probably because of the lack ofadequate early activation of the preemergenceherbicides. However, several other treatmentshad almost equivalent or satisfactory weedcontrol. Control of ilmg was poor with mosttreatments. Yields were low and variablebecause of lack of the proper soybean cystnematode race resistance. There were nosignificant yield differences betweentreatments.
Introduction
Chemical weed control and cultivationhave been used to control weeds in row cropsto reduce weed competition which can reduceyields. Treatments in this test included anuntreated check, two applications ofTouchdown Total (glyphosate), oneconventional two-pass treatment (Boundary,preemergence (PRE) + Flexstar + Fusion earlypostemergence (EP)), and nine treatments of apreemergence herbicide followed by aglyphosate treatment. The weeds evaluated inthese tests were large crabgrass (lacg), palmeramaranth (paam), common sunflower (cosf),and ivyleaf morningglory (ilmg)
Procedures
This test was conducted on a Eudora siltloam soil previously cropped to corn. The testsite had a pH of 6.9 and an organic mattercontent of 1.1%. Garst 3812/N soybean wasplanted May 19 at 144,000 seeds/a in 30-inchrows and 10-34-0 fertilizer was banded at 120
lbs/a. Herbicides were broadcast at 15 gal/a,with 8003XR flat fan nozzles at 17 psi. Arandomized complete block design with threereplications per treatment was used.Preemergence (PRE) applications were madeMay 20. Early postemergence (EP) treatmentswere applied June 21 to 4 - 5 trifoliatesoybean, 1-3" lacg, 1-10" paam, 1-10" cosf,and 1-3" ilmg. Mid-postemergence (MP)treatments were applied July 2 to 1-4" lacg; 2 -12" paam; 3 - 12" cosf; and 1- 4" ilmg. Thelate postemergence (LP) treatments wereapplied July 11. Weed sizes were: lacg, 1-5";paam, 1-14"; cosf, 1-14"; and ilmg, 1-6".Populations of all 4 weeds were moderate toheavy. Plots were not cultivated. The injuryratings reported were made on July 1 and theweed control ratings were made July 18. Thefirst significant rainfall after PRE herbicideapplication was on June 3 (2.31 inches). Theplots were irrigated as needed and wereharvested October 19 using a modified JohnDeere 3300 plot combine.
Results
A significant rain of 2.31" occurred onJune 3. Prior to that, the largest rainfall eventswere 0.12 and 0.07 inches on May 25 and 27.Therefore, the PRE treatments were not wellactivated until June 3.
Significant crop injury was observed withthe EP treatment containing Flexstar, but itappeared to have no effect on grain yield(Table 4). However, yields were low andvariable. This was attributed to the fact that,although the soybean variety used wasnematode resistant, it did not have goodresistance to our specific race of soybean cystnematode (SCN).
Control of paam and cosf overall was verygood to excellent. The conventional treatmentof Boundary followed by (fb) Flexstar +Fusion had the poorest control of paam (80%).
This publication from the Kansas State University Agricultural Experiment Station and Cooperative Extension Service has been archived. Current information is available from http://www.ksre.ksu.edu.

KRV-6
The control of lacg was good to excellent withthe exception of the Boundary fb Flexstar +Fusion and the Boundary fb Touchdown Totaltreatments which only had 77 and 68%control, respectively. Control of ilmg waspoor to fair with only one treatment(Touchdown Total
fb Touchdown Total) attaining greater than80% control. This was probably because ofthe lack of timely activation of the PREherbicides, some of which would normallyhave activity on ilmg. The untreated checkwas not harvestable because of weeds,especially cosf. As mentioned earlier, yieldswere low because of the lack of proper SCNrace resistance.
Table 4. Effects of herbicide application on injury, weed control, and grain yield of soybean, Kansas River Valley Experiment Field, Rossville, KS, 2005.
Treatment1 Rate,product/a
ApplTime2
Injury,July 1
%
Percent Weed Control, July 183 GrainYield,bu/alacg paam cosf ilmg
Untreated check --- 0 0 0 0 0 0
Boundary fb Flexstar + FusionBoundary fb Touchdown TotalBoundary fb Touchdown Total + FirstRateTouchdown Total fb Touchdown TotalFirstRate + Valor fb Glyphomax XRTFirstRate fb Glyphomax XRTPendimax + FirstRate fb Glyphomax XRTPendimax + Python fb Glyphomax XRTIntrro fb Roundup WeatherMaxIntrro + Valor fb Roundup WeatherMaxDual II Magnum + FirstRate fb Touchdown Total
1.5 pt16 oz + 10 oz
1.5 pt24 oz1.5 pt
24 oz + 0.3 oz24 oz19 oz
0.3 oz + 1.5 oz24 oz0.3 oz24 oz
3.0 pt + 0.3 oz24 oz
3.0 pt + 0.8 oz24 oz2.0 qt22 oz
2.0 qt + 1.50oz22 oz
1.3 pt + 0.6 oz24 oz
PREEP
PREEP
PREEPEPEP
PREEPEPLPEPEPLPEP
PREEP
PREEP
PREEP
12
0
0
0
0
0
0
0
0
0
0
77
68
87
99
90
85
88
92
92
97
93
80
93
87
99
98
99
98
97
97
99
98
99
98
99
99
99
99
99
99
99
99
99
0
50
73
83
75
72
35
63
10
70
53
24.9
13.0
25.7
22.7
14.6
20.1
23.2
29.2
26.1
26.1
25.4
LSD(.05) 1 8 7 1 28 18
1 Postemergence treatments had surfactants added ( COC, UAN, &/or AMS) according to label recommendations.2 PRE = preemergence (5/20); EP = early postemergence (6/21); MP = Mid-postemergence (7/2); LP = Late postemergence (7/11).3 lacg = large crabgrass; paam = palmer amaranth; cosf = common sunflower; ilmg = ivyleaf morningglory.
This publication from the Kansas State University Agricultural Experiment Station and Cooperative Extension Service has been archived. Current information is available from http://www.ksre.ksu.edu.

KRV-7
MACRONUTRIENT FERTILITY ON IRRIGATED CORN AND SOYBEANS IN ACORN/SOYBEAN ROTATION
Larry D. Maddux
Summary
A corn-soybean cropping sequence wasevaluated from 1983- 005 (corn planted inodd years) for the effects of N, P, and Kfertilization. From this study, it wasdetermined that no more than 160 lbs N/a wasrequired to obtain optimum corn yields. Nfertilization at 160 lbs N/a decreased soil pHand Bray-1 P when compared to no N applied.P & K fertilization maintained medium tohigh soil test levels. A significant averagecorn yield increase to P fertilization was notobserved. A 6 bu/a average corn yieldincrease was observed from 1983-95 with Kfertilization. N, P & K fertilization of cornincreased the yield of the following soybeancrop from 2 to almost 5 bu/a on the average.
Introduction
A study was initiated in 1972 at theTopeka Unit to evaluate the effects ofnitrogen (N), phosphorus (P), and potassium(K) on irrigated soybeans. In 1983, the studywas changed to a corn/soybean rotation withcorn planted in odd years. Study objectivesare to evaluate the effects of applications ofN, P, and K made to a corn crop on (a) grainyields of corn and the following soybean cropand (b) soil test values.
Procedures
The initial soil test in March 1972 on thissilt loam soil was 47 lbs/a of available P and312 lbs/a of exchangeable K in the top 6 in. ofthe soil profile. Rates of P were 50 and 100lbs P2O5/a (1972-1975) and 30 and 60 lbsP2O5/a (1976-2005), except in 1997 when astarter of 120 lbs/a of 10-34-0 (12 lbs N/a +41 lbs P2O5/a) was applied to all plots (also
applied to soybeans in 1998). Rates of K were100 lbs K2O/a (1972-1975), 60 lbs K2O/a(1976-1995), and 150 lbs K2O/a (1997-2005). N Rates included a factorialarrangement of 0, 40, and 160 lbs of preplantN/a (with single treatments of 80 and 240 lbsN/a). The 40 lbs N/a rate was changed to 120lbs N/a in 1997. N, P, and K treatments wereapplied every year to soybeans (1972-1982)and every other year (odd years) to corn (1983-1995, 1999-2005). Soil samples were takento a depth of 6 inches in the spring of 2005(before fertilizer was applied to the corn) andanalyzed for pH, Bray-1 P, exchangeable K,and organic matter content.
Corn hybrids planted in mid-April wereBoJac 603 (1983), Pioneer 3377 (1985, 1987,1989), Jacques 7820 (1991 and 1993),Mycogen 7250CB (1995), DeKalb 626 (1997,1999), Golden Harvest 2547 (2001), Pioneer33R77 (2003); and DeKalb DKC 63-81RRYG(2005). Soybean varieties planted in early tomid-May were Douglas (1984), Sherman(1986, 1988, 1990, 1992, 1996, and 1997);Edison (1994), IA 3010 (2000), Garst 399RR(2002), and Stine 3982-4 (2004). Herbicideswere applied preplant and incorporated eachyear in both corn and soybeans. The plotswere cultivated and irrigated as needed. Aplot combine was used for harvesting grainyields.
Results
Soil samples taken in the spring of 2005showed that soil pH decreased from 7.0 withno N applied to 6.7 with 160 lbs N/a (Table5). Bray-1 P also decreased from 23.1 ppmwith no N to 17.7 ppm with 160 lbs N/a. Nfertilization had no effect on Exchangeable Kor organic matter content. The Bray-1 P levelhad decreased to 7.7 ppm with no added P,
This publication from the Kansas State University Agricultural Experiment Station and Cooperative Extension Service has been archived. Current information is available from http://www.ksre.ksu.edu.

KRV-8
and had a 34.3 ppm level with the high Pfertilization rate. P fertilization had no effecton soil pH, exchangeable K, or organicmatter. Exchangeable K dropped to 177 ppmcompared to 258 ppm with K fertilization. Kfertilization had no effect on soil pH, Bray-1P, or organic matter.
Average corn yields for 1983-1995 (7years) and for 1997-2005 (5 years) are shownin Table 6. A good N response was obtainedwith 160 lbs N/a with fertilization at 240 lbsN/a resulting in little additional yield. In the1997-2005 average, corn fertilized with 120lbs N/a yielded only 5 bu/a less than thatfertilized with 160 lbs N/a. The average corn
yields for both time periods did not show asignificant response to P fertilization.However, a yield response was obtained in afew years (yearly data not shown). Kfertilization showed a significant averageyield increase of 6 bu/a in the 1985-95, butonly a non-significant increase of 3 bu/a in1997- 2005.
Soybeans showed a good response to thefertilizer previously applied to corn. Therewas a 3.1 and 2.9 bu/a average yield increaseto N application at 160 lbs N/a for the twotime periods, while phosphorus increasedaverage yield by 4.6 and 3.3 bu/a andpotassium fertilization resulted in averageyield increases of 2.3 bu/a for both timeperiods.
This publication from the Kansas State University Agricultural Experiment Station and Cooperative Extension Service has been archived. Current information is available from http://www.ksre.ksu.edu.

KRV-9
Table 5. Effects of N, P, and K applications on soil pH, Bray-1 P, exchangeable K, andorganic matter in a corn-soybean cropping sequence, Topeka, Spring 2005.
Fertilizer Applied1 Soil Bray-1 Exchangeable Organic
N P2O52 K2O pH P K Matter
---------------------lbs/a---------------------- ppm ppm %
000000
00
50/3050/30100/60100/60
060/150
060/150
060/150
7.17.17.07.07.07.0
8.510.022.521.041.035.5
181279181247188247
1.31.21.31.21.41.3
160160160160160160
00
50/3050/30100/60100/60
060/150
060/150
060/150
6.76.66.76.76.76.7
5.5 6.812.820.529.830.8
174267160270179235
1.21.31.31.31.31.2
LSD(.05) 0.1 9.3 30 NS
NITROGEN MEANS:
0160
LSD(.05)
7.06.70.1
23.117.7 3.3
221214NS
1.31.3NS
PHOSPHORUS MEANS:
LSD(.05)
050/30100/60
6.96.96.9NS
7.719.234.3 3.3
225214212NS
1.31.31.3NS
POTASSIUM MEANS:
LSD(.05)
060/150
6.96.9NS
20.020.8NS
177258 8
1.31.2NS
1 Fertilizer applied to corn in odd years 1983 - 2005 and to soybeans for 11 years prior to 1983 (the first number oftwo is the rate applied to corn from 1983 - 1995).2 P treatments not applied in 1997. Starter fertilizer of 10 gal/a of 10-34-0 was applied to all treatments in 1997 &1998 (corn & soybeans). N & K treatments were applied to corn in 1997
This publication from the Kansas State University Agricultural Experiment Station and Cooperative Extension Service has been archived. Current information is available from http://www.ksre.ksu.edu.

KRV-10
Table 6. Effects of nitrogen, phosphorus, and potassium applications on corn yields in acorn-soybean cropping sequence, Topeka.
Fertilizer Applied1 Corn Yield Soybean Yield
N P2O52 K2O 1983 - 1995 1997 - 2005 1984 - 1996 1998 - 2004
---------------------lbs/a---------------------- ------------------------------------ bu/a -----------------------------------
000000
00
50/3050/30100/60100/60
060/150
060/150
060/150
87 86 93 86 84 92
96 98112 95 95 99
63.965.669.069.869.672.3
50.353.654.954.954.459.1
40/12040/12040/12040/12040/12040/120
00
50/3050/30100/60100/60
060/150
060/150
060/150
129126123138117132
186181183196187196
66.367.766.772.770.871.4
54.456.554.759.156.157.2
160160160160160160
00
50/3050/30100/60100/60
060/150
060/150
060/150
171177168181167178
186184181203201202
68.870.070.573.871.374.2
55.855.955.358.859.160.0
80240
50/3050/30
60/15060/150
151182
180203
71.571.7
60.059.3
LSD(.05) 18 25 5.1 4.6
NITROGEN MEANS:
040/120
160LSD(.05)
88127174 8
99188193 11
68.469.371.5 2.2
54.656.357.5 1.9
PHOSPHORUS MEANS:
LSD(.05)
050/30100/60
129131128 NS
155162163 NS
67.070.471.6 2.2
54.456.357.7 1.9
POTASSIUM MEANS:
LSD(.05)
060/150
127133 6
158161 NS
68.670.9 1.8
55.057.3 1.5
1 Fertilizer applied to corn in odd years 1983 - 2005 and to soybeans for 11 years prior to 1983 (the first number oftwo is the rate applied to corn from 1983 - 1995).2 P treatments not applied in 1997. Starter fertilizer of 10 gal/a of 10-34-0 was applied to all treatments in 1997 &1998 (corn & soybeans). N & K treatments were applied to corn in 1997
This publication from the Kansas State University Agricultural Experiment Station and Cooperative Extension Service has been archived. Current information is available from http://www.ksre.ksu.edu.

EC-1
EAST CENTRAL KANSAS EXPERIMENT FIELD
Introduction
The research program at the East-Central Kansas Experiment Field is designed to enhancethe area's agronomic agriculture. Specific objectives are (1) to identify the top performing varietiesand hybrids of wheat, corn, grain sorghum, and soybean; (2) to quantify the amount of tillagenecessary for optimum crop production; (3) to evaluate weed control practices using chemical, non-chemical, and combination methods; and (4) to test fertilizer rates, sources and application methodsfor crop performance and environmental effects.
Soil Description
Soils on the field’s 160 acres are Woodson. The terrain is upland and level-to-gently rolling.The surface soil is a dark, gray-brown silt loam to silty clay loam and the subsoil is dense clay whichmakes the soil somewhat poorly drained. The soil is derived from old alluvium. Water-intake isslow, averaging less than 0.1 in. per hour when saturated. This makes the soil susceptible to waterrunoff and sheet erosion.
2005 Weather Information
Precipitation during 2005 totaled 43.04 inches, which was 6.26 inches above the 35-yraverage (Table 1). Rainfall during March and April was 3.88 inches below average, but cumulativerainfall for May, June, July, and August was 11.11 inches above average.The coldest temperaturesduring 2005 occurred in January and December with 12 days in single digits and two days belowzero. The overall coldest day was 12oF below zero on December 9. There were 30 days during thesummer in which temperatures exceeded 90 degrees. The hottest day in 2005 was August 4, witha temperature of 97oF. The hottest seven-day period in 2005 was June 24 through June 30, whendaily temperatures averaged 93oF. The last freeze in the spring was May 10 (average, April 18) andthe first killing frost in the fall was October 26 (average, October 21). The number of frost-free dayswas 168, compared with the long-term average of 185.
Table 1. Precipitation at the East-Central Experiment Field, Ottawa, Kansas, inches.Month 2005 35-yr.
avg.Month 2005 35-yr. avg.
January 3.35 1.03 July 3.74 3.37Februar 2.07 1.32 August 8.08 3.59March 0.99 2.49 Septembe 2.35 3.83April 1.12 3.50 October 2.63 3.43May 5.37 5.23 November 0.80 2.32June 11.32 5.21 December 1.22 1.45
Annual Total 43.04 36.78
This publication from the Kansas State University Agricultural Experiment Station and Cooperative Extension Service has been archived. Current information is available from http://www.ksre.ksu.edu.

EC-2
STRIP-TILL AND NO-TILL TILLAGE FERTILIZATION SYSTEMS EVALUATED FOR CORN
K.A. Janssen, W.B. Gordon, and R.E. Lamond
Summary
Strip-till and no-till tillage/fertilizationsystems were evaluated for corn at the East-Central Kansas Experiment Field during 2003-2005. Averaged across all tillage and fertilizersystems and years, fall strip-till with under-the-row fertilizers performed best and resulted inincreased plant stands and higher corn grainyields compared to no-till. There was noevidence that fertilizers strip-till applied in thefall performed inferior to fall strip-till andspring planter- banded fertilizer.
Introduction
Row-crop agriculture in East Central andSoutheast Kansas must find ways to offsetrising fuel and fertilizer costs and because ofenvironmental pressures must also reducesediment and nutrient losses via crop landrunoff. Possible management strategies arecutting back on tillage (a big user of fuel and asignificant factor in increased soil loss) andsub-surface banding of fertilizers (which isimportant for improving fertilizer-useefficiency and to reduce nutrient losses viasurface water runoff). Water samples fromedge-of-field runoff studies show that no-tillfarming practices with fertilizers injectedbelow the soil surface can significantly reducesediment and total P losses in runoff (Janssenet al. 2000). However, in East-Central andSoutheast Kansas, no-till can be a challengebecause of frequent spring rains and anabundance of imperfectly drained soils. Theextra residue and the slower soil dryingassociated with no-till can keep no-till fieldscooler and wet longer in the spring and that candelay planting and slow early-season cropdevelopment. Non-irrigated corn in East-Central and Southeast Kansas must be planted
early (middle March - early April) and growquickly in order to produce grain before hotand dry conditions occur in the middle to laterpart of July. Any delay in corn planting andreduced corn growth can have a negativeeffect on corn production. Application ofstarter fertilizers to enhance early-season corngrowth can offset some of the slowed earlycorn development with no-till (Niehues et al.2004), but delays in planting, reduced plantstands, and the inconvenience of having toapply starter fertilizers at planting remains adeterrent to the acceptance of no-till.Presently, there is less than 6 percent of thetotal corn acreage planted no-till in the East-Central and Southeast regions of Kansas(Conservation Technology InformationCenter, 2005 Survey).
Strip-tillage, on the other hand, is acompromise conservation tillage system. It isa system that includes some tillage, but onlywhere the seed rows are to be planted. Row-middles are left untilled. The tilled in the rowstrips provide a raised, loosened seed bed,which improves drainage, warming, anddrying. Strip-tillage also allows fertilizers tobe precision applied under the row which canprovide a starter fertilizer effect without thebother of having to apply fertilizers atplanting-time. Strip-tillage with fertilizersinjected under the row would seem to bedesirable for planting corn early.
The objectives of this study were (1) toevaluate the performance of strip-tillage withno-till for corn using different fertilizer Ntiming and placement methods, and (2) toaccess the effects of fall strip-till with fallapplied N-P-K-S fertilizers verses fall strip-tilland all at planting time banded fertilizers.
This publication from the Kansas State University Agricultural Experiment Station and Cooperative Extension Service has been archived. Current information is available from http://www.ksre.ksu.edu.

EC-3
Procedures
This study was conducted at the East-Central Kansas Experiment Field near Ottawa,KS on an imperfectly drained Woodson siltloam soil from 2003 to 2005 . The field sitehad been managed no-till for five years prior tostarting this study . The tillage and the fertilizertreatments and the dates that the treatmentswere established are shown in Table 2. Theexperiment design was a randomized completeblock with four replications. The croppreceding the 2003 corn study was corn andthe crops preceding the 2004 and 2005 corncrops were soybeans. Burn-down herbicideswere applied each year for pre-plant weedcontrol and consisted of 1qt/a atrazine 4L +0.66pt/a 2,4-D LVE + 1 qt/a COC. Cornplanting was on April 10, 2003, April 15, 2004,and April 13, 2005. The corn hybrid plantedwas Pioneer 35P12 all years. Seed-drop was23,500 seeds per acre. After planting, pre-emergence herbicides were applied whichincluded 0.5 qt/a atrazine 4L and1.33 pt/a DualII Magnum. The effects of the tillage andfertilizer treatments were evaluated by takingplant stand counts, measuring early-seasoncorn growth, and measuring grain yields. Plantcounts were made by counting all of the plantsin the center two rows of each plot. Early-season corn growth was measured byharvesting, drying and weighing the planttissue from six randomly selected corn plantsat the 6-leaf corn growth stage from each plot.Grain yields were measured by machineharvesting and weighing the corn from thecenter two rows of corn from each four-row,10- ft x 40-ft plot. Harvest was on August 28,2003; September 10, 2004; and September 8,2005.
Results
The 2003 corn-growing season was hot anddry. Rainfall during April, May, and June wasnormal, but July and most of August were veryhot and dry. There were 48 days during the
summer of 2003 in which air temperaturesexceeded 90oF. In 2004, rainfall was welldistributed and there was no visual indicationof any moisture stress. Also, there were only13 days in 2004 in which air temperaturesexceeded 90oF. In 2005, a series of 29 to 30oFfreezing temperatures occurred from April 30through May 3. Evidence of freeze damagewas more severe in the no-till plots then instrip-till. However, because the growing pointwas still below the surface of the soilmost ofthe freeze-damaged plants survived. Theremainder of the 2005 corn growing seasonwas normal with temperatures periodicallyexceeding 90oF and moisture decliningthrough late June, July and early August.
Plant Populations and Early Corn Growth
The tillage and fertilization systemsproduced statistically significant differencesin plant stands and early corn growth. Thetillage treatments affected plant populationsmore than the fertilizer applications (Table 2,Figure 1). Plant populations overall tended tobe better and emergence was more uniformfor corn planted using strip-tillage than withno-till. When averaged across all fertilizertreatments for 2003, plant populations were15% greater with strip-till compared to no-till.In 2004, strip-till stands were 7% improvedcompared to no-till, and in 2005 plant-standswere increased 10% with strip-till comparedto no-till. Hendrix et al. (2004) also reportedthat tillage affected corn plant populations,with strip-till and conventional tillage havinghigher plant populations than no-till. The ratesof N fertilizer and the placement and timing ofthe fertilizer applications had basically noeffect on plant stands. (Figure 1).
In addition to strip-tillage having apositive effect on plant stands compared tono-till, strip-tillage also increased early-season plant growth. In 2003, V6 plant-dry-weights, when averaged across all N rates(0,40,80,and 120 lb/a N) were 25% greaterwith strip-till and fall applied fertilizer and
This publication from the Kansas State University Agricultural Experiment Station and Cooperative Extension Service has been archived. Current information is available from http://www.ksre.ksu.edu.
EC-4
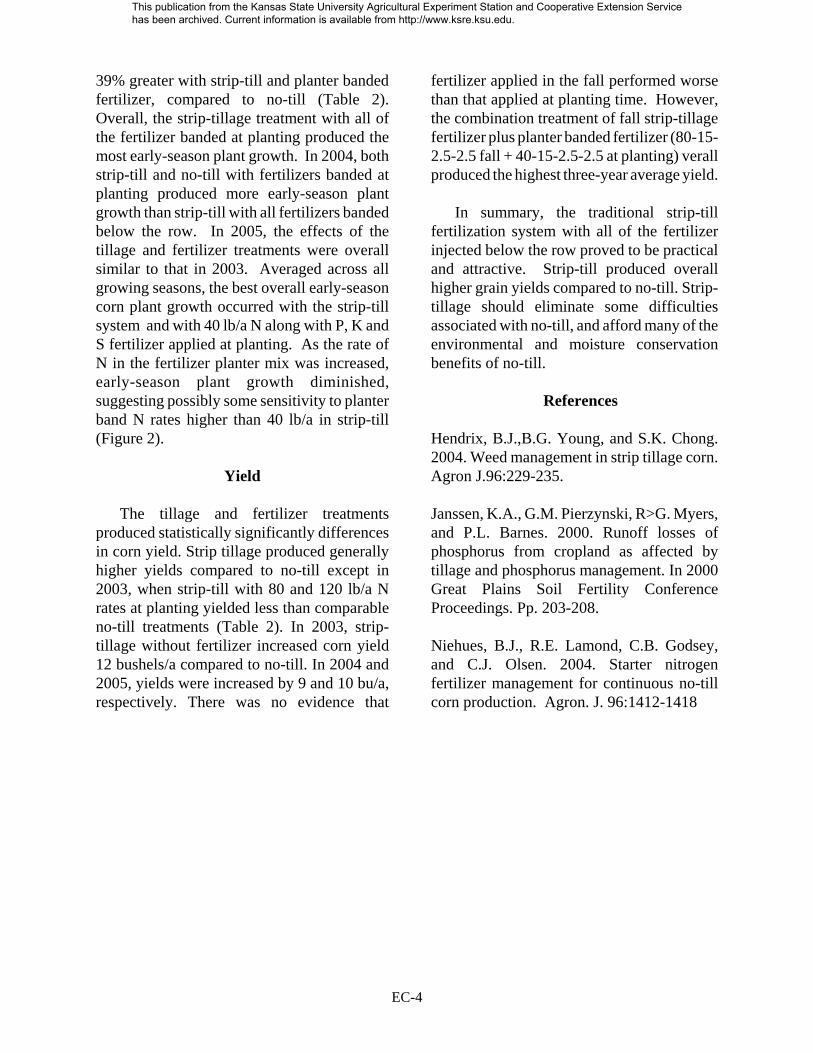
39% greater with strip-till and planter bandedfertilizer, compared to no-till (Table 2).Overall, the strip-tillage treatment with all ofthe fertilizer banded at planting produced themost early-season plant growth. In 2004, bothstrip-till and no-till with fertilizers banded atplanting produced more early-season plantgrowth than strip-till with all fertilizers bandedbelow the row. In 2005, the effects of thetillage and fertilizer treatments were overallsimilar to that in 2003. Averaged across allgrowing seasons, the best overall early-seasoncorn plant growth occurred with the strip-tillsystem and with 40 lb/a N along with P, K andS fertilizer applied at planting. As the rate ofN in the fertilizer planter mix was increased,early-season plant growth diminished,suggesting possibly some sensitivity to planterband N rates higher than 40 lb/a in strip-till(Figure 2).
Yield
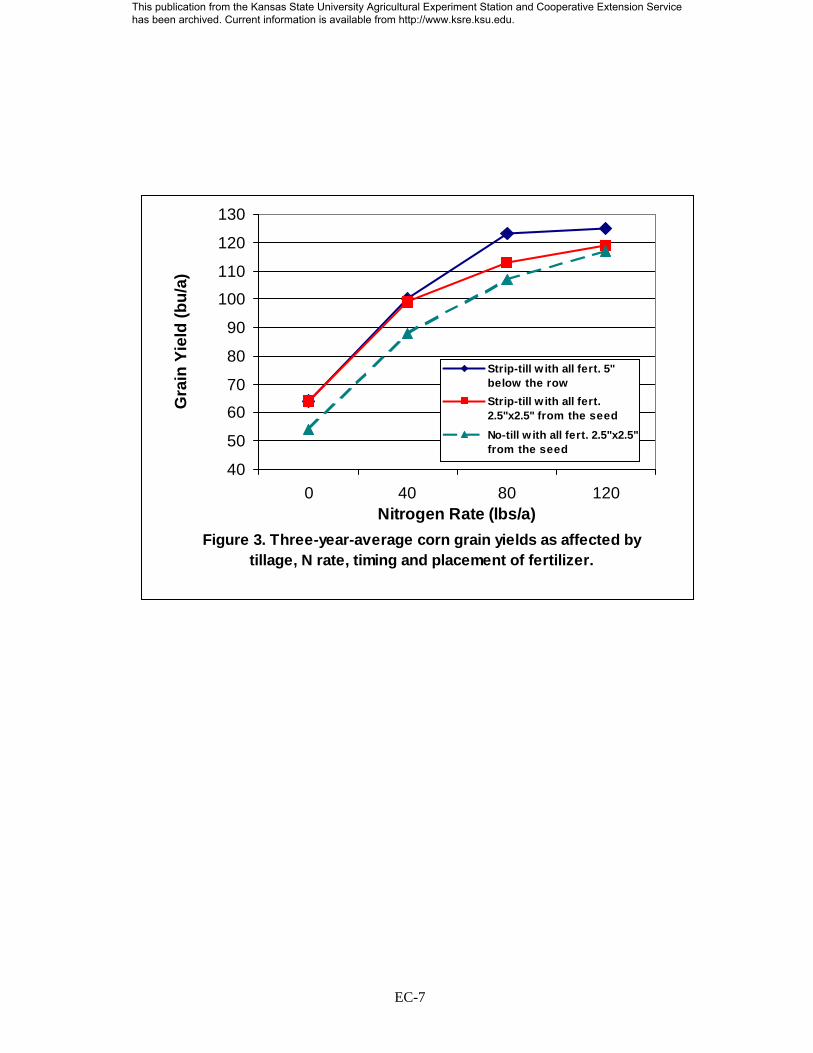
The tillage and fertilizer treatmentsproduced statistically significantly differencesin corn yield. Strip tillage produced generallyhigher yields compared to no-till except in2003, when strip-till with 80 and 120 lb/a Nrates at planting yielded less than comparableno-till treatments (Table 2). In 2003, strip-tillage without fertilizer increased corn yield12 bushels/a compared to no-till. In 2004 and2005, yields were increased by 9 and 10 bu/a,respectively. There was no evidence that
fertilizer applied in the fall performed worsethan that applied at planting time. However,the combination treatment of fall strip-tillagefertilizer plus planter banded fertilizer (80-15-2.5-2.5 fall + 40-15-2.5-2.5 at planting) verallproduced the highest three-year average yield.
In summary, the traditional strip-tillfertilization system with all of the fertilizerinjected below the row proved to be practicaland attractive. Strip-till produced overallhigher grain yields compared to no-till. Strip-tillage should eliminate some difficultiesassociated with no-till, and afford many of theenvironmental and moisture conservationbenefits of no-till.
References
Hendrix, B.J.,B.G. Young, and S.K. Chong.2004. Weed management in strip tillage corn.Agron J.96:229-235.
Janssen, K.A., G.M. Pierzynski, R>G. Myers,and P.L. Barnes. 2000. Runoff losses ofphosphorus from cropland as affected bytillage and phosphorus management. In 2000Great Plains Soil Fertility ConferenceProceedings. Pp. 203-208.
Niehues, B.J., R.E. Lamond, C.B. Godsey,and C.J. Olsen. 2004. Starter nitrogenfertilizer management for continuous no-tillcorn production. Agron. J. 96:1412-1418
This publication from the Kansas State University Agricultural Experiment Station and Cooperative Extension Service has been archived. Current information is available from http://www.ksre.ksu.edu.

EC-5
Table 2. Treatment mean effects for corn plant population, v6 plant dry matter, and grain yields. 2003 2004 2005 2003 2004 2005 2003 2004 2005
Treatments Plant Population V6 Dry Matter Grain YieldTillage x (N-P-K-S, lb/a x 1000 Grams/plant Bu/a
Strip-Till + Strip-till Banded
Fertilizer (5" below the row)
Check 0-0-0-0 21.1 22.1 22.8 2.6 10.0 9.2 78 53 62 40-30-5-5 21.1 22.2 20.3 6.6 12.2 18.1 86 123 91 80-30-5-5 21.2 21.9 22.0 7.1 13.9 15.6 96 160 112 120-30-5-5 21.8 21.7 22.5 7.2 12.7 15.1 91 161 122 80-15-2.5-2.5 fall + 40-15-2.5-2.5 at planting
21.1 21.9 22.2 7.8 17.8 15.2 89 167 133
Strip-Till + Planter Banded
Fertilizer (2.5x2.5 from seed row)
40-30-5-5 21.0 22.4 21.3 9.1 17.6 18.0 90 116 91 80-30-5-5 21.3 22.1 20.6 7.6 18.1 16.2 88 144 108 120-30-5-5 22.2 22.1 20.9 6.7 16.7 12.4 78 160 118
No-Tillage + Planter Banded
Fertilizer (2.5x2.5 from seed row)
Check 0-0-0-0 18.4 20.2 19.3 2.4 8.5 8.5 66 44 52 40-30-5-5 18.8 21.1 18.4 6.2 16.9 15.7 80 101 82 80-30-5-5 18.8 20.3 18.9 5.4 15.8 14.6 90 133 99 120-30-5-5 18.1 21.1 18.9 4.8 16.5 12.8 86 149 117
No-Tillage + Preplant Deep-
banded Fertilizer (15" centers x 4"
de[th)
120-30-5-5 18.9 20.1 22.4 4.8 15.0 16.1 87 163 109LSD 0.05 2.4 1.9 2.4 3.0 1.7 2.3 9 17 10
2003
Fall strip-till and fall banded fertilizer: 11/2/02. Pre-plant deep banded fertilizer, no-till: 3/26/03. Planter-banded fertilizer:4/10/03.
2004
Fall strip-till and fall banded fertilizer: 12/2/03. Pre-plant deep-banded fertilizer, no-till: 4/14/04. Planter-banded fertilizer:4/15/04.
2005
Fall (Spring) strip-till and spring banded fertilizer: 4/01/05. Pre-plant deep-banded fertilizer, no-till: 4/01/05. Planter-bandedfertilizer: 4/13/05.
This publication from the Kansas State University Agricultural Experiment Station and Cooperative Extension Service has been archived. Current information is available from http://www.ksre.ksu.edu.

EC-6
Figure 1. Three-year-average corn plant populations as affected by tillage, N rate, timing and placement of fertilizer.
15
16
17
18
19
20
21
22
23
0 40 80 120Nitrogen Rate (lbs/a)
Plan
t Pop
ulat
ion
(x 1
000)
Strip-till w ith all fert. 5"below the rowStrip-till w ith all fert.2.5"x2.5" from the seedNo-till w ith all fert. 2.5"x2.5"from the seed
Figure 2. Three-year-average early-season corn growth as affected by tillage, N rate, timing and placement of fertilizer.
5
7
9
11
13
15
0 40 80 120Nitrogen Rate (lbs/a)
V6 D
ry M
atte
r (gr
ams/
plan
t)
Strip-till with all fert. 5"below the rowStrip-till with all fert.2.5"x2.5" from the seedNo-till with all fert. 2.5"x2.5"from the seed
This publication from the Kansas State University Agricultural Experiment Station and Cooperative Extension Service has been archived. Current information is available from http://www.ksre.ksu.edu.
EC-7
Figure 3. Three-year-average corn grain yields as affected by tillage, N rate, timing and placement of fertilizer.
40
50
60
70
80
90
100
110
120
130
0 40 80 120Nitrogen Rate (lbs/a)
Gra
in Y
ield
(bu/
a)
Strip-till w ith all fert. 5"below the rowStrip-till w ith all fert.2.5"x2.5" from the seedNo-till w ith all fert. 2.5"x2.5"from the seed
This publication from the Kansas State University Agricultural Experiment Station and Cooperative Extension Service has been archived. Current information is available from http://www.ksre.ksu.edu.

EC-8
PERFORMANCE TRIALS WITHDOUBLE-CROP SOYBEANS PLANTED NO-TILL FOLLOWING WHEAT
Keith A. Janssen and Gary L. Kilgore
Introduction
Planting soybeans no-till after wheat inorder to save precious time and moisture, aswell as using Roundup Ready soybeantechnology for weed control, has reducedsome of the difficulties previously associatedwith planting double-crop soybeans.Generally, the key to a successful double-cropsoybean planting is to plant as quickly aspossible after wheat harvest and to plantsoybean varieties that will utilize the fulldouble-crop soybean growing season. Thisstudy evaluates group III, IV and early groupV Roundup Ready soybean varieties plantedno-till after wheat.
ProcedureFive double-cropped soybean varieties
were evaluated in 2003, six in 2004 and fourin 2005. Seeding was with a no-till planter atapproximately 165,000 seeds per acre in 30
inch rows. No fertilizer was applied, but Pand K soil test levels were good and the priorwheat crops all received P and K fertilizers.Roundup Weather Max at 22 oz/a was sprayedfor weed control one or two times dependingon the amount of weed and volunteer wheatpressure. Planting and harvest dates, soybeanplant and pod heights, and dates whenvarieties were mature (pods dry) are shown inthe accompanying data tables.
Results
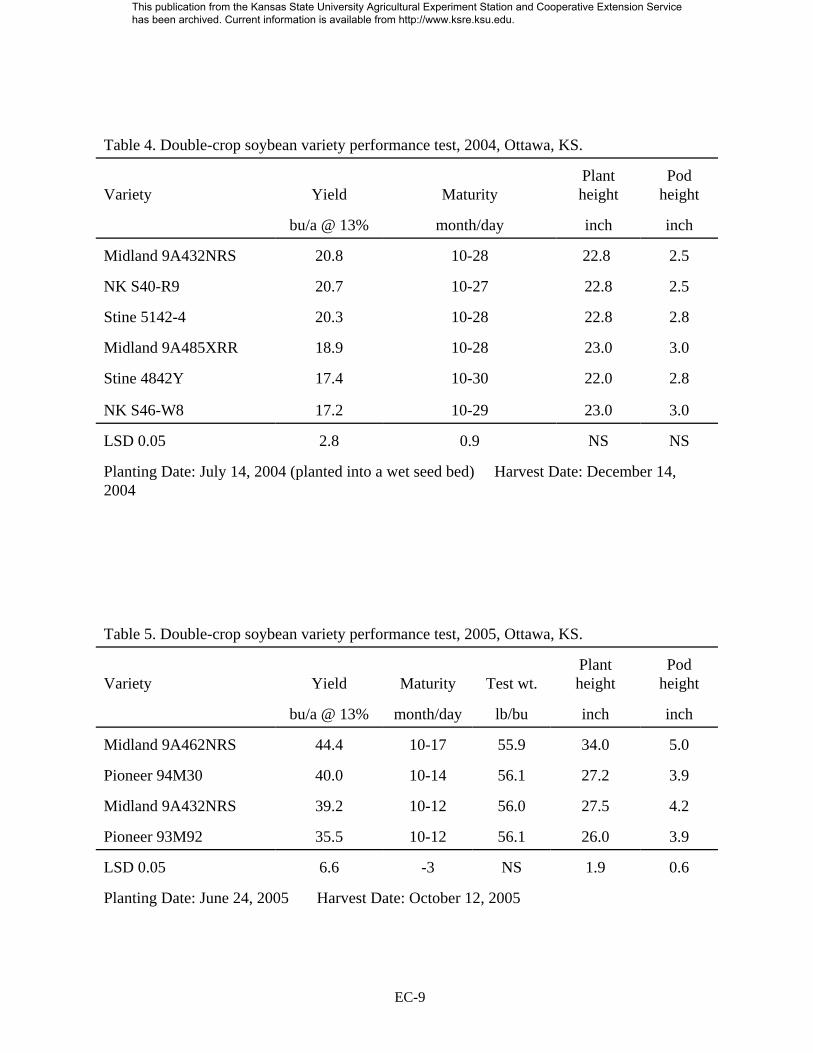
Yields for individual varieties forindividual years ranged from 17.2 to 44.4 bu/aduring the three-year period. Moisture wasthe predominant yield- limiting factor in 2003,delayed planting (wet soil) was a problem in2004, but 2005 had near ideal planting andgrowing conditions. The varieties thatperformed best, overall, tended to be thelonger-season varieties.
Table 3. No-till double-crop soybean variety performance test, 2003, Ottawa, KS.
Variety Yield MaturityPlantheight
Podheight
bu/a @ 13% month/day inch inch
Syngenta S40-R9 23.1 10-23 20.5 4.2
Pioneer 94B13 21.4 10-24 19.5 3.2
Pioneer 93B80 20.3 10-20 19.0 3.2
Pioneer 93B85 18.1 10-20 17.2 2.7
Stine S4442-4 17.6 10-25 17.2 2.6
LSD 0.05 1.8 1 2.1 0.7
Planting date: July 7, 2003 Harvest date: October 30, 2003
This publication from the Kansas State University Agricultural Experiment Station and Cooperative Extension Service has been archived. Current information is available from http://www.ksre.ksu.edu.
EC-9
Table 4. Double-crop soybean variety performance test, 2004, Ottawa, KS.
Variety Yield MaturityPlantheight
Podheight
bu/a @ 13% month/day inch inch
Midland 9A432NRS 20.8 10-28 22.8 2.5
NK S40-R9 20.7 10-27 22.8 2.5
Stine 5142-4 20.3 10-28 22.8 2.8
Midland 9A485XRR 18.9 10-28 23.0 3.0
Stine 4842Y 17.4 10-30 22.0 2.8
NK S46-W8 17.2 10-29 23.0 3.0
LSD 0.05 2.8 0.9 NS NS
Planting Date: July 14, 2004 (planted into a wet seed bed) Harvest Date: December 14,2004
Table 5. Double-crop soybean variety performance test, 2005, Ottawa, KS.
Variety Yield Maturity Test wt.Plantheight
Podheight
bu/a @ 13% month/day lb/bu inch inch
Midland 9A462NRS 44.4 10-17 55.9 34.0 5.0
Pioneer 94M30 40.0 10-14 56.1 27.2 3.9
Midland 9A432NRS 39.2 10-12 56.0 27.5 4.2
Pioneer 93M92 35.5 10-12 56.1 26.0 3.9
LSD 0.05 6.6 -3 NS 1.9 0.6
Planting Date: June 24, 2005 Harvest Date: October 12, 2005
This publication from the Kansas State University Agricultural Experiment Station and Cooperative Extension Service has been archived. Current information is available from http://www.ksre.ksu.edu.

EC-10
EVALUATION OF LUMAX AND CAMIX ON GRAIN SORGHUM
Larry Maddux
Summary
This study was conducted at the CornbeltField in 2002 and at the East-Central Field in2003 and 2004. It evaluated the tolerance ofConcep III treated grain sorghum to the userate and two times the use rate of Lumax,Camix, and Bicep II Magnum. No injury wasobserved with the application of the 20 EPPand 10 EPP treatments, but in two of the threeyears, slight injury (5 - 17%) was observedwith the double rate of Camix and Lumax.However, no yield differences were observed.In other studies in Kansas, greater yields wereobserved with the PRE treatments and a slightyield reduction was observed. These studiescombined with other studies in Kansas wereinstrumental in obtaining a Section 18 usepermit for Lumax applied 7 - 14 days preplant.Users should obtain a label before usingLumax on grain sorghum. It is recommendedto approach the use of Lumax on sorghumwith caution. Most of the studies conductedduring 2003-2005 were largely under optimumconditions. As with any new herbicide, weshould expect some surprises, and the 2006preliminary data show greater injury at theEast Central Experiment Field than wasobtained in these studies.
Introduction
Chemical weed control and cultivationhave been used to control weeds in row cropsto reduce weed competition which can reduceyields. The development of weeds resistant tosome of the herbicides used on grain sorghumand the lack of new herbicide optionsprompted this study. Lumax is a premix ofDual II Magnum, Callisto, and atrazine.Camix is a premix of Dual II Magnum andCallisto. The inclusion of Callisto introducesnew chemistry (mesotrione) with a new mode
of action that, if crop tolerance is acceptable,would increase the spectrum of weed controlin grain sorghum. There were several siteslocated across the state of Kansas.
Procedures
This study was started in 2003 at theCornbelt Experiment Field near Powhattan.With the closure of that field in Dec. 2003, thestudy was conducted at the East-Central Fieldin 2004 and 2005. Treatments consisted ofthree application timings: 20 days beforeplanting (20 EPP), 10 days before planting (10EPP), and preemergence (PRE). Threeherbicides were compared: Lumax, 2.5 and5.0 qt/a; Camix, 2.0 and 4.0 qt/a; and Bicep IIMagnum, 2.1 and 4.2 qt/a. The rates usedwere the normal use rate and two times thenormal use rate. Applications were made asfollows: 20 EPP (5/13/03, 4/22/04, 4/15/05);10 EPP (5/22/03, 5/4/04, 4/27/05); PRE(5/29/03, 5/24/04, 5/11/05). The PREapplication in 2004 was delayed by wetweather. Garst 5382 Concep treated grainsorghum was planted at 70,000 sds/a on May29, 2003, on a Grundy silty clay loam soil witha pH of 6.5 and an organic matter content of3.1 percent. Pioneer 84G62 Concep treatedseed was planted at 64,400 sds/a on May 24,2004 and May 11, 2005, on a Woodson siltloam soil with a pH of 6.9 and an organicmatter content of 2.6 percent. The growingseason was drier than normal at the CornbeltField in 2003, but the East Central ExperimentField site had good moisture both years. Theplots were harvested October 23, 2003,October 25, 2004, and September 24, 2005with a modified John Deere 3300 plotcombine.
This publication from the Kansas State University Agricultural Experiment Station and Cooperative Extension Service has been archived. Current information is available from http://www.ksre.ksu.edu.

EC-11
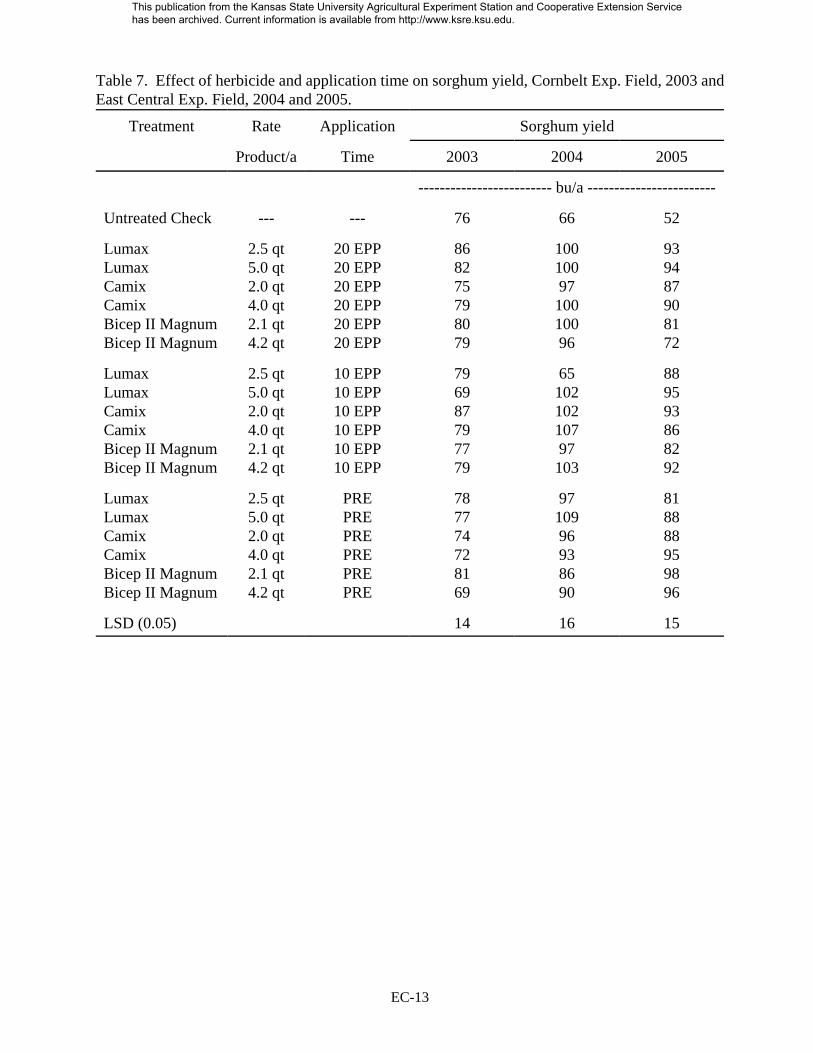
Results
No injury was observed at the CornbeltField in 2003 with the 20 EPP and 10 EPPapplication timings at either the normal userate or the double rate (Table 6). However, with the PRE application, the double rate ofLumax resulted in a 17% injury rating and thedouble rate of Camix resulted in a 10% injuryrating. In 2004, at the East Central Exp. Field,no injury was observed with any herbicide orapplication timing. Injury similar to thatobserved at the Cornbelt Field in 2003 wasobserved at the East Central Field in 2005.However, the severity of injury was a littleless, with only 5% injury being observed withthe double rate of both Lumax and Camix.However, no difference in yield was observedwith any of the treatments (Table 7). Atothersites in Kansas, greater injury was observed,mainly with the PRE treatrments, and someslight yield decreases were observed.
Weed pressures were light on these sites.The main emphasis of this study was to eval-
uate the tolerance of Concept-treated grainsorghum to Lumax and Camix. However,from visual observations, Lumax gave a littlebetter weed control than did Bicep II Magnum.
These studies, as well as the many otherstudies conducted in Kansas by K-Statepersonnel, were instrumental in the approvalof a section 18 emergency exemption allowingLumax herbicide use on grain sorghum inKansas for 2006. When applied according tothe label and after proper activation, thisherbicide controls annual grass (not includingshattercane) and broadleaf weeds in grainsorghum, including triazine resistant,glyphosate-resistant, and ALS resistant Palmeramaranth and waterhemp. It is an indemnifiedlabel, meaning that end users must accept allresponsibility for failure to perform and forcrop damage from Lumax use on sorghum.Applicators must be in possession of the labelat the time of application. The label can beaccessed online at www.farmassist.com onlyafter indicating acceptance of liability.
This publication from the Kansas State University Agricultural Experiment Station and Cooperative Extension Service has been archived. Current information is available from http://www.ksre.ksu.edu.

EC-12
Table 6. Effect of herbicide and application time on sorghum injury, Cornbelt Experiment Field,2003 and East Central Experiment Field, 2004 and 2005.
Treatment Rate Application Sorghum Injury
Product/a Time 2003 2004 2005
------------------------Percent-----------------------
Untreated Check --- --- 0 0 0
LumaxLumaxCamixCamixBicep II MagnumBicep II Magnum
2.5 qt5.0 qt2.0 qt4.0 qt2.1 qt4.2 qt
20 EPP20 EPP20 EPP20 EPP20 EPP20 EPP
0 0 0 2 0 0
000000
000000
LumaxLumaxCamixCamixBicep II MagnumBicep II Magnum
2.5 qt5.0 qt2.0 qt4.0 qt2.1 qt4.2 qt
10 EPP10 EPP10 EPP10 EPP10 EPP10 EPP
0 3 0 0 0 0
000000
000300
LumaxLumaxCamixCamixBicep II MagnumBicep II Magnum
2.5 qt5.0 qt2.0 qt4.0 qt2.1 qt4.2 qt
PREPREPREPREPREPRE
017 210 0 0
000000
050500
LSD (0.05) 8 --- 1
This publication from the Kansas State University Agricultural Experiment Station and Cooperative Extension Service has been archived. Current information is available from http://www.ksre.ksu.edu.
EC-13
Table 7. Effect of herbicide and application time on sorghum yield, Cornbelt Exp. Field, 2003 andEast Central Exp. Field, 2004 and 2005.
Treatment Rate Application Sorghum yield
Product/a Time 2003 2004 2005
------------------------- bu/a ------------------------
Untreated Check --- --- 76 66 52
LumaxLumaxCamixCamixBicep II MagnumBicep II Magnum
2.5 qt5.0 qt2.0 qt4.0 qt2.1 qt4.2 qt
20 EPP20 EPP20 EPP20 EPP20 EPP20 EPP
868275798079
1001009710010096
939487908172
LumaxLumaxCamixCamixBicep II MagnumBicep II Magnum
2.5 qt5.0 qt2.0 qt4.0 qt2.1 qt4.2 qt
10 EPP10 EPP10 EPP10 EPP10 EPP10 EPP
796987797779
6510210210797103
889593868292
LumaxLumaxCamixCamixBicep II MagnumBicep II Magnum
2.5 qt5.0 qt2.0 qt4.0 qt2.1 qt4.2 qt
PREPREPREPREPREPRE
787774728169
9710996938690
818888959896
LSD (0.05) 14 16 15
This publication from the Kansas State University Agricultural Experiment Station and Cooperative Extension Service has been archived. Current information is available from http://www.ksre.ksu.edu.
i
TABLE OF CONTENTS
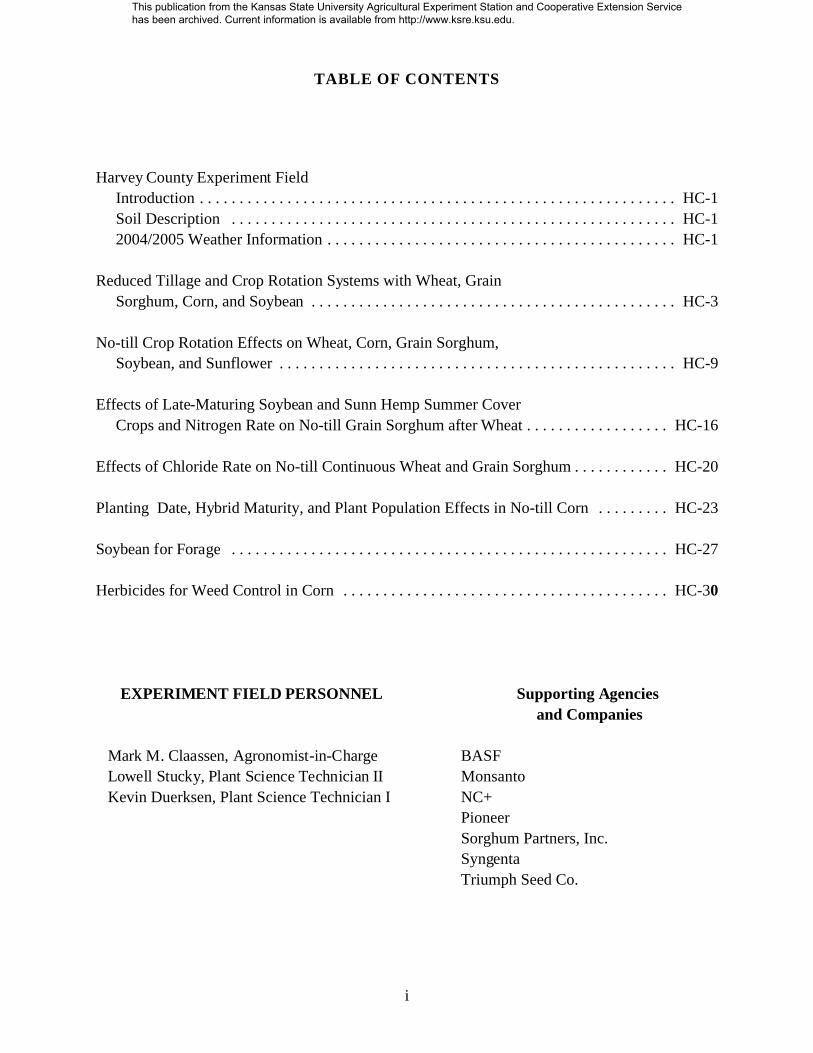
Harvey County Experiment Field
Introduction . . . . . . . . . . . . . . . . . . . . . . . . . . . . . . . . . . . . . . . . . . . . . . . . . . . . . . . . . . . . HC-1
Soil Description . . . . . . . . . . . . . . . . . . . . . . . . . . . . . . . . . . . . . . . . . . . . . . . . . . . . . . . . HC-1
2004/2005 Weather Information . . . . . . . . . . . . . . . . . . . . . . . . . . . . . . . . . . . . . . . . . . . . HC-1
Reduced Tillage and Crop Rotation Systems with Wheat, Grain
Sorghum, Corn, and Soybean . . . . . . . . . . . . . . . . . . . . . . . . . . . . . . . . . . . . . . . . . . . . . . HC-3
No-till Crop Rotation Effects on Wheat, Corn, Grain Sorghum,
Soybean, and Sunflower . . . . . . . . . . . . . . . . . . . . . . . . . . . . . . . . . . . . . . . . . . . . . . . . . . HC-9
Effects of Late-Maturing Soybean and Sunn Hemp Summer Cover
Crops and Nitrogen Rate on No-till Grain Sorghum after Wheat . . . . . . . . . . . . . . . . . . HC-16
Effects of Chloride Rate on No-till Continuous Wheat and Grain Sorghum . . . . . . . . . . . . HC-20
Planting Date, Hybrid Maturity, and Plant Population Effects in No-till Corn . . . . . . . . . HC-23
Soybean for Forage . . . . . . . . . . . . . . . . . . . . . . . . . . . . . . . . . . . . . . . . . . . . . . . . . . . . . . . HC-27
Herbicides for Weed Control in Corn . . . . . . . . . . . . . . . . . . . . . . . . . . . . . . . . . . . . . . . . . HC-30
EXPERIMENT FIELD PERSONNEL
Mark M. Claassen, Agronomist-in-Charge
Lowell Stucky, Plant Science Technician II
Kevin Duerksen, Plant Science Technician I
Supporting Agencies
and Companies
BASF
Monsanto
NC+
Pioneer
Sorghum Partners, Inc.
Syngenta
Triumph Seed Co.
This publication from the Kansas State University Agricultural Experiment Station and Cooperative Extension Service has been archived. Current information is available from http://www.ksre.ksu.edu.

HC-1
HARVEY COUNTY EXPERIMENT FIELD
Introduction
Research at Harvey County Experiment
Field deals with many aspects of dryland crop
production on soils of the Central Loess Plains
and Central Outwash Plains of central and
south-central Kansas, and is designed to
directly benefit the agricultural industry of the
area. The focus is primarily on wheat, grain
sorghum, and soybean, but research is also
conducted on alternative crops such as corn
and sunflower. Investigations include variety
and hybrid performance tests, chemical weed
control, reduced tillage/no-tillage systems,
crop rotations, cover crops, fertilizer use, and
planting practices, as well as disease and
insect resistance and control.
Soil Description
The Harvey County Experiment Field
consists of two tracts. The headquarters tract
(North Unit), 75 acres immediately west of
Hesston on Hickory St., is all Ladysmith silty
clay loam with 0-1% slope. The second tract
(South Unit), located 4 miles south and 2
miles west of Hesston, is composed of 142
acres of Ladysmith, Smolan, Detroit, and
Irwin silty clay loams, as well as Geary and
Smolan silt loams. All have 0-3% slope. Soils
on the two tracts are representative of much of
Harvey, Marion, McPherson, Dickinson, and
Rice Counties, as well as adjacent areas.
These are deep, moderately well to
well-drained, upland soils with high fertility
and good water-holding capacity. Water run-
off is slow to moderate. Permeability of the
Ladysmith, Smolan, Detroit, and Irwin series
is slow to very slow, whereas permeability of
the Geary series is moderate.
2004-2005 Weather Information
Consecutive rainy days before mid-
October delayed wheat planting. Within a
week thereafter, rainfall totaled 1.87 inches.
November had above-normal rainfall, but
December turned quite dry. Average October
and November temperatures were near
normal, but December temperatures were well
above average. Wheat emerged in 7 to10 days
after planting. Fall wheat development was
good, but somewhat less than usual tillering
was observed.
Beginning with heavy rainfall in early
January, winter precipitation was substantially
above normal. Coldest temperatures of the
winter occurred in early and mid-January, as
well as very briefly in early February. Mean
temperatures were slightly below normal in
January and March, but February temperatures
averaged 3 oF above normal. Wheat survival
was good.
Rainfall was well below normal in April,
but somewhat above normal in May. The first
seventeen days of June were characterized by
wet weather. Mean temperatures were about 1oF cooler than normal in April, normal in
May, and slightly above normal in June.
Preharvest rains resulted in light wheat test
weights.
Soil-borne mosaic and spindle streak
mosaic symptoms appeared in some varieties
at the beginning of March. The presence of
both diseases was confirmed by laboratory
analysis. Mosaic symptoms in susceptible
varieties persisted, causing reduction in plant
height, delayed heading, and yield reduction.
Light to moderate powdery mildew on some
varieties was observed, along with light tan
spot, in early May. Stripe rust also was noted
This publication from the Kansas State University Agricultural Experiment Station and Cooperative Extension Service has been archived. Current information is available from http://www.ksre.ksu.edu.

HC-2
on some varieties at that time. Leaf rust
became the dominant disease after mid-May.
Weather and soil conditions permitted
timely corn planting, with light rains
following. Freezing temperatures on April 24
and 30, as well as on May 2, caused loss of
corn leaves, but generally did not result in
mortality of seedlings. Wheat damage from
freezing temperatures occurred in the region,
but there was no significant injury on station.
Persistent rains in early June seriously
impacted field work and delayed planting of
row crops that had not been planted earlier in
May. At the North Unit, a brief hail storm on
June 30 shredded leaves of corn and other row
crops. In July and August, average
temperatures were 2.1 to 2.7 oF below normal.
During these months, there were only 2 days
with temperatures at or above 100 oF. July
rainfall was somewhat below normal,
resulting in periods of limited drought stress.
August brought abundant rains, mainly in the
second half of the month as corn approached
maturity. Early September was dry and set the
stage for ideal row crop harvesting conditions.
Both grain sorghum and soybean matured
before the first fall freeze. Neck rot occurred
in some grain sorghum plots, but lodging was
generally negligible.
Freezing temperatures occurred last in the
spring on May 2. First fall frost occurred on
October 23. The frost-free season of 174 days
was about 6 days longer than normal.
Table 1. Monthly precipitation totals, inches - Harvey Co. Experiment Field, Hesston, Kansas.1
Month N Unit S Unit Normal Month N Unit S Unit Normal
2004 2005
October 3.49 2.98 2.95 March 3.07 3.08 2.71
November 2.36 1.89 1.68 April 1.29 1.49 2.84
December 0.21 0.21 1.01 May 5.42 6.00 4.83
June 10.07 9.86 4.72
2005 July 3.28 3.49 3.59
January 2.68 3.06 0.79 August 5.29 7.01 3.88
February 1.76 1.75 1.08 September 1.69 1.19 2.99
Twelve-month total
Departure from 30-year Normal at N. Unit
40.61
7.54
42.01
8.94
33.07
1 Three experiments reported here were conducted at the South Unit: Effects of Late-maturing
Soybean and Sunn Hemp Summer Cover Crops and Nitrogen Rate on No-till Grain Sorghum after
Wheat; Soybean for Forage; and Herbicides for Weed Control in Corn. Three experiments in this
report were conducted at the North Unit: Reduced Tillage and Crop Rotation Systems with Wheat,
Grain Sorghum, Corn, and Soybean; No-till Crop Rotation Effects on Wheat, Corn, Grain Sorghum,
Soybean, and Sunflower; and Planting Date, Hybrid Maturity, and Plant Population Effects in No-
till Corn. One experiment, Effects of Chloride Rate on No-till Continuous Wheat and Grain
Sorghum, was divided between units, with the wheat portion conducted at the North Unit and the
grain sorghum trial at the South Unit.
This publication from the Kansas State University Agricultural Experiment Station and Cooperative Extension Service has been archived. Current information is available from http://www.ksre.ksu.edu.
HC-3
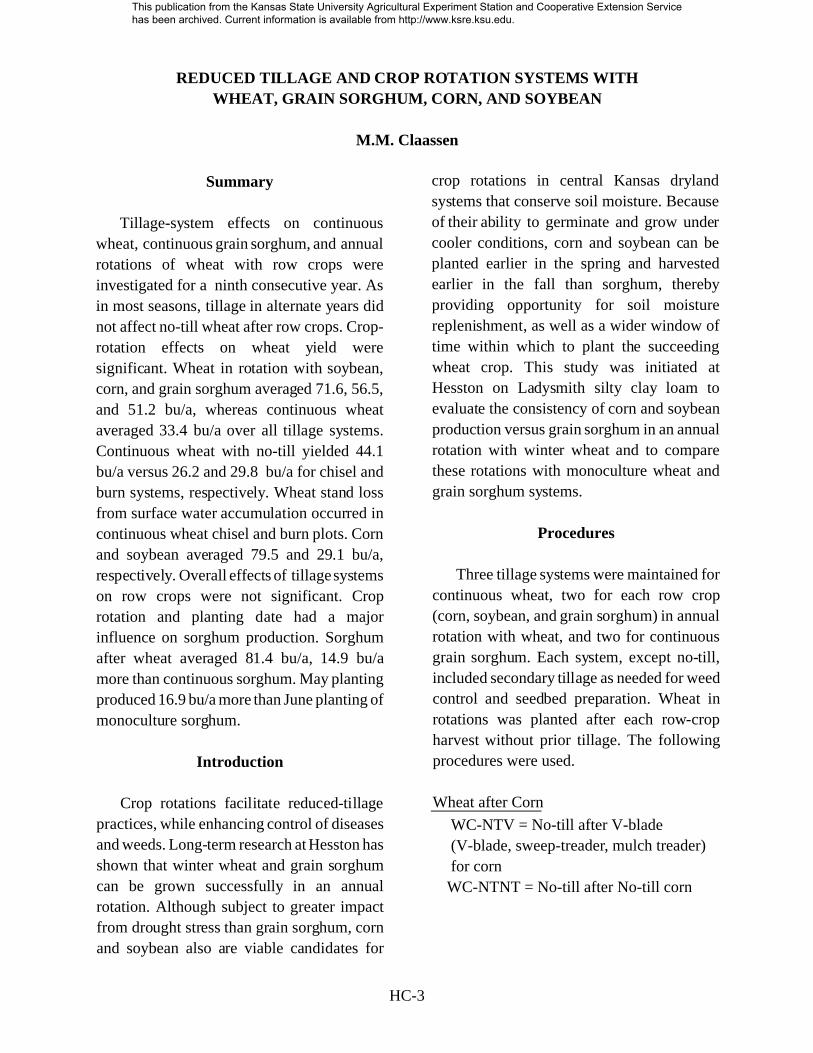
REDUCED TILLAGE AND CROP ROTATION SYSTEMS WITH
WHEAT, GRAIN SORGHUM, CORN, AND SOYBEAN
M.M. Claassen
Summary
Tillage-system effects on continuous
wheat, continuous grain sorghum, and annual
rotations of wheat with row crops were
investigated for a ninth consecutive year. As
in most seasons, tillage in alternate years did
not affect no-till wheat after row crops. Crop-
rotation effects on wheat yield were
significant. Wheat in rotation with soybean,
corn, and grain sorghum averaged 71.6, 56.5,
and 51.2 bu/a, whereas continuous wheat
averaged 33.4 bu/a over all tillage systems.
Continuous wheat with no-till yielded 44.1
bu/a versus 26.2 and 29.8 bu/a for chisel and
burn systems, respectively. Wheat stand loss
from surface water accumulation occurred in
continuous wheat chisel and burn plots. Corn
and soybean averaged 79.5 and 29.1 bu/a,
respectively. Overall effects of tillage systems
on row crops were not significant. Crop
rotation and planting date had a major
influence on sorghum production. Sorghum
after wheat averaged 81.4 bu/a, 14.9 bu/a
more than continuous sorghum. May planting
produced 16.9 bu/a more than June planting of
monoculture sorghum.
Introduction
Crop rotations facilitate reduced-tillage
practices, while enhancing control of diseases
and weeds. Long-term research at Hesston has
shown that winter wheat and grain sorghum
can be grown successfully in an annual
rotation. Although subject to greater impact
from drought stress than grain sorghum, corn
and soybean also are viable candidates for
crop rotations in central Kansas dryland
systems that conserve soil moisture. Because
of their ability to germinate and grow under
cooler conditions, corn and soybean can be
planted earlier in the spring and harvested
earlier in the fall than sorghum, thereby
providing opportunity for soil moisture
replenishment, as well as a wider window of
time within which to plant the succeeding
wheat crop. This study was initiated at
Hesston on Ladysmith silty clay loam to
evaluate the consistency of corn and soybean
production versus grain sorghum in an annual
rotation with winter wheat and to compare
these rotations with monoculture wheat and
grain sorghum systems.
Procedures
Three tillage systems were maintained for
continuous wheat, two for each row crop
(corn, soybean, and grain sorghum) in annual
rotation with wheat, and two for continuous
grain sorghum. Each system, except no-till,
included secondary tillage as needed for weed
control and seedbed preparation. Wheat in
rotations was planted after each row-crop
harvest without prior tillage. The following
procedures were used.
Wheat after Corn
WC-NTV = No-till after V-blade
(V-blade, sweep-treader, mulch treader)
for corn
WC-NTNT = No-till after No-till corn
This publication from the Kansas State University Agricultural Experiment Station and Cooperative Extension Service has been archived. Current information is available from http://www.ksre.ksu.edu.

HC-4
Wheat after Sorghum
WG-NTV = No-till after V-blade
(V-blade, sweep-treader, mulch treader)
for sorghum
WG-NTNT = No-till after No-till sorghum
Wheat after Soybean
WS-NTV = No-till after V-blade
(V-blade, sweep-treader, mulch treader)
for soybean
WS-NTNT = No-till after No-till soybean
Continuous Wheat
WW-B = Burn (burn, disk, field cultivate)
WW-C = Chisel (chisel, disk, field
cultivate)
WW-NT = No-till
Corn after Wheat
CW-V = V-blade (V-blade, sweep-
treader, mulch treader)
CW-NT = No-till
Sorghum after Wheat
GW-V = V-blade (V-blade, sweep-
treader, mulch treader)
GW-NT = No-till
Soybean after Wheat
SW-V = V-blade (V-blade, sweep-
treader, mulch treader)
SW-NT = No-till
Continuous Sorghum
GG-C = Chisel (chisel, sweep-treader,
mulch treader)
GG-NT = No-till
Continuous wheat, no-till plots were
sprayed with Roundup1 Original Max + 2,4-
DA + Clarity2 + ammonium sulfate (AMSU)
(33 oz + 3 oz + 1.7 lb/a) on July 20.
Additional fallow application of Roundup
Original Max + 2,4-DA + AMSU (16 oz + 16
oz + 0.5 lb/a) was made on August 31. This
treatment without 2,4-D was repeated for
WW-NT on October 22.
For WC-NT, late-season weeds and
volunteer growth in corn stubble were sprayed
in early October with Roundup Original Max
+ 2,4-DLVE 6 EC + AMSU (22 oz + 4 oz + 0.5
lb/a).
Variety Overley was planted on October
22 in 8-inch rows at 90 lb/a with a
CrustBuster no-till drill equipped with double
disk openers. Wheat was fertilized with 121 lb
N/a and 35 lb P2O5/a as preplant, broadcast
ammonium nitrate and in-furrow
diammonium phosphate at planting. Because
of stand loss from excess moisture in WW-B
and WW-C, these plots were overseeded with
Overley at 120 lb/a on December 31. No
herbicides were used on wheat in any of the
tillage and cropping systems. Wheat was
harvested on June 27, 2005.
No-till corn after wheat plots received the
same fallow herbicide treatments as WW-NT
during the summer. Roundup Ultra Max II +
Clarity + AMSU (22 oz + 2.5 oz + 1 lb/a) was
applied on March 14. Early preplant
application of Dual3 II Magnum + atrazine
90DF + crop oil concentrate (COC) at 1.6 pt +
1.11 lb + 1 qt/a was made 4 weeks before
planting. Weeds and volunteer wheat were
controlled during the summer through the
early winter period in CW-V plots with three
tillage operations. A light Roundup Ultra
1Roundup is a registered trademark of Monsanto.
2Clarity is a registered trademark of BASF.3Dual, AAtrex, Concep, and Cruiser are registeredtrademarks of Syngenta.
This publication from the Kansas State University Agricultural Experiment Station and Cooperative Extension Service has been archived. Current information is available from http://www.ksre.ksu.edu.
HC-5
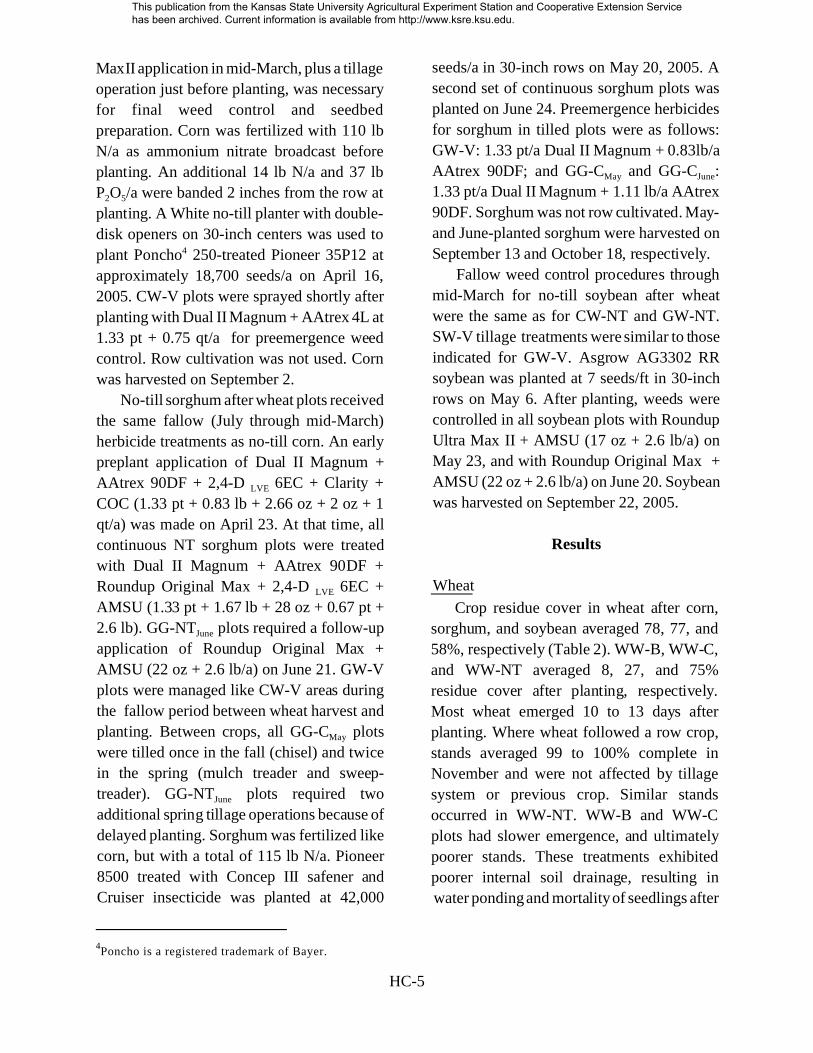
MaxII application in mid-March, plus a tillage
operation just before planting, was necessary
for final weed control and seedbed
preparation. Corn was fertilized with 110 lb
N/a as ammonium nitrate broadcast before
planting. An additional 14 lb N/a and 37 lb
P2O5/a were banded 2 inches from the row at
planting. A White no-till planter with double-
disk openers on 30-inch centers was used to
plant Poncho4 250-treated Pioneer 35P12 at
approximately 18,700 seeds/a on April 16,
2005. CW-V plots were sprayed shortly after
planting with Dual II Magnum + AAtrex 4L at
1.33 pt + 0.75 qt/a for preemergence weed
control. Row cultivation was not used. Corn
was harvested on September 2.
No-till sorghum after wheat plots received
the same fallow (July through mid-March)
herbicide treatments as no-till corn. An early
preplant application of Dual II Magnum +
AAtrex 90DF + 2,4-D LVE 6EC + Clarity +
COC (1.33 pt + 0.83 lb + 2.66 oz + 2 oz + 1
qt/a) was made on April 23. At that time, all
continuous NT sorghum plots were treated
with Dual II Magnum + AAtrex 90DF +
Roundup Original Max + 2,4-D LVE 6EC +
AMSU (1.33 pt + 1.67 lb + 28 oz + 0.67 pt +
2.6 lb). GG-NTJune plots required a follow-up
application of Roundup Original Max +
AMSU (22 oz + 2.6 lb/a) on June 21. GW-V
plots were managed like CW-V areas during
the fallow period between wheat harvest and
planting. Between crops, all GG-CMay plots
were tilled once in the fall (chisel) and twice
in the spring (mulch treader and sweep-
treader). GG-NTJune plots required two
additional spring tillage operations because of
delayed planting. Sorghum was fertilized like
corn, but with a total of 115 lb N/a. Pioneer
8500 treated with Concep III safener and
Cruiser insecticide was planted at 42,000
seeds/a in 30-inch rows on May 20, 2005. A
second set of continuous sorghum plots was
planted on June 24. Preemergence herbicides
for sorghum in tilled plots were as follows:
GW-V: 1.33 pt/a Dual II Magnum + 0.83lb/a
AAtrex 90DF; and GG-CMay and GG-CJune:
1.33 pt/a Dual II Magnum + 1.11 lb/a AAtrex
90DF. Sorghum was not row cultivated. May-
and June-planted sorghum were harvested on
September 13 and October 18, respectively.
Fallow weed control procedures through
mid-March for no-till soybean after wheat
were the same as for CW-NT and GW-NT.
SW-V tillage treatments were similar to those
indicated for GW-V. Asgrow AG3302 RR
soybean was planted at 7 seeds/ft in 30-inch
rows on May 6. After planting, weeds were
controlled in all soybean plots with Roundup
Ultra Max II + AMSU (17 oz + 2.6 lb/a) on
May 23, and with Roundup Original Max +
AMSU (22 oz + 2.6 lb/a) on June 20. Soybean
was harvested on September 22, 2005.
Results
Wheat
Crop residue cover in wheat after corn,
sorghum, and soybean averaged 78, 77, and
58%, respectively (Table 2). WW-B, WW-C,
and WW-NT averaged 8, 27, and 75%
residue cover after planting, respectively.
Most wheat emerged 10 to 13 days after
planting. Where wheat followed a row crop,
stands averaged 99 to 100% complete in
November and were not affected by tillage
system or previous crop. Similar stands
occurred in WW-NT. WW-B and WW-C
plots had slower emergence, and ultimately
poorer stands. These treatments exhibited
poorer internal soil drainage, resulting in
water ponding and mortality of seedlings after
4Poncho is a registered trademark of Bayer.
This publication from the Kansas State University Agricultural Experiment Station and Cooperative Extension Service has been archived. Current information is available from http://www.ksre.ksu.edu.

HC-6
heavy fall rains. Benefit of overseeding wheat
in December was impeded by unusually heavy
rainfall in early January. Although final stands
in WW-B and WW-C were reasonable, wheat
tillering in these plots was limited and plant
development was delayed. Cheat control was
generally good to excellent, except for WW-
C. Plant N concentration in wheat at late boot-
early heading stage was highest in WW-B and
WW-C. Among remaining treatments, plant N
was highest in wheat after soybean (1.35%).
Heading date occurred one day earlier in
wheat after soybean than in wheat after corn
or sorghum and two days earlier than WW-
NT. Yields were highest in wheat rotated with
soybean, corn, and sorghum, averaging 71.6,
56.5, and 51.2 bu/a, respectively. No-till
continuous wheat yielded substantially less, at
44.1 bu/a. Tillage-system effects on wheat
yield were not significant in any of the row
crop rotations. In continuous wheat, no-till
yield was 16.1 bu/a better than with the burn
and chisel treatments. Crop rotation effect on
test weight was significant, with slightly
greater values in wheat after corn and soybean
than after grain sorghum or in continuous
wheat.
Row Crops
Corn, sorghum, and soybean following
wheat had an average of 34, 28, and 24%,
respectively, crop residue cover after planting
in V-blade systems (Table 3). Where these
row-crops were planted NT after wheat, crop
residue cover ranged from 81 to 92%, with the
greatest residue cover in CW-NT. The chisel
system in May-planted continuous sorghum
resulted in 11% more ground cover than the
V-blade system in sorghum after wheat. Over
the past nine years, the respective averages
for GG-C May and GW-V ground cover have
been 37 and 35%, respectively, whereas
GG-CJune has averaged 25% ground cover. In
keeping with long-term averages, NT
sorghum after wheat averaged 11% more
ground cover than did May-planted NT
continuous sorghum. GG-NT June had 21% less
ground cover than GG-NT May, compared with
a long-term difference of 12%.
In corn, tillage system did not affect
stands, ears per plant, or grain test weight. No-
till delayed silking by two days, decreased leaf
nutrient level by 0.36% N and tended to
reduce yield, but not significantly at p =0.05.
In sorghum after wheat, tillage system had
no significant effect on stand, days to half
bloom, grain test weight, and yield. Leaf N
levels were ample with both tillage systems,
but were somewhat higher in GW-V than in
GW-NT. Also, the number of heads per plant
was slightly larger in GW-V. Within the same
planting date, continuous sorghum showed
little or no effect from tillage system on any of
the variables measured.
Crop rotation and planting date both had
large effects on grain sorghum. Following
wheat in rotation, sorghum had 0.16 more
heads/plant and produced 81.4 bu/a, 14.9 bu/a
more than continuous sorghum produced
when planted on the same date. June-planted
continuous sorghum reached bloom stage 8
days earlier, had 0.08 more heads/plant, and
yielded an average of 16.9 bu/a less, with 3.7
lb/bu lower test weight, than May-planted
continuous sorghum.
Soybean averaged 29.1 bu/a, close to the
long-term mean production. Tillage system
did not affect soybean yield.
This publication from the Kansas State University Agricultural Experiment Station and Cooperative Extension Service has been archived. Current information is available from http://www.ksre.ksu.edu.

HC-7
Table 2. Effects of row crop rotation and tillage on wheat, Harvey County Experiment Field, Hesston, Kansas,
2005.
Crop
Sequence1
Tillage
System
Crop
Residue
Cover 2
Yield3
Test
Wt
Stand4
Nov Apr
Head-
ing5
Plant
N6
Cheat
Control72005 9-Yr
% bu/a lb/bu % date % ----%----
Wheat-corn
(No-till)
V-blade
No-till
76
80
58.0
55.0
56.7
57.6
58.8
58.4
100 100
100 100
5
6
1.19
1.14
94
100
Wheat-
sorghum
(No-till)
V-blade
No-till
72
82
51.2
51.3
47.9
47.6
57.8
57.8
100 100
100 100
4
5
1.12
1.04
93
100
Wheat-
soybean
(No-till)
V-blade
No-till
58
59
73.9
69.4
57.2
59.7
58.7
58.4
99 99
100 100
4
4
1.31
1.40
100
99
Continuous
wheat
Burn
Chisel
No-till
8
27
75
29.8
26.2
44.1
47.4
45.1
47.9
57.6
57.4
57.5
41 91
31 89
96 97
12
12
6
1.77
1.76
1.19
96
73
91
LSD .05
LSD .10
8
6
9.8
8.1
8.9
7.4
0.9
0.8
10 6
8 5
3.1
2.5
0.19
0.16
NS
NS
Main effect means:
Crop Sequence
Wheat-corn
Wheat-sorghum
Wheat-soybean
Continuous wheat
LSD .05
78
77
58
51
6
56.5
51.2
71.6
35.1
6.9
57.1
47.7
58.4
46.5
6.2
58.6
57.8
58.6
57.4
0.6
100 100
100 100
99 99
64 93
4 4
5
5
4
9
1.9
1.16
1.08
1.35
1.48
0.13
97
96
100
82
NS
Rotation Tillage system
No-till/V-blade
No-till/no-till
LSD .05
69
74
NS
61.0
58.6
NS
53.9
55.0
NS
58.5
58.2
NS
100 100
100 100
NS NS
5
5
NS
1.21
1.19
NS
96
99
NS1 Wheat planted no-till after row crop. Crop sequence main-effect means exclude continuous wheat-burn treatment.
Tillage main-effect means exclude all continuous wheat treatments.2 Crop residue cover estimated by line transect after planting. 3 Means of four replications adjusted to 12.5% moisture.4 Stands evaluated on November 22 and April 21. 5 Date in May on which 50% heading occurred.6 Whole-plant N levels at late boot to early heading. 7 Visual rating of cheat control just before harvest.
This publication from the Kansas State University Agricultural Experiment Station and Cooperative Extension Service has been archived. Current information is available from http://www.ksre.ksu.edu.
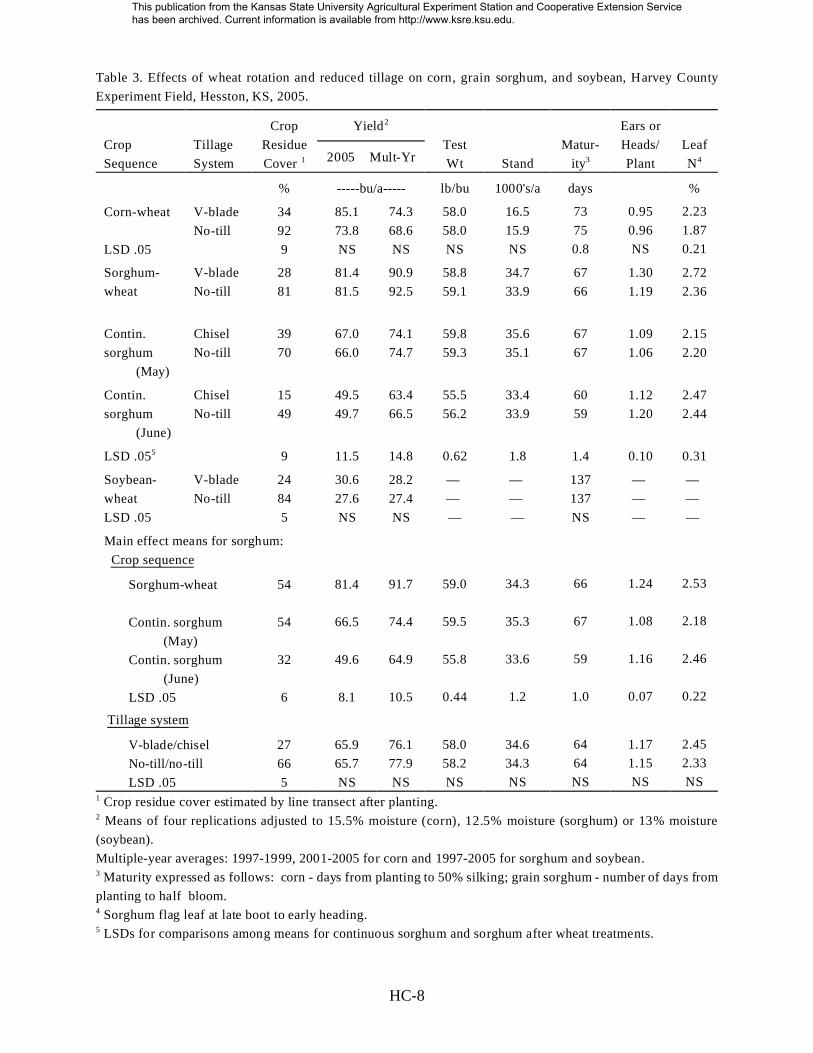
HC-8
Table 3. Effects of wheat rotation and reduced tillage on corn, grain sorghum, and soybean, Harvey County
Experiment Field, Hesston, KS, 2005.
Crop
Sequence
Tillage
System
Crop
Residue
Cover 1
Yield2
Test
Wt Stand
Matur-
ity3
Ears or
Heads/
Plant
Leaf
N42005 Mult-Yr
% -----bu/a----- lb/bu 1000's/a days %
Corn-wheat
LSD .05
V-blade
No-till
34
92
9
85.1
73.8
NS
74.3
68.6
NS
58.0
58.0
NS
16.5
15.9
NS
73
75
0.8
0.95
0.96
NS
2.23
1.87
0.21
Sorghum-
wheat
V-blade
No-till
28
81
81.4
81.5
90.9
92.5
58.8
59.1
34.7
33.9
67
66
1.30
1.19
2.72
2.36
Contin.
sorghum
(May)
Chisel
No-till
39
70
67.0
66.0
74.1
74.7
59.8
59.3
35.6
35.1
67
67
1.09
1.06
2.15
2.20
Contin.
sorghum
(June)
Chisel
No-till
15
49
49.5
49.7
63.4
66.5
55.5
56.2
33.4
33.9
60
59
1.12
1.20
2.47
2.44
LSD .055 9 11.5 14.8 0.62 1.8 1.4 0.10 0.31
Soybean-
wheat
LSD .05
V-blade
No-till
24
84
5
30.6
27.6
NS
28.2
27.4
NS
—
—
—
—
—
—
137
137
NS
—
—
—
—
—
—
Main effect means for sorghum:
Crop sequence
Sorghum-wheat
Contin. sorghum
(May)
Contin. sorghum
(June)
LSD .05
54
54
32
6
81.4
66.5
49.6
8.1
91.7
74.4
64.9
10.5
59.0
59.5
55.8
0.44
34.3
35.3
33.6
1.2
66
67
59
1.0
1.24
1.08
1.16
0.07
2.53
2.18
2.46
0.22
Tillage system
V-blade/chisel
No-till/no-till
LSD .05
27
66
5
65.9
65.7
NS
76.1
77.9
NS
58.0
58.2
NS
34.6
34.3
NS
64
64
NS
1.17
1.15
NS
2.45
2.33
NS1 Crop residue cover estimated by line transect after planting.2 Means of four replications adjusted to 15.5% moisture (corn), 12.5% moisture (sorghum) or 13% moisture
(soybean).
Multiple-year averages: 1997-1999, 2001-2005 for corn and 1997-2005 for sorghum and soybean. 3 Maturity expressed as follows: corn - days from planting to 50% silking; grain sorghum - number of days from
planting to half bloom. 4 Sorghum flag leaf at late boot to early heading.5 LSDs for comparisons among means for continuous sorghum and sorghum after wheat treatments.
This publication from the Kansas State University Agricultural Experiment Station and Cooperative Extension Service has been archived. Current information is available from http://www.ksre.ksu.edu.
HC-9
NO-TILL CROP ROTATION EFFECTS ON WHEAT, CORN, GRAIN SORGHUM,
SOYBEAN, AND SUNFLOWER
M.M. Claassen and D.L. Regehr
Summary
A field experiment consisting of eleven 3-
yr, no-till crop rotations was initiated in 2001
in central Kansas on Ladysmith silty clay
loam. Cropping systems involving winter
wheat (W), corn (C), grain sorghum (GS),
double-crop grain sorghum ([GS]), soybean
(SB), double-crop soybean ([SB]), and
sunflower (SF) are as follows: W-C-SB,
W-[SB]-C-SB, W-SB-C, W-GS-SB,
W-[SB]-GS-SB, W-[GS]-GS-SB, W-GS-SF,
W-[SB]-GS-SF, W-[GS]-GS-SF, GS-C-SB,
and GS-GS-GS. Data collection to determine
cropping system effects commenced in 2004.
In 2005, highest W yields occurred in
W-C-SB and W-GS-SB rotations, with 83.7
and 79.6 bu/a, respectively. In rotations where
W followed SB or SF, yields averaged 77.9
and 72.2 bu/a. Following an unusually large
corn yield in 2004, W after C produced 11.6
and 5.9 bu/a less than after SB and SF,
respectively. Row crops, particularly C,
suffered hail damage in late June. Corn
averaged 79.9 bu/a without crop rotation
effect. Grain sorghum grain production did not
differ significantly among rotations. Grain
sorghum averaged 81.9 bu/a, whereas [GS]
had comparable yields of 78.4 bu/a. Soybean
produced an average yield of 28.3 bu/a
without significant differences among the
seven rotations. Unlike 2004, SB was not
adversely affected by an antecedent GS crop
versus following W or C. Double-crop
soybean averaged 15.4 bu/a and showed no
meaningful response to crop rotation.
Sunflower yielded 1734 lb/a with no rotation
effect.
Introduction
The number of acres devoted to no-till
crop production in the U.S. has risen steadily
over the past 10 years, most notably since
2002. In 2004, according to the Conservation
Technology Information Center, no-till was
used on 62.4 million acres, nearly 23% of the
cropland. Kansas currently ranks seventh in
the nation, with 4.2 million acres of no-till
annual crops representing 21.2% of planted
acres. Soil and water conservation issues; cost
of labor, fuel, and fertilizers; changes in
government farm programs; development of
glyphosate-tolerant crops; and lower
glyphosate herbicide cost have all contributed
to no-till adoption by growers.
Research has shown that crop rotation
reduces pest control costs, enhances yields,
and contributes significantly to successful no-
till crop production. Selection of appropriate
crop rotations brings adequate diversity of
crop types to facilitate the realization of these
benefits and also provides sufficient water-use
intensity to take full advantage of available
moisture.
In central and south-central Kansas, long-
term no-till research on multiple crop rotations
is needed to determine their profitability and
reliability. The experiment reported here
includes 10 three-year rotations. Nine of these
involve winter wheat, corn or grain sorghum,
and soybean or sunflower. One rotation
consists entirely of row crops. Continuous
grain sorghum serves as a monoculture check
treatment. Double-crop soybean and grain
sorghum after wheat are used as intensifying
components in five of the rotations. One
This publication from the Kansas State University Agricultural Experiment Station and Cooperative Extension Service has been archived. Current information is available from http://www.ksre.ksu.edu.
HC-10
complete cycle of these rotations was
completed in 2003. Official data collection
began in 2004.
Procedures
The experiment site was located on a
Ladysmith silty clay loam where no-till
soybean had been grown in year 2000. Lime
was applied according to soil test
recommendation and incorporated by light
tillage in late fall of that year. Detailed soil
sampling was done in early April 2001, just
before establishment of the cropping systems.
Average soil test values at that time included:
pH 6.2, organic matter 2.7%, available
phosphorus (P) 46 lb/a, and exchangeable
potassium 586 lb/a.
Eleven crop rotations were selected to
reflect adaptation across the region. These
involved winter wheat (W), corn (C), grain
sorghum (GS), double-crop grain sorghum
([GS]), soybean (SB), double-crop soybean
([SB]), and sunflower (SF) as follows:
W-C-SB, W-[SB]-C-SB, W-SB-C, W-GS-SB,
W-[SB]-GS-SB, W-[GS]-GS-SB, W-GS-SF,
W-[SB]-GS-SF, W-[GS]-GS-SF, GS-C-SB,
and GS-GS-GS. A randomized complete-
block design was used, with four replications
of 31 treatments annually representing each
crop in each rotation.
Corn plots to be planted to wheat were
sprayed with Roundup Original Max + 2,4-
DLVE 6EC + AMSU (22 oz + 4 oz + 0.5 lb/a)
on October 2, 2004, to control volunteer crop
growth and/or late emerged weeds. Overley
wheat was planted into corn and soybean
stubble on October 22 in 8-inch rows at 90
lb/a with a CrustBuster no-till drill equipped
with double-disk openers. Wheat was ferti-
lized with 121 lb N/a and 35 lb P2O5/a as
preplant broadcast ammonium nitrate and as
in-furrow diammonium phosphate at planting.
No herbicides were used on wheat in any of
the cropping systems. Wheat was harvested on
June 24, 2005.
Wheat plots to be planted to corn were
sprayed with Roundup Original II + AMSU
(1.5 qt + 1.7 lb/a) on July 13 and with
Roundup Original Max + 2,4-DA + AMSU (16
oz + 16 oz + 0.5 lb/a) on August 31, 2004.
Wheat and [SB] plots to be planted to corn
were treated with Roundup Ultra Max II +
Clarity + AMSU (22 oz + 2.5 oz + 1 lb/a) on
March 14. These areas and those where corn
followed grain sorghum received an
application of atrazine 90DF + Dual II
Magnum + COC (1.67 lb + 1.6 pt + 1 qt/a) on
March 19. Soybean plots to be planted to corn
and then rotated to wheat were sprayed with
Roundup Ultra Max II + atrazine 90DF + Dual
II Magnum + AMSU + COC ( 17 oz + 1.11 lb
+ 1.6 pt + 2.6 lb + 1 qt/a) on the same day. A
White no-till planter with double-disk openers
on 30-inch centers was used to plant Poncho
250-treated Pioneer 35P12 at approximately
18,700 seeds/a on April 16, 2005. All corn
was fertilized with14 lb N/a and 37 lb P2O5/a,
banded 2 inches from the row at planting.
Corn after wheat, [SB], and grain sorghum
received 111 lb N/a, and corn after soybean
received 81 lb N/a as 28-0-0, injected in a
band 10 inches on either side of each row
during the third week of May. Corn was
harvested on September 2, 2005.
Plots to be planted to grain sorghum were
treated the same as corn during the preceding
summer. Wheat, [GS], and [SB] plots to be
planted to grain sorghum were treated with
Roundup Ultra Max II + Clarity + AMSU (22
oz + 2.5 oz + 1 lb/a) on March 14. Following
wheat, sorghum plots received atrazine 90DF
+ Dual II Magnum + 2,4-DLVE 6EC + COC
(1.6 lb + 1.33 pt + 1.33 oz + 1 qt/a) on April
23. Remaining plots were treated on the same
day with Roundup Original Max + atrazine
This publication from the Kansas State University Agricultural Experiment Station and Cooperative Extension Service has been archived. Current information is available from http://www.ksre.ksu.edu.
HC-11
90DF + Dual II Magnum + 2,4-DLVE 6EC +
AMSU (28 oz + 1.1 or 1.6 lb + 1.33 pt + 0.67
pt + 2.6 lb/a).
Sorghum Partners KS 585 treated with
Cruiser insecticide and Concep safener was
planted at 42,000 seeds/a in 30-inch rows,
with 14 lb N/a and 37 lb P2O5/a banded 2
inches from the row on May 20. Sorghum
after W, GS, [GS], and [SB] received an
additional 76 lb/a of N, and sorghum after SB
received 46 lb/a of N. Both rates were injected
as 28-0-0 in a band 10 inches from the row
in June. Sorghum was harvested on September
13, 2005.
Double-crop grain sorghum had a preplant
application of Roundup Original Max +
AMSU (33 oz + 1.3 lb/a) on July 11. Pioneer
85G57 was planted like KS 585 on July 11.
An additional 46 lb/a of N was injected on
August 9. Postemergence application of
atrazine 4L + COC (1.5 qt + 1 qt/a) was made
with drop nozzles on August 10. Double-crop
grain sorghum was harvested on October 27.
Wheat plots to be planted to soybean were
treated with Roundup applications in July and
August like those for corn and sorghum. Corn
plots to be planted to soybean were sprayed
with Roundup Original Max + 2,4-DLVE 6EC
+ AMSU (16 oz + 0.67 qt + 0.5 lb/a) on
October 2, 2004. Spring preplant weed control
where soybean followed wheat consisted of
treatment with Roundup Ultra Max II +
Clarity + AMSU (22 oz + 2.5 oz + 1 lb/a) on
March 19. All remaining plots were sprayed
with Roundup Original Max + 2,4-DLVE 6EC
+ AMSU (22 oz + 2.7 oz + 2.6 lb/a) on April
23. Asgrow AG3302 RR soybean was planted
at 122,000 seeds/a in 30-inch rows on May 5.
During the season, Roundup at 22 oz/a was
applied June 15 and repeated in combination
with Select herbicide at 8 oz/a on July 16.
Soybean was harvested on September 23.
Double-crop soybean had a preplant
application of Roundup Original Max +
AMSU (33 oz + 1.3 lb/a) on July 11. Asgrow
AG3302 RR soybean was planted as a double
crop at 122,000 seeds/a in 30-inch rows on the
same day. Double-crop soybean was sprayed
with Roundup Original Max II + AMSU (22
oz + 2.6 lb/a) on August 31, and was
harvested on October 27, 2005.
All sunflower plots were sprayed with
Roundup Original Max + 2,4-DLVE 6EC +
AMSU (22 oz + 2.7 oz + 2.6 lb/a) on April 23.
After an extended wet period, Roundup Ultra
Max II + Dual II Magnum + AMSU (33 oz +
1.67 pt + 2.6 lb/a) was applied on June 20.
Triumph s672 sunflower was planted at
22,000 seeds/a, with 14-37-0 fertilizer banded
2 inches from the row, on June 24. An
additional 56 lb/a of N was injected on July
25. Sunflower was harvested on October 6.
Results
Wheat
Wheat stand establishment was excellent.
Heading tended to be slightly later and plant
heights slightly greater in wheat after corn or
soybean than after sunflower (Table 4). Plant
N concentrations differed among crop
rotations, but averaged 0.14% less following
sunflower than following corn or soybean.
Wheat yields were highest in W-GS-SB and
W-C-SB, ranging from 79.6 to 83.7 bu/a,
respectively. When averaged over all
rotations, wheat after soybean and sunflower
averaged 77.9 and 72.2 bu/a. Following an
unusually large corn yield in 2004, wheat after
corn produced 11.6 and 5.9 bu/a less than after
these broadleaf row crops. Grain test weights
averaged 58.6 lb/bu and were not affected by
crop rotation. Grain protein ranged from 11.3
to 12.3% among rotations and tended to be
lowest in wheat following sunflower.
This publication from the Kansas State University Agricultural Experiment Station and Cooperative Extension Service has been archived. Current information is available from http://www.ksre.ksu.edu.

HC-12
Corn
Corn emerged about 9 days after planting.
Final corn populations averaged 16,200
plants/a (Table 5) and were not significantly
affected by crop rotation. Corn generally
reached the half-silking stage at 72 days after
planting. Leaf N averaged 2.33%, with no
significant rotation effect. Lodging,
presumably greater because of hail damage,
ranged from 12 to 30%, without consistent
relationship to crop rotation. Corn yields
averaged 79.9 bu/a, without rotation effect.
As covariates, plant population and
lodging only accounted for about 4% of yield
variation beyond any effect of crop rotation.
Test weight averaged 57.9 lb/bu, and the
number of ears/plant ranged from 0.89 to 1.1,
again without rotation effect.
Grain sorghum
Grain sorghum planting was completed a
few days ahead of an extended period of wet
weather that began in late May. Emergence
occurred rapidly, at 5 days after planting. Final
populations ranged from 35,200 to 38,300
plants/a. Lowest full-season sorghum plant
counts occurred in W-[GS]-GS-SF, whereas
populations were quite uniform across the
remaining rotations. On average, full-season
grain sorghum reached half-bloom stage at 66
days after planting. In W-[GS]-GS-SB, W-
[GS]-GS-SF, and continuous GS, half bloom
occurred two to three days later than in the
other crop rotations. Leaf N levels averaged
3.23% and were not affected by crop rotation.
The average yield of full-season grain
sorghum was 81.9 bu/a, with no significant
crop-rotation effect. Grain test weight
averaged 60.3 lb/bu, with minor differences
among rotations. Heads/plant ranged from
1.17 to 1.35. Lowest head counts tended to
occur in rotations in which GS followed GS or
[GS]. Lodging was generally minor, with a
high of 7% in the W-GS-SF rotation.
Double-crop grain sorghum stands
averaged 29,600 plants/a and reached half
bloom in 53 days after planting. Leaf N
averaged 3.07%. Remarkably, double-crop
grain production was similar to that of the
full-season crop. Yields averaged 78.4 bu/a,
with a test weight of 55.7 lb/bu. Double-crop
grain sorghum produced 1.68 heads/plant,
with no lodging. Crop rotations had no effect
on any of the variables measured in [GS].
Soybean
Soybean emerged 12 days after planting.
Stands were excellent with very minor
differences among rotations (Table 6). Full-
season soybean plant heights ranged from 22
to 25 inches. Soybean tended to be tallest
following wheat and shortest after grain
sorghum. Yields averaged 28.3 bu/a and were
not affected significantly by crop rotation.
Unlike results in 2004, soybean yields
following grain sorghum were at least as high
as after other crops. There was no lodging.
Double-crop soybean stands averaged
99%. Plant heights averaged 18 inches.
Double-crop soybean reached maturity at 102
days after planting and averaged 15.4 bu/a. No
lodging occurred. Crop rotations did not
significantly affect any of the [SB] variables
measured.
Sunflower
Sunflower emerged 7 days after planting.
Populations averaged 11,570 plants/a.
Triumph s672 NuSun short-stature sunflower
reached half-bloom stage at 56 days and an
average height of 33 inches. Yields averaged
1734 lb/a, with 6% lodging. None of these
variables were affected by crop rotation.
This publication from the Kansas State University Agricultural Experiment Station and Cooperative Extension Service has been archived. Current information is available from http://www.ksre.ksu.edu.

HC-13
Table 4. Effects of crop rotation on no-till wheat, Harvey County Experiment Field, Hesston, Kansas, 2005.
Crop Crop Rotation1
Yield2 Test
Wt Stand
Head-
ing3
Plant
ht
Plant
N4
Grain
Protein2005 2004
-------bu/a------ lb/bu % date inches % %
Wheat W-C-SB 83.7 57.8 58.9 100 35 40 1.10 12.2
W-[SB]-C-SB 76.3 65.2 58.9 100 34 38 1.17 12.3
W-SB-C 66.3 59.6 58.4 100 35 38 1.21 11.9
W-GS-SB 79.6 63.4 58.9 100 34 37 1.27 12.1
W-[SB]-GS-SB 74.8 65.0 58.7 100 34 38 1.27 11.7
W-[GS]-GS-SB 74.4 59.9 58.5 100 34 37 1.24 12.1
W-GS-SF 74.6 51.8 58.6 100 34 38 1.13 11.5
W-[SB]-GS-SF 72.5 56.1 58.6 100 33 37 1.10 11.5
W-[GS]-GS-SF 69.3 53.9 58.4 100 34 37 0.98 11.3
LSD 0.05
LSD 0.10
6.9
5.7
7.7
6.4
NS
NS
NS
NS
0.7
0.6
1.1
0.9
NS
NS
0.67
0.56
Preceding crop main effect means:
Corn 66.3 59.6 58.4 100 35 38 1.21 11.9
Soybean 77.9 62.3 58.8 100 34 38 1.21 12.1
Sunflower 72.2 53.9 58.5 100 33 37 1.07 11.5
LSD 0.055
LSD 0.105
4.4
3.6
4.5
3.8
NS
0.28
NS
NS
0.4
0.3
NS
0.7
0.12
0.10
0.38
0.31
1 C = corn, GS = grain sorghum, SB = soybean, SF = sunflower, W = wheat, and [ ] = double crop.2 Means of four replications adjusted to 12.5% moisture.3 Days after March 31 on which 50% heading occurred.4 Whole-plant N levels at late boot to early heading.5 Estimate based on the average number of crop sequences involving the same preceding crop = 3.0.
This publication from the Kansas State University Agricultural Experiment Station and Cooperative Extension Service has been archived. Current information is available from http://www.ksre.ksu.edu.

HC-14
Table 5. Effects of crop rotation on no-till corn and grain sorghum, Harvey County Experiment Field, Hesston,
Kansas, 2005.
Crop Crop Rotation1
Yield2
Test
Wt Stand
Matur-
ity3
Ears or
Heads/
Plant
Lodg-
ing
Leaf
N42005 2004
-----bu/a----- lb/bu 1000/a date % %
Corn W-C-SB 82.5 142.5 58.4 15.7 72 0.97 12 2.46
W-[SB]-C-SB 80.4 144.2 57.8 17.5 72 0.91 28 2.37
W-SB-C 79.7 133.4 56.9 14.5 73 1.10 23 2.18
GS-C-SB 76.9 138.2 58.6 17.2 72 0.89 30 2.31
LSD 0.05
LSD 0.10
NS
NS
8.1
6.6
NS
NS
NS
NS
NS
NS
NS
NS
NS
NS
NS
NS
Sorghum W-GS-SB 83.9 107.8 60.5 37.2 65 1.35 1 3.29
W-[SB]-GS-SB 81.3 101.9 60.6 38.3 64 1.28 2 3.25
W-[GS]-GS-SB 82.9 98.1 60.2 38.1 67 1.17 0 3.23
W-GS-SF 77.0 108.6 59.8 37.5 64 1.37 7 3.21
W-[SB]-GS-SF 80.2 98.2 60.2 37.5 65 1.38 2 3.14
W-[GS]-GS-SF 84.5 102.0 60.4 35.2 67 1.28 0 3.26
GS-C-SB 84.1 102.9 60.7 36.5 65 1.32 1 3.16
GS-GS-GS 81.1 98.6 60.1 36.8 67 1.17 0 3.28
[Sorghum] W-[GS]-GS-SB 77.3 78.5 55.6 30.4 53 1.63 0 3.11
W-[GS]-GS-SF 79.5 79.1 55.7 28.8 53 1.73 0 3.03
LSD 0.05
LSD 0.10
NS
NS
9.1
7.6
0.6
0.5
3.1
2.6
1.0
0.8
0.14
0.12
4
3
NS
NS
Preceding crop main effect means:
Sorghum Wheat 80.4 108.2 60.2 37.4 64 1.36 4 3.25
[Soybean] 80.8 100.1 60.4 37.9 64 1.33 2 3.20
Soybean 84.1 102.9 60.7 36.5 65 1.32 1 3.16
[Sorghum] 83.7 100.1 60.3 36.6 67 1.22 0 3.24
Sorghum 81.1 98.6 60.1 36.8 67 1.17 0 3.28
LSD 0.055
LSD 0.105
NS
NS
NS
6.0
NS
NS
NS
NS
0.9
0.7
0.11
0.09
NS
NS
NS
NS
1 C = corn, GS = grain sorghum, SB = soybean, SF = sunflower, W = wheat, and [ ] = double crop.2 Means of four replications adjusted to 15.5% moisture (corn) or 12.5% moisture (grain sorghum).3 Maturity expressed as: corn - days from planting to 50% silking; grain sorghum - days from planting to half bloom.4 N level of the ear leaf plus one in corn and of the flag leaf in sorghum.5 Estimate based on the average number of crop sequences involving the same preceding crop to full-season grain
sorghum = 1.6.
This publication from the Kansas State University Agricultural Experiment Station and Cooperative Extension Service has been archived. Current information is available from http://www.ksre.ksu.edu.

HC-15
Table 6. Effects of crop rotation on no-till soybean and sunflower, Harvey County Experiment Field, Hesston,
Kansas, 2005.
Crop Crop Rotation1
Yield2
Stand3 Plant Ht
Matur-
ity4
Lodg-
ing2005 2004
----------bu/a---------- inches date %
Soybean W-C-SB 29.1 61.7 100 23 137 0
W-[SB]-C-SB 29.3 62.1 100 24 138 0
W-SB-C 27.3 61.2 100 25 137 0
W-GS-SB 29.3 55.2 100 23 138 0
W-[SB]-GS-SB 28.8 56.0 100 22 139 0
W-[GS]-GS-SB 29.6 53.6 100 22 138 0
GS-C-SB 24.8 62.7 100 23 138 0
[Soybean] W-[SB]-C-SB 14.9 11.6 100 18 103 0
W-[SB]-GS-SB 13.5 13.3 97 17 102 0
W-[SB]-GS-SF 17.8 14.8 100 19 102 0
LSD 0.05
LSD 0.10
5.9
4.9
NS
NS
2
1
2.0
1.7
1.3
1.1
NS
NS
Preceding crop main effect means:
Wheat 27.3 61.2 100 25 137 0
Corn 27.7 62.2 100 23 138 0
Sorghum 29.2 54.9 100 22 138 0
LSD 0.055
LSD 0.105
NS
NS
NS
5.6
NS
NS
1.2
1.0
0.9
0.8
NS
NS
Sunflower W-GS-SF 1819 2311 12.5 34 56 6
W-[SB]-GS-SF 1602 2098 11.6 32 56 10
W-[GS]-GS-SF 1782 1984 10.6 33 56 3
LSD 0.05
LSD 0.10
NS
NS
NS
NS
NS
NS
0.9
0.7
NS
NS
NS
NS
1 C = corn, GS = grain sorghum, SB = soybean, SF = sunflower, W = wheat, and [ ] = double crop.2 Means of four replications adjusted to 13% moisture (soybean) or 10% moisture (sunflower in lb/a).3 Stand expressed as a percentage for soybean and as plant population in thousands per acre for sunflower. 4 Sunflower maturity expressed as number of days from planting to half bloom.5 Estimate based on the average number of crop sequences involving the same preceding crop to full-season
soybean = 2.3.
This publication from the Kansas State University Agricultural Experiment Station and Cooperative Extension Service has been archived. Current information is available from http://www.ksre.ksu.edu.

HC-16
EFFECTS OF LATE-MATURING SOYBEAN AND SUNN HEMP SUMMER COVER
CROPS AND NITROGEN RATE ON NO-TILL GRAIN SORGHUM AFTER WHEAT
M.M. Claassen
Summary
Late-maturing Roundup Ready® soybean
and sunn hemp drilled in wheat stubble at 60
and 10 lb/a, respectively, produced an average
of 2.11 and 3.19 ton/a of above-ground dry
matter. Corresponding nitrogen (N) yields of
90 and125 lb/a were potentially available to
the succeeding grain sorghum crop. Following
cover crops, grain sorghum leaf N
concentrations were generally higher at all but
the highest rate of fertilizer N. When averaged
across N fertilizer rates, soybean and sunn
hemp significantly increased sorghum leaf
nutrient levels, by 0.15% N and 0.16% N,
respectively. Cover crops did not affect grain
sorghum plant population, the length of time
to reach half bloom, or grain test weight.
Soybean increased sorghum yields at all but
the 90 lb/a N rate, whereas sunn hemp in the
rotation improved yields at all N rates. The
positive effect of soybean and sunn hemp
cover crops was seen in respective sorghum
yield improvements of 9.7 and 13.4 bu/a when
averaged over N rate. Averaged over cropping
systems, yields increased significantly with
each 30 lb/a increment of fertilizer N.
Introduction
Research at the KSU Harvey County
Experiment Field over an 8-year period
explored the use of hairy vetch as a winter
cover crop following wheat in a winter wheat-
sorghum rotation. Results of long-term
experiments showed that, between September
and May, hairy vetch can produce a large
amount of dry matter, with an N content on
the order of 100 lb/a. But significant
disadvantages also exist in the use of hairy
vetch as a cover crop. These include the cost
and availability of seed, interference with the
control of volunteer wheat and winter annual
weeds, and the possibility of hairy vetch
becoming a weed in wheat after sorghum.
New interest in cover crops has been
generated by research in other areas showing
the positive effect that these crops can have on
the overall productivity of no-till systems. In
a 2002 pilot project at Hesston, a Group VI
maturity soybean grown as a summer cover
crop after wheat produced 2.25 ton/a of
above-ground dry matter and an N yield of 87
lb/a potentially available to the succeeding
crop. Soybean cover crop did not affect grain
sorghum yield in the following growing
season but, when averaged over N rate,
resulted in 0.15% N increase in flag leaves.
In the current experiment, late-maturing
soybean and sunn hemp, a tropical legume,
were evaluated as summer cover crops for
their impact on no-till sorghum grown in the
spring following wheat harvest. In the first
cycle of these rotations, the two cover crops
produced N yields of 146 and 119 lb/a,
respectively. Sunn hemp increased grain
sorghum yields by 10.6 bu/a, whereas soybean
did not impact sorghum grain production in a
season with considerable drought stress. Data
presented for 2005 represent the second cycle
of wheat-grain sorghum rotations, without and
with soybean and sunn hemp cover crops.
Procedures
The experiment was established on a
Geary silt loam site that had been used for
hairy vetch cover crop research in a wheat-
This publication from the Kansas State University Agricultural Experiment Station and Cooperative Extension Service has been archived. Current information is available from http://www.ksre.ksu.edu.
HC-17
sorghum rotation from 1995 to 2001. In
keeping with the previous experimental
design, soybean and sunn hemp were assigned
in 2002 to plots where vetch had been grown,
and the remaining plots retained the no-cover-
crop treatment. The existing factorial
arrangement of N rates on each cropping
system also was retained. The second cycle of
these cropping systems with summer cover
crops was initiated after wheat harvest in
2004.
Weeds in wheat stubble were controlled
with Roundup Ultra Max II herbicide applied
9 days before cover crop planting. Asgrow
AG7601 Roundup Ready® soybean and sunn
hemp seed were treated with respective
rhizobium inoculants and were no-till planted
in 8-inch rows with a CrustBuster stubble drill
on July 9 at 60 lb/a and 10 lb/a, respectively.
Sunn hemp began flowering in mid-
September and was terminated at that time by
a combination of rolling with a crop roller and
application of 22 oz/a of Roundup Ultra Max
II. Soybean was rolled after initial frost in
early October. Forage yield of each cover crop
was determined by harvesting a 3.28 ft2 area in
each plot just before termination. Samples
were subsequently analyzed for N content.
Weeds were controlled during the fallow
period after cover crops with Roundup Ultra
Max II, 2,4-DLVE and Clarity. Pioneer 8500
grain sorghum treated with Concep-safener
and Cruiser insecticide was planted at
approximately 42,000 seeds/a on May 23,
2005. Atrazine and Dual II Magnum were
applied preemergence for residual weed
control shortly after sorghum planting.
All plots received 37 lb/a of P2O5 banded
as 0-46-0 at planting. Nitrogen fertilizer
treatments were applied as 28-0-0, injected at
10 inches from the row on June 27, 2005.
Grain sorghum was combine harvested on
September 15.
Results
During the 9 days preceding cover crop
planting, rainfall totaled 1.82 inches. The next
rains occurred about two weeks after planting,
when 4 inches were received over a 3-day
period. Stand establishment was good with
both soybean and sunn hemp. Although July
rainfall in 2004 was above normal, August
and September were drier than usual. Late-
maturing soybean reached an average height
of 24 inches, showed limited pod
development, and produced 2.11 ton/a of
above-ground dry matter with an N content of
2.11% or 90 lb/a (Table 7). Sunn hemp
averaged 72 inches in height and produced
3.19 ton/a with 1.95% N or 125 lb/a of N.
Soybean and sunn hemp suppressed volunteer
wheat to some extent, but failed to give the
desired level of control ahead of the wheat
planting season.
Grain sorghum emerged on May 30, 2005,
with final stands averaging 31,795 plants/a. In
July and August, average temperatures were
2.1 to 2.7 oF below normal, whereas
September was 2.7 oF warmer than usual.
During these months, there were only 2 days
with temperatures at or above 100 oF. July
rainfall was somewhat below normal,
resulting in periods of limited drought stress.
August brought abundant rains totaling 7
inches, mainly in the second half of the
month. September was dry, with less than half
of the long-term average rainfall.
Cover crops had no effect on sorghum
population or the length of time from planting
to half bloom. Both cover crops significantly
increased leaf N concentration. Across N
rates, these increases averaged 0.15% N and
0.16% N, respectively, for soybean and sunn
hemp. The positive effect of cover crops on
sorghum leaf N concentration was significant
at each level of fertilizer N except the 90 lb/a
rate following soybean. Cover crops tended to
This publication from the Kansas State University Agricultural Experiment Station and Cooperative Extension Service has been archived. Current information is available from http://www.ksre.ksu.edu.

HC-18
increase the number of heads/plant slightly.
When averaged over N rate, soybean and sunn
hemp significantly increased grain sorghum
yields, by 9.7 and 13.4 bu/a, respectively.
Sorghum test weights were not affected by
cover crops. Nitrogen rates increased the
number of sorghum heads/plant and the N
content of sorghum leaves. Leaf N increased
with each 30 lb/a increment of N fertilizer in
all crop rotations except with the highest N
rate in sorghum following soybean. Fertilizer
N effect on sorghum grain yields followed the
same trend as observed in leaf N levels. The
main effect of fertilizer N on yield was highly
significant, with an increase of 10 bu/a with
the last 30 lb/a increment.
This publication from the Kansas State University Agricultural Experiment Station and Cooperative Extension Service has been archived. Current information is available from http://www.ksre.ksu.edu.

HC-19
Table 7. Effects of soybean and sunn hemp summer cover crops and nitrogen rate on no-till grain sorghum
after wheat, Hesston, Kansas, 2005.
Cover Crop
N
Rate1
Cover Crop
Yield2
Forage N
Grain Sorghum
Grain
Yield
Bushel
Wt Stand
Half3
Bloom
Heads/
Plant4
Leaf
N5
lb/a ton/a lb/a bu/a lb 1000's/a days no. %
None 0
30
60
90
----
----
----
----
----
----
----
----
49.2
74.0
84.5
96.9
55.2
55.3
55.5
55.9
32.9
32.9
32.3
29.7
68
66
67
66
0.91
1.06
1.15
1.40
1.86
2.31
2.66
2.88
Soybean 0
30
60
90
2.30
2.02
2.53
1.59
93
87
109
69
73.4
81.3
92.8
96.3
55.8
55.3
55.5
55.8
34.2
31.4
29.9
30.8
66
66
66
67
1.01
1.17
1.29
1.36
2.20
2.57
2.75
2.79
Sunn hemp 0
30
60
90
2.95
3.10
3.26
3.47
116
118
130
136
71.7
87.2
92.7
106.7
55.7
55.2
55.6
56.2
32.2
33.3
31.4
30.5
66
65
67
66
1.06
1.12
1.23
1.49
2.07
2.60
2.80
2.92
LSD .05 0.71 32 9.7 NS 3.4 NS 0.17 0.16
Means:
Cover Crop/
Termination
None
Soybean
Sunn hemp
LSD .05
----
2.11
3.19
0.35
----
90
125
16
76.2
85.9
89.6
4.9
55.4
55.6
55.7
NS
32.0
31.6
31.8
NS
67
66
66
NS
1.13
1.21
1.23
0.09
2.43
2.58
2.59
0.08
N Rate
0
30
60
90
LSD .05
2.62
2.56
2.89
2.53
NS
105
102
119
103
NS
64.8
80.8
90.0
100.0
5.6
55.6
55.3
55.5
56.0
NS
33.1
32.5
31.2
30.3
2.0
67
66
67
66
NS
0.99
1.12
1.23
1.42
0.10
2.04
2.49
2.73
2.86
0.09
1 N applied as 28-0-0 on June 27, 2005.2 Oven dry weight and N content for sunn hemp and soybean on September 17 and October 4, 2004,
respectively. 3 Days from planting (May 23, 2005) to half bloom.4 Main effect of cover crop on heads/plant significant at p=0.06. 5 Flag leaf at late boot to early heading.
This publication from the Kansas State University Agricultural Experiment Station and Cooperative Extension Service has been archived. Current information is available from http://www.ksre.ksu.edu.

HC-20
EFFECTS OF CHLORIDE RATE ON NO-TILL CONTINUOUS WHEAT
AND GRAIN SORGHUM
M.M. Claassen
Summary
Experiments were conducted to determine
crop response to chloride (Cl) rates in
continuous no-till wheat and grain sorghum on
soils testing low in Cl. Ammonium chloride
(6-0-0-16.5) was broadcast on wheat in early
spring and on sorghum preemergence at rates
providing 10, 20, and 30 lb/a of Cl. Consistent
with soil test results, levels of Cl in leaves of
both crops were low in plots receiving no Cl
fertilizer. Each increment of Cl fertilizer
significantly increased the concentration of Cl
in crop leaves. Wheat yields increased by a
maximum of 7.6 bu/a with 20 lb/a of Cl. Grain
sorghum yields also were highest at 20 lb/a of
Cl, with an increase of 4.7 bu/a versus the
check treatment receiving no Cl.
Introduction
Chloride (Cl) is known to be an essential
plant nutrient. It plays an important role in the
uptake of nutrient cations and in the dynamics
of plant water utilization. Although it is
required in small amounts, deficiencies or
sub-optimal levels can result in yield
reduction. Significant yield increases in wheat,
corn, and grain sorghum from Cl application
in Kansas have been most consistent when
soil Cl levels are less than 4 parts per million
at a soil depth of 0 to 24 inches.
One of the benefits of Cl is its apparent
effect in reducing the severity of plant
diseases. Chloride fertilization in wheat has
been shown to suppress fungal diseases such
as tan spot, leaf rust, and stripe rust. In grain
sorghum and corn, it has been found to
suppress stalk rot. The current interest in using
stacked crop rotations (consecutive years of
the same crop) to enhance the economics of
no-till systems raises concern about plant
disease control, particularly in wheat. The
most notable disease in continuous no-till
wheat is tan spot.
The experiments reported here were
conducted to assess the benefits of Cl
fertilization in continuous no-till wheat and
grain sorghum on soils low in Cl.
Procedures
Wheat
The site was located on Ladysmith silty
clay loam soil (North Unit), with soil Cl of 2.4
parts per million at 0 to 24 inches. The area
had been cropped to no-till wheat in 2003-
2004. Jagger wheat was no-till planted on
October 21, 2004, at 90 lb/a. The basic
fertilizer program on the site provided 120-35-
0 lb/a of N-P-K, applied as 18-46-0 banded
with the seed and 46-0-0 broadcast in early
spring. Chloride rates of 0, 10, 20, and 30 lb/a
were broadcast as ammonium chloride (6-0-0-
16.5) on 4- to 6-inch wheat on March16,
2005. Leaf samples for nutrient analyses were
collected at late boot to early heading on May
7. Plots were combine harvested on June 24,
2005.
Grain Sorghum
Location of the grain sorghum project
also was on Ladysmith silty clay loam soil,
about 5 miles distant (South Unit) from the
previous site. Soil test indicated 1.9 parts per
million Cl at 0 to 24 inches. The previous crop
This publication from the Kansas State University Agricultural Experiment Station and Cooperative Extension Service has been archived. Current information is available from http://www.ksre.ksu.edu.
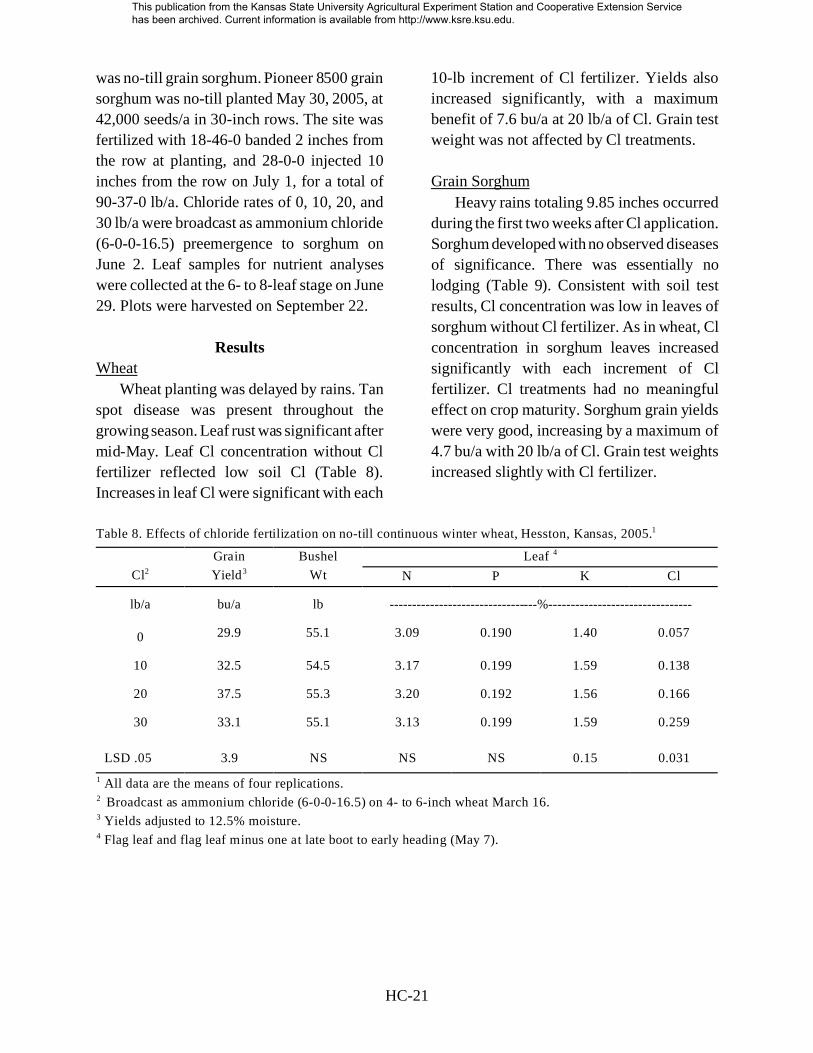
HC-21
was no-till grain sorghum. Pioneer 8500 grain
sorghum was no-till planted May 30, 2005, at
42,000 seeds/a in 30-inch rows. The site was
fertilized with 18-46-0 banded 2 inches from
the row at planting, and 28-0-0 injected 10
inches from the row on July 1, for a total of
90-37-0 lb/a. Chloride rates of 0, 10, 20, and
30 lb/a were broadcast as ammonium chloride
(6-0-0-16.5) preemergence to sorghum on
June 2. Leaf samples for nutrient analyses
were collected at the 6- to 8-leaf stage on June
29. Plots were harvested on September 22.
Results
Wheat
Wheat planting was delayed by rains. Tan
spot disease was present throughout the
growing season. Leaf rust was significant after
mid-May. Leaf Cl concentration without Cl
fertilizer reflected low soil Cl (Table 8).
Increases in leaf Cl were significant with each
10-lb increment of Cl fertilizer. Yields also
increased significantly, with a maximum
benefit of 7.6 bu/a at 20 lb/a of Cl. Grain test
weight was not affected by Cl treatments.
Grain Sorghum
Heavy rains totaling 9.85 inches occurred
during the first two weeks after Cl application.
Sorghum developed with no observed diseases
of significance. There was essentially no
lodging (Table 9). Consistent with soil test
results, Cl concentration was low in leaves of
sorghum without Cl fertilizer. As in wheat, Cl
concentration in sorghum leaves increased
significantly with each increment of Cl
fertilizer. Cl treatments had no meaningful
effect on crop maturity. Sorghum grain yields
were very good, increasing by a maximum of
4.7 bu/a with 20 lb/a of Cl. Grain test weights
increased slightly with Cl fertilizer.
Table 8. Effects of chloride fertilization on no-till continuous winter wheat, Hesston, Kansas, 2005.1
Cl2
Grain
Yield3
Bushel
Wt
Leaf 4
N P K Cl
lb/a bu/a lb ---------------------------------%--------------------------------
0 29.9 55.1 3.09 0.190 1.40 0.057
10 32.5 54.5 3.17 0.199 1.59 0.138
20 37.5 55.3 3.20 0.192 1.56 0.166
30 33.1 55.1 3.13 0.199 1.59 0.259
LSD .05 3.9 NS NS NS 0.15 0.031
1 All data are the means of four replications.2 Broadcast as ammonium chloride (6-0-0-16.5) on 4- to 6-inch wheat March 16.3 Yields adjusted to 12.5% moisture.4 Flag leaf and flag leaf minus one at late boot to early heading (May 7).
This publication from the Kansas State University Agricultural Experiment Station and Cooperative Extension Service has been archived. Current information is available from http://www.ksre.ksu.edu.

HC-22
Table 9. Effects of chloride fertilization on no-till continuous grain sorghum, Hesston, Kansas, 2005.1
Cl2
Grain
Yield3
Bushel
Wt
Half
Bloom
Lodg-
ing
Leaf 4
N P K Cl
lb/a bu/a lb DAP % --------------------------%--------------------------
0 101.9 57.3 63 0 2.68 0.258 2.47 0.090
10 104.3 56.7 64 0 2.66 0.244 2.41 0.351
20 106.6 56.8 64 0 2.71 0.243 2.33 0.611
30 105.3 56.9 64 0 2.82 0.253 2.26 0.774
LSD 0.10 2.9 0.4 0.4 NS NS NS 0.15 0.0591 All data are the means of eight replications.2 Broadcast as ammonium chloride (6-0-0-16.5) preemergence to sorghum June 2. 3 Yields adjusted to 12.5% moisture.4 Uppermost expanded leaf at 6- to 8-leaf stage June 29.
This publication from the Kansas State University Agricultural Experiment Station and Cooperative Extension Service has been archived. Current information is available from http://www.ksre.ksu.edu.

HC-23
PLANTING DATE, HYBRID MATURITY, AND PLANT POPULATION EFFECTS
IN NO-TILL CORN
M.M. Claassen and D.L. Fjell
Summary
Three Pioneer corn hybrids, 38H67, 35P12,
and 33B51, representing 97-, 105-, and 111-day
maturities, were planted in a soybean rotation
under no-till conditions on March14, April 4,
and April 16, with final populations of 14,000,
18,000, and 22,000 plants/a. The growing
season was punctuated by hail at the end of
June, but otherwise offered less drought stress
than usual for corn. All treatment factors
significantly affected corn. Planting date had the
largest effect on length of time to reach half-silk
stage. March14 and April 4 planting dates
delayed silking by 25 and 8 days versus April 16
planting. Corn yields averaged 106 bu/a when
planted in mid-March, but declined by 6 and
10% with successive plantings in April. Hybrid
38H67 produced an average of 95 bu/a, whereas
the later-maturing 35P12 and 33B51 had 3 and
13% larger yields. Yields increased with plant
population, averaging 11 and 22% more at
18,000 and 22,000, respectively, than at 14,000.
In 2004, yields were largest with the latest
planting date; in 2005, highest yield of 124 bu/a
occurred with the earliest planting. In both
years, maximum yields occurred with latest-
maturing hybrid and highest plant population.
Treatment effects on grain test weight were
minor, but early planting dates resulted in
slightly higher test weights than the mid-April
planting. Number of ears/plant was 9 and 2%
larger in corn planted on March 14 and April 4,
respectively, versus the April 16 planting date.
Ears/plant declined with increasing hybrid
maturity and increasing plant population.
Introduction
In central and south-central Kansas, dryland
corn often does not perform as well as grain
sorghum under existing seasonal weather
conditions, which usually involve some degree
of drought. Nevertheless, corn is preferred as a
rotational crop by some producers because
earlier growth termination and harvest facilitate
the planting of double-crop no-till wheat in
rotations. Genetic gains in corn drought
tolerance, as well as no-till planting practices
that conserve soil moisture, have encouraged
producer interest in growing corn despite
increased risk of crop failure.
Planting date, hybrid maturity, and plant
population all have a major effect on dryland
corn production. Recent research at this location
indicated that highest dryland yields occurred at
plant populations of 14,000 or 18,000 plants/a.
This experiment was initiated in 2004 to
determine if drought effects on no-till corn can
be minimized by early planting dates, use of
hybrids ranging in maturity from 97 to 111 days,
and plant populations of 14,000 to 22,000.
Procedures
The experiment was conducted on a
Ladysmith silty clay loam site that had been
cropped to no-till soybean in 2004. Corn was
fertilized with 95 lb/a of N and 37 lb/a of P2O5
as 18-46-0 banded close to the row before
planting and as 28-0-0 injected in a band 10
inches on either side of each row in mid-May.
The experiment design was a split-plot, with
planting-date main plots and subplots with
factorial combinations of three hybrids and three
This publication from the Kansas State University Agricultural Experiment Station and Cooperative Extension Service has been archived. Current information is available from http://www.ksre.ksu.edu.
HC-24
plant populations in four replications. Pioneer
38H67, 35P12, and 33B51, representing
maturities of 97, 105, and 111 days to black
layer, respectively, were no-till planted at
approximately 26,000 seeds/a into moist soil on
March14, April 4, and April 16. Weeds were
controlled with a March 11 application of 1.67
lb/a atrazine 90DF + 22 oz/a Roundup Ultra
Max II + 1.7 lb/a AMSU + 1 qt/a crop oil
concentrate, followed by 1.6 pt/a Dual II
Magnum broadcast 8 days later. Corn was hand
thinned to specified populations of 14,000,
18,000, and 22,000 plants/a. Evaluations
included maturity, plant height, lodging, ear
number, yield, and grain test weight. Plots were
combine harvested on September 2.
Results
Rainfall totaled 3.01, 0.88, and 0.39 inches
during the first 10 days after the respective
planting dates. Corresponding intervals from
planting to emergence were 25, 12, and 7 days.
Averaged across planting date, plant
populations before hand thinning were 94 to
97% of the planting rate. Low temperatures of
31 oF on April 24 and 30, as well as 30 oF on
May 2, caused some corn leaf injury but did not
affect stands. Mean temperatures were about 1oF cooler than normal in April, normal in May,
and slightly above normal in June. In July and
August, average temperatures were 2.1 to 2.7 oF
below normal. During these months, there were
only 2 days with temperatures at or above 100oF. Rainfall was well below normal in April,
nearly 1 inch above normal in May, and
dominated the first seventeen days of June. July
rainfall was somewhat below normal, resulting
in periods of limited drought stress. August
brought abundant rains, mainly in the second
half of the month as corn approached maturity.
Length of time to reach half-silk stage
increased with early planting and hybrid
maturity but, on average, was not affected by
plant populations. March 14 and April 4
planting dates delayed silking by 25 and 8 days
versus April 16 planting (Table 10). Average
hybrid differences in silking date ranged from 2
to 4 days.
Corn yields were significantly affected by
planting date, hybrid, and plant population.
Among the possible two-way interactions
between these treatment variables, only planting
date x hybrid was significant. Corn yield
averaged 106, 100, and 95 bu/a when planted on
March14, April 4, and April 16, respectively.
Average yields for 38H67, 35P12, and 33B51
were 95, 98, and 108 bu/a. Plant populations of
14,000, 18,000, and 22,000 produced an average
of 90, 100, and 110 bu/a. Yields of all hybrids
were maximized by the earliest planting and
declined with succeeding planting dates. At the
last planting date, yield of 38H67 was reduced
5.6 to 8.6 bu/a more than that of 35P12 and
33B51, respectively. Highest yield of 124 bu/a
occurred with 33B51 planted on March 14 with
a population of 22,000.
Test weights averaged 58.2 lb/bu. Although
treatment main effects on test weight were
significant, the differences were relatively small.
Planting date was the most influential, with the
earliest plantings resulting in slightly higher test
weights than the mid-April planting. Number of
ears/plant was higher (1.08) with the March 14
planting than with the other planting dates,
decreased with the later-maturing hybrids, and
also declined with increasing plant population.
Plant heights were not affected by planting date
or plant population, but increased by 4 to 5
inches with later-maturing hybrids. Treatment
effects on lodging were substantial. The April
16 planting averaged 33% lodging, three times
greater than the earlier plantings. Hybrids 35P12
and 33B51 averaged 23% lodging, versus 7%
with 38H67. Successive increases in plant
population increased lodging significantly.
This publication from the Kansas State University Agricultural Experiment Station and Cooperative Extension Service has been archived. Current information is available from http://www.ksre.ksu.edu.

HC-25
Table 10. Dryland no-till corn hybrid response to planting date and plant populations, Harvey County Experiment
Field, Hesston, KS, 2005.
Planting1
Date Hybrid2
Plant
Popu-
lation
Yield3
Mois-
ture
Bu
Wt
Ears/
Plant
Days
to
Silk4
Plant
Ht
Lodg-
ing2005 2004
no./a ------bu/a------ % lb/bu inches %
March 14 38H67 14,000 92 100 13.1 57.9 1.38 95 79 5
18,000 103 110 13.4 58.0 1.22 94 79 4
22,000 112 112 13.1 57.7 1.07 95 81 5
35P12 14,000 92 108 13.3 58.3 1.03 96 86 4
18,000 105 121 13.8 58.3 1.03 96 84 14
22,000 114 127 13.1 58.8 1.00 96 86 28
33B51 14,000 98 121 14.2 58.3 1.04 98 90 4
18,000 113 135 14.3 58.9 0.97 98 89 10
22,000 124 142 13.6 59.3 0.99 99 86 26
April 4 38H67 14,000 84 127 13.4 58.4 1.07 77 80 1
18,000 98 119 13.3 58.5 1.00 77 82 2
22,000 107 130 13.1 58.2 0.99 77 83 3
35P12 14,000 86 111 13.3 58.8 1.01 79 85 4
18,000 98 127 13.8 59.2 0.99 79 86 18
22,000 106 137 13.5 59.3 0.98 79 86 25
33B51 14,000 102 134 13.6 58.4 1.05 81 87 3
18,000 105 141 13.9 58.1 1.00 81 86 13
22,000 114 146 13.5 58.6 1.00 81 86 24
April 16 38H67 14,000 77 112 13.0 57.9 1.11 68 84 9
18,000 83 124 13.0 57.9 0.97 68 85 15
22,000 100 132 13.2 58.1 0.95 68 83 22
35P12 14,000 86 117 13.4 58.0 1.04 71 84 27
18,000 95 137 13.7 58.3 0.98 71 84 54
22,000 99 144 13.8 58.0 0.95 71 82 54
33B51 14,000 96 129 14.3 56.2 1.01 73 85 10
18,000 103 150 14.1 56.8 0.96 73 84 33
22,000 115 164 14.1 58.0 0.97 73 84 67
LSD .05 Means in same DOP4
Means in different DOP
7.5
8.1
8.5
10.5
0.64
0.78
0.80
0.83
0.05
0.06
0.7
1.1
3
4
14
18
DOP*Hybrid5 0.04 0.004 0.06 0.0001 0.0001 0.01 0.0001 0.01
DOP*Population6 NS 0.001 NS NS 0.02 NS NS 0.01
Hybrid*Population7 NS 0.002 NS 0.02 0.0001 NS NS 0.0001
(cont. next page)
This publication from the Kansas State University Agricultural Experiment Station and Cooperative Extension Service has been archived. Current information is available from http://www.ksre.ksu.edu.
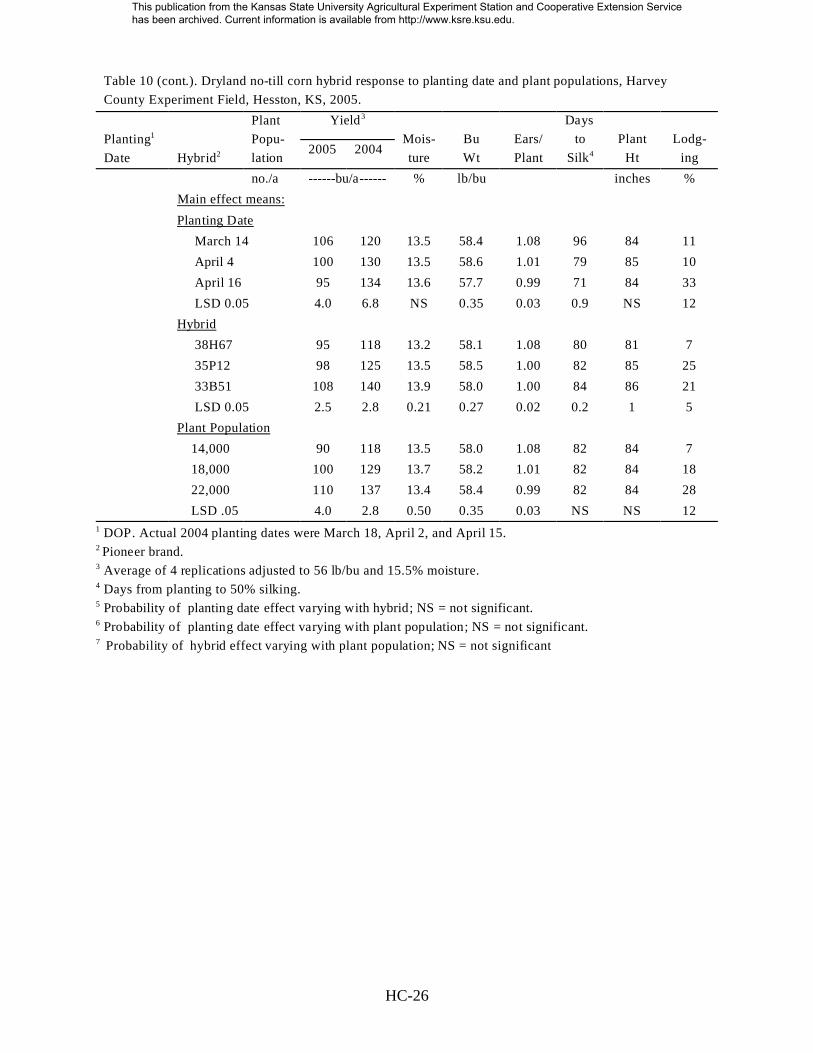
HC-26
Table 10 (cont.). Dryland no-till corn hybrid response to planting date and plant populations, Harvey
County Experiment Field, Hesston, KS, 2005.
Planting1
Date Hybrid2
Plant
Popu-
lation
Yield3
Mois-
ture
Bu
Wt
Ears/
Plant
Days
to
Silk4
Plant
Ht
Lodg-
ing2005 2004
no./a ------bu/a------ % lb/bu inches %
Main effect means:
Planting Date
March 14 106 120 13.5 58.4 1.08 96 84 11
April 4 100 130 13.5 58.6 1.01 79 85 10
April 16 95 134 13.6 57.7 0.99 71 84 33
LSD 0.05 4.0 6.8 NS 0.35 0.03 0.9 NS 12
Hybrid
38H67 95 118 13.2 58.1 1.08 80 81 7
35P12 98 125 13.5 58.5 1.00 82 85 25
33B51 108 140 13.9 58.0 1.00 84 86 21
LSD 0.05 2.5 2.8 0.21 0.27 0.02 0.2 1 5
Plant Population
14,000 90 118 13.5 58.0 1.08 82 84 7
18,000 100 129 13.7 58.2 1.01 82 84 18
22,000 110 137 13.4 58.4 0.99 82 84 28
LSD .05 4.0 2.8 0.50 0.35 0.03 NS NS 12
1 DOP. Actual 2004 planting dates were March 18, April 2, and April 15. 2 Pioneer brand. 3 Average of 4 replications adjusted to 56 lb/bu and 15.5% moisture.4 Days from planting to 50% silking.5 Probability of planting date effect varying with hybrid; NS = not significant.6 Probability of planting date effect varying with plant population; NS = not significant.7 Probability of hybrid effect varying with plant population; NS = not significant
This publication from the Kansas State University Agricultural Experiment Station and Cooperative Extension Service has been archived. Current information is available from http://www.ksre.ksu.edu.
HC-27
SOYBEAN FOR FORAGE
M.M. Claassen
Summary
Four grain-type soybean varieties from
maturity groups III to VII and nine forage-type
lines or varieties from maturity groups V to
VII were grown under no-till conditions to
evaluate their utility for forage production.
Soybean was planted in early June after a wet
weather delay. Although not totally devoid of
moisture stress, the growing season was
sufficiently favorable for soybean to produce
the highest dry matter yields obtained over the
last three years. Forage soybean reached a
maximum of 61 inches, and averaged 15
inches taller than grain-type soybean in the
same maturity groups. Forage variety Derry
produced the highest yield of 3.24 tons/a of
dry matter. Other entries in the top yield group
were Hutcheson, 97 VA 5, SG 13 #53, Tyrone
and XB 32 with dry matter yields of 2.88 to
3.11 tons/a. As a group, forage types produced
0.36 tons/a more than the grain-type varieties.
Hutcheson, a grain-type soybean, yielded
more than all forage types except Derry. These
two varieties also had the highest total N
yields, 144 to 152 lb/a.
Introduction
Soybean represents a potentially valuable
alternative crop for growers in central and
south-central Kansas. It can provide helpful
broadleaf and legume diversity to adapted
crop rotations that typically emphasize wheat
and grain sorghum. Such diversity aids in the
disruption of pest cycles. Particularly
attractive is the ease with which wheat can be
no-till planted into soybean stubble after late
summer or early fall harvest. But the
economics of soybean production can be
difficult in a full-season or double-crop setting
when summer drought stress results in low
yield and poor grain quality. Little attention
has been given to the potential for soybean as
a forage crop in this area of the state. This
investigation was initiated in 2003 to
determine the forage production
characteristics of several grain-type and
forage-type soybean varieties.
Procedures
The experiment site was located on Irwin
silty clay loam and had been cropped to wheat
in 2004. Four grain-type soybean varieties
from maturity groups III to VII and nine
forage types from maturity groups V to VII
were no-till planted in four, 30-inch rows per
plot on June 7 and 8, 2005, at 137,000 seeds/a.
Five of the forage-type soybean entries were
experimental lines obtained via the USDA
forage soybean breeding program at Beltsville,
Maryland. Of these, XB 32, 7P116, and 97
VA 5 were evaluated for the first time here in
2004; 8GH 85-2 and SG 13 #53 were new
entries in 2005. Weeds were controlled with a
May 20 application of 22 oz/a Roundup
Original Max + 1.33 oz/a 2,4-DLVE 6EC + 0.77
lb/a AMSU and a subsequent application of
22 oz/a Roundup Original Max + 1.66 pt/a
Dual II Magnum + 4 oz/a Sencor5 75 DF + 1.3
lb/a AMSU immediately after planting. To
determine forage yield, subplot areas were
hand harvested at a height of three inches
above the soil surface when the most mature
5 Sencor is a registered trademark of Bayer.
This publication from the Kansas State University Agricultural Experiment Station and Cooperative Extension Service has been archived. Current information is available from http://www.ksre.ksu.edu.
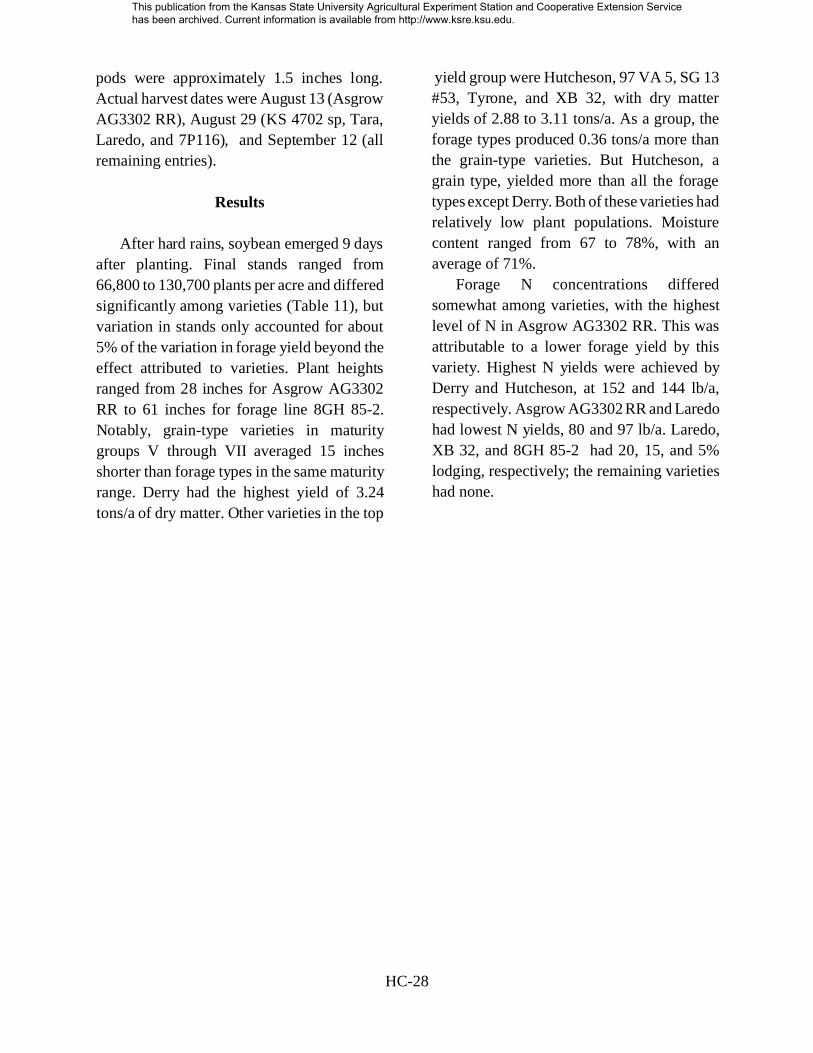
HC-28
pods were approximately 1.5 inches long.
Actual harvest dates were August 13 (Asgrow
AG3302 RR), August 29 (KS 4702 sp, Tara,
Laredo, and 7P116), and September 12 (all
remaining entries).
Results
After hard rains, soybean emerged 9 days
after planting. Final stands ranged from
66,800 to 130,700 plants per acre and differed
significantly among varieties (Table 11), but
variation in stands only accounted for about
5% of the variation in forage yield beyond the
effect attributed to varieties. Plant heights
ranged from 28 inches for Asgrow AG3302
RR to 61 inches for forage line 8GH 85-2.
Notably, grain-type varieties in maturity
groups V through VII averaged 15 inches
shorter than forage types in the same maturity
range. Derry had the highest yield of 3.24
tons/a of dry matter. Other varieties in the top
yield group were Hutcheson, 97 VA 5, SG 13
#53, Tyrone, and XB 32, with dry matter
yields of 2.88 to 3.11 tons/a. As a group, the
forage types produced 0.36 tons/a more than
the grain-type varieties. But Hutcheson, a
grain type, yielded more than all the forage
types except Derry. Both of these varieties had
relatively low plant populations. Moisture
content ranged from 67 to 78%, with an
average of 71%.
Forage N concentrations differed
somewhat among varieties, with the highest
level of N in Asgrow AG3302 RR. This was
attributable to a lower forage yield by this
variety. Highest N yields were achieved by
Derry and Hutcheson, at 152 and 144 lb/a,
respectively. Asgrow AG3302 RR and Laredo
had lowest N yields, 80 and 97 lb/a. Laredo,
XB 32, and 8GH 85-2 had 20, 15, and 5%
lodging, respectively; the remaining varieties
had none.
This publication from the Kansas State University Agricultural Experiment Station and Cooperative Extension Service has been archived. Current information is available from http://www.ksre.ksu.edu.

HC-29
Table 11. Soybean variety forage production, Harvey County Experiment Field, Hesston, Kansas, 2005.
Brand Variety
Matur-
ity
Group
Plant
Popula-
tion
Plant
Ht
Forage
Yield1 Lodg-
ing
Mois-
ture ----N----2005 2-yr2
1000's Inch ------ton/a------ % % lb/a
Grain-type
Asgrow AG3302 RR III 122.0 28 1.37 --- 0 78 2.91 80
Public KS 4702 sp IV 87.1 34 2.51 1.96 0 73 2.56 128
Public Hutcheson V 66.8 39 3.11 2.57 0 70 2.32 144
Asgrow AG7601 RR VII 106.0 41 2.63 --- 0 67 2.26 119
Forage-type3
Public Tara IV 68.2 56 2.43 --- 0 74 2.08 101
Public Laredo --- 103.1 52 2.12 2.00 20 74 2.29 97
Public Derry VI 81.3 53 3.24 2.62 0 69 2.36 152
Public Tyrone VII 119.1 55 2.93 2.68 0 70 1.94 113
Public XB 32 V 130.7 53 2.88 2.74 15 69 2.10 121
Public 7P116 VI 92.9 52 2.54 2.41 0 74 2.32 118
Public 8GH 85-2 VI 106.0 61 2.68 --- 5 68 2.18 116
Public SG 13 #53 VII 97.3 60 2.92 --- 0 68 2.00 117
Public 97 VA 5 VII 113.3 59 3.09 2.74 0 70 2.04 126
LSD .05 31.3 3 0.42 --- 3 2 0.21 19
Main effect means for soybean type:
Grain 95.5 35 2.40 --- 0 72 2.51 118
Forage 101.3 55 2.76 --- 4 71 2.14 118
LSD .05 NS 2 0.21 --- 3 NS 0.09 NS
1 Dry matter yield.2 2004 and 2005.3 None of the forage-type soybean varieties have the Roundup Ready® trait.
This publication from the Kansas State University Agricultural Experiment Station and Cooperative Extension Service has been archived. Current information is available from http://www.ksre.ksu.edu.

HC-30
HERBICIDES FOR WEED CONTROL IN CORN
M.M. Claassen
Summary
Nineteen herbicide treatments were
evaluated for crop tolerance and weed control
efficacy in corn, with focus on application
timing effects of mesotrione (Callisto6)- and
glyphosate (Roundup and Touchdown)-based
products. Weed competition consisted of
dense large crabgrass and moderate Palmer
amaranth and domestic sunflower populations.
All treatments involving mesotrione-based
products as well as Bicep II Magnum
preemergence were highly effective in
controlling large crabgrass and Palmer
amaranth. Early control of domestic sunflower
was superior with mesotrione-based products.
Roundup Ultra Max II was effective on all
species, and time of application was not
significant in the control of Palmer amaranth
and domestic sunflower. However, single
applications of Roundup Ultra Max II alone
tended to give slightly less control of Palmer
amaranth. Also, Roundup Ultra Max II tended
to be more effective on large crabgrass with
delayed application.
Corn showed no injury symptoms of
consequence. All herbicide treatments
significantly increased corn yields by an
average of 42 bu/a in comparison with the
untreated check. Yield differences among
herbicide treatments were not significant. The
herbicide treatments represented a wide range
of input cost.
Introduction
In recent years, Callisto has been one of
the newer herbicides to join the arsenal of
herbicides available to corn growers. Premix
options with Callisto include Camix , Lumax
and Lexar. Camix contains 3.34 lb S-
metolachlor (Dual II Magnum) + 0.33 lb
mesotrione/gal; Lumax contains 2.68 lb S-
metolachlor + l lb atrazine + 0.268 lb
mesotrione/gal. Lexar has 1.74 lb S-
metolachlor + l.74 lb atrazine + 0.224 lb
mesotrione/gal. This experiment evaluated
weed control with mesotrione based
preemergence and postemergence treatments
for broad spectrum weed control in
combination with and in comparison with
glyphosate products applied at different stages
of crop and weed development.
Procedures
Winter wheat was grown on the
experiment site in 2004. Soil was a Geary silt
loam with pH 6.3 and 2.0% organic matter.
The site was maintained without tillage until
preparations for this experiment commenced
just before planting. A mulch treader and field
cultivator were used to prepare the seedbed
and incorporate Palmer amaranth and large
crabgrass seed that was broadcast over the
area to enhance the uniformity of weed
populations. Domestic sunflower also was
planted across all plots in 30-inch rows. Corn
was fertilized with 125 lb N and 37 lb P2O5/a.
NC+ 4574RB was planted into moist soil at
6 Callisto, Touchdown, Bicep, Camix, Lumax, and
Lexar are registered trademarks of Syngenta.
This publication from the Kansas State University Agricultural Experiment Station and Cooperative Extension Service has been archived. Current information is available from http://www.ksre.ksu.edu.

HC-31
approximately 18,700 seeds/a in 30-inch rows
on April 20, 2005. Seedbed condition was
excellent. All herbicides were broadcast in 15
gal/a of water, with three replications per
treatment (Table 12). Preemergence (PRE)
applications were made shortly after planting
with AI TeeJet 110025-VS nozzles at 30 psi.
E a r l y p o s t e m e r g e n c e ( E P O S T ) ,
postemergence (POST), and late
postemergence (LPOST) treatments were
applied with Greenleaf TurboDrop TDXL025
venturies in combination with Turbo Tee
11005 nozzles at 30 psi on May 20, May 28
and June 6, respectively. On these dates, large
crabgrass was 0.5 to 2 inches, 0.5 to 3 inches,
and 1 to 7 inches in height. Palmer amaranth
was 0.5 to 1.5 inches, 1 to 6 inches, and 3 to
16 inches. Domestic sunflower was 3 to 5
inches, 5 to 10 inches, and 13 to 18 inches,
respectively. Plots were not cultivated. Crop
injury and weed control were rated several
times during the growing season. Corn was
harvested on September 12, 2005.
Results
Corn emerged in 14 days. During the first
10 days after planting and preemergence
herbicide application, rainfall totaled 0.44
inch. Significant rains occurred during the
week before each of the respective
postemergence treatments. Corn reached the
early-silking stage at the end of June. None of
the herbicides caused any corn injury.
Dense populations of large crabgrass
developed, along with moderate populations
of Palmer amaranth and domestic sunflower.
Large crabgrass control was excellent to
perfect throughout the growing season with all
preemergence herbicides. Roundup Ultra Max
II tended to be more efficacious with delay in
time of application. This timing effect was
significant, with excellent, good, and fair
control of large crabgrass with late
postemergence, postemergence, and early
postemergence applications, respectively.
Camix, Lexar, Lumax, and Harness7 Xtra
preemergence totally controlled Palmer
amaranth at the evaluation in late May. Bicep
II Magnum also gave excellent, but slightly
less, initial Palmer amaranth control. All
treatments provided excellent season-long
Palmer amaranth control, but single
applications of Roundup Ultra Max II alone
resulted in slightly less control. Effect of
Roundup time of application on Palmer
amaranth was not significant.
Initial sunflower control in late May was
excellent after application of Camix, Lexar,
and Lumax; fair to good with Bicep II
Magnum; and generally poor with Harness
Xtra preemergence. Postemergence
components of treatments resulted in perfect,
full-season control of sunflower in all cases.
Roundup Ultra Max II was equally effective
at all times of application.
Dryland corn yields were very good for
this location. Herbicide treatments increased
corn yields by an average of 42 bu/a. Yield
differences among these treatments tended not
to be significant. Corn test weights did not
reflect any significant herbicide effect.
The costs of the herbicide treatments
differed substantially, ranging from $15.85 to
$39.34/a.
7 Harness is a registered trademark of Monsanto.
This publication from the Kansas State University Agricultural Experiment Station and Cooperative Extension Service has been archived. Current information is available from http://www.ksre.ksu.edu.

HC-32
Table 12. Weed control in corn, Harvey County Experiment Field, Hesston, Kansas, 2005.
Herbicide Treatment 1Product
Timing2
Injury
5/30
Lacg3
Control
9/12
Paam4
Control
9/12
Dosf5
Control
9/12 Yield Cost6Form Rate/a Unit
% % % % bu/a $/a
1 Lumax 3.94 SE 2.5 qt PRE 0 100 99 100 96 26.77
2 Lumax + 3.94 SE 2.5 qt PRE 0 100 100 100 101 29.31
AAtrex 4 L 1 qt PRE
3 Lexar 3.7 SE 3 qt PRE 0 100 100 100 109 25.19
4 Lexar + 3.7 SE 3 qt PRE 0 100 99 100 92 29.20
Princep 4 L 1 qt PRE
5 Camix + 3.67 SE 1.6 qt EPOST 0 100 100 100 102 35.33
Touchdown Total + 4.17 SL 24 fl oz EPOST
AMSU 2.5 lb EPOST
6 Lumax + 3.94 SE 2 qt EPOST 0 100 100 100 108 33.74
Touchdown Total + 4.17 SL 24 fl oz EPOST
AMSU 2.5 lb EPOST
7 Lexar + 3.7 SE 2.26 qt EPOST 0 100 100 100 96 31.48
Touchdown Total + 4.17 SL 24 fl oz EPOST
AMSU 2.5 lb EPOST
8 Camix 3.67 SE 1.6 qt PRE 0 100 99 100 114 39.34
Touchdown Total + 4.17 SL 24 fl oz POST
AMSU 2.5 lb POST
9 Lumax 3.94 SE 2 qt PRE 0 100 99 100 102 37.75
Touchdown Total + 4.17 SL 24 fl oz POST
AMSU 2.5 lb POST
10 Lexar 3.7 SE 2.26 qt PRE 0 100 99 100 103 35.49
Touchdown Total + 4.17 SL 24 fl oz POST
AMSU 2.5 lb POST
11 Dual II Magnum 7.6 EC 1.33 pt PRE 0 99 99 100 101 35.73
Callisto + 4 SC 3 fl oz POST
AAtrex + 4 L 0.5 qt POST
COC + 1 % v/v POST
UAN 2.5 % v/v POST
12 Bicep II Magnum 5.5 SC 2.1 qt PRE 0 100 100 100 103 38.51
Callisto + 4 SC 3 fl oz POST
AAtrex + 4 L 0.5 qt POST
COC + 1 % v/v POST
UAN 2.5 % v/v POST
(cont. next page)
This publication from the Kansas State University Agricultural Experiment Station and Cooperative Extension Service has been archived. Current information is available from http://www.ksre.ksu.edu.
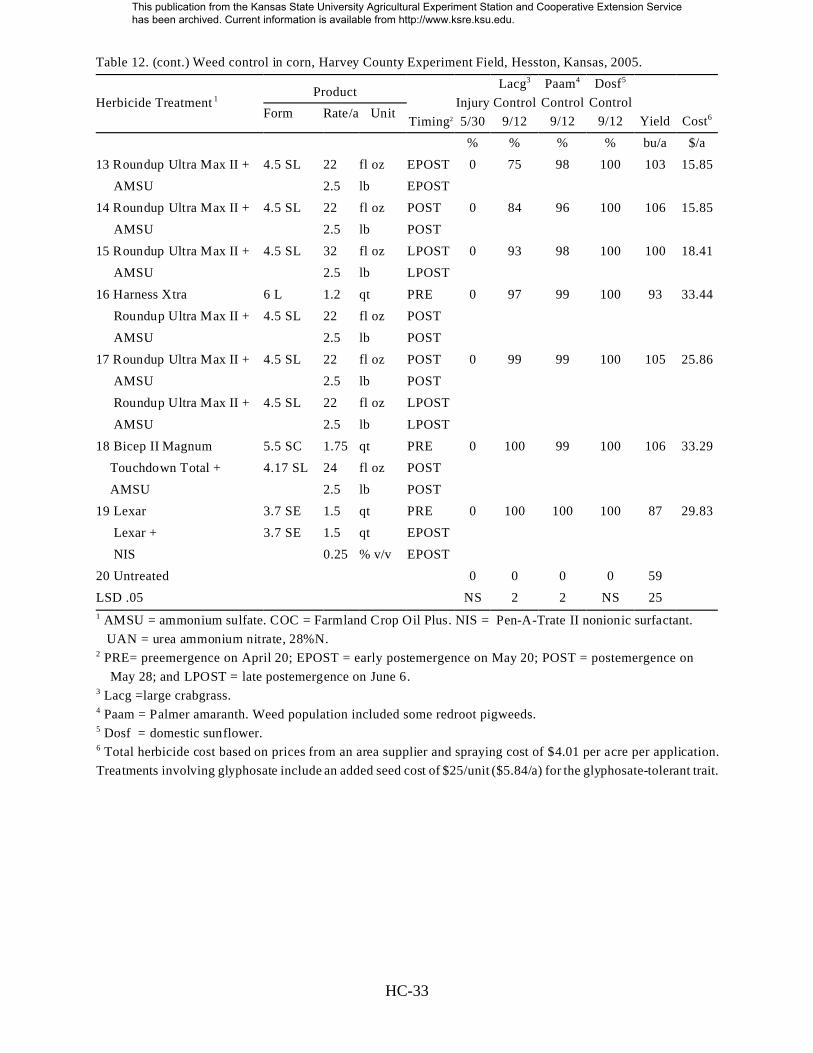
HC-33
Table 12. (cont.) Weed control in corn, Harvey County Experiment Field, Hesston, Kansas, 2005.
Herbicide Treatment 1Product
Timing2
Injury
5/30
Lacg3
Control
9/12
Paam4
Control
9/12
Dosf5
Control
9/12 Yield Cost6Form Rate/a Unit
% % % % bu/a $/a
13 Roundup Ultra Max II + 4.5 SL 22 fl oz EPOST 0 75 98 100 103 15.85
AMSU 2.5 lb EPOST
14 Roundup Ultra Max II + 4.5 SL 22 fl oz POST 0 84 96 100 106 15.85
AMSU 2.5 lb POST
15 Roundup Ultra Max II + 4.5 SL 32 fl oz LPOST 0 93 98 100 100 18.41
AMSU 2.5 lb LPOST
16 Harness Xtra 6 L 1.2 qt PRE 0 97 99 100 93 33.44
Roundup Ultra Max II + 4.5 SL 22 fl oz POST
AMSU 2.5 lb POST
17 Roundup Ultra Max II + 4.5 SL 22 fl oz POST 0 99 99 100 105 25.86
AMSU 2.5 lb POST
Roundup Ultra Max II + 4.5 SL 22 fl oz LPOST
AMSU 2.5 lb LPOST
18 Bicep II Magnum 5.5 SC 1.75 qt PRE 0 100 99 100 106 33.29
Touchdown Total + 4.17 SL 24 fl oz POST
AMSU 2.5 lb POST
19 Lexar 3.7 SE 1.5 qt PRE 0 100 100 100 87 29.83
Lexar + 3.7 SE 1.5 qt EPOST
NIS 0.25 % v/v EPOST
20 Untreated 0 0 0 0 59
LSD .05 NS 2 2 NS 25
1 AMSU = ammonium sulfate. COC = Farmland Crop Oil Plus. NIS = Pen-A-Trate II nonionic surfactant.
UAN = urea ammonium nitrate, 28%N.2 PRE= preemergence on April 20; EPOST = early postemergence on May 20; POST = postemergence on
May 28; and LPOST = late postemergence on June 6. 3 Lacg =large crabgrass.
4 Paam = Palmer amaranth. Weed population included some redroot pigweeds. 5 Dosf = domestic sunflower.6 Total herbicide cost based on prices from an area supplier and spraying cost of $4.01 per acre per application.
Treatments involving glyphosate include an added seed cost of $25/unit ($5.84/a) for the glyphosate-tolerant trait.
This publication from the Kansas State University Agricultural Experiment Station and Cooperative Extension Service has been archived. Current information is available from http://www.ksre.ksu.edu.

i
TABLE OF CONTENTS
Irrigation and North Central Kansas Experiment FieldsIntroduction ................................................................................................................. NC-1Soil Description .......................................................................................................... NC-12004 Weather Information .......................................................................................... NC-1
Use of Strip Tillage for Corn Production in Kansas ............................................................... NC-2
Use of Foliar Potassium for Soybean Production in Reduced-tillage Systems ....................... NC-9
Controlled-release Urea for Irrigated Corn Production ......................................................... NC-11
Maximizing Irrigated Soybean Yields in the Great Plains .................................................... NC-14
Manganese Nutrition of Glyphosate-resistant and Conventional Soybean ........................... NC-17
Management Systems for Grain Sorghum Production Under Drylandand Irrigated Conditions ............................................................................................ NC-20
EXPERIMENT FIELD PERSONNEL
W.B. Gordon, Agronomist-in-ChargeMike R. Larson, Plant Science TechnicianA. Dean Milner, Plant Science Technician
This publication from the Kansas State University Agricultural Experiment Station and Cooperative Extension Service has been archived. Current information is available from http://www.ksre.ksu.edu.

NC-1
IRRIGATION AND NORTH CENTRAL KANSAS EXPERIMENT FIELDS
Introduction
The 1952 Kansas legislature provided a special appropriation to establish the IrrigationExperiment Field to serve expanding irrigation development in north-central Kansas. The original35-acre field was located 9 miles northwest of Concordia. In 1958, the field was relocated to itspresent site on a 160-acre tract near Scandia in the Kansas-Bostwick Irrigation District. Water issupplied by the Miller canal and stored in Lovewell Reservior in Jewell County, Kansas, and HarlanCounty Reservoir at Republican City, Nebraska. In 2001, a linear sprinkler system was added on a32-acre tract 2 miles south of the present Irrigation Field. In 2002 there were 125,000 acres ofirrigated cropland in north-central Kansas. Current research on the field focuses on managingirrigation water and fertilizer in reduced-tillage and crop-rotation systems.
The 40-acre North Central Kansas Experiment Field, located 2 miles west of Belleville, wasestablished on its present site in 1942. The field provides information on factors that allow fulldevelopment and wise use of natural resources in north-central Kansas. Current research emphasisis on fertilizer management for reduced-tillage crop production and management systems fordryland, corn, sorghum, and soybean production.
Soil Description
The predominant soil type on both fields is a Crete silt loam. The Crete series consists of deep,well-drained soils that have a loamy surface underlain by a clayey subsoil. These soils developedin loess on nearly level to gently undulating uplands. The Crete soils have slow to medium runoffand slow internal drainage and permeability. Natural fertility is high. Available water holdingcapacity is approximately 0.19 inches of water per inch of soil.
2005 Weather Information
Table 1. Climatic data for the North Central Kansas Experiment Fields.
Rainfall, inches Temperature, 0F Growth Units
Scandia Belleville Average Daily Mean Avg Mean 2005 Average
2005 2005 30-year 2006
April 4.2 4.3 2.3 54 52 263 217
May 1.8 1.6 3.7 63 63 454 421
June 5.3 5.1 4.6 75 73 702 679
July 7.1 5.7 3.4 78 78 788 807
August 4.8 4.2 3.4 75 77 728 780
Sept 0.3 0.3 3.6 71 68 628 538
Total 23.5 21.2 20.9 3563 3442
This publication from the Kansas State University Agricultural Experiment Station and Cooperative Extension Service has been archived. Current information is available from http://www.ksre.ksu.edu.
NC-2
USE OF STRIP TILLAGE FOR CORN PRODUCTION IN KANSAS
W.B. Gordon
Summary
Conservation-tillage production systemsare being used by an increasing number ofproducers. Early-season plant growth andnutrient uptake can be poorer in no-till than inconventional-tillage systems. Strip tillage mayoffer many of the soil-saving advantages ofthe no-till system while establishing a seed-bed that is similar to that of conventionaltillage. Field studies were conducted atBelleville, Kansas, to compare theeffectiveness of strip tillage and no-till, and toassess the effects of fall versus springapplications of N-P-K-S fertilizer on growth,nutrient uptake, and yield of corn.
The 2003 growing season wascharacterized by rainfall that was considerablyless than normal. Corn yields were severelyreduced by the hot, dry conditions. Eventhough grain yields were low, strip tillageimproved early-season growth and nutrientuptake of corn. Strip tillage shortened the timefrom emergence to mid-silk by 7 days andalso reduced grain moisture content at harvest.Strip tillage plots yielded 15 bu/a more thanno-till plots did. In 2004, the growing seasonwas nearly ideal, except for an early-seasonhail storm that reduced plant population.Yields were very good, and the use of striptillage increased yields by 16 bu/a over yieldsof no-till corn. Soil temperature wasconsistently warmer in strip tillage than in no-till in both 2003 and 2004. A very hot, dryperiod occurred in late June and early July in2005, but this period was followed by veryfavorable growing conditions, and yields weregood. When averaged over fertility treatment,strip-tillage corn yielded 12 bu/a greater thanno-till corn.
In all three years of the experiment, yield,early-season growth, and number of daysfrom emergence to mid-silk were greatly
improved in strip tillage, compared with no-till. Fall fertilization was as effective as springfertilization. Strip tillage seems to be anattractive alternative to no-till for Great Plainsproducers.
Introduction
Production systems that limit tillage arebeing used by an increasing number ofproducers in the central Great Plains becauseof several inherent advantages. These includereduction of soil erosion losses, increased soilwater-use efficiency, and improved soilquality. But early-season plant growth can bepoorer in reduced-tillage systems than inconventional systems. The large amount ofsurface residue present in a no-till system canreduce seed-zone temperatures. Lower-than-optimum soil temperature can reduce the rateof root growth and nutrient uptake by plants.Soils can also be wetter in the early springwith no-till systems. Wet soils can delayplanting. Early-season planting is done so thatsilking can occur when temperature andrainfall are more favorable. Strip tillage mayprovide an environment that preserves thesoil- and nutrient-saving advantages of no-till,while establishing a seed bed that is similar tothat of conventional tillage. The objectives ofthis experiment were to compare theeffectiveness of strip tillage and no-till, and toassess the effects of fall, spring, or splitapplications of N-P-K-S fertilizer on growth,grain yield, and nutrient uptake of corn grownin strip-till or no-till systems.
Procedures
This experiment was conducted at theNorth Central Kansas Experiment Farm nearBelleville on a Crete silt loam soil to compare
This publication from the Kansas State University Agricultural Experiment Station and Cooperative Extension Service has been archived. Current information is available from http://www.ksre.ksu.edu.
NC-3
strip-till and no-till systems for dryland cornproduction. Fertilizer treatments consisted of40, 80, or 120 lb/a N with 30 lb/a P2O5, 5 lb/aK2O, and 5 lb/a S. An unfertilized check plotalso was included. In the strip-tillage system,fertilizer was either applied in the fall at thetime of tilling or in the spring at planting.Fertilizer was applied in the spring at plantingin the no-till system. Strip tillage was done inwheat stubble in early October in both yearsof the study. The zone receiving tillage was 5to 6 inches wide. Fertilizer was placed 5 to 6inches below the soil surface in the fall withthe strip-tillage system. Spring-appliedfertilizer was placed 2 inches to the side and2 inches below the seed at planting. Nutrientswere supplied as 28% UAN, ammoniumpolyphosphate (10-34-0), and potassiumthiosulfate. Corn was planted in early April inall three years of the experiment. Soil testphosphorus, potassium, and sulfur were in the“high” category.
Results
Because the growing season was very dryin 2003, grain yields were very low, andresponse to applied N was variable. Striptillage improved early-season growth, nutrientuptake, and grain yield of corn, comparedwith no-till (Table 2). When averaged overfertility treatments, strip-tilled plots reachedmid-silk 7 days earlier than no-till plots did.The early-season growth advantage seen inthe strip-tilled plots carried over all the way toharvest. Grain moisture in the strip-tilled plotswas 2.8% less than in no-till plots. In this verydry year, the yield advantage may have beenthe result of the increased rate of developmentin the strip-tillage system. The corn plantsreached the critical pollination period soonerin the strip-tilled plants, while some storedsoil water was still available. The soil waterreserve was depleted one week later when theplants in the no-till plots reached mid-silk. In2004, rainfall was above normal in May, June,and July. A hail storm in early June did reduceplant population by an average of 12%, but
surviving plants developed normally and grainyields were very good. When averaged overfertility treatments, strip-tilled plots yielded16 bu/a more than no-till plots yielded (Table3). As in 2003, early-season growth wasincreased, and days from emergence to mid-bloom were decreased, in the strip-tillagesystem. In 2005, weather was not as favorableduring corn pollination as in 2004. Late Juneand early July were hot and dry, but this wasfollowed by moderate temperatures and veryfavorable rainfall. Yields were still somewhatabove average in 2005. Grain yields againwere improved by the use of strip tillage(Table 4).
Soil temperature in the early growingseason was warmer in the strip-tillage systemthan in the no-till system in both 2003 and2004 (Figures 1 and 2). Soil temperaturedifferences between the two tillage systemspersisted into late May. Although final standdid not differ in the two tillage systems, plantemergence in the strip-tillage system reached100% three days sooner than in the no-tillsystem.
In all three years of the experiment, yieldsin the strip-tillage system were greater thanyields in no-till at all rates of applied fertilizer(Tables 5, 6, and 7). Under Kansas conditions,fall-applied fertilizer was as effective asspring-applied fertilizer (Tables 8, 9, and 10).Splitting fertilizer application did notsignificantly improve yields over applying allin either the spring or the fall (Tables 11, 12,and 13).
Strip tillage proved to be an effectiveproduction practice in both low- and high-yielding environments. Strip tillage doesprovide a better early-season environment forplant growth and development, while stillpreserving a large amount of residue on thesoil surface. This system may solve some ofthe major problems associated withconservation tillage, thus making it moreacceptable to producers.
This publication from the Kansas State University Agricultural Experiment Station and Cooperative Extension Service has been archived. Current information is available from http://www.ksre.ksu.edu.

NC-4
Table 2. Early-season growth, number of days from emergence to mid-silk, grain moisture atharvest, and yield of corn averaged over fertility treatments, Belleville, Kansas, 2003.
TreatmentV-6
Dry WeightEmergence to
Mid-silkHarvestMoisture Yield
lb/a days % bu/a
Strip Tillage 299 56 14.5 60
No Tillage 168 66 17.5 45
LSD (0.05) 20 3 1.2 7
Table 3. Early-season growth, number of days from emergence to mid-silk, grain moisture at harvestand yield of corn, averaged over fertility treatments, Belleville, Kansas, 2004.
TreatmentV-6
Dry Weight Emergence to
Mid-silkHarvestMoisture Yield
lb/a days % bu/a
Strip Tillage 421 55 13.8 160
No Tillage 259 66 16.2 144
LSD (0.05) 26 3 1.8 10
Table 4. Early-season growth, number of days from emergence to mid-silk, grain moisture at harvestand yield of corn, averaged over fertility treatments, Belleville, Kansas, 2005.
TreatmentV-6
Dry WeightEmergence to
Mid-silkHarvest Moisture Yield
lb/a days % bu/a
Strip Tillage 320 55 15.3 123
No Tillage 188 64 17.6 111
LSD (0.05) 21 2 1.9 9
This publication from the Kansas State University Agricultural Experiment Station and Cooperative Extension Service has been archived. Current information is available from http://www.ksre.ksu.edu.

NC-5
50
55
60
65
70
75
80
4/25/2005
4/30/2005
5/5/2005
5/10/2005
5/15/2005
5/20/2005
5/25/2005
5/30/2005
Deg
rees
F
Strip-till
No-till
45
50
55
60
65
70
75
4/28/2005
5/3/2005
5/8/2005
5/13/2005
5/18/2005
5/23/2005
5/28/2005
Deg
rees
F
Strip-tillNo-till
Figure 1. Soil temperature at planting depth, Belleville, Kansas, 2003.
Figure 2. Soil temperature at planting depth, Belleville, Kansas, 2004.
This publication from the Kansas State University Agricultural Experiment Station and Cooperative Extension Service has been archived. Current information is available from http://www.ksre.ksu.edu.

NC-6
Table 5. Corn grain yield as affected by tillage and spring-applied fertilizer, Belleville, Kansas,2003.
Fertilizer Grain Yield
Treatment Strip Till No Till
lb/a - - - - - - - - - - - bu/a - - - - - - - - - - -
40-30-5-5 52 45
80-30-5-5 60 48
120-30-5-5 71 51
Average 61 48
LSD (0.05) 5
Table 6. Corn grain yield as affected by tillage and spring-applied fertilizer, Belleville, Kansas,2004.
Fertilizer Grain Yield
Treatment Strip Till No Till
lb/a - - - - - - - - - - - bu/a - - - - - - - - - -
40-30-5-5 161 146
80-30-5-5 174 159
120-30-5-5 186 165
Average 174 157
LSD (0.05) 8
Table 7. Corn grain yield as affected by tillage and spring-applied fertilizer, Belleville, Kansas,2005.
Fertilizer Grain Yield
Treatment Strip Till No Till
lb/a - - - - - - - - - - - bu/a - - - - - - - - - - -
40-30-5-5 120 108
80-30-5-5 126 114
120-30-5-5 128 115
Average 125 112
LSD (0.05) 6
This publication from the Kansas State University Agricultural Experiment Station and Cooperative Extension Service has been archived. Current information is available from http://www.ksre.ksu.edu.
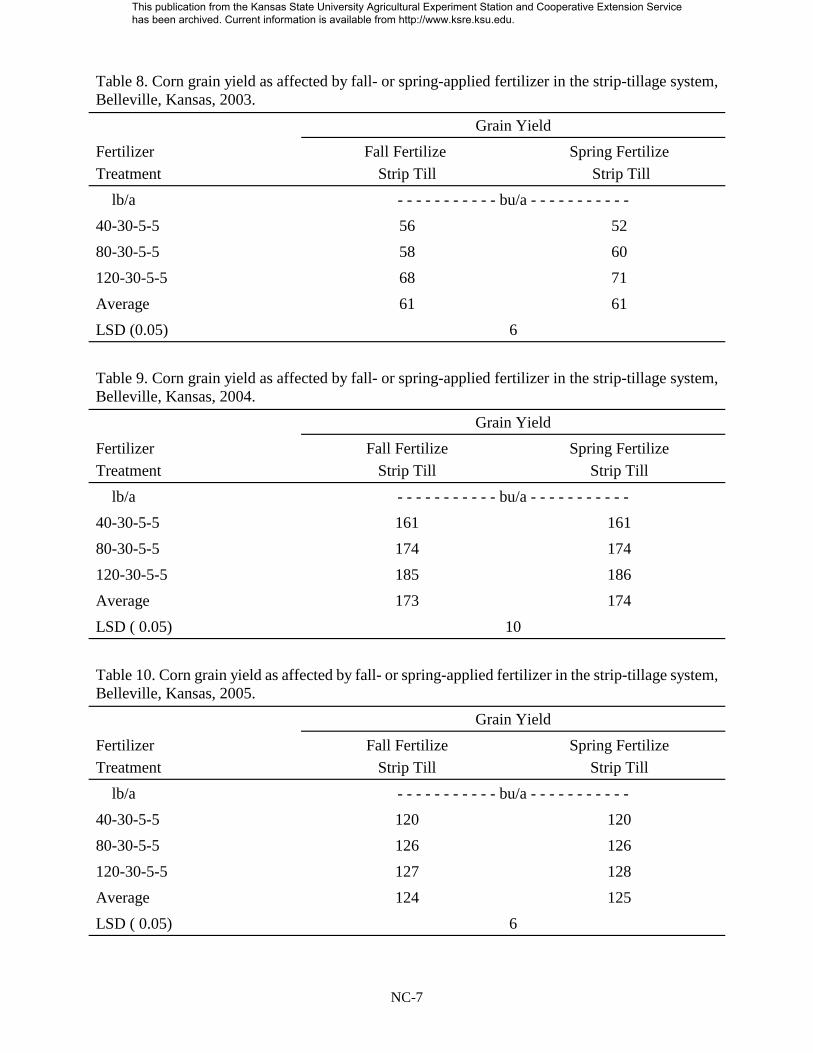
NC-7
Table 8. Corn grain yield as affected by fall- or spring-applied fertilizer in the strip-tillage system,Belleville, Kansas, 2003.
Grain Yield
FertilizerTreatment
Fall Fertilize Strip Till
Spring Fertilize Strip Till
lb/a - - - - - - - - - - - bu/a - - - - - - - - - - -
40-30-5-5 56 52
80-30-5-5 58 60
120-30-5-5 68 71
Average 61 61
LSD (0.05) 6
Table 9. Corn grain yield as affected by fall- or spring-applied fertilizer in the strip-tillage system,Belleville, Kansas, 2004.
Grain Yield
FertilizerTreatment
Fall FertilizeStrip Till
Spring FertilizeStrip Till
lb/a - - - - - - - - - - - bu/a - - - - - - - - - - -
40-30-5-5 161 161
80-30-5-5 174 174
120-30-5-5 185 186
Average 173 174
LSD ( 0.05) 10
Table 10. Corn grain yield as affected by fall- or spring-applied fertilizer in the strip-tillage system,Belleville, Kansas, 2005.
Grain Yield
FertilizerTreatment
Fall FertilizeStrip Till
Spring FertilizeStrip Till
lb/a - - - - - - - - - - - bu/a - - - - - - - - - - -
40-30-5-5 120 120
80-30-5-5 126 126
120-30-5-5 127 128
Average 124 125
LSD ( 0.05) 6
This publication from the Kansas State University Agricultural Experiment Station and Cooperative Extension Service has been archived. Current information is available from http://www.ksre.ksu.edu.
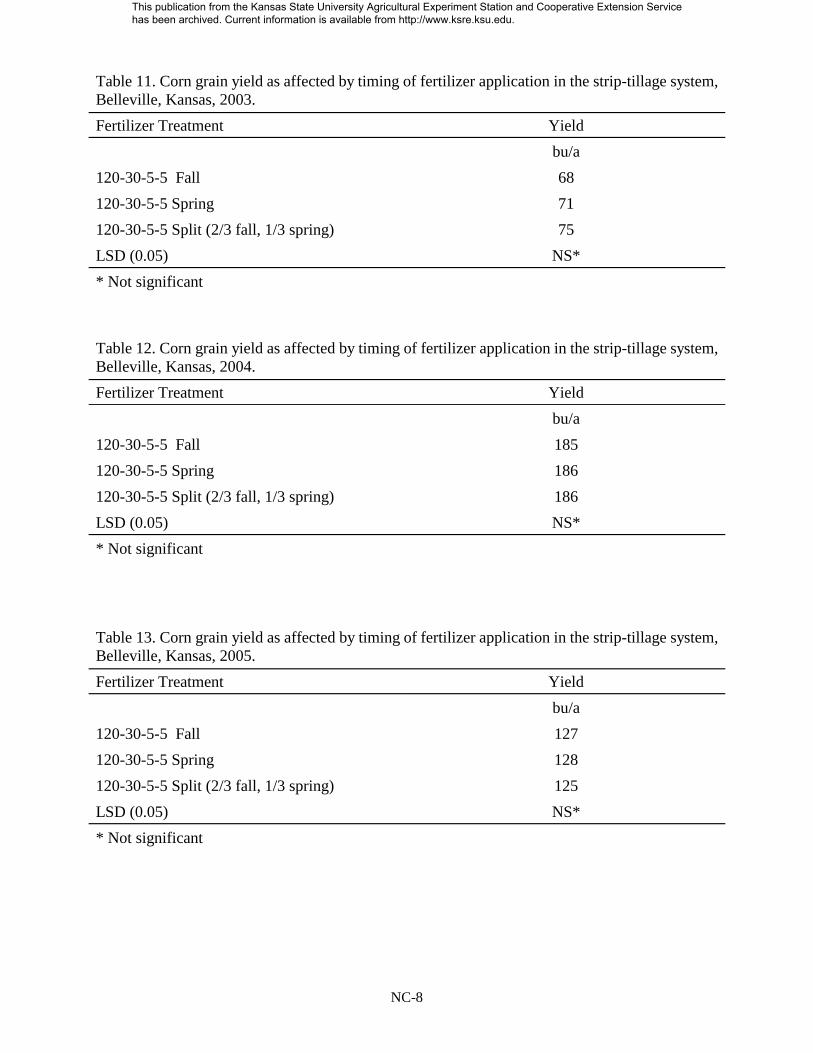
NC-8
Table 11. Corn grain yield as affected by timing of fertilizer application in the strip-tillage system,Belleville, Kansas, 2003.
Fertilizer Treatment Yield
bu/a
120-30-5-5 Fall 68
120-30-5-5 Spring 71
120-30-5-5 Split (2/3 fall, 1/3 spring) 75
LSD (0.05) NS*
* Not significant
Table 12. Corn grain yield as affected by timing of fertilizer application in the strip-tillage system,Belleville, Kansas, 2004.
Fertilizer Treatment Yield
bu/a
120-30-5-5 Fall 185
120-30-5-5 Spring 186
120-30-5-5 Split (2/3 fall, 1/3 spring) 186
LSD (0.05) NS*
* Not significant
Table 13. Corn grain yield as affected by timing of fertilizer application in the strip-tillage system,Belleville, Kansas, 2005.
Fertilizer Treatment Yield
bu/a
120-30-5-5 Fall 127
120-30-5-5 Spring 128
120-30-5-5 Split (2/3 fall, 1/3 spring) 125
LSD (0.05) NS*
* Not significant
This publication from the Kansas State University Agricultural Experiment Station and Cooperative Extension Service has been archived. Current information is available from http://www.ksre.ksu.edu.
NC-9
USE OF FOLIAR POTASSIUM FOR SOYBEAN PRODUCTION IN REDUCED-TILLAGE SYSTEMS
W.B. Gordon
Summary
Potassium (K) deficiency can be aproblem on soils that have been managed withreduced-tillage practices. The large amount ofresidue left on the soil surface can depress soiltemperature and interfere with plant growth,nutrient uptake, and, grain yield. Soiltemperature influences both K uptake by rootand K diffusion through the soil.
The appearance of K deficiency in fieldsmanaged with conservation-tillage systemshas been reported with greater frequency inrecent years and has become a concern forproducers. In this experiment, preplantbroadcast application of Trisert K+ (5-0-20-13) was compared with a planting-time starterapplication of Trisert-K+ and foliar applica-tion at three growth stages of soybean. Theexperimental area had been in a ridge-tillageproduction system since 1984. All treatmentsimproved soybean seed yield over theuntreated check plot. Yields were maximizedwith either planting-time application of TrisertK+ in combination with foliar application ofTrisert-K+ at early pod stage or with twofoliar applications of Trisert-K+, at earlyvegetative stage and again at early pod stage.Applying three foliar applications of TrisertK+ did not significantly improve yields overyields with two applications. All treatmentsincreased whole-plant K content at thebeginning of seed fill (R5) over the untreatedcheck. Tissue K content was greatest in thetreatment receiving three foliar applications of2.5 gal/a Trisert K+.
Introduction
The use of conservation tillage hasincreased in recent years because of its
effectiveness in conserving soil and water.Potassium (K) deficiency can be a problem onsoils that have been managed with reduced-tillage practices. The large amount of residueleft on the soil surface can depress soiltemperature early in the growing season. Lowsoil temperature can interfere with plant rootgrowth, nutrient availability in soil, and cropnutrient uptake. Soil temperature influences Kuptake by roots and K diffusion through thesoil. Limited soil water content or zones ofsoil compaction can reduce K availability.
In plant physiology, K is the mostimportant cation, not only in its concentrationin tissues, but also with respect tophysiological functions. A deficiency in Kaffects such important physiological processesas respiration, photosynthesis, chlorophylldevelopment, and regulation of stomatalactivity. Plants suffering from a K deficiencyshow a decrease in turgor, making resistanceto drought poor. The main function of K inbiochemistry is in activating many differentenzyme systems involved in plant growth anddevelopment. Potassium also influences cropmaturity and plays a role in reducing disease.The appearance of K deficiency in fieldsmanaged with conservation tillage has beenreported with greater frequency in recentyears and has become a concern forproducers. The objective of these studies wasto determine if K applied as a starter atplanting, alone or in combination with foliarapplications of K, could improve K uptakeand yield of soybean on soils that had beenmanaged in a ridge-tillage production system.
Procedures
This field experiment was conducted in2004 and 2005 on a Crete silt loam soil. The
This publication from the Kansas State University Agricultural Experiment Station and Cooperative Extension Service has been archived. Current information is available from http://www.ksre.ksu.edu.

NC-10
experimental area had been managed in aridge-tillage system since 1984. Potassiumdeficiencies had been observed in this areabefore initiation of the study. Soil test resultsshowed that initial pH was 6.5, organic matterwas 2.5%, and Bray-1 P and exchangeable Kin the top 6 inches of soil were 26 and 280ppm, respectively. Treatments consisted of theliquid fertilizer Trisert-K+ applied at 2.5 gal/aat the V5 (early vegetative) or R3 (early pod)stage of growth; Trisert-K+ applied at 5 gal/aat R3; 2.5 gal/a of Trisert-K+ applied at bothV5 and R3; starter-applied Trisert-K+; starterTrisert-K+ in combination with 2.5 gal/aTrisert-K+ applied at R3; 2.5 gal/a Trisert-K+applied at V5, R3, and R4; and Trisert-K+applied preplant broadcast. An untreatedcheck plot also was included. Trisert-K+ is achlorine-free, clear liquid solution containing5% nitrogen (N), 20% K2O, and 13% sulfur(S). Each gallon of Trisert-K+ contains 0.58lb N, 2.34 lb K2O, and 1.55 lb sulfur. Starterfertilizer was applied 2 inches to the side and2 inches below the seed at planting. Foliarfertilizer was applied with a backpack sprayerat a total spray volume of 20 gal/a. Broadcastapplications were made 5 days beforeplanting. The experiment was furrow-irrigated. The Roundup Ready® soybean
variety Asgrow 3303 was planted in earlyMay each year at the rate of 12 seeds/ft. TheV5 application was made on June 5 in 2004and June 6 in 2005. The R3 application wason July 8 and July 12 in 2004 and 2005,respectively, and the R4 application was onAugust 17 in 2004 and on August 13 in 2005.
Results
All K fertilizer treatments improvedsoybean yields and whole-plant K concentra-tion over the untreated check plot, except forthe broadcast application (Table 14). Seedyields were maximized with either starterapplication of Trisert-K+ in combination withfoliar application of either 2.5 gal/a or 5 gal/aof Trisert-K+ applied at R3, or with two foliarapplications of Trisert-K+ at 5 gal/a applied atV5 and again at R3. Three foliar applicationsof Trisert-K+ did not improve yields overyields with two applications. Seed yield was5 bu/a greater when starter fertilizer wascombined with a single foliar application ofTrisert-K+ at the R3 stage than when starterwas applied alone. Broadcast application offertilizer containing K was not as effective asstarter plus foliar-applied fertilizer.
Table 14. Potassium fertilizer application effects on soybean yield, Scandia, Kansas, 2004-2005.
Yield
Whole-plant K
at Early PodTreatment 2004 2005 2004 2005
- - - - - bu/a - - - - - - - - - - % - - - - -Trisert-K+ (2.5 gal/a at V5) 75.7 75.9 3.12 3.10Trisert-K+ (5 gal/a at V5) 81.6 75.9 3.32 3.33Trisert-K+ (2.5 gal/a at R3) 84.9 76.5 3.54 3.51Trisert-K+ (5.0 gal/a at R3) 85.6 78.6 3.48 3.47Trisert-K+ (2.5 gal/a at V5+R3) 89.3 86.2 3.57 3.51Trisert-K+ (5gal/a at V5+R3) 91.8 90.1 3.66 3.68Starter Trisert-K+ (5 gal/a) 85.3 78.0 3.20 3.15Starter Trisert-K+ plus Trisert-K+ (2.5 gal/a at R3) 90.7 88.6 3.59 3.62Starter Trisert-K+ plus TrisertK+ (5 gal/a at R3) 92.9 90.8 3.67 3.68Preplant Broadcast KTS 83.1 74.2 3.08 3.00Trisert-K+ (2.5 gal/a at V5+R3+R4) 91.5 87.6 3.72 3.77Untreated check 69.5 70.1 2.82 2.67LSD (0.05) 2.5 2.2 0.75 0.64
This publication from the Kansas State University Agricultural Experiment Station and Cooperative Extension Service has been archived. Current information is available from http://www.ksre.ksu.edu.

NC-11
CONTROLLED-RELEASE UREA FOR IRRIGATED CORN PRODUCTION
W.B. Gordon
Summary
No-till production systems are being usedby an increasing number of producers in thecentral Great Plains because of severaladvantages that include reduction of soilerosion, increased soil water-use efficiency,and improved soil quality. The large amountof residue left on the soil surface, however,can make nitrogen (N) management difficult.
Surface applications of urea-containingfertilizers are subject to volatilization losses.Leaching can also be a problem on coarse-textured soils when N is applied in onepreplant application. Slow-release polymer-coated urea products are beginning to becomeavailable for agricultural use. The polymercoating allows the urea to be released at aslower rate than uncoated urea.
This experiment compares urea, acontrolled-release polymer-coated urea(ESN), and ammonium nitrate at threenitrogen (N) rates (80, 160, and 240 lb/a).Split applications (1/2 preplant + 1/2 at V4stage) at 160 lb/a N rate also were includedfor urea, ammonium nitrate, and ESN. TheV4-stage application of all the materials wasapplied in a surface band. Only the preplantapplications were broadcast. Other treatmentsincluded preplant applications of UANbroadcast and banded, and urea plus theurease inhibitor Agrotain®.
The study was conducted at the NorthCentral Kansas Experiment Field on a Cretesilt loam soil. The study was furrow-irrigated.The coated urea product, ESN, resulted ingreater yield than urea did at all N rates.Ammonium nitrate and ESN resulted inessentially the same yields at all N rates.Grain yield was excellent in 2005. Yieldincreased with increasing N rate up to the 160lb/a rate with ESN and ammonium nitrate, butcontinued to increase up to the 240 lb/a rate
with uncoated urea. Applying 160 lb/a N intwo split applications did not improve yieldsover applying all N preplant. Applying UANbroadcast was not effective as applying in adribble band. Urea applied with the ureaseinhibitor was much more effective than ureaalone. The polymer-coated urea product hasthe potential to make surface application of Nin no-till systems more efficient.
Introduction
Conservation-tillage production systemsare being used by an increasing number ofproducers in the Great Plains because ofseveral inherent advantages. These advantagesinclude reduction of soil erosion losses,increased soil water-use efficiency, andimproved soil quality. The large amount ofresidue left on the soil surface in no-tillsystems can make N management difficult.Surface application of N fertilizers is apopular practice with producers. When urea-containing N fertilizers are placed on the soilsurface, they are subject to volatilizationlosses. Nitrogen immobilization can also be aproblem when N fertilizers are surface appliedin high-residue production systems. Nitrogenleaching can be both an agronomic andenvironmental problem on coarse-texturedsoils. Polymer-coated urea has the potential tomake N management more efficient whensurface applied in no-till systems.
Procedures
This experiment was conducted at theNorth Central Kansas Experiment Field on aCrete silt loam soil. Soil pH was 6.5, organicmatter was 2.15, Bray-1 P was 44 ppm, andexchangeable K was 325 ppm. The cornhybrid DeKalb DKC60-19 was planted
This publication from the Kansas State University Agricultural Experiment Station and Cooperative Extension Service has been archived. Current information is available from http://www.ksre.ksu.edu.

NC-12
without tillage into corn stubble on April 22,2004, at the rate of 31,000 seeds/a. Nitrogenwas applied on the soil surface immediatelyafter planting. Split applications consisted of1/2 of the N applied immediately afterplanting and 1/2 applied at the V4 stage.Preplant treatments were broadcast, and V4treatments were banded. Treatments consistedof controlled-release polymer-coated urea(ESN), urea, or ammonium nitrate, applied atthree rates (80, 160, and 240 lb/a). A no-Ncheck plot also was included. Additionaltreatments were split applications of ESN,urea, ammonium nitrate, UAN (28% N)broadcast and applied in a dribble band, andurea plus the urease inhibitor, Agrotain®, at160 lb/a N. The experimental area wasadequately irrigated throughout the growingseason. Plots were harvested on October 28,2005.
Results
The ESN controlled-release urea productresulted in greater corn yield at all rates of Nthan application of urea did (Table 15). Yieldsachieved with ESN application were equal tothose with ammonium nitrate. The loweryields with urea indicate that volatilization ofN may have been a significant problem.Splitting applications of N did not improvecorn yields with any of the materials. Weatherconditions were good and yields wereexcellent. Yields increased with increasing Nrate up to the 160 lb/a rate, except with urea,for which yields continued to increase withincreasing N up to the 240 lb/a rate. ApplyingUAN in a dribble band was more effectivethan broadcasting, and applying urea with theurease inhibitor Agrotain® was moreeffective than urea alone.
Results of this study suggest that slow-release polymer-coated urea can improve Nuse efficiency, compared with urea and UAN,when surface applied in no-till conditions.
This publication from the Kansas State University Agricultural Experiment Station and Cooperative Extension Service has been archived. Current information is available from http://www.ksre.ksu.edu.
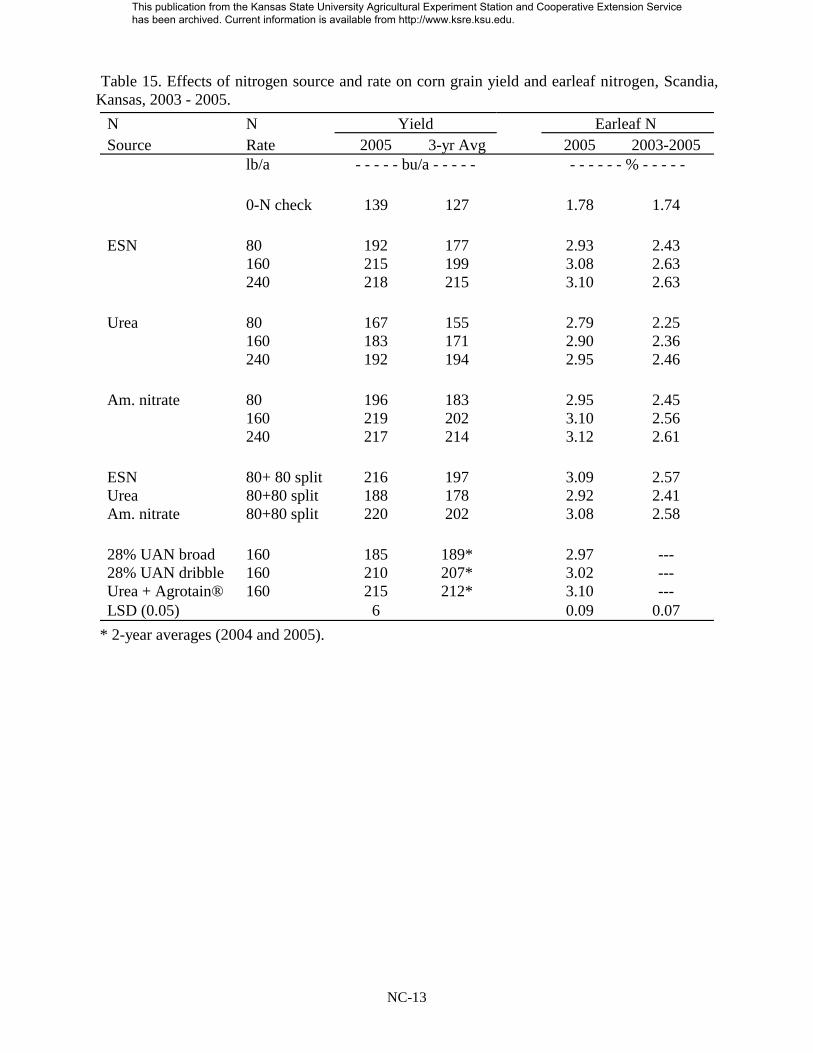
NC-13
Table 15. Effects of nitrogen source and rate on corn grain yield and earleaf nitrogen, Scandia,Kansas, 2003 - 2005.
N N Yield Earleaf N Source Rate 2005 3-yr Avg 2005 2003-2005
lb/a - - - - - bu/a - - - - - - - - - - - % - - - - -
0-N check 139 127 1.78 1.74
ESN 80 192 177 2.93 2.43160 215 199 3.08 2.63240 218 215 3.10 2.63
Urea 80 167 155 2.79 2.25160 183 171 2.90 2.36240 192 194 2.95 2.46
Am. nitrate 80 196 183 2.95 2.45160 219 202 3.10 2.56240 217 214 3.12 2.61
ESN 80+ 80 split 216 197 3.09 2.57Urea 80+80 split 188 178 2.92 2.41Am. nitrate 80+80 split 220 202 3.08 2.58
28% UAN broad 160 185 189* 2.97 ---28% UAN dribble 160 210 207* 3.02 ---Urea + Agrotain® 160 215 212* 3.10 ---LSD (0.05) 6 0.09 0.07
* 2-year averages (2004 and 2005).
This publication from the Kansas State University Agricultural Experiment Station and Cooperative Extension Service has been archived. Current information is available from http://www.ksre.ksu.edu.

NC-14
MAXIMIZING IRRIGATED SOYBEAN YIELDS IN THE GREAT PLAINS
W.B. Gordon
Summary
In 2004, studies were initiated to seekways to maximize soybean yield in the centralGreat Plains. Treatments included rowspacing (30- and 7.5-inch rows), plantpopulation (150,000 and 225,000 plants/a),and seven fertility treatments. Fertilitytreatments consisted of a low phosphorus (P)application (K-State soil test recommendationwould consist of 30 lb/a P2O5 at this site), lowP- low potassium (K), low P-high K, high P-high K, N-P-K, and an unfertilized check plot.
In 2005, a treatment consisting of 5 lb/aMn in addition to N-P-K was added.Phosphorus application rates were 30 or 80lb/a P2O5, and K treatments were 80 or 120lb/a K2O. The N-P-K treatment consisted ofapplication of 20 lb/a N, 80 lb/a P2O5, and 120lb/a K2O. Fertilizer was broadcast in mid-March each year. Soybean was sprinklerirrigated. Planting dates were May 8, 2004,and May 10, 2005. Harvest dates were in mid-October each year.
In 2004, increasing plant populations didnot increase grain yields, nor did reducing rowspacing from 30 to 7.5 inches. Increasingplant population in narrow rows reducedyield. Soybean yields did respond to fertilizerapplication. Applying 80 lb P2O5 with 60 lb/aK2O increased yield by 32 bu/a over yield inthe unfertilized check plot. Applyingadditional K or adding N to the mix did notincrease yields. Increasing plant population atlower fertility rates decreased yield.
In 2005, soybean yield was not affected byrow spacing or plant population, nor was yieldaffected by any interaction of factors. Fertilitytreatments did have a dramatic effect onsoybean yield. Applying 80 lb P2O5 with 60lb/a K2O increased yield by 33 bu/a over yieldin the unfertilized check plot. Applyingadditional K or N did not result in any yield
increase, but addition of Mn to the mix didsignificantly increase yield.
In high-yield environments, soybeanyields can be greatly improved by directfertilization.
Introduction
Analysis of corn yield data from hybridperformance tests in Kansas show that cornyields have increased by an average of 2.5bu/a per year. Soybean yield trends inperformance tests have also been on anupward trend, but average state-wide yields inKansas have not increased. In a corn-soybeanrotation, fertilizer typically is applied onlyduring the corn phase of the rotation. On aper-bushel basis, soybean removes twice asmuch phosphorus and almost five times asmuch potassium as corn does. To capitalize ongenetic improvements in yield, levels of plantnutrients must not be limiting. Otherproduction practices, such as plant populationand row spacing, may interact with fertilitymanagement to influence crop yields.
Procedures
The experiment was conducted on a Cretesilt loam soil at the North Central KansasExperiment Field and included soybeanplanted at two row spacings (30 and 15inches) and two plant populations (150,000and 225,000 plants/a). Fertility treatmentsconsisted of a low-P application (K-State soiltest recommendation would consist of 30 lb/aP2O5 at this site), low P- low K, low P-high K,high P-high K, N-P-K, N-P-K-Mn, and anunfertilized check plot. Phosphorusapplication rates were 30 or 80 lb/a P2O5, andK treatments were 80 or 120 lb/a K2O. The N-P-K treatment consisted of application of 40
This publication from the Kansas State University Agricultural Experiment Station and Cooperative Extension Service has been archived. Current information is available from http://www.ksre.ksu.edu.

NC-15
lb N, 80 lb P2O5 and 120 lb K2O per acre. TheN-P-K-Mn consisted of the same N-P-Ktreatment plus 5 lb/a of Mn. Soil test valueswere: pH, 6.9; Bray-1 P, 21 ppm; andexchangeable K, 210 ppm. Fertilizer wasbroadcast in mid-March. The soybean varietyAsgrow 3305 was planted on May 8 in 2004and on May 10 in 2005. Soybean wassprinkler irrigated.
Results
In neither year of the experiment didincreasing plant populations or reducing rowspacing result in any increase in yield (Tables16 and 17).
In 2004, increasing plant population innarrow rows actually reduced yield. Soybean
yields did respond to fertilizer application.Applying 80 lb/a P2O5 with 60 lb/a K2Oincreased yield by 32 bu/a over yield of theunfertilized check plot (Table 18). Applyingadditional K or adding N to the mix did notincrease yields. Increasing plant population atlower fertility rates decreased yield.
In 2005, soybean yield was not affected byrow spacing or plant population, nor was yieldaffected by any interaction of factors. Fertilitytreatments did have a dramatic effect onsoybean yield. Applying 80 lb/a P2O5 with 60lb/a K2O increased yield by 33 bu/a over theunfertilized check plot (Table 19). Applyingadditional K or N did not result in any yieldincrease, but addition of Mn to the mix didsignificantly increase yield.
Table 16. Soybean yield as affected by row spacing and plant population (average over fertility treatments), North Central Kansas Experiment Field, 2004.
Yield
Row Space 150,000 plants/a 255,000 plants/a
- - - - - - - - - - bu/a - - - - - - - - - -
30 inch 76 77
7.5 inch 77 73
LSD (0.05) 3
Table 17. Soybean yield as affected by row spacing and plant population (average over fertilitytreatments), North Central Kansas Experiment Field, 2005.
Yield
Row Space 150,000 plants/a 255,000 plants/a
- - - - - - - - - - - bu/a - - - - - - - - - - -
30 inch 78 80
7.5 inch 80 78
LSD (0.05) NS*
*Not Significant
This publication from the Kansas State University Agricultural Experiment Station and Cooperative Extension Service has been archived. Current information is available from http://www.ksre.ksu.edu.
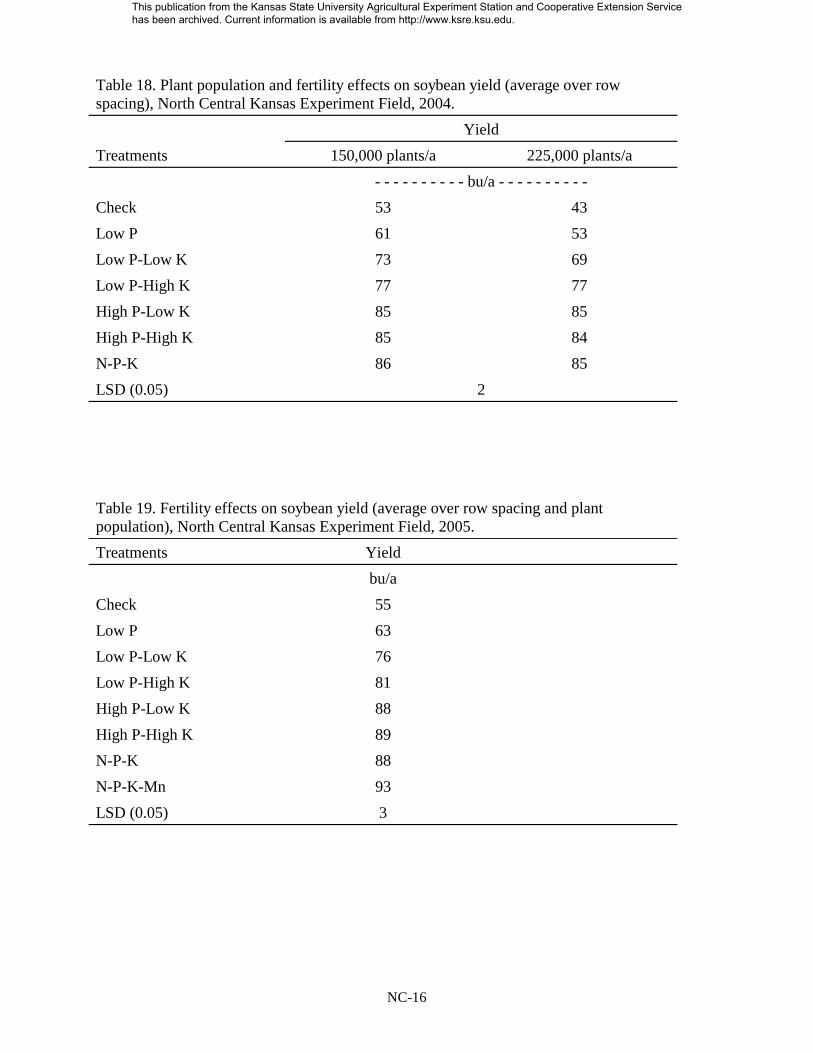
NC-16
Table 18. Plant population and fertility effects on soybean yield (average over rowspacing), North Central Kansas Experiment Field, 2004.
Yield
Treatments 150,000 plants/a 225,000 plants/a
- - - - - - - - - - bu/a - - - - - - - - - -
Check 53 43
Low P 61 53
Low P-Low K 73 69
Low P-High K 77 77
High P-Low K 85 85
High P-High K 85 84
N-P-K 86 85
LSD (0.05) 2
Table 19. Fertility effects on soybean yield (average over row spacing and plantpopulation), North Central Kansas Experiment Field, 2005.
Treatments Yield
bu/a
Check 55
Low P 63
Low P-Low K 76
Low P-High K 81
High P-Low K 88
High P-High K 89
N-P-K 88
N-P-K-Mn 93
LSD (0.05) 3
This publication from the Kansas State University Agricultural Experiment Station and Cooperative Extension Service has been archived. Current information is available from http://www.ksre.ksu.edu.

NC-17
MANGANESE NUTRITION OF GLYPHOSATE-RESISTANT AND CONVENTIONAL SOYBEAN
W.B. Gordon
Summary
There is evidence to suggest that insertionof the gene that imparts glyphosate resistancein soybean may have altered physiologicalprocesses that affect manganese (Mn) uptakeand metabolism. This study was conducted todetermine if glyphosate-resistant soybeanresponds differently than conventionalsoybean to applied Mn. The glyphosate-resistant soybean variety KS 4202 RR and itsconventional isoline were grown on a Cretesilt loam soil with a pH of 6.9 at the NorthCentral Kansas Experiment Field. Granularmanganese sulfate was applied in late April togive rates of 2.5, 5, and 7.5 lb Mn/a. A no-Mncheck plot also was included. Soybean wasplanted without tillage on May 10, 2005. Theexperiment was sprinkler irrigated.
Yield of the conventional soybean varietywas 12 bu/a greater than its glyphosate-tolerant isoline. Addition of Mn improvedyield of the glyphosate-resistant variety, butthe yield of the conventional isoline decreasedwith increasing Mn rate. Foliar application ofchelated Mn also was effective in improvingyield of glyphosate-resistant soybean.
Introduction
There is evidence to suggest that yields ofglyphosate-resistant soybean may still lagbehind that of conventional soybean. Manyfarmers have noticed that soybean yields,even under optimal conditions, are not as highas expected. In Kansas, average yield seldomexceeds 60 to 65 bu/a, even when soybean isgrown with adequate rainfall and/orsupplemental irrigation water. The addition ofthe gene that imparts herbicide resistance mayhave altered other physiological processes.
Some scientists suggest than soybean rootexudates have been changed, and that plantsno longer solubilize enough soil Mn.Application of glyphosate also may retardmanganese metabolism in the plant. Additionof supplemental Mn at the proper time maycorrect deficiency symptoms and result ingreater soybean yields.
In higher plants, photosynthesis ingeneral, and photosynthetic O2 evolution inPhotosystem II (Hill Reaction) in particular,are the processes that respond mostsensitively to Mn deficiency. Changes in O2
evolution induced by Mn deficiency arecorrelated with changes in the ultrastructureof thylakoid membranes (internal chlorophyll-containing membranes of the chloroplastwhere light absorption and the chemicalreactions of photosynthesis take place). WhenMn deficiency becomes severe, thechlorophyll content decreases and theultrastructure of the thylakoids is drasticallychanged. Manganese acts as a cofactor,activating about 35 different enzymes.Manganese activates several enzymes leadingto the biosynthesis of aromatic amino acids,such as tyrosine, and secondary products, suchas lignin and flavonoids. Flavonoids in rootextracts of legumes stimulate nod (nodulation)gene expression. Lower concentrations oflignin and flavonoids in Mn-deficient tissueare also responsible for a decrease in diseaseresistance of Mn-deficient plants. Innodulated legumes, such as soybean, thattransport nitrogen in the form of allantoin andallantoate to the shoot, the degradation ofthese ureides in the leaves and in the seed coatis catalyzed by an enzyme that has an absoluterequirement of Mn. Ureides account for mostof N transported in the xylem sap to the aerialportions of soybean. Tissue Mn deficiencyand drought stress can increase shoot ureide
This publication from the Kansas State University Agricultural Experiment Station and Cooperative Extension Service has been archived. Current information is available from http://www.ksre.ksu.edu.

NC-18
concentration. In research done in Arkansas,it was found that foliar Mn applicationsreduced soybean shoot ureide concentrationsand prolonged N2 fixation. Information isneeded to determine if field-grownglyphosate-resistant soybean responds toapplied Mn in a different manner thanconventional soybean does and, if so, whatfertilization practices are best to correct theproblem. There currently is little informationon Mn fertilization of soybean in Kansas.
The objective of this research was todetermine if glyphosate-resistant soybeanresponds differently to applied manganesethan conventional soybean does and, if so, todevelop fertilization strategies that willprevent or correct deficiencies, leading toimproved yield for soybean producers.
Procedures
The glyphosate-resistant soybean varietyKS 4202 RR and its conventional isoline weregrown on a Crete silt loam soil with sprinklerirrigation. The soil pH in the top 6 inches ofsoil at the site was 6.9. Manganese fertilizertreatment was pre-plant banded soilapplications of manganese sulfate at rates of2.5, 5, and 7.5 lb/a. A no-Mn check treatmentalso was included. The experimental design
was a randomized complete block with a split-plot arrangement. Whole plots were herbicide-resistant and conventional soybean varieties(isolines of KS 4202), and split plots were Mnrates and sources. An additional experimentevaluated liquid chelated Mn applied tosoybean foliage at three growth stages (V4,V8, and R2). Manganese was applied to theglyphosate-resistant soybean variety KS4202RR to give a rate of 0.3 lb/a Mn at eachapplication.
Results
Yields were affected by an interactionbetween soybean variety and Mn rate (Figure3). In the glyphosate-resistant variety KS4202 RR, yields increased with addition ofMn up to the 5 lb/a rate. Yield of theconventional variety KS 4202 was 12 bu/agreater than its glyphosate-resistant isoline KS4202RR when no Mn was added. Yield of theconventional variety declined with increasingMn rate. Tissue Mn concentration (uppermostexpanded trifoliate at full bloom) in theherbicide-resistant isoline was less than halfthat of the conventional variety when no Mnwas applied (Figure 4). Foliar-applied liquidMn chelate was effective in increasing yieldof glyphosate-resistant soybean (Table 20).
Table 20. Foliar-applied manganese effects on soybean yield, 2005.
Stage of Growth Yield
bu/a
V4 62
V4+V8 69
V4+V8+R2 72
Untreated Check 80
LSD (0.05) 4
0.3 lb Mn/a was applied at each application.
This publication from the Kansas State University Agricultural Experiment Station and Cooperative Extension Service has been archived. Current information is available from http://www.ksre.ksu.edu.

NC-19
72.6
64.9
72.8
77.6 77.674.9
76.176.9
60
65
70
75
80
0 2.5 5 7.5
Mn-rate, lb/a
Yie
ld, b
u/a
KS 4202
KS 4202RR
105
32
9592
8075 87
72
20
40
60
80
100
120
0 2.5 5 7.5
Mn-rate, lb/a
leaf
tis
sue
Mn
, pp
m
KS 4202
KS 4202RR
Figure 3. Soybean yield response to applied manganese.
Figure 4. Soybean leaf tissue Mn concentration (uppermost expanded trifoliate at full bloom).
This publication from the Kansas State University Agricultural Experiment Station and Cooperative Extension Service has been archived. Current information is available from http://www.ksre.ksu.edu.

NC-20
MANAGEMENT SYSTEMS FOR GRAIN SORGHUM PRODUCTION UNDERDRYLAND AND IRRIGATED CONDITIONS
W.B. Gordon
Summary
Experiments were conducted at the NorthCentral Kansas Experiment Fields on a Cretesilt loam soil to compare corn and sorghum inboth dryland and irrigated environments. Inthe dryland experiment, when averaged overpopulations and hybrids, corn yield averaged104 bu/a and grain sorghum yielded 137 bu/a.
With grain sorghum, the latest-maturinghybrid (DKS 53-11) yield was the greatestand the earliest (DKS 36-00) yield was theleast. Longer-season sorghum develops moreleaves than shorter-season sorghum does and,thus, has a greater potential for fixing carbonand increasing yield. In many years, however,the fuller-season hybrids run short of water indryland environments, and the potential forgreater yield is not realized.
Above-normal rainfall was received inAugust 2005, and distribution was ideal forgrain sorghum production. In the irrigatedexperiment, when averaged over populationsand hybrids, corn yielded 180.3 bu/a and grainsorghum yielded 183 bu/a. Grain sorghumdemonstrated its ability to compete with cornin both dryland and limited-irrigationproduction systems.
Introduction
As competition for limited water suppliesincreases in arid and semi-arid regions,irrigation water is becoming increasinglyscarce and expensive. Where water is alimiting resource, the objectives of irrigationmanagement may shift from obtainingmaximum yield to obtaining maximumeconomic production per unit of appliedwater. When the available water supply islimited, producers are faced with different
planning decisions than historically wereencountered. Deficit irrigation occurs whenwater supplies are limited to the extent thatfull replacement of evapotranspiration (ET)demand is no longer possible. With limitedamounts of available water, choice ofcropping system may change.
The slope of the yield ET relationship forcorn is larger than for most other crops. TheET threshold for grain yield is also higher.With grain sorghum, it takes 6 inches of waterto produce the first bushel of grain. Cornrequires twice that amount to produce the firstbushel of grain.
Sorghum originated in, is well adapted to,and is primarily grown in the semiarid regionsof the world. It has long been recognized asbeing drought tolerant, compared with othermajor grain crops, and is therefore well suitedto conditions characterized by: (1) insufficientwater supply to meet evaporative demand, (2)uneven seasonal distribution of precipitation,and (3) high year-to-year variation in rainfalland surface water supplies. In drylandconditions or with limited amounts ofirrigation water available, grain sorghum maybecome a viable alternative to cornproduction.
The objectives of this research would beto compare grain sorghum to corn productionin dryland and limited irrigation croppingsystems.
ProceduresIn 2005, a dryland experiment was
conducted at the North Central KansasExperiment Field on a Crete silt loam soil tocompare corn and grain sorghum productionin the same environment. The experimentconsisted of three corn hybrids (DeKalb DKC
This publication from the Kansas State University Agricultural Experiment Station and Cooperative Extension Service has been archived. Current information is available from http://www.ksre.ksu.edu.
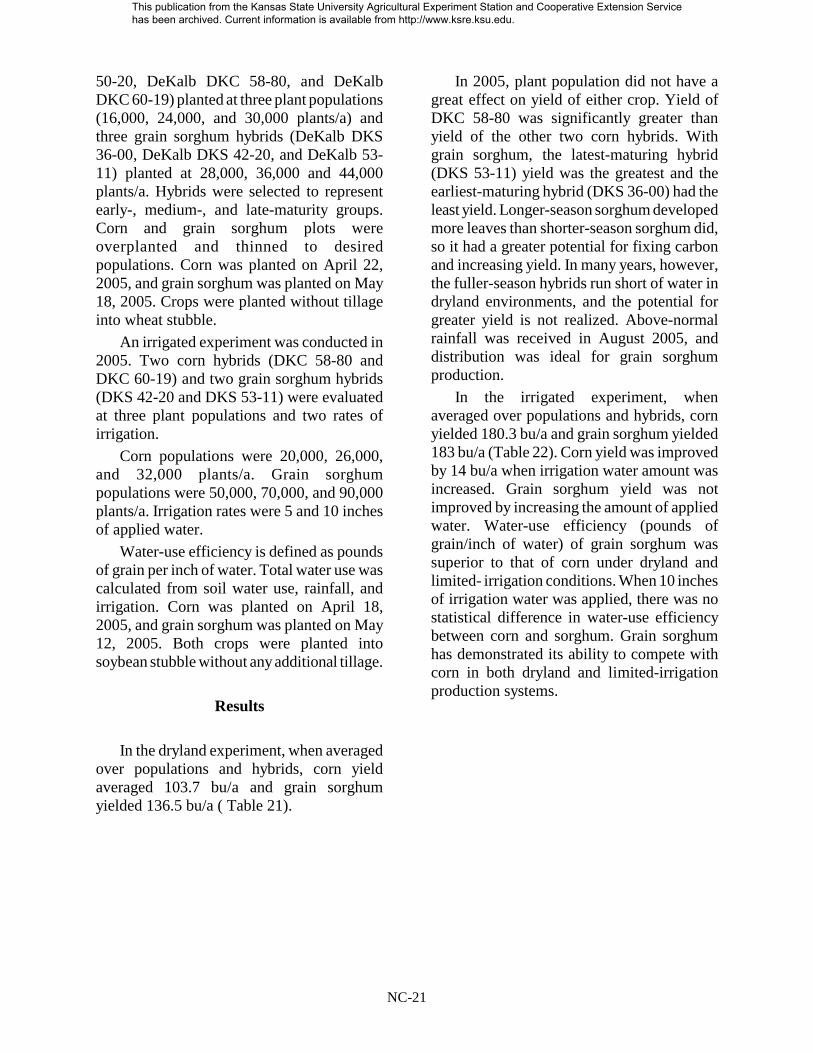
NC-21
50-20, DeKalb DKC 58-80, and DeKalbDKC 60-19) planted at three plant populations(16,000, 24,000, and 30,000 plants/a) andthree grain sorghum hybrids (DeKalb DKS36-00, DeKalb DKS 42-20, and DeKalb 53-11) planted at 28,000, 36,000 and 44,000plants/a. Hybrids were selected to representearly-, medium-, and late-maturity groups.Corn and grain sorghum plots wereoverplanted and thinned to desiredpopulations. Corn was planted on April 22,2005, and grain sorghum was planted on May18, 2005. Crops were planted without tillageinto wheat stubble.
An irrigated experiment was conducted in2005. Two corn hybrids (DKC 58-80 andDKC 60-19) and two grain sorghum hybrids(DKS 42-20 and DKS 53-11) were evaluatedat three plant populations and two rates ofirrigation.
Corn populations were 20,000, 26,000,and 32,000 plants/a. Grain sorghumpopulations were 50,000, 70,000, and 90,000plants/a. Irrigation rates were 5 and 10 inchesof applied water.
Water-use efficiency is defined as poundsof grain per inch of water. Total water use wascalculated from soil water use, rainfall, andirrigation. Corn was planted on April 18,2005, and grain sorghum was planted on May12, 2005. Both crops were planted intosoybean stubble without any additional tillage.
Results
In the dryland experiment, when averagedover populations and hybrids, corn yieldaveraged 103.7 bu/a and grain sorghumyielded 136.5 bu/a ( Table 21).
In 2005, plant population did not have agreat effect on yield of either crop. Yield ofDKC 58-80 was significantly greater thanyield of the other two corn hybrids. Withgrain sorghum, the latest-maturing hybrid(DKS 53-11) yield was the greatest and theearliest-maturing hybrid (DKS 36-00) had theleast yield. Longer-season sorghum developedmore leaves than shorter-season sorghum did,so it had a greater potential for fixing carbonand increasing yield. In many years, however,the fuller-season hybrids run short of water indryland environments, and the potential forgreater yield is not realized. Above-normalrainfall was received in August 2005, anddistribution was ideal for grain sorghumproduction.
In the irrigated experiment, whenaveraged over populations and hybrids, cornyielded 180.3 bu/a and grain sorghum yielded183 bu/a (Table 22). Corn yield was improvedby 14 bu/a when irrigation water amount wasincreased. Grain sorghum yield was notimproved by increasing the amount of appliedwater. Water-use efficiency (pounds ofgrain/inch of water) of grain sorghum wassuperior to that of corn under dryland andlimited- irrigation conditions. When 10 inchesof irrigation water was applied, there was nostatistical difference in water-use efficiencybetween corn and sorghum. Grain sorghumhas demonstrated its ability to compete withcorn in both dryland and limited-irrigationproduction systems.
This publication from the Kansas State University Agricultural Experiment Station and Cooperative Extension Service has been archived. Current information is available from http://www.ksre.ksu.edu.
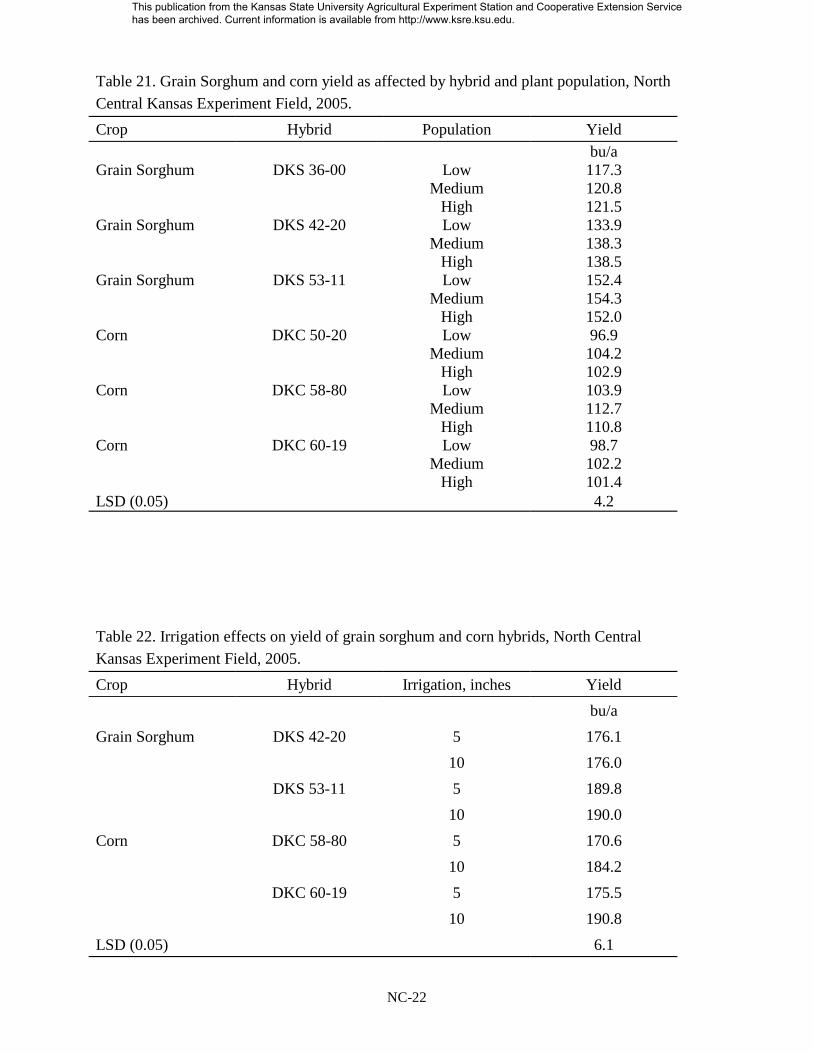
NC-22
Table 21. Grain Sorghum and corn yield as affected by hybrid and plant population, North Central Kansas Experiment Field, 2005.
Crop Hybrid Population Yieldbu/a
Grain Sorghum DKS 36-00 Low 117.3Medium 120.8
High 121.5Grain Sorghum DKS 42-20 Low 133.9
Medium 138.3High 138.5
Grain Sorghum DKS 53-11 Low 152.4Medium 154.3
High 152.0Corn DKC 50-20 Low 96.9
Medium 104.2High 102.9
Corn DKC 58-80 Low 103.9Medium 112.7
High 110.8Corn DKC 60-19 Low 98.7
Medium 102.2High 101.4
LSD (0.05) 4.2
Table 22. Irrigation effects on yield of grain sorghum and corn hybrids, North Central Kansas Experiment Field, 2005.
Crop Hybrid Irrigation, inches Yield
bu/a
Grain Sorghum DKS 42-20 5 176.1
10 176.0
DKS 53-11 5 189.8
10 190.0
Corn DKC 58-80 5 170.6
10 184.2
DKC 60-19 5 175.5
10 190.8
LSD (0.05) 6.1
This publication from the Kansas State University Agricultural Experiment Station and Cooperative Extension Service has been archived. Current information is available from http://www.ksre.ksu.edu.

NC-23
050
100150
200250300
350400
450500
0 5 10
Inches of Irrigation Water
Wat
er U
se E
ffic
ien
cy
lb o
f gra
in/in
ch o
f wat
er)
Corn
Sorghum
Figure 5. Water use efficiency of corn and grain sorghum.
This publication from the Kansas State University Agricultural Experiment Station and Cooperative Extension Service has been archived. Current information is available from http://www.ksre.ksu.edu.

i
TABLE OF CONTENTS
Introduction . . . . . . . . . . . . . . . . . . . . . . . . . . . . . . . . . . . . . . . . . . . . . . . . . . . . . . . . . . . . . . SC-1
Soil Description . . . . . . . . . . . . . . . . . . . . . . . . . . . . . . . . . . . . . . . . . . . . . . . . . . . . . . . . . . . SC-1
Weather Information . . . . . . . . . . . . . . . . . . . . . . . . . . . . . . . . . . . . . . . . . . . . . . . . . . . . . . . SC-2
Crop Performance Tests . . . . . . . . . . . . . . . . . . . . . . . . . . . . . . . . . . . . . . . . . . . . . . . . . . . . . SC-3
Effects of Nitrogen Rate and Previous Crop on Grain Yield in ContinuousWheat and Alternative Cropping Systems in South Central Kansas . . . . . . . . . . . . . . . . . . . SC-4
Effects of Termination Date of Austrian Winter Pea Winter Cover Cropand Nitrogen Rates On Grain Sorghum and Wheat Yields . . . . . . . . . . . . . . . . . . . . . . . . . SC-14
Evaluation of Spring Small Grains for the Production of Grain and Forage . . . . . . . . . . . . SC-18
Effects of Row Spacing and Seeding Rate on Summer Annual Forage Dry Matter Yield . SC-22
EXPERIMENT FIELD PERSONNEL
William F. Heer, Agronomist-in-Charge
This publication from the Kansas State University Agricultural Experiment Station and Cooperative Extension Service has been archived. Current information is available from http://www.ksre.ksu.edu.
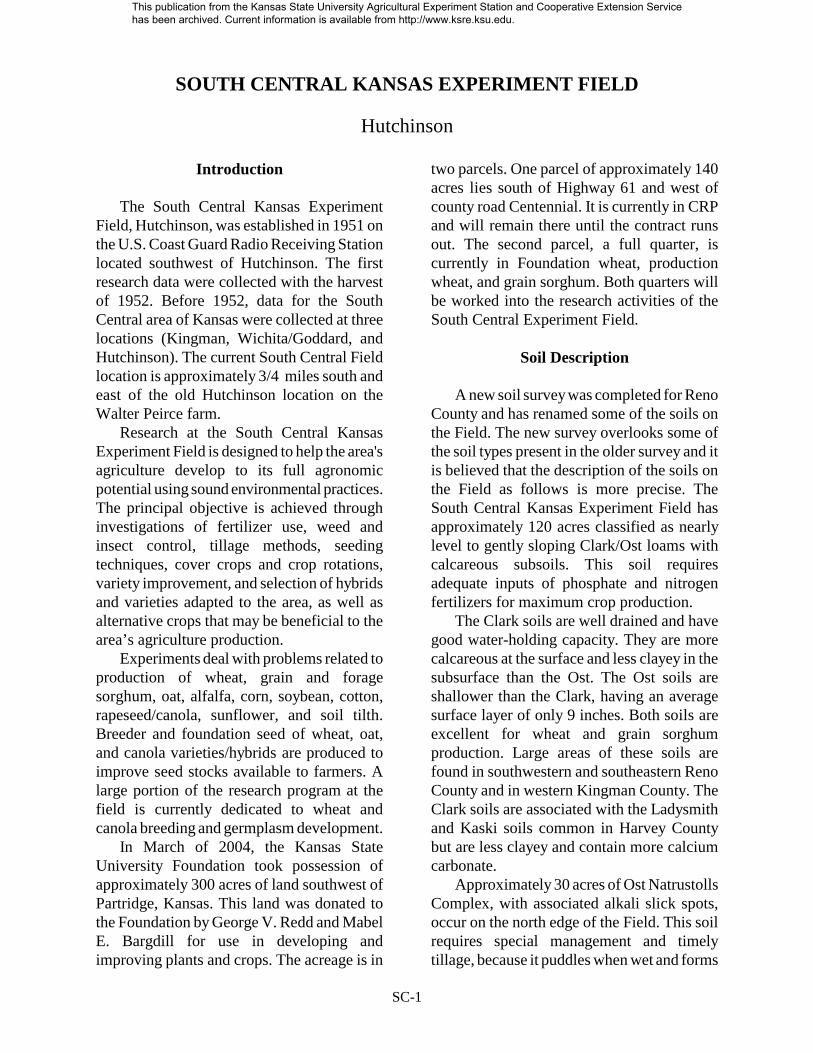
SC-1
SOUTH CENTRAL KANSAS EXPERIMENT FIELD
Hutchinson
Introduction
The South Central Kansas ExperimentField, Hutchinson, was established in 1951 onthe U.S. Coast Guard Radio Receiving Stationlocated southwest of Hutchinson. The firstresearch data were collected with the harvestof 1952. Before 1952, data for the SouthCentral area of Kansas were collected at threelocations (Kingman, Wichita/Goddard, andHutchinson). The current South Central Fieldlocation is approximately 3/4 miles south andeast of the old Hutchinson location on theWalter Peirce farm.
Research at the South Central KansasExperiment Field is designed to help the area'sagriculture develop to its full agronomicpotential using sound environmental practices.The principal objective is achieved throughinvestigations of fertilizer use, weed andinsect control, tillage methods, seedingtechniques, cover crops and crop rotations,variety improvement, and selection of hybridsand varieties adapted to the area, as well asalternative crops that may be beneficial to thearea’s agriculture production.
Experiments deal with problems related toproduction of wheat, grain and foragesorghum, oat, alfalfa, corn, soybean, cotton,rapeseed/canola, sunflower, and soil tilth.Breeder and foundation seed of wheat, oat,and canola varieties/hybrids are produced toimprove seed stocks available to farmers. Alarge portion of the research program at thefield is currently dedicated to wheat andcanola breeding and germplasm development.
In March of 2004, the Kansas StateUniversity Foundation took possession ofapproximately 300 acres of land southwest ofPartridge, Kansas. This land was donated tothe Foundation by George V. Redd and MabelE. Bargdill for use in developing andimproving plants and crops. The acreage is in
two parcels. One parcel of approximately 140acres lies south of Highway 61 and west ofcounty road Centennial. It is currently in CRPand will remain there until the contract runsout. The second parcel, a full quarter, iscurrently in Foundation wheat, productionwheat, and grain sorghum. Both quarters willbe worked into the research activities of theSouth Central Experiment Field.
Soil Description
A new soil survey was completed for RenoCounty and has renamed some of the soils onthe Field. The new survey overlooks some ofthe soil types present in the older survey and itis believed that the description of the soils onthe Field as follows is more precise. TheSouth Central Kansas Experiment Field hasapproximately 120 acres classified as nearlylevel to gently sloping Clark/Ost loams withcalcareous subsoils. This soil requiresadequate inputs of phosphate and nitrogenfertilizers for maximum crop production.
The Clark soils are well drained and havegood water-holding capacity. They are morecalcareous at the surface and less clayey in thesubsurface than the Ost. The Ost soils areshallower than the Clark, having an averagesurface layer of only 9 inches. Both soils areexcellent for wheat and grain sorghumproduction. Large areas of these soils arefound in southwestern and southeastern RenoCounty and in western Kingman County. TheClark soils are associated with the Ladysmithand Kaski soils common in Harvey Countybut are less clayey and contain more calciumcarbonate.
Approximately 30 acres of Ost NatrustollsComplex, with associated alkali slick spots,occur on the north edge of the Field. This soilrequires special management and timelytillage, because it puddles when wet and forms
This publication from the Kansas State University Agricultural Experiment Station and Cooperative Extension Service has been archived. Current information is available from http://www.ksre.ksu.edu.

SC-2
a hard crust when dry. A 10-acre depressionon the south edge of the Field is a Tabler-Natrustolls Complex (Tabler slick-spot com-plex). This area is unsuited for cultivated cropproduction and has been seeded toswitchgrass. Small pockets of the Tabler-Natrustolls are found throughout the Field.
The soils on the Redd-Bargdill land aresomewhat different from those on the currentField. The south quarter (CRP) has mostlyShellabarger fine sandy loams with 1 to 3%slopes. There are also some Farnums on thisquarter. The new classification has these soilsclassified as Nalim loam. The north quarterwas previously all classified as Tabler clayloam; the new survey has the soils classifiedas Funmar-Taver loams, Funmar loams, andTever loams.
Weather Information
From 1997-2000 precipitation was aboveaverage. In 2001 and in 2003, below-normalprecipitation was recorded at the Field. Theprecipitation for 2002 and 2004 was 0.946 and3.14 inches above normal, respectively. TheU.S. Department of Commerce NationalOceanic and Atmospheric AdministrationNational Weather Service rain gauge
(Hutchinson 10 S.W. 14-3930-8) collected32.09 inches of precipitation in 2005, 2.22inches above the 30-year (most recent)average of 29.87 inches. It should be notedthat the 30-year average has been increasingin the past few years. These figures aredifferent from those available through the K-State automated weather s tat ion(http://www.oznet.k-state.edu/wdl/) becauseof the distance between the two. As with allyears, distribution within the year and therainfall intensity are the determining factors inthe usefulness of the precipitation. In 2005,January, June, July, and August receivedabove-normal precipitation, of 1.66, 4.57,1.32, and 3.79 inches, respectively. The timingof the spring rains and cool temperaturesallowed the winter wheat and other fall crops(canola) to do well. The excess summer rainswere beneficial for the summer crops, as canbe seen in the data tables, but the hail stormon July 3 had a major effect on yield, with thecotton plots being completely hailed out. Hadit not been for the late freeze, the summercrops would not have yielded well.
A frost-free growing season of 177 days(April 30 - October 24, 2005) was recorded.This is six days less than the average frost-freeseason of 183 days (April 19 - October 17).
Table 1. Precipitation at South Central Kansas Experiment Field, Hutchinson, Kansas (10 S.W. 14-3930-8).
MonthRainfall(inches)
30-yr Avg* (inches) Month
Rainfall(inches)
30-yr Avg(inches)
2004 April 1.78 2.71
September 1.67 2.73 May 2.51 4.11
October 2.64 2.47 June 8.92 4.35
November 1.81 1.35 July 4.88 3.56
December 0.21 0.95 August 6.94 3.15
2005 September 0.47 2.73
January 2.35 0.69 October 1.02 2.49
February 1.75 1.10 November 0.19 1.38
March 1.07 2.70 December 0.31 0.90
2005 Total 32.09 29.87
* Most recent 30 years.
This publication from the Kansas State University Agricultural Experiment Station and Cooperative Extension Service has been archived. Current information is available from http://www.ksre.ksu.edu.

SC-3
CROP PERFORMANCE TESTS AT THE SOUTH CENTRAL FIELD
W.F. Heer and K.L. Roozeboom
Introduction
Performance tests for winter wheat, grain sorghum, alfalfa, canola, sunflower, oat, and springwheat were conducted at the South Central Kansas Experiment Field. Off-site tests for irrigatedcorn, soybean, and grain sorghum also were conducted. Results of these tests can be found in thispublication and in the following publications, which are available at the local county extension officeor online at http://www.ksu.edu/kscpt.
2005 Kansas Performance Tests with Winter Wheat Varieties. KAES Report of Progress SRP947.2005 Great Plains Canola Research. KAES Report of Progress SRP 954.2005 Kansas Performance Tests with Corn Hybrids. KAES Report of Progress SRP 949.2005 Kansas Performance Tests with Grain Sorghum Hybrids. KAES Report of Progress SRP950.2005 Kansas Performance Tests with Sunflower Hybrids. KAES Report of Progress SRP 953.2005 Kansas Performance Tests with Alfalfa Varieties. KAES Report of Progress SRP 952.2005 Kansas Performance Tests with Summer Annual Forages. KAES Report of Progress SRP955.2005 Kansas Performance Tests with Soybean. KAES Report of Progress SRP 951.
This publication from the Kansas State University Agricultural Experiment Station and Cooperative Extension Service has been archived. Current information is available from http://www.ksre.ksu.edu.
SC-4
EFFECTS OF NITROGEN RATE AND PREVIOUS CROP ON GRAIN YIELD INCONTINUOUS WHEAT AND ALTERNATIVE CROPPING SYSTEMS IN SOUTH-
CENTRAL KANSAS
W. F. Heer
Summary
The predominant cropping systems inSouth-Central Kansas have been continuouswheat and wheat-grain sorghum-fallow. Withcontinuous wheat, tillage is preformed tocontrol diseases and weeds. In the wheat-sorghum-fallow system only two crops areproduced every three years. Other crops (corn,soybean, sunflower, winter cover crops andcanola) can be placed in these cropping sys-tems. To determine how winter wheat (andalternative crop) yields are affected by thesealternative cropping systems, winter wheatwas planted in rotations following the alterna-tive crops. Yields were compared with yieldsof continuous winter wheat under conven-tional (CT) and no-till (NT) practices. Ini-tially, the CT continuous wheat yields weregreater than those from the other systems.Over time, however, wheat yields followingsoybean have increased, reflecting the effectsof reduced weed and disease pressure andincreased soil nitrogen. But CT continuouswinter wheat seems to out-yield NT winterwheat, regardless of the previous crop.
Introduction
In South-Central Kansas, continuous hardred winter wheat and winter wheat - grainsorghum - fallow are the predominant dry-landcropping systems. The summer-fallow periodfollowing sorghum is required because thesorghum crop is harvested in late fall, after theoptimum planting date for wheat in this re-gion. Average annual rainfall is only 29inch/yr, with 60 to 70% occurring betweenMarch and July. Therefore, soil moisture isoften not sufficient for optimum wheat growthin the fall. No-tillage (NT) systems often
increase soil moisture by increasing infiltra-tion and decreasing evaporation. But highergrain yields associated with increased soilwater in NT have not always been observed.
Cropping systems with winter wheatfollowing several alternative crops wouldprovide improved weed control, throughadditional herbicide options and reduceddisease incidence by interrupting diseasecycles, as well as allow producers severaloptions under the 1995 Farm Bill. But thefertilizer nitrogen (N) requirement for manycrops is often greater under NT than underCT. Increased immobilization anddenitrification of inorganic soil N and de-creased mineralization of organic soil N havebeen related to the increased N requirementsunder NT. Therefore, evaluation of N rates onhard red winter wheat in continuous wheatand in cropping systems involving "alterna-tive" crops for the area have been evaluated atthe South Central Field.
The continuous-winter-wheat study wasestablished in 1979 and was restructured toinclude a tillage factor in 1987. The first of thealternative cropping systems, in which wheatfollows short-season corn, was established in1986 and modified in 1996 to a wheat-covercrop-grain sorghum rotation. The secondcropping system (established in 1990) haswinter wheat following soybean. Both crop-ping systems use NT seeding into the previouscrop’s residue. All three systems have thesame N rate treatments.
Procedures
The research was conducted at the KSUSouth Central Experiment Field, Hutchinson.Soil is an Ost loam. The sites had been inwheat before the start of the cropping systems.
This publication from the Kansas State University Agricultural Experiment Station and Cooperative Extension Service has been archived. Current information is available from http://www.ksre.ksu.edu.

SC-5
The research was replicated five times in arandomized block design with a split-plotarrangement. The main plot was crop and thesubplot was six N rates (0, 25, 50, 75, 100,and 125 lb/a). Nitrogen treatments werebroadcast applied as NH4NO3 before planting.Phosphate was applied in the row at planting.All crops were produced each year of thestudy. Crops were planted at the normal timefor the area. Plots were harvested at maturityto determine grain yield, moisture, and testweight.
Continuous WheatThese plots were established in 1979. The
conventional tillage treatments are plowedimmediately after harvest then worked with adisk as necessary to control weed growth. Thefertilizer is applied with a Barber meteredscrew spreader before the last tillage (fieldcultivation) on the CT and before seeding ofthe NT plots. The plots are cross-seeded inmid-October to winter wheat. Because of aninfestation of cheat in the 1993 crop, the plotswere planted to oat in the spring of 1994. Thefertility rates were maintained, and the oat washarvested in July. Winter wheat has beenplanted in mid-October each year since the fallof 1994. New herbicides have aided in thecontrol of cheat in the NT treatments. In thefall of 2005, these plots were seeded to canola.The nitrogen rates and tillage treatments wereretained. It is hoped that doing this will giveus some field data on the effects of canola onwheat yields in a continuous-wheat croppingsystem.
Wheat after Corn/Grain Sorghum FallowIn this cropping system, winter wheat was
planted after short-season corn had beenharvested in late August to early September.This early harvest of short-season corn allowsthe soil-profile water to be recharged (bynormal late-summer and early-fall rains)before planting of winter wheat in mid-October. Fertilizer rates were applied with theBarber metered screw spreader in the same
manner as for the continuous wheat. In 1996,the corn crop in this rotation was dropped, andthree legumes (winter peas, hairy vetch, andyellow sweet clover) were added as wintercover crops. Thus, the rotation became awheat-cover crop-grain sorghum-fallow rota-tion. The cover crops replaced the 25, 75, and125 N treatments in the grain sorghum por-tion of the rotation. Yield data can be found inField Research 2000, KAES Report of Prog-ress SRP 854.
Wheat after SoybeanWinter wheat is planted after the soybean
has been harvested in early- to mid-Septemberin this cropping system. As with thecontinuous-wheat plots, these plots areplanted to winter wheat in mid October. Fertil-izer rates are applied with the Barber meteredscrew spreader in the same manner as for thecontinuous wheat. Since 1999, a group IIIsoybean has been used. This delays harvestfrom late August to early October. In someyears, this effectively eliminates the potentialrecharge time before wheat planting.
Wheat after Grain Sorghum in CoverCrop/Fallow - Grain Sorghum - Wheat
Winter wheat is planted into grain sor-ghum stubble harvested the previous fall.Thus, the soil-profile water has had 11 monthsto be recharged before planting of winterwheat in mid-October. Nitrogen fertilizer isapplied at a uniform rate of 75 lb/a with theBarber metered screw spreader in the samemanner as for the continuous wheat. Thisrotation will be terminated after the harvest ofeach crop in 2006. For the 2007 harvest year,canola will be introduced into this rotationwhere the cover crops had been.
Winter wheat is also planted after canolaand sunflower to evaluate the effects of thesetwo crops on the yield of winter wheat.Uniform nitrogen fertility is used; therefore,the data is not presented. The yields for wheatafter these two crops are comparable to wheatafter soybean.
This publication from the Kansas State University Agricultural Experiment Station and Cooperative Extension Service has been archived. Current information is available from http://www.ksre.ksu.edu.
SC-6
Results
Continuous WheatGrain yield data from plots in continuous
winter wheat are summarized by tillage and Nrate in Table 3. Data for years before 1996 canbe found in Field Research 2000, KAESReport of Progress SRP 854. Conditions in1996 and 1997 proved to be excellent forwinter wheat production, in spite of the dryfall of 1995 and the late-spring freezes in bothyears. Excellent moisture and temperaturesduring the grain- filling period resulted indecreased grain-yield differences between theconventional and no-till treatments within Nrates. Conditions in the springs of 1998 and1999 were excellent for grain filling in wheat.However, the differences in yield betweenconventional and no-till wheat still expressedthemselves (Table 3). In 2000, the differenceswere wider, up to the 100 lb/a N rate. At thatpoint, the differences were similar to those ofprevious years. The wet winter and late springof the 2003-2004 harvest year allowed forexcellent tillering and grain fill and yields(Table 2). In 2005, the dry period in April andMay seemed to affect the yields in the plotswith 0 and 25 lb/a N rates.
Wheat after SoybeanWheat yields after soybean also reflect the
differences in N rate. When comparing thewheat yields from this cropping system withthose where wheat followed corn, however,the effects of residual N from soybean produc-tion in the previous year can be seen. This isespecially true for N rates between 0 and 75 lbin 1993 and between 0 and 125 lb in 1994(Table 3). Yields in 1995 reflect the added Nfrom the previous soybean crop with yield-by-N-rate increases similar to those of 1994. The1996 yields for spring wheat reflect the lack ofresponse to nitrogen fertilizer for the springwheat. Yields for 1997 and 1998 both showthe leveling off after the first four incrementsof N. As with the wheat in the other rotationsin 1999, the ideal moisture and temperature
conditions allowed the wheat yields aftersoybean to express the differences in N rate upto 100 lb N/a. In the past, those differencesstopped at the 75 lb N/a treatment. Whencompared with the yields in the continuouswheat, the yield of rotational wheat is startingto reflect the presence of the third crop (grainsorghum) in the rotation. Wheat yields werelower in 2000 than in 1999. This is attributedto the lack of timely moisture in April andMay and the hot days at the end of May. Thisheat caused the plants to mature early, andalso caused low test weights. In 2004, therewas not as much cheat as in 2003; thus, theyields were much improved (Table 3). Yieldsin 2004 indicate that the wheat is showing a50- to 75-lb N credit from the soybean androtational effects. As with the continuouswheat cropping system, the yields in plotswith the 0 and 25 lb/a N rate were less than in2004. As the rotation continues to cycle, thedifferences at each N rate will probably stabi-lize after four to five cycles, with a potentialto reduce fertilizer N applications by 25 to 50lb/a where wheat follows soybean.
Wheat after Grain Sorghum/Cover CropThe first year that wheat was harvested
after a cover-crop grain sorghum planting was1997. Data for the 1997-2005 wheat yields arein Table 4. Over these nine years, there doesnot seem to be a definite effect of the covercrop (CC) on yield. This is most likely due tothe variance in CC growth within a given year.In years like 1998 and 1999, in which suffi-cient moisture and warm winter temperaturesproduced good CC growth, the additional Nfrom the CC seems to carry through to thewheat yields. With the fallow period after thesorghum in this rotation, the wheat crop has amoisture advantage over the wheat after soy-bean. Cheat was the limiting factor in thisrotation in 2003. A more aggressive herbicidecontrol of cheat in the cover crops was started,and the 2004 yields reflect the control ofcheat. Management of the grasses in thecover-crop portion of this rotation seems to be
This publication from the Kansas State University Agricultural Experiment Station and Cooperative Extension Service has been archived. Current information is available from http://www.ksre.ksu.edu.
SC-7
the key factor in controlling the cheat grassand increasing yields. This can be seen in theyields for 2005, when compared with thewheat yields, either continuous wheat or inrotation with soybean.
Other Observations
Nitrogen application significantly in-creased grain N contents in all crops. Grainphosphate content did not seem to be affectedby increased N rate.
Loss of the wheat crop after corn canoccur in years when fall and winter moistureis limited. This loss has not occurred in con-tinuous winter wheat, regardless of tillage, orin the wheat after soybean. Corn will have thepotential to produce grain in favorable years(cool and moist) and silage in nonfavorable(hot and dry) years. In extremely dry summers,extremely low grain sorghum and soybeanyields can occur. The major weed-controlproblem in the wheat-after-corn system is withthe grasses. This was expected, and work isbeing done to determine the best herbicidesand time of application to control grasses.
Soybean and Grain Sorghum in RotationsSoybean was added to intensify the crop-
ping system in the South-Central area ofKansas. Soybean also has the ability, being alegume, to add nitrogen to the soil system. Forthis reason, nitrogen is not applied during the
time when soybean are planted in the plots forthe rotation. This gives the following crops theopportunity to use the added N and allowschecking the yields against the yields for thecrop in other production systems. Yield datafor soybean following grain sorghum in therotation are given in Table 5. Soybean yieldsare affected more by the weather for the givenyear than by the previous crop. In three out ofthe nine years, there was no effect of the Nrates applied to the wheat and grain sorghumcrops in the rotation. In the two years that Napplication rate did affect yield, it was only atthe lesser N rates. This is a similar effect thatis seen in a given crop. The yield data for thegrain sorghum after wheat in the soybean-wheat-grain sorghum rotation are in Table 6.As with the soybean, weather is the mainfactor affecting yield. The addition of a cashcrop (soybean), thus intensifying the rotation(cropping system), will reduce the yield ofgrain sorghum in the rotation; comparesoybean-wheat-grain sorghum vs. wheat-covercrop-grain sorghum in Tables 6 and 7. Moreuniform yields are obtained in the soybean-wheat-grain sorghum rotation (Table 6) thanin the wheat-cover crop-grain sorghum rota-tion (Table 7).
Other systems studies at the Field are awheat-cover crop (winter pea)-grain sorghumrotation with N rates, and a date of planting,date of termination cover-crop rotation withsmall grains (oat) and grain sorghum.
This publication from the Kansas State University Agricultural Experiment Station and Cooperative Extension Service has been archived. Current information is available from http://www.ksre.ksu.edu.

SC-8
Table 2. Wheat yields by tillage and nitrogen rate in a continuous-wheat cropping system, Hutchinson, Kansas.
N Yield (bu/a)
Rate1 1996 1997 1998 1999 2000 2001 2002 2003 2004 2005
CT2 NT CT NT CT NT CT NT CT NT CT NT CT NT CT NT CT NT CT NT
0 46 23 47 27 52 19 49 36 34 15 50 11 26 8 54 9 66 27 47 26
25 49 27 56 45 61 37 67 51 46 28 53 26 34 9 56 9 68 41 63 36
50 49 29 53 49 61 46 76 61 52 28 54 35 32 8 57 22 65 40 68 38
75 49 29 50 46 64 53 69 64 50 34 58 36 34 7 57 42 63 37 73 43
100 46 28 51 44 55 52 66 61 35 33 54 34 35 5 56 35 64 43 73 40
125 45 25 48 42 56 50 64 58 31 32 56 36 32 5 57 38 63 31 69 35
LSD (0.01)* NS NS 8 8 5 5 13 13 14 14 10 10 6 NS NS 18 NS 9 14 14
* Unless two yields in the same column differ by at least the least significant difference (LSD), there can be little confidence in one being greater than the other.1 Nitrogen rate in lb/a.2 CT conventional NT no-tillage.
This publication from the Kansas State University Agricultural Experiment Station and Cooperative Extension Service has been archived. Current information is available from http://www.ksre.ksu.edu.

SC-9
Table 3. Wheat yields after soybeans in a soybean-wheat-grain sorghum rotation with nitrogen rates, Hutchinson, Kansas.
N Yield (bu/a)
Rate1 1991 1992 1993 1994 1995 19962 1997 1998 1999 2000 2001 20023 2003 2004 2005
0 51 31 24 23 19 35 13 21 31 26 12 9 31 40 30
25 55 36 34 37 26 36 29 34 46 37 16 10 48 46 43
50 55 37 41 47 34 36 40 46 59 46 17 9 59 48 49
75 52 37 46 49 37 36 44 54 66 54 17 7 65 46 52
100 51 35 45 50 39 36 45 55 69 55 20 8 67 43 50
125 54 36 46 52 37 36 47 57 68 50 21 8 66 40 48
LSD (0.01)* NS 4 6 2 1 1 4 3 7 5 7 4 3 5 5
CV (%) 7 6 9 5 7 2 9 4 5 7 23 24 4 6 6* Unless two yields in the same column differ by at least the least significant difference (LSD), there can be little confidence in one being greater thanthe other. 1 Nitrogen rate in lb/a.2 Spring wheat yields.3 Yields severely reduced by hail.
This publication from the Kansas State University Agricultural Experiment Station and Cooperative Extension Service has been archived. Current information is available from http://www.ksre.ksu.edu.

SC-10
Table 4. Wheat yields after grain sorghum in a wheat-cover crop-grain sorghum rotation with nitrogen rates, Hutchinson, Kansas.
N Yield (bu/a)
Rate1 1997 1998 1999 2000 2001 20023 2003 2004 2005
0 17 25 26 4 45 10 9 47 59
HV2 43 50 39 16 45 10 5 36 63
50 59 52 50 21 41 8 4 35 56
WP2 43 51 66 21 41 9 8 37 60
100 52 56 69 26 39 5 5 32 55
SC2 53 54 70 22 42 6 6 36 55
LSD (0.01)* 21 12 5 5 5 3 NS 8 6
CV (%) 26 14 6 16 6 20 70 12 6 * Unless two yields in the same column differ by at least the least significant difference (LSD), there can be little confidence in one being greaterthan the other.1 Nitrogen rate in lb/a.2 HV hairy vetch, WP winter pea, SC sweet clover.3 Yields severely reduced by hail.
This publication from the Kansas State University Agricultural Experiment Station and Cooperative Extension Service has been archived. Current information is available from http://www.ksre.ksu.edu.

SC-11
Table 5. Soybean yields after grain sorghum in soybean-wheat-grain sorghum rotation with nitrogen rates, Hutchinson, Kansas.
N Yield (bu/a)
Rate1 1996 1997 1998 1999 2000 2001 2002 2003 2004 2005
0 16 26 22 33 25 7 22 5 53 20
25 17 29 23 35 21 8 22 6 50 19
50 18 30 23 36 23 9 22 6 50 18
75 20 29 24 36 24 8 21 7 51 18
100 22 31 25 37 21 9 21 7 51 19
125 20 25 24 34 22 8 22 7 49 19
LSD (0.01)* 3 7 NS NS NS NS ns 1.4 5 NS
CV (%) 10 12 6 12 15 13 7 17 6 11
* Unless two yields in the same column differ by at least the least significant difference (LSD), there can be little confidence in onebeing greater than the other.
1 N rate in lb/a; N rates are not applied to the soybean plots in the rotation.
This publication from the Kansas State University Agricultural Experiment Station and Cooperative Extension Service has been archived. Current information is available from http://www.ksre.ksu.edu.

SC-12
Table 6. Grain sorghum yields after wheat in a soybean-wheat-grain sorghum rotation with nitrogen rates, Hutchinson, Kansas.
N Yield (bu/a)
Rate1 1996 1997 1998 1999 2000 2001 2002 2003 2004 2005
0 32 13 57 52 55 15 34 10 86 86
25 76 29 63 67 56 15 41 10 112 90
50 93 40 61 82 54 13 43 9 129 97
75 107 41 60 84 49 9 43 8 136 95
100 106 65 55 77 50 7 46 8 141 101
125 101 54 55 82 49 7 47 9 142 95
LSD (0.01)* 8 13 NS 13 NS NS 8 NS 9 12
CV (%) 5 18 10 9 10 58 11 24 4 7* Unless two yields in the same column differ by at least the least significant difference (LSD), there can be little confidence in one being greater than the other.1 Nitrogen rate in lb/a.
This publication from the Kansas State University Agricultural Experiment Station and Cooperative Extension Service has been archived. Current information is available from http://www.ksre.ksu.edu.

SC-13
Table 7. Grain sorghum yields after cover crop in cover crop-grain sorghum-wheat rotation with nitrogen rates, Hutchinson, Kansas.
N Yield (bu/a)
Rate1 1996 1997 1998 1999 2000 2001 20023 2003 2004 2005
0 73 26 69 81 68 17 22 21 92 84
HV2 99 36 70 106 54 17 21 16 138 93
50 111 52 73 109 66 13 25 15 135 90
WP2 93 35 72 95 51 19 23 17 138 101
100 109 54 67 103 45 12 25 14 136 89
SC2 94 21 72 92 51 19 19 19 94 80
LSD (0.01)* 13 14 NS 21 16 6 NS 5 19 16
CV (%) 8 22 13 12 16 21 20 22 9 10* Unless two yields in the same column differ by at least the least significant difference (LSD), there can be little confidence in one being greater than the other.1 Nitrogen rate in lb/a.2 HV hairy vetch, WP winter pea, SC sweet clover.3 Yields affected by hot dry conditions in July and bird damage.
This publication from the Kansas State University Agricultural Experiment Station and Cooperative Extension Service has been archived. Current information is available from http://www.ksre.ksu.edu.

SC-14
EFFECTS OF TERMINATION DATE OF AUSTRIAN WINTER PEA WINTERCOVER CROP AND NITROGEN RATES ON
GRAIN SORGHUM AND WHEAT YIELDS
W.F. Heer
Summary
The effects of the cover crop most likelywere not expressed in the first-year (1996)grain sorghum harvest (Table 8). Limitedgrowth of the cover crop (winter peas), due toweather conditions, produced limited amountsof organic nitrogen (N). Therefore, the effectsof the cover crop were limited and varied,compared with those of fertilizer N. Thewheat crop for 1998 was harvested in June.The winter pea plots were then planted, andwere terminated the following spring, before1999 grain sorghum plots were planted. The Nrate treatments were applied and grain sor-ghum was planted on June 11, 1999. Winterwheat was again planted on the plots in Octo-ber 2000 and harvested in June 2001. Winterpeas were planted in September 2001 andterminated in April and May 2002. Grainsorghum was planted in June and harvested inOctober.
During 2003, this area was in sorghumfallow, and the plots were fertilized andplanted to wheat in October 2003 for harvestin 2004. The winter pea cover crop wasplanted into the wheat stubble in the fall of2004. These plots were terminated as indi-cated in Table 8, and were planted to grainsorghum in June 2005.
Introduction
There has been a renewed interest in theuse of winter cover crops as a means of soiland water conservation, as a substitute forcommercial fertilizer, and for the maintenanceof soil quality. One of the winter cover cropsthat may be a good candidate is winter pea.Winter pea is established in the fall, over-winters, produces sufficient spring foliage,
and is returned to the soil before planting of asummer annual. Because it is a legume, thereis a potential for adding nitrogen to the soilsystem. With this in mind, research projectswere established at the South Central Experi-ment Field to evaluate the effect of winter peaand its ability to supply N to the succeedinggrain sorghum crop, compared with commer-cial fertilizer N, in a winter wheat-winter pea-grain sorghum rotation.
Procedures
The research is being conducted at theKSU Research and Extension South CentralExperiment Field, Hutchinson. The soil in theexperimental area is an Ost loam. The site hadbeen in wheat before starting the cover-cropcropping system. The research used a random-ized block design and was replicated fourtimes. Cover-crop treatments consist of fall-planted winter peas with projected termina-tion dates in April and May, and no covercrop (fallow). The winter peas are planted intowheat stubble in early September at a rate of35 lb/a in 10-inch rows with a double diskopener grain drill. Before termination of thecover crop, above-ground biomass samplesare taken from a one-square-meter area. Thesesamples are used to determine forage yield(winter pea and other), and forage nitrogenand phosphate content for the winter peaportion. Fertilizer treatments consist of fourfertilizer N rates (0, 30, 60, and 90 lb/a N).Nitrogen treatments are broadcast applied asNH4NO3 (34-0-0) before planting of grainsorghum. Phosphate is applied at a rate of 40lb P2O5 in the row at planting. Grain sorghumplots are harvested to determine grain yield,moisture, test weight, and grain nitrogen andphosphate content. The sorghum plots are
This publication from the Kansas State University Agricultural Experiment Station and Cooperative Extension Service has been archived. Current information is available from http://www.ksre.ksu.edu.

SC-15
fallowed until the plot area is planted to wheatin the fall of the following year. The fertilizertreatments are also applied before plantingwheat.
Results
Winter Pea/Grain SorghumResults for winter pea cover crop and
grain sorghum were summarized in the FieldResearch 2000 Report of Progress SRP 854pages 139-142. The grain sorghum yields byN rate (Table 8) were similar to the wheatyields in the long-term N-rate study. The firstincrement of N resulted in the greatest changein yield, and the yields tended to peak at the60-lb N rate treatment, regardless of the pres-ence or lack of winter pea.
Winter WheatThe fall of 2000 was wet, after a very hot,
dry August and September. Thus, the plantingof wheat was delayed. Fall temperatures werewarm, allowing the wheat to tiller into lateDecember. January and February both hadabove-normal precipitation. April, May, andJune were slightly below normal in both
precipitation and temperature. Wheat yieldsreflected the presence of the winter pea treat-ments, as well as the reduced yields in thegrain sorghum for the no-pea treatment plots.Test weight of the grain was not affected bypea or fertilizer treatment, but was affected bythe rainfall at harvest time. This was also truefor the percentage of nitrogen in the seed atharvest. A concern with the rotation is weedpressure. The treatment with April-termina-tion pea plus 90 lb/a N had significantly moreweeds in it than any of the other treatments.Except for this treatment, there were no differ-ences noted for weed pressure. Grain yielddata are presented in Table 9. With the earlierplanting for the 2004 crop, the wheat shouldhave had a better chance to tiller, but the fallwas wet and cold, limiting fall growth.
As this rotation continues and the soilsystem adjusts, it will reveal the true effects ofthe winter cover crop in the rotation. It isimportant to remember that in the dry (nor-mal) years, the soil water (precipitation) dur-ing the growing season most likely will not beas favorable as it was in 1999, and the wateruse by the cover crop will be the main influ-ence on the yield of succeeding crop.
This publication from the Kansas State University Agricultural Experiment Station and Cooperative Extension Service has been archived. Current information is available from http://www.ksre.ksu.edu.
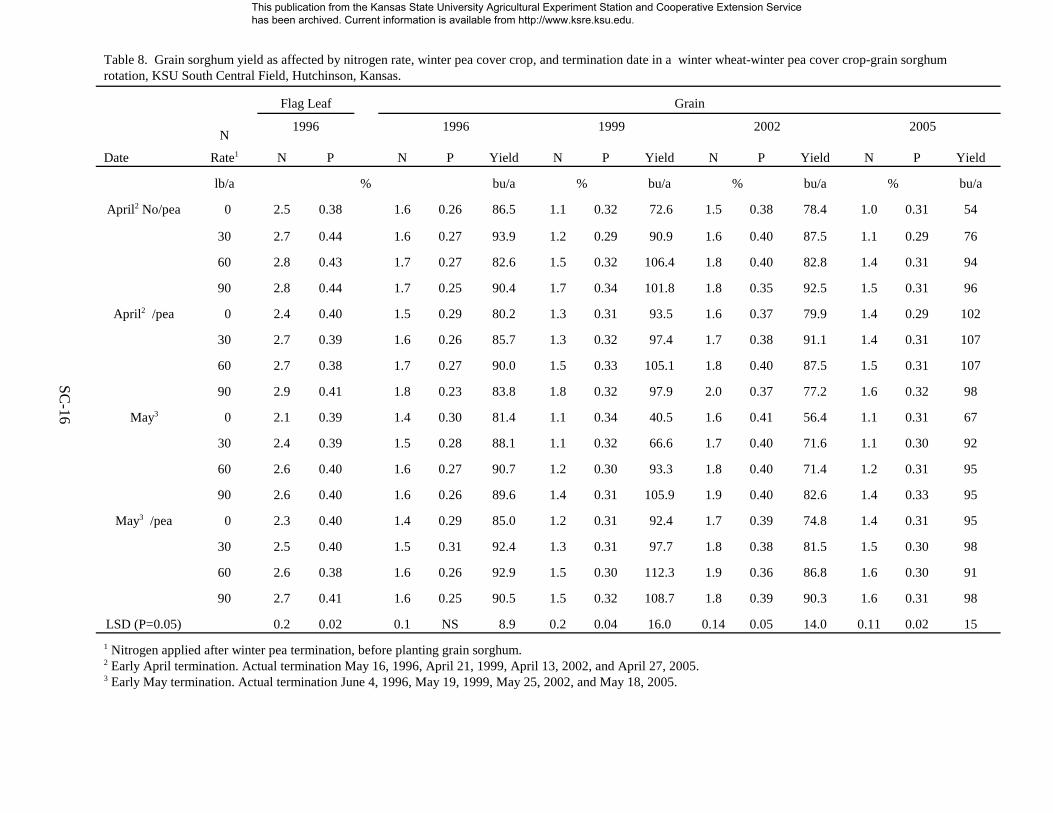
SC-16
Table 8. Grain sorghum yield as affected by nitrogen rate, winter pea cover crop, and termination date in a winter wheat-winter pea cover crop-grain sorghumrotation, KSU South Central Field, Hutchinson, Kansas.
N
Flag Leaf Grain
1996 1996 1999 2002 2005
Date Rate1 N P N P Yield N P Yield N P Yield N P Yield
lb/a % bu/a % bu/a % bu/a % bu/a
April2 No/pea 0 2.5 0.38 1.6 0.26 86.5 1.1 0.32 72.6 1.5 0.38 78.4 1.0 0.31 54
30 2.7 0.44 1.6 0.27 93.9 1.2 0.29 90.9 1.6 0.40 87.5 1.1 0.29 76
60 2.8 0.43 1.7 0.27 82.6 1.5 0.32 106.4 1.8 0.40 82.8 1.4 0.31 94
90 2.8 0.44 1.7 0.25 90.4 1.7 0.34 101.8 1.8 0.35 92.5 1.5 0.31 96
April2 /pea 0 2.4 0.40 1.5 0.29 80.2 1.3 0.31 93.5 1.6 0.37 79.9 1.4 0.29 102
30 2.7 0.39 1.6 0.26 85.7 1.3 0.32 97.4 1.7 0.38 91.1 1.4 0.31 107
60 2.7 0.38 1.7 0.27 90.0 1.5 0.33 105.1 1.8 0.40 87.5 1.5 0.31 107
90 2.9 0.41 1.8 0.23 83.8 1.8 0.32 97.9 2.0 0.37 77.2 1.6 0.32 98
May3 0 2.1 0.39 1.4 0.30 81.4 1.1 0.34 40.5 1.6 0.41 56.4 1.1 0.31 67
30 2.4 0.39 1.5 0.28 88.1 1.1 0.32 66.6 1.7 0.40 71.6 1.1 0.30 92
60 2.6 0.40 1.6 0.27 90.7 1.2 0.30 93.3 1.8 0.40 71.4 1.2 0.31 95
90 2.6 0.40 1.6 0.26 89.6 1.4 0.31 105.9 1.9 0.40 82.6 1.4 0.33 95
May3 /pea 0 2.3 0.40 1.4 0.29 85.0 1.2 0.31 92.4 1.7 0.39 74.8 1.4 0.31 95
30 2.5 0.40 1.5 0.31 92.4 1.3 0.31 97.7 1.8 0.38 81.5 1.5 0.30 98
60 2.6 0.38 1.6 0.26 92.9 1.5 0.30 112.3 1.9 0.36 86.8 1.6 0.30 91
90 2.7 0.41 1.6 0.25 90.5 1.5 0.32 108.7 1.8 0.39 90.3 1.6 0.31 98
LSD (P=0.05) 0.2 0.02 0.1 NS 8.9 0.2 0.04 16.0 0.14 0.05 14.0 0.11 0.02 15
1 Nitrogen applied after winter pea termination, before planting grain sorghum.2 Early April termination. Actual termination May 16, 1996, April 21, 1999, April 13, 2002, and April 27, 2005.3 Early May termination. Actual termination June 4, 1996, May 19, 1999, May 25, 2002, and May 18, 2005.
This publication from the Kansas State University Agricultural Experiment Station and Cooperative Extension Service has been archived. Current information is available from http://www.ksre.ksu.edu.

SC-17
Table 9. Winter wheat yield after grain sorghum as affected by nitrogen rate, winter pea cover crop, andtermination date in a winter wheat-winter pea cover crop-grain sorghum rotation, KSU South Central Field,Hutchinson, Kansas.
Termination Grain Plant
Date NRate1
Yield N P Height Lodg-ing
2004Weeds20012001 2004 2001 2004 2001 2004 2001 2004
lb/a bu/a % inch % rating2
April3 N/pea 0 37 58 2.32 1.73 0.38 0.38 26 31 0 3
30 40 56 2.43 1.94 0.36 0.36 28 29 3.8 5
60 39 51 2.30 2.23 0.38 0.34 30 30 17.5 4
90 37 44 2.24 2.27 0.38 0.35 30 29 35.0 7
April3 /pea 0 39 58 2.38 1.89 0.35 0.38 26 29 3.8 3
30 42 55 2.33 1.97 0.37 0.34 27 32 8.8 4
60 36 50 2.22 2.23 0.40 0.33 29 31 37.5 7
90 37 47 2.18 2.46 0.37 0.32 28 30 60.0 10
May4 N/pea 0 38 57 2.30 1.79 0.37 0.36 26 30 1.3 3
30 38 53 2.32 2.13 0.37 0.34 26 30 32.5 5
60 34 46 2.42 2.30 0.35 0.35 30 30 46.3 7
90 38 44 2.24 2.37 0.35 0.35 30 30 50.0 8
May4 /pea 0 42 60 2.37 1.91 0.40 0.36 26 30 3.8 4
30 37 50 2.38 2.19 0.38 0.35 28 30 27.5 6
60 35 45 2.38 2.33 0.37 0.33 29 30 42.5 9
90 37 45 2.34 2.42 0.38 0.34 28 30 42.5 10
LSD (P=0.05) 5 6 0.18 0.12 0.03 0.03 2 1 24 31 Nitrogen applied as 34-0-0 before planting winter wheat. 2 Visual rating 1= few to 10=most. Insufficient weeds were present in 2004 to rate. 3 Early April termination. 4 Early May termination. There was minimal lodging in 2001.
This publication from the Kansas State University Agricultural Experiment Station and Cooperative Extension Service has been archived. Current information is available from http://www.ksre.ksu.edu.

SC-18
EVALUATION OF SPRING SMALL GRAINS FOR THE PRODUCTION OF GRAIN AND FORAGE
V. L. Martin and W.F. Heer
Summary
Hard red winter wheat is the predominantsmall grain cereal in Kansas, with climaticrequirements typical of conditions in the statein May and June. Spring cereals (oat, wheat,and triticale) mature later than winter wheat,and this often results in reduced grain yieldsand test weights. But spring cereals are anexcellent potential source of forage as pasture,hay, or silage, and are an important nicheforage for producers during the spring. Inaddition, the grain, although not possessing asignificant market, is well-suited as feed on alocal basis.
The purpose of this study is to evaluate theforage and grain yield potential of spring oat,wheat, and triticale, particularly new varieties,in South-Central Kansas. This test also pro-vides information for producers interested inspring wheat as a potential substitute forwinter wheat. Conditions for growth anddevelopment in 2005 were cooler and wetterthan normal. These conditions resulted inexcellent forage yields for most varieties,despite delayed planting due to wet condi-tions. Oat grain yield and test weight wereacceptable for the area. Spring triticale andwheat matured significantly later than oat, anda severe storm lodged and shattered thetriticale and wheat grain before harvest.
Introduction
Spring cereal grains, predominantly oat,originally were planted in Kansas as feed forlivestock, especially horses. But hot, dryconditions common in late May and Junetypically reduce yields and test weightssignificantly. Therefore, as on-farm livestockdisappeared, so did spring cereal acreage.Although conditions are not conducive for
grain production, spring weather often isfavorable for the production of forage. Withthe development of new, hardier spring oat,triticale, and wheat varieties, the potentialexists for grain production suitable for off-farm marketing.
These spring cereals can provide a valu-able bridge forage for livestock producersduring a time of year when perennial pasturesare often not ready for livestock, hay andsilage are scarce, or forage is expensive. Thegrain also provides suitable livestock feed.
Procedures
Research was conducted at the SouthCentral Experiment Field, Hutchinson, on anOst loam. The site was fallowed during 2004with the following tillage operations: mold-board plow - August 9, 2004, tandem disk -September 7, 2004, pre-plant field cultivation- March 9, 2005. Fertilizer was applied asfollows: 75 lb/a N as urea (46-0-0) broadcaston October 2, 2004, and 50 lb/a N as ureabroadcast on March 7, 2005. No post-emer-gence herbicides were applied.
Spring cereals were divided into two tests,spring oat varieties and spring wheat plusspring triticale varieties. Plots were planted ina randomized complete-block design, withfour replications. Each test was planted twice,with one set of plots for forage harvest andone for grain. Eighteen oat, three triticale, andseven hard red spring wheat varieties wereplanted. Jagger winter wheat was used forcomparison in the spring wheat/triticale test.
Each plot was 35 ft X 5 ft, consisting ofsix rows, eight inches apart and planted witha plot drill. Seeding rate was two bu/a. Allplots were planted on March 9. Planting wasdelayed due to wet soil conditions. Forage washarvested with a Carter plot forage harvester
This publication from the Kansas State University Agricultural Experiment Station and Cooperative Extension Service has been archived. Current information is available from http://www.ksre.ksu.edu.
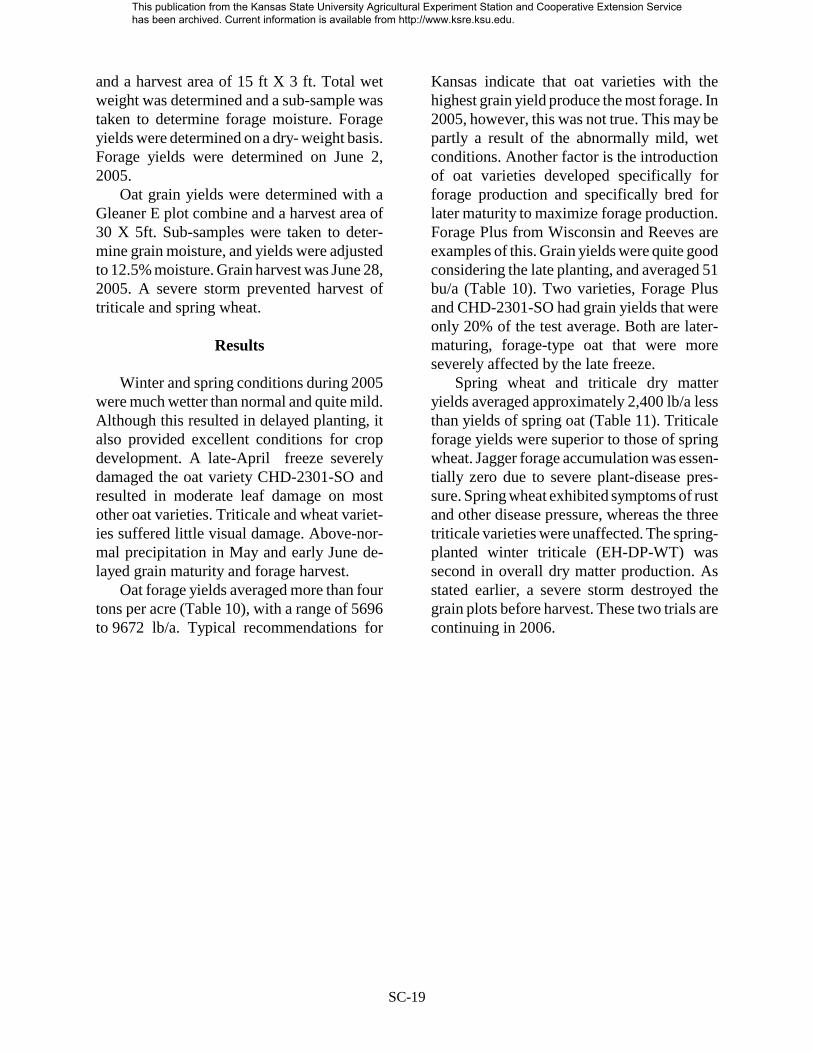
SC-19
and a harvest area of 15 ft X 3 ft. Total wetweight was determined and a sub-sample wastaken to determine forage moisture. Forageyields were determined on a dry- weight basis.Forage yields were determined on June 2,2005.
Oat grain yields were determined with aGleaner E plot combine and a harvest area of30 X 5ft. Sub-samples were taken to deter-mine grain moisture, and yields were adjustedto 12.5% moisture. Grain harvest was June 28,2005. A severe storm prevented harvest oftriticale and spring wheat.
Results
Winter and spring conditions during 2005were much wetter than normal and quite mild.Although this resulted in delayed planting, italso provided excellent conditions for cropdevelopment. A late-April freeze severelydamaged the oat variety CHD-2301-SO andresulted in moderate leaf damage on mostother oat varieties. Triticale and wheat variet-ies suffered little visual damage. Above-nor-mal precipitation in May and early June de-layed grain maturity and forage harvest.
Oat forage yields averaged more than fourtons per acre (Table 10), with a range of 5696to 9672 lb/a. Typical recommendations for
Kansas indicate that oat varieties with thehighest grain yield produce the most forage. In2005, however, this was not true. This may bepartly a result of the abnormally mild, wetconditions. Another factor is the introductionof oat varieties developed specifically forforage production and specifically bred forlater maturity to maximize forage production.Forage Plus from Wisconsin and Reeves areexamples of this. Grain yields were quite goodconsidering the late planting, and averaged 51bu/a (Table 10). Two varieties, Forage Plusand CHD-2301-SO had grain yields that wereonly 20% of the test average. Both are later-maturing, forage-type oat that were moreseverely affected by the late freeze.
Spring wheat and triticale dry matteryields averaged approximately 2,400 lb/a lessthan yields of spring oat (Table 11). Triticaleforage yields were superior to those of springwheat. Jagger forage accumulation was essen-tially zero due to severe plant-disease pres-sure. Spring wheat exhibited symptoms of rustand other disease pressure, whereas the threetriticale varieties were unaffected. The spring-planted winter triticale (EH-DP-WT) wassecond in overall dry matter production. Asstated earlier, a severe storm destroyed thegrain plots before harvest. These two trials arecontinuing in 2006.
This publication from the Kansas State University Agricultural Experiment Station and Cooperative Extension Service has been archived. Current information is available from http://www.ksre.ksu.edu.

SC-20
Table 10. Spring oat dry matter (forage) and grain yield and test weights,2005, Hutchinson, Kansas.
Variety Dry Matter Yield Grain Yield Test Weight
lb/a bu/a lb/bu
Bates 7713 51.6 28.6
Blaze 9672 52.4 29.5
Chaps 7640 64.0 28.7
CHD-2301-SO 5696 10.2 18.2
Dane 7387 57.6 26.8
Don 6769 57.0 30.6
Esker 9206 57.5 27.2
Forage Plus 8451 12.3 17.8
Gem 9395 49.1 27.4
INO9201 8964 58.6 28.7
Jay 7726 55.1 30.2
Jerry 8368 52.5 28.1
Jim 8407 60.1 29.9
Moraine 8134 58.2 28.1
Ogle 8013 56.7 28.0
Reeves 8145 46.4 28.6
Richard 9227 45.5 24.4
Spurs 7917 66.6 29.4
Mean 8124 50.6 27.3
LSD (.05)* 1577 11.9 2.66
*Unless two values within a column differ by more than the least significantdifference (LSD), there can be little confidence in one being greater than theother.
This publication from the Kansas State University Agricultural Experiment Station and Cooperative Extension Service has been archived. Current information is available from http://www.ksre.ksu.edu.

SC-21
Table 11. Spring wheat and triticale dry matter (forage), 2005, Hutchinson,Kansas.
Variety Grain1 Dry Matter Yield
lb/a
Jagger HRWW 0
Briggs HRSW 6612
Forge HRSW 6230
Granger HRSW 6043
Ingot HRSW 5675
Oxen HRSW 5868
Russ HRSW 6242
Walworth HRSW 5882
EH-DP-WT WT 6793
CHD-400 ST 6364
EH-P-ST ST 7027
Mean 5703
LSD (.05)* 978
1 HRWW (Hard Red Winter Wheat); HRSW (Hard Red Spring Wheat);WT (Winter Triticale); ST (Spring Triticale). *Unless two values within a column differ by more than the least significantdifference (LSD), there can be little confidence in one being greater than theother.
This publication from the Kansas State University Agricultural Experiment Station and Cooperative Extension Service has been archived. Current information is available from http://www.ksre.ksu.edu.
SC-22
EFFECTS OF ROW SPACING AND SEEDING RATE ON SUMMER ANNUAL FORAGE DRY MATTER YIELD
V.L. Martin and W.F. Heer
Summary
Although traditional summer annualforages have long been a crop produced inKansas, relatively little work has been done tooptimize total production and feed quality.Typical growing-season conditions allow foradequate production of vegetation but oftennegatively impact grain production withoutirrigation. Summer annual forages (e.g., for-age sorghum, sudan grass, pearl millet, andsorghum X sudan hybrids) are anunderutilized source of feed for both beef anddairy production.
The objective of this research is to deter-mine the effect of cultural practices on theforage yield and quality of traditional summerannual forages produced in Kansas. Theeffects of seeding rate and row spacing wereexamined for six common summer annualforages. Headless and fertile forage sorghumdry matter yields were highest, whereas thoseof the sorghum sudan grass were significantlylower. A seeding rate of eighteen lb/a resultedin the highest average dry matter yields. Indi-vidual forage response to seeding rate varied.Even with less-than-optimal conditions anddelayed planting, dry matter yields averagedmore than 5 tons per acre.
Introduction
Summer annual forages occupy a smallbut important niche for producers in Kansas,especially for beef production. These foragesare fed as hay and silage, and are grazed, withhaying being the most common. They typi-cally are stockpiled for periods when pastureis limiting or weather is severe. Grain produc-tion is not the primary goal with these crops,so weather conditions normally allow foradequate production of dry matter. Within the
last few years, the development of Brown MidRib (BMR) forages has improved the qualityand palatability of the forages.
With the price of fuel and fertilizer in-creasing, evaluating Best Management Prac-tices (BMP) for traditional summer annualforages will provide information to optimizedry matter production and forage quality.Once determined, these BMP can be adoptedacross the range of summer annual forages,allowing for significant improvements in rateof gain and time to finish.
ProceduresResearch was conducted at the South
Central Experiment Field, Hutchinson, on anOst loam. The site was in sunflower produc-tion during 2004, with the following tillageoperations before planting: tandem disk -April 15, 2005, field cultivation - April 19,2005. Fertilizer was applied as follows: 100lb/a N as urea (46-0-0) broadcast on July 22,2005. Buctril (1.5 pt/a) was applied for punc-ture vine control July 23, 2005.
Excessive precipitation in May and Junecaused the abandonment of the planting-datestudy and a delay in planting the other threestudies until late June/early July. The otherthree studies each consisted of a randomizedcomplete-block design with four replications,planted using forages as listed in Table 12.
Each plot was 35ft X 5 ft, consisting of sixrows, eight inches apart and planted with aplot drill, with the exception of the nitrogen-rate study, which was planted with a Marlissno-till drill with 10-inch centers and plotdimensions of 10 ft X 30 ft. Forages wereharvested with a Carter forage harvester anda harvest area of 10 ft X 3 ft. Total wet weightwas determined and a sub-sample was takento determine forage moisture. Non-replicatedsub-samples were analyzed to determine
This publication from the Kansas State University Agricultural Experiment Station and Cooperative Extension Service has been archived. Current information is available from http://www.ksre.ksu.edu.

SC-23
potential nitrate toxicity and relative feedvalue. Forage yields were determined on adry-weight basis. Forage yields were deter-mined on September 29 and 30.
Nitrogen Rate Study: N rates applied were0, 50, 100, and 150 lb/a N as urea. Pearl millet(10 lb/a), sterile sorgo X Sudan grass hybrid(18 lb/a), and fertile forage sorghum (18 lb/a)were planted on July 1 and harvested October20.
Seeding Rate Study: Forages were plantedon July 8 at 6, 12, 18, and 24 lb/a seed, andwere harvested on September 29.
Row Spacing Study: Forages were plantedin 8- and 16-inch rows on July 8 and wereharvested on September 29.
Results
Spring/early summer conditions weremuch wetter than normal and resulted insignificantly delayed planting. A severe stormtwo days after planting significantly decreasedemergence of forages planted for the N-ratestudy, and caused abandonment of the pearlmillet plots. Nitrogen rate had no effect onforage dry matter accumulation (Table 13);there was a slight increase in nitrate levels inthe forage as the N rate increased. This isprobably due to uneven stands, weed pressure,and significant rainfall shortly after nitrogenapplication.
Forage yields were significantly affectedby seeding rate (Table 14 and 15). The onlyforage unaffected by seeding rate was pearlmillet; this is not unusual, with its growthhabit and ability to tiller. The two forage-typesorghums responded positively to increasedseeding rate, but not as strongly as sorghumsudan grass and the two hybrids. Overall,except for the pearl millet, the optimal seedingrate in 2005 for later planting was approxi-mately 18 lb/a. Overall, forage yields were notsignificantly different among the forages, withthe exception of the sorghum sudan grass.This is not unusual, based on the growth habitof this forage and the fact that it is a BMRtype, which tend to yield less than conven-tional types, but are of much better quality.Yields for both the pearl millet and sorghumsudan grass would likely have increased withearlier planting and multiple cuttings.
Row spacing had no significant effect ondry matter accumulation (Table 16). Overall,increasing row spacing slightly decreasedforage yield. Forage sorghums typically areplanted in 30-inch rows, but these studiesindicate that decreasing row spacing does notnegatively affect yield. Narrow row spacingwould help control weed pressure often com-mon in forage sorghums and also woulddecrease stalk diameter.
These studies, in addition to several oth-ers, are continuing to help determine BMP forsummer annual forage production.
Table 12. Summer annual forage research entries, 2005, Hutchinson, Kansas.
Name Description Seeds/lb
Pro-Mil Hybrid Pearl Millet 79,000
BMR44S Brown Midrib Sorghum Sudan Grass 14,500
Sweetleaf II Sterile Sorgo/Sudan Grass Hybrid 21,000
800HS Headless Forage Sorghum 21,300
Nutri-Cane II Sterile Sorgo X Sorgo Forage Hybrid 23,900
Nutri-Ton II Fertile Forage Sorghum 17,600
This publication from the Kansas State University Agricultural Experiment Station and Cooperative Extension Service has been archived. Current information is available from http://www.ksre.ksu.edu.

SC-24
Table 13. Summer annual forage dry matter yield as affected by nitrogen fertilizer rate, 2005,Hutchinson, Kansas.
Forage Nitrogen Fertilizer Rate Dry Matter Yield
lb/a t/a
Sorgo/Sudan Grass Hybrid 0 3.9
50 4.2
100 4.6
150 4.1
Sorgo X Sorgo Forage Hybrid 0 5.2
50 4.5
100 4.1
150 4.5
Mean 4.4
LSD (.05)* NS
Nitrogen rate across forage
0 4.6
50 4.3
100 4.4
150 4.3
LSD (.05)* NS
*Unless two values within a column differ by more than the least significant difference (LSD),there can be little confidence in one being greater than the other. NS - Not Significant at the5% level.
This publication from the Kansas State University Agricultural Experiment Station and Cooperative Extension Service has been archived. Current information is available from http://www.ksre.ksu.edu.

SC-25
Table 14. Summer annual forage dry matter yields as affected by forage type X seeding rate,2005, Hutchinson, Kansas.
Forage Seeding Rate Dry Matter Yield
lb/a t/a
Pearl Millet 6 5.60
Pearl Millet 12 5.45
Pearl Millet 18 5.76
Pearl Millet 24 5.52
Sorghum Sudan Grass 6 3.38
Sorghum Sudan Grass 12 3.75
Sorghum Sudan Grass 18 4.26
Sorghum Sudan Grass 24 4.83
Sorgo/Sudan Grass Hybrid 6 4.75
Sorgo/Sudan Grass Hybrid 12 5.73
Sorgo/Sudan Grass Hybrid 18 5.38
Sorgo/Sudan Grass Hybrid 24 6.04
Headless Forage Sorghum 6 5.75
Headless Forage Sorghum 12 5.96
Headless Forage Sorghum 18 6.28
Headless Forage Sorghum 24 6.28
Sorgo X Sorgo Forage Hybrid 6 4.41
Sorgo X Sorgo Forage Hybrid 12 5.94
Sorgo X Sorgo Forage Hybrid 18 6.38
Sorgo X Sorgo Forage Hybrid 24 5.10
Fertile Forage Sorghum 6 5.34
Fertile Forage Sorghum 12 5.34
Fertile Forage Sorghum 18 6.11
Fertile Forage Sorghum 24 6.07
Mean 5.39
LSD (.05)* 1.22
*Unless two values within a column differ by more than the least significant difference (LSD),there can be little confidence in one being greater than the other.
This publication from the Kansas State University Agricultural Experiment Station and Cooperative Extension Service has been archived. Current information is available from http://www.ksre.ksu.edu.

SC-26
Table 15. Summer annual forage dry matter yield, 2005, Hutchinson, Kansas.
Factor Dry Matter Yield
t/a
Forage
Pearl Millet 5.58
Sorghum Sudan Grass 4.05
Sorgo/Sudan Grass Hybrid 5.47
Headless Forage Sorghum 6.07
Sorgo X Sorgo Forage Hybrid 5.46
Fertile Forage Sorghum 5.72
LSD (.05)* 0.75
Seeding Rate (lb/a)
6 4.87
12 5.36
18 5.70
24 5.64
LSD (.05)* 0.45
*Unless two values within a column differ by more than the least significant difference (LSD),there can be little confidence in one being greater than the other.
This publication from the Kansas State University Agricultural Experiment Station and Cooperative Extension Service has been archived. Current information is available from http://www.ksre.ksu.edu.

SC-27
Table 16. Summer annual forage dry matter yields as affected by forage type X row spacing,2005, Hutchinson, Kansas.
Forage Row Spacing Dry Matter Yield
inches t/a
Pearl Millet 8 4.08
Pearl Millet 16 4.24
Sorghum Sudan Grass 8 4.90
Sorghum Sudan Grass 16 4.02
Sorgo/Sudan Grass Hybrid 8 5.38
Sorgo/Sudan Grass Hybrid 16 4.80
Headless Forage Sorghum 8 5.57
Headless Forage Sorghum 16 5.07
Sorgo X Sorgo Forage Hybrid 8 4.18
Sorgo X Sorgo Forage Hybrid 16 4.20
Fertile Forage Sorghum 8 4.70
Fertile Forage Sorghum 16 4.78
Mean 4.66
LSD (.05)* 1.09
*Unless two values within a column differ by more than the least significant difference (LSD), therecan be little confidence in one being greater than the other.
This publication from the Kansas State University Agricultural Experiment Station and Cooperative Extension Service has been archived. Current information is available from http://www.ksre.ksu.edu.

NW-i
TABLE OF CONTENTS
County Comparisons of No-till to Tilled Wheat in Northwest Kansas . . . . . . . . . . . . . . . . NW-1
Dryland Strip-till in Western Kansas . . . . . . . . . . . . . . . . . . . . . . . . . . . . . . . . . . . . . . . . . . . NW-5
PMDI Field Test Results from Sheridan County . . . . . . . . . . . . . . . . . . . . . . . . . . . . . . . . . . NW-8
This publication from the Kansas State University Agricultural Experiment Station and Cooperative Extension Service has been archived. Current information is available from http://www.ksre.ksu.edu.
NW-1
NORTHWEST KANSAS RESEARCH - EXTENSION
COUNTY COMPARISONS OF NO-TILL TO TILLED WHEAT IN NORTHWEST KANSAS
B.L.S. Olson and J.S. Falk
Summary
Many farmers in western Kansas areevaluating whether to move their farmingoperation completely to a no-till system.These farmers are asking many questions. Isthere a yield drag from no-till? Are wheatvarieties impacted adversely when grown in adifferent tillage system? A multi-site side-by-side comparison study of tilled to no-tillwheat was setup across Northwest Kansas toaddress these questions. No-till wheat yieldswere 7 bu/a higher than those from wheatplanted into tilled fields. In addition, wheatvarieties were not impacted differently acrosstillage systems which is good news forfarmers when they go to choose a variety.Therefore, farmers can assess yield fromperformance tests and disease ratings and notworry whether the wheat variety will beadversely affected by the tillage system.
Introduction
Many farmers in western Kansas who arealready using no-till production practices fortheir summer crops are evaluating whether tomove their farming operation to a no-tillsystem. This move would involve plantingwinter wheat into no-till fields. Concerns overa possible reduction in yield or possibledifferences in how wheat varieties may beaffected by a different tillage system are allfactors farmers are considering. However, aswheat drills need to be replaced, input costssuch as diesel continue to rise, and glyphosatecontinues to decrease in price, more farmersare willing to change their production system.
Therefore, the objectives of this studywere to evaluate wheat yield from multipleon-farm side-by-side comparisons assessing
wheat planted no-till to wheat planted ontilled ground under various environmentsacross Northwest Kansas, and to evaluate anydifference in wheat varietal response to thetwo tillage systems.
Procedures
Multiple on-farm comparisons sites werelocated across Northwest Kansas. At each site,a 150 ft wide by 250 ft long section wasmarked for the no-till plot. After all tillageoperations were completed a second 150 ft by250 ft long section was marked for the tilledplot. Crop rotations varied across county siteswith the following rotations recorded:wheat/corn/fallow - Wallace, Thomas,Decatur; wheat/grain sorghum/fallow -Phillips, Ellis, Sheridan, Gove, Trego;wheat/wheat - Rooks, Mitchell; wheat/fallow -C h e y e n n e , S h e r m a n , R a w l i n s ;wheat/soybean/wheat/fallow - Smith. Weedcontrol on the no-till plots at each site waseither applied by K-State faculty, the farmercooperator, or elevator agronomists withglyphosate with or without 2,4-D or dicambaas the standard herbicide treatment. In tilledplots, the ground was typically worked with afield cultivator two to three times and a disconce before planting. Any fertilizer wasapplied according to wheat needs at eachlocation and was applied at the same rateacross tillage systems. For the no-till plots,fertilizer was injected across a majority of thesites, while on the tilled plots, the fertilizerwas either injected or broadcast applied.
Six varieties were planted in both tillagesystems across all sites. These varieties wereJagger, 2137, Jagalene, Cutter, T-81, andStanton. A 6 ft Great Plains no-till drill seededthe wheat in both tillage systems at a rate of
This publication from the Kansas State University Agricultural Experiment Station and Cooperative Extension Service has been archived. Current information is available from http://www.ksre.ksu.edu.

NW-2
85 lbs/a. Two passes were used for eachvariety, so each varietal plot within eachtillage system was 12 ft by 250 ft. At four ofthe locations (Decatur, Sheridan, Gove, andTrego), an additional eight varieties and oneblend were added: TAM 111, NuHills,Wesley, Overley, Dominator, Millennium,Thunderbolt, Trego, and a blend ofJagger/2137/T-81.
In March, soil moisture and temperaturedata loggers were placed at four locations(Decatur, Sheridan, Thomas, and Gove) torecord soil moisture at the 6 and 18 inchesalong with soil temperature at 1 and 12inches. Soil moisture in centibars andtemperature in degrees Celsius was collecteduntil mid-June. Data was downloaded andgraphed. At harvest, plots were harvested withthe assistance of the local cooperator, weighedwith a weigh wagon, and subsamples werecollected for test weight and moisture. Alldata was analyzed using SAS with eachlocation representing a replication. Five siteswere eliminated from the analysis due to thefollowing reasons: Sherman and Smith hadcrop failures, Ellis and Rooks hadmanagement problems with fertilizerapplication, and Cheyenne had low and highlyvariable wheat yields.
Results
Results from the nine county sites are inTable 1. Variability across the sites is evidentwith wheat yields ranging from the mid-30'sto low-70's in bu/a. When evaluating theaverage wheat yield across the six varieties,no-till yielded more at seven locations andtilled wheat yielded more at one site with thetwo systems yielding the same at the last site.When analyzing across variety, tillage system,and location, no-till yielded 58 bu/a and tilledwheat yielded 51 bu/a with an LSD (0.05) at4.6 bu/a.
A reason for the increased yield in no-tillmay be related to the higher soil moisturecontent that was observed at the four locationsthat had the soil moisture and temperaturesensors. Even though no difference were
observed for soil moisture at 6 inches or soiltemperature and 1 and 12 inches, soil moisturewas greater at 18 inches in the no-till systemscompared with the tilled system. Thecomposite average for soil moisture from eachtillage system is displayed in Fig. 1. Greatersoil moisture at the 18 inch depth likelyallowed for increased number of spikelets tosurvive and produce grain, thus increasingyield.
When evaluating differences in varietalresponse to the two tillage systems, no yielddifference was observed for the fourteenvarieties and one blend planted at four sitesacross tillage systems (Table 2), or the sixvarieties planted at nine locations acrosstillage systems (Table 3).
In conclusion, no-till wheat yields fromthe various side-by-side comparison acrossNorthwest Kansas were higher than thosefrom wheat planted into tilled fields. Inaddition, wheat varieties were not impacteddifferently across tillage systems which isgood news for farmers when they go tochoose a variety. Therefore, farmers canassess yield from performance tests anddisease ratings and not worry whether thewheat variety will be adversely affected bythe tillage system.
Acknowledgments
The assistance and cooperation from allthe area farmers where these on-farm siteswere located to the many county agents thatassisted with these comparisons to thefinancial support provided by the KansasWheat Commission allowed for this study tobe completed is acknowledged andappreciated.
This publication from the Kansas State University Agricultural Experiment Station and Cooperative Extension Service has been archived. Current information is available from http://www.ksre.ksu.edu.

NW-3
Average Soil Moisture at 18 inches
0
50
100
150
200
250
CT NT
cent
ibar
s
Table 1. County wheat yields, Northwest Kansas.Variety Tillage Lincoln Trego Sheridan Rawlins Wallace Decatur Gove Thomas Phillips
-----------------------------------------------------bu/a---------------------------------------------------
Jagger NT 43 63 68 47 62 62 73 75 65 Jagalene NT 41 64 77 47 57 63 81 67 72 Cutter NT 46 52 72 41 62 64 71 67 65 2137 NT 45 52 51 31 41 55 66 69 50 Stanton NT 37 38 60 39 52 60 65 65 58 T-81 NT 41 56 76 51 54 59 72 69 62
AVG 42 54 67 43 55 60 71 69 62
Jagger CT 40 63 57 48 63 58 63 45 55 Jagalene CT 40 52 68 48 58 63 68 36 67 Cutter CT 36 45 68 51 76 60 64 19 60 2137 CT 40 51 40 37 40 54 54 30 52 Stanton CT 26 36 46 43 41 57 57 28 54 T-81 CT 30 49 75 46 54 55 70 42 67
AVG 35 50 59 46 55 58 63 33 59
Figure 1. Soil moisture at 18 inches across four locations in Northwest Kansas.
This publication from the Kansas State University Agricultural Experiment Station and Cooperative Extension Service has been archived. Current information is available from http://www.ksre.ksu.edu.

NW-4
Table 2. No variety response by tillage system was evident at the four locationsthe 14 varieties and one blend were planted in Northwest Kansas.
Variety bu/a
TAM 111 73
Jagalene 67
NuHills 66
T-81 64
Jagger 64
Wesley 62
Overley 62
Cutter 62
Dominator 60
Jagger/2137/T-81 58
Millennium 58
Thunderbolt 56
2137 53
Stanton 52
Trego 51
LSD (0.05) 9.5
Table 3. No variety response by tillage system was evident at the nine locationsthe 6 varieties were planted in Northwest Kansas.
Variety bu/a
Jagalene 60
T-81 58
Jagger 57
Cutter 57
Stanton 48
2137 48
LSD (0.05) 7.5
This publication from the Kansas State University Agricultural Experiment Station and Cooperative Extension Service has been archived. Current information is available from http://www.ksre.ksu.edu.
NW-5
DRYLAND STRIP-TILL IN WESTERN KANSAS
B.L.S. Olson and R. Aiken
Summary
Interest in strip-till has risen over the pastfew years. Questions about whether strip-tillis beneficial on dryland fields is a majorconcern for producers in western Kansasevaluating this process. To provide answers tosome of these questions, a farmer assistedfield study was initiated in the fall of 2003.The objectives of this research were tocompare no-till to strip-till fertilizertreatments applied at various timings. Noresponse to strip-till was observed with grainsorghum in 2004 and 2005. Grain sorghumroot development was more likely influencedby soil moisture than tillage system. Forsunflower, a spring applied liquid strip-till andwinter applied anhydrous ammonia strip-tillyielded more than no-till over both years.Sunflower root development was probablymore influenced by tillage than by soilmoisture.
Introduction
Strip-till is a tillage process by which asix- to ten-inch strip of ground is tilled. Thebasic configuration consists of a coulter,disks, and a sub-surface knife for injectingfertilizer. Questions from farmers aboutwhether dryland strip-till is a viableproduction option in Northwest Kansas havearisen over the past few years. Some of thebenefits to strip-till may include warming ofthe ground in the spring which provides anideal environment for seedling crops anddestruction of compaction zones which areprevalent in western Kansas fields. Byworking the ground, however, moisture losscould negate any benefit strip-till couldprovide on dryland fields. Therefore, theobjectives of this research were to compareno-till to strip-till fertilizer treatments appliedat various timings.
Procedures
A two year farmer assisted field researchstudy was conducted on fields of wheatstubble ½ mile east of Quinter, KS. In 2004,previous cropping history indicated the fieldhad been no-till for the previous five years,whereas, for the 2005 site, the previouscropping history indicated the field had beenno-till for the previous four years. Treatment1 consisted of a fall applied strip-till treatmentof 50 lb/a of nitrogen (N) applied as 28%UAN which was strip-tilled on December 1,2003 and December 13, 2004. Treatment 2consisted of anhydrous ammonia strip-tilledon January 23, 2004 and December 13, 2004at 50 lb/a of N. For Treatment 3, 50 lb/a of Napplied as 32% UAN was strip-tilled on April19, 2004 and April 27, 2005. At planting, anadditional 25 lb/a of N was applied as urea ina 2x2 (two inches over from the planted rowand two inches in the soil) for all strip-tilltreatments. For Treatment 4 (the no-tilltreatment), 75 lb/a of N was applied as urea ina 2x2 at planting. All treatments had a total of75 lb/a of N applied. Plot size was 8- to 30-inch rows wide by 600 feet long. Treatmentswere randomized across three replications foreach crop. DeKalb DKF 3880 CL (sunflower)was planted on May 28, 2004 at 17,300seeds/a and May 20, 2005 at 18,900 seeds/a.Appropriate pest management measures weretaken to control weeds and head moth in thesunflower. Grain sorghum (NC+ 5B89) wasplanted on May 28, 2004 at 51,800 seeds/aand May 20, 2005 at 55,000 seeds/a. Plotswere harvested on October 9, 2004 andOctober 7, 2005.
In 2004, the site had higher than normalaverage rainfall for the period of April toSeptember (2004 - 20.51 inches, Average -17.79 inches). The higher than averagerainfall along with cooler than normaltemperatures for June and July allowed foradequate moisture to be available to meet the
This publication from the Kansas State University Agricultural Experiment Station and Cooperative Extension Service has been archived. Current information is available from http://www.ksre.ksu.edu.
NW-6
needs of the crops even though the crops wereplanted on eighteen inches of subsoilcontaining available moisture.
In 2005, rainfall was near normal for thegrowing season with adequate subsoilmoisture available at planting.
Root measurements were taken on fiverandomly selected plants from each plot aftergrain harvest. Roots were extracted carefullyfrom the soil for Treatment 2 and 4 for grainsorghum and Treatment 3 and 4 for sunflower.Roots were then washed, tagged, and airdried.
Root scores were obtained by evaluatingall of the roots from the plot. For sunflower,taproot mass was assessed on a scale of 1 to 5with 1 equal to greatest taproot mass and 5equal to least taproot mass. Straightness oftaproot was gauged on a scale of 1 to 5 with 1equal to very straight while 5 equalssignificant turning. For grain sorghum, rootmass was assessed on a scale of 1 to 5 with 1equal to greatest root mass and 5 equal to leastroot mass. Straightness of root mass wasgauged on a scale of 1 to 5 with 1 equal tovery straight while 5 equals significantturning. Lateral roots were scored on a scaleof 1 to 5 with 1 equal to abundant lateral rootsand 5 equal to sparse lateral roots, whilesecondary roots were evaluated on a scale of1 to 5 with 1 equal to abundant and 5 equal tosparse.
Results
Results from 2004 and 2005 suggest abenefit to strip-tilled sunflower compared tono-tilled sunflower, while there were nodifferences observed for grain sorghum. Withsunflower, two of the three strip-tilltreatments yielded more than no-till whenresults were combined across years (Table 4).The number of plants per acre were higher inthese treatments compared to no-till in 2004
while the difference in population betweenstrip-till treatments compared with no-till isnot as dramatic in 2005. Higher numbers ofseedling survival may be one reason whystrip-till yielded more.
Another reason for the higher yields forthe strip-till treatments could be better rootdevelopment (Table 5). Roots examined fromthe strip-till treatment had straighter rootswith more lateral and secondary root growththan those extracted from the no-till treatment.Although the field had been in no-till prior tothe study for four to five years, root growthwas still impeded which in turn likely affectedyield.
For grain sorghum, there was nodifference in grain yield (Table 6). Rootmeasurements in 2004 indicated root massand straightness of the root mass was higherin the strip-till treatment, whereas there wasno difference in root development forstraightness, mass, laterals, and secondaryroots in 2005 (Table 7). The difference indevelopment between the two years possiblycould be explained by the difference in soilconditions at planting. The increasedstraightness of root mass with more root massin the 2004 strip-till treatment was probablydue to the grain sorghum root more easilyexploring the loosened soil in the strip-tilltreatment versus the no-till treatment. In 2005,however, soil moisture was prevalent the firstfew weeks after planting which probablyallowed for roots in both treatments toadequately develop.
In summary, there was a positive responseto strip-tilling sunflower with Treatment 2 and3 yielding more than Treatment 4 (no-till)over both years. Sunflower root developmentwas more likely influenced by tillage than bysoil moisture. For grain sorghum, no responseto strip-till was observed in either 2004 or2005. Grain sorghum root development wasprobably more influenced by soil moisturethan tillage system.
This publication from the Kansas State University Agricultural Experiment Station and Cooperative Extension Service has been archived. Current information is available from http://www.ksre.ksu.edu.

NW-7
Table 4. Sunflower yield, Quinter, Kansas, 2004 and 2005.Trts. Tillage Test weight Population (plts/a)
2004 2005lbs/a
adj. 10.0% moisture2 Strip-till 29.6 12900 18000 2225
3 Strip-till 28.9 15700 17500 2218
4 No-till 29.8 11200 16500 2008
1 Strip-till 29.4 13600 16800 1984
LSD (0.05) NS 1084 167
Table 5. Sunflower root scores , Quinter, Kansas, 2004 and 2005.Trts Tillage Root Mass Tap Root
StraightnessLateral Roots Secondary Roots
3 Strip-till 2.9 1.9 2.1 2.4
4 No-till 2.9 3.1 3.0 3.3
LSD(0.05)
NS 0.77 0.48 0.55
Table 6. Grain sorghum yield, Quinter, Kansas, 2004 and 2005.Trts Tillage Test weight bu/a
adj. 14.0% moisture1 Strip-till 56.7 114
4 No-till 56.4 113
2 Strip-till 56.2 113
3 Strip-till 55.7 111
LSD (0.05) NS NS
Table 7. Grain sorghum root scores, Quinter, Kansas, 2004 and 2005.Trts Tillage Root Mass Root Mass
StraightnessLateralRoots
SecondaryRoots
2004 2005 2004 2005 2004 2005 2004 2005
2 Strip-till 1.3 3.3 1.3 3.1 1.3 3.0 1.3 3.1
4 No-till 4.0 3.0 3.0 2.6 2 2.7 2 2.7
LSD (0.05) 1.85 NS 0.93 NS NS NS NS NS
This publication from the Kansas State University Agricultural Experiment Station and Cooperative Extension Service has been archived. Current information is available from http://www.ksre.ksu.edu.
NW-8
PMDI FIELD TEST RESULTS FROM SHERIDAN COUNTY
B.L.S. Olson and D. Rogers
Introduction
Precision mobile drip irrigation is anirrigation system where drip hoses areattached to a center pivot sprinkler and drugon top of the ground. The placement of waterby the hoses on the ground could potentiallyincrease irrigation efficiency over a standarddrop nozzle system. In addition, problemsassociated with wet wheel tracks should bereduced. Drag hoses lying on the ground,however, could cause more managementconcerns for farmers. One example would beanimal damage to the drip hoses whichdisrupts uniform water distribution.
The objectives of this study were tocompare yield from corn irrigated usingprecision mobile drip irrigation (PMDI) tosprinkler irrigation with drops (drop nozzle).The second objective was to discern if theemitters have a reduction in water flow overthe season due to clogging. Figure 2 is asprinkler with the drag hoses attached.
Procedures
The study was initiated on a center pivotsprinkler located seven miles north and threemiles west of Hoxie, KS. Cooperation fromDLS Farms was very important to evaluatingthese two application methods. Three spans,spans 4, 5, and 7, of an eight span center pivotsprinkler were divided into two sections. Eachsection had either the PMDI system installedor the standard drop nozzle system. With thisconfiguration, three replications of eachmethod were achieved for a total of six plots.The center pivot sprinkler is nozzled to apply300 gpm. Drag hose spacing on the PMDIsystem was 60 inches, whereas the spacing onthe drop nozzle system was 120 inches. Theentire flow to the center pivot was screenfiltered to 50 mesh.
For the 2004 growing season, the farmerstrip-tilled the field the previous fall and
applied 75 lb/a of nitrogen (N) as anhydrousammonia and 7-25-0 lb/a as 10-34-0. Thefield was planted on May 2, 2004 in circularrows with Mycogen 2E685 treated withCruiser at 26,000 seeds/a with 50 lb/a of N as32% UAN applied in a 2x2. Appropriate pestmanagement measures were taken to controlweeds and insects.
For the 2005 growing season, manure wasapplied to the field, and then the field wasstrip-tilled in the fall. On April 28, 2005Mycogen 2E762 treated with Cruiser wasseeded in straight noncircular rows at 26,000seeds/a with 50 lb/a N as 32% UAN appliedin a 2x2. Appropriate pest managementmeasures were taken to control weeds andinsects.
Emitter water flow at the end emitter andthen the 5, 10, and 15 emitter from the end oftwo drag hoses from each plot were capturedfor one minute on May 26, August 4, andSeptember 13 in 2004 and May 27, July 29,and September 8 in 2005. Water flow for theentire drag hose was collected for the twodrag hoses along with the water flow fromtwo drop nozzles on the same span.
Corn yield was collected in two ways.First, samples were hand harvested from fortyfeet of each plot. Samples were then dried,threshed, weighed, and yield was calculatedon a bu/a basis. Yield was also collected atharvesting using a Green Star yieldmonitoring system for the entire field.
Results
Weather conditions over the summerbrought supplemental rainfall which allowedfor respectable yields to be achieved at thesite for both years. When comparing handharvest yields, there was no significantdifference between the PMDI treatment andthe drop nozzle treatment in either year orwhen combined across years (Table 8). Whenlooking at the 2004 field map (Fig. 3) or the
This publication from the Kansas State University Agricultural Experiment Station and Cooperative Extension Service has been archived. Current information is available from http://www.ksre.ksu.edu.
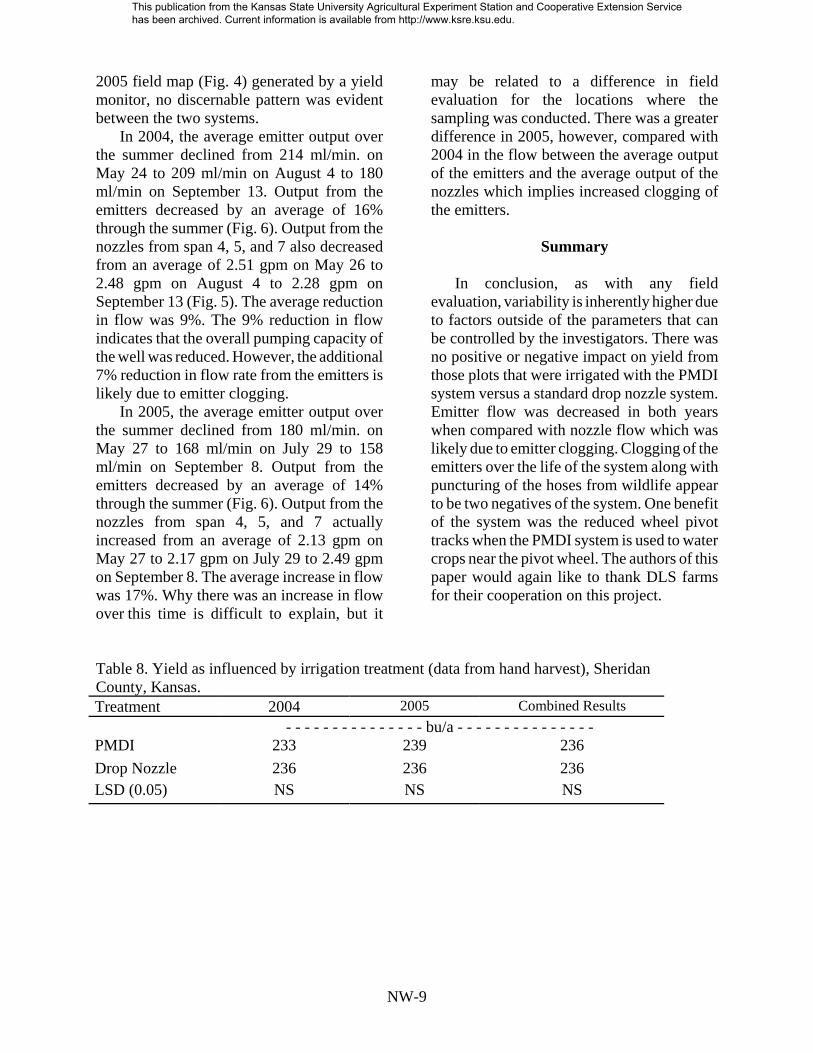
NW-9
2005 field map (Fig. 4) generated by a yieldmonitor, no discernable pattern was evidentbetween the two systems.
In 2004, the average emitter output overthe summer declined from 214 ml/min. onMay 24 to 209 ml/min on August 4 to 180ml/min on September 13. Output from theemitters decreased by an average of 16%through the summer (Fig. 6). Output from thenozzles from span 4, 5, and 7 also decreasedfrom an average of 2.51 gpm on May 26 to2.48 gpm on August 4 to 2.28 gpm onSeptember 13 (Fig. 5). The average reductionin flow was 9%. The 9% reduction in flowindicates that the overall pumping capacity ofthe well was reduced. However, the additional7% reduction in flow rate from the emitters islikely due to emitter clogging.
In 2005, the average emitter output overthe summer declined from 180 ml/min. onMay 27 to 168 ml/min on July 29 to 158ml/min on September 8. Output from theemitters decreased by an average of 14%through the summer (Fig. 6). Output from thenozzles from span 4, 5, and 7 actuallyincreased from an average of 2.13 gpm onMay 27 to 2.17 gpm on July 29 to 2.49 gpmon September 8. The average increase in flowwas 17%. Why there was an increase in flowover this time is difficult to explain, but it
may be related to a difference in fieldevaluation for the locations where thesampling was conducted. There was a greaterdifference in 2005, however, compared with2004 in the flow between the average outputof the emitters and the average output of thenozzles which implies increased clogging ofthe emitters.
Summary
In conclusion, as with any fieldevaluation, variability is inherently higher dueto factors outside of the parameters that canbe controlled by the investigators. There wasno positive or negative impact on yield fromthose plots that were irrigated with the PMDIsystem versus a standard drop nozzle system.Emitter flow was decreased in both yearswhen compared with nozzle flow which waslikely due to emitter clogging. Clogging of theemitters over the life of the system along withpuncturing of the hoses from wildlife appearto be two negatives of the system. One benefitof the system was the reduced wheel pivottracks when the PMDI system is used to watercrops near the pivot wheel. The authors of thispaper would again like to thank DLS farmsfor their cooperation on this project.
Table 8. Yield as influenced by irrigation treatment (data from hand harvest), Sheridan County, Kansas.Treatment 2004 2005 Combined Results
- - - - - - - - - - - - - - - bu/a - - - - - - - - - - - - - - - PMDI 233 239 236
Drop Nozzle 236 236 236LSD (0.05) NS NS NS
This publication from the Kansas State University Agricultural Experiment Station and Cooperative Extension Service has been archived. Current information is available from http://www.ksre.ksu.edu.

NW-10
Figure 2. Sprinkler with drag hoses attached.
Figure 3. 2004 Field Map
This publication from the Kansas State University Agricultural Experiment Station and Cooperative Extension Service has been archived. Current information is available from http://www.ksre.ksu.edu.

NW-11
Figure 4. 2005 Field Map.
This publication from the Kansas State University Agricultural Experiment Station and Cooperative Extension Service has been archived. Current information is available from http://www.ksre.ksu.edu.

NW-12
0
40
80
120
160
200
240
Flo
w -
ml/
min
May 26 August 4 September 13sampling dates
Span 4 Span 5 Span 7
Emitter Response - 2004
0
40
80
120
160
200
240
Flo
w -
ml/
min
May 27 July 29 September 8sampling dates
Span 4 Span 5 Span 7
Emitter Response - 2005
Figure 5. Emitter response from 2004 and 2005.
This publication from the Kansas State University Agricultural Experiment Station and Cooperative Extension Service has been archived. Current information is available from http://www.ksre.ksu.edu.

NW-13
0
0.5
1
1.5
2
2.5
3
3.5
Flo
w -
ga
l/m
in
May 26 August 4 September 13sampling date
Span 4 Span 5 Span 7
Nozzle Response - 2004
0
0.5
1
1.5
2
2.5
3
3.5
Flo
w -
ga
l/m
in
May 27 July 29 September 8sampling date
Span 4 Span 5 Span 7
Nozzle Response - 2005
Figure 6. Nozzle response from 2004 and 2005.
This publication from the Kansas State University Agricultural Experiment Station and Cooperative Extension Service has been archived. Current information is available from http://www.ksre.ksu.edu.

This report was produced by the Department of Communications, K-State Research and Extension. Contents of this publication may be freely reproduced for educational purposes. All other rights reserved. In each case, give
credit to the author(s), Kansas State University, and the date it was published.
K-State Research and Extension publications are available online at: www.oznet.ksu.edu
Note: Brand names appearing in this publication are for product identification purposes only.No endorsement is intended, nor is criticism implied of similar products not mentioned.
Kansas State University Agricultural Experiment Station and Cooperative Extension Service, Manhattan 66506 SRP 975 April 2007 K-State Research and Extension is a equal opportunity provider and employer.
This publication from the Kansas State University Agricultural Experiment Station and Cooperative Extension Service has been archived. Current information is available from http://www.ksre.ksu.edu.