agriculture in the united kingdom
TRANSCRIPT

Agriculture in the United Kingdom
2011Department for Environment, Food and Rural Affairs
Department of Agriculture and Rural Development (Northern Ireland)
The Scottish Government, Rural and Environment Research and Analysis Directorate
Welsh Assembly Government, The Department for Rural Affairs and Heritage


Agriculturein the United
Kingdom2011
Produced by:
Department for Environment, Food and Rural Affairs
Department of Agriculture and Rural Development (Northern Ireland)
Welsh Assembly Government, The Department for Rural Affairs and Heritage
The Scottish Government, Rural and Environment Research and Analysis Directorate


ContentsPreface vii Legal basis Changes Structure of tables
Chapter 1 - Key Events in 2011 1 Total Income from Farming Common Agricultural Policy Reform Proposals Bluetongue free status gained E. coli outbreak Higher welfare enriched poultry cages Drought declared in parts of England Macdonald Red Tape Review
Chapter 2 - Farming Income 3 Summary Long-term trends in farming income (chart 2.1) Summary measures including Total Income from Farming (table 2.1) Summary measures by country (table 2.2) Income measures in the EU (chart 2.2, table 2.3) Farm Business Incomes by farm type (tables 2.4, 2.5 & chart 2.3) Farm Income Measures Diversification
Chapter 3 - The Structure of the Industry 13 Summary Introduction Land use, crop areas and livestock numbers (tables 3.1, 3.2, charts 3.1 to 3.3) Numbers and sizes of holdings and enterprises (tables 3.3 to 3.5) Labour force in agriculture (table 3.6) Age of holders (table 3.7)
Chapter 4 - Prices 27 Summary Price indices (table 4.1, Chart 4.1)
iii

iv
Chapter 5 - Commodities
Crops 29
Crops summary Data revisions Cereals (tables 5.1 to 5.4) Straw Oilseed rape (table 5.5) Linseed (table 5.6) Sugar beet and sugar (table 5.7) Peas and beans for harvesting dry (table 5.8) Fresh vegetables (table 5.9) Plantsandflowers(table5.10) Potatoes (table 5.11) Fresh fruit (table 5.12
Livestock 45
Summary Livestock Cattle and calves; beef and veal (table 5.13) Pigs and pigmeat (table 5.14) Sheep and lambs; mutton and lamb (table 5.15) Poultry and poultrymeat (table 5.16) Milk (table 5.17) Hen eggs (table 5.18)
Chapter 6 - Intermediate Consumption 53
Summary Introduction (chart 6.1) Motor and Machinery fuels (charts 6.2, 6.3) Electricity and fuels for heating (chart 6.4) Fertiliser (chart 6.5) Animal feed (chart 6.6, table 6.1)
Chapter 7 - The Food Industry 59
Summary Contribution of the agri-food sector to the national economy (chart 7.1, table 7.1) Economic summary of the UK food chain (chart 7.2) Food chain employees and self-employed farmers (chart 7.3) Food manufacturing Food wholesaling Food retailing The food chain Non-residential catering Trade in food, feed and drink (table 7.1) Food Production to supply ratio (chart 7.4) Distinction between competitiveness and food security Origins of food consumed in the United Kingdom (chart 7.5) Consumer expenditure Farmers’ share of consumers’ expenditure (table 7.2, chart 7.6) Changes in consumer price indices (chart 7.7)

v
Chapter 8 - Overseas Trade 67
Summary Introduction Trade in food, feed and drink (chart 8.1, table 8.1) Trading Partners (charts 8.2, 8.3) Global exports 2010 (map 8.1) Global imports 2010 (map 8.2) Exports and imports (charts 8.4, 8.5) Trade in key commoditites (tables 8.2, 8.3) Trade with EU 26 Countries Bacon and ham (charts 8.6, 8.7) Pork (charts 8.8, 8.9) Milk and Cream (charts 8.10, 8.11) Trade with key trading partners Lamb and mutton (charts 8.12, 8.13) Beef and veal (charts 8.14, 8.15) Poultrymeat (chart 8.16, 8.17) Poultrymeat products (charts 8.18, 8.19) Unmilled wheat (chart 8.20, 8.21) Fresh vegetables (chart 8.22, 8.23) Fresh fruit (chart 8.24, 8.25)
Chapter 9 - Accounts 81
Summary Introduction Production and income account at current prices (table 9.1) Definitionsoftermsusedintables9.1and9.2 Changes in outputs and inputs (table 9.2) Balance sheets (table 9.3) Accumulation accounts (table 9.4) Revaluation accounts (table 9.5) Interest (table 9.6) Changes in volume of capital assets (table 9.7)
Chapter 10 - Productivity 95 Summary Total factor productivity (chart 10.1, table 10.1, 10.2)
Chapter 11 - Public Payments 101
Summary Direct payments to farmers (chart 11.1) Direct payments to farmers and levies recorded in the production and income account (table 11.1) Payments to farmers by country in 2010 (table 11.2) Payments made through key measures of the Rural Development Programmes (table 11.3) Take-up of agri-environment schemes (tables 11.4, 11.5)

vi
Chapter 12 - Organic Farming 107 Summary Introduction Total UK organic land (in-conversion and fully organic) (table 12.1) Organically managed land (chart 12.1) Organic and in-conversion land use (table 12.2) Organic producers and/or processors - regional (table 12.3) Numbers of crops/livestock organic producers and processors (table 12.4) Estimates of organic and in-conversion livestock numbers (table 12.5)
Chapter 13 - Environment 113 Summary Introduction (chart 13.1) Land use (chart 13.2) Agri-Environment Schemes Fertiliser use (charts 13.3, 13.4) Soil nutrient balances Water quality Water use Greenhouse gas emissions Air Quality Pesticides Farmland bird index Chapter 14 - Key Statistics for EU Member States 121 Summary Introduction Incomes Indicator A of the income from agricultural activity (chart 14.1) Agricultural products Wheat (chart 14.2) Cow’s milk (chart 14.3) Pigmeat (chart 14.4) Beef and veal (chart 14.5) Sheep and goat meat (chart 14.6) Price indices Crop products (chart 14.7) Animal and animal products (chart 14.8) Total means of agricultural production ( chart 14.9)

PrefaceLegal basis
AgricultureintheUnitedKingdom2011fulfilstherequirementundertheAgricultureAct1993thatMinisters1. publish an annual report on such matters relating to price support for agricultural produce as they consider relevant. The Government will draw on this information when considering policy issues, including proposals by the European Commission in respect of the Common Agricultural Policy (CAP) and the provision of agricultural support.
Changes
Someofthefiguresnowgivenforpastyearsmaydifferfromthosepublishedinprecedingissues.This2. is because of the use of later information, changes in the scope and nature of the available data and improvements in statistical methods.
AUK 2011 does not include a chapter on Animal Health and Welfare. Information on Animal Health and 3. Welfare statistics can be found at: http://www.defra.gov.uk/statistics/foodfarm/landuselivestock/cattletb/
Due to a lack of available data, publication of Defra’s Agricultural Land Sales and Prices in England 4. was suspended in 2005. More recent information on land prices is available from the Royal Institution of Chartered Surveyors (RICS) at http://www.rics.org/ruralmarketsurvey.
Structure of Tables
Most of the data are on a calendar year basis. The data for 2011 are provisional because information for 5. 2010 was still incomplete at the time of publication and therefore an element of forecasting was required.
The following points apply throughout:6.
(a)AllfiguresrelatetotheUnitedKingdomunlessotherwisestated.
(b) In the tables
- means 'nil' or 'negligible' (less than half the last digit shown). . . means 'not available' or 'not applicable'.
(c)Thefiguresforimportsandexportsincludethosefrominterventionstocksandthefiguresforexports include re-exports. Imports are based on country of consignment. Exports are based on country of reportedfinaldestination.ThesourceofOverseasTradeStatisticsisHMRevenueandCustoms.
(d) Where statistics are shown for the European Union (EU) as a whole they represent the present Member States in all years regardless of when they became a member.
Wherefiguresarepresentedinrealtermsthemeasureofinflationusedistheall-itemsRetailPriceIndex.7.
vii

viii

Chapter1
1
Cha
pter
1 -
Key
Eve
nts
in 2
011
Key events in 2011
Total Income from Farming
In 2011 total income from farming recovered from the fall in 2010 to £5.69 billion, a 25 per cent increase in 1. real terms from 2010 after adjusting for inflation. Similarly the total income from farming per annual work unit of entrepreneurial labour (for example, farmers and their partners) has risen to £30,900, a 24 per cent increase in real terms when compared to 2010.
Common Agricultural Policy Reform Proposals
The EU published the Common Agricultural Policy on 12 October. In December Defra launched an informal 2. consultation to gather the views of farmers, environmental groups and others with an interest in the Common Agricultural Policy. Defra ministers began Common Agricultural Policy negotiations on behalf of the United Kingdom.
Bluetongue free status gained
Restrictions on British exports of sheep and cattle, which have been in place since 2007 following the 3. first cases of bluetongue, were lifted on 5 July when Great Britain achieved bluetongue free status. This means that animals exported to other bluetongue free countries no longer require vaccination, or any other bluetongue requirements.
E. coli outbreak
The outbreak of E coli in Germany during May and June impacted on growers of fruit and vegetables 4. across the EU, including our domestic growers. Retail prices for home produced salad crops remained largely unaffected although demand declined with the result that more went to the wholesale markets where prices fell. The Russian Federation imposed a ban on EU fruit and vegetables which again led to more produce going to the wholesale markets across the EU.
Higher welfare enriched poultry cages
From the 1 January 2012 all EU member state egg producers should have switched from battery cages to 5. higher welfare ‘enriched’ cages. It is estimated that the United Kingdom industry alone spent £400 million ensuring hens live in better conditions.
Drought declared in parts of England
In June 2011 drought was declared in East Anglia with near drought conditions in South East, South West 6. and the Midlands. These were the driest conditions across England and Wales since 1900.
1.

AGRICULTURE IN THE UNITED KINGDOM 2010
2
AGRICULTURE IN THE UNITED KINGDOM 2010
Macdonald Red Tape Review
Defra has responded to the Farming Regulation Task Force report chaired by Richard Macdonald. The 7. report’s key strategic message was that Defra and its agencies need to establish an entirely new approach to, and culture of, regulation.
Defra is keen to take forward the over-riding principle of ‘earned recognition’ with inspections taking place 8. where they are most needed. There were 220 recommendations directed at Defra, of which 159 were accepted, 30 were rejected and the remaining 31 are under consideration.
Defra’s full response was published in 2012 9. http://www.defra.gov.uk/food-farm/farm-manage/farm-regulation/

3
Cha
pter
2 -
Farm
ing
inco
me
Chapter2 Farming income1.
Summary
In 2011:
Total Income from Farming is estimated to have risen by 25 per cent in real terms after adjusting for ●inflation,to£5.69billion.
Total Income from Farming per annual work unit of entrepreneurial labour is estimated to have increased by ●24 per cent in real terms to £30,900.
In the longer term, this represents the best performance for the agricultural industry in the United Kingdom ●since the mid-1990s.
Long-term trends in farming income (chart 2.1)
In 2011, Total Income from Farming, a key measure of the performance of the agricultural industry in 1. theUnitedKingdom,isestimatedtohaverisenby25percentinrealtermsafteradjustingforinflation.Total Income from Farming per annual work unit of entrepreneurial labour is estimated to have increased by 24 per cent in real terms to £30,900. In the longer term, this represents the best performance for the agricultural industry in the United Kingdom since the mid-1990s.
Thedramaticriseinfarming’sprofitabilityintheearlyninetiesfollowedthedeclineintheeuro/sterling2. exchange rate after the United Kingdom left the Exchange Rate Mechanism. The equally rapid reverse in the second half of the decade was caused by increases in the exchange rate, lower world commodity prices andtheimpactofBSE.Theincreasein2008reflectedadeclineintheeuro/sterlingexchangerateastheUnited Kingdom entered into recession and increases in commodity prices.
15 000
20 000
25 000
30 000
35 000
4 000
5 000
6 000
7 000
8 000
9 000 Total Income from
Farming per A
labour (£ per A
rom
farm
ing
(£ m
illio
n)
0
5 000
10 000
15 000
20 000
25 000
30 000
35 000
0
1 000
2 000
3 000
4 000
5 000
6 000
7 000
8 000
9 000
1986
1987
1988
1989
1990
1991
1992
1993
1994
1995
1996
1997
1998
1999
2000
2001
2002
2003
2004
2005
2006
2007
2008
2009
2010
2011
Total Income from
Farming per A
WU
of entrepreneurial labour (£ per A
WU
)
Tota
l inc
ome
from
farm
ing
(£ m
illio
n)
Source: Defra Statistics
Total Income from Farming (£ million)
Total Income from Farming per AWU of entrepreneurial labour (£ per AWU)
0
5 000
10 000
15 000
20 000
25 000
30 000
35 000
0
1 000
2 000
3 000
4 000
5 000
6 000
7 000
8 000
9 000
1986
1987
1988
1989
1990
1991
1992
1993
1994
1995
1996
1997
1998
1999
2000
2001
2002
2003
2004
2005
2006
2007
2008
2009
2010
2011
Total Income from
Farming per A
WU
of entrepreneurial labour (£ per A
WU
)
Tota
l inc
ome
from
farm
ing
(£ m
illio
n)
Source: Defra Statistics
Total Income from Farming (£ million)
Total Income from Farming per AWU of entrepreneurial labour (£ per AWU)
Chart 2.1 Long-term trends in farming income in real terms at 2011 prices; United Kingdom

4
AGRICULTURE IN THE UNITED KINGDOM 2011
Summary measures including Total Income from Farming (table 2.1)
Table 2.1 shows the main indicators derived from the aggregate agricultural account at the United Kingdom 3. level. These are:
Net Value Added - a measure of the value added by the agricultural industry to all goods and services ●from outside agriculture after provision has been made for depreciation. It includes all subsidies but excludes interest, rent or labour costs.
Total Income from Farming - a key measure of the performance of the agricultural industry in the United ●Kingdom. It is income generated by production within the agriculture industry, including subsidies, and representsbusinessprofitsandremunerationforworkdonebyownersandotherunpaidworkers.
Table 2.1 Summary measures from the aggregate agricultural account; United KingdomEnquiries: Nick Olney on +44 (0)1904 455355 email: [email protected]
£million(unlessotherwisespecified) Calendar years
Year Net value added at factor cost
Income from farming Cashflow from farmingTotal Income
from FarmingCompensation of employees
Income from agriculture of
total labour input
Total Income from Farming
per AWU of entrepreneurial
labour (a)
Current prices A B A + B (£)
2001 4 256 1 661 1 859 3 520 7 700 3 710
2002 4 744 2 242 1 836 4 078 10 700 2 629
2003 5 300 2 811 1 831 4 642 13 700 3 286
2004 5 244 2 661 1 899 4 560 13 200 2 688
2005 5 043 2 400 1 954 4 354 12 000 627
2006 5 178 2 505 1 975 4 479 12 800 2 862
2007 5 734 2 953 2 005 4 958 15 500 3 576
2008 7 241 4 458 2 068 6 526 23 900 3 858
2009 7 254 4 554 2 165 6 719 24 800 4 329
2010 7 096 4 342 2 208 6 550 23 700 4 651
2011 8 544 5 693 2 292 7 985 30 900 5 785
In real terms, 2011 prices
2001 5 774 2 253 2 522 4 776 10 500 5 034
2002 6 333 2 993 2 450 5 444 14 200 3 510
2003 6 874 3 646 2 375 6 021 17 700 4 262
2004 6 606 3 352 2 392 5 744 16 600 3 386
2005 6 178 2 940 2 394 5 333 14 800 768
2006 6 147 2 973 2 344 5 317 15 200 3 398
2007 6 528 3 361 2 283 5 644 17 600 4 071
2008 7 928 4 880 2 264 7 144 26 100 4 223
2009 7 984 5 012 2 383 7 395 27 300 4 764
2010 7 465 4 567 2 323 6 891 24 900 4 893
2011 8 544 5 693 2 292 7 985 30 900 5 785(a) An annual work unit (AWU) represents the equivalent of an average full-time person engaged in agriculture.
Cha
pter
2 -
Farm
ing
Inco
me
5
Compensation of employees - the full costs of employees to the business. ●
Income from agriculture of total labour input - the sum of ‘Total Income from Farming’ and ●‘Compensation of employees’.
Total Income from Farming per Annual Work Unit (AWU) of entrepreneurial labour – a measure of ●income received by owners and other unpaid workers. To take account of part-time and seasonal work, agricultural labour is measured in annual work units; one annual work unit correspond to the input of one person engaged in agricultural activities on a full-time basis over one year.
Cashflowfromfarming–thisreflectssalesandexpenditureongrossfixedcapitalformationand ●includescapitaltransferspaidtotheindustryinexchangeforassets.Variationsincashflowsince2005largelyreflectdelaysinpaymentsmadethroughtheSinglePaymentScheme.
Summary measures by country (table 2.2)
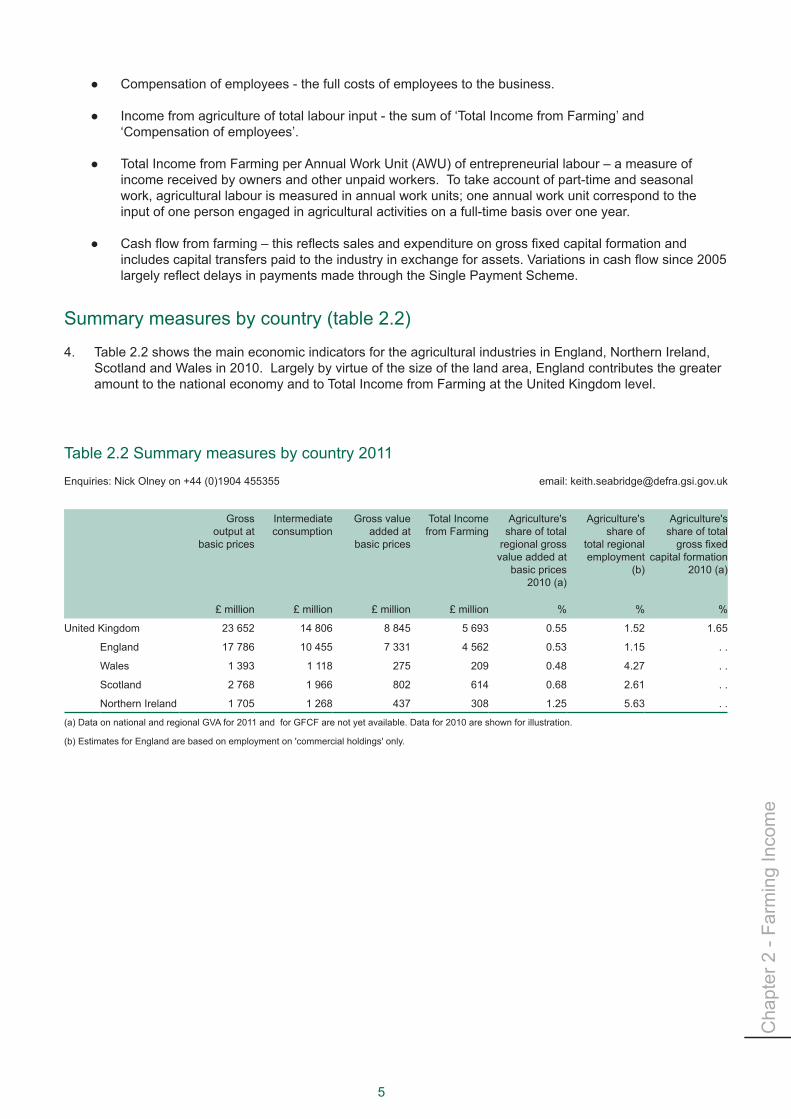
Table 2.2 shows the main economic indicators for the agricultural industries in England, Northern Ireland, 4. Scotland and Wales in 2010. Largely by virtue of the size of the land area, England contributes the greater amount to the national economy and to Total Income from Farming at the United Kingdom level.
Table 2.2 Summary measures by country 2011Enquiries: Nick Olney on +44 (0)1904 455355 email: [email protected]
Gross output at
basic prices
Intermediate consumption
Gross value added at
basic prices
Total Income from Farming
Agriculture's share of total
regional gross value added at
basic prices 2010 (a)
Agriculture's share of
total regional employment
(b)
Agriculture's share of total grossfixed
capital formation 2010 (a)
£ million £ million £ million £ million % % %
United Kingdom 23 652 14 806 8 845 5 693 0.55 1.52 1.65
England 17 786 10 455 7 331 4 562 0.53 1.15 . .
Wales 1 393 1 118 275 209 0.48 4.27 . .
Scotland 2 768 1 966 802 614 0.68 2.61 . .
Northern Ireland 1 705 1 268 437 308 1.25 5.63 . .
(a) Data on national and regional GVA for 2011 and for GFCF are not yet available. Data for 2010 are shown for illustration.
(b) Estimates for England are based on employment on 'commercial holdings' only.
6
AGRICULTURE IN THE UNITED KINGDOM 2011
7.1
-
-14.0
-10.3
-8.9
-5.6
-5.6
-2.0-1.5
1.2
1.6
5.1
8.4
9.0
10.0
11.0
13.7
16.1
17.0
19.9
20.2
20.3
23.2
23.7
24.7
27.5
49.2
56.8
-20.0
-10.0
0.0
10.0
20.0
30.0
40.0
50.0
60.0
% change 2010 to 2011
7.1
-22.5
-14.0
-10.3
-8.9
-5.6
-5.6
-2.0-1.5
1.2
1.6
5.1
8.4
9.0
10.0
11.0
13.7
16.1
17.0
19.9
20.2
20.3
23.2
23.7
24.7
27.5
49.2
56.8
-40.0
-30.0
-20.0
-10.0
0.0
10.0
20.0
30.0
40.0
50.0
60.0
EU
27
Belgium
Malta
Portugal
Netherlands
Finland
Greece
France
Spain
Sw
eden
Cyprus
Slovenia
United K
ingdom
Poland
Latvia
Italy
Germ
any
Austria
Slovakia
Lithuania
Denm
ark
Estonia
Bulgaria
Czech R
epublic
Luxembourg
Ireland
Hungary
Rom
ania
% change 2010 to 2011
Chart 2.2 Changes in incomes from agricultural activity across the EU: Indicator A
Table 2.3 Eurostat income indicatorsEnquiries: Nick Olney on +44 (0)1904 455355 email: [email protected]
Index 2005 = 100
2005 2006 2007 2008 2009 2010 2011
Net value added at factor cost of agriculture per total Annual Work Unit (Indicator A)
United Kingdom 100.0 101.9 109.3 143.3 134.5 138.8 150.4
EU27 100.0 104.0 114.5 110.8 98.5 111.4 119.1
Net agricultural entrepreneurial income per unpaid Annual Work Unit (Indicator B)
United Kingdom 100.0 102.8 114.0 182.0 169.0 173.8 193.9
EU27 100.0 104.7 118.8 110.4 90.2 110.8 121.9
Net entrepreneurial income from agriculture (Indicator C)
United Kingdom 100.0 100.7 109.1 170.7 156.6 159.4 177.7
EU27 100.0 101.8 109.7 99.6 79.0 94.1 100.0
Source: Eurostat database. Last update 28.03.12. Extracted 08.05.12
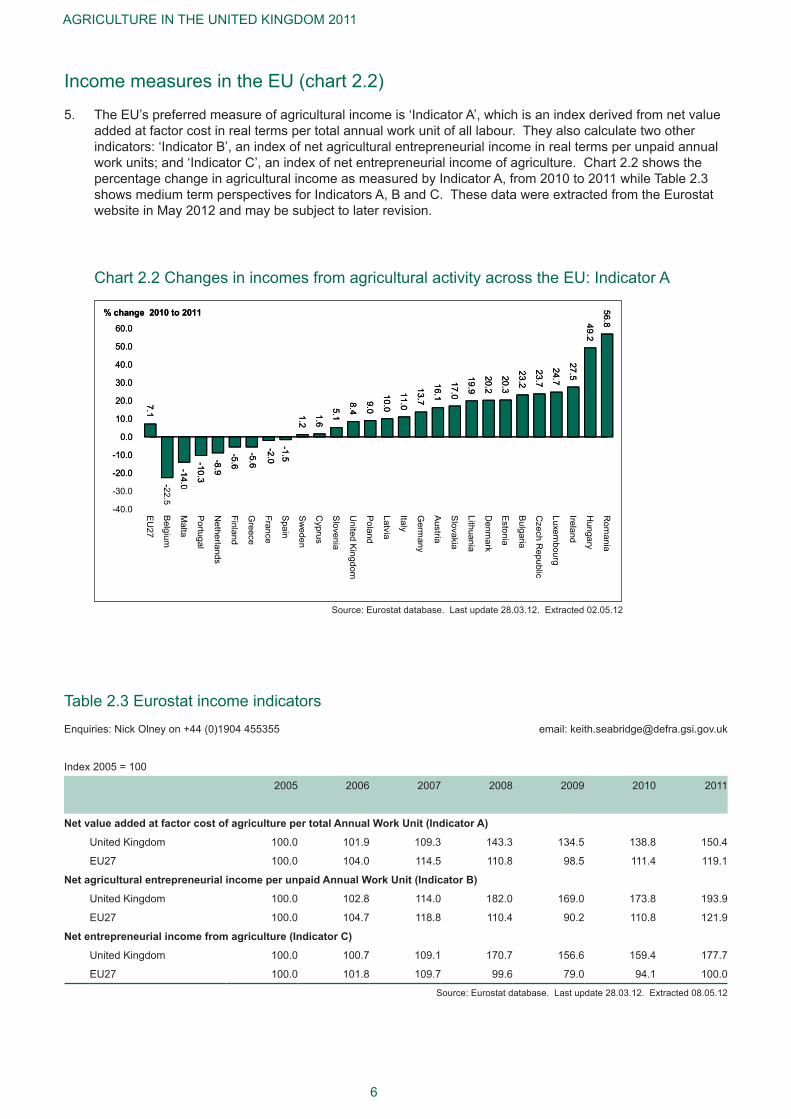
Income measures in the EU (chart 2.2)
The EU’s preferred measure of agricultural income is ‘Indicator A’, which is an index derived from net value 5. added at factor cost in real terms per total annual work unit of all labour. They also calculate two other indicators: ‘Indicator B’, an index of net agricultural entrepreneurial income in real terms per unpaid annual work units; and ‘Indicator C’, an index of net entrepreneurial income of agriculture. Chart 2.2 shows the percentage change in agricultural income as measured by Indicator A, from 2010 to 2011 while Table 2.3 shows medium term perspectives for Indicators A, B and C. These data were extracted from the Eurostat website in May 2012 and may be subject to later revision.
Source: Eurostat database. Last update 28.03.12. Extracted 02.05.12
Cha
pter
2 -
Farm
ing
Inco
me
7
Farm Business Incomes by farm type (tables 2.4, 2.5 and chart 2.3)
Farm Business Income is presented in Tables 2.4 and 2.5. It replaced Net Farm Income as the headline 6. measure of farming income in 2007. Chart 2.3 shows the distribution of performance for farms in the United Kingdom in 2010/11.
Estimates of Farm Business Income for 2011/12 (i.e. year ended February 2012) at current prices are 7. shown in table 2.4 for England, Wales and Northern Ireland alongside outturn data for the previous six years. These estimates include Single Payment Scheme receipts which are recorded as due for the appropriate accounting year, e.g. receipts of the 2011 Single Payment Scheme are recorded in the 2011/12 accounting year.
It should be noted that forecasts of farm business income in 2011/12 are not produced in Scotland. Also 8. data for 2010/11 are based on standard output typology for England, Wales and Northern Ireland but on standard gross margin typology for Scotland.
Changes to the Single Payment receipt were quite small in 2011 as there was only a small increase in the 9. exchange rate from 0.85995 in September 2010 to 0.86665 in September 2011.
Further increases in average Farm Business Incomes are expected on cereal farms in England for 2011/12, 10. reflectingmuchhigheroutputfromoilseedrapecombinewithcontinuingfirmpricesforcereals.Ongeneralcropping farms, the fall in potato prices is expected to have a substantial impact on incomes leading to a fall of around 25 per cent.
Average Farm Business Income on dairy farms is forecast to increase across England, Wales and Northern 11. Ireland in 2011/12 compared with the previous year. Total output is expected to increase substantially due tohighermilkpricesandfirmervaluesforbreedingheifersandcullcows.Feedandfertilisercostsarealsoexpected to increase but these are more than offset by the higher output.
In England and Wales, grazing livestock farms in both the lowland and Less Favoured Areas (LFA) are 12. expectedtoseeanincreaseinaverageincomesin2011/12.Thisistheresultoffirmerpricesforfatandstorecattlealongsidecontinuinghighvaluesforfinishedlambs,cullewesandreplacementbreedingsheep.In Northern Ireland incomes on grazing livestock farms in the LFA are predicted to fall slightly due to the increases in product prices not being enough to offset the increases in input costs.
Average Farm Business Income is forecast to fall on specialist pig and poultry farms in England 2011/12. 13. This is primarily the result of higher production costs, particularly feed, which offsets the increased output from eggs, pig and poultrymeat. For specialist pig farms the falling value of trading livestock towards the end of the accounting year is also expected to lead to a considerable change in the year on year closing valuation.
Incomes on mixed farms in England are also expected to increase slightly in 2011/12. This is due to an 14. increase in output across all enterprises but particularly from the combinable cropping and cattle rearing enterprises.
Table 2.5 shows the variation in the level of Farm Business Income, Net Farm Income and Cash Income 15. across farms in England, Wales, Scotland and Northern Ireland 2010/11. Across the individual countries betweenafifthandathirdoffarmshadaFarmBusinessIncomeof£10,000orless.Notethatthefiguresfor Scotland are based on a different typology.
A greater proportion of farms fall into the lower band income ranges for Net Farm Income. This is because 16. Net Farm Income is a narrower measure of income; it is net of an imputed rent on owned land and an imputed cost for unpaid labour (apart from farmer and spouse).
Chart 2.3 shows the differences in performance of farms in the United Kingdom for 2010/11. Performance 17. ismeasuredas£ofoutputper£100ofinput.Thechartillustratesthesignificantvariationinperformanceacross all farms in the United Kingdom with just over 11 per cent of farms failing to recover their costs.

8
AGRICULTURE IN THE UNITED KINGDOM 2011
Table 2.4 Farm business income by country and type of farm (a)Enquiries: +44 (0)20 7238 3274 email: [email protected]
Average farm business income per farm (£ farm) Accounting years ending on average in February
Standard Gross Margin (SGM) Typology (c) Standard Output (SO) Typology (c)
2008/09 2009/10 (b) 2010/11 2009/10 2010/11 2011/12
(provisional)
At current prices
England
Cereals 69 700 46 000 . . 42 000 84 800 90 000
General cropping 96 000 66 000 . . 66 600 111 700 84 800
Dairy 69 400 56 100 . . 59 100 66 200 84 300
Grazing livestock (lowland) 18 500 22 000 . . 28 900 21 400 28 200
Grazing livestock (LFA) 17 100 22 200 . . 25 900 21 300 23 800
Specialist pigs 59 100 71 600 . . 75 400 44 400 35 600
Specialist poultry 47 700 66 300 . . 72 700 68 200 62 500
Mixed 29 300 39 800 . . 32 800 50 900 54 500
Wales
Dairy 62 200 52 200 . . 49 700 57 100 63 900
Grazing livestock (lowland) 24 400 32 300 . . 33 900 29 700 35 800
Grazing livestock (LFA) 24 500 33 600 . . 34 500 27 100 32 000
Scotland
Cereals 41 800 16 300 50 900 . . . . . .
General cropping 60 900 18 400 59 700 . . . . . .
Dairy 78 400 58 900 73 600 . . . . . .
Grazing livestock (lowland) 24 000 32 100 34 300
Grazing livestock (LFA) 24 400 37 200 34 200 . . . . . .
Mixed 45 300 39 700 47 800 . . . . . .
Northern Ireland
Dairy 37 500 19 300 . . 19 900 51 600 61 500
Grazing livestock (LFA) 20 200 21 200 . . 21 600 19 300 19 100
United Kingdom . .
Cereals 65 600 42 100 . . . . . . . .
General cropping 87 900 55 100 . . . . . . . .
Dairy 62 400 47 700 . . . . . . . .
Grazing livestock (lowland) 19 100 22 600 . .
Grazing livestock (LFA) 21 800 29 600 . . . . . . . .
Specialist pigs 51 600 67 400 . . . . . . . .
Specialist poultry 47 700 66 300 . . . . . . . .
Mixed 33 300 39 500 . . . . . . . .
ALL TYPES (Including Horticulture) 44 200 38 800 . . . . . . . .
continued

Cha
pter
2 -
Farm
ing
Inco
me
9
Table 2.4 continued
Average farm business income per farm (£ farm) Accounting years ending on average in February
Standard Gross Margin (SGM) Typology (c) Standard Output (SO) Typology (c)
2008/09 2009/10 (b) 2010/11 2009/10 2010/11 2011/12
(provisional)
In real terms (at 2011/12 prices) . .
United Kingdom . . . . . . . .
Cereals 59 600 38 200 . . . . . . . .
General cropping 79 800 49 900 . . . . . . . .
Dairy 56 700 43 200 . . . . . . . .
Grazing livestock (lowland) 17 300 20 500 . . . . . . . .
Grazing livestock (LFA) 19 800 26 800 . .
Specialist pigs 46 800 61 100 . . . . . . . .
Specialist poultry 43 300 60 100 . . . . . . . .
Mixed 30 200 35 800 . . . . . . . .
ALL TYPES (Including Horticulture) 40 100 35 200 . . . . . . . .
(a)Thecalculationof'farmbusinessincome'hasbeenmodifiedandappliedbackthroughthetimeseriesasthecalculationinearlierpublicationswasincorrectlydefinedintermsofprofitorlossonsaleoffixedassets.Thereforethefigurespresentedabovewillnotmatchthosepublishedpriorto2007/08.
(b)RevisedfiguresforScotland
(c) A note on the effect on farm business income in England as a result of the change from SGM to SO typology is available at:
http://www.defra.gov.uk/statistics/files/defra-stats-foodfarm-farmmanage-fbs-reviseclass_111221.pdf

10
AGRICULTURE IN THE UNITED KINGDOM 2011
Table 2.5 All farm types: distribution of farm incomes by country 2010/11 (a)Enquiries: +44 (0)20 7238 3274 email: [email protected]
Percentage of farms
England Wales Scotland Northern United
Ireland Kingdom
Farm Business Income
Less than zero 11.4 10.2 7.2 13.0 10.8
0 to less than £5,000 6.5 7.5 7.0 7.6 6.8
£5,000 to less than £10,000 6.1 8.2 6.2 11.8 7.0
£10,000 to less than £20,000 13.9 16.3 14.9 17.8 14.7
£20,000 to less than £30,000 10.7 17.1 13.4 16.2 12.4
£30,000 to less than £50,000 16.7 21.0 18.8 13.4 17.1
£50,000 and over 34.7 19.8 32.4 20.3 31.1
Average (£ thousand per farm) 57.3 32.9 45.1 29.2 49.8
Net Farm Income
Less than zero 19.3 27.5 15.9 26.9 20.6
0 to less than £5,000 6.5 5.8 5.4 8.3 6.5
£5,000 to less than £10,000 8.3 6.3 6.2 8.9 7.8
£10,000 to less than £20,000 13.8 13.8 21.7 17.8 15.3
£20,000 to less than £30,000 9.3 17.0 13.2 14.6 11.3
£30,000 to less than £50,000 15.2 17.3 14.4 8.8 14.7
£50,000 and over 27.6 12.3 23.4 14.7 23.9
Average (£ thousand per farm) 44.9 22.2 33.8 21.7 38.3
Cash Income
Less than zero 5.8 6.9 6.0 5.9 5.9
0 to less than £5,000 4.1 5.9 3.0 1.3 3.8
£5,000 to less than £10,000 5.2 3.6 4.0 9.3 5.3
£10,000 to less than £20,000 10.6 13.9 16.6 20.0 12.8
£20,000 to less than £30,000 11.9 12.0 12.3 16.2 12.4
£30,000 to less than £50,000 19.0 31.6 19.7 16.1 20.2
£50,000 and over 43.5 26.0 38.3 31.1 39.5
Average (£ thousand per farm) 73.7 43.0 50.6 43.3 63.7
(a) UK aggregate comprises England, Wales and Northern Ireland results derived using standard output (SO) typology with Scotland results derived using standard gross margin (SGM) typology.
A note on the effect on farm business income in England as a result of the change from SGM to SO typology is available at:
http://www.defra.gov.uk/statistics/files/defra-stats-foodfarm-farmmanage-fbs-reviseclass_111221.pdf

Cha
pter
2 -
Farm
ing
Inco
me
11
Chart 2.3 Distribution of performance across farms 2010/11; United Kingdom (a)
5
10
15
% of farms
0
5
10
15
0 to 60 60 to 70
70 to 80
80 to 90
90 to 100
100 to 110
110 to 120
120 to 130
130 to 140
140 to 150
150 to 160
160 to 170
170 to 180
180 to 200
200 to 300
300 and over
% of farms
£ output per £100 input
Farm income measures
Farm Business Income (FBI)18. is the preferred measure for comparisons of farm type and represents the return to all unpaid labour (farmers, spouses and others with an entrepreneurial interest in the farm business) and to all their capital invested in the farm business including land and farm buildings.
Farm Business Income equals Total output from agriculture (includes crop and livestock valuation change) plus Total output from agri-environment schemes plus Totaloutputfromdiversification plus Single payment scheme less Expenditure (costs, overheads, fuel, repairs, rent, depreciation, paid labour) plus Profit/(loss)onsaleoffixedassets.
Total Income from Farming (TIFF)19. representsbusinessprofitsandremunerationforworkdonebyownersand other unpaid workers. It is used to assess United Kingdom agriculture as a whole.
Total Income from Farming equals Gross output at basic prices plus Other subsidies less taxes less Total intermediate consumption, rent, paid labour less Totalconsumptionoffixedcapital(depreciation)less Interest.
(a) UK aggregate comprises England, Wales and Northern Ireland results derived using standard output (SO) typology with Scotland results derived using standard gross margin (SGM) typology.A note on the effect on farm business income in England as a result of the change from SGM to SO typology is available at:http://www.defra.gov.uk/statistics/files/defra-stats-foodfarm-farmmanage-fbs-reviseclass_111221.pdf

12
AGRICULTURE IN THE UNITED KINGDOM 2011
20. Differences and similarities
Farm Business Income
the preferred measure for comparisons of farm type; ●
covers the 12 month period March to February; ●
does not include imputed rent for owner occupiers; ●
completerangeofon-farmactivitiesincludingincomefromdiversifiedactivitieswheretheyareincluded ●in the farm accounts;
treatment of stocks: the change in the book value of stocks between the start and end of the ●accounting year.
Total Income from Farming
the main aggregate measure of farm income used to assess United Kingdom agriculture as a whole. ●
covers the calendar year; ●
does not include imputed rent for owner occupiers; ●
completerangeofon-farmactivitiesincludingincomefromdiversifiedactivitieswheretheyareincluded ●in the farm accounts;
treatment of stocks: the physical changes in stocks valued at average calendar year prices. ●
Diversification
Diversificationiswidelyheldtoofferconsiderablescopeforimprovingtheeconomicviabilityoffarm21. businesses. It can be thought of as “the entrepreneurial use of farm resources for a non-agricultural purposeforcommercialgain”.Therearesomeobviousactivitiesthatareincludedasdiversificationsuchas tourism, sport, recreation and processing, and others that are not, such as the production of organic or novelcrops,whichwhilepossiblyreflectingachangeinfocusandentrepreneurialactivitybythefarmer,remain agricultural activities. Others such as off-farm employment or investment income are not regarded asdiversifiedactivitiesastheydonotutilisefarmresources.
FurtherinformationondiversificationinEnglandandWalesisavailableat:22.
http://archive.defra.gov.uk/rural/rdpe/erdp/schemes/index.htm
http://wales.gov.uk/topics/statistics/headlines/agric2008/hdw200806242/?lang=en

Cha
pter
3 -
The
Stru
ctur
e of
the
Indu
stry
The Structure of the Industry
13
Chapter 3Summary
In 2011 compared with 2010:
The Utilised Agricultural Area stood stable at 17.2 million hectares, accounting for 70 per cent of land in the ●UK.
There was another record area of oilseed rape planted of 705 thousand hectares. ●
The cereals area saw a modest increase to 3.1 million hectares as farmers took advantage of better cereal ●prices.
Dairy herd numbers decreased by 1.8 per cent to 1.8 million, continuing the long term decline. ●
Despite rising feed costs, the total pig population was almost unchanged at 4.4 million. ●
Sheep and lamb numbers totalled 31.6 million, rising by 1.8 per cent with increases across most types of ●sheep.
There was an unexpected rise in the number of people working on UK farms to 476 thousand. ●
Introduction
The tables in this chapter show the size and structure of the agricultural industry in the United Kingdom. 1. They provide information on land use and livestock numbers, on the distribution of these between holdings, onthelabourforce,theageofholdersandontheindustry’sfixedcapital.
DatainthischapteraresourcedprimarilyfromtheJuneSurveys/CensusofAgriculturecarriedoutinthe2. four UK countries each year. The exceptions to this are the holder age data (sourced from the EU Farm Structure Survey) and land use data in Scotland (sourced from Single Application Form (SAF) subsidy data). Also, cattle data are sourced from the Cattle Tracing System (CTS) in England and Wales and from the equivalent APHIS system in Northern Ireland. In Scotland, cattle data continue to be sourced from agricultural surveys.
From 2009 onwards, England data relate to “commercial” holdings only. The term “commercial” covers 3. allEnglishholdingswhichhavemorethanfivehectaresofagriculturalland,onehectareoforchards,0.5hectares of vegetables or 0.1 hectares of protected crops, or more than 10 cows, 50 pigs, 20 sheep, 20 goatsor1,000poultry.ThesethresholdsarespecifiedintheEUFarmStructureSurveyRegulationEC1166/2008.The2009figuresforEnglandweresubsequentlyrecalculatedtobeonacomparablebasiswith2010.The2005figuresdisplayedintables3.3and3.5arealsobasedoncommercialholdingstoallowcomparisons to the 2011 results.
There are no data available for 2011 on the breakdowns of Standard Labour Requirement (SLR), farm 4. typesorLessFavouredAreas(LFAs).ThisisduetothemuchsmallersamplesizefortheJuneSurveyin England in 2011 compared with previous years. For 2010 data please refer to the 2010 publication of Agriculture in the United Kingdom. The next available data will be for 2013 when the sample size increases for the EU Farm Structure Survey.

AGRICULTURE IN THE UNITED KINGDOM 2011
14
FormoreinformationontheJuneSurveyandformoredetailedresultspleasevisitthefollowingwebpages:5.
England: http://www.defra.gov.uk/statistics/foodfarm/landuselivestock/junesurvey/
Scotland: http://www.scotland.gov.uk/Topics/Statistics/Browse/Agriculture-Fisheries/PubFinalResultsJuneCensus
Wales: www.wales.gov.uk/statistics
Northern Ireland: http://www.dardni.gov.uk/index/news/press-releases-statistical/press-release-statistical-current.htm
Cereals50%
Oilseeds12%
Other arable crops9%
Horticultural crops 3%
Uncropped arable land
3%Potatoes
2%
Cereals50%
Temporary grass21%
Oilseeds12%
Other arable crops9%
Horticultural crops 3%
Uncropped arable land
3%Potatoes
2%
Chart3.1TotalcroppableareaonagriculturalholdingsJune2011
Land use, crop areas and livestock numbers (tables 3.1, 3.2, charts 3.1 to 3.3)
AtJune2011theUtilisedAgriculturalArea(UAA)was17.2millionhectares,makingup70percentofthe6. total UK land area. UAA is made up of arable and horticultural crops, uncropped arable land, common rough grazing, temporary and permanent grassland and land used for outdoor pigs. It does not include woodland and other non-agricultural land.
Almost 36 per cent of UAA was considered to be croppable land, i.e. land currently under crops, bare fallow 7. or temporary grassland. As chart 3.1 shows, 50 per cent of this croppable area is occupied by cereal crops and of these cereals wheat is the predominant crop, with an area of 2.0 million hectares.
The area of oilseed rape rose by 9.8 per cent to 705 thousand hectares, the largest area on record. Prices 8. have proved attractive for growers with increased demand for biofuel.
In 2011 the total area of cereal crops planted increased by 2.1 per cent to 3.1 million hectares, largely 9. due to better prices for cereals. Wheat and barley both saw increases of 1.6 per cent and 5.3 per cent respectively.

Cha
pter
3 -
The
Stru
ctur
e of
the
Indu
stry
15
Wheat
Barley
Oilseed rape
Potatoes
0 0
2.0
4.0
6.0
8.0
10.0
12.0
% change 2011 over 2010
Wheat
Barley
Oilseed rape
Potatoes
Sugar beet-6.0
-4.0
-2.0
0.0
2.0
4.0
6.0
8.0
10.0
12.0
% change 2011 over 2010
Beef cows Ewes and Shearlings
Lambs
Breeding sows
0.0
1.0
2.0
3.0
4.0
% change 2011 over 2010
Dairy cows
Beef cows Ewes and Shearlings
Lambs
Breeding sows
-3.0
-2.0
-1.0
0.0
1.0
2.0
3.0
4.0
% change 2011 over 2010
Chart 3.2 Changes in crop areas
Chart 3.3 Changes in livestock numbers
The main dairy herd saw a small decrease of 1.8 per cent, standing at 1.8 million in 2011. This continues 10. the long term decline. Conversely numbers in the beef herd rose by 1.1 per cent to 1.7 million.
Sheepnumbersincreasedin2011andthetotalfigurenowstandsatalmost32millionanimals.Chart3.311. shows there have been increases of 0.9 and 3.6 per cent in both the number of ewes and shearlings and number of lambs respectively.
The total number of pigs remained almost unchanged in 2011 at 4.4 million. Despite increased feeding 12. costs, there was virtually no change seen in the number of fattening pigs which remained at 3.9 million. The number of breeding pigs increased by 1.0 per cent and now stands at 523 thousand.
Total poultry numbers decreased by 0.8 per cent in 2011, largely due to the 2.7 per cent decrease in the 13. number of table chickens which now stands at 102 million. This decrease could be due to increased input costs, especially feed prices.

AGRICULTURE IN THE UNITED KINGDOM 2011
16
Table 3.1 Agricultural land use (a)
Enquiries:JennyTickneron+44(0)1904455332 email: [email protected]
Thousand hectares AtJuneofeachyear
2007 2008 2009 2010 2011
Utilised agricultural area (UAA) (b) 17 737 17 703 17 325 17 234 17 172 #
UAA as a proportion of total UK area 73% 73% 71% 71% 70%
Total agricultural area 18 692 18 697 18 296 18 282 18 263 #
Common rough grazing 1 238 1 238 1 237 1 228 1 199
Total area on agricultural holdings 17 453 17 459 17 060 17 054 17 064 #
Total croppable area 6 215 6 070 6 092 6 015 6 106 #
Total crops 4 440 4 735 4 607 4 610 4 673 #
Arable crops (c) 4 271 4 565 4 437 4 441 4 497 #
Cereals 2 885 3 274 3 076 3 013 3 075
Oilseeds (includes linseed and borage) 687 621 600 686 742
Potatoes 140 144 144 138 146
Other crops 559 527 616 604 534 #
Horticultural crops 169 170 170 169 175 #
Uncropped arable land (d)(e) 599 194 244 174 156
Temporary grass under 5 years old 1 176 1 141 1 241 1 232 1 278
Total permanent grassland 10 284 10 395 9 996 9 980 9 858
Grass over 5 years old 5 965 6 036 5 865 5 925 5 877
Sole right rough grazing (f) 4 319 4 359 4 131 4 055 3 981
Other land on agricultural holdings 954 994 972 1 059 1 100
Woodland 663 705 726 774 786
Land used for outdoor pigs .. .. .. 10 9
All other non-agricultural land 291 289 246 274 305
Source:JuneSurveys/CensusofAgriculture/SAFlanddataScotland.Formoredetailspleaseseetheintroductionsectionofthischapter.
Please note that totals may not add up to the sum of components due to rounding. Totals may not agree across tables for the same reason.
#: The 2011 UK totals for other arable crops and glasshouse crops were revised in May 2012 to account for calculation changes in the Scotland and Northern Irelandfigures.Asaresultsomesubtotalshavealsobeenrevised.
(a) Figures for England from 2009 onwards relate to commercial holdings only. More information on commercial holdings can be found in the introduction section of this chapter.
(b) UAA includes all arable and horticultural crops, uncropped arable land, common rough grazing, temporary and permanent grassland and land used for out-door pigs (it excludes woodland and other non-agricultural land).
(c) Includes crops grown on previous set-aside land for England for 2007.
(d) Includes uncropped set-aside land for 2007.
(e) Includes all arable land not in production, including land managed in Good Agricultural and Environmental Condition (GAEC12), wild bird cover and game cover.Inthe2009formguidancenotesforEngland,birdcoverandgamestripswereforthefirsttimeexplicitlystatedasbelonginginthiscategory,sothe2009figuremayhavecapturedmoreofthislandthaninpreviousyears.
(f) Also includes mountains, hills, heathland or moorland.

Cha
pter
3 -
The
Stru
ctur
e of
the
Indu
stry
17
Table 3.2 Crop areas and livestock numbers (a)
Enquiries:JennyTickneron+44(0)1904455332 email: [email protected]
AtJuneofeachyear
2007 2008 2009 2010 2011
Crop areas (thousand hectares)
Total area of arable crops (b) 4 271 4 565 4 437 4 441 4 497 #
of which: wheat 1 830 2 080 1 775 1 939 1 969
barley 898 1 032 1 143 921 970
oats 129 135 129 124 109
rye, mixed corn and triticale 27 27 28 29 27
oilseed rape 674 598 570 642 705
linseed 13 16 28 44 36
potatoes 140 144 144 138 146
sugar beet (not for stockfeeding) 125 120 114 118 113
peasforharvestingdryandfieldbeans 161 148 228 210 155
maize 146 153 163 164 164
Total area of horticultural crops 169 170 170 169 175 #
of which: vegetables grown outdoors 121 122 125 121 129
orchard fruit (c) 23 24 22 24 24
soft fruit & wine grapes 10 10 10 10 10
outdoorplantsandflowers 13 13 11 12 11
glasshouse crops 2 2 2 2 2 #
Livestock numbers (thousand head)
Total cattle and calves (d) 10 304 10 107 10 025 10 112 9 933
of which: cows in the dairy herd (e) 1 954 1 909 1 857 1 847 1 814
cows in the beef herd (f) 1 698 1 670 1 626 1 657 1 675
Total sheep and lambs 33 946 33 131 31 445 31 084 31 634
of which: ewes and shearlings 16 064 15 616 14 636 14 740 14 868
lambs under one year old 16 855 16 574 15 892 15 431 15 990
Total pigs 4 834 4 714 4 540 4 460 4 441
of which: sows in pig and other sows for breeding 398 365 379 360 362
gilts in pig 57 55 48 67 70
Total poultry 167 667 166 200 152 753 163 867 162 551
of which: table fowl 109 794 109 859 98 754 105 309 102 461
laying and breeding fowl 47 719 44 321 42 663 47 107 48 610
turkeys, ducks, geese and all other poultry 10 154 12 019 11 335 11 451 11 481
Source:JuneSurveys/CensusofAgriculture/SAFlanddataScotland.AlsoCattleTracingSystem/APHIS(forcattledata).Formoredetailsplease see the introduction section of this chapter.
Please note that totals may not add up to the sum of components due to rounding. Totals may not agree across tables for the same reason.
#: The 2011 UK totals for other arable crops and glasshouse crops were revised in May 2012 to account for calculation changes in the Scotland and Northern Irelandfigures.Asaresultsomesubtotalshavealsobeenrevised.
(a) Figures for England from 2009 onwards relate to commercial holdings only. More information on commercial holdings can be found in the introduction section of this chapter.
(b) Includes arable crops grown on set-aside land in 2007 for England only.
(c) Includes non-commercial orchards.
(d)Cattlefiguresinthistablearebasedonallagriculturalholdings.Thereforethesefiguresdonotmatchthetotalsintable3.5,whicharebasedoncommercial holdings for England.
(e)Dairycowsaredefinedasfemaledairycowsover2yearsoldwithoffspring.
(f)Beefcowsaredefinedasfemalebeefcowsover2yearsoldwithoffspring.

AGRICULTURE IN THE UNITED KINGDOM 2011
18
Numbers and sizes of holdings and enterprises (tables 3.3 to 3.5)
As table 3.3 shows, the number of commercial agricultural holdings has decreased from 248 thousand 14. in 2005 to 223 thousand in 2011. The 2010 Census provided a good opportunity to update the statistical register of English holdings. As a result of this exercise a large number of inactive holdings were removed from the register. This is part of the reason for the decrease seen in the total number of UK holdings.
Table 3.3 Numbers of holdings by size group (a)
Enquiries:JennyTickneron+44(0)1904455332 email: [email protected]
AtJuneofeachyear
2005 2011
Number of Number of
holdings Hectares holdings Hectares
(thousand) (thousand) (thousand) (thousand)
Total area on holdings under 20 hectares 120 812 105 703
20 to under 50 hectares 49 1 620 42 1 397
50 to under 100 hectares 37 2 625 33 2 400
100 hectares and over 42 12 099 41 12 564
Total 248 17 156 223 17 064
Average area (hectares) 69 77
Average area on holdings with >=20 hectares 128 140
Croppable area (b) 0.1 to under 20 hectares 68 401 50 310
20 to under 50 hectares 23 748 20 657
50 to under 100 hectares 16 1 147 15 1 055
100 hectares and over 17 3 533 18 4 084
Total 124 5 829 103 6 106
Average croppable area (hectares) 47 59
Source:JuneSurveys/CensusofAgriculture/SAFlanddataScotland.Formoredetailspleaseseetheintroductionsectionofthischapter.
Please note that totals may not add up to the sum of components due to rounding. Totals may not agree across tables for the same reason.
(a) Figures for England relate to commercial holdings only. More information on commercial holdings can be found in the introduction section of this chapter.
(b)Croppableareaisdefinedaslandundercrops,temporarygrassunderfiveyearsoldanduncroppedarableland.

Cha
pter
3 -
The
Stru
ctur
e of
the
Indu
stry
19
Table3.4NumbersofholdingsbysizegroupandcountryatJune2011
Enquiries:JennyTickneron+44(0)1904455332 email: [email protected]
England (a) Wales Scotland Northern Ireland
Number of Number of Number of Number of
holdings Hectares holdings Hectares holdings Hectares holdings Hectares
(thousand) (thousand) (thousand) (thousand) (thousand) (thousand) (thousand) (thousand)
Total area on holdings
Under 20 hectares 38.0 329 25.4 107 32.2 164 9.9 102
20 to under 50 hectares 21.4 716 6.2 207 6.2 203 8.4 271
50 to under 100 hectares 19.0 1 368 5.0 356 5.3 381 4.3 295
100 hectares and over 26 .4 6 501 4.3 862 8.9 4 877 1.9 324
Total 104 .8 8 915 40.9 1 533 52.5 5 625 24.4 991
Average area (hectares) 85 37 107 41
Average area on holdings with >=20 hectares 129 92 268 61
Source:JuneSurveys/CensusofAgriculture/SAFlanddataScotland.Formoredetailspleaseseetheintroductionsectionofthischapter.
Please note that totals may not add up to the sum of components due to rounding. Totals may not agree across tables for the same reason.
(a) Figures for England relate to commercial holdings only. More information on commercial holdings can be found in the introduction section of this chapter.

AGRICULTURE IN THE UNITED KINGDOM 2011
20
continued
Table 3.5 Numbers of holdings and land areas / livestock numbers by size group (a)
Enquiries:JennyTickneron+44(0)1904455332 email: [email protected]
2005 2011
Number of holdings Hectares
Number of holdings Hectares
(thousand) (thousand) (thousand) (thousand)
Wheat 0.1 to under 15 hectares 11.6 93.7 8.7 71.9
15 to under 30 hectares 8.3 179.4 6.9 151.0
30 to under 50 hectares 6.6 259.1 6.2 241.0
50 to under 100 hectares 7.2 505.9 6.9 491.4
100 hectares and over 4.6 827.5 5.5 1 014.1
Total 38.4 1 865.7 34.1 1 969.4
Average wheat area (hectares) 48.6 57.8
Average wheat area on holdings with >=15 hectares of wheat (hectares) 66.2 74.6
Barley 0.1 to under 15 hectares 20.3 143.9 16.0 119.8
15 to under 30 hectares 8.9 190.3 8.1 173.4
30 to under 50 hectares 5.0 194.5 5.0 193.0
50 to under 100 hectares 3.6 243.4 3.9 264.3
100 hectares and over 1.1 164.7 1.4 219.3
Total 38.9 936.8 34.4 969.8
Average barley area (hectares) 24.1 28.2
Average barley area on holdings with >=15 hectares of barley (hectares) 42.5 46.4
Cereals 0.1 to under 15 hectares 20.5 148.0 15.8 118.3
15 to under 30 hectares 11.1 240.8 9.3 202.7
30 to under 50 hectares 8.9 349.4 8.0 315.3
50 to under 100 hectares 10.7 752.6 10.0 712.0
100 hectares and over 7.8 1 425.6 9.0 1 727.0
Total 59.0 2 916.4 52.1 3 075.2
Average cereal area (hectares) 49.4 59.0
Average cereal area on holdings with >=15 hectares of cereals (hectares) 71.9 81.3
Oilseed rape 0.1 to under 10 hectares 2.8 16.9 1.6 9.8
10 to under 20 hectares 3.7 54.9 3.0 45.3
20 to under 30 hectares 2.6 64.7 2.6 63.4
30 to under 50 hectares 2.9 113.1 3.3 129.7
50 hectares and over 3.0 269.2 4.6 456.3
Total 15.1 518.7 15.1 704.6
Average oilseed rape area (hectares) 34.4 46.6
Average oilseed rape area on holdings with >=10 hectares of oilseed rape (hectares) 40.9 51.3

Cha
pter
3 -
The
Stru
ctur
e of
the
Indu
stry
21
Table 3.5 continued
continued
2005 2011
Number of holdings Hectares
Number of holdings Hectares
(thousand) (thousand) (thousand) (thousand)
Sugar beet 0.1 to under 10 hectares 2.8 14.9 1.7 8.7
10 to under 20 hectares 2.0 28.7 1.3 19.1
20 hectares and over 2.5 104.7 1.8 84.9
Total 7.3 148.2 4.8 112.7
Average sugar beet area (hectares) 20.3 23.6
Average sugar beet area on holdings with >=10 hectares of sugar beet (hectares) 29.8 33.6
Potatoes 0.1 to under 2 hectares 3.9 1.9 2.4 1.2
2 to under 5 hectares 1.6 5.4 1.1 3.7
5 to under 10 hectares 2.2 16.4 1.6 12.3
10 to under 20 hectares 2.3 32.1 2.3 33.4
20 hectares and over 1.9 81.1 2.1 95.5
Total 11.8 136.8 9.6 146.1
Average potato area (hectares) 11.6 15.2
Average potato area on holdings with >=2 hectares of potatoes (hectares) 17.0 20.3
2005 2011
Number of holdings
Number of livestock
Number of holdings
Number of livestock
(thousand) (thousand) (thousand) (thousand)
Cows in the dairy herd (b) 1 to 9 dairy cows 8.7 22 7.2 19
10 to 49 5.5 167 3.3 96
50 to 99 7.4 544 4.9 362
100 to 149 4.3 516 3.4 415
150 and over 3.4 747 3.8 921
Total 29.3 1 997 22.6 1 813
Average number of dairy cows (number of head) 68 80
Average number of dairy cows on holdings with >=10 dairy cows (number of head) 96 117
Cows in the beef herd (c) 1 to 9 beef cows 24.5 99 23.7 98
10 to 19 12.8 178 11.7 167
20 to 29 7.9 189 7.5 183
30 to 49 8.6 328 8.0 307
50 to 99 7.1 482 6.7 459
100 and over 3.0 473 2.8 457
Total 63.9 1 749 60.5 1 671
Average number of beef cows (number of head) 27 28
Average number of beef cows on holdings with >=10 beef cows (number of head) 42 43

AGRICULTURE IN THE UNITED KINGDOM 2011
22
Table 3.5 continued
continued
2005 2011
Number of holdings
Number of livestock
Number of holdings
Number of livestock
(thousand) (thousand) (thousand) (thousand)
Total cattle and calves 1 to 9 cattle and calves 13.3 62 11.7 55
10 to 29 19.3 364 16.3 306
30 to 49 12.5 492 10.7 418
50 to 99 19.9 1 447 16.4 1 185
100 to 149 11.8 1 454 9.5 1 169
150 and over 24.0 6 939 21.5 6 780
Total 100.7 10 758 86.2 9 914
Average number of cattle and calves (number of head) 107 115
Average number of cattle and calves on holdings with >=10 cattle and calves (number of head) 122 132
Femalesheepbreedingflock 1 to 19 breeding sheep 13.2 134 12.3 122
20 to 49 14.1 466 12.4 408
50 to 124 18.2 1 503 15.1 1 242
125 to 499 22.8 5 852 19.9 5 139
500 to 999 6.6 4 592 5.9 4 096
1 000 and over 2.8 4 363 2.5 3 862
Total 77.8 16 911 68.1 14 868
Average number of female breeding sheep (number of head) 217 218
Average number of female breeding sheep on holdings with >=20 female breeding sheep (number of head) 260 264
Total sheep and lambs 1 to 19 sheep and lambs 9.4 77 9.8 85
20 to 49 11.3 377 9.8 330
50 to 124 15.1 1 248 13.1 1 083
125 to 499 25.4 6 713 21.7 5 782
500 to 999 10.4 7 432 9.3 6 617
1 000 and over 10.4 19 520 9.3 17 736
Total 81.9 35 366 73.0 31 634
Average number of sheep and lambs (number of head) 432 434
Average number of sheep and lambs on holdings with >=20 sheep and lambs (number of head) 486 499
Female pig breeding herd 1 to 4 breeding pigs 2.5 5 3.3 7
5 to 24 1.4 17 1.3 14
25 to 99 0.8 45 0.6 32
100 and over 1.1 401 0.9 379
Total 5.8 468 6.0 432
Average number of female breeding pigs (number of head) 80 72
Average number of female breeding pigs on holdings with >=5 female breeding pigs (number of head) 141 153

Cha
pter
3 -
The
Stru
ctur
e of
the
Indu
stry
23
Table 3.5 continued
2005 2011
Number of holdings
Number of livestock
Number of holdings
Number of livestock
(thousand) (thousand) (thousand) (thousand)
Fattening pigs (d) 1 to 9 fattening pigs 2.9 11 3.9 15
10 to 49 1.5 34 1.8 40
50 to 299 1.2 163 1.1 142
300 to 999 1.3 781 1.0 591
1 000 and over 1.3 3 309 1.2 3 130
Total 8.2 4 298 9.0 3 917
Average number of fattening pigs (number of head) 523 437
Average number of fattening pigs on holdings with >=10 fattening pigs (number of head) 803 768
Total pigs 1 to 9 pigs 3.7 13 5.1 18
10 to 49 1.8 42 2.2 49
50 to 299 1.4 188 1.2 159
300 to 999 1.3 771 1.0 602
1 000 and over 1.4 3 835 1.3 3 613
Total 9.6 4 849 10.9 4 441
Average number of pigs (number of head) 503 409
Average number of pigs on holdings with >=10 pigs (number of head) 814 771
Broilers 1 to 9 999 broilers 1.8 662 1.4 560
10 000 to 99 999 0.7 33 844 0.6 29 414
100 000 and over 0.4 76 963 0.4 72 487
Total 2.9 111 468 2.4 102 461
Average number of broilers (number of head) 37 953 42 692
Average number of broilers on holdings with >=10 000 broilers (number of head) 98 495 99 903
Source:JuneSurveys/CensusofAgriculture/SAFlanddataScotland.AlsoCattleTracingSystem/APHIS(forcattledata).Formoredetailsplease see the introduction section of this chapter.Please note that totals may not add up to the sum of components due to rounding. Totals may not agree across tables for the same reason.
(a) Figures for England relate to commercial holdings only. More information on commercial holdings can be found in the introduction section of this chapter.
(b)Dairycowsaredefinedasfemaledairycowsover2yearsoldwithoffspring.
(c)Beefcowsaredefinedasfemalebeefcowsover2yearsoldwithoffspring.
(d) All fattening pigs (includes barren sows).
AGRICULTURE IN THE UNITED KINGDOM 2011
24
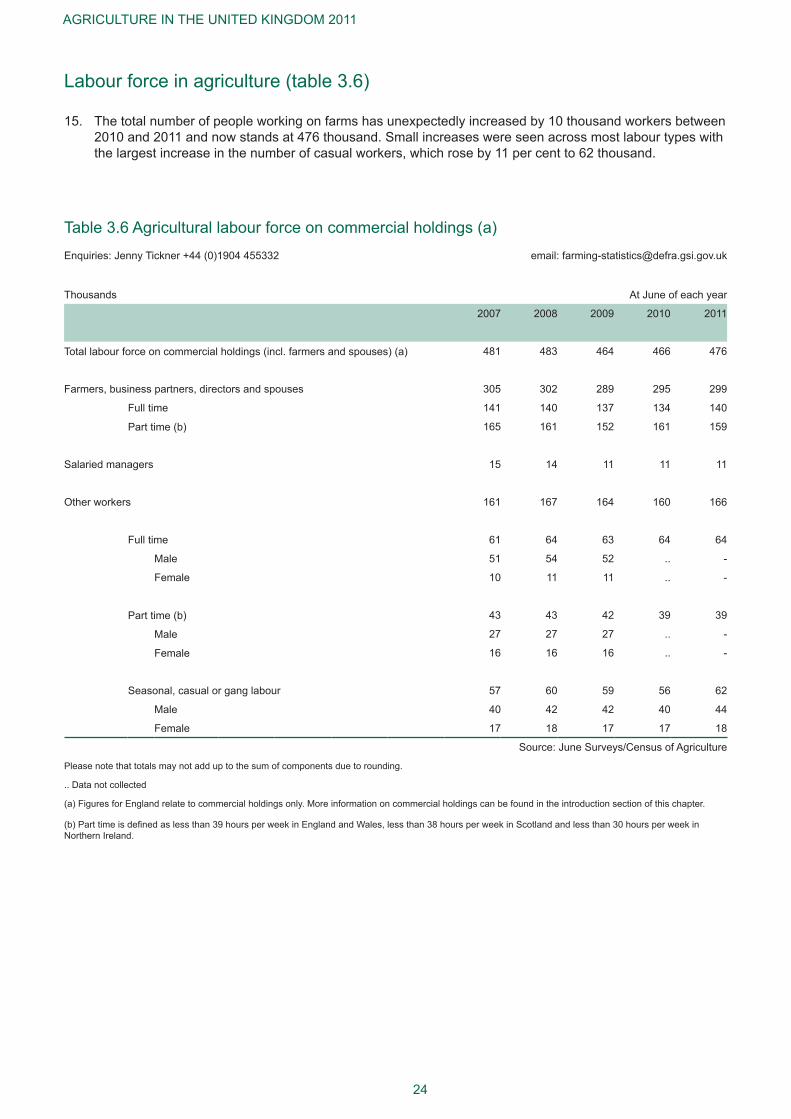
Labour force in agriculture (table 3.6)
The total number of people working on farms has unexpectedly increased by 10 thousand workers between 15. 2010 and 2011 and now stands at 476 thousand. Small increases were seen across most labour types with the largest increase in the number of casual workers, which rose by 11 per cent to 62 thousand.
Table 3.6 Agricultural labour force on commercial holdings (a)Enquiries:JennyTickner+44(0)1904455332 email: [email protected]
Thousands AtJuneofeachyear
2007 2008 2009 2010 2011
Total labour force on commercial holdings (incl. farmers and spouses) (a) 481 483 464 466 476
Farmers, business partners, directors and spouses 305 302 289 295 299
Full time 141 140 137 134 140
Part time (b) 165 161 152 161 159
Salaried managers 15 14 11 11 11
Other workers 161 167 164 160 166
Full time 61 64 63 64 64
Male 51 54 52 .. -
Female 10 11 11 .. -
Part time (b) 43 43 42 39 39
Male 27 27 27 .. -
Female 16 16 16 .. -
Seasonal, casual or gang labour 57 60 59 56 62
Male 40 42 42 40 44
Female 17 18 17 17 18
Source:JuneSurveys/CensusofAgriculture
Please note that totals may not add up to the sum of components due to rounding.
.. Data not collected
(a) Figures for England relate to commercial holdings only. More information on commercial holdings can be found in the introduction section of this chapter.
(b)Parttimeisdefinedaslessthan39hoursperweekinEnglandandWales,lessthan38hoursperweekinScotlandandlessthan30hoursperweekinNorthern Ireland.
Cha
pter
3 -
The
Stru
ctur
e of
the
Indu
stry
25
Age of holders (table 3.7)
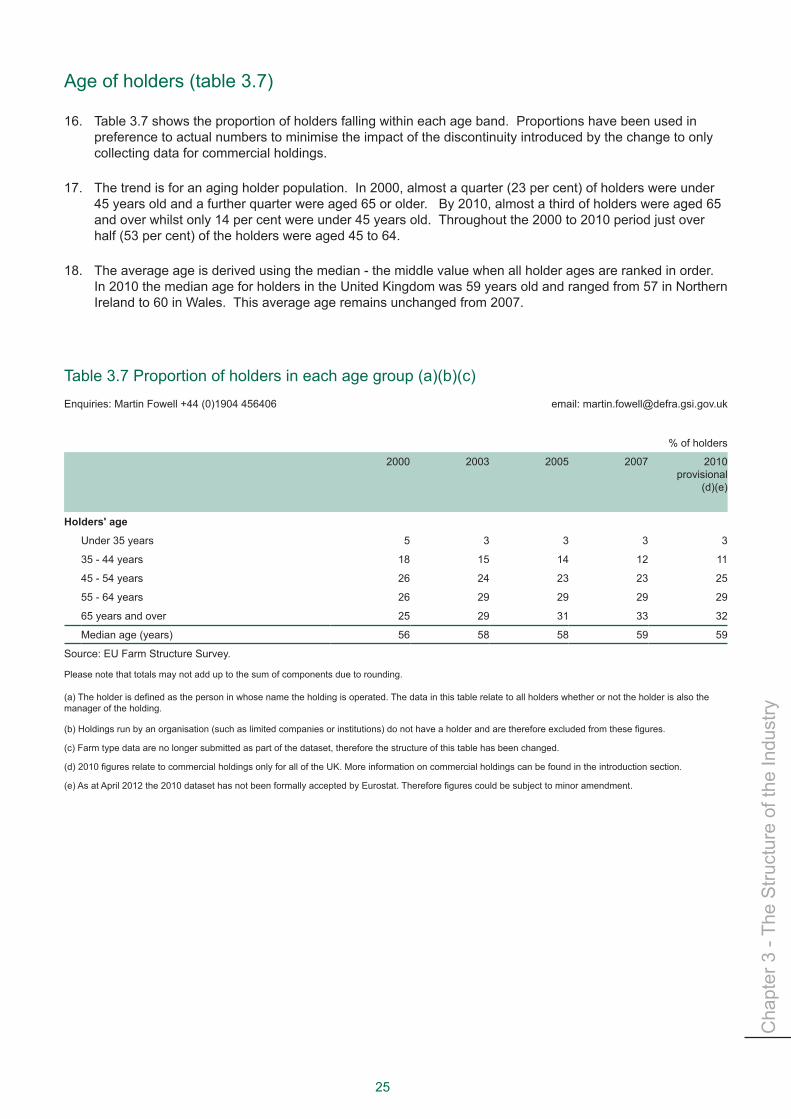
Table 3.7 shows the proportion of holders falling within each age band. Proportions have been used in 16. preference to actual numbers to minimise the impact of the discontinuity introduced by the change to only collecting data for commercial holdings.
The trend is for an aging holder population. In 2000, almost a quarter (23 per cent) of holders were under 17. 45 years old and a further quarter were aged 65 or older. By 2010, almost a third of holders were aged 65 and over whilst only 14 per cent were under 45 years old. Throughout the 2000 to 2010 period just over half (53 per cent) of the holders were aged 45 to 64.
The average age is derived using the median - the middle value when all holder ages are ranked in order. 18. In 2010 the median age for holders in the United Kingdom was 59 years old and ranged from 57 in Northern Ireland to 60 in Wales. This average age remains unchanged from 2007.
Table 3.7 Proportion of holders in each age group (a)(b)(c) Enquiries: Martin Fowell +44 (0)1904 456406 email: [email protected]
% of holders
2000 2003 2005 2007 2010 provisional
(d)(e)
Holders' age
Under 35 years 5 3 3 3 3
35 - 44 years 18 15 14 12 11
45 - 54 years 26 24 23 23 25
55 - 64 years 26 29 29 29 29
65 years and over 25 29 31 33 32
Median age (years) 56 58 58 59 59
Source: EU Farm Structure Survey.
Please note that totals may not add up to the sum of components due to rounding.
(a)Theholderisdefinedasthepersoninwhosenametheholdingisoperated.Thedatainthistablerelatetoallholderswhetherornottheholderisalsothemanager of the holding.
(b)Holdingsrunbyanorganisation(suchaslimitedcompaniesorinstitutions)donothaveaholderandarethereforeexcludedfromthesefigures.
(c) Farm type data are no longer submitted as part of the dataset, therefore the structure of this table has been changed.
(d)2010figuresrelatetocommercialholdingsonlyforalloftheUK.Moreinformationoncommercialholdingscanbefoundintheintroductionsection.
(e)AsatApril2012the2010datasethasnotbeenformallyacceptedbyEurostat.Thereforefigurescouldbesubjecttominoramendment.

AGRICULTURE IN THE UNITED KINGDOM 2011
26

Cha
pter
4 -
Pric
es
Prices
27
Chapter4Summary
In 2011:
The average producer price of agricultural products rose 13 per cent. ●
The average price of cereals rose 43 per cent, due to tight global stocks and strong demand. ●
The average price of forage crops rose 18 per cent, which were adversely affected by a Europe wide ●drought during spring that reduced hay and straw volumes.
The average producer price of fresh vegetables fell 9.0 per cent. ●
Theaverageproducerpriceofmilkrose11percent,reflectingcontinuedstrengtheningdemand. ●
The average price of agricultural inputs rose 12 per cent. ●
The average price of livestock feedingstuffs rose by 21 per cent as a result of higher cereal prices. ●
The average price of energy and lubricants rose 17 per cent. ●
The average price of fertilisers and soil improvers rose by 26 per cent due to higher energy costs and ●relativelyfixedfertilisersupplies.
Price indices (table 4.1, chart 4.1)
The price indices for agricultural 1. products and inputs are constructed using fixedannualweights relatingto 2005. They reflect observedmarket prices and do not take account of subsidy payments coupled to production. The price changes presented in table 9.2 are based on current production and may differ from the price movements presented here.
115125135145155165175
2005 = 100Inputs Products
758595
105115125135145155165175
1990 1993 1996 1999 2002 2005 2008 2011
2005 = 100Inputs Products
Chart 4.1 Price Indices for agricultural products and inputs; United Kingdom

AGRICULTURE IN THE UNITED KINGDOM 2011
28
Table 4.1 Price indices for products and inputs; United KingdomEnquiries:JulieRumseyon+44(0)1904455249 email: [email protected]
Indices (a) 2005 = 100 Calendar years
2007 2008 2009 2010 2011
(provisional)
Producer prices for agricultural products (b) 119.0 143.6 136.3 144.9 163.7
of which:
Crop products: 134.1 154.5 131.9 150.3 177.3
Cereals (including seeds) 166.7 207.1 150.1 172.4 245.7
Industrial Crops 112.0 159.9 139.1 146.8 180.8
Forage Crops 128.6 145.6 147.7 181.5 214.2
Fresh vegetables 122.1 117.5 113.9 131.9 120.0
Potatoes 146.4 153.8 123.8 141.1 150.9
Fresh fruit 107.4 126.4 124.6 129.6 132.2
Seeds 118.3 126.4 126.4 126.4 126.4
Flowers and plants 110.1 115.1 116.7 138.2 141.1
Other crop products 113.3 119.4 119.5 119.9 120.2
Livestock and livestock products: 108.5 136.0 139.4 141.2 154.3
Livestock (for slaughter and export) 105.5 133.2 146.0 146.2 159.7
Milk 112.3 140.4 128.4 133.5 148.1
Eggs 118.3 140.4 144.7 137.8 137.9
Other livestock products 106.7 130.5 121.4 135.1 142.1
Prices of agricultural inputs: 114.2 139.9 129.9 135.6 151.2
of which:
Currently consumed in agriculture: 115.7 145.8 133.0 139.1 157.1
Livestock feedingstuffs 129.7 167.3 152.5 161.0 194.9
Seeds 104.3 111.6 112.1 110.3 118.8
Fertilisers and soil improvers 119.8 272.5 189.8 182.4 229.3
Plant protection products 104.2 106.4 108.5 105.6 105.4
Maintenance and repair of plant and machinery 109.9 116.3 121.5 126.9 133.1
Energy, lubricants 117.9 158.2 130.4 147.1 171.5
Maintenance and repair of buildings 114.1 122.3 122.0 130.1 139.7
Veterinary services 108.4 104.0 104.7 118.8 120.7
Other Goods and Services 108.2 113.5 115.4 123.4 127.2
Contributing to agricultural investment (c): 107.1 111.4 114.8 118.9 122.5
Machinery and other equipment 110.3 117.5 122.1 124.0 126.1
Transport Equipment 100.6 100.7 104.5 109.4 111.7
Buildings 113.0 120.3 120.6 126.7 134.1
Engineering and Soil Improvement operations 107.3 112.1 118.2 119.8 121.8
(a) Indices covering an aggregation of commodities are weighted annual averages with weights based on the values of output of the respective commodities in 2005.
(b)Theseindicesreflectpricesreceivedbyproducersbutexcludedirectsubsidies.
(c) Covers the purchase and maintenance of capital items, but excludes stocks.

Cha
pter
5 -
Com
mod
ities
Chapter5 Commodities
29
1.
Crops Summary
In 2011:
The value of production of wheat and barley increased by 37 and 60 per cent respectively to reach £2.2 ●billion and £860 million respectively.
The volume of production of oilseed rape reached a record 2.8 million tonnes and the value of production ●increased by 65 per cent to reach £1.1 billion.
The total cost of all purchased animal feed rose by 9.4 per cent to £4.1 billion. ●
Production of sugar beet returned to 2009 levels at 8.5 million tonnes following crop losses due to the ●weather conditions in 2010. The value of production was £251 million, slightly higher than 2009.
Data revisions
Figures for potatoes on the value of sales have been revised back to 2000 due to receipt of new information 1. on seed sales and also some simplification of the methodology.
There have been some revisions to the value of production figures for protected crops back to 2002 as 2. a result of revised figures for Scotland due to methodological changes in the way the areas for protected crops have been apportioned.
Cereals (tables 5.1 to 5.4)
The area of wheat increased by 1.6 per cent and for barley the increase was 5.3 per cent. Overall wheat 3. yields were 1.0 per cent higher than 2010 whereas barley yields were 0.7 per cent lower but in both cases were lower than the 5 year average. Yields varied widely across the country, with the drought in spring and early summer having greater effect on the drier and lighter soils in the south and east whereas yields in crops grown on the heavier soils of the north and west were less affected. However a combination of average rainfall and cooler temperatures helped extend the grain fill period by 7-10 days, therefore reducing the potential yield impacts of the earlier spring drought. Harvest progressed well and the production of wheat and barley in 2011 was 15.3 and 5.5 million tonnes respectively, up 2.5 and 4.6 per cent respectively on 2010.
The overall quality of the crops was also very good and has been reflected in a higher proportion of the 4. domestic wheat crop being used for milling which reduced imports. The recovery of the United Kingdom brewing and malting sector also increased demand for barley in particular but also wheat. Use of both wheat and barley for animal feed was lower in 2011. Feed use of barley from the 2011 crop in particular declined markedly due to the strong demand for the high quality malting barley which meant that the price differential between feed wheat and feed barley favoured use of wheat in feed rations over barley.
Cereal prices showed some week on week variation throughout the year due to a combination of factors 5. including conflicting reports over weather related events in the main grain producing areas, the world economic situation and political unrest. However the underlying tight supply situation meant prices remained firm.
AGRICULTURE IN THE UNITED KINGDOM 2011
30
The price data is sourced from the Corn Returns and includes both spot and forward buying. These prices 6. are used to derive the valuation estimates. For this reason the prices quoted in the tables (for example milling wheat at £175 per tonne and feed wheat at £150 per tonne) will not directly correlate with spot market prices.
The value of production of wheat increased by 37 per cent to £2.2 billion whilst that for barley increased by 7. 60 per cent to £860 million. The annual average price of milling wheat, feed wheat, malting barley and feed barley all showed significant increases compared to 2010 and hence the increase in the value of production for both crops.
Straw
Straw prices were similar to 2010 and value of production for straw increased by 5.0 per cent to £372 8. million. Demand has been strong, especially from the livestock sector and the area baled has increased to try and compensate for the reduced yields.
Oilseed rape (table 5.5)
Planting conditions for oilseed rape in August/September 2010 were excellent and with strong markets, the 9. area of oilseed rape planted increased again in 2011, up 9.8 per cent on 2010 to 705 thousand hectares. With high yields, production was at a record 2.8 million tonnes, an increase of 24 per cent on 2010. Oil content was good also. Prices for oilseed rape also have been strong, particularly at the start of the year. Although they declined gradually during the course of the year, the overall annual average price for 2011 was around 50 per cent higher than in 2010. Consequently the value of production increased by 65 per cent to £1.1 billion.
The high prices, especially in the first half of the year were as a result of a tight EU supply and demand 10. situation and low stocks over the last 2 years. In 2010, EU rapeseed production was lower than anticipated due to disruptive rains at harvest time in Central Europe. For the 2011 harvest, poor planting conditions in much of Central Europe, then a harsh winter followed by a dry spring resulted in lower yields, particularly in Germany and Poland. EU demand has been strong, supported by biodiesel mandates so raw seed prices had to rise disproportionately in order to keep adequate stock levels. With the high UK production in 2011, exports to the EU and especially Germany, where there was a deficit, more than doubled to 681 thousand tonnes.
The price increases for cereals and oilseed rape in particular are reflected in the valuation of production of 11. animal feed (see Chapter 6) although there is a lag between price increases in the raw ingredients and the compound feed.
Linseed (table 5.6)
The area of linseed fell but with good yields, production was very similar to 2010 at 71 thousand tonnes. A 12. large proportion of the crop is grown under contract and prices were strong during 2011 resulting in a 19 per cent increase in the value of production to £27 million.
Sugar beet (table 5.7)
The yield for sugar beet recovered in 2011 after the 2010 crop was badly impacted by the weather 13. conditions at the end of 2010 and early 2011 which resulted in yield losses through damage and rotting of late lifted crop. The yield for the 2011 crop at 75.2 tonnes per hectare exceeded the previous high achieved in 2009 and production reached 8.5 million tonnes. The value of production at £251 million is up 28 per cent on 2010 but similar to that achieved in 2009.

Cha
pter
5 -
Com
mod
ities
31
Peas and beans (table 5.8)
The area of field peas was down by 48 per cent compared to 2010; the reduction in plantings was due to 14. the fall in price for the 2009/10 crop. Of this area a greater proportion was planted with marrowfat types (i.e. for human consumption), which resulted in the proportion grown for animal feed falling to around 40 per cent and consequently production fell to around 49 thousand tonnes. The area of field beans was down 26 per cent and with a small reduction in yield, production was down by 28 per cent compared to 2010 at 419 thousand tonnes. The value of production for both field peas and beans fell in line with the respective volume of production falls, down to £8 and £72 million respectively.
Fresh vegetables (table 5.9)
The overall value of production of all vegetables has shown a small decrease of 3.5 per cent on 2010 at 15. £1.2 billion. This was driven by decreases for onions, down by £26 million and tomatoes down by £21 million where 2010 valuations were particularly high. Spring Greens had a drop in value due to limited demand for this product in 2011. White cabbage stocks ran low, including cold store stocks which became very limited, and drove the high prices pushing the overall value of production for cabbages up by 17 per cent.
Those who were affected by reduced demand for selected salad vegetables due to the E.coli outbreak 16. in Germany in 2011 were able to apply for the Exceptional Aid Scheme in June. This was for withdrawn or non-harvested lettuce, tomatoes and cucumbers. The Rural Payments Agency processed payments totalling £566 thousand to 22 separate claimants.
Salad crops on the whole have had a difficult season in 2011, in particular tomatoes and iceberg lettuce 17. being affected through a combination lower prices and a reduction in planted area.
Production as a percentage of total new supply for use in the United Kingdom for all fresh vegetables was 18. 58 per cent which is within the typical range observed in recent years.
Plants and flowers (table 5.10)
The value of production in the ornamental sector has increased by 5.4 per cent to £1.1 billion in 2011. 19. Within the category hardy ornamental nursery stock, Christmas trees were a major contributor to this increase in value.
The area of narcissi bulbs grown remained stable in 2011. However bulb prices increased by 5-10 per 20. cent, depending on variety, and export of both bulbs and flowers to Europe and the USA remained a key part of the trade. The protected cut flower sector has continued to benefit from increased demand and a favourable exchange rate with the Euro, which led to increased values for some crops. However, the overall downward trend in production continued.
Potatoes (table 5.11)
The area of potatoes planted in 2011 was up 5.6 per cent but with slightly lower yields the volume of 21. production was up just a modest 1.0 per cent at 6.1 million tonnes. Farm-gate prices for the 2010 crop at the start of 2011 were the highest for over a decade due to a number of factors. A cold wet spring led to a later start to early crop lifting. A generally drier growing period in the summer resulted in reduced tuber sizes and many growers delayed harvest to grow on longer than usual in an attempt to increase bulking rates. There was a similar situation in Northern Europe. Exceptional export opportunities to Eastern Europe, with Russia experiencing two consecutive years of drought, strengthened the whole market.
In contrast, the start of 2011 was dry and unusually warm and allowed good planting progress. Many crops 22. produced good yields and there were ample supplies throughout the lifting season. The unseasonably dry weather meant many English growers irrigated ahead of the harvest to minimise bruising while parts of Scotland and the north had higher than normal rainfall. Consequently prices have been much lower for the 2011 crop. Overall the value of production was up 9.7 per cent at £700 million.

AGRICULTURE IN THE UNITED KINGDOM 2011
32
Fresh fruit (table 5.12)
The overall value of production of all fresh fruit increased by 4.6 per cent on 2010 to £632 million. The 23. overall increase was driven by increases in the value of production of strawberries and raspberries by 7.0 and 14 per cent respectively. The warm weather in April and May brought forward the start of picking for both crops and resulted in good returns. Supply and demand for strawberries was well matched in the main season but there was some oversupply in August and September. In the case of raspberries the usual oversupply in the summer months was avoided with the cloudier weather allowing the picking to be well managed. The warm spring weather meant top fruit flowered earlier. Later many orchards suffered drought stress but by harvest overall yields were not widely affected although fruit sizes were smaller.
Production as a percentage of total new supply for use in the United Kingdom has remained at 12 per cent.24.

Cha
pter
5 -
Com
mod
ities
33
Table 5.1 Total cereals; United KingdomEnquiries: Allan Howsam on +44 (0)1904 455076 email: [email protected]
Thousand tonnes (unless otherwise specified) Calendar years
2007 2008 2009 2010 2011
(provisional)
Production
Area (thousand hectares) 2 884 3 274 3 075 3 013 3 076
Volume of harvested production 19 130 24 283 21 618 20 946 21 484
Value of production (£ million) (a) 1 948 3 150 2 300 2 259 3 160
Supply and use
Production 19 130 24 283 21 618 20 946 21 484
Imports from: the EU 1 662 1 537 1 677 1 542 1 327
the rest of the world 1 103 1 057 814 678 690
Exports to: the EU 2 362 3 016 3 274 3 945 2 936
the rest of the world 78 446 176 518 238
Total new supply 19 455 23 415 20 660 18 703 20 327
Change in farm and other stocks -1 026 2 965 196 -2 314 - 172
Total domestic uses 20 481 20 450 20 464 21 017 20 500
Production as % of total new supply for use in UK 98 104 105 112 106
(a) Includes arable area payments, but excludes set-aside payments and farm saved seed. Taxes, where applicable, are deducted.

AGRICULTURE IN THE UNITED KINGDOM 2011
34
Table 5.2 Wheat; United KingdomEnquiries: Allan Howsam on +44 (0)1904 455076 email: [email protected]
Thousand tonnes (unless otherwise specified) Calendar years
2007 2008 2009 2010 2011
(provisional)
Production
Area (thousand hectares) 1 830 2 080 1 775 1 939 1 969
Yield (tonnes per hectare) 7.2 8.3 7.9 7.7 7.7
Volume of harvested production 13 221 17 227 14 076 14 878 15 257
Value of production (£ million) (a) 1 315 2 278 1 562 1 609 2 202
of which: sales 1 344 1 781 1 546 1 728 2 221
subsidies (b) . . . . . . . . . .
on farm use 90 169 122 19 73
change in stocks - 119 327 - 107 - 138 - 92
Prices (average prices weighted by volumes of sales (£ per tonne))
Milling wheat 108.7 152.2 121.9 122.3 174.9
Feed wheat 99.0 126.6 107.8 112.6 149.6
Supply and use
Production 13 221 17 227 14 076 14 878 15 257
Imports from: the EU 625 645 780 642 493
the rest of the world 613 603 610 469 409
Exports to: the EU 1 903 2 389 2 378 2 908 2 156
the rest of the world 9 376 156 427 162
Total new supply 12 547 15 709 12 932 12 654 13 841
Change in farm and other stocks - 928 2 180 - 718 -1 190 250
Total domestic uses 13 475 13 529 13 650 13 844 13 591
of which: flour milling 5 673 6 123 6 067 6 459 6 229
animal feed 6 611 6 238 6 534 6 347 6 244
seed 311 322 290 295 295
other uses and waste 880 846 759 742 823
Production as % of total new supply for use in UK 105 110 109 118 110
% of home grown wheat in milling grist 83 80 80 86 89
(a) Excludes farm saved seed.
(b) Includes arable area payments but excludes set-aside payments and is net of taxes.

Cha
pter
5 -
Com
mod
ities
35
Table 5.3 Barley; United KingdomEnquiries: Allan Howsam on +44 (0)1904 455076 email: [email protected]
Thousand tonnes (unless otherwise specified) Calendar years
2007 2008 2009 2010 2011
(provisional)
Production
Area (thousand hectares) 898 1 032 1 143 921 970
Yield (tonnes per hectare) 5.7 6.0 5.8 5.7 5.7
Volume of harvested production 5 079 6 144 6 668 5 252 5 494
Value of production (£ million) (a) 555 831 710 537 860
of which: sales 395 504 440 461 562
subsidies (b) . . . . . . . . . .
on farm use 178 222 191 207 279
change in stocks - 17 105 79 - 131 19
Prices (average prices weighted by volumes of sales (£ per tonne))
Malting barley 123.9 152.7 124.6 108.2 161.9
Feed barley 105.6 117.6 87.6 98.2 146.1
Supply and use
Production 5 079 6 144 6 668 5 252 5 494
Imports from: the EU 95 107 120 115 129
the rest of the world 3 11 10 - -
Exports to: the EU 408 489 850 940 724
the rest of the world 63 70 19 91 76
Total new supply 4 706 5 704 5 929 4 336 4 823
Change in farm and other stocks - 140 762 857 -1 050 - 403
Total domestic uses 4 846 4 942 5 072 5 386 5 226
of which: brewing/distilling 1 732 1 774 1 632 1 692 1 791
animal feed 2 922 2 966 3 223 3 510 3 250
seed 155 160 171 145 145
other uses and waste 37 43 45 38 39
Production as % of total new supply for use in UK 108 108 112 121 114
(a) Excludes farm saved seed.
(b) Includes arable area payments but excludes set-aside payments and is net of taxes.

AGRICULTURE IN THE UNITED KINGDOM 2011
36
Table 5.4 Oats; United KingdomEnquiries: Allan Howsam on +44 (0)1904 455076 email: [email protected]
Thousand tonnes (unless otherwise specified) Calendar years
2007 2008 2009 2010 2011
(provisional)
Production
Area (thousand hectares) 129 135 129 124 109
Yield (tonnes per hectare) 5.5 5.8 5.8 5.5 5.6
Volume of harvested production 712 784 744 685 613
Value of production (£ million) (a) 65 90 72 62 94
of which: sales: 46 57 51 54 76
subsidies (b) . . . . . . . . . .
on farm use 19 23 20 18 37
change in stocks - 9 1 - 9 - 19
Prices (average prices weighted by volumes of sales (£ per tonne))
Milling oats 91.6 113.7 96.8 93.0 149.8
Feed oats 92.5 114.9 96.9 93.1 159.3
Supply and use
Production 712 784 744 685 613
Imports from: the EU 53 46 19 19 34
the rest of the world 1 - - - -
Exports to: the EU 32 119 32 73 23
the rest of the world 6 - 1 - -
Total new supply 734 711 731 631 624
Change in farm and other stocks 41 23 56 - 74 - 23
Total domestic uses 693 688 675 705 647
of which: milling 418 420 419 444 458
animal feed 246 244 233 241 170
seed 18 19 18 17 15
other uses and waste 10 4 5 3 3
Production as % of total new supply for use in UK 97 110 102 109 98
(a) Excludes farm saved seed.
(b) Includes arable area payments but excludes set-aside payments and is net of taxes.

Cha
pter
5 -
Com
mod
ities
37
Table 5.5 Oilseed rape; United KingdomEnquiries: Lindsay Holmes on +44 (0)1904 455563 email: [email protected]
Thousand tonnes (unless otherwise specified) Calendar years
2007 2008 2009 2010 2011
(provisional)
Production
Area (thousand hectares) (a) 681 598 570 642 705
Yield (tonnes per hectare) 3.1 3.3 3.4 3.5 3.9
Volume of harvested production 2 108 1 973 1 912 2 230 2 758
of which:
Production not on set-aside land:
Area (thousand hectares) 602 598 581 642 705
Yield (tonnes per hectare) (b) 3.2 3.3 3.4 3.5 3.9
Production (b) 1 900 1 973 1 951 2 230 2 758
Production on set-aside land:
Area (thousand hectares) 80 - - - -
Yield (tonnes per hectare) 2.6 - - - -
Production 208 - - - -
Value of production (£ million) (c) 426 631 476 674 1 111
of which: sales 408 621 487 640 1 026
subsidies (d) . . . . . . . . . .
change in stocks 18 9 - 12 34 85
Prices (average prices weighted by volumes of sales (£ per tonne)) 202.3 319.6 248.7 302.3 402.9
Supply and use
Production 2 108 1 973 1 912 2 230 2 758
Imports from: the EU 63 175 401 159 64
the rest of the world - - 21 9 -
Exports to: the EU 264 217 50 262 681
the rest of the world - 2 3 2 -
Total new supply 1 907 1 930 2 281 2 134 2 142
Production as % of total new supply for use in UK 111 102 84 105 129
(a) Includes oilseed rape grown on set-aside land for the whole of the United Kingdom.
(b) These figures are on the basis of a standard (9 per cent) moisture content.
(c) Value of production is calculated taking into account the price for oilseed rape produced not on set-aside with an average oil content of 43 per cent.
(d) Includes arable area payments but excludes set-aside payments.

AGRICULTURE IN THE UNITED KINGDOM 2011
38
Table 5.6 Linseed; United KingdomEnquiries: Lindsay Holmes on +44 (0)1904 455563 email: [email protected]
Thousand tonnes (unless otherwise specified) Calendar years
2007 2008 2009 2010 2011
(provisional)
Production
Area (thousand hectares) 13 16 28 44 36
Yield (tonnes per hectare) 1.6 1.8 2.0 1.6 2.0
Volume of harvested production 20 30 54 72 71
of which:
Production not on set-aside land:
Area (thousand hectares) 11 16 28 44 36
Yield (tonnes per hectare) (a) 1.6 1.8 2.0 1.6 2.0
Production (a) 17 30 54 72 71
Production on set-aside land:
Area (thousand hectares) 2 - - - -
Yield (tonnes per hectare) (a) 1.4 - - - -
Production (a) 2 - - - -
Value of production (£ million) 4 10 17 23 27
of which: sales 5 10 16 22 27
subsidies (b) . . . . . . . . . .
change in stocks - 1 - 1 1 -
Supply and use
Production 20 30 54 72 71
Imports from: the EU 6 9 6 10 8
the rest of the world 1 1 2 2 2
Exports to: the EU 20 13 36 47 49
the rest of the world - - - - -
Total new supply 6 27 26 37 31
Production as % of total new supply for use in UK 318 111 212 193 226
(a) These figures are based on a standard (9 per cent) moisture content.
(b) Includes arable area payments but excludes set-aside payments.

Cha
pter
5 -
Com
mod
ities
39
Table 5.7 Sugar beet and sugar; United KingdomEnquiries: Lindsay Holmes on +44 (0)1904 455563 email: [email protected]
Thousand tonnes (unless otherwise specified) Calendar years
2007 2008 2009 2010 2011
(provisional)
Sugar beet (a)
Area (thousand hectares) 125 120 114 118 113
Yield (adjusted tonnes per hectare) 53.8 63.8 74.0 55 75
Volume of harvested production 6 733 7 641 8 457 6 527 8 504
Value of production (£ million) 162 208 246 197 251
Sugar content % 17.96 17.65 18.00 16.87 18.44
Prices (average market price (£ per adjusted tonne)) (a) 24.0 27.3 29.1 30.1 29.5
Sugar (refined basis)
Production (b) 1 049 1 192 1 280 995 1 315
Imports from: the EU 197 220 246 404 260
the rest of the world 1 109 1 186 1 091 926 473
Exports to: the EU 414 462 387 225 108
the rest of the world 143 138 149 285 103
Total new supply 1 798 1 998 2 081 1 814 1 837
Production as % of total new supply for use in UK 58 60 62 55 72
(a) Average price for all sugar beet, including transport allowance and bonuses.
(b) Sugar coming out of the factory in the early part of the new year is regarded as being part of the previous calendar year's production.
Table 5.8 Peas and beans harvested dry; United KingdomEnquiries: Allan Howsam on +44 (0)1904 455076 email: [email protected]
Thousand tonnes (unless otherwise specified) Calendar years
2007 2008 2009 2010 2011
(provisional)
Peas for harvesting dry (a)
Area (thousand hectares) 26 21 27 23 12
Yield (tonnes per hectare) 3.1 4.0 3.6 3.5 4.1
Volume of harvested production 80 85 98 81 49
Value of production (£ million) 14 12 12 12 8
of which: sales 14 12 12 12 8
subsidies (b) . . . . . . . . . .
Field beans
Area (thousand hectares) 123 118 186 168 125
Yield (tonnes per hectare) 3.0 4.5 3.7 3.5 3.4
Volume of harvested production (a) 375 526 688 580 419
Value of production (£ million) 65 73 83 92 72
of which: sales 65 73 83 92 72
subsidies (b) . . . . . . . . . .
Value of production at market prices (£ million) (c) 65 73 83 92 72
(a) The figures presented here cover only that part of the crop which is harvested dry (about 80 per cent to 90 per cent of total production) and largely used for stockfeed. The remainder is included in UK fresh vegetables, table 5.9.
(b) Includes arable area payments but excludes set-aside payments; includes protein crop premium from 2004.

AGRICULTURE IN THE UNITED KINGDOM 2011
40
Table 5.9 Fresh vegetables; United KingdomEnquiries: Julie Dobson on +44 (0)1904 455080 email: [email protected]
Thousand tonnes (unless otherwise specified) Calendar years
2007 2008 2009 2010 2011
(provisional)
Production
Area (thousand hectares): 119 117 125 122 121
of which: grown in the open (a) (b) 118 117 125 122 120
protected 1 1 1 1 1
Value of production (£ million): 1 065 1 105 1 083 1 260 1 217
of which: grown in the open 801 825 805 930 913
protected 264 280 278 331 304
of which: subsidies (d) . . . . . . . . . .
Selected crops: cabbages 64 70 64 71 82
carrots 122 126 116 118 119
cauliflowers 48 52 44 48 45
lettuces 95 111 124 147 146
mushrooms 105 104 104 113 114
onions 67 46 50 109 84
peas 34 47 53 52 54
tomatoes 86 96 90 116 95
Prices (farmgate price (£ per tonne))
Selected crops: cauliflowers 389.6 450.8 407.7 434.4 439.4
tomatoes 1 009.4 1 080.4 1 034.4 1 287.9 1 051.8
Supply and use (f)
Total production 2 478 2 589 2 658 2 727 2 569
Imports from: the EU 1 685 1 698 1 577 1 620 1 703
the rest of the world 263 258 246 252 258
Exports to: the EU 69 62 72 89 83
the rest of the world 19 18 6 6 5
Total new supply 4 338 4 466 4 404 4 503 4 441
Production as % of total new supply for use in the UK 57 58 60 61 58
(a) Includes peas harvested dry for human consumption.
(b) Areas relate to field areas multiplied by the number of crops in the year and hence differ from those shown in table 3.2.
(c) Arable area payments for peas harvested dry.
(d) Trade figures relate to fresh produce where distinguishable.

Cha
pter
5 -
Com
mod
ities
41
Table 5.10 Plants and flowers; United KingdomEnquiries:Joanne Gardiner on +44 (0)1904 4555681 email: [email protected]
Thousand tonnes (unless otherwise specified) Calendar years
2007 2008 2009 2010 2011
(provisional)
Production
Area (thousand hectares) (a): 19 20 18 18 18
Value of production (£ million) 768 819 879 997 1 051
of which: flowers and bulbs in the open (b) 33 35 37 38 42
hardy plants and flowers nursery stock 487 539 563 648 689
protected crops 248 245 278 311 320
Trade (£ million)
Imports
Bulbs 53 58 58 63 93
Cut flowers 559 573 564 605 625
Foliage 35 35 35 41 33
Indoor plants 104 107 110 121 113
Outdoor plants 69 51 48 43 59
Trees 72 81 66 63 68
Other 35 41 39 41 42
Total Imports (exc. Channel Islands) 928 945 921 977 1 032
Exports
Bulbs 10 10 9 10 13
Cut flowers 17 17 19 16 22
Foliage 3 3 1 1 1
Indoor plants 2 2 6 6 6
Outdoor plants 3 3 3 3 4
Trees 2 3 2 2 3
Other 7 10 10 11 10
Total Exports 45 48 51 49 59
(a) Areas relate to field areas multiplied by the number of crops in the year and hence differ from those shown in table 3.2.
(b) Including forced flower bulbs.

AGRICULTURE IN THE UNITED KINGDOM 2011
42
Table 5.11 Potatoes; United KingdomEnquiries: Lindsay Holmes on +44 (0)1904 455563 email: [email protected]
Thousand tonnes (unless otherwise specified) Calendar years
2007 2008 2009 2010 2011
(provisional)
Production
Area (thousand hectares) 140 144 144 138 146
of which: early 16 17 15 11 12
maincrop 124 127 129 127 134
Yield (tonnes per hectare): 39.7 42.7 44.3 44 40
of which: early 12.5 13.3 15 23 24
maincrop 43.1 46.6 48 46 44
Volume of harvested production 5564 6132 6396 6 056 6 115
of which: early 198 224 236 251 294
maincrop 5 367 5 908 6 160 5 805 5 821
End year stocks 2 182 2 618 3 018 2 675 2 694
Value of production (£ million) 708 794 681 638 700
of which: sales 734 713 613 673 679
change in stocks - 40 68 52 - 51 3
Prices (average price paid to registered producers (£ per tonne)) (a)
early potatoes 153.0 206.8 148.8 226.0 160.5
maincrop potatoes 141.4 143.8 130.3 144.0 157.2
all potatoes 147.5 152.0 132.2 149.2 158.2
Supply and use
Total production 5 564 6 132 6 396 6 056 6115
Supplies from the Channel Islands 33 26 31 - -
Imports 1 544 1 705 1 606 1 568 1 670
of which: early 195 162 121 105 121
maincrop 148 258 145 128 119
processed (raw equivalent) 1 185 1 267 1 324 1 319 1 402
seed 16 18 16 16 28
Exports 380 388 424 509 554
of which: raw 154 125 166 239 265
processed (raw equivalent) 131 171 168 172 167
seed 95 92 91 97 122
Total new supply 6 762 7 474 7 609 7 115 7231
Change in stocks - 266 435 400 - 343 19
Production as % of total new supply for use in the UK 82 82 84 85 85
(a) Takes account of support buying, seed sales and sacks where appropriate.
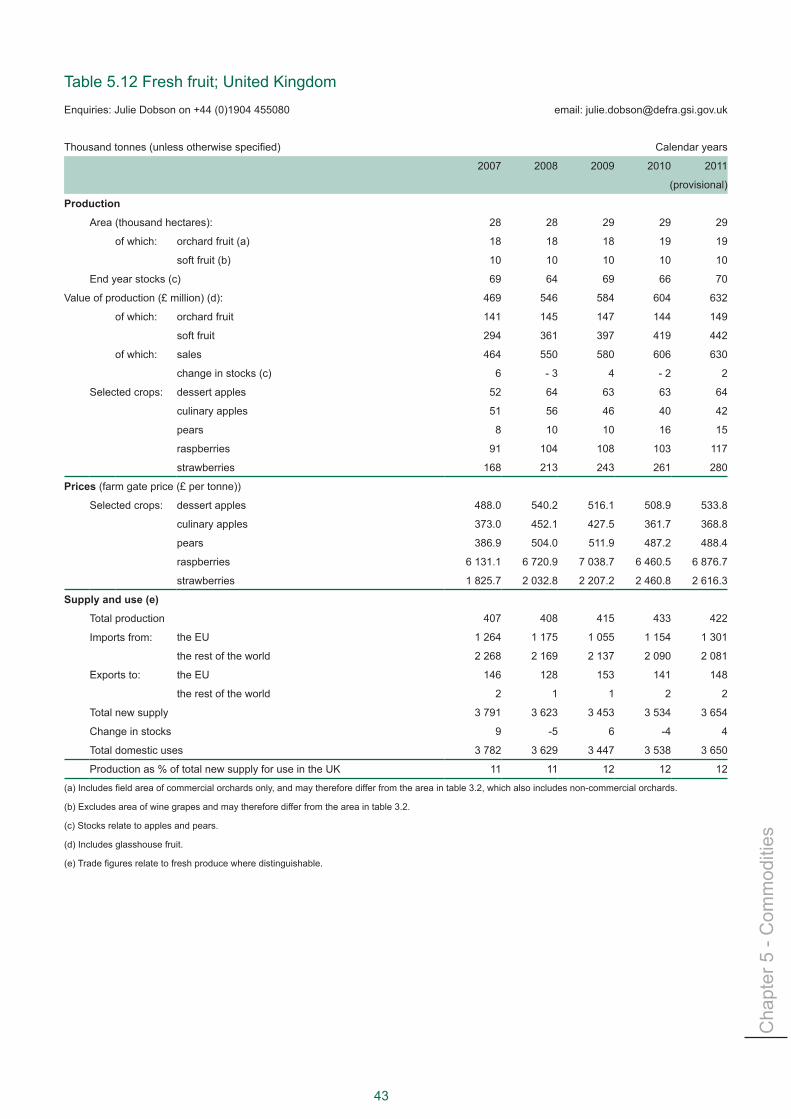
Cha
pter
5 -
Com
mod
ities
43
Table 5.12 Fresh fruit; United KingdomEnquiries: Julie Dobson on +44 (0)1904 455080 email: [email protected]
Thousand tonnes (unless otherwise specified) Calendar years
2007 2008 2009 2010 2011
(provisional)
Production
Area (thousand hectares): 28 28 29 29 29
of which: orchard fruit (a) 18 18 18 19 19
soft fruit (b) 10 10 10 10 10
End year stocks (c) 69 64 69 66 70
Value of production (£ million) (d): 469 546 584 604 632
of which: orchard fruit 141 145 147 144 149
soft fruit 294 361 397 419 442
of which: sales 464 550 580 606 630
change in stocks (c) 6 - 3 4 - 2 2
Selected crops: dessert apples 52 64 63 63 64
culinary apples 51 56 46 40 42
pears 8 10 10 16 15
raspberries 91 104 108 103 117
strawberries 168 213 243 261 280
Prices (farm gate price (£ per tonne))
Selected crops: dessert apples 488.0 540.2 516.1 508.9 533.8
culinary apples 373.0 452.1 427.5 361.7 368.8
pears 386.9 504.0 511.9 487.2 488.4
raspberries 6 131.1 6 720.9 7 038.7 6 460.5 6 876.7
strawberries 1 825.7 2 032.8 2 207.2 2 460.8 2 616.3
Supply and use (e)
Total production 407 408 415 433 422
Imports from: the EU 1 264 1 175 1 055 1 154 1 301
the rest of the world 2 268 2 169 2 137 2 090 2 081
Exports to: the EU 146 128 153 141 148
the rest of the world 2 1 1 2 2
Total new supply 3 791 3 623 3 453 3 534 3 654
Change in stocks 9 -5 6 -4 4
Total domestic uses 3 782 3 629 3 447 3 538 3 650
Production as % of total new supply for use in the UK 11 11 12 12 12
(a) Includes field area of commercial orchards only, and may therefore differ from the area in table 3.2, which also includes non-commercial orchards.
(b) Excludes area of wine grapes and may therefore differ from the area in table 3.2.
(c) Stocks relate to apples and pears.
(d) Includes glasshouse fruit.
(e) Trade figures relate to fresh produce where distinguishable.

AGRICULTURE IN THE UNITED KINGDOM 2011
44

Cha
pter
5 -
Com
mod
ities
45
Livestock Summary
In 2011, compared with 2010, the value of production at market prices for:
Beef and Veal rose by 20 per cent to £2.6 billion. ●
Pigmeat rose by 10 per cent to £1.1 billion. ●
Mutton and lamb rose by 17 per cent to £1.1 billion. ●
Poultrymeat rose by 5.3 per cent to £1.9 billion. ●
Milk and milk products rose by 12 per cent to £3.7 billion. ●
Eggs fell by 0.3 per cent to £559 million. ●
Livestock
Across the livestock sector values have risen in 2011, with the exception of eggs where there was little 1. change.Highproductioncosts,especiallyhigherfeedandfuelprices,continuedtoimpactonprofitmargins.
Cattle and calves: beef and veal (table 5.13)
Thesignificantincreaseinthevalueofproductionatmarketpricesofbeefandvealwaspartlydueto2. increased home production, especially for cows and adult bulls due to the high demand for manufacturing beef and strong prices due to limited supplies. In general, carcase weights were lower this year as high feedpricesledtoproducersfinishinganimalsearlier.
Pigs and pigmeat (table 5.14)
Despite high feed prices leading to the early marketing of pigs resulting in slightly lighter weights, pigmeat 3. production increased in 2011. Strong cull prices encouraged producers to replace unproductive sows leading to improved herd performance. The value of home-fed production of pigmeat increased in 2011 withpricesimprovingthroughouttheyear.However,feedpricescontinuetoimpactonprofitmargins.
Sheep and lambs: mutton and lamb (table 5.15)
Muttonandlambhomefedproductionrosein2011,asbreedingflockgrowthandfavourableweather4. conditions led to an increased lamb crop and good grazing conditions helped increase weights. Record farmgateprices,duetothetightsuppliesathomeandglobally,contributedtothesignificantriseinthevalue of production at market prices.
AGRICULTURE IN THE UNITED KINGDOM 2011
46
Poultry and poultrymeat (table 5.16)
The value of production of poultrymeat rose in 2011 with prices remaining good, despite a small reduction in 5. overall production due to fewer broiler chick placings and high feed prices continuing to impact.
Milk (table 5.17)
Milk production from the dairy herd increased again in 2011, with an increase to the average yield per dairy 6. cow across the national herd offsetting the fall in overall dairy cow numbers. The value of production rose significantlyin2011asaresultofincreasedmilkavailabilityhelpedbyfavourableweatherconditionsandhigher farmgate milk prices. However, high input costs continue to be a major factor for United Kingdom milkproducersaffectingfarmlevelprofitmargins.Strongglobaldemandfordairyproductsledtoanincrease in the production of butter and cheese compared to the previous year.
Hen eggs (table 5.18)
Egg production fell slightly in 2011 following the over-supply experienced across the market during 2010. 7. Intensive egg production fell as producers switched to enriched colonies in preparation for the 2012 EU conventional cage ban. This reduction in production led to a slight fall in the value of eggs for human consumption. The annual average price per dozen was virtually unchanged on the year previous, although higherfeedpricesandenrichedcageinvestmentcostsimpactedonprofitmargins.

Cha
pter
5 -
Com
mod
ities
47
Table 5.13 Cattle and calves; beef and veal; United KingdomEnquiries: Sarah Thompson on +44 (0)1904 455097 email: [email protected]
Thousand tonnes (unless otherwise stated) Calendar years
2007 2008 2009 2010(g) 2011
(provisional)
Population
Totalcattleandcalves(thousandheadatJune) 10 304 10 107 10 025 10 112 9 933
of which: dairy cows 1 954 1 909 1 857 1 847 1 814
beef cows 1 698 1 670 1 626 1 657 1 675
Production (a)
Total home-fed marketings (thousand head) 2 724 2 613 2 476 2 678 2 824
of which: steers, heifers and young bulls 2 155 1 956 1 946 2 063 2 090
calves 108 91 43 61 92
cows and adult bulls 461 566 487 554 642
Average dressed carcase weight (kg):
steers, heifers and young bulls 342 349 342 347 345
calves 32 31 33 32 33
cows and adult bulls 317 314 315 320 316
Production (dressed carcase weight):
home-fed production 888 866 823 897 931
Value of production (£ million) 1 670 2 118 2 151 2 173 2 605
of which: value of home-fed production 1 668 2 095 2 130 2 220 2 654
subsidies (b) 47 47 20 19 19
change in work-in-progress (c) - 44 - 21 9 - 55 - 63
less imported livestock 1 3 8 11 6
plus breeding animals exported . . . . . . . . . .
Value of production at market prices (£ million) (d) 1 623 2 071 2 131 2 154 2 585
Prices
Store cattle (£ per head):
Hereford/cross bull calves 93.0 119.4 165.5 148.1 156.2
Beef/cross yearling steers 480.9 539.3 639.3 638.6 670.9
Finished cattle (pence per kg liveweight): All prime cattle 112.3 144.8 154.6 147.2 169.3
Supply and use (thousand tonnes, dressed carcase weight) (e)
Home-fed production (a) 888 866 823 897 931
Imports from: the EU (f) 204 216 208 206 207
the rest of the world 75 79 76 75 75
Exports to: the EU 76 99 96 125 163
the rest of the world 1 1 3 4 6
Total new supply 1 090 1 061 1 008 1 050 1 044
Home-fed production as % of total new supply for use in the UK 81 82 82 85 89
(a) Measures of home-fed marketings, dressed carcase weights, production and value include animals raised and slaughtered in the UK, excluding any animals removed from the food chain.
(b) Comprising variable premium, calf subsidy, hill livestock compensatory allowances, suckler cow premium, beef special premium, deseasonalisation premium, extensificationpayments,slaughterpremiumandScottishBeefCalfScheme.IncludespaymentsmadeundertheOverThirtyMonthScheme,CalfProcessingAid Scheme and the Older Cattle Disposal Scheme.
(c) A valuation of the change in work-in-progress of animals to be slaughtered.
(d) Excluding subsidies and taxes.
(e) Does not include meat offals or trade in preserved or manufactured meat products. Boneless meat has been converted to bone-in weights.
(f)Includesmeatfromimportsoflivefinishedanimals.
(g)Forcomparabilitywithotheryears,thefiguresfor2010havebeenadjustedfroma53-weektoa52-weekbasiswhereappropriate.

AGRICULTURE IN THE UNITED KINGDOM 2011
48
Table 5.14 Pigs and pigmeat; United KingdomEnquiries: Sarah Thompson on +44 (0)1904 455097 email: [email protected]
Thousandtonnes(unlessotherwisespecified) Calendar years
2007 2008 2009 2010(e) 2011
(provisional)
Population
Totalpigs(thousandheadatJune) 4 834 4 714 4 540 4 460 4 441
of which: sows in pig and other sows for breeding 398 365 379 360 362
gilts in pig 57 55 48 67 70
Production (a)
Total home-fed marketings (thousand head) 9 076 8 997 8 557 (f) (f)
of which: clean pigs 8 858 8 755 8 348 8 642 9 234
sows and boars 218 242 209 (f) (f)
Average dressed carcase weight (kg):
clean pigs 76 76 78 78 78
sows and boars 151 151 152 155 151
Production (dressed carcase weight):
home-fed production 707 706 681 710 759
Value of production (£ million) 736 865 968 978 1 069
of which: value of home-fed production 733 867 972 978 1 065
change in work in progress (b) - 1 - 4 - 6 - 2 - 2
less imported livestock . . . . . . . . . .
plus breeding animals exported 4 2 3 3 6
Prices (pence per kg deadweight)
Clean pigs 107.1 126.3 145.7 141.7 144.8
Supply and use of pigmeat (carcase weight equivalent) (c)
Home-fed production (a) 707 706 681 710 759
Imports from: the EU (d) 864 801 804 802 770
the rest of the world 5 12 12 12 11
Exports to: the EU 113 130 109 145 154
the rest of the world 12 25 26 25 39
Total new supply 1 451 1 364 1 362 1 354 1 347
Home-fed production as % of total new supply for use in the UK 49 52 50 52 56
(a) Measures of home-fed marketings, dressed carcase weights, production and value include animals raised and slaughtered in the UK, excluding any animals removed from the food chain.
(b) A valuation of the change in work in progress of animals to be slaughtered.
(c) Does not include meat offals or trade in preserved or manufactured meat products. Boneless meat has been converted to bone-in weights.
(d)Includesmeatfromimportsoflivefinishedanimals.
(e)Forcomparabilitywithotheryears,thefiguresfor2010havebeenadjustedfroma53-weektoa52-weekbasiswhereappropriate.
(f)dataareconfidential

Cha
pter
5 -
Com
mod
ities
49
Table 5.15 Sheep and lambs; mutton and lamb; United KingdomEnquiries: Sarah Thompson on +44 (0)1904 455097 email: [email protected]
Thousandtonnes(unlessotherwisespecified) Calendar years
2007 2008 2009 2010(i) 2011
(provisional)
Population
Totalsheepandlambs(thousandheadatJune) 33 946 33 131 31 445 31 084 31 634
of which: ewes and shearlings 16 064 15 616 14 636 14 740 14 868
lambs under one year old 16 855 16 574 15 892 15 431 15 990
Production (a)
Total home-fed marketings (thousand head) 16 036 16 989 15 911 14 440 15 007
of which: clean sheep and lambs 13 791 14 617 13 692 12 480 12 956
ewes and rams 2 245 2 372 2 219 1 961 2 051
Average dressed carcase weight (kg):
clean sheep and lambs 19 19 19 19 19
ewes and rams 27 24 25 25 26
Production (dressed carcase weight):
home-fed production 329 332 313 287 301
Value of production (£ million) 641 798 967 979 1 148
of which: value of home-fed production 638 824 977 981 1 139
subsidies (b) . . . . . . . . . .
change in work in progress (c) 7 - 23 - 6 - 1 9
less imported livestock 4 3 4 2 -
plus breeding animals exported . . . . . . . . . .
Value of production at market prices (£ million) (d) 641 798 967 979 1 148
Prices
Store sheep (£ per head): (e)
Lambs, hoggets and tegs 30.3 33.7 46.5 59.3 60.3
Finished sheep (pence per kg estimated dressed carcase weight) (f):
Great Britain 236.8 297.6 360.4 389.6 432.9
Northern Ireland 226.0 273.4 322.3 340.6 403.9
Supply and use (dressed carcase weight) (g)
Home-fed production (a) 329 332 313 287 301
Imports from: the EU (h) 21 20 21 19 16
the rest of the world 116 115 122 109 93
Exports to: the EU 76 94 105 101 112
the rest of the world 1 1 1 1 1
Total new supply 390 372 350 313 297
Home-fed production as % of total new supply for use in the UK 84 89 89 92 101
(a) Measures of home-fed marketings, dressed carcase weights, production and value include animals raised and slaughtered in the UK, excluding any animals removed from the food chain.
(b) Comprising variable premium, hill livestock compensatory allowances and sheep annual premium.
(c) A valuation of the change in work in progress of animals to be slaughtered.
(d) Excluding subsidies and taxes.
(e) Average prices at representative markets in England and Wales.
(f) Unweighted average of weekly prices at representative markets.
(g) Does not include meat offals or trade in preserved or manufactured meat products. Boneless meat has been converted to bone-in weights.
(h)Includesmeatfromimportsoflivefinishedanimals.
(i)Forcomparabilitywithotheryears,thefiguresfor2010havebeenadjustedfroma53-weektoa52-weekbasiswhere appropriate.
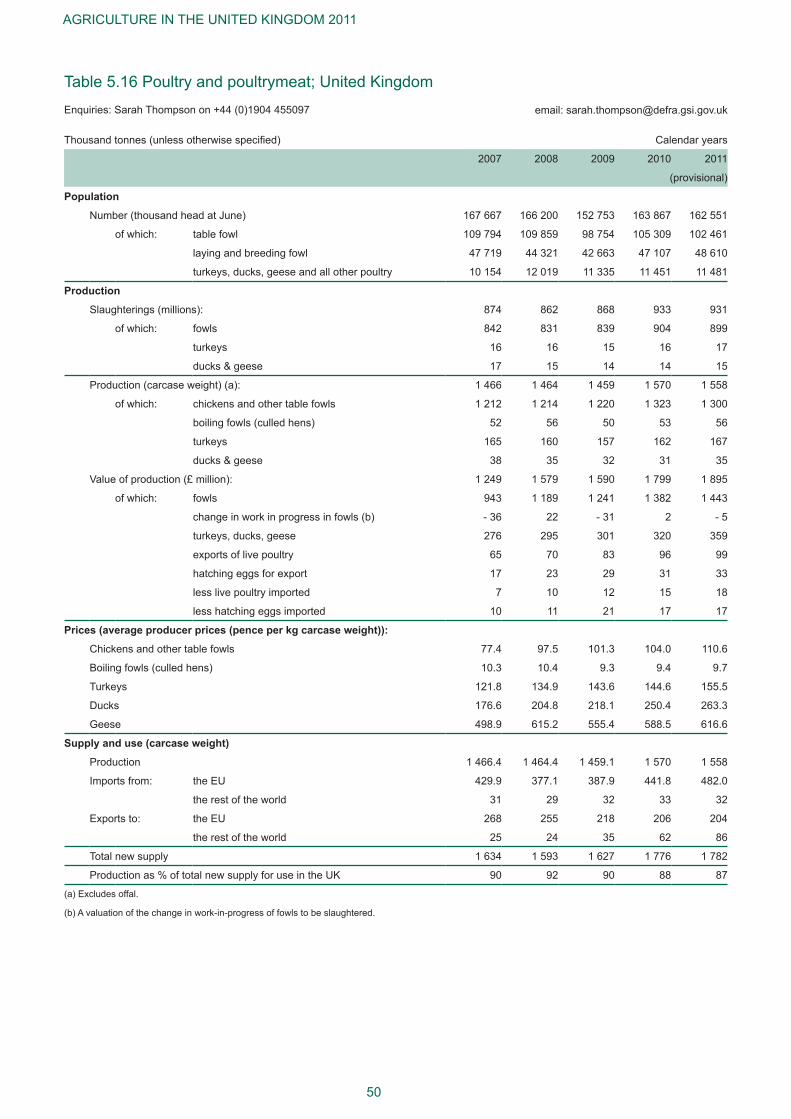
AGRICULTURE IN THE UNITED KINGDOM 2011
50
Table 5.16 Poultry and poultrymeat; United KingdomEnquiries: Sarah Thompson on +44 (0)1904 455097 email: [email protected]
Thousandtonnes(unlessotherwisespecified) Calendar years
2007 2008 2009 2010 2011
(provisional)
Population
Number(thousandheadatJune) 167 667 166 200 152 753 163 867 162 551
of which: table fowl 109 794 109 859 98 754 105 309 102 461
laying and breeding fowl 47 719 44 321 42 663 47 107 48 610
turkeys, ducks, geese and all other poultry 10 154 12 019 11 335 11 451 11 481
Production
Slaughterings (millions): 874 862 868 933 931
of which: fowls 842 831 839 904 899
turkeys 16 16 15 16 17
ducks & geese 17 15 14 14 15
Production (carcase weight) (a): 1 466 1 464 1 459 1 570 1 558
of which: chickens and other table fowls 1 212 1 214 1 220 1 323 1 300
boiling fowls (culled hens) 52 56 50 53 56
turkeys 165 160 157 162 167
ducks & geese 38 35 32 31 35
Value of production (£ million): 1 249 1 579 1 590 1 799 1 895
of which: fowls 943 1 189 1 241 1 382 1 443
change in work in progress in fowls (b) - 36 22 - 31 2 - 5
turkeys, ducks, geese 276 295 301 320 359
exports of live poultry 65 70 83 96 99
hatching eggs for export 17 23 29 31 33
less live poultry imported 7 10 12 15 18
less hatching eggs imported 10 11 21 17 17
Prices (average producer prices (pence per kg carcase weight)):
Chickens and other table fowls 77.4 97.5 101.3 104.0 110.6
Boiling fowls (culled hens) 10.3 10.4 9.3 9.4 9.7
Turkeys 121.8 134.9 143.6 144.6 155.5
Ducks 176.6 204.8 218.1 250.4 263.3
Geese 498.9 615.2 555.4 588.5 616.6
Supply and use (carcase weight)
Production 1 466.4 1 464.4 1 459.1 1 570 1 558
Imports from: the EU 429.9 377.1 387.9 441.8 482.0
the rest of the world 31 29 32 33 32
Exports to: the EU 268 255 218 206 204
the rest of the world 25 24 35 62 86
Total new supply 1 634 1 593 1 627 1 776 1 782
Production as % of total new supply for use in the UK 90 92 90 88 87
(a) Excludes offal.
(b) A valuation of the change in work-in-progress of fowls to be slaughtered.

Cha
pter
5 -
Com
mod
ities
51
Table 5.17 Milk; United KingdomEnquiries: Leigh Riley on +44 (0)1904 455095 email: [email protected]
Millionlitres(unlessotherwisespecified) Calendar Years
2007 2008 2009 2010 2011
(Provisional)
Population and yield
Dairy herd (annual average, thousand head) (a) 1 970 1 918 1 867 1 850 1 815
Average yield per dairy cow (litres per annum) 6 913 6 943 7 031 7 273 7 533
Production
Milk from the dairy herd (b) 13 619 13 319 13 128 13 453 13 675
Milk from the beef herd (b) 7 7 7 7 7
less on farm waste and milk fed to stock 184 181 135 116 116
Volume for human consumption 13 442 13 145 13 001 13 344 13 566
Value of production (£ million) 2 823 3 447 3 123 3 329 3 742
of which: raw milk leaving farm (c) 2 752 3 368 3 055 3 259 3 674
raw milk processed on farm (d) 72 79 68 69 68
subsidies . . . . . . . . . .
less levies . . . . . . . . . .
Value of production at market prices (£ million) (e) 2 823 3 447 3 123 3 329 3 742
Prices (average price received by milk producers, net of delivery charges (pence per litre)) (f)
Farmgate price of milk excluding bonus payments 20.7 25.9 23.7 24.7 27.3
Farmgate price of milk including bonus payments 20.7 25.9 23.7 24.7 27.4
Supply and use
Production 13 626 13 326 13 135 13 460 13 682
Imports 57 49 75 88 104
Exports 538 559 433 417 403
Total new supply 13 146 12 816 12 777 13 131 13 382
of which:
for liquid consumption 6 724 6 678 6 626 6 836 6 954
for manufacture 6 085 5 840 5 699 6 112 6 218
of which: butter 248 229 242 246 263
cheese 3 561 3 635 3 369 3 529 3 670
cream 285 249 248 254 243
condensed milk (g) 300 332 308 279 295
milk powder 1 232 933 999 1 139 1 136
other 459 461 535 665 612
dairy wastage and stock change 127 92 293 45 72
other uses (h) 210 206 158 138 138
Production as a % of new supply 104 104 103 103 102
(a)Thisistheaveragesizeofthedairyherdacrossthewholeyear,ratherthanthesizeataparticulartimeofyear.From2005thedairyherdisdefinedasdairycowsovertwoyearsofagewithoffspring.Until2004thedairyherdwasdefinedascowsandheifersinmilkpluscowsincalfbutnotinmilk,keptmainlyforproducing milk or rearing calves for the dairy herd.
(b) Excludes suckled milk.
(c) Value of raw milk sold to other businesses (dairies) for processing.
(d) Value of milk and milk products processed on farm and sold direct to the consumer.
(e) Excluding subsidies and taxes/levies.
(f) No deduction is made for superlevy.
(g) Includes condensed milk used in the production of chocolate crumb and in the production of machine skimmed milk.
(h) Includes farmhouse consumption, milk fed to stock and on farm waste. Excludes suckled milk.

AGRICULTURE IN THE UNITED KINGDOM 2011
52
Table 5.18 Hen eggs; United KingdomEnquiries: Leigh Riley on +44 (0)1904 455095 email: [email protected]
Million dozen (unless otherwise specified) Calendar Years
2007 2008 2009 2010 2011
(provisional)
Population
Number of laying fowl (thousands) 47 719 44 321 42 663 47 107 48 610
Production
Volume of production of eggs 831 867 869 950 943
of which: eggs for human consumption 720 754 751 826 821
eggs for hatching 99 98 101 105 103
other (d) (e) 12 15 17 19 19
Value of production of eggs for human consumption (£ million) (a) 410 520 531 561 559
Prices (pence per dozen)
Weighted average of eggs graded in the UK (b) 57.0 69.0 70.7 68.0 68.1
Supply and use
UK production of eggs for human consumption 720 754 751 826 821
of which: eggs sold in shell 539 577 597 673 664
eggs processed 181 177 154 152 158
Imports from (c): the EU 203 219 224 212 188
the rest of the world 2 1 1 3 7
Exports to (c): the EU 17 24 18 20 21
the rest of the world - - 1 1 1
Total new supply 908 950 957 1 020 994
Production as % of total new supply for use in the UK 79 79 78 81 83
(a) Excludes the value of eggs for hatching, as that is included in the value of poultry.
(b) Represents the price paid by packers to producers in the United Kingdom, excluding bonus, and takes accounts of all egg systems - laying cages, free range, barn and organic.
(c) Includes shell egg equivalent of whole (dried, frozen and liquid) egg, egg yolk and albumen.
(d) included hatching eggs for export and waste.
(e) hatching eggs for exports are valued in table 5.16.

Cha
pter
6 -
Inte
rmed
iate
Con
sum
ptio
n
Chapter6 Intermediate Consumption
53
1.
Summary
In 2011:
Crude oil prices reached an average of $111 per barrel, the highest annual average recorded. ●
The value of consumption of motor and machinery fuels is estimated to have more than doubled in the last ●ten years to over £1 billion.
The value of consumption of electricity and heating fuels is estimated to have risen by 78 per cent since ●2004 to £373 million.
Thevalueofconsumptionoffertiliserisestimatedtohavedoubledinthelastfiveyearstoover£1.6billion. ●
The value of consumption of animal feed is estimated to have increased by 80 per cent since 2005 to £4.4 ●billion.
Introduction
In recent years, increases in crude oil 1. prices have led to increased concerns for the impact of high oil prices on the margins and profitability of agriculturalbusinesses, which are dependent on products derived from petroleum, notably fuels. This chapter presents long-term trends in crude oil prices and the cost of selected inputs as recorded in the intermediate consumption section of the production and income account (see Chapter 9).
Intermediate consumption represents 2. the consumption of goods and services, e.g. fuels, feed, seeds, fertiliser, plant protection products. Some inputs, such as fuels, electricity and fertilisers are closely linked to the oil price while others are not and trends for these are shapedbyotherfactors.Thefiguresfor2011 are provisional estimates and will be revised in due course; users are thus advised to consider long-term trends in costs rather than year-on-year changes for 2011.
Source: Energy Information Administration, U.S. Department of Energy, BP Statistical Review of World Energy 2008, US Bureau of Labour Statistics
Chart 6.1 Historic trends in crude oil prices 1861-2011
40
60
80
100
120$ per barrel Arabian
LightAt 2011$ prices
US Crude Oil Wellhead
Europe Brent
0
20
40
60
80
100
120
1861 1876 1891 1906 1921 1936 1951 1966 1981 1996 2011
$ per barrel Arabian Light
At 2011$ prices
US Crude Oil Wellhead
Europe Brent

AGRICULTURE IN THE UNITED KINGDOM 2011
54
Source: Defra/Aggregate Agricultural Accounts
Chart 6.2 Motor and machinery fuels
100
150
200
250
300
Indices 2000=100 Oil price Value
Volume Unit price
0
50
100
150
200
250
300
1973 1981 1991 2001 2011
Indices 2000=100 Oil price Value
Volume Unit price
Chart 6.3 Red diesel prices
Source: Defra/DECC
70
80
p per litre
70
80
p per litre
50
60
70
80
p per litre
30
40
50
60
70
80
p per litre
10
20
30
40
50
60
70
80
p per litre
0
10
20
30
40
50
60
70
80
Jan98 Jan00 Jan02 Jan04 Jan06 Jan08 Jan10 Jan12
p per litre
0
10
20
30
40
50
60
70
80
Jan98 Jan00 Jan02 Jan04 Jan06 Jan08 Jan10 Jan12
p per litre
The three major farm inputs – and those that have shown the greatest increases in cost in recent years - are 3. the ‘three Fs’: fuel, fertiliser and feed. The following charts and table show long-term trends in these three areas.
These charts present long-term trends expressed as indices where the data point in 2000 is expressed as 4. equal to 100 and the data points for other years are relative to that in 2000. Indices are shown for value and volume, which are derived from the production and income accounts. An index is shown for a unit price, whichisderivedfromthevalueandvolumeindicesandshowstheinfluenceofpriceontrendsinvalue.Thechartsforfuelsandfertiliserincludeanindexfortheoilprice,whichshowstheinfluenceofoilpriceonthecosts of these inputs. Detailed information on feed is shown in Table 6.1.
Motor and machinery fuels (charts 6.2, 6.3)
The cost of motor and machinery 5. fuels, principally red diesel, is heavily influencedbytrendsinoilprices.
In 2011, the value of consumption of 6. motor and machinery fuels is estimated to have exceeded £1 billion. Over the longer term, the volume of consumption has shown a declining trend but the value has shown an accelerated rate of increase over the past decade, increasing by 127 per cent since 2001.
Red diesel prices were consistently high 7. in 2011 with an average price of 69 pence perlitrereflectingthehighpriceforcrudeoil. In the longer term, the price of red diesel has increased sharply for most of the past decade and was about three times higher in 2011 than in 2001. The spike in 2008 reflects a spike in the oilprice at that time.

Cha
pter
6 -
Inte
rmed
iate
Con
sum
ptio
n
55
Source: Defra/Aggregate Agricultural Accounts
Chart 6.4 Electricity and fuels for heating
150
200
250
300
350
Indices 2000 = 100 Oil price Value
Volume Unit price
0
50
100
150
200
250
300
350
1973 1981 1991 2001 2011
Indices 2000 = 100 Oil price Value
Volume Unit price
Electricity and fuels for heating (chart 6.4)
This represents power and fuel, mainly 8. electricity, used primarily for stationary activities, such as the operation of facilitiesanddairies,andisasignificantsource of energy costs.
The volume of consumption of 9. electricity and fuels for heating in 2011 shows a return towards the levels of consumption seen at the start of the century. The value of consumption shows an accelerated rate of increase since 2004, increasing by 78 per cent, driven primarily by increases in prices.
Chart 6.5 Fertiliser
Source: Defra/Aggregate Agricultural Accounts
150
200
250
300
350
Indices2000 = 100 Oil price Value
Volume Unit price
0
50
100
150
200
250
300
350
1973 1981 1991 2001 2011
Indices2000 = 100 Oil price Value
Volume Unit price
Fertiliser (chart 6.5)
The production of fertiliser is an energy 10. intensive manufacturing process in which natural gas is used to synthesise atmospheric nitrogen. The price of natural gas is linked to the oil price and reflectsmovementintheoilprice.Highfuel prices also impact on delivery costs. High prices and a slight increase in the volume of consumption saw the value of consumption of fertiliser go over £1.6 billion. The long term trend for the volume of consumption shows a decline since the mid-1980s but the value of consumption has doubled in the fiveyearsreflectingincreasesinprices.

AGRICULTURE IN THE UNITED KINGDOM 2011
56
Animal feed (chart 6.6, table 6.1)
The cost of animal feed is the largest 11. item of expenditure recorded in the production and income account. Total expenditure rose steeply from 1973 to 1984 but levelled out after the introduction of milk production quota in 1984. It fell sharply after 1996, largely as a result of the fall in commodity prices which were shaped by exchange rates and world prices, and a fall in the volume of feed for pigs that mirrored a decline in the pig herd. In recent years, the cost of feed has substantially increased by 80 per cent since 2005 reflectingincreasesincerealprices.
The total cost of all purchased animal 12. feed rose by 12 per cent on 2010 to £4.4 billion for 2011. This is despite a 5.1 per cent fall in the volume of all purchased animal feed due to increased prices for a range of raw ingredients but particularly cereals and oilseeds. Total compound feed production fell by 2.3 per cent. The 2.0 per cent decreaseinthevolumeofpoultrycompoundsproducedisinlinewithcontractionsofthelayerflockrelatedtonewEUregulationsoncagedhenswhichcameintoforceinJanuary2012,andamorestaticproductionof broiler hens. However there has been a more marked decline in the sheep category, which showed a decrease of 11 per cent. This is due to more favourable weather conditions compared to the winter of 2010 which enabled more forage grazing and reduced reliance on compound feed. This is also relevant to the 2.3 per cent decline in cattle compounds alongside declining cattle numbers. The production of pig compounds have seen a 2.3 per cent increase in line with current production trends.
In2011theuseofstraightconcentratesdecreasedby11.8percent.Decreaseswereseeninfieldpeas13. due to a reduction in the area planted and as a consequence of this, there was a decrease of peas going into animal feed due to a lack of availability of peas for human consumption.
Chart 6.6 Animal feed
Source: Defra/Aggregate Agricultural Accounts
100
150
200
Indices2000 = 100 Value Volume Unit price
0
50
100
150
200
1973 1981 1991 2001 2011
Indices2000 = 100 Value Volume Unit price

Cha
pter
6 -
Inte
rmed
iate
Con
sum
ptio
n
57
Table 6.1 Animal feed; United KingdomIncluding direct inter-farm and intra-farm transfer
Enquiries:TomJohnsonon+44(0)1904455301 email: [email protected]
Thousandtonnes(unlessotherwisespecified) Calendar years
2007 2008 2009 2010 2011
(provisional)
Compounds:
cattle 4 544 4 598 4 485 4 680 4 570
calves 201 212 204 213 217
pigs 1 708 1 540 1 464 1 580 1 616
poultry (a) 3 509 3 527 3 559 3 828 3 751
other 725 767 745 859 764
Total (b) 10 570 10 533 10 373 11 022 10 766
Straight concentrates (c) 6 696 6 991 7 574 7 890 6 961
Non-concentrates (d) 525 525 525 525 525
Inter/intra farm transfer 3 008 3 349 3 421 2 494 2 556
Total all purchased animal feed 20 799 21 398 21 894 21 930 20 807
Value of purchased animal feed (£ million) (e) 2 876 3 794 3 480 3 765 4 120
(a) Includes poultry feed produced by 'retail' compounders, but excludes production from integrated poultry units which are included within the straight concen-trates data.
(b) Includes imports, less exports.
(c) These are cereals, cereal offals, proteins and other high energy feeds.
(d) Low-energy bulk feeds expressed as concentrate equivalent. Brewers and distillers grains, hay, milk by-products and other low-energy bulk feeds expressed in terms of equivalent tonnage of high energy feeds.
(e) See Table 9.1 for a breakdown of this total.

58

Cha
pter
7 -
The
Food
Cha
in
Chapter7 The Food Chain
59
Summary
Theaverageannualfoodinflationrateover2011was5.5percentwhilsttheaveragerateforgeneral ●inflationwas4.5percent.
Excluding the effect of price rises consumers’ expenditure fell 2.5 per cent in 2011 and has fallen 8.6 per ●cent since 2007, indicating that consumers were buying less or lower quality products.
In 2011, the farmgate share of the price of a basket of items covering staples of agricultural production was ●39 per cent. This is 17 per cent less than the farmgate share in 1988 but the highest it has been since 1997.
In 2010, the agri-food sector in the United Kingdom accounted for a total estimated Gross Value Added ●(GVA) of £86 billion or 6.8 per cent of national GVA, unchanged on 2009. Food manufacturing, food wholesaling and non-residential catering sectors all increased gross value added in 2010 while food retailing saw a slight reduction.
Employment in the agri-food sector increased 1.1 per cent over the 12 month period to the third quarter ●of 2011 to around 3.6 million. The largest increase was in non-residential catering, rising by 59 thousand while in food retailing there was a drop of 24 thousand. The agriculture sector increased by 9 thousand (2.2 per cent).
In 2010, total factor productivity in the food sector excluding agriculture was broadly the same as in 2009. ●Of the four main food industry sectors, productivity in both food manufacture and food wholesale have risen overall since 2000 whilst productivity of food retail is at similar levels to 2000 and for catering it has fallen.
Contribution of the agri-food sector to the national economy (chart 7.1, table 7.1)
In the agri-food sector in 2010 food 1. manufacturing was the largest contributor at 29 per cent, ahead of food retailing at 27 per cent and non-residential catering at 25 per cent. Food wholesaling covers 11 per cent of the sector and agriculture made the smallest contribution at 8.2 per cent.
Comparing 2010 with 2009 all sectors 2. of the food chain have seen an increase in productivity, resulting in a 0.8 per cent rise in total factor productivity of the food chain. Benchmarking against a wider economy measure shows that the average annual growth in the food chain between 2000 and 2010 was 0.5 per cent compared to 0.2 per cent in the wider economy.
1.
Chart 7.1 Contribution of the agri-food sector to the national economy
Source: Annual Business Survey (ONS) and Aggregate Agrcultural Accounts (Defra)
Agriculture£7.1 bn, 8%
Food and Drink Manufacturing£24.7 bn, 29%
Food and Drink
Food and Drink Retailing£23.5 bn, 27%
Non-Residential Catering£21.6 bn, 25%
Agriculture£7.1 bn, 8%
Food and Drink Manufacturing£24.7 bn, 29%
Food and Drink Wholesaling£9.3 bn, 11%
Food and Drink Retailing£23.5 bn, 27%
Non-Residential Catering£21.6 bn, 25%

AGRICULTURE IN THE UNITED KINGDOM 2011
60
Table 7.1 Agri-food sector contribution to the national economy; United KingdomEnquiries:JimHoldingon+44(0)1904455069 email: [email protected]
£million(unlessotherwisespecified) Calendar years
2007 2008 2009 2010 2011
(provisional)
Agri-food sector’s contribution to total economy gross value added
at current prices Agriculture 5 598 7 182 7 046 7 098 8 845
Food Manufacturing 21 797 22 796 23 880 24 687 . .
Food Wholesaling 9 156 8 882 9 263 9 346 . .
Food Retailing 21 791 22 727 23 579 23 543 . .
Food Non-Residential Catering 21 817 22 047 20 400 21 563 . .
% of national gross value added (current prices) 6.5 6.7 6.8 6.8 -
Workforce in the food sector (thousand persons)
Agriculture 438 439 419 426 435
Food Manufacturing 399 380 372 370 371
Food Wholesaling 213 224 214 213 206
Food Retailing 1 117 1 145 1 182 1 130 1 106
Food Non-Residential Catering 1 415 1 461 1 399 1 381 1 440
% of total workforce in employment 13.4 13.5 13.7 13.5 13.7
Trade in food, feed and drink (in real terms at 2011 prices)
Imports of food, feed and drink 30 352 34 654 35 787 35 411 36 806
% of total UK imports 8.6 9.2 10.5 9.2 9.2
Exports of food, feed and drink 12 982 14 496 15 441 16 663 18 160
% of total UK exports 5.2 5.3 6.2 6.0 6.1
UK Food Production to Supply Ratio(‘Self-Sufficiency’)
% of all food 60.0 59.9 58.4 61.1 62.9
% of indigenous type food 73.1 72.7 71.8 75.1 77.7
Household final consumption expenditure on food and alcoholic drinks
at current prices 162 326 167 814 165 674 173 610 178 136
of which: household food 75 706 79 790 81 185 84 297 86 464
food eaten out 43 746 45 354 44 113 47 994 46 913
alcoholic drinks 42 874 42 670 40 376 41 319 44 759
at constant 2008 prices (£ million) 172 683 167 814 158 763 161 768 157 766
of which: household food 82 534 79 790 76 986 77 433 75 398
food eaten out 47 962 47 629 44 946 47 489 45 629
alcoholic drinks 42 187 40 395 36 831 36 846 36 739
%oftotalhouseholdfinalconsumptionexpenditure 18.8 19.1 19.3 19.2 19.2
of which: household food 8.8 9.1 9.5 9.3 9.3
food eaten out 5.1 5.2 5.1 5.3 5.0
alcoholic drinks 5.0 4.9 4.7 4.6 4.8
Producer prices for agricultural products (2008 = 100) 82.8 100.0 94.9 100.9 114.0
Consumer price index (2008 = 100):
food 91.7 100.0 105.4 109.0 114.9
alcoholic drinks 96.9 100.0 104.5 107.8 114.1
all items 96.5 100.0 102.2 105.5 110.3
Source: Annual Business Survey (ONS), Aggregate Agricultural Accounts (Defra), Labour Force Survey Q3 2011 (ONS), Overseas Trade Statistics (HMRC), Consumer Price Indices (ONS)

Cha
pter
7 -
The
Food
Cha
in
61
1
(a) Overseas trade data is provisional for full year 2011 from HM Revenue and Customs. (Data may not equal total due to rounding.) Dashed lines indicate main trade flows. (b) Consumers’ expenditure, properly known as household final consumption expenditure, is provisional from the Office for National Statistics for full year 2011 and is calculated at current prices. (Data may not equal total due to rounding.) (c) Gross value added (GVA) is the difference between the value of goods and services produced and the cost of raw materials and other inputs used up in production. GVA figures are from the Annual Business Survey and is provisional data for full year 2010, which is calculated at basic prices (market prices less taxes plus subsidies). GVA for food and drink manufacturing is an estimate, as 2010 GVA data for beer manufacturing is unavailable.(d) Employee data for grocery retailers is for Great Britain only and is for Q4 2011 from the Office for National Statistics. Food and drink wholesaling, and agricultural wholesaling includes an estimate of employment by food and drink wholesaling agents, and wholesalers of agricultural machinery from the Annual Business Survey. (Employee data is rounded.) (e) UK Production to Supply Ratio (formerly known as the “Self-Sufficiency” Ratio). The UK sources food from diverse stable countries (with 29% of food coming from the European Free Trade Area), and imports can make up for domestic supply shortages. (f) UK greenhouse gas emissions and energy consumption data does not relate to Q3 2011. Energy consumption does not take into account energy embedded in food that we import, nor does it subtract energy that went into producing food that is exported. Therefore the 20% of energy consumption cannot be directly compared to the 15% of GHG emissions.
Enterprises 8,000
Total Consumers’ Expenditure (b)on food, drink, and
catering services – £178.1bn
Farmers and Primary Producers Gross value added – £8.8bn
Employees – 466,000 Farm holdings – 222,668
Total payments to farmers (less levies) – £3.4bn Payments linked to production – £25m
Total agricultural land area – 18.3 million hectares
Food and Drink Manufacturing Includes everything from primary processing (milling, malting, slaughtering) to complex prepared foods. Many products will go through several stages.
Gross value added – £24.6bn (c) Employees – 384,000 Enterprises – 7,356
Manufacturing sites – 9,215
Agricultural Wholesalers (including agricultural machinery)
Gross value added – £2.1bn (c) Employees – 44,000 (d)
Enterprises – 4,105
Food and Drink Wholesalers (including agents)
Gross value added – £9.3bn (c) Employees – 185,000 (d)
Enterprises – 15,232
Consumers’ Expenditure (b) on catering services – £76.4bn
Caterers (restaurants, cafes, canteens) Gross value added – £21.6bn (c)
Employees – 1,504,000 (d) Enterprises – 112,769
Catering Outlets – 420,034
Food and Drink Retailers Gross value added – £23.5bn (c)
Employees – 1,174,000 (d) Enterprises – 52,124
Stores – 88,441
Household Expenditure (b) on food and drink – £101.7bn
Distribution Involved at all parts of the chain
Imports (a) £36.8bn of which:
Highly processed – £13.0bn Lightly processed – £16.9bn
Unprocessed – £6.8bn
Fishing & Aquaculture Gross value added – £572m (c)
Employees – 7,000 Enterprises – 3,757
Fleet size (All vessels) – 6,477
Exports (a) £18.2bn of which:
Highly processed – £10.3bn Lightly processed – £6.2bn
Unprocessed – £1.6bn
UK Consumers63 million people
Agricultural Supply Industry (Manufacturing of agricultural
machinery, fertilizers & pesticides) Gross value added – £995m (c)
Employees – 11,000 Enterprises – 438
Food & Drink Supply Industry (Food processing machinery)
Gross value added – £319m (c) Employees – 7,000 Enterprises – 487
UK Production to Supply Ratio (e) All Food – 63%
Indigenous – 78%
Energy Consumption (f)Domestic cooking, agriculture, food & drink manufacturing, transport, food retailing & service sector catering – Together these activities account for an estimated 20% of total UK energy consumption.
Greenhouse Gas Emissions (f)Total food chain – 158 million tonnes CO2
equivalent (15% of total emissions associated with UK consumption)
Production – 62% of UK food chain emissions Trade – 25% of UK food chain emissions
Household – 13% of UK food chain emissions
Chart 7.2 Economic summary of the UK Food Chain – Fourth quarter 2011*

AGRICULTURE IN THE UNITED KINGDOM 2011
62
Food chain employees and self–employed farmers (chart 7.3)
In the third quarter of 2011, the agri-food sector employed 14 per cent of all employees in Great Britain. It 3. has been about 14 per cent since 2001. Less than half a million of these are employed in agriculture – see chart 7.3.
In the twelve months to September 2011, employment in the agri-food sector increased by 1.1 per cent. 4. Increases in agriculture, manufacturing and non-residential catering outweighed decreases in the wholesaling and retailing sectors. Employment across the whole economy fell by 0.1 per cent over the same period.
Food manufacturing
Gross value added in the food manufacturing 5. sector increased 3.4 per cent in 2010. It had the largest gain in productivity in 2010 due to a proportionally larger rise in volume of output than in the volume of purchases. Employment was on a long term downward trend but levelled off around 2009, coinciding with higher food prices. Higher food prices appear to have benefitted the food manufacturingindustry and, combined with the productivity growth in 2010, helped facilitate a small increase in employment. Figures for quarter three 2011 show an increase of around one thousandemployees,thefirstincreasesince1999.
Food wholesaling
Gross value added in the food wholesaling 6. sector has risen steadily since 2000. At £9.3 billion in 2010, it is 68 per cent higher than in 2000. Employment in this sector fell 3.3 per cent in 2011. A reduction of seven thousand employees reduced employment levels to 1.8 per cent lower than the previous dip in 2005. Productivity has been on an upward trend since 2000 and increased 0.6 per cent in 2010. It is now 7.1 per cent higher than in 2000 with an average annual increase of 0.7 per cent.
Food retailing
Food retailing gross value added was £23.5 billion in 2010, a small decrease of 0.2 per cent on 2009. 7. Employmentinthissectorrosebetween2007and2009butreductionsoffiftytwothousandemployeesin2010 and a further twenty four thousand in 2011 resulted in employment levels lower than at any time since 2000. Productivity of food retail increased in 2010 due mainly to the fall in labour, but there has been no overall productivity growth in the sector since 2000.
Non-residential catering
Fallingconsumerexpenditureoneatingoutsince2003hasmadeitdifficultforthissector.However,in8. 2010 gross value added increased 5.7 per cent, going some way to reversing the 7.5 per cent drop seen in 2009. Employment increased in 2011 by 4.3 per cent with an additional 59 thousand employees. This is slightly below 2008 levels but 14 per cent higher than in 2000.
Agriculture0.4312%
Food and drink manufacturing
0.3710%
Food and agricultural wholesaling
0.216%
Non-residential catering1.4441%
Agriculture0.4312%
Food and drink manufacturing
0.3710%
Food and agricultural wholesaling
0.216%
Food and drink retailing1.1131%
Non-residential catering1.4441%
Chart 7.3 Food chain employees and self-employed farmers (millions)
Source:LabourMarketTrends(ONS)andJuneSurveyofAgricultural&Horticultural Holdings (Defra)

Cha
pter
7 -
The
Food
Cha
in
63
The food chain (chart 7.2)
In 2011, the food supply chain in the United Kingdom as a whole received £159 billion, which came from 9. spending by consumers in the United Kingdom, plus exports less imports of agricultural commodities and processed food and drink products (assuming that imports and exports directly to and from consumers are negligible). Chart 7.2 shows the largest elements of the food chain from agriculture as a primary producer through food manufacturing and retail trade to consumers’ expenditure.
Trade in food, feed and drink (table 7.1)
The value of imports of food, feed and drink was £36.8 billion in 2011, an increase of 3.9 per cent from 10. 2010. The value of exports of food, feed and drink rose by 9.0 per cent over the same period to £18 billion, resulting in little change to the trade gap at £18.6 billion.
Foodproductiontosupplyratio(commonlyreferredtoasthe‘Self-sufficiency’ratio) (chart 7.4)
Food production to supply ratio, 11. which is calculated as the farm-gate value of raw food production divided by the value of raw food for human consumption, is estimated to be 63 per cent for all food in 2011 and 78 per cent for indigenous type food. This compares with 61 per cent and 75 per cent respectively in 2010. This slight increase on 2010 is a result of increases in the value of domestically produced oilseed, beef, milk, and wheat. The food production to supply ratiofiguresfor2010intable7.1,areslightly higher than those published in AUK 2010. This is due to provisional tradedatabeingfinalised.
The rise in the production to supply ratio for beef was due to increased domestic production resulting from 12. ahighdemandformanufacturingbeef.Limitedsuppliesin2011ledtostrongpricesthathadasignificanteffect on the value of home-fed beef production – a 20 per cent rise on 2010.
AtightEUsupplyanddemandsituationledtohighpricesforoilseedrape,particularlyinthefirsthalfof13. 2011. This led to a 65 per cent increase in the farmgate value of domestic production.
Thevalueofdomesticmilkproductionrosesignificantlyin2011becauseofincreasedmilkavailabilityand14. higher farmgate milk prices.
United Kingdom wheat prices follow global markets and prices were supported by a tight global supply 15. situation. Additionally, a higher proportion of the 2011 United Kingdom wheat crop was of milling quality andbenefitedfromhigherpremiums,leadingtoa41percentincreaseinthevalueofdomesticproduction.
40
60
80
100
%All food % Indigenous type food %
0
20
40
60
80
100
1988 1990 1992 1994 1996 1998 2000 2002 2004 2006 2008 2010
%All food % Indigenous type food %
Chart 7.4 Food production to supply ratio

AGRICULTURE IN THE UNITED KINGDOM 2011
64
Distinction between competitiveness and food security
The production to supply ratio provides a very broad indicator of the ability of United Kingdom agriculture to 16. meet consumer demand, which can also be described as competitiveness. The ratio is not an appropriate measure of “food security” since it fails to account for many dimensions of this complex issue.
A detailed analysis is given in the defra publication ‘UK Food Security Assessment’ available at: 17. http://archive.defra.gov.uk/foodfarm/food/security/index.htm.
The key points on food production to supply ratio and food security from this paper are:18.
Diversity enhances security. The United Kingdom sources foods from diverse stable countries, mainly ●European countries, and imports can make up for domestic supply shortages; see chart 7.5 ‘Origins of food consumed in the United Kingdom’.A high food production to supply ratio fails to insulate a country against many possible disruptions to its ●supply chainProduction potential is more relevant at EU level than United Kingdom level, and the EU as a whole ●has a food production to supply ratio of over 90 per cent.
Further trade liberalisation is unlikely to materially affect food security within the EU.19.
Origins of food consumed in the United Kingdom (chart 7.5)
Chart 7.5 includes the proportion of 20. United Kingdom food consumption that is produced in the United Kingdom. This should not be confused with the measure of United Kingdom Food Production to Supply Ratio given in chart 7.4. Chart 7.5 looks purely at the breakdown of food that the United Kingdom actually consumes.
The United Kingdom Food Production 21. to Supply Ratio (chart 7.4) considers all United Kingdom food production, including food that the United Kingdom exports instead of consuming. A further, much smaller, difference is that the United Kingdom food production used in the food production to supply ratio calculations has been adjusted to take account of the balance of trade in the important inputs into agriculture.
20%
40%
60%
80%
100%
Chart 7.5 Origin of food consumed in the UK: 1996, 2001, 2006, 2011
South America
Rest of Europe
North America
EU
Australasia
Asia
Africa
UK consumption (a)
-20%
0%
20%
40%
60%
80%
100%
1996 2001 2006 2011
Chart 7.5 Origin of food consumed in the UK: 1996, 2001, 2006, 2011
South America
Rest of Europe
North America
EU
Australasia
Asia
Africa
UK (a)
UK exports (b)UKexports (b)
UK consumption (a)
Based on the farm-gate value of raw food(a) Consumption of UK origin consists of UK domestic production minus UK exports(b) UK exports are given as a percentage of total UK consumption.
Chart 7.5 Origins of food consumed in the United Kingdom: 1996, 2001, 2006, 2011

Cha
pter
7 -
The
Food
Cha
in
65
Consumers’ expenditure
With higher food prices consumers 22. responded in part by buying less or lower quality foods for the household, reducing amounts of eating out and reducing purchases of alcoholic drinks. In 2010 there was some reversal of this reaction, but it was not sustained in 2011. Excluding the effects of price rises consumers spent 8.6 per cent less on household food in 2011 than in 2007, 4.9 per cent less on eating out and 13 per cent less on alcoholic drinks. At current prices, which incorporate the higher food prices, consumers spent 9.7 per cent more in 2011 than in 2007.
50
% share of value of basket
40
50
% share of value of basket
30
40
50
% share of value of basket
20
30
40
50
% share of value of basket
10
20
30
40
50
% share of value of basket
0
10
20
30
40
50
1988 1990 1992 1994 1996 1998 2000 2002 2004 2006 2008 2010
% share of value of basket
0
10
20
30
40
50
1988 1990 1992 1994 1996 1998 2000 2002 2004 2006 2008 2010
% share of value of basket
Chart 7.6 Farmers’ share of consumers’ expenditure
Table 7.2 Farmers’ share of the value of a basket of food items (a); United KingdomEnquiries:JimHoldingon+44(0)1904455069 e-mail: [email protected]
Farmgate share in
1988 %
Farmgate share in
2011 %
% change in share
1988/2011
Weight in basket
2011
Farmers’ share of basket 47 39 -17
Farm gate product Retail product
apples dessert apples per kg 55 40 -27 6
beef untrimmed beef (b) per kg 67 53 -22 188
carrots carrots per kg 30 46 52 10
cabbages cabbage, hearts, per kg 38 61 59 7
chicken oven ready roasting chicken, fresh or chilled per kg 47 39 -18 125
eggs Free range eggs per dozen (c) 28 26 na 49
lamb untrimmed lamb (b) per kg 65 57 -11 86
onions onions per kg 25 39 54 7
pork untrimmed pork (b) per kg 57 39 -30 91
potatoes old loose white potatoes per kg 24 22 -7 59
tomatoes tomatoes per kg 48 41 -14 8
wheat white loaf sliced, 800g 16 11 -35 46
milk whole milk (d) 38 34 -9 319
(a)FarmgatepricesfromDefra,retailpricesfromtheOfficeforNationalStatisticsandtheAgriculture&HorticultureDevelopmentBoard(AHDB).
(b) Retail prices for beef, lamb and pork are untrimmed AHDB prices adjusted for drip loss.
(c) Farmgate share in 1988 is based on non-free range size 2 eggs.
(d) The average price of one pint of delivered milk and one pint of shop milk (the shop milk based on a two pint purchase).

AGRICULTURE IN THE UNITED KINGDOM 2011
66
Farmers’ share of consumers’ expenditure (table 7.2, chart 7.6)
In 2011 the farmgate share of the price 23. of a basket of items covering staples of agricultural production was 39 per cent. The absolute level of the farmgate share is sensitive to which retail products are chosen for the basket; some have a greater amount of added value beyond the farmgate and it would therefore be expected that the share accounted for by the farmer would be lower.
Table 7.2 shows the items in the basket 24. and how the farmers’ share has changed for each. They are weighted according to their value to farmers in the United Kingdom. Milk has a weight of 319 units, which means it accounts for 31.9 per cent of the basket.
In 2011:25.
The farmgate share rose notably for beef and cabbages. ●
The farmgate share fell notably for tomatoes. ●
The farmgate share was hardly changed for apples, eggs, lamb, chicken, carrots, potatoes, onions, ●pork, bread and milk.
Since 1988, the largest reductions have been for bread and pork where the farmers’ share has reduced 26. by 35 per cent and 30 per cent respectively. The largest increases in the farmers’ share since 1988 have been for carrots, cabbages and onions, all of which have increased by more than 50 per cent.
Changes in consumer price indices (chart 7.7)
Historically(1975to2000)foodpricestendedtorisemoreslowlythangeneralinflation,asmeasuredbythe27. Retail Price Index (RPI). Food prices in real terms were fairly stable between 2000 and 2007, as measured by the Consumer Price Index (CPI), before rising by 12 per cent and then returning to real terms stability from 2009 onwards. In March 2012, food prices were in real terms 12 per cent above those of 2000.
Averagedover2011theannualrateoffoodinflationwas5.5percentasmeasuredbytheConsumerPrice28. Index.Thiscompareswithageneralinflationrateof4.5percentoverthesameperiod.TheannualrateoffoodinflationexceededallitemsCPIineightoutofthetwelvemonthsof2011.
In 2011, the largest average annual price rises were for oils and fats up by 12 per cent; coffee, tea and 29. cocoaup9.4percent;fishup9.3percent;mineralwaterandsoftdrinksup8.5percentandconfectioneryup 7.5 per cent.
100
105
110
115
an 2
000
= 10
0
Changes In Consumer Price Indices (to March 2012)
Food prices in real terms
90
95
100
105
110
115
Jan-00 Jan-01 Jan-02 Jan-03 Jan-04 Jan-05 Jan-06 Jan-07 Jan-08 Jan-09 Jan-10 Jan-11 Jan-12
Jan2000=100
Changes In Consumer Price Indices (to March 2012)
Food prices in real terms
Chart 7.7 Changes in consumer price indices
Source: Consumer Price Index (ONS)

Cha
pter
8 -
Ove
rsea
s Tr
ade
Overseas Trade
67
Chapter8Summary
In 2011:
The value of food, feed and drink exports was £18.2 billion, a rise of 9.0 per cent on 2010 in real terms. ●
The value of food, feed and drink imports increased by 3.9 per cent on 2010 to £36.8 billion in real terms in ●2011.
The trade gap in food, feed and drink narrowed by 0.5 per cent to £18.6 billion in real terms. ●
Principal destinations for exports were the Irish Republic (18 per cent), France (13 per cent), USA (7.9 per ●cent), Germany (6.9 per cent) and Spain (6.2 per cent).
The most important trade partners for imports remained the Netherlands (12 per cent), France (11 per ●cent), Irish Republic (9.2 per cent), Germany (8.3 per cent) and Spain (6.1 per cent).
Whisky is the largest value single food, feed and drink export item, totalling £4.3 billion in 2011, an increase ●of 16 per cent on 2010 in real terms.
Fresh fruit and vegetables constitute the highest value imports, together totalling £4.5 billion in 2011. ●
Introduction
The Overseas Trade Statistics presented in this chapter are based on data collected by HM Revenue and 1. Customs and are compiled from returns made by importers and exporters. Before the completion of the Single Market in the European Union at the end of 1992, all overseas trade data for the United Kingdom was compiled from Customs declarations made by traders. Since the beginning of 1993 the collection of trade statistics has been divided into two categories: that transacted between the United Kingdom and countries outside the European Union (extra-EU trade) and that between the United Kingdom and its European Union partners (intra-EU trade). Extra-EU trade statistics are compiled, as before, from Customs declarations by importers, exporters and their agents; intra-EU trade statistics are compiled using a system linked to traders’ VAT returns, known as Intrastat.
The trade statistics shown here may not match those shown in the commodities tables in Chapter 5 where, 2. for example, trade in meat includes the carcase weight equivalent of trade in live animals and trade in milk is of raw milk before processing and not of processed and packaged milk and cream as shown here.
Forselectedtablesandcharts,provisionalfiguresfor2011havebeenincludedtoshowthemostuptodate3. information;the2011datawillbefinalisedbyHMRevenueandCustomsinAugust2012.Forotherchartsandmapswhichhaveadditionaldetail,particularlyoncountrybreakdowns,onlyfinaldataupto2010havebeen used. This is because the 2011 data at this level of detail are more likely to be subject to revision. However the broad conclusions based on 2010 data are likely to apply to 2011.

AGRICULTURE IN THE UNITED KINGDOM 2011
68
15 00020 00025 00030 00035 00040 000
£ million Exports (£m) at 2011 PricesImports (£m) at 2011 Prices
05 000
10 00015 00020 00025 00030 00035 00040 000
1981 1986 1991 1996 2001 2006 2011 (Prov)
£ million Exports (£m) at 2011 PricesImports (£m) at 2011 Prices
Chart 8.1 Trade in food, feed and drink at 2011 prices; United Kingdom
Trade in food, feed and drink (chart 8.1, table 8.1)
The value of exports of food, feed and drink was 53 per cent higher in real terms in 2011 than in 2002. This 4. is a consequence of the combination of the increased strength of sterling, disease related issues, and world commodity prices. The value of imports was 44 per cent higher in real terms in 2011 than in 2002. As a consequence, the trade gap in food, feed and drink has widened by 37 per cent in real terms between 2002 and 2011 to £18.6 billion.
Table 8.1 shows the value of trade at 2011 prices. The value of food, feed and drink exports was £18.2 5. billion in 2011, 9.0 per cent up in real terms on 2010 when it stood at £16.7 billion. The value of food, feed and drink imports was £36.8 billion in 2011, a 3.9 per cent increase in real terms on 2010, when it stood at £35.4 billion. As a result, the trade gap in food, feed and drink narrowed by 0.5 per cent in real terms between 2010 and 2011. All categories except Sugar and Cereals have seen a rise in exports with the largest nominal increase being seen in Drink which showed a 15 per cent increase. Oils exports showed thelargestpercentincreaseat30percent.Categorieswhichinfluencedthesmallincreaseinimportswere Oils, which showed a 19 per cent increase, and Fish and Meat which showed 8.6 and 7.5 per cent increases respectively.

Cha
pter
8 -
Ove
rsea
s Tr
ade
69
Table 8.1 Trade in food, feed and drink by SITC division (at 2011 prices); United KingdomEnquiries:JoanneGardineron+44(0)1904455681 email: [email protected]
£ million Calendar years
SITC
Division 2006 2007 2008 2009 2010 2011
Code Title (provisional)
Exports
01 Meat 901.0 949.9 1 271.5 1 359.2 1 473.3 1 681.6
02 Dairy 862.6 919.3 960.2 920.8 1 089.6 1 245.1
03 Fish 1 120.9 1 118.2 1 105.4 1 283.6 1 415.6 1 465.6
04 Cereals 1 468.8 1 546.4 1 920.7 1 952.1 2 032.7 2 027.7
05 Fruit and Veg 691.9 682.5 755.4 834.0 851.6 880.6
06 Sugar 444.5 444.5 486.1 497.6 462.9 378.6
07 Coffee, tea, etc. 797.5 833.8 950.1 973.9 1 061.1 1 089.4
08 Animal feed 431.8 485.7 577.0 643.5 680.3 703.9
09 Misc. 921.8 887.3 978.1 1 096.1 1 149.3 1 178.7
11 Drink 4 450.3 4 664.5 5 004.6 5 423.2 5 889.5 6 784.7
22 + S4 Oils 381.0 449.3 487.0 457.5 557.0 724.2
Total 12 472.0 12 981.6 14 496.1 15 441.4 16 662.9 18 160.2
Imports
01 Meat 4 658.9 4 649.0 5 137.2 5 474.8 5 342.9 5 741.1
02 Dairy 2 210.9 2 131.8 2 520.7 2 584.4 2 599.0 2 578.9
03 Fish 2 282.0 2 270.6 2 420.7 2 396.6 2 372.1 2 577.0
04 Cereals 1 849.4 2 190.3 2 700.2 2 715.7 2 478.8 2 536.9
05 Fruit and Veg 7 094.4 7 252.1 7 886.3 7 935.2 8 019.0 8 139.2
06 Sugar 1 150.7 1 106.5 1 275.8 1 323.4 1 229.3 1 275.0
07 Coffee, tea, etc. 1 753.0 1 829.5 2 141.0 2 548.5 2 631.7 2 799.5
08 Animal feed 1 205.1 1 221.0 1 565.3 1 705.3 1 796.0 1 693.4
09 Misc. 1 499.9 1 748.4 2 132.5 2 408.5 2 253.8 2 443.4
11 Drink 4 521.8 4 570.4 4 791.0 4 895.6 4 949.6 4 953.8
22+S4 Oils 1 259.9 1 382.2 2 082.8 1 799.4 1 738.7 2 067.9
Total 29 486.0 30 351.7 34 653.6 35 787.2 35 410.8 36 806.1
Defra'saggregate'Food,FeedandDrink'iscomposedofthefollowingdivisionsfromtheStandardInternationalTradeClassification:
01 Meat: meat from cattle, sheep, pigs, goats, poultry, horses etc.; preparations including blood, juices, sausages, livers, offal.
02 Dairy: includes milk (skimmed or otherwise), butter, buttermilk, cream, yoghurt, ice cream, whey, cheese and curd, all types of eggs both in and out of shell.
03 Fish: All types of edible marine life excluding mammals, fresh, frozen, processed, prepared or preserved.
04 Cereals:includesrice,wheat,barley,oats,maize,grainsorghumandpreparationsincludingsweetbiscuits,waffles,gingerbread,uncooked/unstuffed pasta.
05 Fruit and vegetables: includes fresh, frozen or prepared fruit (except crystallised) and vegetables, nuts (except groundnuts), vegetable and fruit juices of all kinds except wine (see division 11), jams, marmalades, fruit or nut puree/paste etc.
06 Sugar:includesbothnaturalsugarandsugarconfectionery(butnotchocolateorcocoa),bothnaturalandartificialhoney,andliquorice.
07 Coffee, tea, etc.: includes all types of tea, coffee (e.g. green, decaffeinated), extracts and substitutes thereof; cocoa and chocolate (of all kinds): all kinds of spices.
08 Animal feed: includes hay, fodder, bran, sharps and other residues derived from cereals or leguminous plants, oil-cake and other solid resi-dues, other residues, brewing dregs, all types of pet or animal food.
09 Miscellaneous:includesmargarine,shortening,homogenisedproductsorpreparationsnotelsewherespecified,sauces,vinegar,soups,yeasts, cooked/stuffed pasta, food preparations for infant use.
11 Drink:includesalcoholicdrinksofallkinds;alsonaturalorartificialmineralandaeratedwaterssweetenedorotherwise.
22+S4 Oils:includesgroundnuts(peanuts),soyabeans,sunflowerseeds,rapeseeds,palmnuts,linseed,poppyseedsetc.,lard,pigfat,oliveoil,rape oil, corn oil, linseed oil, beeswax etc.
Division 00, which covers all live animals, is excluded from the aggregate 'Food, Feed and Drink' because it includes non-food animals, particularly race horses.
S4 stands for Section 4 in the SITC and covers animal and vegetable oils, fats and waxes.

AGRICULTURE IN THE UNITED KINGDOM 2011
70
Germany
Spain
Italy
Belgium
Denmark
Brazil
U.S.A. £ million
0 500 1000 1500 2000 2500 3000 3500 4000 4500
Netherlands
France
Irish Republic
Germany
Spain
Italy
Belgium
Denmark
Brazil
U.S.A. £ million
Chart 8.3 Imports in food, feed and drink by country of despatch 2010; United Kingdom
Chart 8.2 Exports in food, feed and drink by country of destination 2010; United Kingdom
It l
Belgium
Singapore
Hong Kong £ million
It l
Belgium
Singapore
Hong Kong £ million
Spain
Netherlands
Italy
Belgium
Singapore
Hong Kong £ million
Germany
Spain
Netherlands
Italy
Belgium
Singapore
Hong Kong £ million
France
U.S.A.
Germany
Spain
Netherlands
Italy
Belgium
Singapore
Hong Kong £ million
Irish Republic
France
U.S.A.
Germany
Spain
Netherlands
Italy
Belgium
Singapore
Hong Kong £ million
0 500 1000 1500 2000 2500 3000
Irish Republic
France
U.S.A.
Germany
Spain
Netherlands
Italy
Belgium
Singapore
Hong Kong £ million
Map 8.1 Global exports 2010
Trading partners (charts 8.2, 8.3)
Principal destinations of food, feed and drink exports to the European Union in 2010 were the Irish Republic 6. (£2.9 billion), France (£2.0 billion), Germany (£1.1 billion) and Spain (£1.0 billion). The principal European Union countries from which food, feed and drink were imported into the United Kingdom in 2010 were the Netherlands (£4.1 billion), France (£3.8 billion), the Irish Republic (£3.1 billion), Germany (£2.8 billion) and Spain (£2.1 billion).
Principal non-EU destinations of food, feed and drink exports in 2010 were the USA (£1.2 billion), 7. Singapore (£283 million) and Hong Kong (£269 million), while the main non-EU countries from which food, feed and drink were imported into the United Kingdom were Brazil (£935 million), the USA (£933 million), and Thailand (£664 million).

Cha
pter
8 -
Ove
rsea
s Tr
ade
71
Map 8.2 Global imports 2010
Exports and imports (charts 8.4, 8.5)
Between 2002 and 2011, at 2011 prices:
The value of exports of highly processed foods and drink, such as confectionery, canned meats, jams, ●alcoholic drinks and ice cream, increased by 43 per cent.
The value of exports of lightly processed foods and drinks, i.e. goods that retain their raw recognisable form, ●suchasmeat,cheeseandbutter,powderedmilk,flourandsugar,roseby58percent.
The value of exports of unprocessed commodities, such as fresh fruit and vegetables, honey, eggs, milk and ●cream and unmilled cereals, increased by 116 per cent.
Between 2002 and 2011, at 2011 prices:
The value of imports of highly processed foods and drink increased by 50 per cent. ●
The value of imports of lightly processed foods and drinks increased by 46 per cent. ●
The value of imports of unprocessed commodities increased by 31 per cent. ●

AGRICULTURE IN THE UNITED KINGDOM 2011
72
14 00016 00018 000£ million
Highly processed
Lightly processed
Unprocessed14 00016 00018 000£ million
Highly processed
Lightly processed
Unprocessed
10 00012 00014 00016 00018 000£ million
Highly processed
Lightly processed
Unprocessed
6 0008 000
10 00012 00014 00016 00018 000£ million
Highly processed
Lightly processed
Unprocessed
2 0004 0006 0008 000
10 00012 00014 00016 00018 000£ million
Highly processed
Lightly processed
Unprocessed
02 0004 0006 0008 000
10 00012 00014 00016 00018 000
2001 2003 2005 2007 2009 2011
£ millionHighly processed
Lightly processed
Unprocessed
02 0004 0006 0008 000
10 00012 00014 00016 00018 000
2001 2003 2005 2007 2009 2011 (prov)
£ millionHighly processed
Lightly processed
Unprocessed
Chart 8.5 Imports of food, feed and drink by degree of processing at 2011 prices; United Kingdom
Chart 8.4 Exports of food, feed and drink by degree of processing at 2011 prices; United Kingdom
10 000
12 000£ million
Highly processed
Lightly processed
Unprocessed10 000
12 000£ million
Highly processed
Lightly processed
Unprocessed
6 000
8 000
10 000
12 000£ million
Highly processed
Lightly processed
Unprocessed
4 000
6 000
8 000
10 000
12 000£ million
Highly processed
Lightly processed
Unprocessed
2 000
4 000
6 000
8 000
10 000
12 000£ million
Highly processed
Lightly processed
Unprocessed
0
2 000
4 000
6 000
8 000
10 000
12 000
2001 2003 2005 2007 2009 2011
£ millionHighly processed
Lightly processed
Unprocessed
0
2 000
4 000
6 000
8 000
10 000
12 000
2001 2003 2005 2007 2009 2011 (prov)
£ millionHighly processed
Lightly processed
Unprocessed
Trade in key commodities (tables 8.2, 8.3)
Between 2002 and 2011, at 2011 prices:
The value of exports of whisky increased by 40 per cent to £4.3 billion and constitute the highest value single ●commodity while the value of wine imports increased by 12 per cent to £3.0 billion.
Thevalueofexportsofbeefandvealshowedasignificantincrease,reflectingtheresumptionofexports ●following the lifting of the ban on exports in 2006 that had been in place between March 1996 and November 2005.
The value of imports of poultrymeat products (such as cooked chicken) increased by 137 per cent while the ●value of exports increased by 79 per cent.
The value of breakfast cereal imports increased by 80 per cent while the value of exports rose by 8.9 per ●cent.
The value of cheese exports increased by 97 per cent while imports increased by 47 per cent, but the value ●of imports is still just over 3 times the value of exports.
The value of bacon and ham imports fell by 11 per cent and there was also a fall for butter, down by 6.1 per ●cent.
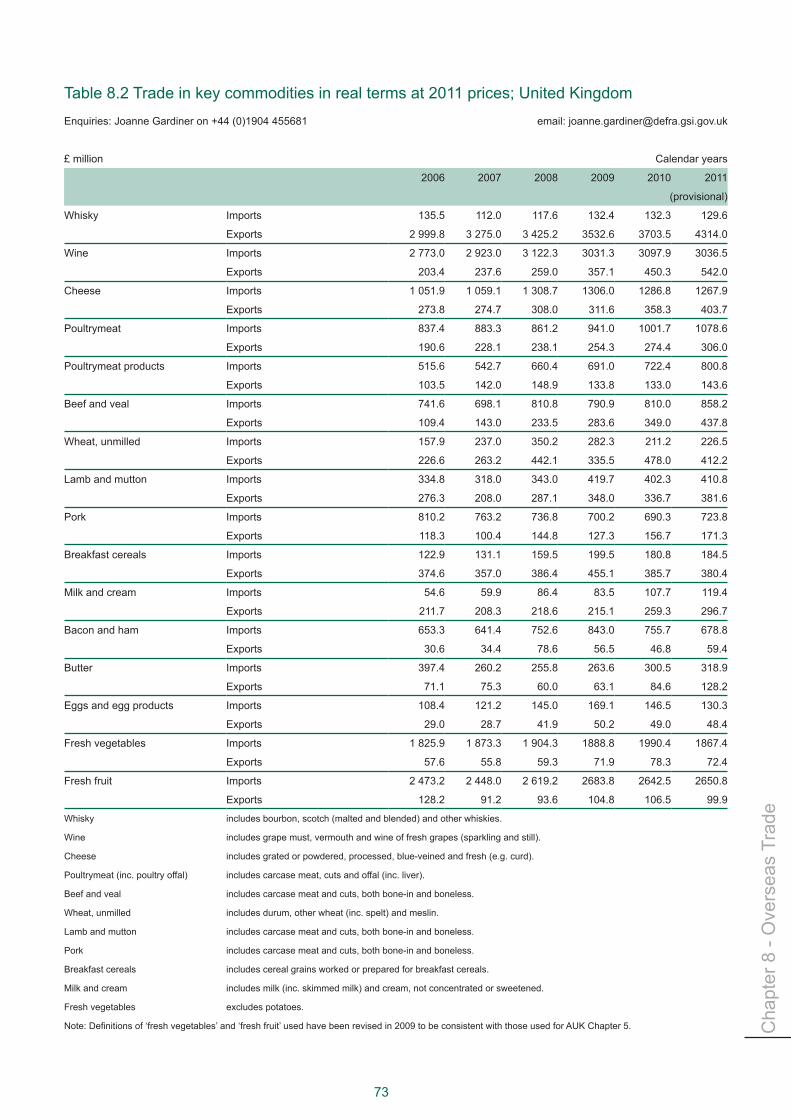
Cha
pter
8 -
Ove
rsea
s Tr
ade
73
Table 8.2 Trade in key commodities in real terms at 2011 prices; United KingdomEnquiries:JoanneGardineron+44(0)1904455681 email: [email protected]
£ million Calendar years
2006 2007 2008 2009 2010 2011
(provisional)
Whisky Imports 135.5 112.0 117.6 132.4 132.3 129.6
Exports 2 999.8 3 275.0 3 425.2 3532.6 3703.5 4314.0
Wine Imports 2 773.0 2 923.0 3 122.3 3031.3 3097.9 3036.5
Exports 203.4 237.6 259.0 357.1 450.3 542.0
Cheese Imports 1 051.9 1 059.1 1 308.7 1306.0 1286.8 1267.9
Exports 273.8 274.7 308.0 311.6 358.3 403.7
Poultrymeat Imports 837.4 883.3 861.2 941.0 1001.7 1078.6
Exports 190.6 228.1 238.1 254.3 274.4 306.0
Poultrymeat products Imports 515.6 542.7 660.4 691.0 722.4 800.8
Exports 103.5 142.0 148.9 133.8 133.0 143.6
Beef and veal Imports 741.6 698.1 810.8 790.9 810.0 858.2
Exports 109.4 143.0 233.5 283.6 349.0 437.8
Wheat, unmilled Imports 157.9 237.0 350.2 282.3 211.2 226.5
Exports 226.6 263.2 442.1 335.5 478.0 412.2
Lamb and mutton Imports 334.8 318.0 343.0 419.7 402.3 410.8
Exports 276.3 208.0 287.1 348.0 336.7 381.6
Pork Imports 810.2 763.2 736.8 700.2 690.3 723.8
Exports 118.3 100.4 144.8 127.3 156.7 171.3
Breakfast cereals Imports 122.9 131.1 159.5 199.5 180.8 184.5
Exports 374.6 357.0 386.4 455.1 385.7 380.4
Milk and cream Imports 54.6 59.9 86.4 83.5 107.7 119.4
Exports 211.7 208.3 218.6 215.1 259.3 296.7
Bacon and ham Imports 653.3 641.4 752.6 843.0 755.7 678.8
Exports 30.6 34.4 78.6 56.5 46.8 59.4
Butter Imports 397.4 260.2 255.8 263.6 300.5 318.9
Exports 71.1 75.3 60.0 63.1 84.6 128.2
Eggs and egg products Imports 108.4 121.2 145.0 169.1 146.5 130.3
Exports 29.0 28.7 41.9 50.2 49.0 48.4
Fresh vegetables Imports 1 825.9 1 873.3 1 904.3 1888.8 1990.4 1867.4
Exports 57.6 55.8 59.3 71.9 78.3 72.4
Fresh fruit Imports 2 473.2 2 448.0 2 619.2 2683.8 2642.5 2650.8
Exports 128.2 91.2 93.6 104.8 106.5 99.9
Whisky includes bourbon, scotch (malted and blended) and other whiskies.
Wine includes grape must, vermouth and wine of fresh grapes (sparkling and still).
Cheese includes grated or powdered, processed, blue-veined and fresh (e.g. curd).
Poultrymeat (inc. poultry offal) includes carcase meat, cuts and offal (inc. liver).
Beef and veal includes carcase meat and cuts, both bone-in and boneless.
Wheat, unmilled includes durum, other wheat (inc. spelt) and meslin.
Lamb and mutton includes carcase meat and cuts, both bone-in and boneless.
Pork includes carcase meat and cuts, both bone-in and boneless.
Breakfast cereals includes cereal grains worked or prepared for breakfast cereals.
Milk and cream includes milk (inc. skimmed milk) and cream, not concentrated or sweetened.
Fresh vegetables excludes potatoes.
Note:Definitionsof‘freshvegetables’and‘freshfruit’usedhavebeenrevisedin2009tobeconsistentwiththoseusedforAUKChapter5.

AGRICULTURE IN THE UNITED KINGDOM 2011
74
Table 8.3 Trade in key commodities by volume; United KingdomEnquiries:JoanneGardineron+44(0)1904455681 email: [email protected]
Thousandtonnes(unlessotherwisespecified) Calendar years
2006 2007 2008 2009 2010 2011
(provisional)
Whisky (million litres) Imports 16.9 14.4 15.6 15.9 16.5 15.8
Exports 302.0 326.3 308.1 311.5 305.3 361.5
Wine (million litres) Imports 1 260.1 1 308.9 1 288.9 1 295.2 1 365.1 1 370.8
Exports 32.3 47.7 43.7 57.6 89.9 87.0
Cheese Imports 378.1 402.9 421.8 418.6 435.8 414.1
Exports 104.2 97.2 88.4 104.7 112.7 124.0
Poultrymeat Imports 381.7 383.4 335.5 339.9 380.8 412.1
Exports 258.7 291.8 278.3 258.0 270.5 295.0
Poultrymeat products Imports 206.0 230.4 248.6 241.4 254.6 279.4
Exports 31.3 46.4 45.5 38.3 38.4 45.5
Beef and veal Imports 235.7 240.1 247.5 230.8 238.0 235.5
Exports 41.2 59.4 81.3 83.4 110.1 142.6
Wheat, unmilled Imports 1 028.1 1 238.4 1 248.3 1 390.2 1 110.9 901.8
Exports 2 116.5 1 911.1 2 765.7 2 533.1 3 334.8 2 287.2
Lamb and mutton Imports 113.8 114.1 111.9 116.0 100.7 88.1
Exports 87.1 68.8 86.8 96.1 89.1 98.9
Pork Imports 458.8 462.9 393.5 360.2 363.2 372.8
Exports 94.7 98.6 117.9 104.4 131.3 144.4
Breakfast cereals Imports 92.7 91.8 103.0 110.5 105.1 107.3
Exports 174.8 165.3 160.3 171.4 157.6 157.3
Milk and cream Imports 123.8 133.5 192.7 157.6 193.1 214.7
Exports 621.3 513.2 532.5 538.7 561.2 648.2
Bacon and ham Imports 264.0 277.5 292.7 322.9 312.6 280.9
Exports 10.2 11.9 31.4 21.2 24.5 34.1
Butter Imports 147.1 103.2 81.4 96.2 101.5 99.5
Exports 35.7 31.7 23.8 26.5 26.8 35.7
Eggs and egg products Imports 78.4 93.1 95.3 90.3 75.5 68.4
Exports 13.1 11.9 14.0 23.0 23.8 16.7
Fresh vegetables Imports 1 893.1 1 947.3 1 956.7 1 823.0 1 871.2 1 971.6
Exports 82.7 87.9 79.9 77.6 95.1 88.7
Fresh fruit Imports 3 470.1 3 510.2 3 326.2 3 175.0 3 228.8 3 346.6
Exports 176.8 147.1 128.1 152.8 142.0 148.5
Whisky includes bourbon, scotch (malted and blended) and other whiskies.
Wine includes grape must, vermouth and wine of fresh grapes (sparkling and still).
Cheese includes grated or powdered, processed, blue-veined and fresh (e.g. curd).
Poultrymeat (inc. poultry offal) includes fresh, chilled or frozen carcase meat, cuts and offal (inc. liver).
Poultrymeat products includes prepared, preserved, salted or cooked poultrymeat and offal (inc. liver).
Beef and veal includes carcase meat and cuts, both bone-in and boneless.
Wheat, unmilled includes durum, other wheat (inc. spelt) and meslin.
Lamb and mutton includes carcase meat and cuts, both bone-in and boneless.
Pork includes carcase meat and cuts, both bone-in and boneless.
Breakfast cereals includes cereal grains worked or prepared for breakfast cereals.
Milk and cream includes milk (inc. skimmed milk) and cream, not concentrated or sweetened.
Fresh vegetables excludes potatoes, dried legumes and processed vegetables.
Fresh fruit excludes jams, juices, dried and processed fruit.
Note:Definitionsof'freshvegetables'and'freshfruit'usedhavebeenrevisedin2009tobeconsistentwiththoseusedforAUKChapter5.

Cha
pter
8 -
Ove
rsea
s Tr
ade
75
Trade with EU 26 countries (charts 8.6 to 8.11)
This section describes the volume of trade in 3 key commodities between the United Kingdom and the other 8. 26 Member States of the European Union (the EU 26 countries). These commodities have been chosen because the vast majority of United Kingdom trade in them is with countries within the EU.
Bacon and ham
Imports of bacon and ham from the EU 26 countries have been far in excess of exports for many years. 9. Imports have remained relatively stable over the last 10 years but there was a more notable increase in 2009 and then a small decrease in 2010. Total imports stood at 313 thousand tonnes in 2010 when the Netherlands and Denmark provided 81 per cent of all imported bacon and ham. In 2010 exports increased by 14 per cent to 24 thousand tonnes. This increase was mainly driven by increases in exports to Irish Republic, Denmark and Italy which are the key existing export destinations alongside the Netherlands.
300
Th tonnes Total imports from EU 26 countries
Total exports to EU 26 countries
300
Th tonnes Total imports from EU 26 countries
Total exports to EU 26 countries
200
300
Th tonnes Total imports from EU 26 countries
Total exports to EU 26 countries
200
300
Th tonnes Total imports from EU 26 countries
Total exports to EU 26 countries
100
200
300
Th tonnes Total imports from EU 26 countries
Total exports to EU 26 countries
0
100
200
300
Th tonnes Total imports from EU 26 countries
Total exports to EU 26 countries
0
100
200
300
2001 2002 2003 2004 2005 2006 2007 2008 2009 2010
Th tonnes Total imports from EU 26 countries
Total exports to EU 26 countries
Chart 8.6 Trade with EU 26 countries; bacon and ham
Denmark44%
Netherlands
Germany12%
Italy2%
Others 5%
Denmark44%
Netherlands37%
Germany12%
Italy2%
Others 5%
Chart 8.7 Trade with EU 26 countries; imports of bacon and ham 2010
Pork
Since the ban on exports during the outbreak of foot and mouth disease in 2001, exports have been much 10. lower than their pre-2001 levels. However they have shown a small year on year increase since 2004, excepting for 2009, and in 2010 stood at 107 thousand tonnes; this is still 36 per cent down on the 2000 level. Imports have shown continual gradual increases, peaking in 2007 at 458 thousand tonnes and in 2010 stood at 359 thousand tonnes. Denmark accounted for 28 per cent of the imports of pork in 2010, the Netherlands 18 per cent with a further 27 per cent contributed by Germany, Belgium and Luxembourg.

AGRICULTURE IN THE UNITED KINGDOM 2011
76
400
500
Th tonnes Total imports from EU 26 countries
Total exports to EU 26 countries
400
500
Th tonnes Total imports from EU 26 countries
Total exports to EU 26 countries
300
400
500
Th tonnes Total imports from EU 26 countries
Total exports to EU 26 countries
200
300
400
500
Th tonnes Total imports from EU 26 countries
Total exports to EU 26 countries
100
200
300
400
500
Th tonnes Total imports from EU 26 countries
Total exports to EU 26 countries
0
100
200
300
400
500
Th tonnes Total imports from EU 26 countries
Total exports to EU 26 countries
0
100
200
300
400
500
2001 2002 2003 2004 2005 2006 2007 2008 2009 2010
Th tonnes Total imports from EU 26 countries
Total exports to EU 26 countries
Chart 8.8 Trade with EU 26 countries; pork
Denmark28%
Germany13%
Others27%
Denmark28%
Netherlands18%
Belgium-Luxembourg
14%
Germany13%
Others27%
Chart 8.9 Trade with EU 26 countries; imports of pork 2010
600
700Th tonnes Total imports from EU 26 countries
Total exports to EU 26 countries
600
700Th tonnes Total imports from EU 26 countries
Total exports to EU 26 countries
400
500
600
700Th tonnes Total imports from EU 26 countries
Total exports to EU 26 countries
300
400
500
600
700Th tonnes Total imports from EU 26 countries
Total exports to EU 26 countries
100
200
300
400
500
600
700Th tonnes Total imports from EU 26 countries
Total exports to EU 26 countries
0
100
200
300
400
500
600
700Th tonnes Total imports from EU 26 countries
Total exports to EU 26 countries
0
100
200
300
400
500
600
700
2001 2002 2003 2004 2005 2006 2007 2008 2009 2010
Th tonnes Total imports from EU 26 countries
Total exports to EU 26 countries
Chart 8.10 Trade with EU 26 countries; milk and cream
Belgium-Luxembourg
9%
France9%
Others7%
Irish Republic75%
Belgium-Luxembourg
9%
France9%
Others7%
Chart 8.11 Trade with EU 26 countries; exports of milk and cream 2010
Milk and cream
Imports of milk and cream saw year on year increases from 2003 to 2008 after earlier declines. A decrease 11. in 2009 was followed by a return to 2008 levels and in 2010 imports stood at 193 thousand tonnes. Imports should be viewed in the context of overall supply - imports only account for approximately 1 per cent of UK supply of liquid drinking milk. Exports rose sharply in the middle of the decade and even though they have droppedsince2006whentheyreached620thousandtonnes,the2010figureof560tonnesoutweighsimports by over three to one. In 2010, 75 per cent of milk and cream exports went to the Irish Republic with a further 18 per cent exported to Belgium, Luxembourg and France.

Cha
pter
8 -
Ove
rsea
s Tr
ade
77
Trade with key trading partners (charts 8.12 to 8.25)
This section describes the volume of trade in several key commodities between the United Kingdom and all 12. countries, both inside and outside the EU.
Lamb and mutton
The ban on exports during the outbreak of foot and mouth disease explains the dip in exports in 2001, 13. followed by a recovery to 87.1 thousand tonnes in 2006. In 2007 exports were lower at 68.8 thousand tonnes but in 2010 reached 89 thousand tonnes. The majority, 65 per cent, of all lamb and mutton exported in 2010 went to France, with a further 21 per cent going to Belgium, Luxembourg, Germany and Italy. Imports decreased to 101 thousand tonnes in 2010, the lowest level since 2002.
50
100
150Th tonnes Total imports from all countries
Total exports to all countries
0
50
100
150
2001 2002 2003 2004 2005 2006 2007 2008 2009 2010
Th tonnes Total imports from all countries
Total exports to all countries
Chart 8.12 World trade; lamb and mutton
France65%
Belgium-Luxembourg
8.6%
Germany6%
Italy6%
Others14%
France65%
Belgium-Luxembourg
8.6%
Germany6%
Italy6%
Others14%
Chart 8.13 Trade all countries; exports of lamb and mutton 2010
Beef and veal
Following the Government’s announcement of a link between BSE14. (a) andnewvariantCJD(b), exports of beef originating in the United Kingdom were banned between March 1996 and November 2005. The small amounts of exports seen here over that period are of beef and veal of non-UK origin which have been imported into the United Kingdom and then exported. Following the end of the ban, exports continue to show signs of recovery. Although the 2010 level of 110 thousand tonnes is a 32 per cent increase on 2009 it still stands a long way below the 1995 level of 274 thousand tonnes. Imports rose during the export ban and are currently still around twice the level of imports before the ban and were 238 thousand tonnes in 2010. The Irish Republic accounted for 71 per cent of the imports in 2010 with the Netherlands, Uruguay and Germany accounting for a further 13 per cent.
(a) Bovine Spongiform Encephalopathy(b)VarientCreutzfeld-Jacobdisease

AGRICULTURE IN THE UNITED KINGDOM 2011
78
350400450
Th tonnes Total imports from all countries
Total exports to all countries
350400450
Th tonnes Total imports from all countries
Total exports to all countries
250300350400450
Th tonnes Total imports from all countries
Total exports to all countries
150200250300350400450
Th tonnes Total imports from all countries
Total exports to all countries
50100150200250300350400450
Th tonnes Total imports from all countries
Total exports to all countries
050
100150200250300350400450
Th tonnes Total imports from all countries
Total exports to all countries
050
100150200250300350400450
2001 2002 2003 2004 2005 2006 2007 2008 2009 2010
Th tonnes Total imports from all countries
Total exports to all countries
Chart 8.16 World trade; poultrymeat
Netherlands38%Others
Netherlands38%Others
28%
Netherlands38%
Germany7%
Others28%
Netherlands38%
Irish RepublicPoland
10%
Germany7%
Others28%
Netherlands38%
Irish Republic17%
Poland10%
Germany7%
Others28%
Netherlands38%
Irish Republic17%
Poland10%
Germany7%
Others28%
Chart 8.17 Trade all countries; imports of poultrymeat 2010
Chart 8.14 World trade; beef and veal
Netherlands6%
Uruguay4%
Germany3%
Others16%
Irish Republic71%
Netherlands6%
Uruguay4%
Germany3%
Others16%
Chart 8.15 Trade all countries; imports of beef and veal 2010
250
300
Th tonnes Total imports from all countries
Total exports to all countries
250
300
Th tonnes Total imports from all countries
Total exports to all countries
200
250
300
Th tonnes Total imports from all countries
Total exports to all countries
150
200
250
300
Th tonnes Total imports from all countries
Total exports to all countries
50
100
150
200
250
300
Th tonnes Total imports from all countries
Total exports to all countries
0
50
100
150
200
250
300
Th tonnes Total imports from all countries
Total exports to all countries
0
50
100
150
200
250
300
2001 2002 2003 2004 2005 2006 2007 2008 2009 2010
Th tonnes Total imports from all countries
Total exports to all countries
Poultrymeat
TheUnitedKingdomhasrunalongtermtradedeficitinpoultrymeat.Importshaveincreasedsteadilyfrom15. 1993 reaching a peak in 2005 of 406 thousand tonnes. In 2010 imports increased by 12 per cent on 2009 and stood at 381 thousand tonnes. The Netherlands accounted for 38 per cent of imports in 2010 with the Irish Republic, Poland and Germany accounting for a further 34 per cent.

Cha
pter
8 -
Ove
rsea
s Tr
ade
79
Poultrymeat Products
Poultrymeat products include prepared, preserved, salted or cooked poultrymeat. At 255 thousand 16. tonnes,importsofpoultrymeatproductswerearound7timesthelevelofexportsin2010.Thisreflectsanincreasingyearonyeartradedeficit.Thailandaccountedfor53percentofimportswiththeIrishRepublic,Brazil and the Netherlands accounting for a further 25 per cent in similar proportions.
150
200
250
300
Th tonnes Total imports from all countries
Total exports to all countries
0
50
100
150
200
250
300
2001 2002 2003 2004 2005 2006 2007 2008 2009 2010
Th tonnes Total imports from all countries
Total exports to all countries
Chart 8.18 World trade; poultrymeat products
Netherlands8%
Others22%
Thailand53%
Irish Republic9%
Brazil8%
Netherlands8%
Others22%
Chart 8.19 Trade all countries; imports of poultrymeat products 2010
Unmilled wheat
Exports of unmilled wheat have comfortably exceeded imports every year from 1993 apart from 2001 and 17. 2002. In these two years exports fell to almost the same level as imports due to a poor 2001 harvest, causedbyseverefloodinginthepreviouswinter.In2010exportsstoodat3.3milliontonnes,a32percentincrease on 2009, as a result of higher production and availability. Of this 35 per cent went to Spain and a further 33 per cent went to the Netherlands, Portugal and the Irish Republic.
Chart 8.20 World Trade; unmilled wheat
3 000
3 500
4 000Th tonnes Total imports from all countries
Total exports to all countries
3 000
3 500
4 000Th tonnes Total imports from all countries
Total exports to all countries
2 000
2 500
3 000
3 500
4 000Th tonnes Total imports from all countries
Total exports to all countries
1 500
2 000
2 500
3 000
3 500
4 000Th tonnes Total imports from all countries
Total exports to all countries
500
1 000
1 500
2 000
2 500
3 000
3 500
4 000Th tonnes Total imports from all countries
Total exports to all countries
0
500
1 000
1 500
2 000
2 500
3 000
3 500
4 000Th tonnes Total imports from all countries
Total exports to all countries
0
500
1 000
1 500
2 000
2 500
3 000
3 500
4 000
2001 2002 2003 2004 2005 2006 2007 2008 2009 2010
Th tonnes Total imports from all countries
Total exports to all countries
Spain35%
Others32% Spain
35%
Others32% Spain
35%
Netherlands18%Portugal
9%
Irish Republic6%
Others32% Spain
35%
Netherlands18%Portugal
9%
Irish Republic6%
Others32% Spain
35%
Netherlands18%Portugal
9%
Irish Republic6%
Others32%
Chart 8.21 Trade all countries; exports of unmilled wheat 2010

1 500
2 000
2 500
3 000
3 500
Th tonnesTotal imports from all countries Total exports to all countries
0
500
1 000
1 500
2 000
2 500
3 000
3 500
2001 2002 2003 2004 2005 2006 2007 2008 2009 2010
Th tonnesTotal imports from all countries Total exports to all countries
Chart 8.24 World trade; fresh fruit
Spain13%
Spain13%
Spain13%
Costa Rica11%
Others35%
Spain13%
Costa Rica11%
South Africa10%
Colombia
Others35%
Spain13%
Costa Rica11%
South Africa10%
Colombia7%
Netherlands6%Brazil
Chile
Others35%
Spain13%
Costa Rica11%
South Africa10%
Colombia7%
Netherlands6%
France6%
Dominican Rep.5%
Brazil4%
Chile3%
Others35%
Spain13%
Costa Rica11%
South Africa10%
Colombia7%
Netherlands6%
France6%
Dominican Rep.5%
Brazil4%
Chile3%
Others35%
Chart 8.25 Trade all countries; imports of fresh fruit 2010
80
Fresh vegetables
TheUnitedKingdomrunsalargeandsteadilyincreasingtradedeficitinfreshvegetables.Importshave18. risen virtually every year up to 2008 but have been lower than the 2008 high in the last two years and were at 1.9 million tonnes in 2010, almost double the 1994 total. Exports stood at 95 thousand tonnes in 2010, an increase on 2009 levels but still well below the peak seen in 2002 of 113 thousand tonnes. In 2010, 37 per cent of all fresh vegetables imports came from Spain and 32 per cent from the Netherlands with France having the next largest share at 5 per cent.
2 000
2 500Th tonnes Total imports from all countries
Total exports to all countries
2 000
2 500Th tonnes Total imports from all countries
Total exports to all countries
1 500
2 000
2 500Th tonnes Total imports from all countries
Total exports to all countries
1 000
1 500
2 000
2 500Th tonnes Total imports from all countries
Total exports to all countries
500
1 000
1 500
2 000
2 500Th tonnes Total imports from all countries
Total exports to all countries
0
500
1 000
1 500
2 000
2 500Th tonnes Total imports from all countries
Total exports to all countries
0
500
1 000
1 500
2 000
2 500
2001 2002 2003 2004 2005 2006 2007 2008 2009 2010
Th tonnes Total imports from all countries
Total exports to all countries
Chart 8.22 World trade; fresh vegetables
Spain
Others20%
Spain37%
Irish Republic3%
Others20%
Spain37%
France
Poland3%
Irish Republic3%
Others20%
Spain37%
N th l d
France5%
Poland3%
Irish Republic3%
Others20%
Spain37%
Netherlands32%
France5%
Poland3%
Irish Republic3%
Others20%
Spain37%
Netherlands32%
France5%
Poland3%
Irish Republic3%
Others20%
Chart 8.23 Trade all countries; imports of fresh vegetables 2010
Fresh fruit
Imports of fresh fruit have historically been far in excess of exports and stood at 3.2 billion tonnes in 2010. 19. Exports have seen higher levels in recent years but still represent just 4 per cent of imports. Spain was the largest single source of imports with 13 per cent in 2010. The top three sources of imports (Spain, Costa Rica and South Africa) provided a total 35 per cent of imports, which demonstrates the diversity of supply of fresh fruit.

Cha
pter
9 -
Acc
ount
s
Chapter9 Accounts
81
1.
Summary
In 2011:
Total Income from Farming is estimated to have risen by 31 per cent at current prices to £5,693 million ●compared to 2010, the best performance for the agricultural industry since the mid-1990s.
Gross output at basic prices is estimated to be £23,652 million while the value of intermediate consumption ●is estimated at £14,806 million.
Gross value added at basic prices is estimated to be £8,845 million, the highest value at current prices ●since 1996.
Introduction
This chapter shows a sequence of inter-related accounts for agriculture including current accounts, 1. accumulation accounts and balance sheets. These accounts conform to internationally agreed accounting principlesrequiredbyboththeUnitedKingdom’sNationalAccountsandbyEurostat,thestatisticalofficeofthe European Union.
The production and income account provides details of the industry’s outputs, inputs and generation of 2. income; the balance sheets show the total assets and liabilities for agriculture at the end of each calendar year, together with their net worth; and the accumulation accounts analyse the various components of change in the assets and liabilities of agriculture and record changes in net worth. The net worth shown in the balance sheets incorporates changes due to all of the accumulation accounts.
Production and income account at current prices (table 9.1)
The production and income account produces a key measure of the performance of the agricultural 3. industry, Total Income from Farming. This is income generated by production within the agriculture industry, includingsubsidies,andrepresentsbusinessprofitsandremunerationforworkdonebyownersandotherunpaid workers.
Total Income from Farming is sensitive to small percentage changes in the values of outputs and inputs. 4. Thissensitivity,theprovisionalnatureofthefiguresforthelatestyear,andrevisionsmadetopreviouslypublishedfiguresforearlieryearsasmethodologyordatasourcesimprove,allneedtobeborneinmindwhenusingthefigures.
In 2011, Total Income from Farming is estimated to have risen by 31 per cent in current prices to £5,693 5. million compared to 2010.
The value of gross output at basic prices rose by £3,069 million (15 per cent) in 2011 to £23,652 million. 6. The value of total crop output rose by £1,541 million (21 per cent) to £8,955 million, largely due to increases in the value of output of wheat, barley and oilseed rape, and the value of total livestock output rose by £1,355 million (12 per cent) to £12,573 million, due mainly to increases in the value of output for cattle and sheep produced for meat, and milk.

AGRICULTURE IN THE UNITED KINGDOM 2011
82
The value of output of wheat increased by £593 million (37 per cent) to £2,202 million and the value of 7. output of barley increased by £323 million (60 per cent) to £860 million owing to higher quality crops, increaseddemandandsignificantlyhigherpricescomparedto2010.Thevalueofoilseedraperoseby£437 million (65 per cent) to £1,111 million owing to an increase in the area planted, high yields and strong prices. The values of output of wheat and barley have doubled since 2006, while the value of oilseed rape has increased by 250 per cent from £310 million to £1,111 million in the same period.
The value of output of cattle produced for meat rose by £432 million (20 per cent) to £2,585 million owing to 8. increased production and strong prices due to high demand, especially for manufacturing beef. The value of output of sheep rose by £170 million (17 per cent) to £1,148 million owing to increased production and record prices due to tight supplies in the United Kingdom and globally. The value of milk production rose by £413 million (12 per cent) to £3,742 million owing to an increase in production helped by favourable weather conditions and higher milk prices paid to farmers. The value of output of livestock has risen by 60 per cent since 2006, while the value of milk output has risen by 50 per cent.
The value of intermediate consumption, the goods and services consumed or used as inputs in the 9. productive process, is provisionally estimated to have increased by £1,321 million (10 per cent) to £14,806 million. The value of all inputs consumed is expected to have increased, particularly those for animal feed, energy and fertilisers.
Thevalueofconsumptionofanimalfeedroseby£468million(12percent)to£4,428millionreflecting10. increases in prices for cereals and oilseed rape in particular, although there is a lag between price increases in the raw ingredients and compound feed. The value for energy, principally motor and machinery fuels, is provisionally estimated to have increased by £177 million (15 per cent) to £1,378 million and the value of fertilisers consumed is provisionally estimated to have increased by £280 million (21 per cent)to£1,621million,reflectinghigherpricesforthesecommodities.Thecostofanimalfeed,energyandfertilisershaveincreasedsignificantlyinrecentyears.Thevalueoffertiliserconsumedhasdoubledsince2006 while animal feed increased by 72 per cent and energy by 66 per cent in the same period.
The increase in the value of output more than offset the increase in the value of intermediate consumption 11. leading to an increase in Gross Value Added at basic prices of £1,748 million (25 per cent) to £8,845 million.
Thevalueofothercosts,principallyconsumptionoffixedcapitalandcompensationofemployees,less12. receipts, i.e. other subsidies on production, that contribute to Total Income from Farming rose by £396 million(14percent)to£3,152million.Thevalueofconsumptionoffixedcapital,whichisfixedcapital,such as equipment, buildings and the breeding herd used up in the process of generating new output, is estimated to have increased by £295 million (8.9 per cent) to £3,593 million and of compensation of employees, which is total remuneration in cash or in kind payable to employees in return for work done, is estimated to have increased by £83 million (3.8 per cent) to £2,292 million. The value of other subsidies on production, which are payments received as a consequence of engaging in agricultural production but which are not linked to production, principally the Single Payment Scheme and agri-environment schemes, was unchanged at £3,411 million.

Cha
pter
9 -
Acc
ount
s
83
Definitionoftermsusedintables9.1and9.2The following list is provided to aid the used with the terms used in tables 9.1 and 9.2Terms Table 9.1
reference number
Definition
Agricultural industry All activities taking place within businesses that carry out any agricultural activities. These businesses include all farms and specialist agricultural contractors.
Capital formation in livestock
8 Production of animals that will be used as the means of production, e.g. breeding animals.
Other agricultural activities 10 Agriculturalactivitiesthatdonotresultinsalesoffinalproduct,e.g.quota leasing, contract work.
Inseparable non-agricultural activities
11 Non-agricultural activities which are included within the business level accounts and are inseparable, e.g. some cases of bed and breakfast and recreation facilities.
Output at market prices 12 Output excluding subsidies. The output of the agricultural industry includes some non-agricultural activities and transactions within the industry.
Basic prices Market price plus directly paid subsidies that are linked to productionofspecificproduct.
Subsidies (less taxes) on product
13 Subsidies and taxes linked to the production of an agricultural product. All subsidies are recorded on an ‘as due’ basis.
FISIM 23 Financial Intermediation Services Indirectly Measured (FISIM) isanestimateofthevalueofservicesprovidedbyfinancialintermediaries, such as banks, for which no explicit charges are made, and which are paid for as part of the margin between rate applied to savers and borrowers.
Intermediate consumption 25 Consumption of goods and services, e.g. feed, seeds, fertiliser, pesticides.
Gross value added 26 Gross output less intermediate consumption.Consumptionoffixedcapital
28 The reduction in value (at current prices) of capital assets used in the production process, e.g. buildings, plant, machinery, vehicles and livestock.
Net value added 30 Grossvalueaddedatbasicpriceslessconsumptionoffixedcapital.Other subsidies on production
32 Subsidiesandtaxesnotlinkedtoproductionofaspecificproduct,e.g. Single Payment Scheme, agri-environment payments, animal disease compensation.
Net value added at factor cost
33 Net value added at basic prices plus other subsidies (less taxes) on production.
Compensation of employees
34 The full costs of employees to the business including national insurance contributions.
Total Income from Farming 37 Income to those with an entrepreneurial interest in the agricultural industry, e.g. farmers, partners, spouses and most other family workers.

AGRICULTURE IN THE UNITED KINGDOM 2011
84
continued
Table 9.1 Production and income account at current prices; United KingdomEnquiries: Nick Olney on +44 (0)1904 455355 email: [email protected]
£ million Calendar years
2007 2008 2009 2010 2011
(provisional)
Output at market prices (a)
1 Output of cereals 1 939 3 202 2 348 2 211 3 160
wheat 1 315 2 278 1 562 1 609 2 202
rye 2 2 2 2 3
barley 555 831 710 537 860
oats and summer cereal mixtures 65 90 72 62 94
other cereals 1 1 2 2 2
2 Output of industrial crops 819 1 177 1 106 1 321 1 858
oil seeds 476 641 493 697 1 138
oilseed rape 472 631 476 674 1 111
other oil seeds 4 10 17 23 27
sugar beet 162 208 246 197 251
other industrial crops 181 328 367 427 468
fibreplants - 1 - 1 1
hops 4 4 4 4 4
other industrial crops (b) 176 323 363 422 463
3 Output of forage plants 238 292 317 330 277
4 Output of vegetables and horticultural products 1 833 1 925 1 962 2 257 2 268
fresh vegetables 1 065 1 105 1 083 1 260 1 217
plantsandflowers 768 819 879 997 1 051
5 Output of potatoes (including seeds) 708 794 681 638 700
6 Output of fruit 467 546 584 604 632
7 Output of other crop products including seeds 43 45 58 52 60
Total crop output (sum 1 to 7) 6 047 7 981 7 056 7 414 8 955
8 Output of livestock 5 232 6 579 7 148 7 242 8 185
primarily for meat 4 432 5 504 5 846 6 108 6 905
cattle 1 623 2 071 2 131 2 154 2 585
pigs 736 865 968 978 1 069
sheep 641 798 967 979 1 148
poultry 1 249 1 579 1 590 1 799 1 895
other animals 183 190 189 198 208
grossfixedcapitalformation 799 1 076 1 302 1 134 1 280
cattle 493 782 871 649 698
pigs 5 6 8 8 8
sheep 153 125 238 296 369
poultry 149 162 185 181 204
9 Output of livestock products 3 286 4 019 3 711 3 977 4 388
milk 2 823 3 447 3 123 3 329 3 742
eggs 410 520 531 561 559
raw wool 12 10 14 37 39
other animal products 41 41 43 49 48
Total livestock output (8 + 9) 8 518 10 598 10 859 11 219 12 573

Cha
pter
9 -
Acc
ount
s
85
continued
2007 2008 2009 2010 2011
(provisional)
10 Other agricultural activities 680 792 869 930 1 043
agricultural services 680 792 869 930 1 043
leasing out quota - - - - -
11 Inseparable non-agricultural activities 763 814 913 994 1 056
12 Output (at market prices) (sum 1 to 11) 16 007 20 185 19 697 20 557 23 627
of which: -
transactions within the agricultural industry -
feed wheat 90 169 122 19 73
feed barley 178 222 191 207 279
feed oats 19 23 20 18 37
fodder maize 146 153 179 197 164
seed potatoes 14 14 16 16 18
straw 137 267 302 354 372
contract work 680 792 869 930 1 043
leasing of quota - - - - -
total capital formation in livestock 799 1 076 1 302 1 134 1 280
13 Total subsidies (less taxes) on product (c) 59 55 34 26 25
14 Gross output at basic prices (12 + 13) 16 067 20 240 19 731 20 582 23 652
Intermediate consumption
15 Seeds 614 705 690 636 705
16 Energy 897 1 166 1 095 1 201 1 378
electricity and fuels for heating 274 341 342 357 373
motor and machinery fuels 623 826 754 844 1 004
17 Fertilisers 813 1 478 1 229 1 341 1 621
18 Plant protection products 571 690 715 761 772
19 Veterinary expenses 302 338 360 401 414
20 Animal feed (d) 3 013 3 947 3 659 3 960 4 428
compounds 1 702 2 186 2 088 2 248 2 610
straights 877 1 193 1 060 1 271 1 266
feed produced and used on farm or purchased from other farms 434 568 512 441 553
21 Total maintenance (e) 1 085 1 218 1 282 1 341 1 402
materials 695 745 798 826 862
buildings 389 473 484 515 540
22 Agricultural services 680 792 869 930 1 043
23 FISM 113 141 119 130 133
24 Other goods and services (e)(f) 2 380 2 583 2 665 2 783 2 910
25 Total intermediate consumption (sum 15 to 24) 10 468 13 058 12 685 13 485 14 806
26 Gross value added at market prices (12 - 25) 5 539 7 127 7 012 7 072 8 821
27 Gross value added at basic prices (14 - 25) 5 598 7 182 7 046 7 098 8 845
28 Total consumption of Fixed Capital 2 717 3 069 3 274 3 298 3 593
equipment 1 213 1 268 1 391 1 450 1 525
buildings (e)(g) 696 709 709 704 727
livestock 809 1 091 1 173 1 145 1 341
cattle 503 743 731 679 793
pigs 6 7 8 8 8
sheep 157 188 269 291 344
poultry 142 153 164 167 196
Table 9.1 continued

AGRICULTURE IN THE UNITED KINGDOM 2011
86
2007 2008 2009 2010 2011
29 Net value added at market prices (26 - 28) 2 822 4 059 3 739 3 774 5 228
30 Net value added at basic prices (27 - 28) 2 881 4 113 3 773 3 799 5 252
31 Other taxes on production - 101 - 103 - 106 - 115 - 119
32 Other subsidies on production (c) 2 954 3 231 3 588 3 411 3 411
33 Net value added at factor cost (30 + 31 + 32) 5 734 7 241 7 254 7 096 8 544
34 Compensation of employees (h) 2 005 2 068 2 165 2 208 2 292
35 Rent 305 350 366 366 373
rent paid (i) 402 445 456 467 477
rent received (j) - 97 - 95 - 89 - 102 - 104
36 Interest (k) 471 365 169 180 185
37 Total Income from Farming (33 - 34 - 35 - 36) 2 953 4 458 4 554 4 342 5 693
(a) Output is net of VAT collected on the sale of non-edible products. Figures for output at market prices exclude subsidies on products.
(b) Includes straw and minor crops.
(c) “Subsidies (less taxes) on product”: payments linked to the production of agricultural products. “Other subsidies on production”: payments not linked to productionfromwhichagriculturalproducerscanbenefitasaconsequenceofengaginginagriculturalactivitiese.g.SinglePaymentScheme,agri-environmentschemes.
(d) For years prior to 1992 the split between compounds and straights was derived from the split present in later years.
(e)Landlords'expensesareincludedwithintotalmaintenance,othergoodsandservicesandtotalconsumptionoffixedcapitalofbuildings.
(f) Includes livestock and crop costs, water costs, insurance premiums, bank charges, professional fees, rates, and other farming costs.
(g)Amoreempiricallybasedmethodologyforcalculatinglandlords'consumptionoffixedcapitalwasintroducedin2000.Thenewserieshasbeenlinkedwiththeold one using a smoothing procedure for the transition year of 1996.
(h) Excludes the value of work done by farm labour on own account capital formation in buildings and works.
(i)Rentpaidonalltenantedland(including'conacre'landinNorthernIreland)lesslandlords'expenses,landlords'consumptionoffixedcapitalandthebenefitvalue of dwellings on that land.
(j) Rent received by farming landowners from renting of land to other farmers less landlords' expenses. This series starts in 1996 following a revision to the methodology of calculating net rent.
(k) Interest charges on loans for current farming purposes and buildings and works less interest on money held on short term deposit.
Table 9.1 continued

Cha
pter
9 -
Acc
ount
s
87
continued
Table 9.2 Changes in outputs and inputs; United KingdomEnquiries: Nick Olney on +44 (0)1904 455355 email: [email protected]
£ million
Current price value Changes %
2010 2011 value volume price
Output at market prices (a)
1 Output of cereals 2 211 3 160 43 2 40
wheat 1 609 2 202 37 1 36
rye 2 3 47 - 47
barley 537 860 60 8 49
oats and summer cereal mixtures 62 94 52 - 11 70
other cereals 2 2 - 13 - 2 - 12
2 Output of industrial crops 1 321 1 858 41 17 20
oil seeds 697 1 138 63 23 33
oilseed rape 674 1 111 65 24 33
other oil seeds 23 27 19 - 1 21
sugar beet 197 251 28 30 - 2
other industrial crops 427 468 10 - 9
fibreplants 1 1 108 99 4
hops 4 4 - - -
other industrial crops (b) 422 463 10 - 9
3 Output of forage plants 330 277 - 16 - 19 4
4 Output of vegetables and horticultural products 2 257 2 268 - - 1 2
fresh vegetables 1 260 1 217 - 3 - 2 - 1
plantsandflowers 997 1 051 5 - 6
5 Output of potatoes (including seeds) 638 700 10 4 6
6 Output of fruit 604 632 5 - 1 5
7 Output of other crop products including seeds 52 60 14 1 13
Total crop output (sum 1 to 7) 7 414 8 955 21 3 17
8 Output of livestock 7 242 8 185 13 4 9
primarily for meat 6 108 6 905 13 3 10
cattle 2 154 2 585 20 3 16
pigs 978 1 069 9 7 2
sheep 979 1 148 17 6 11
poultry 1 799 1 895 5 - 1 7
other animals 198 208 5 - 5
grossfixedcapitalformation 1 134 1 280 13 7 5
cattle 649 698 8 8 -
pigs 8 8 - 4 9 - 11
sheep 296 369 25 8 16
poultry 181 204 13 4 8
9 Output of livestock products 3 977 4 388 10 1 9
milk 3 329 3 742 12 2 11
eggs 561 559 - - -
raw wool 37 39 3 3 -
other animal products 49 48 - 3 - 1 - 2
Total livestock output (8 + 9) 11 219 12 573 12 3 9
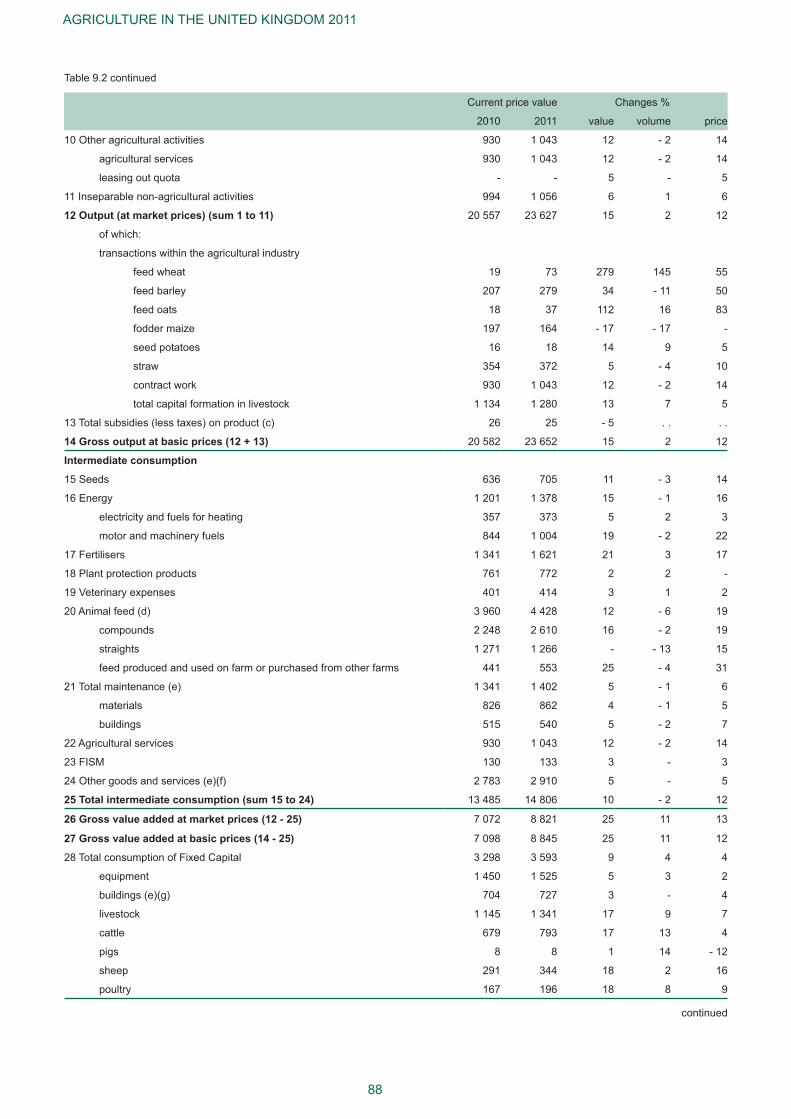
AGRICULTURE IN THE UNITED KINGDOM 2011
88
continued
Current price value Changes %
2010 2011 value volume price
10 Other agricultural activities 930 1 043 12 - 2 14
agricultural services 930 1 043 12 - 2 14
leasing out quota - - 5 - 5
11 Inseparable non-agricultural activities 994 1 056 6 1 6
12 Output (at market prices) (sum 1 to 11) 20 557 23 627 15 2 12
of which:
transactions within the agricultural industry
feed wheat 19 73 279 145 55
feed barley 207 279 34 - 11 50
feed oats 18 37 112 16 83
fodder maize 197 164 - 17 - 17 -
seed potatoes 16 18 14 9 5
straw 354 372 5 - 4 10
contract work 930 1 043 12 - 2 14
total capital formation in livestock 1 134 1 280 13 7 5
13 Total subsidies (less taxes) on product (c) 26 25 - 5 . . . .
14 Gross output at basic prices (12 + 13) 20 582 23 652 15 2 12
Intermediate consumption
15 Seeds 636 705 11 - 3 14
16 Energy 1 201 1 378 15 - 1 16
electricity and fuels for heating 357 373 5 2 3
motor and machinery fuels 844 1 004 19 - 2 22
17 Fertilisers 1 341 1 621 21 3 17
18 Plant protection products 761 772 2 2 -
19 Veterinary expenses 401 414 3 1 2
20 Animal feed (d) 3 960 4 428 12 - 6 19
compounds 2 248 2 610 16 - 2 19
straights 1 271 1 266 - - 13 15
feed produced and used on farm or purchased from other farms 441 553 25 - 4 31
21 Total maintenance (e) 1 341 1 402 5 - 1 6
materials 826 862 4 - 1 5
buildings 515 540 5 - 2 7
22 Agricultural services 930 1 043 12 - 2 14
23 FISM 130 133 3 - 3
24 Other goods and services (e)(f) 2 783 2 910 5 - 5
25 Total intermediate consumption (sum 15 to 24) 13 485 14 806 10 - 2 12
26 Gross value added at market prices (12 - 25) 7 072 8 821 25 11 13
27 Gross value added at basic prices (14 - 25) 7 098 8 845 25 11 12
28 Total consumption of Fixed Capital 3 298 3 593 9 4 4
equipment 1 450 1 525 5 3 2
buildings (e)(g) 704 727 3 - 4
livestock 1 145 1 341 17 9 7
cattle 679 793 17 13 4
pigs 8 8 1 14 - 12
sheep 291 344 18 2 16
poultry 167 196 18 8 9
Table 9.2 continued

Cha
pter
9 -
Acc
ount
s
89
Current price value Changes %
2010 2011 value volume price
29 Net value added at market prices (26 - 28) 3 774 5 228 39 16 19
30 Net value added at basic prices (27 - 28) 3 799 5 252 38 16 19
31 Other taxes on production - 115 - 119 4 . . . .
32 Other subsidies on production (c) 3 411 3 411 - . . . .
33 Net value added at factor cost (30 + 31 + 32) 7 096 8 544 20 . . . .
34 Compensation of employees (h) 2 208 2 292 4 . . . .
35 Rent 366 373 2 . . . .
rent paid (i) 467 477 2 . . . .
rent received (j) - 102 - 104 2 . . . .
36 Interest (k) 180 185 3 . . . .
37 Total Income from Farming (33 - 34 - 35 - 36) 4 342 5 693 31 . . . .
(a) Output is net of VAT collected on the sale of non-edible products. Figures for output at market prices exclude subsidies on products.
(b) Includes straw and minor crops.
(c) “Subsidies (less taxes) on product”: payments linked to the production of agricultural products. “Other subsidies on production”: payments not linked to productionfromwhichagriculturalproducerscanbenefitasaconsequenceofengaginginagriculturalactivitiese.g.SinglePaymentScheme,agri-environmentschemes.
(d) For years prior to 1992 the split between compounds and straights was derived from the split present in later years.
(e)Landlords'expensesareincludedwithintotalmaintenance,othergoodsandservicesandtotalconsumptionoffixedcapitalofbuildings.
(f) Includes livestock and crop costs, water costs, insurance premiums, bank charges, professional fees, rates, and other farming costs.
(g)Amoreempiricallybasedmethodologyforcalculatinglandlords'consumptionoffixedcapitalwasintroducedin2000.Thenewserieshasbeenlinkedwiththeold one using a smoothing procedure for the transition year of 1996.
(h) Excludes the value of work done by farm labour on own account capital formation in buildings and works.
(i)Rentpaidonalltenantedland(including'conacre'landinNorthernIreland)lesslandlords'expenses,landlords'consumptionoffixedcapitalandthebenefitvalue of dwellings on that land.
(j) Rent received by farming landowners from renting of land to other farmers less landlords' expenses. This series starts in 1996 following a revision to the methodology of calculating net rent.
(k) Interest charges on loans for current farming purposes and buildings and works less interest on money held on short term deposit.
Table 9.2 continued

AGRICULTURE IN THE UNITED KINGDOM 2011
90
Balance sheets (table 9.3)
The aggregate balance sheet for agriculture values the total assets and liabilities for agriculture at the end 13. of each calendar year and estimates the total net worth of the industry. Net worth was estimated to be £198 billion in 2009.
Table 9.3 Aggregate balance sheets for agriculture; United KingdomEnquiries: Nick Olney on +44 (0)1904 455355 email: [email protected]
£ million As at December each year
2006 2007 2008 2009 2010
(provisional)
At current prices
Assets
Fixed: (a)
Land and buildings 131 869 150 892 187 394 176 379 . .
Plant, machinery and vehicles 7 356 7 494 7 981 8 608 9 449
Breeding livestock 4 183 5 726 6 651 9 121 7 756
Totalfixed 143 407 164 113 202 026 194 109 . .
Current:
Trading livestock 5 029 5 291 3 032 3 064 2 860
Crops and stores 2 243 2 865 3 222 2 971 3 486
Debtors, cash deposits 800 766 876 956 1 219
Total current 8 072 8 921 7 130 6 990 7 565
Total assets 151 479 173 034 209 156 201 099 . .
Liabilities
Long and medium-term:
AMC and SASC (b) 1 482 948 1 069 1 213 1 469
Building societies and institutions 83 85 128 172 190
Bank loans 431 473 587 666 865
Family loans 91 88 80 80 114
Other 92 29 7 4 4
Total long and medium-term 2 180 1 623 1 871 2 136 2 641
Short-term:
Leasing 93 112 111 89 80
Hire purchase 122 135 161 168 217
Trade credit 255 257 297 308 387
Bank overdrafts 554 489 490 532 575
Other 16 22 22 18 22
Total short-term 1 040 1 015 1 082 1 115 1 282
Total liabilities 3 219 2 639 2 953 3 250 3 923
Net worth 148 260 170 395 206 203 197 849 . .
In real terms (as deflated by the retail price index):
Indices 2005 = 100
Total assets 104 115 137 129 . .
Total liabilities 93 73 81 87 101
Net worth 105 116 139 130 . .
(a) The valuations of land, buildings and breeding livestock are at average market prices; those of plant, machinery and vehicles are at replacement cost, net of consumptionoffixedcapital.
(b) Values of land and buildings are not directly comparable with data prior to 1993.
(c) Agricultural Mortgage Corporation (AMC) and Scottish Agricultural Securities Corporation (SASC).

Cha
pter
9 -
Acc
ount
s
91
Accumulation accounts (table 9.4)
The accumulation accounts analyse the various components of change in the assets and liabilities of 14. agriculture. The capital account shows estimates of changes in the value of assets held by the agricultural sectorintheUnitedKingdomandincludesgrossfixedcapitalformation,consumptionoffixedassetsandchanges in inventories. Capital formation and capital consumption in livestock measure the value of output due to the production and depreciation of breeding animals, mainly dairy cows, beef cows, ewes, sows and egglayingpoultry.Consumptionoffixedcapitalinlivestock,whichisapproximatedbyassumingthatalldepreciation takes place at the time animals leave the breeding herds. Changes in inventories contribute to income.
Table 9.4 Accumulation accounts; United KingdomEnquiries: Nick Olney on +44 (0)1904 455355 email: [email protected]
£ million Calendar years
2007 2008 2009 2010 2011
(provisional)
Capital account
Gross fixed capital formation 2 825 3 417 3 745 3 334 3 497
Acquisitions less disposals of non-livestock assets: 2 025 2 341 2 443 2 200 2 218
buildings and works 745 881 983 836 821
plant and machinery 1 245 1 422 1 425 1 333 1 364
vehicles 35 38 35 31 33
Capital formation in livestock (a): 799 1 076 1 302 1 134 1 280
cattle 493 782 871 649 698
sheep 153 125 238 296 369
pigs 5 6 8 8 8
poultry 149 162 185 181 204
Consumption of fixed capital 2 717 3 069 3 274 3 298 3 593
Non-livestock assets: 1 909 1 977 2 100 2 154 2 252
buildings and works 696 709 709 704 727
plant and machinery 999 1 047 1 150 1 201 1 274
vehicles 213 221 241 249 251
Livestock (b): 809 1 091 1 173 1 145 1 341
cattle 503 743 731 679 793
sheep 157 188 269 291 344
pigs 6 7 8 8 8
poultry 142 153 164 167 196
Changes in inventories - 279 405 83 - 389 - 243
stocks of crops - 153 515 19 - 297 - 2
work-in-progress livestock - 126 - 110 64 - 92 - 241
Total Income from Farming 2 953 4 458 4 554 4 342 5 693
Other capital grants and payments not included in the production and income account 74 158 57 43 . .
(a) Capital formation in livestock is estimated by valuing the number of entries to the breeding herds at the entry price less the disposal price.
(b)Consumptionoffixedcapitalinlivestockisestimatedbyvaluingthedisposalsfromthebreedingherdsattheentrypricelessthedisposalprice.

AGRICULTURE IN THE UNITED KINGDOM 2011
92
Revaluation accounts (table 9.5)
Revaluation or holding gains measures the change in value between the time of production and the end of 15. the accounting period due to changes in price. It includes the value of work-in-progress for production of non-breeding livestock and for replacement animals, and the value of work-in-progress of crop production. Revaluation is not included in the production and income account and therefore does not contribute to income. The value of total holding gains was estimated at £1,070 million in 2011.
Table 9.5 Revaluation account; United KingdomEnquiries: Nick Olney on +44 (0)1904 455355 email: [email protected]
£ million Calendar years
2007 2008 2009 2010 2011
(provisional)
Livestock production work-in-progress (non-breeders)
cattle - 34 427 220 - 52 483
sheep - 20 71 82 - 1 73
pigs - 90 11 29 - 50 69
poultry (a) 23 24 9 12 37
Total - 121 533 340 - 91 662
Replacement animals for breeding herds
cattle 1 315 263 - 333 331
sheep - 9 31 35 - 1 32
pigs - 2 - - - 1 1
Total - 9 346 299 - 335 364
Crop production work-in-progress
wheat 428 - 149 - 162 318 149
barley 93 - 29 - 101 107 60
potatoes 51 - 98 - 33 145 - 127
other crops (b) 84 - 25 - 15 139 - 38
Total 656 - 301 - 312 709 44
Total holding gains 526 579 327 283 1 070
(a) Broilers, ducks, geese and turkeys.
(b) Oats, oilseeds, apples and pears.

Cha
pter
9 -
Acc
ount
s
93
Interest (table 9.6)
Table 9.6 presents estimates of interest charges payable on farmers’ borrowings for agricultural purposes 16. including land purchases, less interest received on short-term deposits. Total interest changes are estimated at £185 million in 2011 after adjustment for Financial Services Indirectly Measured (FISIM), an estimateofthevalueoftheservicesprovidedbyfinancialintermediaries,suchasbanks,forwhichnoexplicit charges are made and which are paid for as part of the margin between rates applied to savers and borrowers. FISIM is included in the intermediate consumption section of the production and income account and is estimated at £133 million.
Table 9.6 Interest; United KingdomEnquiries: Nick Olney on +44 (0)1904 455355 email: [email protected]
£million(unlessotherwisespecified) Calendar years
2007 2008 2009 2010 2011
(provisional)
Interest rates
average bank base lending rate in the UK 5.5% 4.6% 0.6% 0.5% 0.5%
average rate of interest on bank advances 7.1% 6.7% 3.2% 3.0% 3.2%
Unadjusted interest charges (all lending to the farm business) on:
bank advances 434 434 233 236 241
AMC and SASC loans (a) 65 20 22 27 27
instalment credit 75 78 42 42 43
leased assets 9 9 3 3 3
other credit (b) 65 39 22 23 25
less interest earned on money held on short-term deposit 64 73 34 21 21
Total 584 506 288 310 319
Interest charges (all lending to the farm business) after adjustment for FISIM
Interest paid 548 454 211 208 213
less interest received 77 89 42 28 28
Total interest 471 365 169 180 185
Financial intermediation services indirectly measured (FISIM) (c) 113 141 119 130 133
(a) Agricultural Mortgage Company (AMC) and Scottish Agricultural Securities Corporation (SASC).
(b) Interest paid on other institutional credit and that from private sources.
(c)FISIMisanestimateofthevalueoftheservicesprovidedbyfinancialintermediaries,suchasbanks,forwhichnoexplicitchargesaremade,andwhicharepaid for as part of the margin between rates applied to savers and borrowers.

AGRICULTURE IN THE UNITED KINGDOM 2011
94
Changes in volume of capital assets (table 9.7)
Table 9.7 presents medium-term trends in the volume of capital assets expressed as indices, including 17. grossfixedcapitalformationandcapitalconsumption.
Table 9.7 Changes in volume of capital assets; United KingdomEnquiries: Nick Olney on +44 (0)1904 455355 email: [email protected]
Indices 2005 = 100 Calendar years
2007 2008 2009 2010 2011
(provisional)
Total volume of gross fixed capital formation
Grossfixedcapitalformation: 103.5 119.4 132.5 113.1 103.0
non livestock: 133.4 148.6 139.3 125.6 125.4
buildings and works 93.0 100.0 86.7 75.5 78.7
plant and machinery 108.9 116.5 109.8 105.8 113.4
vehicles 103.6 123.0 105.0 96.6 104.0
livestock 131.7 92.6 115.4 120.2 129.7
Total volume of capital consumption
Consumptionoffixedcapital 104.5 105.1 104.6 104.1 103.6
non livestock: 97.4 99.5 102.3 103.0 106.6
buildings and works 99.4 101.1 103.1 103.7 104.5
plant and machinery 87.8 95.1 80.0 82.4 89.9
vehicles 81.4 90.9 69.9 74.9 84.4
livestock 98.7 102.7 97.0 88.4 89.9

Cha
pter
10
- Pro
duct
ivity
Chapter10 Productivity
95
Chart 10.1 Agricultural productivity; United Kingdom
100
120
140
160
1986 = 100
Final output at market prices
All inputs
Total factor productivity
60
80
100
120
140
160
1986 1991 1996 2001 2006 2011
1986 = 100
Final output at market prices
All inputs
Total factor productivity
1.
Summary
Over the longer term:
Since 1986, total factor productivity for the agricultural industry has grown by 26 per cent, however the long ●term upward trend can be seen to have levelled off from around 2005.
The volume of final output at market prices has increased by 1.8 per cent since 1986 while the volume of all ●inputs has fallen by 19 per cent.
In 2011, compared to 2010:
The volume of final output at market prices rose by 2.7 per cent. ●
The volume of all inputs including entrepreneurial labour fell by 0.7 per cent and as a result, total factor ●productivity rose by 3.4 per cent.
The total labour force expressed in annual work units (or full-time person equivalent) rose by 0.5 per ● cent.
Labour productivity as measured by net value added at market prices per annual work unit rose by 15 ● per cent.
Total factor productivity
A key measure of agriculture’s economic 1. performance and a key component of its competitiveness is its productivity, that is, how efficiently the agricultural industry uses the resources that are available to turn inputs into outputs. It is a key measure of the economic sustainability of United Kingdom farming and food, an important driver of farm incomes and an essential foundation for the environmental and social contributions which farming and food make.
Measuring productivity is not straightforward 2. and comparisons need to be interpreted carefully because of both practical problems in obtaining robust data and because productivity performance is often shaped by factors outside farmers’ control, such as climate or disease outbreaks.

AGRICULTURE IN THE UNITED KINGDOM 2011
96
The headline measure, total factor productivity, shows the volume of output leaving the industry per unit of 3. all inputs including fixed capital and labour. It encompasses all businesses engaged in farming activities, including specialist contractors. Labour productivity measures the volume of net value added per unit of all labour (paid and entrepreneurial) and is a key component of total factor productivity.
Table 10.1 Productivity; United KingdomEnquiries: Nick Olney on +44 (0)1904 455355 or Keith Seabridge at [email protected]
2007 2008 2009 2010 2011
(provisional)
Volume indices 2005 = 100
Final output at market prices (gross output less transactions within the industry) 96 101 98 100 103
All inputs (including fixed capital, paid and entrepreneurial labour) 99 99 99 101 101
Total factor productivity (a) 97 101 99 99 102
Labour productivity (net value added at market prices per AWU of all labour) (b) 90 107 98 94 109
Labour volumes (c); annual work unit (thousand)
Entrepreneurial labour 191 187 184 183 184
Paid labour 100 101 100 99 100
Total labour force 290 287 284 283 284
(a) Final output per unit of all inputs (including fixed capital and labour).
(b) An annual work unit (AWU) represents the equivalent of an average full-time person engaged in agriculture.
(c) Volume of paid labour relating to agricultural work only and excluding time spent on the construction of farm buildings.

Cha
pter
10
- Pro
duct
ivity
97
continued
Table 10.2 Output and input volume indices; United KingdomEnquiries: Nick Olney on +44 (0)1904 455355 or Keith Seabridge at [email protected]
Indices 2005 = 100 Calendar years
2007 2008 2009 2010 2011
(provisional)
Outputs at market prices
1 Output of cereals 91 117 104 97 99
wheat 88 117 95 95 96
rye 100 100 100 116 116
barley 93 113 126 98 105
oats and summer cereal mixtures 134 148 140 126 113
other cereals 85 98 154 127 125
2 Output of industrial crops 85 98 100 101 118
oil seeds 107 106 104 122 150
oilseed rape 111 110 106 124 153
other oil seeds 22 33 61 80 80
sugar beet 78 88 97 75 98
other industrial crops 61 101 103 99 99
fibre plants 51 77 21 60 119
hops 83 83 83 83 83
others (a) 61 102 104 99 99
3 Output of forage plants 90 101 115 108 87
4 Output of vegetables and horticultural products 93 95 94 97 95
fresh vegetables 94 96 101 103 101
plants and flowers 93 95 85 89 89
5 Output of potatoes (including seeds) 92 99 100 84 87
6 Output of fruit 119 123 130 130 129
7 Output of other crop products including seeds 82 85 90 83 84
Total crop output 93 106 102 99 102
8 Output of livestock 99 100 96 99 102
primarily for meat 98 97 94 98 101
cattle 98 96 94 98 102
pigs 105 104 100 105 112
sheep 99 97 94 87 92
poultry 92 94 92 100 99
other animals 100 100 100 100 100
gross fixed capital formation 109 117 110 106 113
cattle 104 123 105 97 104
pigs 111 125 111 123 134
sheep 132 93 115 120 130
poultry 106 108 123 128 133
9 Output of livestock products 96 95 94 98 99
milk 97 95 94 96 98
eggs 94 100 101 114 113
raw wool 83 80 74 74 76
other animal products 79 65 69 74 73
Total livestock output 98 98 96 98 101
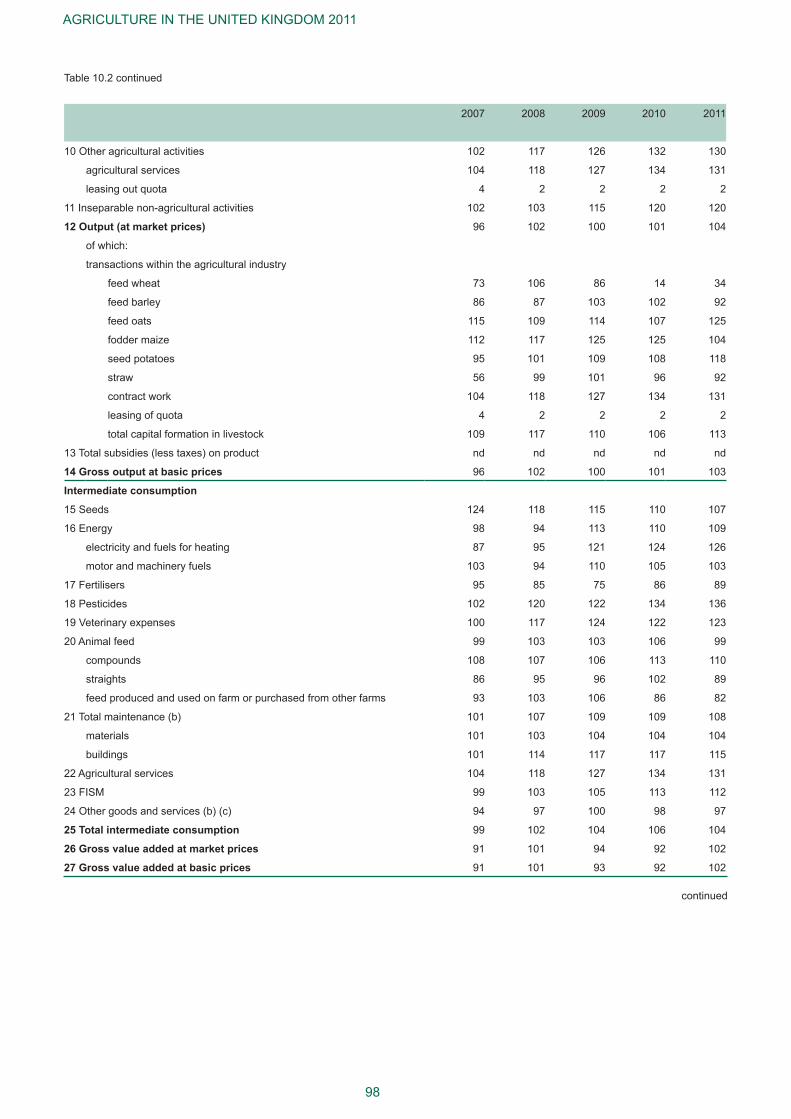
AGRICULTURE IN THE UNITED KINGDOM 2011
98
2007 2008 2009 2010 2011
10 Other agricultural activities 102 117 126 132 130
agricultural services 104 118 127 134 131
leasing out quota 4 2 2 2 2
11 Inseparable non-agricultural activities 102 103 115 120 120
12 Output (at market prices) 96 102 100 101 104
of which:
transactions within the agricultural industry
feed wheat 73 106 86 14 34
feed barley 86 87 103 102 92
feed oats 115 109 114 107 125
fodder maize 112 117 125 125 104
seed potatoes 95 101 109 108 118
straw 56 99 101 96 92
contract work 104 118 127 134 131
leasing of quota 4 2 2 2 2
total capital formation in livestock 109 117 110 106 113
13 Total subsidies (less taxes) on product nd nd nd nd nd
14 Gross output at basic prices 96 102 100 101 103
Intermediate consumption
15 Seeds 124 118 115 110 107
16 Energy 98 94 113 110 109
electricity and fuels for heating 87 95 121 124 126
motor and machinery fuels 103 94 110 105 103
17 Fertilisers 95 85 75 86 89
18 Pesticides 102 120 122 134 136
19 Veterinary expenses 100 117 124 122 123
20 Animal feed 99 103 103 106 99
compounds 108 107 106 113 110
straights 86 95 96 102 89
feed produced and used on farm or purchased from other farms 93 103 106 86 82
21 Total maintenance (b) 101 107 109 109 108
materials 101 103 104 104 104
buildings 101 114 117 117 115
22 Agricultural services 104 118 127 134 131
23 FISM 99 103 105 113 112
24 Other goods and services (b) (c) 94 97 100 98 97
25 Total intermediate consumption 99 102 104 106 104
26 Gross value added at market prices 91 101 94 92 102
27 Gross value added at basic prices 91 101 93 92 102
Table 10.2 continued
continued

Cha
pter
10
- Pro
duct
ivity
99
2007 2008 2009 2010 2011
28 Total consumption of Fixed Capital 96 100 95 96 100
equipment 98 100 102 103 106
buildings (b) 105 105 105 104 104
livestock 88 95 80 82 90
cattle 81 91 70 75 84
pigs 102 110 96 103 117
sheep 99 103 97 88 90
poultry 100 101 109 116 126
29 Net value added at market prices 86 101 91 88 102
30 Net value added at basic prices 86 101 91 88 102
(a) Includes straw and minor crops.
(b) Landlords' expenses are included within total maintenance, other goods and services and total consumption of fixed capital of buildings.
(c) Includes livestock and crop costs, water costs, insurance premiums, bank charges, professional fees, rates, and other farming costs.
Table 10.2 continued

AGRICULTURE IN THE UNITED KINGDOM 2011
100

Cha
pter
11
- Pub
lic P
aym
ents
Chapter11 Public Payments
101
1.
Summary
In 2011:
Direct payments made to farmers totalled £3.44 billion similar to 2010. ●
Payments not linked to production, including the Single Payment Scheme, were £3.11 billion. ●
Payments linked to production came to £25 million. ●
Payments under the agri-environment schemes were £500 million. ●
Payments under the Less Favoured Areas Scheme totalled £120 million. ●
2000
3000
£ million Payments not linked to production
Payments and levies linked to production
0
1000
2000
3000
1992 1993 1994 1995 1996 1997 1998 1999 2000 2001 2002 2003 2004 2005 2006 2007 2008 2009 2010 2011
£ million Payments not linked to production
Payments and levies linked to production
Chart 11.1 Direct payments made to farmers; United Kingdom

AGRICULTURE IN THE UNITED KINGDOM 2011
102
Table 11.1 Direct payments to farmers and levies recorded in the production and income account; United KingdomShows payments after deduction for modulation where appropriate.
Enquiries: Nick Olney on +44 (0)1904 455355 email: [email protected]
£ million Calendar years
2007 2008 2009 2010 2011
(provisional)
Coupled payments and levies (linked to production)
Crop subsidies
Arable area payments . . . . . . . . . .
Other crop subsidies (a) 13 8 14 7 5
Livestock subsidies
Beef special premium . . . . . . . . . .
Suckler cow premium . . . . . . . . . .
Slaughter premium . . . . . . . . . .
Over Thirty Month Scheme/Older Cattle Disposal Scheme 28 29 . . . . . .
Beef national envelope . . . . . . . . . .
Scottish beef calf scheme 19 18 20 19 19
Sheep annual premium . . . . . . . . . .
Sheep national envelope . . . . . . . . . .
Other livestock subsidies . . . . . . . . . .
Dairy subsidies (b) . . . . . . . . . .
less Levies:
Milk superlevy . . . . . . . . . .
Other levies (f) . . . . . . . . . .
Total coupled payments less levies 59 55 34 26 25
Decoupled and other payments (not linked to production)
Single Payment Scheme 2 311 2 580 2 948 2 743 2 767
Agri-environment schemes 460 486 471 476 500
Less Favoured Areas support schemes (c) 130 134 136 138 120
Animal disease compensation (d) 21 26 21 19 23
Extensificationschemes . . . . . . . . . .
Rural World Premium . . . . . . . . . .
Arable area payments setaside . . . . . . . . . .
Other (e) 31 - - 30 -
Total decoupled and other payments (f) 2 952 3 226 3 576 3 405 3 410
Total direct payments less levies 3 012 3 281 3 610 3 431 3 435
Capital transfers and other payments not included in the production and income account 74 158 57 43 8
(a)CAPhopsandherbageseedssupport;hempandflaxaid;proteincroppremium;areaaidfornuts;energycropsaid.
(b) Dairy premium and additional dairy premium.
(c) Tir Mynydd in Wales, Less Favoured Area Compensatory Allowance Scheme in Northern Ireland, Less Favoured Areas Support Scheme in Scotland and Hill Farm Allowance in England.
(d) Compensation paid for livestock compulsorily slaughtered under disease control measures. Compensation paid for work-in-progress livestock are recorded as income compensation paid for capital livestock are recorded as capital transfers.
(e) Northern Ireland Weather Aid 2007; 2010: Scotland - Severe Weather Grant Scheme: £3 million; 2010 - EU Dairy Fund £26.5 million.
(f)figuresfor2007to2010includedatathatwerenotavailablewhentheAccounts(chapter9)wereproduced.
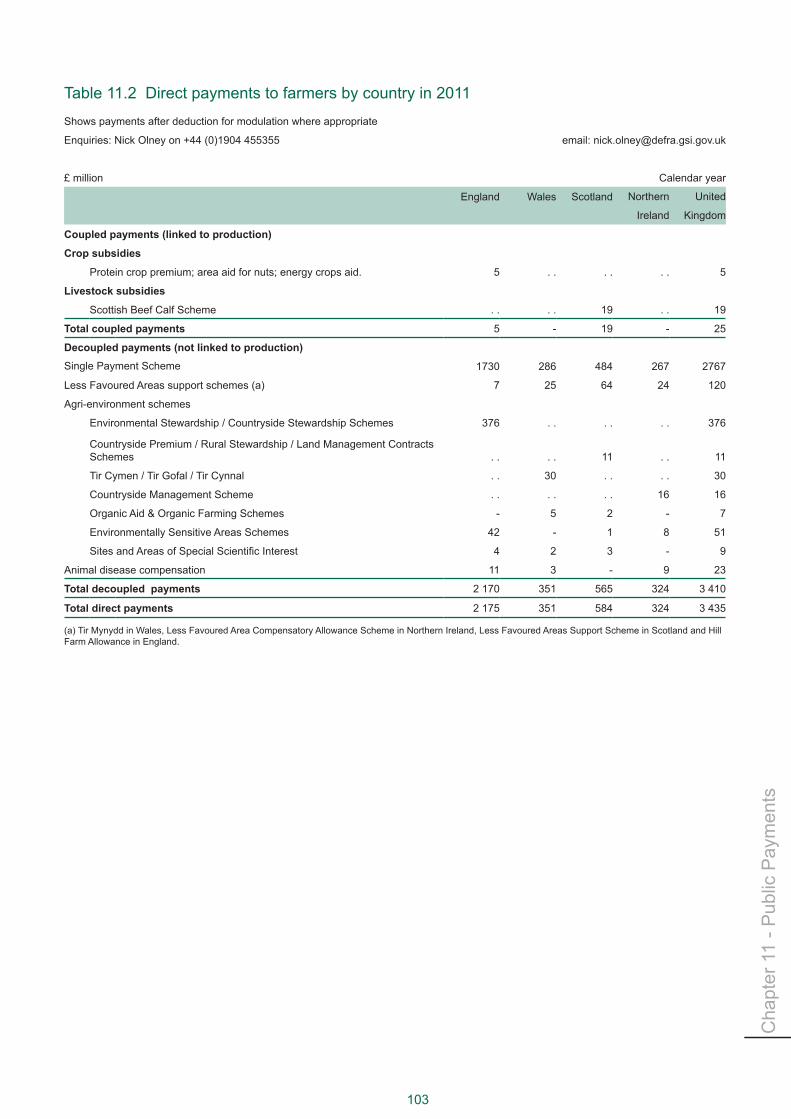
Cha
pter
11
- Pub
lic P
aym
ents
103
Table 11.2 Direct payments to farmers by country in 2011
Shows payments after deduction for modulation where appropriate
Enquiries: Nick Olney on +44 (0)1904 455355 email: [email protected]
£ million Calendar year
England Wales Scotland Northern United
Ireland Kingdom
Coupled payments (linked to production)
Crop subsidies
Protein crop premium; area aid for nuts; energy crops aid. 5 . . . . . . 5
Livestock subsidies
Scottish Beef Calf Scheme . . . . 19 . . 19
Total coupled payments 5 - 19 - 25
Decoupled payments (not linked to production)Single Payment Scheme 1730 286 484 267 2767
Less Favoured Areas support schemes (a) 7 25 64 24 120
Agri-environment schemes
Environmental Stewardship / Countryside Stewardship Schemes 376 . . . . . . 376
Countryside Premium / Rural Stewardship / Land Management Contracts Schemes . . . . 11 . . 11
Tir Cymen / Tir Gofal / Tir Cynnal . . 30 . . . . 30
Countryside Management Scheme . . . . . . 16 16
Organic Aid & Organic Farming Schemes - 5 2 - 7
Environmentally Sensitive Areas Schemes 42 - 1 8 51
SitesandAreasofSpecialScientificInterest 4 2 3 - 9
Animal disease compensation 11 3 - 9 23
Total decoupled payments 2 170 351 565 324 3 410
Total direct payments 2 175 351 584 324 3 435
(a) Tir Mynydd in Wales, Less Favoured Area Compensatory Allowance Scheme in Northern Ireland, Less Favoured Areas Support Scheme in Scotland and Hill Farm Allowance in England.

AGRICULTURE IN THE UNITED KINGDOM 2011
104
Direct payments made through key measures of the Rural Development Programmes (table 11.3)
There are four rural development programmes in the United Kingdom, covering England, Wales, Scotland 1. and Northern Ireland.
Table 11.3 shows details of payments made through two key measures of these programmes; Less 2. Favoured Areas and Agri-Environment, adopted by each of the countries of the United Kingdom.
Further information on the rural development programmes may be found at:3.
http://www.defra.gov.uk/rural/rdpe/ http://www.scotland.gov.uk/Topics/farmingrural/SRDP http://wales.gov.uk/topics/environmentcountryside/farmingandcountryside/ruraldevelopment/?lang=en http://www.dardni.gov.uk/index/rural-development/nirdp2007-2013.htm
Table 11.3 Direct payments made through key measures of the Rural Development ProgrammesEnquiries: Nick Olney on +44 (0)1904 455355 email: [email protected]
£ Million Calendar years
2007 2008 2009 2010 2011
Less Favoured Areas and Areas with Environmental Restrictions measure
England: Hill Farm Allowance / Uplands Transitional Payment (a) 25.9 23.8 24.0 24.3 7.3
Wales: Tir Mynydd 23.7 29.7 25.2 25.0 25.0
Scotland: Less Favoured Areas Support Scheme 59.2 58.9 64.0 63.7 63.7
Northern Ireland: Less Favoured Areas Compensatory Allowance 21.0 22.0 22.5 24.9 24.4
Agri-Environment and Animal Welfare measure
England: Organic Farming Scheme 2.3 0.5 - - -
Countryside Stewardship Scheme 94.2 84.9 82.8 70.6 59.4
Environmentally Sensitive Areas Scheme 56.4 53.3 41.7 47.6 41.6
Environmental Stewardship Scheme 170.3 222.0 226.6 266.2 317.0
Wales: Organic Farming Scheme 2.5 6.0 4.2 7.2 4.9
Tir Gofal 25.2 22.0 30.7 26.3 23.0
Environmentally Sensitive Areas Scheme 3.7 1.9 2.2 0.9 0.2
Tir Cynnal 5.7 6.3 8.6 7.2 7.1
Scotland: Organic Aid Scheme 5.1 4.7 2.6 1.8 1.8
Rural Stewardship Scheme 24.9 17.3 13.0 4.9 4.9
Environmentally Sensitive Areas Scheme 5.1 3.6 2.7 1.4 1.4
Land Management Contract Scheme 19.8 20.0 18.5 5.4 5.4
Northern Ireland: Organic Farming Scheme 0.6 0.3 0.1 - -
Countryside Management Scheme 16.9 18.5 16.2 18.3 16.0
New Environmentally Sensitive Areas Scheme (b) 7.4 7.7 6.5 7.6 8.0
(a) Hill Farm Allowance payments replaced by Uplands Transitional Payments in 2011(b) The Environmentally Sensitive Areas Scheme (ESA) in Northern Ireland ended in 2002 when it was replaced by the New Environmentally Sensitive Areas Scheme (NESA); existing agreements under the ESA Scheme continue to be honoured.
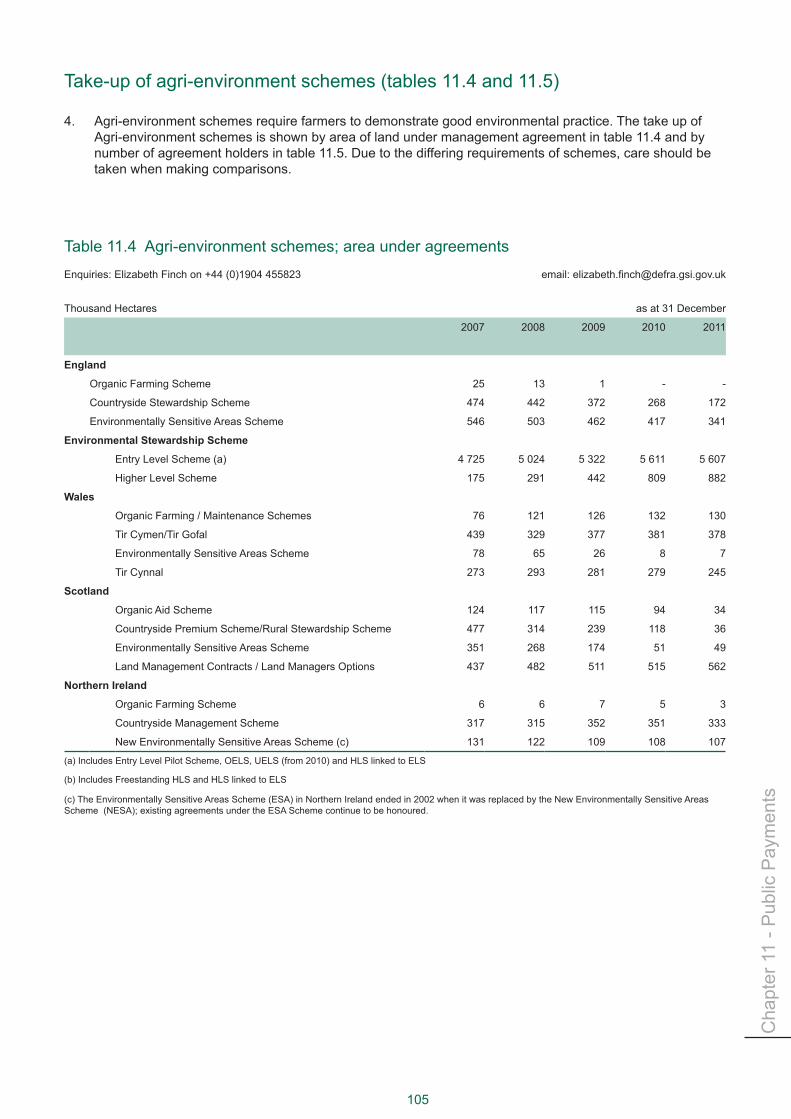
Cha
pter
11
- Pub
lic P
aym
ents
105
Take-up of agri-environment schemes (tables 11.4 and 11.5)
Agri-environment schemes require farmers to demonstrate good environmental practice. The take up of 4. Agri-environment schemes is shown by area of land under management agreement in table 11.4 and by number of agreement holders in table 11.5. Due to the differing requirements of schemes, care should be taken when making comparisons.
Table 11.4 Agri-environment schemes; area under agreementsEnquiries: Elizabeth Finch on +44 (0)1904 455823 email:[email protected]
Thousand Hectares as at 31 December
2007 2008 2009 2010 2011
England
Organic Farming Scheme 25 13 1 - -
Countryside Stewardship Scheme 474 442 372 268 172
Environmentally Sensitive Areas Scheme 546 503 462 417 341
Environmental Stewardship Scheme
Entry Level Scheme (a) 4 725 5 024 5 322 5 611 5 607
Higher Level Scheme 175 291 442 809 882
Wales
Organic Farming / Maintenance Schemes 76 121 126 132 130
Tir Cymen/Tir Gofal 439 329 377 381 378
Environmentally Sensitive Areas Scheme 78 65 26 8 7
Tir Cynnal 273 293 281 279 245
Scotland
Organic Aid Scheme 124 117 115 94 34
Countryside Premium Scheme/Rural Stewardship Scheme 477 314 239 118 36
Environmentally Sensitive Areas Scheme 351 268 174 51 49
Land Management Contracts / Land Managers Options 437 482 511 515 562
Northern Ireland
Organic Farming Scheme 6 6 7 5 3
Countryside Management Scheme 317 315 352 351 333
New Environmentally Sensitive Areas Scheme (c) 131 122 109 108 107
(a) Includes Entry Level Pilot Scheme, OELS, UELS (from 2010) and HLS linked to ELS
(b) Includes Freestanding HLS and HLS linked to ELS
(c) The Environmentally Sensitive Areas Scheme (ESA) in Northern Ireland ended in 2002 when it was replaced by the New Environmentally Sensitive Areas Scheme (NESA); existing agreements under the ESA Scheme continue to be honoured.
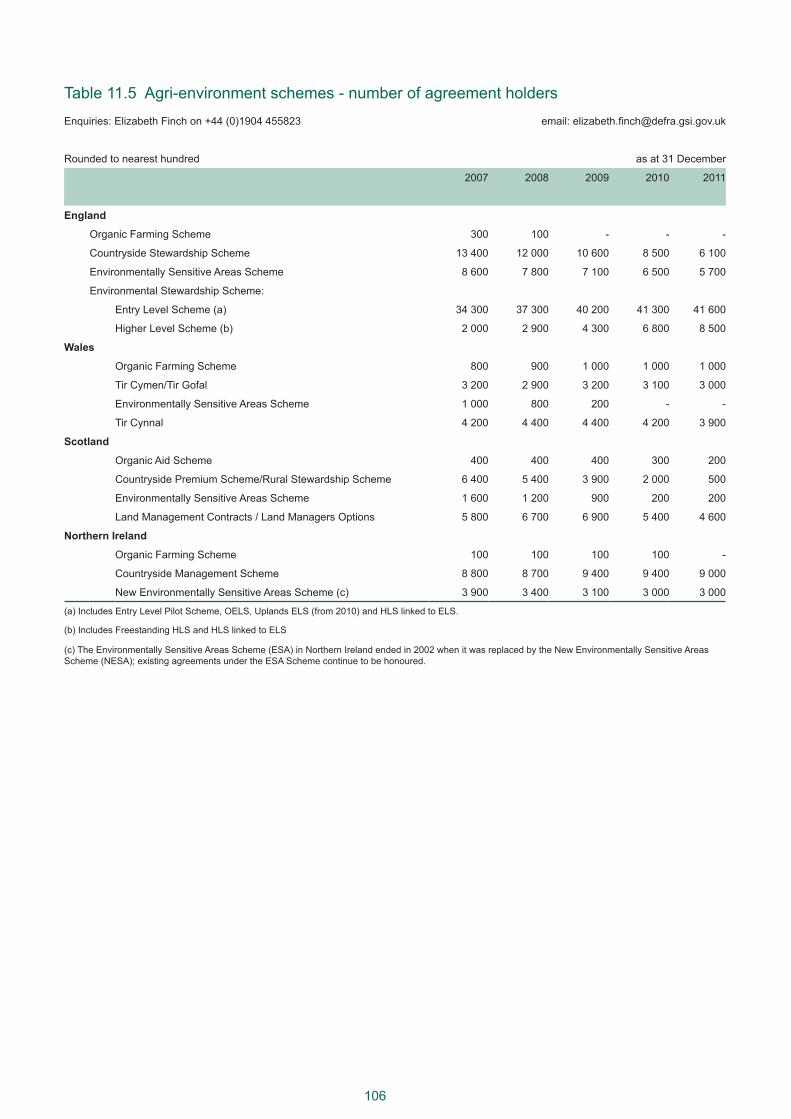
106
Table 11.5 Agri-environment schemes - number of agreement holdersEnquiries: Elizabeth Finch on +44 (0)1904 455823 email:[email protected]
Rounded to nearest hundred as at 31 December
2007 2008 2009 2010 2011
England
Organic Farming Scheme 300 100 - - -
Countryside Stewardship Scheme 13 400 12 000 10 600 8 500 6 100
Environmentally Sensitive Areas Scheme 8 600 7 800 7 100 6 500 5 700
Environmental Stewardship Scheme:
Entry Level Scheme (a) 34 300 37 300 40 200 41 300 41 600
Higher Level Scheme (b) 2 000 2 900 4 300 6 800 8 500
Wales
Organic Farming Scheme 800 900 1 000 1 000 1 000
Tir Cymen/Tir Gofal 3 200 2 900 3 200 3 100 3 000
Environmentally Sensitive Areas Scheme 1 000 800 200 - -
Tir Cynnal 4 200 4 400 4 400 4 200 3 900
Scotland
Organic Aid Scheme 400 400 400 300 200
Countryside Premium Scheme/Rural Stewardship Scheme 6 400 5 400 3 900 2 000 500
Environmentally Sensitive Areas Scheme 1 600 1 200 900 200 200
Land Management Contracts / Land Managers Options 5 800 6 700 6 900 5 400 4 600
Northern Ireland
Organic Farming Scheme 100 100 100 100 -
Countryside Management Scheme 8 800 8 700 9 400 9 400 9 000
New Environmentally Sensitive Areas Scheme (c) 3 900 3 400 3 100 3 000 3 000
(a) Includes Entry Level Pilot Scheme, OELS, Uplands ELS (from 2010) and HLS linked to ELS.
(b) Includes Freestanding HLS and HLS linked to ELS
(c) The Environmentally Sensitive Areas Scheme (ESA) in Northern Ireland ended in 2002 when it was replaced by the New Environmentally Sensitive Areas Scheme (NESA); existing agreements under the ESA Scheme continue to be honoured.

Cha
pter
12
- Org
anic
Far
min
g
Chapter12 Organic Farming
107
1.
SummaryIn 2010:
The total area of land that was organically managed (either fully organic or in-conversion) fell by 2.8 per ●cent, at a faster rate of decline than between 2008 and 2009.
Permanent and temporary pasture continues to make up the greatest percentage of organically managed ●land, covering 84 per cent of the total for the United Kingdom. Cereals cover the next greatest land area with 7.9 per cent of the total.
More than half (55 per cent) of all organically managed land in the United Kingdom was in England, ●covering 392 thousand hectares, compared to 51 per cent in 2009.
The total number of producers and / or processors in the United Kingdom fell to 7,287 in 2010 from 7,567 ●in 2009, with 70 per cent of producers and / or processors located in England. The fall in the number of organicproducersand/orprocessorsbetween2008and2010mayreflecttheongoingeconomicslow-down which has forced some consumers to switch away from organic produce to cheaper types of food.
The South West region of England still has the highest number of both crop and livestock producers in ●the United Kingdom with a 31 per cent share of both these types of producers.
Introduction
Organic farming is a method of farming 1. that requires farmers to operate to a system based on ecological principles and which imposes strict limitations on the inputs that can be used in order to minimise damage to the environment and wildlife. Emphasis is placed on natural methods of production and pest control.
Defra works with the various organic 2. certification bodies in the UnitedKingdom to collect and publish data on theorganicsector. Eachyear,certifierbodies visit their registered farms to carry out annual inspections. During these inspections, certifiers record thecrop areas and numbers of livestock present on the organic holding on that day. The data collected during these inspections is sent to Defra eachJanuary.Duetothenatureoftheinspections,thedataiscollectedatvaryingtimesthroughtheyear.Therefore,thedatapresentedinthischapterdonotgiveanexactsnapshotoforganicfarmingatanyspecifictime of year, so this should be considered when interpreting the results.
300
400
500
600
700
800Thousand Hectares
0
100
200
300
400
500
600
700
800
1994 1996 1998 2000 2002 2004 2006 2008 2010
Thousand Hectares
Chart 12.1 Organically managed land; United Kingdom

AGRICULTURE IN THE UNITED KINGDOM 2011
108
Table 12.1 Total United Kingdom organic land (in-conversion & fully organic)Enquiries: Organic Statistics Team on +44 (0)1904 455435 email: [email protected]
Thousand hectares
2006 2007 2008 2009 2010
Land, in-conversion
North East 6.9 4.8 9.8 6.5 4.0
North West 1.8 3.3 3.8 3.4 2.4
Yorkshire & Humberside 3.4 4.1 3.8 2.7 0.9
East Midlands 2.1 3.1 3.7 3.1 1.0
West Midlands 4.0 5.7 8.2 5.7 2.1
Eastern 3.6 5.3 4.8 4.1 1.4
South West 31.6 48.2 46.5 34.7 13.6
South East (inc. London) 13.2 14.6 10.4 7.3 4.3
England 66.5 89.0 91.1 67.6 29.8
Wales 15.4 30.9 49.5 36.8 4.0
Scotland 35.2 34.8 6.2 12.0 12.6
Northern Ireland 4.0 3.2 2.3 3.0 4.4
United Kingdom 121.1 157.9 149.1 119.4 50.8
Land, fully organic
North East 22.6 25.8 25.6 26.8 30.6
North West 19.4 20.4 21.2 19.8 20.0
Yorkshire & Humberside 9.0 9.6 10.9 11.9 13.8
East Midlands 12.5 13.2 12.2 14.4 16.3
West Midlands 26.3 28.2 29.7 32.0 35.4
Eastern 10.8 12.7 13.2 14.2 17.3
South West 93.4 106.3 123.9 140.4 174.6
South East (inc. London) 35.8 42.5 47.2 51.6 54.1
England 229.9 258.7 284.0 311.2 362.0
Wales 63.5 65.1 75.1 88.6 118.8
Scotland 200.1 193.1 225.1 209.3 176.3
Northern Ireland 5.1 7.3 10.1 10.3 10.4
United Kingdom 498.6 524.3 594.4 619.3 667.6
Total UK organic land (in-conversion & fully organic) 619.8 682.2 743.5 738.7 718.3
Source:OrganiccertifierbodiescollatedbyDefrastatistics
Since the 2008 edition of Agriculture in the United Kingdom which coincided with a review of published 3. organic data, there has been some adjustment to the way in which yearly data is labelled. As mentioned above,organicdataiscollectedthroughouttheyearandsuppliedtoDefrathefollowingJanuary.Theexisting method for labelling the yearly data meant that data collected throughout 2010 would be labelled January2011.Itwasthoughtthatthismethodwasslightlymisleadingasthiscouldimplythatthedataprovided represents the state of organic production at that given point in time. The revised method means thatdatacollectedduring2010andsuppliedattheendofJanuary2011willnowbelabelled2010.Allyearly data has been re-labelled accordingly.

Cha
pter
12
- Org
anic
Far
min
g
109
Table 12.2 Organic and in-conversion land use; United KingdomEnquiries: Organic Statistics Team on +44 (0)1904 455435 email: [email protected]
Thousand hectares
2006 2007 2008 2009 2010
Land, in-conversion
Cereals 11.9 13.2 9.9 6.5 2.2
Other crops 3.4 3.5 2.5 2.1 0.7
Fruit & nuts 0.2 0.4 0.4 0.3 0.2
Vegetables (including potatoes) 2.1 2.6 2.0 1.6 0.5
Herbs & ornamentals 0.1 0.1 0.6 0.8 1.0
Temporary pasture 22.9 34.2 31.0 19.6 7.3
Set aside 1.1 . . . . . . . .
Permanent pasture (a) 72.1 93.6 96.0 82.7 35.7
Woodland 4.2 5.6 2.7 2.6 1.9
Non cropping 2.3 3.3 1.9 1.1 0.7
Other 0.2 0.3 0.3 0.1 0.2
Unknown 0.8 1.1 1.7 2.0 0.5
Total 121.1 157.9 149.1 119.4 50.8
Land, fully organic
Cereals 35.5 38.4 47.3 53.4 54.7
Other crops 6.8 7.8 8.7 9.1 10.2
Fruit & nuts 1.6 1.6 1.5 1.9 2.0
Vegetables (including potatoes) 13.5 14.3 17.7 17.3 17.4
Herbs & ornamentals 0.6 0.5 4.9 4.9 5.2
Temporary pasture 79.8 90.9 98.8 106.6 117.5
Set aside 1.3 . . . . . . . .
Permanent pasture (a) 350.5 358.4 398.3 413.0 443.3
Woodland 4.0 5.9 3.2 4.6 6.2
Non cropping 4.0 4.7 4.4 5.7 5.5
Other 0.4 0.4 1.0 1.5 1.7
Unknown 0.6 1.4 8.6 1.1 3.9
Total 498.6 524.3 594.4 619.3 667.5
Source:OrganiccertifierbodiescollatedbyDefrastatistics
(a) Includes rough grazing.

AGRICULTURE IN THE UNITED KINGDOM 2011
110
Table 12.3 Organic producers and / or processors (a) - regional breakdownEnquiries: Organic Statistics Team on +44 (0)1904 455435 email: [email protected]
Number of businesses
2006 2007 2008 2009 2010
North East 161 173 179 167 160
North West 332 367 367 333 315
Yorkshire & Humberside 319 356 330 308 302
East Midlands 446 487 449 422 408
West Midlands 520 556 555 507 494
Eastern 556 574 551 529 515
South West 1732 1961 2002 1988 1953
South East (inc. London) 939 1042 1041 1024 984
England 5005 5516 5474 5278 5131
Wales 835 953 1230 1176 1166
Scotland 911 860 889 820 737
Northern Ireland 292 302 303 293 253
United Kingdom 7043 7631 7896 7567 7287
Source:OrganiccertifierbodiescollatedbyDefrastatistics
(a) Processers can include abattoirs, bakers, storers and wholesalers. The recorded location depends on the address registered with the CertifierBodiesandsolargerbusinessesmayberecordedattheirheadquarters.
Table 12.4 Numbers of crop / livestock organic producers and processors 2010 (a)Enquiries: Organic Statistics Team on +44 (0)1904 455435 email: [email protected]
Number of businesses
No. crop producers
No. crop producers
and processors
No. livestock producers
No. livestock producers
and processors
North East 117 3 87 2
North West 156 10 107 7
Yorkshire & Humberside 131 8 88 6
East Midlands 184 10 130 7
West Midlands 293 16 189 15
Eastern 199 17 71 12
South West 1415 74 879 62
South East (inc. London) 408 30 188 24
England 2903 168 1739 135
Wales 992 28 636 20
Scotland 488 9 311 7
Northern Ireland 187 1 174 1
United Kingdom 4570 206 2860 163
Source:OrganiccertifierbodiescollatedbyDefrastatistics
(a) Mixed organic holdings will be recorded under both the crop and livestock headings above so the above numbers cannot be added together to get total producers / processors by region as this will lead to double counting. For totals please see Table 12.3
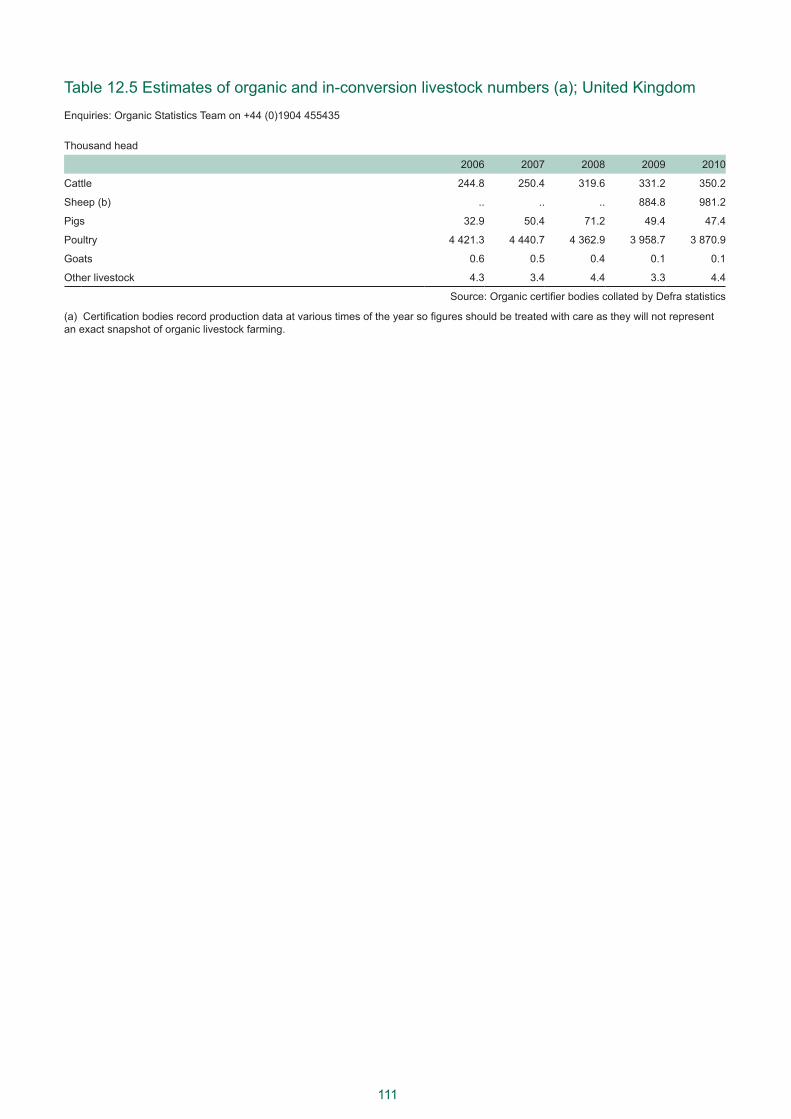
111
Table 12.5 Estimates of organic and in-conversion livestock numbers (a); United KingdomEnquiries: Organic Statistics Team on +44 (0)1904 455435
Thousand head
2006 2007 2008 2009 2010
Cattle 244.8 250.4 319.6 331.2 350.2
Sheep (b) .. .. .. 884.8 981.2
Pigs 32.9 50.4 71.2 49.4 47.4
Poultry 4 421.3 4 440.7 4 362.9 3 958.7 3 870.9
Goats 0.6 0.5 0.4 0.1 0.1
Other livestock 4.3 3.4 4.4 3.3 4.4
Source:OrganiccertifierbodiescollatedbyDefrastatistics
(a)Certificationbodiesrecordproductiondataatvarioustimesoftheyearsofiguresshouldbetreatedwithcareastheywillnotrepresentan exact snapshot of organic livestock farming.

AGRICULTURE IN THE UNITED KINGDOM 2011
112

Cha
pter
13
- Env
ironm
ent
Chapter13 Environment
113
1.
Summary
Occupying over 17 million hectares, agriculture accounts for more than 70 per cent of land use in the United ●Kingdom. The management of this land helps to shape the landscape and can have a profound impact on soils, water bodies, air and biodiversity.
The key drivers of change for environmental impacts in the last ten years have been declines in the number ●of livestock, in particular ruminants, and reductions in fertiliser applications particularly on grassland. These have led to reductions in methane emissions and the amounts of nitrogen and phosphorus released to the environment.
Between 1990 and 2011 nitrate fertiliser use in the United Kingdom decreased by 35 per cent. ●
Between 1990 and 2011 phosphate fertiliser use in the United Kingdom decreased by 54 per cent. ●
The nitrogen and phosphorus soil nutrient balances have fallen steadily since 1990, reducing the nutrient ●surpluses which could be lost to the environment.
Between 1990 and 2010 agricultural emissions of both nitrous oxide and methane decreased by 20 per ●cent. Between 2009 and 2010 nitrous oxide emissions from agriculture increased by 1.0 per cent and methane by 0.6 per cent.
Between 1990 and 2010 ammonia emissions from agriculture have fallen by 24 per cent. Between 2009 ●and 2010 ammonia emissions increased by 1.0 per cent.
In England, the weight of pesticides used on cereals decreased by 23 per cent between 2008 and 2010. ●
The index of farmland bird populations in the United Kingdom fell by 3.0 per cent between 2009 and ● 2010. The index is now at 50 per cent of its 1970 value.
Introduction (chart 13.1)
Chart 13.1 shows the relative contribution that agriculture makes to the United Kingdom economy, natural 1. resources and societal well-being. While agriculture makes a relatively small contribution to the economy (less than 1.0 per cent), it provides us with nearly three quarters of the food we eat and is the dominant form of land use. Along with other land management practices and activities, agriculture helps to shape the landscape and provide habitats for wildlife. These practices can have a profound impact on soils, water bodies, air and biodiversity in the natural environment.
This chapter brings together a wide range of data to provide an overall picture of agriculture’s environmental 2. impacts. The results are based on data collected from environmental monitoring, administrative systems and farm-based surveys.

AGRICULTURE IN THE UNITED KINGDOM 2011
114
Ammonia emissions
Phosphate in rivers (GB)
Nitrate in rivers (E&W)
Water abstraction (E&W)
Area of land
Indigenous food production (by value)
Employment
Gross value added
0% 25% 50% 75% 100%
Methane emissions
Nitrous oxide emissions
Ammonia emissions
Phosphate in rivers (GB)
Nitrate in rivers (E&W)
Water abstraction (E&W)
Area of land
Indigenous food production (by value)
Employment
Gross value added
Damages from agriculture
Benefits from agriculture
Other sectors, use or sources
Chart 13.1 UK agriculture’s contribution to the economy and the environment
Source: Defra
Land use (chart 13.2)
Agricultural land use (chart 13.2) has remained relatively stable since 1983 with the proportion of land used 3. for grassland (72 per cent) and crops (27 per cent) remaining fairly constant. The total area of uncropped land fell sharply in 2008, reflecting high cereal prices and the setting of a zero rate of set-aside, and has remained low due to good planting and market conditions.
Chart 13.2 Land use
4
6
8
10
12
14
million hectares
0
2
4
6
8
10
12
14
1983 1987 1991 1995 1999 2003 2007 2011
million hectares
grassland crops set aside & bare fallow uncropped land(a)
(a) Grassland includes temporary grassland, permanent grassland, sole right grazing land and common rough grazing areas.

Cha
pter
13
- Env
ironm
ent
115
Agri-Environment Schemes
Agri-Environment Schemes provide payments to farmers who adopt land management and farm practices 4. that are beneficial to the environment. The level of uptake of these schemes therefore gives an indication of the extent of environmentally sensitive farming. Details of the number of agreement holders in agri-environment schemes across the United Kingdom and the land areas that these schemes cover are given in Chapter 11.
Overall, the area of land in Agri-environment Schemes in England has increased from around 5,100 5. thousand hectares in 2006 to 6,200 thousand hectares in 2011. In Wales and Northern Ireland there have been slight declines over this period. In Scotland the land area in Agri-environment Schemes has declined from 1,557 thousand hectares to 681 thousand hectares due to legacy Agri-environment schemes being closed to new applications since 2006; land may now be entered into the competitive Rural Priorities Scheme and this currently covers 623 thousand hectares. Further information on the uptake of Agri-environment Schemes in England can be found at: http://www.defra.gov.uk/statistics/foodfarm/enviro/observatory/programme-indicators/
Fertiliser use (charts 13.3 and 13.4)
The key nutrients required for crop growth are nitrogen and phosphorus. The main sources are mineral 6. fertilisers and organic fertilisers, such as manures and slurries from livestock. While their use contributes to high crop yields, allowing greater levels of production to be achieved, a surplus of these nutrients in agricultural soils can pose an environmental risk. Losses of nutrients to the environment can impact on water quality (nitrate and phosphate levels on rivers), air quality (ammonia emissions) and climate change (nitrous oxide emissions)
Levels of fertiliser use in Scotland, Wales and Northern Ireland are generally low whilst they have been 7. considerably higher in England (charts 13.3. and 13.4). This is mainly due to the high levels of cropping in England which generally result in higher rates of fertiliser applications being required. Between 1990 and 2011 nitrogen fertiliser use has declined by 35 per cent and phosphate fertiliser use has declined by 54 per cent, mainly due to a reduction in application rates on grassland.
Yearly fluctuations in overall application rates are influenced by fertiliser prices, crop prices and crop 8. type. Between 2010 and 2011, the overall nitrogen application rate for mineral fertilisers in Great Britain fell by 1 kg per hectare to 101 kg/ha. The overall phosphate application rate was 19 kg per hectare, little changed from 2010. Further information concerning the British Survey of Fertiliser Practice 2011, including the report, can be found at: http://www.defra.gov.uk/statistics/foodfarm/enviro/fertiliserpractice/. Further information on fertiliser use in England and Wales can be found at: http://www.defra.gov.uk/statistics/foodfarm/enviro/observatory/programme-indicators/

AGRICULTURE IN THE UNITED KINGDOM 2011
116
Chart 13.3 Nitrogen (N) fertiliser use in the United Kingdom 1985 to 2011
800
1 000
1 200
1 400
thousand tonnes
800
1 000
1 200
1 400
thousand tonnes
800
1 000
1 200
1 400
thousand tonnes
400
600
800
1 000
1 200
1 400
thousand tonnes
0
200
400
600
800
1 000
1 200
1 400
thousand tonnes
0
200
400
600
800
1 000
1 200
1 400
1985 1987 1989 1991 1993 1995 1997 1999 2001 2003 2005 2007 2009 2011
thousand tonnes
England and Wales Scotland Northern Ireland
0
200
400
600
800
1 000
1 200
1 400
1985 1987 1989 1991 1993 1995 1997 1999 2001 2003 2005 2007 2009 2011
thousand tonnes
England and Wales Scotland Northern Ireland
200
300
400
thousand tonnes
200
300
400
thousand tonnes
200
300
400
thousand tonnes
100
200
300
400
thousand tonnes
0
100
200
300
400
thousand tonnes
0
100
200
300
400
1985 1987 1989 1991 1993 1995 1997 1999 2001 2003 2005 2007 2009 2011
thousand tonnes
England and Wales Scotland Northern Ireland
0
100
200
300
400
1985 1987 1989 1991 1993 1995 1997 1999 2001 2003 2005 2007 2009 2011
thousand tonnes
England and Wales Scotland Northern Ireland
Chart 13.4 Phosphate (P2O5) fertiliser use in the United Kingdom 1985 to 2011

Cha
pter
13
- Env
ironm
ent
117
Soil nutrient balances
Soil nutrient balances provide a method for estimating the nutrient loadings of nitrogen and phosphorus 9. to agricultural soils. The balances are calculated as the differences between nutrient inputs and nutrient removals by crop products and fodder. They determine whether there is a surplus or deficit of nutrients and the magnitude. When expressed as a loading of nitrogen or phosphorus per hectare of managed farmland, soil nutrient balances can be used as a high level indicator of environmental risks.
The nitrogen balance has fallen from a surplus of 111.1 kg N per hectare in 2000 to 93.4 kg N per hectare 10. in 2010. This represents a steady improvement but still indicates a risk of loss to the environment. The phosphorus balance has fallen from a surplus of 10 kg P per hectare to 6.3 kg P per hectare in 2010 and is at a level that better matches crop growth requirements. Further information, including graphical displays of the nutrient balances, can be found at: http://www.defra.gov.uk/statistics/files/defra-stats-foodfarm-environ-obs-research-soilnutrientbalance-statsnotice-uk-110728.pdf
Water quality
A high level of nitrogen and phosphorus in agricultural soils increases the risk of their transportation to river 11. water from soil erosion and leaching. Nitrogen and phosphorus in river water can cause environmental impacts such as eutrophication or acidification and a loss of biodiversity. For human health reasons, excessive levels of these nutrients must be removed from water bodies used for drinking water, incurring significant costs to water companies. It is estimated that agriculture accounts for around 61 per cent of the nitrates in river water in England and Wales1 and around 28 per cent of phosphates in river water in Great Britain2
To meet the requirements of the EU Water Framework Directive, the monitoring of river water quality in 12. the United Kingdom has changed. As a result, 2009 was the last year for which river water quality was based on the General Quality Assessment monitoring process. A new approach to monitoring has been introduced across the United Kingdom. Reporting options for the new monitoring approach are being considered and as a consequence no long term comparative data are available at this time. Further information can be found at: http://www.defra.gov.uk/statistics/files/exp-note-changes.pdf.
Water use
Water abstraction from surface waters and groundwater provide a source for irrigation, particularly in areas 13. of low rainfall and for certain crops, helping to achieve high yields and crop quality. Agricultural water use can have positive impacts, such as the recharge of aquifers, but also negative impacts in terms of soil erosion and flooding. Over-abstraction can also lead to damage of sensitive aquatic habitats. Agriculture accounts for around 1 per cent of the total water abstracted in England and Wales with the majority used in the South East and East of England where there are particular pressures for water resources.
Levels of water abstraction for agricultural use are highly variable from year to year being greatly influenced 14. by annual rainfall, particularly during the growing season. In 2010, the recorded agricultural abstraction rate in England of 353 Mega litres per day was 28 per cent higher than in 2009. Further information can be found at: http://www.defra.gov.uk/statistics/foodfarm/enviro/observatory/programme-indicators/
1 Hunt, D.T.E., et al, 2004, Updating an estimate of the sources of nitrogen to waters in England and Wales. Defra Project WT03016. 2 White, P.J. and Hammond, J. P., 2006, Updating the estimate of the sources of phosphorus in UK waters. Defra Project WT0701CSF.

AGRICULTURE IN THE UNITED KINGDOM 2011
118
Greenhouse gas emissions
Nitrous oxide is a potent greenhouse gas, emitted to the air as a result of nitrogen applications to 15. agricultural soils. Agricultural emissions represented 80 per cent of total United Kingdom nitrous oxide emissions in 2010.
Nitrous oxide emissions from agriculture have fallen by 20 per cent between 1990 and 2010 which is 16. consistent with trends in nitrogen fertiliser use over the same period. Further information can be found at: http://www.defra.gov.uk/statistics/foodfarm/enviro/observatory/programme-indicators/
Agriculture is the largest source of methane emissions in the United Kingdom, another greenhouse gas 17. which contributes to climate change. In 2010 agriculture accounted for 44 per cent of total United Kingdom emissions of methane. Agricultural emissions of methane arise mainly from enteric fermentation in ruminating animals.
Methane emissions from agriculture have fallen by 20 per cent between 1990 and 2010 mainly as a result 18. of decreasing livestock numbers, particularly cattle. Further information can be found at: http://www.defra.gov.uk/statistics/foodfarm/enviro/observatory/programme-indicators/
Air quality
Ammonia emissions have an impact on air quality and thus on human health. Deposition of ammonia can 19. also damage sensitive habitats due to acidification and eutrophication, where excessive growth of a few dominant species leads to a decline in diversity of other species. Livestock production is a major source of ammonia emissions mainly from livestock housing and from the spreading of animal manure. Agriculture was responsible for 89 per cent of the total United Kingdom emissions in 2010.
Ammonia emissions since 1990 have fluctuated but overall have shown a declining trend. Again, this 20. reflects the fall in the livestock numbers over the period. Further information can be found at: http://www.defra.gov.uk/statistics/foodfarm/enviro/observatory/programme-indicators/
Pesticides
Pesticides include a range of plant protection products which are used to manage pests and diseases and 21. to regulate growth. These play a vital part in maintaining high crop yields and allowing greater levels of production from land. However, pesticides can have detrimental impacts on the environment, in particular to terrestrial and aquatic biodiversity.
The majority of pesticides are used on cereals. Pesticide usage can be measured in terms of the 22. application of active substance per hectare of crop grown. Pesticides vary considerably in terms of their activity with newer active substances often requiring lower application rates as a result of better activity levels. Between 2008 and 2010, the total pesticide application rate on cereals decreased by 23 per cent. This was largely due to dramatic changes in herbicide use; the revocation of isoproturon and trifluralin and replacement with active substances requiring lower application rates. Further information can be found at: http://www.defra.gov.uk/statistics/foodfarm/enviro/observatory/programme-indicators/

Cha
pter
13
- Env
ironm
ent
119
Farmland bird index
Farmland bird populations are considered to be a good indicator of the general state of wildlife because 23. they have a wide habitat distribution and are near the top of the food chain. Agriculture can provide habitats for nesting birds and valuable sources of winter food and spring forage. As a result, farming has a significant impact on farmland bird populations, although the situation is complex with a range of non-agricultural factors also contributing, i.e. the severity of winters and predation pressures.
The farmland bird index is made up of seven farmland generalist species and twelve farmland specialist 24. species. Since 1970 the generalist populations have remained relatively stable with the overall declining trend for all species driven mainly by the trend for the specialists; the farmland bird index is now at 50 per cent of its 1970 value. Most of the decline occurred between the late 1970s and early 1990s. Between 2009 and 2010 the index declined by 3.0 per cent. Further information can be found at: http://www.defra.gov.uk/statistics/files/Wild-bird-populations-in-the-UK-1970-2010-National-Statistics-Release.pdf

AGRICULTURE IN THE UNITED KINGDOM 2011
120

Cha
pter
14
- Key
Sta
tistic
s fo
r EU
Mem
ber S
tate
s
Key Statistics for EU Member States
121
Chapter14Summary
In 2011:
Income from agricultural activity in the United Kingdom as measured by the EU was 50 per cent higher than ●in 2005, while for the EU27 it was 19 per cent higher.
Of the EU27 Member States the United Kingdom is:
The largest producer of sheep and goat meat. ●
The third largest producer of wheat. ●
The third largest producer of cows’ milk. ●
The fourth largest producer of beef and veal. ●
Between 2005 and 2011:
Producer prices for crop products rose by 77 per cent in the United Kingdom and by 34 per cent in the ●EU27.
Producer prices for animals and animal products rose by 54 per cent in the United Kingdom and by 23 per ●cent in the EU27.
Purchase prices for the means of agricultural production rose by 58 per cent in the United Kingdom and by ●38 per cent in the EU27.
Introduction
This chapter presents simple analyses of agriculture in the European Union to enable comparison of the 1. United Kingdom with other Member States. The source of the data is http://epp.eurostat.ec.europa.eu/portal/page/portal/eurostat/home where a range of data is available free of charge.
EurostatisthestatisticalofficeoftheEuropeanUnion.ItstaskistoprovidetheEuropeanUnionwith2. statistics at a European level that enables comparisons between countries and regions.

AGRICULTURE IN THE UNITED KINGDOM 2011
122
Incomes
Indicator A of the income from agricultural activity
Chart 14.1 shows Indicator A, a measure 3. of the average income obtained from agriculture, for the United Kingdom and the EU27. An index showing the trend in the euro/sterling exchange rate is also shown.
100
125
150
Indices2005 = 100
United Kingdom
EU (27 countries)
euro/sterling exchange rate
75
100
125
150
2001 2003 2005 2007 2009 2011
Indices2005 = 100
United Kingdom
EU (27 countries)
euro/sterling exchange rate
Chart 14.1 Indicator A of the income from agricultural activity
Agricultural products
Wheat
Chart 14.2 shows the quantities of wheat 4. produced by the top five producingMember States in 2007 to 2010. This is production of common wheat and durum wheat. Data is not yet available for 2011 and some is not available for 2010.
Germany
United Kingdom
Poland
ItalyThousand tonnes
2007
2008
2009
2010
0 10 000 20 000 30 000 40 000
France
Germany
United Kingdom
Poland
ItalyThousand tonnes
2007
2008
2009
2010
Chart 14.2 Production of wheat
Cows’ milk
Chart 14.3 shows the quantities of 5. cows’ milk produced by the top fiveproducing Member States in 2007 to 2010. This is cows’ milk collected from farms by approved dairies and excludes milk consumed on farm, sold direct to consumers and used for cattle feed. Data is not yet available for 2011.
ItalyThousand tonnes
2007
Netherlands
ItalyThousand tonnes
2007
2008
UnitedKingdom
Netherlands
ItalyThousand tonnes
2007
2008
2009
2010
France
UnitedKingdom
Netherlands
ItalyThousand tonnes
2007
2008
2009
2010
Germany
France
UnitedKingdom
Netherlands
ItalyThousand tonnes
2007
2008
2009
2010
Germany
France
UnitedKingdom
Netherlands
ItalyThousand tonnes
2007
2008
2009
2010
0 5 000 10 000 15 000 20 000 25 000 30 000
Germany
France
UnitedKingdom
Netherlands
ItalyThousand tonnes
2007
2008
2009
2010
Chart 14.3 Collection of cows' milk

Cha
pter
14
- Key
Sta
tistic
s fo
r EU
Mem
ber S
tate
s
123
Pigmeat
Chart 14.4 shows the quantities of 6. pigmeat produced by the top fiveproducing Member States in 2008 to 2011. This is the total carcase weight of pigs slaughtered in slaughter houses and onthefarmwhosemeatisdeclaredfitforhuman consumption.
Beef and veal
Chart 14.5 shows the quantities of 7. beef and veal produced by the top fiveproducing Member States in 2008 to 2011. This is the total carcase weight of bovine animals (calves, bullocks, bulls, heifers and cows) slaughtered in slaughter houses and on the farm whose meat is declaredfitforhumanconsumption.
DenmarkThousand tonnes
2008
Poland
DenmarkThousand tonnes
2008
2009
France
Poland
DenmarkThousand tonnes
2008
2009
2010
2011
Spain
France
Poland
DenmarkThousand tonnes
2008
2009
2010
2011
Germany
Spain
France
Poland
DenmarkThousand tonnes
2008
2009
2010
2011
Germany
Spain
France
Poland
DenmarkThousand tonnes
2008
2009
2010
2011
0 1 000 2 000 3 000 4 000 5 000
Germany
Spain
France
Poland
DenmarkThousand tonnes
2008
2009
2010
2011
Chart 14.4 Production of pigmeat
United
SpainThousand tonnes
2008
2009UnitedKingdom
SpainThousand tonnes
2008
2009
Italy
UnitedKingdom
SpainThousand tonnes
2008
2009
2010
2011
Germany
Italy
UnitedKingdom
SpainThousand tonnes
2008
2009
2010
2011
France
Germany
Italy
UnitedKingdom
SpainThousand tonnes
2008
2009
2010
2011
France
Germany
Italy
UnitedKingdom
SpainThousand tonnes
2008
2009
2010
2011
0 500 1 000 1 500
France
Germany
Italy
UnitedKingdom
SpainThousand tonnes
2008
2009
2010
2011
Chart 14.5 Production of beef and veal
Sheep and goat meat
Chart 14.6 shows the quantities of sheep 8. andgoatmeatproducedbythetopfiveproducing Member States in 2008 to 2011. This is the total carcase weight of sheep, including lambs and goats, slaughtered in slaughter houses or elsewherewhosemeatisdeclaredfitforhuman consumption.
IrelandThousand tonnes
2008
2009France
IrelandThousand tonnes
2008
2009
Greece
France
IrelandThousand tonnes
2008
2009
2010
2011
Spain
Greece
France
IrelandThousand tonnes
2008
2009
2010
2011
United
Spain
Greece
France
IrelandThousand tonnes
2008
2009
2010
2011
UnitedKingdom
Spain
Greece
France
IrelandThousand tonnes
2008
2009
2010
2011
0 100 200 300
UnitedKingdom
Spain
Greece
France
IrelandThousand tonnes
2008
2009
2010
2011
Chart 14.6 Production of sheep and goat meat

AGRICULTURE IN THE UNITED KINGDOM 2011
124
Price indices
Crop products
The indices in chart 14.7 show the trends 9. in the nominal producer prices of crop products as a whole. The sub-indices were weighted by the values of sales in 2005. An index showing the trend in the euro/sterling exchange rate is also shown.
Animals and animal products
The indices in chart 14.8 show the trends 10. in the nominal producer prices of animals and animal products as a whole and in the euro/sterling exchange rate is also shown.
200
Indices2005 = 100
United Kingdom
EU27
euro/sterling exchange rate
180
200
Indices2005 = 100
United Kingdom
EU27
euro/sterling exchange rate
160
180
200
Indices2005 = 100
United Kingdom
EU27
euro/sterling exchange rate
120
140
160
180
200
Indices2005 = 100
United Kingdom
EU27
euro/sterling exchange rate
100
120
140
160
180
200
Indices2005 = 100
United Kingdom
EU27
euro/sterling exchange rate
80
100
120
140
160
180
200
Indices2005 = 100
United Kingdom
EU27
euro/sterling exchange rate
80
100
120
140
160
180
200
2005 2006 2007 2008 2009 2010 2011
Indices2005 = 100
United Kingdom
EU27
euro/sterling exchange rate
Chart 14.7 Producer price indices, nominal: Crop products
180
Indices2005 = 100
United Kingdom
EU27
euro/sterling exchange rate
160
180
Indices2005 = 100
United Kingdom
EU27
euro/sterling exchange rate
140
160
180
Indices2005 = 100
United Kingdom
EU27
euro/sterling exchange rate
120
140
160
180
Indices2005 = 100
United Kingdom
EU27
euro/sterling exchange rate
100
120
140
160
180
Indices2005 = 100
United Kingdom
EU27
euro/sterling exchange rate
80
100
120
140
160
180
2005 2006 2007 2008 2009 2010 2011
Indices2005 = 100
United Kingdom
EU27
euro/sterling exchange rate
80
100
120
140
160
180
2005 2006 2007 2008 2009 2010 2011
Indices2005 = 100
United Kingdom
EU27
euro/sterling exchange rate
Chart 14.8 Producer prices indices, nominal: Animals and animal products
180
Indices2005 = 100
United Kingdom
EU27
euro/sterling exchange rate
160
180
Indices2005 = 100
United Kingdom
EU27
euro/sterling exchange rate
140
160
180
Indices2005 = 100
United Kingdom
EU27
euro/sterling exchange rate
120
140
160
180
Indices2005 = 100
United Kingdom
EU27
euro/sterling exchange rate
100
120
140
160
180
Indices2005 = 100
United Kingdom
EU27
euro/sterling exchange rate
80
100
120
140
160
180
2005 2006 2007 2008 2009 2010 2011
Indices2005 = 100
United Kingdom
EU27
euro/sterling exchange rate
80
100
120
140
160
180
2005 2006 2007 2008 2009 2010 2011
Indices2005 = 100
United Kingdom
EU27
euro/sterling exchange rate
Chart 14.9 Purchase price indices, nominal: Total means of agricultural production
Total means of agricultural production
The indices in chart 14.9 show the trends 11. in the nominal purchase prices of the means of agricultural production as a whole and in the euro/sterling exchange rate.