agriculture in madhya pradesh challenges, strategy and goals 2009-12 presentation at ministry of...
TRANSCRIPT

Agriculture in Madhya Pradesh
Challenges, strategy and goals2009-12
Presentation at Ministry of Agriculture
19 May 2009
1

???Can this productivity gap ever be bridged?
Item W. Europe1900 2000
India1900 2000
Avg. area tilled by one farmer
10 ha. 100 ha. 1 ha. 1 ha.
Avg. output of grain per annum per worker
100 qtl.@ 10 qtl./ha.
5000 qtl.@ 50qtl/ha
10qtl. 10 qtl.
Average value of grain produced/worker
$ 1000@ $ 10/qtl.
$ 100,000@ $ 20/Qtl
$ 100 $ 200
Productivity ratio 10 500 1 1
Source: Marcel Mazoyer and Laurence Roudart: A History of World. Agriculture from the Neolithic Age to the Current Crisis. London: Earthscan, 2007

Structure of presentation
1. SWOT of MP agriculture2. Overview of recent achievements3. Strategic goals – 2009-124. Strategic Action Plan and budgetary
requirements5. Policy suggestions for GOI

A brief SWOT analysis
• Strengths1. 11 agro-climatic zones; 1100 mm rainfall2. Excellent land-man ratio; good soil types3. 1/3 area under forests; rich bio diversity4. Good support infrastructure: 4500 PACS, 240
mandis, 2 SAU, 11 Ag Colleges5. Strong extension network

SWOT (contd)
• Weakness1. ¾ holdings small and marginal (26% area)2. 2/3 area rainfed; monsoon vagaries3. 22% rural population tribal; low literacy4. High risk factor: lack of diversification5. Low use of HYV seed, fertilizer, mechaniz.6. Rural credit system weak7. Infrastructure (esp. power) and transport
bottlenecks

SWOT (contd)• Opportunities1. Strong political will to support agriculture2. Increased budgetary support under CSS3. Improving power and irrigation scenario

SWOT (concluded)
• Threats1. Uneven fund disbursal2. Inefficient HR management3. Untargeted interventions4. Change of focus at State level

Overview of recent performance
2006-07 to 2008-09

Particulars Unit Status
Geographical area Lakh Ha. 307.56
Net cultivated area Lakh Ha. 148.38
Area under Kharif Lakh Ha. 107.12
Area under Rabi Lakh Ha. 79.64
Double Cropped Area Lakh Ha. 53.78
Irrigated Area % 32.37
Cropping Intensity at present % 136
Agriculture Profile of the State
9

MP in national perspective (2006-07)S.N. Particulars All India M.P. Position
1. Irrigation % 40.3 32.37
2. Cropping intensity % 135 136
3. Fertilizer consumption/ in kg/ha.
104.50 62.70
4. Productivity of crops kg/ha.
a. Paddy 2084 868
b. Jowar 896 1042
c. Bajra 873 1360
d. Maize 1783 979
e. Wheat 2617 1915
f. Gram 782 981 Ist (46.62%) in Prod.
g. Soybean 1051 1007 Ist (54.51%)%in prod.
Total pulses 595 780 Ist (26.12%)%in Prod.
Total Oilseeds 895 955 2nd (19.71%) in prod.

11
AREA, PRODUCTION, YIELD & CAGR OF MAJOR KHARIF CROPS IN MP
(AREA(A):000'Ha., PROD(P).:000'TONNES, YIELD(Y):Kg./Ha.)
CROPS
2006-07 2007-08 2008-09 CAGR %
A P Y A P Y A P Y A P Y
PADDY 1684 1396 874 1645 1332 810 1682 1560 927 -1.22 3.58 -0.63
JOWAR 545 562 1033 528 590 1123 471 577 1225 -8.35 3.83 13.65
MAIZE 890 854 962 853 1119 1312 840 1144 1307 -4.89 32.49 36.12
BAJRA 185 254 1375 202 278 1376 175 241 1377 1.89 2.17 0.11
KODOKUTKI 297 76 254 315 86 273 307 89 300 4.71 15.13 12.80
TUR 309 213 691 325 219 673 363 290 800 11.33 19.48 6.58
URAD 470 161 342 570 195 342 476 183 384 11.28 17.39 6.14
MOONG 73 24 318 76 25 329 76 27 355 4.11 8.33 7.55
GROUNDNUT 201 192 949 204 191 936 200 228 1140 0.50 9.11 9.38
SOYBEAN 4705 4789 1019 5202 5368 1032 5124 5850 1142 9.73 17.12 6.67
SESAMUM 247 88 356 231 88 378 213 98 460 -10.12 5.68 17.61
NIGER 108 24 222 102 24 235 117 27 231 1.39 6.25 4.95
TOTAL 10416 9079 872 10907 9964 914 10712 10772 1006 3.78 14.20 10.09

12
AREA, PRODUCTION, YIELD & CAGR OF MAJOR RABI CROPS IN MP
(AREA(A):000'Ha., PROD(P).:000'TONNES, YIELD(Y):Kg./Ha.)
CROPS2006-07 2007-08 2008-09 CAGR %
A P Y A P Y A P Y A P Y
WHEAT 4275 7848 1916 3742 6032 1748 3607 6000 1665 -14.05 -23.34 -10.93
GRAM 2591 2557 988 2439 1735 699 2714 2307 850 -0.56 -20.96 -21.61
PEAS 190 84 442 166 67 404 216 99 460 0.53 -1.19 -2.26
LENTIL 540 262 485 468 206 440 520 239 460 -8.52 -15.08 -7.22
RAPE/ MUSTARD
753 706 939 579 537 927 596 542 910 -21.98 -23.58 -2.18
LINSEED 126 50 397 105 33 313 114 47 410 -13.10 -20.00 -8.94
TOTAL 8672 11907 1373 7682 9017 1174 7964 9894 1242 -9.79 -20.59 -12.02
NOTE:39 District, 164 Tehsil in 2007-08 & 41 District, 152Tehsil in 2008-09 where drought affected in sgtate, adversely affected area & productivity of crop.

13
PERFORMANCE OF SEED PRODUCTION AND SRR
(Unit-Seed Prodn-lakh Qtls, SRR-%)Crops 2006-07 2007-08 2008-09 CAGR %
Seed Prodn
SRR Seed Prodn
SRR Seed Prodn
SRR Seed Prodn
SRR
Kharif crops
Soybean 12.73 15.84 16.04 14.77 23.24 19.37 54.28 7.77
Paddy 0.34 3.96 0.21 8.85 0.24 11.05 -33.82 151.26
Rabi crops
Wheat 8.59 8.03 10.93 19.19 12.00 13.62 33.47 104.30
Gram 0.51 2.15 1.02 2.90 1.30 4.41 127.45 70.00

Seed Treatment (Unit : % of total seed used)
Year Kharif Rabi
2006-07 14.18 14.81
2007-08 40.00 56.5
2008-09 57.78 68.56
14

Fertilizer Consumption in the State
Nutrients 2006-07 2007-08 2008-09
N 7.301 7.957 7.998
P 4.098 4.303 5.297
K 0.653 0.758 0.899
Total 12.051 13.017 14.195
( Unit – lakh MT )
15

Per ha. consumption of fertilizers
Nutrients Achievement
2006-07 2007-08 2008-09
N 37.58 43.56 42.52
P 21.32 23.55 28.15
K 3.39 4.15 4.78
Total 62.70 71.26 75.40
( Unit – KG/Ha)
16

Performance of mechanization
Year Manually Operated / Bullock Drawn
implements
Power Drawn
implements
Tractor &
Power Tiller
2006-07 64580 1351 440
2007-08 52526 1756 444
2008-09 55180 1816 480
Total 172286 4923 1364
17

NRM – Watershed Development
Particulars Unit 2006-07 2007-08 2008-09
P F P F P F
NWDPRA Ha 53937 1648.88 39094 2286.97 23829 2907.66
RVP / FPR Ha 22349 1536.03 25853 1613.18 19628 1586.46
MIT
Nos - - - - 56 1250.00
PERCOLATION TANKs
Nos 93 259.21 301 1682.50 793 4107.23
18
Unit-Fin-lakh

Some policy initiatives at a glance
1. Lowering risks and cost of agriculture• Coop credit interest brought down from 16% to 7%
(2006-07), 5% (2007-08) and 3% (proposed for 2009-10); state subsidy 100cr
• 2/3 farmers covered under Kisan Credit Card• Rs. 100/qtl wheat bonus in 2007-08 and Rs. 50/qtl
wheat bonus paid in 2008-09 • State level debt waiver scheme for loans upto Rs. 50k
announced (to be implemented)• 300+ farmer seed societies; doubling of F1 seed
availability between 2006-2008.

Policy initiatives (contd)
2. Strengthening extension• 1st State to introduce PPP model (ATMA)• 1st State Level call centre• 1st Hindi website for agriculture; KGK; CSC• Community radio station• Over 1500 farm schools mobilized• Each of 52,000 villages site for demo plot• Dist./block level Krishi Vigyan Mela• Monthly newsletter; radio and TV content

Policy initiatives (contd)
3. Moisture conservation efforts• SRI and ridge-and-furrow thrust techniques• Balram Tal scheme for on-farm ponds• Tubewell scheme for cultivators• Top-up subsidy for drip and sprinkler systems

Policy initiatives (contd)
4. Rural finance institutions• 1st among north Indian states to sign
Vaidyanathan Mou in 2006; over Rs. 1200 crores received as assistance
• Comprehensive amendments to Coop Act passed
• Wide ranging reform of PACS underway; focus on SMF memership; savings, portfolio financing

Policy initiatives (contd)
5. Marketing• Modernization programme covering 240 market yards
(computeriz., electronic scales, farmer facilities)• Single license system for bulk buyers to facilitate
direct farmer-processor linkage• National Spot Exchange begins functioning at Indore
(April 2009)• 3 storage and marketing hubs for cereals and
perishables planned in 2009-10• WHR, storage and collateral services being expanded
Strategic goals
2009-10 to 2011-12
24

Strategic goals 2009-121. Achieve 5% p.a. growth in agriculture2. Attain national productivity goals in major crops3. Promote groundwater recharge and in-situ moisture
conservation efforts4. Promote a sustainable, diversified agriculture model, based
on optimum resource use5. Promote intensive mechanization to improve productivity
and reduce production losses and drudgery6. Create effective and transparent marketing mechanisms to
enable unlocking of farm produce value7. Support research and HRD focused on State’s needs

Strategic Action Plan1. Achieving 5% per annum growth• Double SRR of all major crops in 3 years
• Increase seed production throughout breeder-foundation-certified chain
• Promote diversification through additional areas under horticulture and agro forestry
• Promote targeted mechanization to improve yields
• Strengthen animal husbandry interventions across value chain
• Liberalise marketing arrangements further; PPP in infrastructure; WHR; strategic marketing hubs, etc.
• Target SMF with institutional credit and financial services, including risk mitigation strategies

SAP (contd)2. Attain national productivity goals in major crops
Soybean Research will be focused on early maturing disease free
varieties. Ridge-and-furrow and similar useful practices Weed control to be focus of farm level efforts Farm schools to anchor demo and technology transfer
efforts
Paddy Increase seed availability, esp. hybrids and early
maturing varieties Upland paddy to be phased out with oilseeds and pulses SRI method to cover entire paddy acreage in 3-5 years

Wheat Varietal replacement Addressing micro nutrient deficiencies Timely sowing and irrigation management Niche production and value chain enhancement for
‘sharbati’ and durum varietiesGram Increasing SRR Targeting productivity increase for SMF Irrigation and pest management
Efforts underpinned by revitalised extension system, which is being made totally farmer anchored.

Kharif Crop Development
Crops Year wise projected Area & Productivity (Yield)
2009-10 2010-11 2011-12
Area Yield Area Yield Area Yield
Soybean 50.75 1160 51.25 1200 51.75 1240
Paddy 16.25 975 16.50 1025 16.75 1075
Maize 8.90 1500 9.20 1600 9.50 1800
Pulses 11.15 568 11.50 580 12.00 600
Total 106.70 1040 108.00 1080 109.00 1100
29
Area: lakh ha., Yield: Kg/Ha

Rabi Crop Development
Crops Year wise projected Area & Productivity (Yield)
2009-10 2010-11 2011-12
Area Yield Area Yield Area Yield
Wheat 42.00 2050 42.50 2150 43.00 2200
Gram 30.00 1050 30.30 1080 30.60 1110
Total Pulses 38.00 810 38.50 825 39.00 850
Mustard 7.00 1075 7.25 1100 7.50 1125
Total 90.00 1500 92.00 1550 93.00 1600
30
Area: lakh ha., Yield: Kg/Ha

3. Promote groundwater recharge and in-situ moisture conservation efforts
Expansion of Balram Tal scheme
Expansion of tubewell scheme for SMF
Convergence with NREGA for on-farm ponds, SMF esp.
Greater thrust on NWDPRA
Targeting SMF for use of water saving devices
Implementation of master plan for serial check dams on major streams in collaboration with RDD

4. Promote a sustainable, diversified agriculture model, based on optimum resource use
Increased focus on conservation agriculture practices
Use of NHM & RKVY funds for allied sector interventions
Involvement of NGOs for promoting integrated farm production models (e.g. ‘Wadi’)
Greater emphasis on organic farming, use of farm waste, mulching etc.
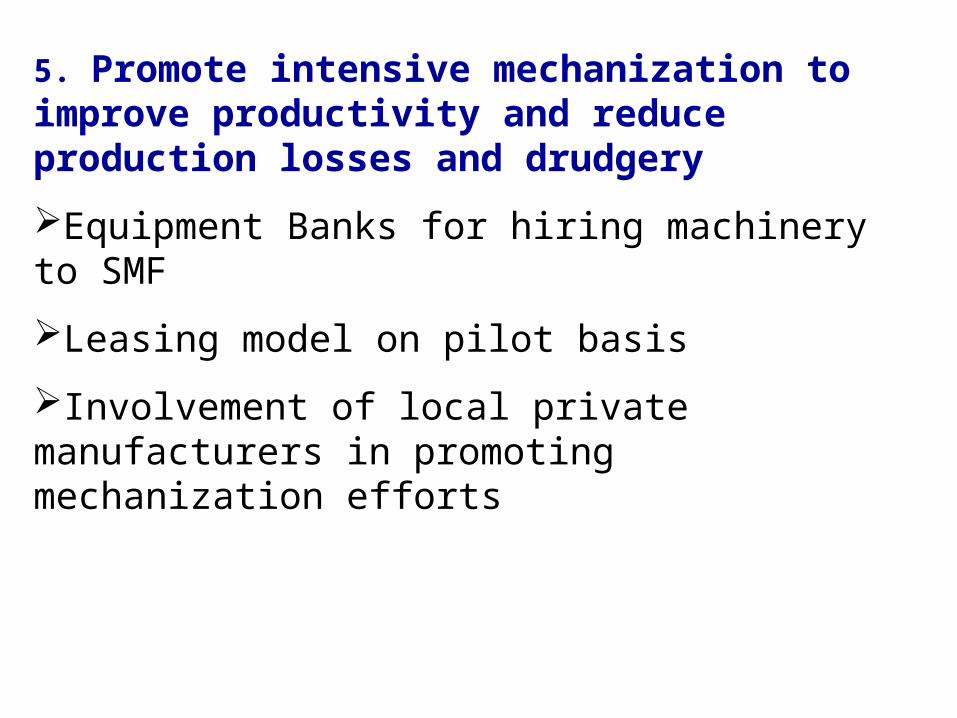
5. Promote intensive mechanization to improve productivity and reduce production losses and drudgery
Equipment Banks for hiring machinery to SMF
Leasing model on pilot basis
Involvement of local private manufacturers in promoting mechanization efforts

6. Create effective and transparent marketing mechanisms to enable unlocking of farm produce value
Purchase centres outside market yards for direct farmer-buyer interface
Provision for Kisan Mandis around major towns
Major projects for perishables and regional storage hubs under implementation
Modernization of mandis – use of IT; PPP model for infrastructure development; WHR & collateral services
National Spot Exchange to be expanded in mandis

7. Support research and HRD focused on State’s needs
SAUs to focus primarily on State specific crops
Greater farmer involvement in varietal research and development
Private sector to be encouraged to enter agri education
Veterinary and horticulture universities under planning
Establishment of gene banks and seed banks at SAUs to preserve unique bio heritage of State and check bio piracy

ATMAActivities Projected Targets
2009-10 2010-11 2011-12
Establishment of FFS 2000 3000 5000
Demonstration 35000 37000 39000
Establishment of CRS 10 15 25
Interface 100 100 100
Kisan Mela/Exhibition 50 50 50
P P Partners 18 25 30
36
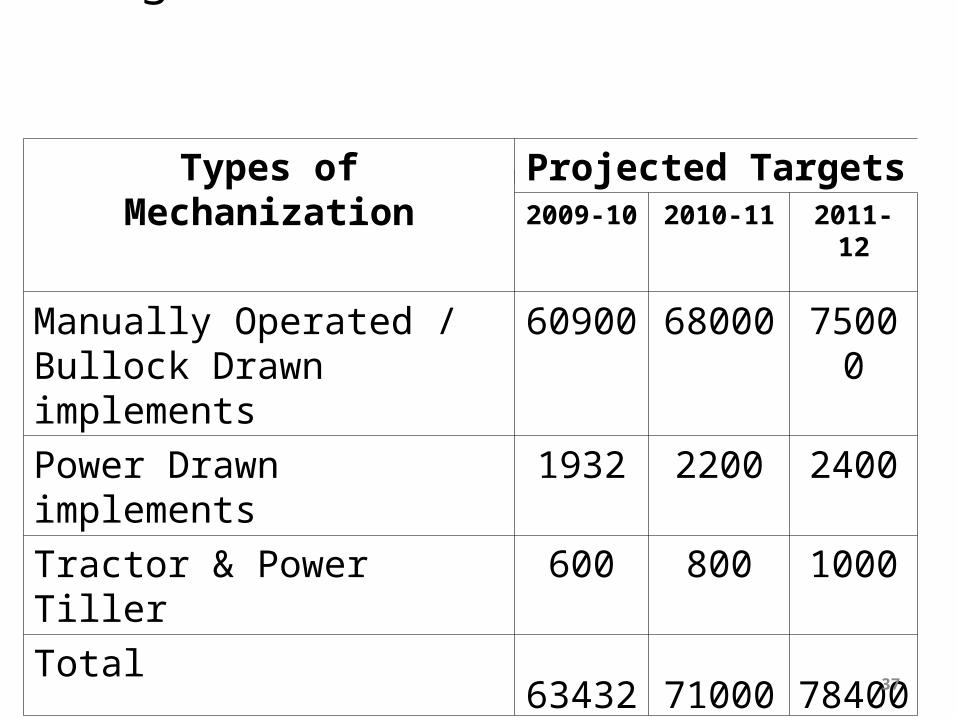
Agriculture Mechanization (Unit-Nos)
Types of Mechanization Projected Targets2009-10 2010-11 2011-12
Manually Operated / Bullock Drawn implements
60900 68000 75000
Power Drawn implements 1932 2200 2400
Tractor & Power Tiller 600 800 1000
Total63432 71000 78400
37

Seed Infrastructure & AvailabilityParticulars Projected Targets
2009-10 2010-11 2011-12
Seed Availability ( Qtls )
•Kharif
•Soybean 900000 1100000 1350000
•Paddy 102797 150000 170000
•Rabi
•Wheat 628000 680000 835000
•Gram 110000 120000 150000
•SRR (%)
•Soybean 24.00 28.00 32.00
•Paddy 12.85 18.00 20.00
•Wheat 16.00 20.00 24.00
•Gram 5.50 7.00 9.00 38

Per Unit Consumption of Fertilizer
Nutrients Projected Targets
2009-10 2010-11 2011-12
N 45 50 55
P 30 32 34
K 05 05.5 06
Total 80 87.5 95
( Unit – KG/Ha)
39

Seed Treatment (Unit : in % of total seed.)
Year Projection
Kharit Rabi
2009-10 75.00 80.00
2010-11 80.00 85.00
2011-2012 85.00 90.00
40

NRM – Watershed Development
Particulars Unit Projected Targets
2009-10 2010-11 2011-12
NWDPRA Ha 41180 50000 60000
RVP / FPR Ha 28000 37000 41000
CONSTRUCTION OF MIT
Nos 75 90 110
CONSTRUCTION OF PERCOLATION TANKs
Nos 800 1000 1100
41

Agriculture infrastructureParticulars Projected Targets
2009-10 2010-11 2011-12
Plant protection lab 1 1 1
Seed testing lab 2 4 4
Fertilizer testing lab 1 1 1
Strengthening of Soil testing labs 14 25 30
Renovation of Trg Institution (State level) 1 1 1
Renovation of Trg Centers (Dist level) 7 7 5
Renovation of Block level Krishi Gyan Kendra
100 100 113
Renovation of State Seed Farms 15 10 1042

43
Expenditure & Proposed Allocations under CSS
(Unit-Lakh Rs.)Name of Scheme
Expenditure Proposed allocation2006-07 2007-08 2008-09 2009-10 2010-11 2011-12
Macro Management
4699.80 5772.06 7580.08 10584.43 12510.00 15370.00
ISOPOM 4557.30 4169.36 5503.40 5600.00 14725.00 16000.00
COTTON MISSION-II
483.96 411.19 475.92 1133.10 1165.85 1267.56
NFSM - 897.45 5762.33 12965.31 14103.00 16100.00
RKVY - 6756.96 11661.17 37527.22 40000.00 50000.00
ATMA 125.39 513.15 1558.03 7270.21 6977.89 7000.00
DSIFPDQS* 351.34 237.93 264.04 3000.00 3200.00 4000.00
Total 10217.79 18758.10 32804.97 78080.27 92681.74 109737.56
* DEV.& STRENGTHENING OF INFRASGTRUCTURE FACILITIESFOR PRODUCTION & DISTRIBUTION OF QUALITY SEEDS

Policy suggestions for Govt. of India
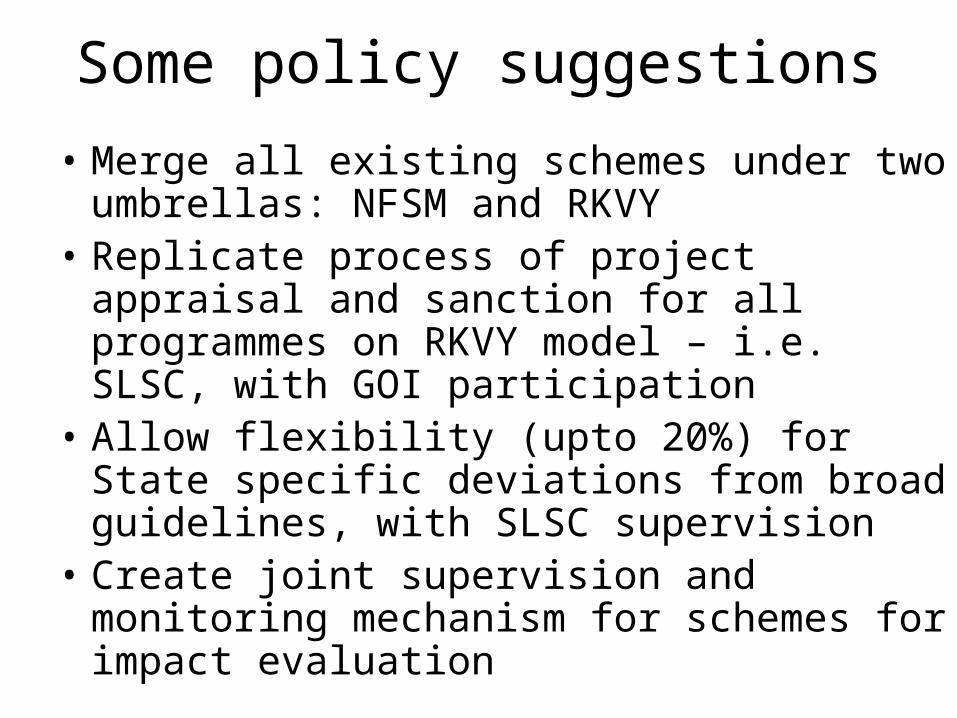
Some policy suggestions
• Merge all existing schemes under two umbrellas: NFSM and RKVY
• Replicate process of project appraisal and sanction for all programmes on RKVY model – i.e. SLSC, with GOI participation
• Allow flexibility (upto 20%) for State specific deviations from broad guidelines, with SLSC supervision
• Create joint supervision and monitoring mechanism for schemes for impact evaluation

THANKS