agriculture and rural development discussion...
TRANSCRIPT

The World Bank
Agriculture and Rural Development Discussion Paper
The Challenge of Compliance with SPS and Other Standards Associated with the Export of Shrimp and Selected Fresh Produce Items to the United States Market
John E. Lamb Julian A. Velez Robert W. Barclay
2
First printing or web posting: 2005 © 2004 The International Bank for Reconstruction and Development/The World Bank 1818 H Street, NW Washington, DC 20433 Telephone 202-473-1000 Internet www.worldbank.org E-mail [email protected] All rights reserved. Agriculture and Rural Development Discussion Papers is an informal series produced by the Agriculture and Rural Development Department of the World Bank. These papers raise concepts and issues for discussion in the broader development community and describe ongoing research and/or implementation experiences from the Bank. The findings, interpretations, and conclusions expressed herein are those of the author(s) and do not necessarily reflect the views of the Board of Executive Directors of the World Bank, the governments they represent, or the organizations of contributing authors. The World Bank does not guarantee the accuracy of the data included in this work. Rights and Permissions The material in this work is copyrighted. Copying and/or transmitting portions or all of this work without permission may be a violation of applicable law. The World Bank encourages dissemination of its work and will normally grant permission promptly. For permission to photocopy or reprint any part of this work, please send a request with complete information to the Copyright Clearance Center, Inc., 222 Rosewood Drive, Danvers, MA 01923, USA, telephone 978-750-8400, fax 978-750-4470, www.copyright.com. All other queries on rights and licenses, including subsidiary rights, should be addressed to the Office of the Publisher, World Bank, 1818 H Street NW, Washington, DC 20433, USA, fax 202-522-2422, e-mail [email protected].

3
Contents
Foreword v Acronyms vi Introduction 1 1. Food Consumption and Import Trends 3 Per Capita Consumption for Selected Categories 3 Role of Imports in U.S. Food Supply 3 Seafood Imports: Spotlight on Shrimp 9 Fresh Produce Imports: Spotlight on Selected Fruits and Vegetables 11 2. Standards Applicable to Imported Food
18
Definitions 18 Purposes 18 Tangible vs. Intangible Standards 18 Degree of Voluntarism 18 Types of Standards 19 Areas of Application in Food and Agriculture 20 3. Coping with Shrimp Standards
24
Standards Applicable to Shrimp 24 Compliance Issues 28 Direct Cost Implications of Compliance Issues for Shrimp 31 4. Coping with Standards for Fresh Fruit and Vegetables
34
Standards Applicable to Fresh Produce 34 Compliance Issues for Selected Fresh Produce Categories 41 Direct Cost of Compliance Issues in Selected Produce Categories 47 5. Other Costs Associated with Compliance with Emerging Standards
50
Additional Costs of Noncompliance 50 Industry Perceptions Concerning Costs of Noncompliance 51 Strategies for Dealing with Risks Associated with Noncompliance 51 6. Conclusions
54
Findings 54 Recommendations 54 Appendixes 1. Value of U.S. Imports of Shrimp from All Countries, 1998–2003 56 2. Volume of U.S. Imports of Shrimp from All Countries, 1998–2003 3. Excerpts from FDA Import Alerts on Shrimp 4. Excerpts from FDA Import Alerts on Fruits and Vegetables
57 58 60
Bibliography 62 Figure

4
1 Causes for FDA refusal of entry for shrimp (all exporting countries and all ports of entry) June–October 2003
31
Tables 1 US per capita consumption of major food commodities 5 2 Import shares of United States food consumption for major categories by weight 6 3 Detailed import shares of United States food consumption by value, 1980–2001 (%) 7 4 US imports of fish products from all countries, 1999–2000 (US$) 9 5 Volume of US imports of fish products from all countries (MT) 10 6 Shrimp import share by form and presentation (US$) 12 7 US cantaloupes: Supply, use, and price, farm weight, 1978–2003 13 8 US imports of fresh cantaloupe by value 14 9 Fresh mangos: Supply and use, 1980 to date 15 10 US imports of fresh mangos by value, 1998–2002 15 11 US asparagus: Supply, use, and price, farm weight, 1978–2003 15 12 US imports of fresh asparagus by value, 1998–2003 16 13 US imports of fresh red raspberries by value, 1998–2003 17 14 US imports of fresh edible pea pods by value, 1998–2003 17 15 Matrix of standards applicable to shrimp 25 16 Direct costs associated with FDA hold/exam for a container of shrimp 32 17 Direct costs associated with FDA detention/refusal of a container of shrimp 33 18 Matrix of standards applicable to fresh produce 36 19 Illustrative costs of fruit and vegetable shipments that are refused entry to the US
(US$) 49
20 Illustrative costs of fruit and vegetable shipments that are detained but released (US$) 49
5
Foreword
Food and agricultural trade is the vital link in the mutual dependency of the global trade system and developing countries. Developing countries derive a substantial portion of their income from food and agricultural trade. The emergence of food safety and agricultural health issues and the related tightening of market requirements form challenges to further gains from trade due to the lack of technical and financial capacities of many developing economies.
As part of a joint program between the World Bank’s Agriculture and Rural Development Department (ARD) and International Trade Department (PRMTR), a survey on the Cost of Compliance of exporting developing countries was undertaken. The survey was focused on the supply chains of high-value food products (horticulture, fish, meat, spices, and nuts). The study quantified the costs incurred by both the public and private sectors; identified the coping strategies employed by the various stakeholders in the supply chains; determined the constraints that hinder compliance; examined the structural changes in the supply chain resulting from compliance with the safety standards; and evaluated the impact of these standards on small-scale enterprises and producers. The survey included Ethiopia (animal products), India (fish and spices), Jamaica (nontraditional agricultural exports), Kenya (fish and horticulture), Latin America Southern Cone (animal products), Morocco (fruits and vegetables), Nicaragua (shrimp), Senegal (fish and groundnuts), and Thailand (shrimp and horticulture).
A complementary perspective is provided by the companion series of buyer surveys involving representative importers, brokers, retailers, and distributors in the European Union, Japan, and the United States. This series, in turn, discusses the buyers’ perception of the strengths and weaknesses of their suppliers and describes the assistance and/or interventions offered by the buyers to their developing country suppliers.
This working paper is one of a series of such buyer surveys. These surveys examined the strategies of suppliers from the buyers’ perspective and the costs of intervention to assist the various developing country stakeholders to comply with international agro-food standards. This paper was prepared by John E. Lamb, Julian A. Velez, and Robert W. Barclay (all with Abt Associates, Inc.), with guidance from Steven Jaffee (PRMTR).
The findings and conclusions derived from these country studies are discussed in a synthesis report that seeks to identify possible points of intervention by the World Bank and other donor agencies and to determine the types of technical assistance that would be most efficient and appropriate. It is hoped that the experiences of these exporter and importer countries will provide useful insights to practitioners in the field, and to national and international policymakers in both the public and private sectors.
Kevin Cleaver Director, Agriculture and Rural Development Department
Uri Dadush Director, International Trade Department

6
Acronyms
ADI Acceptable Daily Intake AGEXPRONT Guild of Non-traditional Products Exporters (Guatemala) AMS Agricultural Marketing Service (USDA ) APHIS Animal and Plant Health Inspection Service (USDA) ASDA American Seafood Distributors Association BSE Bovine Spongiform Encephalopathy (mad cow disease) CBP Customs and Border Protection CDC Centers for Disease Control and Prevention (DHHS) CIF Cost, Insurance and Freight CFSAN Center for Food Safety and Applied Nutrition (FDA) CODEX Codex Alimentarius COMTRADE Commodity Trade Statistics Database (UNSTAT) COOL Country of Origin Labeling DEA Drug Enforcement Agency (US) DHHS United States Department of Health and Human Services DRC Dispute Resolution Corporation DWPE Detention without Physical Examination EBDC Ethylenebis dithiocarbamate EDB ethylene dibromide EDI Electronic data interchange EPA Environmental Protection Agency (U.S.) ERS Economic Research Service (USDA) ESSTO European Seafood Safety and Traceability Organisation EurepGAP European Retailers Programme for Good Agricultural Practices FAO United Nations Food and Agriculture Organization FDA United States Food and Drug Administration (DHHS) F&DC Food, Drug and Cosmetic Act FFDCA Federal Food, Drug and Cosmetic Act FIFRA Federal Insecticide, Fungicide, and Rodenticide Act FMI Food Marketing Institute (US) FOB free on board FQPA Food Quality Protection Act of 1996 FSIS United States Food Safety and Inspection Service (USDA) FTS Federal Technology Service (GSA) FY Fiscal Year GAA Global Aquaculture Alliance GAO Government Accountability Office GAP Good Agricultural Practices GMP Good Manufacturing Practices HACCP Hazard Analysis and Critical Control Points HHS U.S. Department of Health and Human Services HWT hot water treatment IAMA International Food and Agribusiness Management Association (US) IPM integrated pest management IR-4 Minor Use Pesticide Registration Program (EPA) ITC International Trade Commission LAC Latin America and the Caribbean

7
LACF Low Acid Canned Food MDR minimum daily requirement MOU Memorandum of Understanding MPE Model Plan of Excellence (Guatemala) MPF Merchandise processing fee MPN most probable number NMFS National Marine Fisheries Service (US NOAA) NOAA National Oceanic and Atmospheric Administration OIE World Organization for Animal Health OPPTS Office of Prevention, Pesticides, and Toxic Substances ORA Office of Regulatory Affairs OSHA Occupational Safety and Health Administration PACA Perishable Agricultural Commodities Act (USDA) PI preharvest interval PIP Pesticide Improvement Program (ACP/Cotonou) PIPAA Integrated Program for Agricultural and Environment Protection (Guatemala) P.L. Public Law (US) PLU Product Look-Up number POP Point of Purchase PPQ Plant Protection and Quarantine PRIA Pesticide Registration Improvement Act of 2003 PROEXAG/ Project for Support of Non-traditional Agricultural Exports/Export Import EXITOS Technology Support Project, for Central America (USAID) PROMPEX Program for the Promotion of Exports of Peru QAP quarantine action pest RFID Radio Frequency Identification Device SGS Société Générale de Surveillance (international) SPS Sanitary and Phytosanitary SQF Safe Quality Food (certification program of Food Marketing Institute in US) SSA Southern Shrimp Alliance SSOP Sanitation Standard Operating Procedures TBT Technical Barrier to Trade TED turtle excluder device UNEP United Nations Environment Programme UPC Universal Product Code UPOV International Union for the Protection of New Varieties of Plants USCS United States Customs Service USDA United States Department of Agriculture USG United States Government WHO World Health Organization WPS Worker Protection Standard (EPA) WTO World Trade Organization

1
Introduction
The World Bank commissioned this study to understand the challenges faced by United States receivers and buyers of offshore frozen shrimp and selected fresh fruits and vegetables. With this objective in mind, the report analyzes both statistical evidence from regulatory and other governmental agencies and the viewpoints of a sampling of importers, handlers, distributors, and chain buyers. The evidence was collected through a combination of literature review and direct interviews in person and by telephone. Besides discussing costs and difficulties with compliance, the report identifies coping strategies, equity impacts, and the resulting needs for capacity building.
As recent events clearly demonstrate, standards do matter greatly, not only to regulators but also to economic actors in the food industry and to consumers. Unfortunately, standards are most noteworthy in time of food or trade crisis–whether real, alleged or imagined. Coincidentally, several attention-getting crises relating to standards occurred in the United States while this report was being written. First, in 2003, several outbreaks of Hepatitis A occurred in four Eastern states associated with eating raw or undercooked green onions, apparently from Mexico. Next, bovine spongiform encephalopathy (BSE, or, more commonly, “Mad Cow Disease”) was presumptively identified in an adult Holstein cow in the State of Washington.1
The consequences of a food-related incident can be huge, whether justified by the findings or not. In the “Chilean Grape Scare” of 1989 (reports of cyanide injection in table grapes), although the evidence was very doubtful, the U.S. Food and Drug Administration (FDA) impounded 2 million boxes of grapes–an entire shipping season’s worth. An estimated $240 million was lost, and 20,000–50,000 workers reportedly lost their jobs.
In the case of BSE, the consequences have been much greater and will persist over time even if it is fully resolved. When the Washington State problem was first identified, the U.S. Department of Agriculture (USDA) immediately undertook aggressive remedial, trace-back, and media actions to contain the crisis. Despite the rapid response, market access for U.S. beef products was denied quickly in approximately 25 countries, including all major U.S. markets,2 potentially affecting an estimated 2.58 billion pounds of annual U.S. exports to the world, valued at $3.266 billion.3
These incidents show the tremendous challenges, particularly to developing country suppliers. Getting the right product to market on time, in good condition, and at competitive cost is no longer enough. Myriad public and private standards for sanitary and phytosanitary (SPS) matters, environmental protection, and treatment of labor both guide or constrain the production, logistics, marketing, and trade of food products, especially those destined for major markets such as the United States. The risks are enormous. Invasive species or exogenous pests or diseases can do great harm to U.S. agriculture. The U.S. General Accountability Office (GAO) estimates that there are 81 million cases of food-borne illness annually. FDA estimates that 300,000 hospitalizations and 5,000 deaths occur each year due to food-borne pathogens.4
1 http://www.usda.gov/news/releases/2003/12/0432.htm. 2 http://www.cbc.ca/stories/2003/12/28/bse031228. 3 http://www.ers.usda.gov/news/BSECoverage.htm. 4 Figures mentioned by the Director Designate of FDA’s Center for Food Safety and Applied Nutrition in keynote address at the Food Safety Summit held in Washington, D.C., March 2003.

2
Some observers argue that emerging standards have become de facto non-tariff trade barriers. Critics assert that stricter standards generally limit the success of developing countries at penetrating the main foreign markets, and raise costs and reduce net returns to upstream actors in the food chain. These standards may hamper food export development by less experienced and late-moving countries, and discourage participation by small farmers and their producer/exporter organizations.
Other observers argue that emerging standards actually stimulate food trade. Standards can facilitate arms-length transactions. Improvements in their application raise the confidence level of government, industry, and consumer alike in food in general and imported food in particular, and lower the incidence of market-depressing food scares. Standards-based improvements in the quality and condition of supply reduce product shrinkage and associated expenses all along the farm-to-market chain.
While this study was too limited in scope to resolve this important debate, the authors do hope that it will inform the discussion, at least for selected high-value products being exported to the U.S. market.
The study starts off with the consumption and production patterns for selected commodities (seafood, fruits, and vegetables), and, consequently, the significant role of imports. The different types of standards applicable to imported food are described in the next section. That section is followed by a discussion of how offshore suppliers of the pertinent commodities comply with these standards, including cost implications. The subsequent section deals with the much larger costs associated with loss of confidence, image, and market, and identifies the strategies for dealing with the risks associated with noncompliance. Finally, the authors present their main findings and recommend specific strategies for capacity building to the World Bank and other donor agencies.
3
1. Food Consumption and Import Trends
Per Capita Consumption for Selected Categories Annual per capita consumption of food in the United States reached more than 2,000 pounds in 2001,5 up from 1,800 pounds 2 decades ago. The fruit and vegetable category accounted for the largest share of per capita food consumption, but its total in terms of farm weight has risen very slowly and inconsistently (table 1).6 Fruit and vegetable consumption in 2001 amounted to 689 pounds per year, barely up from the 1992 figure of 677 pounds. Fruit consumption actually fell slightly during this period, from 282 pounds to 276. Meanwhile, per capita vegetable consumption rose gradually, from 395 pounds to 413 pounds. Despite the widespread perception that fish and shellfish are good for health, U.S. per capita consumption of fish and shellfish products has actually remained fairly low and flat for the last decade, oscillating between 14.6 and 15.2 pounds annually in terms of retail weight. Red meat consumption remains approximately 7 times as high as that of seafood, and poultry more than 4 times as great.
Role of Imports in U.S. Food Supply
Imports of food in 2003 amounted to more than 6 million shipments, and the number is rising rapidly.7 Food from abroad plays a key role in the United States food system. Between 1997 and 2001, imported fruits, vegetables, seafood, meat, and other foods provided 11.1 percent by weight of the food consumed by U.S. citizens, up from 8.2 percent in the early 1980s. Imports may supply products that cannot be grown within the country due to agroclimatic conditions. Imports fill windows that occur naturally each year because of the change in seasons, and also help fill shortfalls that occur unpredictably due to crop failures. Imports help ensure year-round supply of nearly all food products demanded in the marketplace. This near-certainty in turn helps ensure a strong and orderly market for domestic supplies of similar items during peak supply periods. Imports also provide greater diversity of products and varieties. Finally, by stimulating competition with domestic production where supply periods may overlap, imports help lower the overall cost of food to consumers. For example, in 2000, U.S. consumers devoted just 9.73 percent of their total expenditures to food, which is the lowest ratio in the world.8 The trend continues downward.
5 2001 is the latest year reported fully by USDA. 6 Agricultural Outlook Board, “Per Capita Consumption of Major Food Commodities,” AO Table 39, Economic
Research Service, USDA, May 2003. 7 http://www.fda.gov/bbs/topics/news/2004/NEW01057.html. 8 http://www.ers.usda.gov/publications/wrs011/wrs011.pdf.
4
Many different factors explain the growth in U.S. food imports. On the demand side, consumers increasingly want a greater variety of fresh and processed food items, and for the full 12 months of the year. Many consumers are willing to pay a premium for fresh fruits and vegetables during winter months. They expect to be able to purchase a wide range of ethnic items that match their heritage or to which they were exposed through travel and the media. Most want convenience in the form of different sizes, presentations, degree of processing, and consumer packaging. They also want the choice between conventionally and organically grown items. On the supply side, growers and shippers both have responded to and further stimulated the consumption of offshore and winter season supplies of different

5
varieties and products. Moreover, new technologies in production, post-harvest handling, storage, transport, and distribution have made it possible to lower costs, maintain condition, reduce transit time, ship longer distances, and extend shelf-life.
Imported crops and their derived products predominate over imported animal products. Over the last 20 years, plant products increased their share by 4.8 percentage points, as compared with just 0.7 percentage points for animal products (table 2). The main subcategories of interest in the present study fall within
Table 1
U.S. Per Capita Consumption of Major Food Commodities1
1992 1993 1994 1995 1996 1997 1998 1999 2000 2001
Lbs.
Red meats2,3,4 113.4 111.2 113.5 113.6 111.0 109.0 113.2 115.1 113.7 111.3 Beef 62.4 61.0 62.9 63.5 64.0 62.6 63.6 64.3 64.5 63.1 Veal 0.8 0.8 0.8 0.8 1.0 0.8 0.7 0.6 0.5 0.5 Lamb & mutton 1.0 1.0 0.9 0.9 0.8 0.8 0.9 0.8 0.8 0.8 Pork 49.1 48.5 49.0 48.4 45.2 44.7 48.2 49.3 47.8 46.9Poultry2,3,4 60.4 62.0 62.6 62.1 63.1 63.1 63.7 66.7 66.9 66.2 Chicken 46.4 48.1 48.7 48.2 48.8 49.4 49.7 52.8 53.2 52.4 Turkey 14.0 13.9 13.9 13.9 14.3 13.6 13.9 13.8 13.7 13.8Fish and shellfish3 14.6 14.8 15.0 14.8 14.5 14.3 14.5 14.8 15.2 14.7
Eggs4 30.1 30.1 30.3 29.9 30.1 30.2 30.7 32.1 32.2 32.4Dairy products Cheese (excluding cottage)2,5 25.9 26.0 26.5 26.9 27.3 27.5 27.8 29.0 29.8 30.0 American 11.3 11.3 11.4 11.7 11.8 11.8 11.9 12.6 12.7 12.8 Italian 9.9 9.7 10.2 10.3 10.6 10.8 11.1 11.6 12.0 12.3 Other cheeses6 4.7 5.0 5.0 5.0 4.9 4.9 4.7 4.9 5.1 4.9 Cottage cheese 3.1 2.9 2.8 2.7 2.6 2.6 2.7 2.6 2.6 2.6
Beverage milks2 216.3 210.8 209.3 206.3 205.4 201.9 198.5 197.6 193.8 189.8 Fluid whole milk7 83.2 79.1 77.2 74.0 73.0 71.0 69.5 70.1 69.2 67.2 Fluid lower fat milk8 108.3 105.4 103.9 100.9 99.5 97.4 95.6 95.3 94.7 93.8 Fluid skim milk 24.8 26.3 28.2 31.4 32.9 33.5 33.4 32.2 29.9 28.8 Fluid cream products9 7.9 7.9 7.9 8.3 8.5 8.8 8.9 9.4 9.8 10.6 Yogurt (excluding frozen) 4.5 4.9 5.3 6.2 5.9 5.8 5.9 6.2 6.5 7.0 Ice cream 16.2 16.0 16.0 15.5 15.6 16.1 16.3 16.7 16.6 16.3 Lowfat ice cream10 7.0 6.9 7.5 7.4 7.5 7.8 8.1 7.5 7.3 7.3 Frozen yogurt 3.1 3.5 3.4 3.4 2.5 2.0 2.1 1.9 2.0 1.5 All dairy products, milk equivalent, milkfat basis11 562.6 569.3 579.7 576.2 566.2 567.2 572.4 584.6 592.8 587.2
Fats and oils--total fat content 66.4 69.1 67.3 65.4 64.2 63.7 64.3 67.0 74.5 -- Butter and margarine (product weight) 15.2 15.6 14.6 13.5 13.3 12.5 12.6 12.6 12.8 -- Shortening 22.3 24.9 23.9 22.2 21.9 20.5 20.5 21.1 23.1 -- Lard and edible tallow (direct use) 3.5 3.4 4.2 4.3 4.6 4.0 5.1 5.6 5.9 -- Salad and cooking oils 27.0 26.6 25.9 26.5 25.7 28.0 27.3 28.8 33.7 --
Fruits and vegetables12 676.8 687.8 691.2 690.6 700.5 708.4 696.7 698.3 705.4 688.7 Fruit 282.1 280.6 278.4 283.3 283.1 290.3 283.9 284.6 280.3 275.7 Fresh fruits 122.8 123.5 124.9 122.5 126.2 129.4 128.8 129.6 127.2 125.8 Canned fruit 22.8 20.5 20.7 17.3 18.5 20.1 17.0 19.2 17.5 17.7 Dried fruit 10.7 12.5 12.7 12.6 11.1 10.6 12.1 10.1 10.4 10.2 Frozen fruit 4.2 3.6 3.1 4.6 4.2 3.5 4.0 4.4 3.1 5.9 Selected fruit juices 121.1 120.1 116.6 126.0 123.0 126.1 121.6 120.8 121.6 115.8 Vegetables 394.6 407.2 412.8 407.2 417.4 418.0 412.9 413.7 425.1 412.9 Fresh 173.9 180.7 186.5 180.9 185.9 190.1 186.5 191.3 200.4 196.6 Canning 110.6 110.1 109.8 108.0 106.3 105.4 105.3 102.8 103.0 97.1 Freezing 70.5 75.3 77.5 78.8 83.3 81.5 80.4 80.9 79.6 78.2 Dehydrated and chips 31.4 33.4 30.7 30.9 33.9 32.7 32.5 30.6 33.8 33.3 Pulses 8.3 7.7 8.2 8.5 8.0 8.3 8.2 8.1 8.4 7.8Peanuts (shelled) 6.2 6.0 5.7 5.6 5.6 5.7 5.8 6.0 5.7 --Tree nuts (shelled) 2.2 2.3 2.3 1.9 1.9 2.1 2.2 2.5 2.5 2.2
Flour and cereal products13 184.6 189.1 191.8 190.2 196.2 197.3 194.2 195.5 199.8 195.7 Wheat flour 138.0 142.1 142.9 140.0 146.4 146.8 143.0 142.6 146.3 140.9 Rice (milled basis) 16.7 16.6 18.0 18.6 17.6 18.1 18.3 19.5 19.6 20.2Caloric sweeteners14 136.1 139.1 141.5 143.8 145.0 148.1 149.1 151.3 148.9 147.1Coffee (green bean equiv.) 10.0 9.0 8.1 7.9 8.7 9.1 9.3 9.8 10.3 9.4Cocoa (chocolate liquor equiv.) 4.5 4.3 3.8 3.6 4.2 4.0 4.3 4.5 4.7 4.5-- = Not available. 1. In pounds, retail weight unless otherwise stated. Consumption normally represents total supply minus exports, nonfood use, andending stocks. Calendar-year data, except fresh citrus fruits, peanuts, tree nuts, and rice, which are on crop-year basis. 2. Totals may not add due torounding. 3. Boneless, trimmed weight. 4. Excludes shipments to the U.S. territories. 5. Whole and part-skim milk cheese. Natural equivalent of cheese and cheese products. 6. Includes Swiss, Brick, Muenster, cream, Neufchatel, Blue, Gorgonzola, Edam, and Gouda. 7. Plain and flavored8. Plain and flavored, and buttermilk. 9. Heavy cream, light cream, half and half, eggnog, sour cream, and dip. 10. Formerly known as ice milk. 11. Includes condensed and evaporated milk and dry milk products. 12. Farm weight. 13. Includes rye, corn, oats, and barley products. Excludesquantities used in alcoholic beverages, corn sweeteners, and fuel. 14. Dry weight equivalent. Source: USDA, May 2003

6
three major categories—fish/shellfish, fruits/juices/nuts, vegetables—each of which shows a large and rapidly increasing share of total food imports, especially in value terms.
Table 2. Import shares of United States food consumption for major categories by weight1
Source: Jerardo 2003.
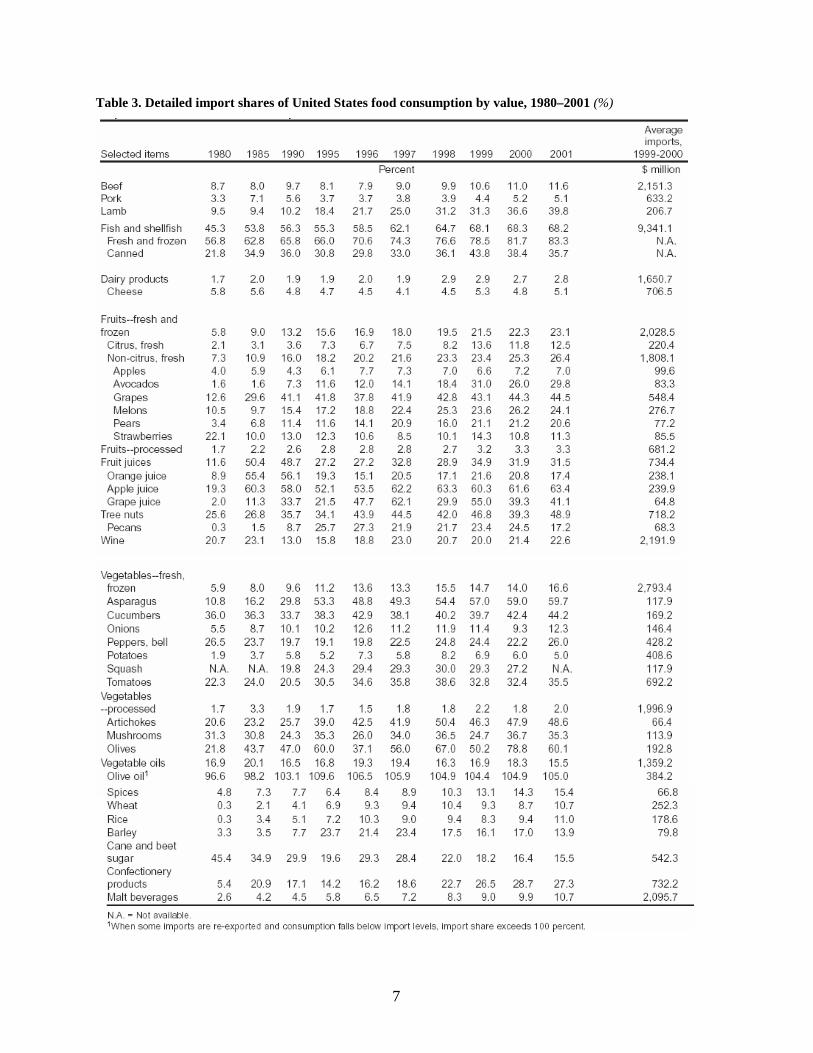
The value of imports of fish and shellfish in 1999–2000 averaged $9.3 billion (table 3). Between 1980 and 2000, the fish/shellfish share of food consumption value jumped more than 11 percentage points each decade, from 45.3 percent to 68.3 percent in 2001. Edible fish and seafood products have also had a large and gradually increasing share of all U.S. agricultural imports: 13.8 percent by value in 1998, 15.4 percent in 2000, and 14.7 percent in 2002.9 Most shrimp consumed in the United States falls within the “fresh and frozen” fish and shellfish category, for which the import share of food consumption value rose dramatically between 1980 and 2001, from 56.8 percent to 83.3 percent.
The import value of fresh and frozen fruits averaged $2 billion in 1999–2000. Of this total, $220 million represented citrus items and $1.8 billion represented non-citrus products. The import share for fresh citrus in food consumption value rose six-fold between 1980 and 2001, from 2.1 percent to 12.5 percent. Meanwhile the share for fresh non-citrus nearly quadrupled, from 7.3 percent to 26.4 percent. Table grapes and melons were the top performers by far, followed by apples, strawberries, avocadoes, and pears. Fruit juice imports also gained market share during these two decades, up from 11.6 percent to 31.5 percent, amounting to $734 million by 1999–2000. Other processed fruit rose as well, from 1.7 percent of all food consumption value to 3.3 percent.
9 See BICO report from Department of Commerce data for CY1998–2002, included as appendix 1.
7
Table 3. Detailed import shares of United States food consumption by value, 1980–2001 (%)

8
Import shares for most vegetables also increased dramatically between 1980 and 2001. For the fresh and frozen vegetable category as a whole, the share of food value nearly tripled, from 5.9 percent to 16.6 percent, culminating in $2.8 billion worth of imports in the years 1999 and 2000. Tomatoes were the leading performer. Bell peppers and potatoes formed a second tier, while cucumbers, onions, asparagus, and squash form a third tier. The processed vegetable category experienced slower growth, with an import share of 2.0 percent in 2001, as compared with 1.7 percent in 1980, but the absolute value of processed vegetable imports remained significant at $1.997 billion.
Actually, every product group listed in table 3 showed an increase in share of U.S. consumption, in some cases, as high as 500 percent over the 20-year period. Given these trends, observers generally agree that, despite a positive agricultural trade balance that stretches back more than 40 years, the United States is on the way to becoming a net agricultural importer. U.S. agricultural exports are expected to increase by approximately $500 million in the current fiscal year, to approximately $56.5 billion, while imports will grow as much as $3.5 billion to approximately $47.5 billion. "We can see this gap narrowing," Purdue University agricultural economist Phil Paarlberg said in a recent interview. "Where we were looking at an agricultural trade surplus five or six years ago of $15 billion to $20 billion, now it's under $10 billion." Although the trade gap was similar in the mid-1980s, the United States has not been a net agricultural importer since 1959. If the present trend continues, U.S. agricultural imports could overtake exports by 2007.10
Before focusing on the matter of standards, the authors set the stage by examining overall trends in origin, volume, value, and presentation for the selected product categories.
Seafood Imports: Spotlight on Shrimp
The authors selected shrimp for detailed consideration for various reasons. It is a major export product for many developing countries with which the World Bank works. Overall volume and value of U.S. imports are both increasing rapidly. Average unit value remains very high, although it has been declining over time as increasing supply drives down prices. Finally, shrimp presents significant challenges in terms of standards, especially with respect to production practices and sanitary compliance.
Table 4. US imports of fish products from all countries, 1999–2003 (US$000)
Product 1999 2000 2001 2002 2003 Fish and seafood products, edible
8,884,945 9,903,575 9,688,548 9,989,703* 10,892,941*
Shrimp 3,144,128 3,759,731 3,627,720 3,425,671 3,763,302*
Tuna 755,335 640,479 664,332 697,821 806,889*
Lobster 724,084 879,332 827,649 930,824* 742,521 Groundfish, fillet/steak 674,057 589,193 478,603 545,402 504,824 Salmon, whole or eviscerated 344,909* 333,161 323,726 343,176 323,914 Other edible fish and seafood 3,242,432 3,701,679 3,766,517 4,046,808 4,498,145*
Source: US Bureau of Census, Trade Data. Note: * = highest import levels since at least 1970. Shrimp has long been the leading contributor to U.S. seafood imports, boasting a 35.9 percent share of total seafood import value for the 5 years from 1999 to 2003 (table 4). The total value of shrimp imports has averaged $3.5 billion over the last 5 years, starting out at $3.1 billion and rising to a new record of $3.8 billion in 2003. Although the 5-year growth in value from 1998 to 2002 averaged approximately 7 percent, 2003 showed a surge of 11.2 percent. Import prices fell 29 percent between 2000 and 2002, and continued to fall throughout most of 2003, at which point wholesale prices fell to their lowest level in 40
10 “U.S. Heads toward Net Food Imports,” The Associated Press, September 26, 2003.

9
years.11 The sluggish economy and oversupply were the main reasons for the decline in average unit price.
The volume of U.S. shrimp imports rose steadily between 1999 and 2003, with a 52 percent overall growth that equates to an annual average increase of approximately 11 percent (table 5).12 Declining prices certainly stimulated more effective demand; yet industry insiders attribute the volume increase more to supply push. Throughout this period, the Thai shrimp export industry continued to grow; Chinese shippers responded to the 2001 EU import ban by turning more toward the United States market; shrimp farming continued to expand in Brazil; and shrimp aquaculture in Ecuador began to recover from virus problems.13
Table 5. Volume of US imports of fish products from all countries (MT)
1999 2000 2001 2002 2003 2002–03 % change
Other seafood 757,963 818,709 882,394 950,269 1,025,747 7.94 Shrimp 332,421 345,526 400,779 429,794 504,862 17.47 Tuna 308,808 269,753 231,974 246,821 297,750 20.63 Groundfish 185,980 178,193 140,578 157,822 150,552 -4.61 Salmon, whole 70,629 68,553 72,140 82,569 73,777 -10.65 Lobster 40,952 47,268 46,384 50,660 50,238 -0.83
Total 1,696,753 1,728,003 1,774,248 1,917,935 2,102,926 9.65 Source: USDA Trade Database, Bureau of Census data.
Perceiving these trends as a significant threat, in October 2002, prominent representatives and supporters of the Gulf and Atlantic Coast wild shrimp harvest, processing, and distributing industry from eight states formed the Southern Shrimp Alliance (SSA) to lobby for protection.14 Ironically, the prospect of a possible antidumping action by SSA caused foreign imports to accelerate in the third and then the fourth quarters of 2003 in anticipation of the possibility of retroactive penalties. The 17.5 percent growth in volume for 2003 led to a problem of oversupply and low prices.
At the very end of 2003, the SSA’s Shrimp Trade Action Committee actually filed the long-awaited antidumping petition with the Department of Commerce against Brazil, China, Ecuador, India, Thailand, and Vietnam.15 The petition alleges a dumping margin of between 27 percent and 267 percent on frozen and canned warm water shrimp (whether wild or farmed). The Commerce Department agreed on January 24, 2004 to investigate the allegations. On February 17, the US International Trade Commission (ITC) voted unanimously that there was a “reasonable indication that all six exporting countries had harmed or threatened local industry.” This vote meant that antidumping investigations would proceed, leading to a preliminary finding on June 8, 2004. If that were positive, a dumping margin would be determined Antidumping tariffs ranging from 58 percent for Thailand to 349 percent for Brazil could be imposed by mid-October 2004.16 Since some other major interest groups, such as the American Seafood Distributors Association (ASDA) and Global Aquaculture Alliance (GAA), opposed the petition, there was considerable uncertainty concerning what the U.S. Government ultimately would find and then do, as well as the final impact on industry and trade.
11 http://www.hotel-online.com/News/2003_Dec_31/p.403.1072895255.html. 12 NOAA, Imports and Exports of Fishery Products, Annual Summaries 1998 to 2002. Fisheries Economics and Statistics Division, National Marine Fisheries Service. 13 FAO, “China, Vietnam and Brazil Increase Share of US Shrimp Market,” Infopesca, August 2003. 14 http://www.shrimpalliance.com/about_us.htm. 15 http://www.olemiss.edu/orgs/SGLC/cnews.html#alliance. 16 http://www.accessnorthga.com/news/ap_newfullstory.asp?ID=29812.

10
Table 6. Shrimp import shares by form and presentation (US$)
Product name Imports
($) Exports
($) Re-exports
($) Balance of trade
($) Shrimp peeled frozen 1,123,280,867 19,355,730 16,162,502 -1,087,762,635 Shrimp frozen other preparations 663,860,778 0 0 -663,860,778 Shrimp shell-on frozen 31/40 311,370,229 3,704,441 4,878,866 -302,786,922 Shrimp shell-on frozen 15/20 283,456,742 2,141,644 1,650,567 -279,664,531 Shrimp shell-on frozen < 15 294,266,104 12,106,708 13,866,692 -268,292,704 Shrimp shell-on frozen 26/30 252,609,086 955,411 352,446 -251,301,229 Shrimp shell-on frozen 21/25 245,428,590 1,332,324 1,392,584 -242,703,682 Shrimp shell-on frozen 41/50 158,013,006 1,666,543 481,777 -155,864,686 Shrimp shell-on frozen 51/60 134,783,868 5,340,919 426,123 -129,016,826 Shrimp shell-on frozen 61/70 89,419,460 232,901 284,267 -88,902,292 Shrimp shell-on frozen > 70 82,709,076 5,752,328 228,648 -76,728,100 Shrimp breaded frozen 51,928,647 0 0 -51,928,647 Shrimp peeled fresh/dried/salted/brine 17,112,124 0 0 -17,112,124 Shrimp other preparations 30,807,545 12,692,551 1,236,582 -16,878,412 Shrimp frozen in ATC 11,316,219 1,332,006 137,182 -9,847,031 Shrimp shell-on fresh/dried/salted/brine 2,756,284 0 0 -2,756,284 Shrimp live/fresh/dried/salted/brine 0 5,454,739 757,698 6,212,437 Shrimp canned 7,330,554 19,435,699 479,307 12,584,452 Shrimp frozen 0 13,736,999 9,721,797 23,458,796 Totals 3,760,449,179 105,240,943 52,057,038 -3,603,151,198 Source: Foreign Trade Information, National Marine Fisheries Service, http://www.st.nmfs.gov/st1/trade/index.html.
U.S. shrimp imports actually originate in many different countries: 65 in total in 2003 (appendixes 1 and 2). Thailand stands far above the rest, with nearly a billion dollars in 2003 value and more than 133,000 MT in volume. China, India, and Vietnam form a second tier, each with $400–$600 million in value, and 40,000–80,000 MT in volume. Mexico, Ecuador, and Indonesia constitute a third tier, each with $150–200 million in export value and 20,000–35,000 MT in annual volume. In effect, the recent antidumping petition targeted the first and second tier, except for Mexico.
Shrimp imports take on various forms (table 6). The main presentation is frozen, shell-on shrimp of various sizes, amounting to 41 percent of value. Peeled and frozen shrimp is the next most important presentation, representing nearly 30 percent of value. “Other frozen preparations” follow, with approximately 18 percent of value. At the other extreme, canned shrimp accounted for just 0.19 percent of value.
Thailand predominates in many market segments: frozen, breaded shrimp; canned shrimp; shrimp frozen in ATC17; other frozen preparations; other preparations; peeled and frozen; and frozen shell-on of 26/30 and 31/40 size. As of 2002, China was the leader in shrimp that was fresh/dried/salted/brined, and in frozen shell-on 41/50 count shrimp. Mexico is the leading supplier of 21/25 frozen shrimp with shell, while Ecuador leads in 61/70 count shrimp, and Brazil in the very small 70+ count frozen shrimp with shell. Meanwhile, India has the lead in very large shrimp, that is, fewer than 15 counts.
Fresh Produce Imports: Spotlight on Selected Fruits and Vegetables
In addition to shrimp, this report will also consider certain horticultural exports: cantaloupe, mangos, red raspberries, asparagus, and snow peas. These particular crops were selected for close analysis for several
17 ATC is the enzyme, aspartate transcarbamylase.

11
reasons. They are all important export products for more than one of the developing countries with which the World Bank works. Overall volume and value of U.S. imports is increasing for each item. Although unit values are generally declining (as seasonal windows fill in), they still remain high. Most importantly, each one of these products presents significant challenges in terms of standards–especially sanitary or phytosanitary. To set the stage, we quickly review the supply and demand situation for each of the selected crops.
U.S. Supply, Demand, and Use of Cantaloupe
In the last 10 years, per capita use for cantaloupes in the United States rose 27 percent (approximately 2.5 percent per year), from 8.6 pounds to approximately 11 (table 7). Consumption has risen 70 percent over the past 20 years. Rising disposable income, ethnic diversity, and health consciousness all have played a role in this demand growth. From the supply side, varietal improvement, year-round availability, and promotion have been important factors. Domestic production rose 23 percent between 1993 and 2003, from 1.9 billion pounds to 2.3 billion. Yet, over the same period, import volume more than doubled from 498 million pounds to 1.1 billion, which meant a major increase in market share.
Varietal improvements, increased scale, investment in drip irrigation, more sophisticated post-harvest handling, and more efficient sea transport have all helped Central American growers, shippers, and exporters to effectively satisfy the winter window from November through early April. Until a salmonella ban (to be examined later) occurred in late October 2002, Mexico also continued to increase early season supplies, especially from March through May. The disparity between domestic and import growth rates caused the import share of available supply to rise from 19 percent to 33 percent in the last decade.
The value of cantaloupe imports rose steadily for most of the past two decades, but it peaked in 2001 at approximately $161 million, and then dropped back to $140 million in 2002 and to $116 million in 2003. The upward trend stalled in 2002 and 2003 due to Mexico’s SPS difficulties (table 8).
Table 7. US cantaloupes: supply, utilization, and price, farm weight, 1978-2003
Supply Utilization Per
Year Production Imports Total Exports Domestic capita 1/ 2/ 2/ use
-- Million pounds -- Pounds
1990 1,856.7 530.3 2,387.0 78.8 2,308.1 9.2 1991 1,664.0 602.5 2,266.5 75.7 2,190.8 8.6 1992 1,811.1 481.9 2,293.0 115.9 2,177.1 8.5 1993 1,898.7 458.1 2,356.8 116.2 2,240.7 8.6 1994 1,795.7 523.9 2,319.6 112.7 2,206.9 8.4 1995 1,896.2 613.1 2,509.3 118.1 2,391.3 9.0 1996 2,157.2 740.8 2,898.0 126.8 2,771.2 10.3 1997 2,084.0 921.6 3,005.6 134.4 2,871.2 10.5 1998 2,149.2 938.6 3,087.8 144.0 2,943.8 10.7 1999 2,257.7 1,108.1 3,365.8 153.9 3,211.9 11.5 2000 r 2,096.5 1,119.2 3,215.7 155.5 3,060.2 10.8 2001 r 2,271.8 1,070.1 3,341.9 146.0 3,195.9 11.2 2002 2,304.6 1,108.6 3,413.2 156.1 3,257.1 11.3 2003 f 2,230.0 1,090.0 3,320.0 155.0 3,165.0 10.9 -- = Not available. r= Revised. f = ERS forecast.
1/ Source: National Agricultural Statistics Service, USDA. 2/ Source: Bureau of the Census, U.S. Dept. of Commerce.

12
Mexico was the largest foreign source of cantaloupes until 2001. Mexican imports peaked in 1999 at $71.8 million, with a volume of 196,802 MT. Since then, however, its imports have fallen precipitously, to $17.5 million in value and 58,714 MT in volume in 2002, and then an additional drop of 85 percent in annual value and 89 percent in annual volume for 2003. The ongoing decline is attributable to the salmonella findings explained later.
As the problem began to emerge, Central America producers ramped up late-season production to fill the void left by Mexico. However, uncertainty concerning the rate of FDA re-approval of individual Mexican shippers together with the normal onset of the Central American rainy season in May appear to have prevented full recovery of past import volume and value. Yet, cantaloupes remain an important fruit product for the U.S. market, particularly among imports.
Table 8. U.S. Imports of fresh cantaloupe by value (US$ 000)
Countries of origin 1998 1999 2000 2001 2002 2003 Costa Rica 22,022 26,701 32,209 50,130 43,324 30,924 Dominican Republic 3,735 5,288 4,894 5,180 5,639 4,139 Guatemala 21,139 32,928 41,031 35,858 52,926 52,578 Honduras 19,260 16,988 18,434 22,941 20,079 24,784 Mexico 57,000 71,783 49,465 46,386 17,547 2,727 Others 800 605 1,140 454 470 881 Total 123,956 154,293 147,173 160,949 139,985 116,033
Source: USDA Foreign Agricultural Service.
U.S. Supply, Demand, and Use of Mangos Mango consumption has been increasing steadily for the past two decades (table 9). It doubled between 1980 and 1986, again between 1986 and 1994, and yet again between 1994 and 2002, when it reached 1.97 pounds per capita. Although the absolute number is still modest, such growth rates in fresh produce are very unusual.
As with cantaloupes, both demand and supply factors are at play. On the one hand, rapid growth in various ethnic segments (especially Latin, Asian and Caribbean) of the U.S. population has been accompanied by greater familiarity with and demand for mangos and other tropical fruits such as papaya. Other segments of the population have come to know and appreciate mangos through travel and the food media. On the supply side, growth in exportable volume from many different countries—but especially Brazil, Costa Rica, Ecuador, Guatemala, Haiti, Mexico, and Peru—has pushed product into the system and brought prices down even in past periods of scarcity, such as early September through Thanksgiving. A critical factor in this expansion from abroad was approval by USDA/APHIS of the hot water treatment as a plant quarantine treatment. to control fruit flies, especially the Mediterranean fruit fly.
U.S. domestic production of mangos, which had long been limited to Hawaii, Florida, and Puerto Rico, held its own until 1992, when Hurricane Andrew destroyed many trees in the Homestead area of South Florida. Since then the domestic industry has languished. It is not likely to recover because of land use pressure and the abundance of inexpensive fruit from Mexico and Puerto Rico during Florida’s summer production season.

13
Import volume tripled between 1980 and 1990, and tripled again by 2000, at which point it reached 518 million pounds. Mango imports continue to increase in volume at approximately 10 percent per year. Given demographic trends and changing consumer preferences, the future is bright for mango imports, as long as there are no major SPS issues that might constrain offshore supply. As will be explained later, fruit fly findings remain a serious threat.
During the 1998–2002 timeframe, volume increased 33 percent, from 197,393 MT to 263,348 MT (table 10). The value of mango imports reached $153 million in 2002, up 16 percent from the $132 million level 5 years earlier. Eleven-month figures for 2003 suggest a 5.4 percent rise in total annual value, coupled with a 6.1 percent increase in volume. The share of U.S. import value held by Mexico continues to be very large–53 percent in 2002–but has fallen from the 78 percent share 5 years back. Meanwhile, Mexico’s share of import volume has fallen from 81.8 percent to 62.3 percent. Increases in fall and winter season exports from South American countries are eroding Mexico’s share of market. Value is more affected than volume, because off-season imports from South America have average unit values 2 to 4 times higher than Mexico’s.
Table 9. Fresh mangos: supply and utilization, 1980 to date
Supply Utilization Year Consumption
Utilized production Import s 1/ Total supply Exports 2/ Total Per capita -- Million pounds -- Pounds
1990 19.3 130.5 149.7 15.8 133.9 0.54 1991 27.5 203.6 231.1 15.2 215.9 0.85 1992 22.0 167.9 189.9 17.1 172.8 0.67 1993 3/ 2.8 243.9 246.7 14.9 231.7 0.89 1994 5.5 271.4 276.9 21.7 255.1 0.97 1995 8.3 312.4 320.6 22.2 298.4 1.12 1996 5.5 378.3 383.8 22.9 360.9 1.34 1997 5.5 411.3 416.8 25.2 391.6 1.44 1998 N.A. 435.2 435.2 23.2 412.0 1.49 1999 N.A. 483.1 483.1 29.8 453.3 1.62 2000 N.A. 518.3 518.3 23.3 495.0 1.75 2001 N.A. 524.6 524.6 14.6 510.0 1.79 2002 4/ N.A. 580.7 580.7 11.8 568.9 1.97 N.A.= Not available. 1/ Imports 1989 - 92 include small amounts of fresh guava. 2/ Before 1981, mango, papaya, and kiwifruit exports were reported together; 1984 - 88 assume mangos 75 percent of "other fruit" exports; 1989 - 92 exports include mangosteens and guavas. 3/ Reflects tree losses due to Hurricane Andrew in August 1992. 4/ Preliminary. Source: Economic Research Service, USDA.

14
Table 10. U.S. imports of fresh mangos by value (US$ 000)
Countries of Origin 1998 1999 2000 2001 2002 2003 Brazil 7,013 11,666 13,622 21,355 28,693 27,897 Ecuador 4,056 6,709 9,911 8,571 10,333 8,151 Guatemala 4,485 4,250 4,257 4,068 4,788 3,644 Haiti 5,439 6,701 7,111 3,465 5,493 4,412 Mexico 103,236 98,429 88,702 100,194 81,215 90,433 Nicaragua 2,490 1,067 2,174 1,982 1,242 2,006 Peru 4,477 12,962 13,383 15,780 19,885 15,980 Others 1,007 1,204 1,592 1,269 1,356 1,269 Total 132,203 142,988 140,752 156,684 153,005 153,792
Source: Department of Commerce, US Census Bureau, Foreign Trade Statistics. Note: Data for 2003 is January to November.
U.S. Supply, Demand, and Use of Asparagus Per capita use of asparagus in all its forms rose 30 percent between 1987 and 2003, or from 1.0 to 1.3 pounds. However, during this 15-year period, the consumption of canned asparagus actually fell, and the consumption of frozen asparagus stagnated. Meanwhile, fresh use has increased rapidly, from 0.6 pounds per capita to 1.0 pounds.
Reliable supplies of good quality from offshore sources are the main explanation. Fresh asparagus is now available year-round, and retail prices have begun to fall even from August through December, when most product must be shipped from South America either by air or in controlled atmosphere sea containers.
Domestic production for fresh use began to stagnate in the late 1980s, and during the early 1990s actually fell for approximately 5 years (table 11). Starting around 1990, foreign imports began to rise, accelerating greatly during the latter 1990s and into the new millennium. Imports almost doubled in volume between 1990 and 1995, then again between 1995 and 2000. Meanwhile, U.S. export volume declined in the 1990s and beyond, largely because of the recession associated with the Asian financial crisis.
Table 11. US asparagus: supply, utilization, and price, farm weight, 1978-2003
Supply Utilization Year Per
Production Imports Total Exports Domestic capita 1/ 2/ 2/ use
-- Million pounds -- Pounds
1990 142.4 43.8 186.2 39.4 146.8 0.6 1991 137.0 52.4 189.4 37.2 152.2 0.6 1992 137.6 57.7 195.3 42.3 153.0 0.6 1993 125.2 69.3 194.5 46.9 147.6 0.6 1994 131.1 64.8 195.9 48.5 147.4 0.6 1995 110.0 79.1 189.1 40.7 148.4 0.6 1996 111.4 76.1 187.5 31.7 155.8 0.6 1997 124.8 88.6 213.4 33.6 179.8 0.7 1998 126.4 109.8 236.2 34.4 201.9 0.7 1999 145.5 142.3 287.8 38.1 249.7 0.9 2000 r 150.4 159.4 309.8 36.6 273.2 1.0 2001 r 137.2 157.0 294.2 31.6 262.6 0.9 2002 126.7 180.3 307.0 29.3 277.7 1.0 2003 f 115.0 195.0 310.0 31.0 279.0 1.0 -- = Not available. r = Revised. f = ERS forecast. 1/ Source: National Agricultural Statistics Service, USDA. 2/ Source: Bureau of the Census, U.S. Department of Commerce.
15
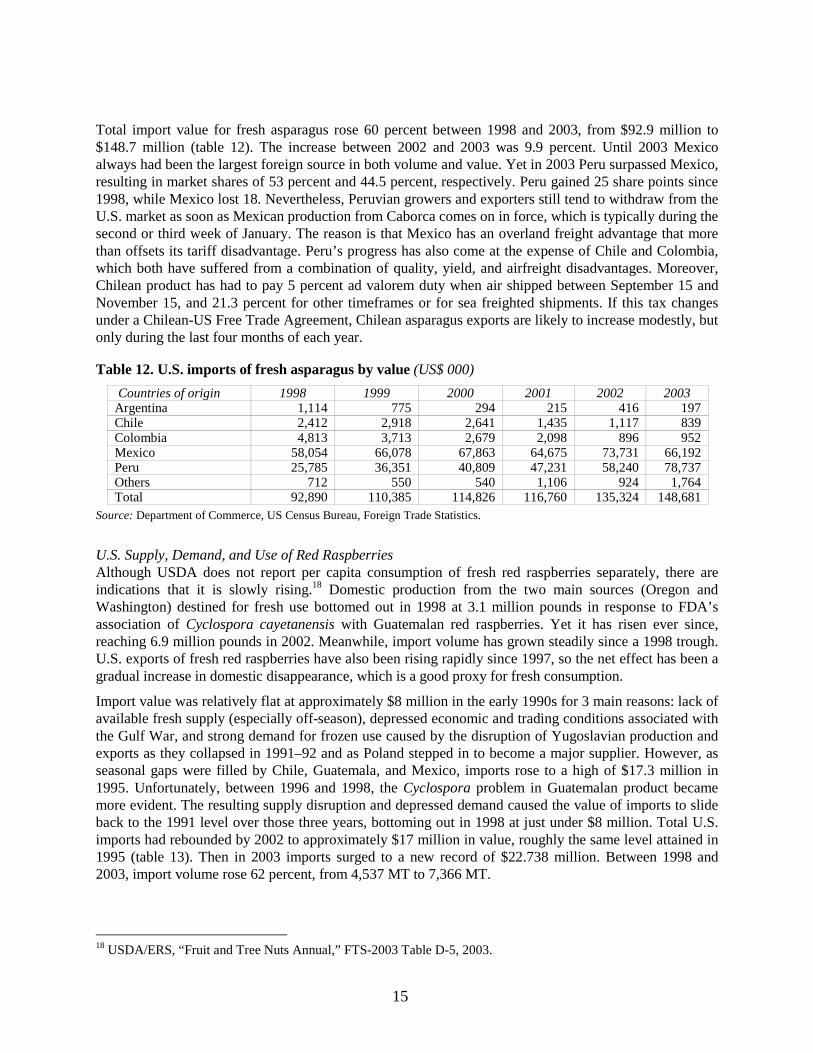
Total import value for fresh asparagus rose 60 percent between 1998 and 2003, from $92.9 million to $148.7 million (table 12). The increase between 2002 and 2003 was 9.9 percent. Until 2003 Mexico always had been the largest foreign source in both volume and value. Yet in 2003 Peru surpassed Mexico, resulting in market shares of 53 percent and 44.5 percent, respectively. Peru gained 25 share points since 1998, while Mexico lost 18. Nevertheless, Peruvian growers and exporters still tend to withdraw from the U.S. market as soon as Mexican production from Caborca comes on in force, which is typically during the second or third week of January. The reason is that Mexico has an overland freight advantage that more than offsets its tariff disadvantage. Peru’s progress has also come at the expense of Chile and Colombia, which both have suffered from a combination of quality, yield, and airfreight disadvantages. Moreover, Chilean product has had to pay 5 percent ad valorem duty when air shipped between September 15 and November 15, and 21.3 percent for other timeframes or for sea freighted shipments. If this tax changes under a Chilean-US Free Trade Agreement, Chilean asparagus exports are likely to increase modestly, but only during the last four months of each year.
Table 12. U.S. imports of fresh asparagus by value (US$ 000)
Countries of origin 1998 1999 2000 2001 2002 2003 Argentina 1,114 775 294 215 416 197 Chile 2,412 2,918 2,641 1,435 1,117 839 Colombia 4,813 3,713 2,679 2,098 896 952 Mexico 58,054 66,078 67,863 64,675 73,731 66,192 Peru 25,785 36,351 40,809 47,231 58,240 78,737 Others 712 550 540 1,106 924 1,764 Total 92,890 110,385 114,826 116,760 135,324 148,681
Source: Department of Commerce, US Census Bureau, Foreign Trade Statistics.
U.S. Supply, Demand, and Use of Red Raspberries Although USDA does not report per capita consumption of fresh red raspberries separately, there are indications that it is slowly rising.18 Domestic production from the two main sources (Oregon and Washington) destined for fresh use bottomed out in 1998 at 3.1 million pounds in response to FDA’s association of Cyclospora cayetanensis with Guatemalan red raspberries. Yet it has risen ever since, reaching 6.9 million pounds in 2002. Meanwhile, import volume has grown steadily since a 1998 trough. U.S. exports of fresh red raspberries have also been rising rapidly since 1997, so the net effect has been a gradual increase in domestic disappearance, which is a good proxy for fresh consumption.
Import value was relatively flat at approximately $8 million in the early 1990s for 3 main reasons: lack of available fresh supply (especially off-season), depressed economic and trading conditions associated with the Gulf War, and strong demand for frozen use caused by the disruption of Yugoslavian production and exports as they collapsed in 1991–92 and as Poland stepped in to become a major supplier. However, as seasonal gaps were filled by Chile, Guatemala, and Mexico, imports rose to a high of $17.3 million in 1995. Unfortunately, between 1996 and 1998, the Cyclospora problem in Guatemalan product became more evident. The resulting supply disruption and depressed demand caused the value of imports to slide back to the 1991 level over those three years, bottoming out in 1998 at just under $8 million. Total U.S. imports had rebounded by 2002 to approximately $17 million in value, roughly the same level attained in 1995 (table 13). Then in 2003 imports surged to a new record of $22.738 million. Between 1998 and 2003, import volume rose 62 percent, from 4,537 MT to 7,366 MT.
18 USDA/ERS, “Fruit and Tree Nuts Annual,” FTS-2003 Table D-5, 2003.

16
Table 13. U.S. imports of fresh red raspberries by value (US$ 000)
Countries of origin 1998 1999 2000 2001 2002 2003 Canada 3,315 7,102 3,473 5,131 3,115 4,088 Chile 1,485 1,568 1,046 2,321 4,720 4,766 Mexico 2,994 4,319 8,718 6,857 8,864 13,741 Others 167 308 278 191 640 143 Total 7,961 13,297 13,515 14,500 17,339 22,738
Source: Department of Commerce, US Census Bureau, Foreign Trade Statistics.
Import shares have changed considerably over time because of the changes just described. Mexico was number two in value until 2000, at which point it overtook Canada. Canada remains the volume leader, but not by much. In 2003 Mexico had a 60 percent share of import value, while Chile’s share was 25 percent and Canada’s was 17 percent. Mexico has been the industry leader, achieving a 43 percent jump in import value between 2003 and 2002. Meanwhile export value for Chile has remained flat. After Guatemala was subjected to an FDA ban in late 1997, its market share fell immediately to zero, bounced back slightly by 2002 to 3.7 percent, then fell again in 2003.
U.S. Supply, Demand, and Use of Snow Peas Snow peas, a flat edible pea pod containing immature seeds, are a specialty vegetable traditionally used in Chinese cuisine. However, they are increasingly sold in supermarkets in loose form or in consumer packs, and are now found in many frozen vegetable blends. USDA statistics combine snow peas with sugar snaps, which are sweeter and have more developed seeds that provide a robust rather than flat shape. Notwithstanding their perceived popularity, fresh consumption of snow peas and sugar snaps has actually stayed flat in the United States over the past decade or more, at just 0.15 pounds per capita. Whatever growth in total product consumption has occurred probably applies more to their use in frozen vegetable mixes than in fresh form.
While domestic production has varied between 24–30 million pounds for more than a decade, imports have long predominated. Imports have grown steadily in the past five years, from 14,125 MT in 2000 to 24,079 MT in 2003, which gives imports approximately a two-thirds market share of this commodity.
Import value in 1998 amounted to $18.1 million, while in 2003 it was $19.3 (table 14). Given the 63 percent increase in volume over that same period, it is evident that average unit values have fallen considerably, and are now in the $7.00/10-lb box (CIF) range.
Table 14. U.S. imports of fresh edible pea pods by value (US$ 000)
Countries of origin 1998 1999 2000 2001 2002 2003 Guatemala 5,117 3,804 4,271 5,644 5,930 7,834 Mexico 11,934 12,554 8,197 8,136 9,429 8,168 Peru 501 1,022 1,602 1,543 2,817 2,796 Others 515 210 130 244 129 453 Total 18,067 17,590 14,200 15,567 18,305 19,251
Source: Department of Commerce, US Census Bureau, Foreign Trade Statistics.
Guatemala has long been the volume leader among snow pea suppliers to the U.S. market, boasting almost 49 percent more exports than Mexico in 2002 and triple the volume in 2003. Mexico remains the leader in terms of value, but by 2003 both countries were converging on the $8 million level, with Guatemala’s value rising and Mexico’s falling. It is important to note as well that Peru has significantly increased its exports in recent years, from just 227 MT worth $500,000 in 1998, to 2,083 MT worth $2.8 million in 2003. Peru has some agro-climatic advantages over Guatemala and Mexico in the months of September and October.
17
2. Standards Applicable to Imported Food
Definitions The technical definitions of “standard” vary widely. Here are some examples:
International Organization for Standardization: “rules, guidelines, or characteristics for activities or their results, aimed at achievement of the optimum degree of order in a given context”
British Standards Institution: “published specifications that establish a common language, and contain a technical specification or other precise criteria and are designed to be used consistently, as a rule, a guideline, or a definition”
Codex Alimentarius: “requirements for food aimed at ensuring for the consumer a sound, wholesome food product free from adulteration, correctly labeled and presented.”
As will become clear from the discussion below, even the last definition is too narrow, given the way the food and agricultural industry is evolving worldwide. Consumers are not the only stakeholder group. Not only the product itself, but also the procedures used to produce, handle, transform, and market it, are of interest. The circumstances surrounding production and marketing are also of interest to some stakeholders. Pests or diseases that might accompany imported food are of great interest to farmers in target markets.
Purposes
Standards can provide benchmarks by which to measure attributes of interest. When used in this manner, typically, they either set minimal acceptable levels, or else aspirational targets. Quantitative measures are customarily used for most standards of this kind. Yet, increasingly, standards are also being used to ensure responsible practices, more broadly defined. In such situations, qualitative judgments by an independent, respected observer are usually the main means of measurement and verification.
Tangible vs. Intangible Standards
Standards may be either tangible or intangible, depending on whether the attributes in question can be measured by examining the product itself or not. For example, a pesticide residue standard is tangible, while a minimum preharvest interval (PI) for applying a given pesticide is not. Intangible standards are not evident to the buyer or consumer, who therefore suffers from imperfect information (not knowing whether he/she is getting what is expected). The marketability of “credence goods” may benefit from, or even require, independent certification. This service is typically provided by an objective, qualified third party who is viewed as credible by the stakeholders. The third party may be governmental or private.
Degree of Voluntarism
Standards may be compulsory, advisory, voluntary, or involuntary. Compulsory standards are most often set by public law, decree, or regulation; and they are also usually enforced by governmental agencies (or their contractors). Typically, they carry penalties for noncompliance. Examples include food labeling controlled by FDA for purposes of product identification, nutritional information, or country-of-origin; quality grades for certain agricultural products governed by USDA Agricultural Marketing Orders; and condition standards for fresh produce defined and administered under the United States’ Perishable Agricultural Commodities Act.

18
Advisory standards may be issued by government or private enterprise. When issued by a regulatory agency, they may indicate a desired direction, foreshadow a future mandatory standard, or simply reflect the reality that a definitive standard cannot be finalized at that time. A good example is the FDA’s “Guide to Minimize Microbial Food Safety Hazards for Fresh Fruits and Vegetables.”19 Via this document, FDA in effect recognized that there was an issue of great concern, but fell short of requiring formal application of HACCP, which the fresh produce industry did not consider feasible because of the diversity of products, forms, presentations, sources, and pest/disease/pathogen problems.
Voluntary standards are more often set and applied by suppliers, handlers, processors, marketers, or other actors in the farm-to-market chain. Such standards are generally established to limit risk or to add value through quality improvement, differentiation, or supply management. Examples in food products include designation as “pesticide-free”; use of quality seals; differentiation via branding; sorting by size; and classifications such as “premium,” “select,” “gourmet,” or “fancy.” Voluntary standards are usually self-enforced, whether by the producer, the middleman, or the marketer. However, the use of third-party private certification is increasing.
Involuntary standards fall between these two extremes. When a voluntary standard really gains traction in a given deal (product/market combination), it can become so compelling in terms of maintaining market access or competitive position in a given supply chain that industry actors must treat it as mandatory even though it is not. Examples include slotting allowances commonly paid to introduce new products into supermarkets, and the use of PLU (product look-up stickers) on individual pieces of fruit.
Types of Standards
While many discussions of standards draw a distinction only between product and process, the standards arena is actually much more complicated than that. For this analysis, the authors prefer to differentiate between four types rather than just two.
Outcome standards are concerned with the situation expected at a given stage in the supply chain.20 When a product has been recently harvested, it has certain quality attributes that can be used as standards. Depending on the product, these may include size, shape, deformity, style, pulp temperature, ripeness, maturity, color, sugar (Brix) level, organoleptic traits (taste, sight, and smell), chemical residues, or presence of pests or diseases. These same attributes may also be used at the packing shed or processing plant as standards for product quality, along with additional ones such as firmness, cosmetic appearance, filth, extraneous matter, decomposition, conformity to count, and gross and net weight. Outcome standards relating to markings (PLU sticker, UPC code, labeling), packaging (type, material, protection against bruising), packing (count per box, use of gel packs), and palletizing may be specified for all products that leave a facility. As the product moves into channels, defects of condition such as percentage of product broken, crushed, or decayed; absence of post-harvest disease; internal temperature; and integrity of the box become more important. At the point of final sale to the retail customer, some set of additional quality and condition standards will also apply, varying by circumstances.
Process standards concern how a given food or agricultural item is produced, harvested, cooled, washed, graded, sorted, handled, processed, packed, stored, transported, traded, distributed, or sold. Good agricultural practices (GAP) and good manufacturing practices (GMP) are sets of process standards that apply during the production, harvesting, and processing stages. For shrimp and other seafood, specific standards have been developed to ensure sustainable harvests, such as the use of turtle excluder devices (TEDs). In some situations, there are standards that govern transport method (air, land, or sea freight), conditions (temperature, ethylene level, venting), and transit time. At the point of retail sale or
19 http://vm.cfsan.fda.gov/~dms/prodguid.html. 20 Adapted from Reardon and others, “Strategic Roles of Food and Agricultural Standards,” MSU, 1999.

19
institutional use, any or all of the previous process standards may be applied, along with others such as shelf life or time held in storage. Variants such as EurepGAP (European Retailers’ Programme for Good Agricultural Practices) further define acceptable agricultural practices in a particular marketplace for selected product groups, initially just fresh produce and cut flowers. Organic standards define agricultural and manufacturing processes that will preserve certain measurable and immeasurable attributes in a product of interest. The HACCP (Hazard Analysis and Critical Control Points) approach further defines acceptable food, consumer, and environmental safety practices for meat, poultry, seafood, processed fruits and vegetables, and certain juices, with application in nearly all developed country markets. LACF (Low Acid Canned Food) regulations prescribe how to process products such as tomato paste or canned asparagus to avoid a particular problem, botulism.
Performance standards are concerned with how well a given product or entity achieves its intended purpose. In the past, such standards applied mainly to non-food agricultural items such as colorants, fragrances, and essential oils. In recent years, they have become relevant to edible agricultural products that serve as “functional foods,” for example, foods whose bioactive ingredients may lower cholesterol, prevent high blood pressure, reduce the risk of heart attacks, or improve the body’s resistance.
Impact standards are concerned with the consequences of consuming, utilizing, or handling a given item. Human safety is the prime example, but animal safety can be an impact concern for products such as ruminant proteins used for feed, while environmental safety can be an impact concern for products such as agricultural waste whose disposal could propagate pests or diseases.
Areas of Application in Food and Agriculture
Quality and condition: Quality standards refer to the desired attributes of a given food item at a particular point in its journey from farm to fork. Condition standards refer to the deterioration that may occur during that same journey, especially for perishable products. This may be due to biological processes such as maturation, ripening, or respiration; or to physical processes such as dehydration or bruising. Quality and condition standards may also apply to packaging, packing materials, or pallets.
Quality and condition standards serve mainly to facilitate arms-length trading, lower transaction costs, reduce rejections and shrinkage, lower commercial or user risk, and differentiate products or suppliers.
Traditionally, official quality standards issued by public agencies in source and destination countries governed most international trade in food and agricultural products. Yet, as trade has become more competitive and demand-driven, and as high-value products have gained market share, more stringent and varied buyer specifications have become more important. The same applies in domestic commerce, and increasingly in major cities, even in developing countries.
For private standards, especially for quality and condition, whoever dominates the supply chain tends to set the standards. For standards that apply only to a particular segment of the supply chain (for example, the production of seed cotton), entities that control a choke point (that is, the gin) may set the quality standards, at least on an interim basis, but always with the next buyer’s expectations in mind.
Most agricultural and food products exported from developing countries quickly enter importer or buyer-dominated supply chains, but there are a few in which growers or exporters have the greatest leverage in the supply chain. Mangos and shrimp are examples of the former, while bananas and rock lobster are examples of the latter.
Sanitary and phytosanitary: SPS standards generally refer to attributes and practices that may affect the life or health of humans, plants, or animals. Although food safety is arguably the most important sanitary issue as far as humans are concerned, worker health and safety are also significant SPS issues. In the phytosanitary field, the main issue is the threat of introducing pests or diseases that could harm potential
20
host plants in the destination market. Zoosanitary threats or risks concern mainly the introduction of animal pests or diseases that might harm the same or related animal hosts in the target market, but there are also zoonotic diseases, such as Avian flu, that can pass from animals to humans. The new field of biosecurity would logically fit under SPS as well, although it has not yet been codified in the 1994 WTO Agreement on the Application of SPS Measures, nor is it written into all of the major international trade or agricultural agreements that contain SPS chapters or provisions.
The main intent and function of SPS standards is to lower risks of unacceptable direct or indirect impacts on consumers, agricultural workers, and flora or fauna in the source and destination countries. However, the use of best practices in SPS has other benefits, in that it facilitates arms-length trading, reduces rejections and shrinkage, lowers commercial risk, and helps to differentiate products or economic actors in the food chain.
More than any other category of standards, SPS can have a dramatic effect on market access. In the United States, for example, inability to prove a level of risk acceptable to APHIS or FDA can: (1) entirely prevent entry of a certain commodity; (2) increase the rate of sampling at the border and subsequent laboratory analysis to levels that stifle trade and raise trading costs; and/or (3) require the use of an approved plant or animal quarantine treatment. And even if in the past a product has been deemed generally admissible from a given source area to certain ports of entry, continued interception of problem shipments can lead to gradual or sudden closing of the border to shipments emanating from specific companies or an entire country. For some SPS issues (such as pesticide residues), there may be a maximum limit, while for others (such as salmonella) there is zero tolerance.
Governments are the main source of SPS standards in the plant and animal health area, in which the potential harm generally takes the form of unacceptable externalities. By contrast, the private sector is playing an increasingly active role in specifying SPS standards for food safety, because the financial and other business costs of a product recall and/or liability suits are huge. While some suppliers still see higher standards as a burdensome problem, others are now using food safety standards, as well as the certification and audit processes that go along with them, as a competitive tool to differentiate their products or supply chains.
Social accountability: These standards generally refer to the conditions that surround the production, handling, processing, and distribution of a given food product. Use of child labor, especially in the fields, is one major concern. Another concern is gender sensitivity, which usually subsumes maternity and child care issues. A third concern is general working conditions, which include worker health and hygiene, hours worked, wage/pay structures, fringe benefits, and right to organize. A fourth is the use of forced, prison, or military labor.
Since labor standards have no tangible effect on product quality or appearance, the only way that they can be enforced is through certification or audit. Depending on whether they are imposed by government or required by buyers, the penalties for noncompliance may be fines or loss of market. Increasingly, labor standards are more imposed by buyers in destination markets than by governments in source countries.
Environment: Environmental standards generally cover risks of harm to water, soils, air, biodiversity, landscape, and cultural heritage. One major set of concerns in agriculture is pollution of underground or surface water through fertilizer and pesticide run-off or leaching, micro-bacteriological contamination from animals or workers, and effluent discharge from processing plants. In the case of soils, the main issues are pesticide residues and depletion of soil fertility. Risks to air quality can come from excessive formation of dust particles due to lack of soil cover and over-tillage; and from smoke, gases, or odors given off by processing plants. The main concerns with respect to biodiversity are uptake of agrochemicals by animals or plants, and the destruction of natural flora or fauna caused by loss of forests, marshlands, or other habitats of importance; and their replacement by monoculture or extensive livestock

21
grazing operations. With respect to cultural heritage, the main issues are typically loss of traditional rural ways of life such as pastoralism, and destruction of historical landmarks.
Again, because environmental standards affect the public welfare, they are promulgated mostly by government––often under pressure from particular environmental interest groups. However, private standards are emerging as well. For example, the “bird-friendly” designation is now being applied to some coffees that are grown without applying granulated agrochemicals.
Service: This last area of application for standards is much less documented and much less tangible than the previous four. Service is becoming crucial for offshore growers and shippers who want to consolidate a major position in major global supply networks. Several megatrends in the United States food system have caused service to assume greater importance as a competitive requirement (or tool, as the case may be). One trend has been the rapid expansion of food service, which was stimulated by growth in the hotel, restaurant, and institutional food retailing system as people began to eat away from home more frequently. Since food service purveyors handle some 4000 items, of necessity they need to rely on standards for both products and level of service. Another has been the emergence of alternative retailing channels for food and dry goods that compete with the traditional grocery store. These include supercenters (for example, Wal-Mart), warehouse clubs, other mass merchandisers, dollar stores, convenience/gas outlets, and even drug stores. Wal-Mart’s pioneering approach of relentlessly squeezing costs of supply chains and eliminating middlemen who do not add value has put a premium in service as well. A third major trend worth mentioning has been consolidation among the major retailing, distribution, manufacturing, processing, and importing companies. As buying offices have shrunk relative to the physical volume they have to manage, suppliers who can provide better service are strongly favored. A fourth big trend has been overhaul of procurement, distribution, and marketing practices. Again the use of technologies such as scanning and electronic data interchange, the application of new techniques such as “category management” and “efficient consumer response,” and growing reliance on preferred supplier arrangements and longer-term contracts all favor seamless integration and cooperative behavior within global supply networks.
It is difficult to generalize about service standards, because they can vary by stage in the supply chain (exporting vs. distribution), by product form (fresh vs. processed), by product type (raw vs. packaged), by source (domestic vs. foreign), and by enterprise. Moreover, they are evolving rapidly in response to changes in the structure and conduct of the food industry. Nevertheless, it is possible to identify the different aspects of service that foreign suppliers may have to address. These may include any or all of the following:
Product improvements: Custom packs (size, count, place-packed), consumer packs, high-graphics packaging, minimal processing, private label
Quality and safety assurance: Certification, audits, bar-coding, radio frequency identification device (RFID) applications, trace-forward and trace-back systems
Incentives: Slotting fees, failure fees, volume rebates, nonvolume rebates Promotional support: Allowances, ad slicks, brochures, press kits Merchandising support: Product look-up (PLU) stickers, point of purchase (POP) materials,
signage, in-store replenishment, cross-merchandising, in-store sampling Information management: Software upgrades, situation and outlook reporting Telecommunications: E-commerce, electronic data interchange (EDI) Capital investment: Food safety systems (such as ozone), dedicated or automated distribution
centers, regional fresh-cut processing facilities.
Service standards present a special challenge to international development programs because (1) they are not transparent; (2) they are not uniform; (3) they are sometimes proprietary; and (4) they may be applied
22
in a discriminatory manner. While some major food retailing chains promulgate and publicize specifications for product quality as well as company codes of practice that cover SPS (including traceability and certification), labor, and environmental matters, the other aspects of service that they expect often remain unwritten. Yet, at some point, best practices by leading firms tend to evolve into generally accepted private standards.
Since there are so many standards that affect food and agriculture, there is an increasing tendency to group them together. Sometimes it occurs within a particular area of application, for example, quality (Chilean table grape standards) or environment (“eco-friendly” designation by Rainforest Alliance). In the SPS area, the Food Marketing Institute in the United States manages the Safe Quality Food (SQF) certification system through its SQF Institute. SQF 1000 was designed for primary producers and small food processing entities, while SQF 2000 is intended for larger producers, processors, manufacturers, distributors, and retailers.
At other times, an informal grouping occurs under a general guideline for best practices such as Good Agricultural Practices (GAP) or Good Manufacturing Practices (GMP). However such approaches sometimes suffer from a lack of specificity or from high variability. For fresh produce, EurepGAP became obligatory as of January 1, 2004. It covers not just SPS matters but also labor and environmental matters, and eventually will require social audits.
Summing up, the sheer number and complexity of standards applicable to imported food in the United States and other developed country markets presents a daunting challenge for all suppliers. This is especially true for developing country suppliers, whose access to information, scale of operation, national policy and regulatory environment, and standards-related infrastructure places them at a disadvantage as compared with competitors from middle-developing or highly developed countries.
23 23
3. Coping with Shrimp Standards
Standards Applicable to Shrimp
Shrimp is subject to officially published standards for quality and condition, SPS compliance, labor, and environment (table 15). Individual buyers may define additional specifications for any or all of those topics.
Quality/condition standards for shrimp are predominantly of the outcome and process-type. Official US Government (USG) standards for grades of fresh/frozen shrimp, frozen raw breaded shrimp, and canned wet pack shrimp form the cornerstone of commerce and trade. According to those standards, quality and condition defects cover a wide range of possible problems:
Improperly peeled
Improper deveining of product
Texture problems
Deterioration or decomposition
Discoloration
Improperly cleaned product
Split ends
Damaged or broken product
Pieces
Legs, shells, or other extraneous matter
Sizing that is not uniform or not in accordance with buyer specifications
Glazing that will not provide proper protection or that results in too high a percentage of frozen weight
Unacceptable residue levels of permissible food additives
Improper naming of the product or its contents
Improper labeling of boxes or bags
Lack of uniform weight
Misstated or misleading net weight.
As with most food products, objective assessment of shrimp quality is based on a two-step process: first, identify and measure the defects, then assess quality based on the number and types of defects. However, as far as condition is concerned, an informed yet subjective judgment is often required. For example, in actual practice, deterioration or decomposition is usually detected through smelling and tasting. While most people could readily detect advanced decomposition, trained testers can recognize more subtle off-odors, off-flavors, and visual indicators. (Since many shrimp species, especially brown tropical shrimp, have detectable amounts of iodine, an odor or flavor of iodine is not a symptom of decomposition, except when it is excessive.) Deterioration of shrimp also accelerates discoloration, of which black spot is the most evident problem.

24 24
Table 15. Matrix of standards applicable to shrimp
Outcome Process Impact
Quality and Condition
U.S. Standards for Grades of Fresh/Frozen Shrimp http://seafood.nmfs.noaa.gov/Shrimp.pdf U.S. Standards for Grades of Frozen Raw Breaded Shrimp http://seafood.nmfs.noaa.gov/RawBreadedShrimp.PDF US Code of Federal Regulations http://www.gpoaccess.gov/cfr/index.html Sec. 161.173 Canned wet pack shrimp in transparent or nontransparent containers Sec. 161.175 Frozen raw breaded shrimp Sec. 161.176 Frozen raw lightly breaded shrimp
Bioterrorism Act of 2002 Registration of Food Facilities http://www.cfsan.fda.gov/~furls/cpgreg.html Prior Notice of Imported Food http://www.cfsan.fda.gov/~pn/cpgpn.html FDA Updates: What You Need to Know…. http://www.cfsan.fda.gov/~dms/fsbtac18.html Country of Origin Labeling http://www.ams.usda.gov/cool/ Food, Drug & Cosmetic Act http://www.access.gpo.gov/uscode/title21/title21.html
NA
Sanitary and Phytosanitary
NA Code of Federal Regulations for HACCP http://www.gpoaccess.gov/cfr/index.html Sec. 21 Part 123 Seafood HACCP Program http://www.cfsan.fda.gov/~comm/haccp4.html Seafood HACCP Mid-Course Correction http://www.cfsan.fda.gov/~comm/shaccp1.html Shrimp Health Management http://www.gaalliance.org/code5.html Therapeutic Agents and Other Chemicals http://www.gaalliance.org/code6.html Food Safety http://www.gaalliance.org/code0.html
Food Safe and Food Safe Plus http://www.unuftp.is/pdf/FCSQFFdSf.pdf
Social Accountability
NA Community and Employee Relations http://www.gaalliance.org/code9.html
NA
Environment NA Site Evaluation http://www.gaalliance.org/code2.html Design and Construction http://www.gaalliance.org/code3.html Feeds and Feed Use http://www.gaalliance.org/code4.html General Pond Operation http://www.gaalliance.org/code7.html
Mangroves http://www.gaalliance.org/code1.html Effluents and Solid Waste http://www.gaalliance.org/code8.html Turtle Excluder Devices http://www.state.gov/r/pa/prs/ps/2003/20152.htm US Code of Federal Regulations Part 161 Subpart B http://www.gpoaccess.gov/cfr/index.html 50 CFR223-- Part 223--Threatened Marine And Anadromous Species
25 25
Four sets of process quality standards are of particular interest for shrimp. The first is product and nutritional labeling.21 The second is the use of food additives such as acidity regulators, antioxidants, colorants, and preservatives such as sulfites. 22
The third set of standards for process quality is country of origin labeling (COOL),23 which under the Farm Act of 2002 was to be required of fish products (as well as beef, lamb, pork, peanuts, and fresh or frozen fruits and vegetables) by September 30, 2004. However, strong opposition to the so-called COOL legislation from major food industry groups (especially meat and fresh produce) delayed its implementation for two more years for all food products except wild fish.
The fourth set of process quality standards are derived from the Public Health Security and Bioterrorism Preparedness and Response Act of 2002. This legislation, commonly referred to as the Bioterrorism Act, mandated that all facilities that manufacture, process, pack, or hold food for consumption in the U.S. be registered with FDA by December 12, 2003. 24 It also required that the Food and Drug Administration receive a prior notification (2 to 8 hours, depending on the mode of transport) of all human and animal food, drinks and dietary supplements imported or offered for import to the U.S. FDA and the U.S. Bureau of Customs and Border Protection (CBP) also issued a compliance policy guide. The nine-month transition period ended on August 12, 2004, and the legislation is in force.
Although the borderline between quality/condition and sanitary/phytosanitary standards is not always clear, and some legislation and codes of practice cover both, SPS is really a distinct category because it concerns only human, animal, and plant life and health. Quality and condition standards more properly fall under the rubric of “technical barriers to trade” (TBTs), which is where they are treated in the many bilateral and regional free trade agreements that the United States has signed or is negotiating, as well as in the WTO Agreement on the Application of Sanitary and Phytosanitary Measures. In addition, TBTs have their own agreement separate from SPS in WTO/Marrakesh.
Since food safety is a major preoccupation of all stakeholders in the shrimp trade, when FDA first required use of the Hazard Analysis and Critical Control Point (HACCP) approach for all seafood starting in December 1997, 25 the more far-sighted actors all along the supply chain generally welcomed it as a means of reducing risks and possibly increasing consumption. Although seafood retailers were technically exempt from these new regulations, FDA encouraged the retailers to use HACCP along with their suppliers, which virtually all have done. Domestic growers and processors must have a fully documented and functional HACCP plan. Foreign growers and processors must also have a HACCP plan that works, or else a letter of understanding between the US FDA and their government that attests to compliance with sanitary standards equal to those required of US processors.26 The more developed countries such as Australia and Japan are believed to have such an equivalence letter, but many other countries apparently do not.
FDA requires proof that imported seafood products have been produced under HACCP conditions.27 Exporting companies normally provide letters of attestation and, in some cases, actually send in their written HACCP/SSOP plans to prove that they comply with the regulation. However, in the experience of
21 Covered by secs. 341–43, subchap. IV, Food, Drug and Cosmetic (FD&C) Act.
http://www.access.gpo.gov/uscode/title21/chapter9_subchapteriv_.html. 22 Covered by sec. 348, subchap. IV, FD&C Act. http://frwebgate.access.gpo.gov/cgi-bin/getdoc.cgi?dbname=browse_usc&docid=Cite:+21USC348. 23 http://www.ams.usda.gov/cool/. 24 http://www.fda.gov/oc/bioterrorism/bioact.html. 25 http://www.cfsan.fda.gov/~dms/fdsafe3.html. 26 21 CFR Part 123 (HACCP Regulations). 27 Chap. 3 (Food-borne Biological Hazards) of FDA’s Import Seafood Products Compliance Program
http://www.cfsan.fda.gov/~comm/cp03844.html.
26 26
the authors, some companies initially tended to think that, if they provided the necessary paperwork, that would be enough. In many cases, they do not follow their written HACCP plans, and what little documentation they keep is sketchy and of little value.
The only way to keep the producers and processors in compliance has been for the FDA and other agencies to perform site inspections. International inspection requests are issued as a result of the following28:
a. The firm has been identified in a submission to FDA as a supplier or an alternate of materials, products, or services.
b. The firm has submitted a process form for the LACF products that the FDA compliance center believes should be evaluated on site.
c. The firm has an inspectional history of violations and/or problems. d. The firm has been identified by a surveillance inspection using a tiered approach based on factors
such as risk, volume of products, and complexity of processes. e. The firm has had problems related to MDRs, adverse reactions reported to FDA, or involvement
in voluntary or involuntary recalls.
In addition, firms that require regulatory or routine coverage for statutory or other reasons are included in planning future international inspection trips.
In accordance with these guidelines the FDA makes regular trips to foreign (and domestic) suppliers to assess the manner in which their facilities and HACCP procedures are managed. When violations or weaknesses are found, "warning letters" may be issued, or an operation may actually be closed. Warning letters are published on the FDA website, which is an embarrassment to the suppliers, of course. Although the culling process may not be complete, it appears that, over time, processors who have taken the "cosmetic" approach to HACCP procedures will systematically be found and de-listed.
Private industry has also defined and published food safety standards for shrimp, especially pond-raised, some of which are broader and more stringent than those that FDA requires. For shrimp as well as other food products, the Safe Quality Food Institute of the Food Marketing Institute (FMI) has devised and promulgated a comprehensive set of impact and process standards, along with a certification program. The Global Aquaculture Alliance (GAA) has been a leader as well, promoting not only its code of practice for Food Safety, but also a code for Shrimp Health Management and another for Therapeutic Agents and Other Chemicals. These public and private standards are being put into place to prevent the entry of shrimp eggs or larvae or bait shrimp that carry diseases communicable to other shrimp or pathogens communicable to humans. Giant Tiger Shrimp (Penaeus monodon) and White Shrimp (Penaeus vannemai), the pond-raised species most commonly exported to the US, may carry endemic viruses such as White Spot and other viral diseases, all of which are communicable to other shrimp but not to humans. Shrimp are also susceptible to contamination by bacteria such as Vibrio haemolyticus and Salmonella, which are communicable and harmful to humans.
With respect to the environment, one of the most significant official USG standards has emerged from the combination of one law that regulates shrimp imports and another law that controls domestic fishing practices. P.L. 101-162 (Section 609) prohibits the importation of shrimp or products of shrimp harvested in a manner that may adversely affect sea turtles. At the same time, the Threatened Marine and Anadromous Species legislation (50CFR223) requires the use of turtle excluder devices (TEDs) in
28 http://www.fda.gov/ora/inspect_ref/giit/ch1a.html#112.

27 27
domestic shrimp fishing.29 The National Marine Fisheries Service (NMFS) describes TEDs as follows: “a grid of bars with an opening either at the top or the bottom. The grid is fitted into the neck of a shrimp trawl. Small animals like shrimp slip through the bars and are caught in the bag end of the trawl. Large animals such as turtles and sharks, when caught at the mouth of the trawl, strike the grid bars and are ejected through the opening.” According to NMFS studies, TEDs can exclude up to 97 percent of sea turtles with minimal loss of shrimp.
While there are no official USG environmental standards that apply to foreign aquacultured shrimp, again the Global Aquaculture Alliance has put forth various other private process standards of note. These include Site Evaluation, Design and Construction, Feeds and Feed Use, and General Pond Operation. GAA impact standards for the environment cover Mangroves as well as Effluents and Solid Wastes.
As far as umbrella standards are concerned, EurepGAP has announced that, over the next few years, it will extend its coverage to aquacultured products. The salmon standards are reportedly near finalization by stakeholders. Shrimp and other species are expected to follow, probably in 2005.
Compliance Issues
To identify the main compliance issues associated with the standards explained above, the authors conducted interviews in November 2003 with key informants engaged in shrimp trade and sourcing. From within the private sector, interviewees included shrimp buyers from Darden Restaurants (Red Lobster); the major supermarket chain, Kroger, Inc.; the large warehouse club, COSTCO; several importing and brokerage houses; one vertically integrated shrimp farming, importing, and distributing company; and one aquaculture expert. The major food retailers and foodservice organizations all expressed a surprisingly high degree of satisfaction with the quality and condition of shrimp that they received. No major problems were noted. Since their satisfaction appears to contradict conventional wisdom as well as some of the facts discussed below, it may well be that their buying power is simply so great that they are insulated from the day-to-day problems that their suppliers must successfully deal with to retain important national accounts. As one moves farther upstream, that is, to distributors, brokers, and importers, the incidence of complaints voiced in the interviews tended to increase with respect to uniformity of size; conformity with specified net weight and glaze percentage; and color, appearance, and consistency of quality and condition across shipments and within each box.
Private sector interviewees saw SPS issues as a more important actual or potential concern for shrimp than quality. This concern was confirmed through interviews with officials from the Food and Drug Administration, the National Marine Fisheries Service, and the U.S. Customs and Border Protection Service (CBP). The public sector interviews ranged from Compliance officer to Director of Import Operations to Assistant Area Port Director.
Until fairly recently, all incoming shipments of all merchandise at U.S. ports of entry were first cleared through Customs,30 after which food and agricultural shipments were referred to other USG officials: USDA/APHIS for soil, plants, or live animals; FSIS for meat, poultry, or eggs; or FDA for seafood and all other food items. For some sensitive products, in which animal and plant health concerns could converge with human health concerns, FDA might sample a product already cleared by another agency such as APHIS. The Drug Enforcement Administration (DEA) would also intervene as necessary based on its own sampling protocols and intelligence, as well as alerts from U.S. Customs. However, in early
29 http://frwebgate2.access.gpo.gov/cgi-bin/waisgate.cgi?WAISdocID=092907457867+12+2+0&WAISaction=retrieve. 30 General import requirements and procedures are described on the U.S. Customs and Border Protection (CBP)
website, http://www.cbp.gov/xp/cgov/toolbox/publications/. A detailed guide to all aspects of importing commercial shipments is also available online at http://www.cbp.gov/nafta/cgov/pdf/iius.pdf.
28 28
December 2003, FDA and CBP signed an MOU that for the first time enabled FDA to commission thousands of CBP officers in ports and other locations to conduct, on FDA's behalf, investigations and examinations of imported foods. The same occurred with APHIS inspectors. This MOU both expanded and diluted to some degree the mandate and coverage of the various USG inspection agencies.
In the months before and after the Twin Towers attacks in New York City on September 11, 2001, FDA funding was significantly increased to protect the nation's families from an attack on the food supply. In FYs2002 and 2003, Congress authorized more than $195 million for food safety programs, enabling FDA to hire 655 new food personnel and conduct more than double the previous number of food import examinations. Nearly all of the new hires were allocated to food safety field activities: 300 to support the conduct of consumer safety investigations at U.S. ports of entry, 100 to support laboratory analyses on imported products, 33 to conduct criminal investigations of import activities, and the remainder to support domestic efforts. In the FY2004 budget, the Department of Health and Human Services (HHS) requested $116.3 million, an increase of $20.5 million over FY2003, to further protect the nation's food supply.
As a result, FDA’s surveillance and inspection activities have increased tremendously. By 2002 FDA provided coverage at 90 ports of entry, as compared with only 40 in 2001. Approximately 62,000 food import samples were collected and analyzed in 2003, approximately 5 times the number carried out in 2001.31
As far as shrimp and other seafood is concerned, FDA’s compliance manual instructs inspectors to “use the following priority selection criteria to determine which importers to inspect first”:
1. Follow-up to violative physical samples of high-risk product imported by the importer in which safety defects were detected.
2. Reinspection of importers of high-risk products that had, during their initial HACCP inspection, deviations as per FDA’s Attachment E, excluding parasites.
3. Follow-up to violative physical samples of low-risk product imported by the importer in which safety defects were detected.
4. Reinspection of importers of low-risk products that had, during their initial HACCP inspection, deviations as per FDA Attachment E.
5. Previously uninspected importers of, first, high-risk products, then low-risk products. 6. Reinspection of importers that had, during their initial HACCP inspection, deviations as per
Attachment E for high-risk products. Reinspection of importers of high-risk products that had, during their initial HACCP inspection, deviations related to the control of parasites in fishery products to be consumed raw.
7. Reinspection of importers of high-risk products whose last HACCP inspection was in compliance.
8. Reinspection of importers that had, during their initial HACCP inspection, deviations as per Attachment E for low-risk products.
9. Reinspection (normal sampling procedure) of importers of low-risk products whose last HACCP inspections were in compliance.
FDA’s mandate requires examination of incoming food shipments for compliance with various legal requirements, including pesticide residues, branding, labeling, adulteration, filth, and micro-bacteriological safety.32 31 http://www.cfsan.fda.gov/~dms/fssrep.html. 32 A complete Compliance Policy Guide for Food, Drugs and Cosmetics is published on the FDA website,

29 29
The individuals interviewed for this study mentioned certain food safety problems that affect the wholesomeness of imported shrimp. For the receivers, the order of priority seemed to be: Salmonella, unacceptable veterinary drugs (such as the antibiotics Chloramphenicol and various nitrofuranes), filth, and pesticide residues. (This is probably not the same order as that of FDA, because receivers are more concerned about potential liability.) Filth and Salmonella usually come from the pond water and silt that remain after harvest, or from dirty wash water that has not been well chlorinated. Antibiotics are generally used to control diseases in shrimp culture, especially viral disease. Agrochemicals may be directly employed to control aquatic weeds, or indirectly find their way into the shrimp’s food chain via run-off or groundwater contamination from nearby agricultural activities.
FDA refusal (formerly called “detention”) data for imported shrimp over the last quarter-century confirm these problems (appendix 3). While most shrimp-exporting countries have run into occasional problems of FDA refusal for a particular shipment, and may also have one or more problem shippers assigned to the “automatic detention” list, five of the most important foreign sources of imported shrimp have been on country-wide automatic detention since 1979. Individual shippers from countries that are not violative can still be removed from the list, but only after submitting negative laboratory reports and establishing a record of compliance.
Source: Authors. http://www.fda.gov/ora/compliance_ref/cpg/cpgfod/. Of particular note from the SPS point of view are the pesticide residue regulations covered by sec. 346a (http://frwebgate.access.gpo.gov/cgi-bin/getdoc.cgi?dbname=browse_usc&docid=Cite:+21USC346a). Sec. 346, subchap. IV, FC&C Act also deals with “other poisonous or deleterious substances,” which include prohibited antibiotics and other veterinary drugs (http://www.cfsan.fda.gov/~lrd/fdaact.html).
Figure 1. Causes for FDA Refusal of Entry for Shrimp(All Exporting Countries and All Ports of Entry)
June - October 2003
0
20
40
60
80
100
120
140
160
Salmonell
a
Filthy
Veter
inar
y Dru
gs
Importe
r/Mfg
r HACCP
No Englis
h
No Firm
I. D
.
Label
ing
Poisonous
List o
f Ingre
dients
Nutrien
t Lab
eling
Lister
ia
Needs F
. C. E
.
No Pro
cess
File
d
False L
abel
ing
Causes
Fre
qu
ency
of
Cau
ses

30 30
Unfortunately, the information contained in these import alerts and in other annual publications of FDA is too general or aggregated to allow anyone outside the agency to quantify (1) how many shippers may be on detention in any given year from any one country; (2) what percentage of overall shipments from a given country are on detention without physical examination (DWPE) status; or (3) what overall percentage of shipments is subject to DWPE.
Since the interviews conducted with major importers and receivers barely mentioned FDA detentions or refusals as a problem, and huge and increasing quantities of product have been coming in from each of the countries mentioned in the alerts, it is plausible to assume that automatic detention affects primarily new or marginal foreign shippers, while, for the most part, the mainstream actors have managed to stay off automatic detention. If true, this also suggests that a relatively small portion of inbound shipments get sampled, and an even smaller percentage get detained.
To find out whether there had been any change in the types of problems encountered, the authors examined “refusal of entry” data for June–October 2003 (figure 1).33 Salmonella generated the most refusals, closely followed by filth. Mislabeling was the third reason for refusal, closely followed by lack of a Low Acid Canned Food process filing or lack of a Food Canning Establishment Registration. The presence of unacceptable residues of veterinary drugs was the fifth most frequent cause for refusal. Findings of the antibiotic Chloramphenicol appear to have been rising mostly recently.34 On the other hand, the problems of filth and Salmonella are not new at all.
Direct Cost Implications of Compliance Issues for Shrimp
Although the question of overall costs of compliance will be explored more fully in section 5, at this point, it is appropriate to provide some detail as to the out-of-pocket losses incurred when a container of shrimp is detained and ultimately refused entry.
When the FDA detains product for inspection, it detains the entire shipment declared on the customs declaration, that is, one, two, or several containers at once. Since inspection cannot be performed in the receiving yard, the contents of the containers must be transported to a bonded commercial cold storage, marked as awaiting examination, and then the importer/buyer must wait for the inspection. Detention times are said to be running 5 to 10 weeks on the average, with some even longer. During this period, the buyer/importer is responsible for all cold storage charges, which run approximately $600.00 per month per container lot of approximately 36,000 lb. net weight. Typically, the product has already been paid for by letter of credit or wire transfer, so new bridge financing is required to cover the holding period. The importer or buyer may elect to order independent inspections by a Certified Marine Surveyor, and/or lab tests to forestall or counter FDA findings. Multirisk insurance (for rejection, loss, damage) may cost as much as 2 percent of the product value. If some of the shipment can be reworked to remedy whatever problems the FDA may find, the owner must also bear these charges. Any product that must be destroyed means not just a loss of product value but also additional charges for destruction. If an entire container must be re-exported (for instance, when the problem is just one of markings or labeling rather than food safety), again the owner must pay the resulting handling and shipping costs.
Although the one-time and monthly charges associated with either a hold/examine action or detain/refuse entry action by FDA can mount up, the loss of saleable product will always be the most significant out-of-pocket loss (tables 16 and 17). Shrimp of the two major species, Penaeus monodon and Penaeus vannemai can be purchased for between $1.60/lb–$3.50/ lb, while wild shrimp sells for approximately $2.50/lb more. The value of a container’s contents (36,000 lb. net weight) varies between $57,600 and $126,000 for pond-raised shrimp and between $147,600 and $216,000 for wild shrimp. The predominant
33 http://www.fda.gov/imports/refusals. 34 http://www.mdac.state.ms.us/Library/AgencyInfo/PressReleases/Shrimp7-24-2002.pdf.

31 31
shrimp in the import market are pond raised. Assuming an average market price of approximately $2.50/lb, a typical container might contain approximately $100,000 worth of product.
Given the above scenarios, it is evident that any hold/examination action can cost the owner considerable money, and temporary (rectifiable) refusal costs even more. Absolute refusal of entry by FDA of even a single container can spell financial disaster for many shippers or importers, especially if not covered by any insurance.
Table 16. Direct costs associated with FDA hold/examination for a container of shrimp (assuming 36,000 lb net weight container with declared value of $100,000)
First month holding costs US$ Drayage to cold storage ($250–600) 500 Cold storage handling costs ($400–600) 500 Cold storage holding costs 600 Property insurance costs 150 Financing costs (@5% p.a.) 425 Monthly total 2175
Source: Authors’ computations.
Table 17. Direct costs associated with FDA detention/refusal of a container of shrimp (assuming 36,000 lb. net weight container with declared value of $100,000)
First month holding/reconditioning costs US$ Drayage to cold storage ($250–600) 500 Cold storage handling costs ($400–600) 500 Cold storage holding costs 600 Property insurance costs 150 Financing costs (@5% p.a.) 425 Laboratory testing 1000 Monthly total 3175 Potential reconditioning or re-export of product 6000-10000
Source: Authors’ computations.

32 32
4. Coping with Standards for Fresh Fruits and Vegetables
Standards Applicable to Fresh Produce
Fresh produce grown or imported in the United States may be subject to officially published standards for quality and condition, SPS matters, social accountability, and environment (table 18). Organic produce is subject to a separate set of standards.35 Again, individual buyers may set additional specifications for any or all of those areas.
Official United States Government standards for grades of fresh fruits and vegetables, which are issued by the Fresh Products Branch of USDA’s Agricultural Marketing Service, provide the foundation for domestic commerce in many fresh produce items, including many but not all imports.36 As far as the five fresh produce items of direct interest to this analysis are concerned, there are official USDA grades and standards for fresh raspberries,37 cantaloupes,38, and asparagus,39 but none for snow peas or mangos. A set of grades does exist for fresh green peas, but this product is much different than edible pea pods such as snow peas and sugar snaps. Mangos lack official U.S. grades for several reasons: first, because Hurricane Andrew destroyed most groves in South Florida, leaving very little domestic production; second, because international supply is so fragmented that growers and importers have not been able—despite repeated attempts—to reach agreement on what the quality standards should be; and third, because there are great differences among the main commercial varieties: Tommy Atkins, Haden, Francine, Kent, Keitt, and Ataulfo.
The outcome attributes for quality and condition covered by official standards vary from one product to the next. A particular standard may cover any or all of the following traits:
Maturity Ripeness Firmness Shape or formation Color of each unit/uniformity within box Brix (sugar) level Lack of uniform size Trimming Brokens Free from damage (caused by dirt, pests, diseases, bruises, cracks, broken skins, sunscald,
sunburn, hail, moisture, stems, shriveling, leaves, trash, tops, roots, splits, doubles, sprouting, dry sunken areas, discoloration, wilting, or other means)
Free from decay Lack of uniform weight across boxes
35 http://www.ams.usda.gov/nop/indexIE.htm. 36 http://www.ams.usda.gov/standards/stanfrfv.htm. 37 http://www.ams.usda.gov/standards/raspberr.pdf. 38 http://www.ams.usda.gov/standards/cantalop.pdf. 39 http://www.ams.usda.gov/standards/asparagu.pdf.
33 33
Misstated or misleading net weight within a box Improper naming of the product Improper labeling of boxes or bags.
Some products have only origin grades, while others have slightly different grades for destination. Official standards for quality usually include tolerances that define whether the product may be graded “U.S. No. 2, “U.S. No. 1,” and for some products “U.S. Fancy,” which is better than U.S. No. 1.
While the produce industry in the United States routinely relies on inspections carried out by USDA inspectors, there are also private inspection services––some run individually by retired USDA employees, others by large international quality assurance organizations such as Société Générale de Surveillance (SGS). When a transport claim against a carrier is in the offing, a Certified Marine Surveyor may also be called in to establish a legal basis for the claim. Such surveyors are not connected to USDA in any way.
Objective assessment of quality in fruits and vegetables is based on a two-step process: (1) identify and measure the defects, and (2) assess quality based on the number and types of defects. In some cases, instruments may be used, such as a refractometer to assess the Brix (sugar) level in melons. More often, a subjective judgment is required. For example, filth, extraneous matter, decay, and post-harvest diseases are usually detected visually, by touch, or by smell.
Recognizing that fresh fruits and vegetables are perishable and will inevitably deteriorate over time, USDA has also developed FOB Good Delivery Guidelines, which specify tolerances for condition defects allowable under the assumption of a typical 5-day transit time by truck between point of origin and point of delivery. 40 These are applicable only to FOB sales, that is, when the commodity is placed "free on board" the carrier at shipping point.
Under FOB contracts, the shipper warrants that the product was loaded onto the transport carrier in "Suitable Shipping Condition." This warranty means that, at the time of shipment, the produce was in a condition that would assure delivery at the contract destination without abnormal deterioration if handled under normal transportation circumstances. With this understanding, the buyer then assumes all risk of damage and delay in transit not caused by the seller. For example, if a load of product is wrecked or stolen in transit, the buyer must pay the invoice price to the seller and file a claim with the carrier to recover damages. Sometimes a product that grades U.S. No. 1 at the shipping point can arrive at destination with total defects that exceed the limits established in the U.S. Grade Standards and still meet the terms of an FOB contract, because the extent of change in condition is within tolerance.
40 http://www.ams.usda.gov/fvpaca/fobgood.htm.

34
Table 18. Matrix of standards applicable to fresh produce
Outcome Process Impact
Quality and Condition
USDA Quality Standards for Fruit (Fresh Market) http://www.ams.usda.gov/standards/frutmrkt.htm USDA Quality Standards for Vegetables (Fresh Market) http://www.ams.usda.gov/standards/vegfm.htm Code of Federal Regulations http://www.gpoaccess.gov/cfr/index.html 7CFR319-- Subpart--Fruits and Vegetables 7CFR944-- Part 944--Fruits; Import Regulations 7CFR980-- Part 980--Vegetables; Import Regulations 21CFR101-- Part 101--Food Labeling USDA PACA F.O.B. Good Delivery Guidelines http://www.ams.usda.gov/fvpaca/fobgood.htm DRC FOB Good Arrival Guidelines http://www.fvdrc.com/en/New_PDF/Good_Arrival_Guidelines_English_April_25_2003.pdf
USDA Perishable Agricultural Commodities Act of 1930 http://www.ams.usda.gov/fvpaca/7usc499a.htm Highlights of the 1995 PACA Legislation http://www.ams.usda.gov/fvpaca/1995hilites.pdf Growers’ Agents Responsibilities under the PACA http://www.ams.usda.gov/fvpaca/GrowersAgent.pdf USDA PACA Unfair Practices http://www.ams.usda.gov/fvpaca/report.htm Registration of Food Facilities under the Bioterrorism Act http://www.cfsan.fda.gov/~furls/cpgreg.html Prior Notice of Imported Food under the Bioterrorism Act http://www.cfsan.fda.gov/~pn/cpgpn.html Country of Origin Labeling http://www.ams.usda.gov/cool/
NA
Sanitary and Phytosanitary
Code of Federal Regulations http://www.gpoaccess.gov/cfr/index.html 7CFR305-- Part 305--Phytosanitary Treatments 40CFR180-- Part 180--Tolerances And Exemptions From Tolerances For Pesticide Chemicals Draft Guidance FDA Channels of Trade Policy for Commodities with Residues of Pesticide Chemicals for which Tolerances Have Been Revoked, Suspended, or Modified… http://www.cfsan.fda.gov/~dms/pesguid.html
Guide to Minimize Microbial Food Safety Hazards for Fresh Fruits and Vegetables http://www.cfsan.fda.gov/~dms/prodguid.html Code of Federal Regulations http://www.gpoaccess.gov/cfr/index.html 7CFR301-- Subpart--Mediterranean Fruit Fly 7CFR319.56-- Sec. 319.56 Notice of quarantine
NA
Social Accountability
CFR, Part 1928 Occupational Safety and Health Regulations for Agriculture http://www.osha-slc.gov/OshStd_toc/OSHA_Std_toc_1928.html
EPA Worker Protection Standard (WPS) http://www.epa.gov/pesticides/safety/workers/PART170.htm
NA
Environment NA EUREPGAP http://www.eurep.org/sites/index_e.html GAP
NA
Service Unwritten
Unwritten Unwritten
35
The types of condition changes that occur most frequently vary by product. For fresh asparagus, for example, tips often bend or open, and diseases such as Erwinia can cause a strong off-odor. Cantaloupes tend to over-ripen or bruise. Raspberries tend to decay, soften, leak, or develop molds. Onions also tend to develop molds. Mangos tend to over-ripen, bruise, and develop anthracnose. Snow peas tend to dehydrate, shrivel, curl, develop black spots, or lose the desired deep green color.
The Perishable Agricultural Commodities Act (PACA),41 as amended,42 also provides process standards with respect to quality and condition. Administered by USDA, PACA fosters good trading practices in the marketing of fresh and frozen fruits and vegetables in interstate and foreign commerce. It prohibits unfair and fraudulent practices and provides a means of enforcing contracts. Under PACA, anyone buying or selling commercial quantities of fruit and vegetables must be licensed by USDA. PACA settlement procedures recognize only official USDA inspections, which are based on the U.S. Grades discussed above.
Not all of the process quality standards applicable to shrimp apply to fresh fruits and vegetables. For example, product and nutritional labeling does not apply. 43 On the other hand, the use of food additives does apply when waxes or colorants are used.44 Waxes can reduce moisture loss by as much as 40 percent, which enables produce to stay fresh longer. Some people in the industry also believe that it can improve cosmetic appearance, as with apples or cucumbers. Under the Farm Act of 2002, country of origin labeling was to be required for fresh produce by September 30, 2004.45 However, as noted earlier, its implementation has been delayed two more years. In conjunction with a major move toward use of radio frequency identification (RFID) tags on all pallets and boxes by 2007, industry leader Wal-Mart is reportedly working vigorously with partner businesses of all type to develop a new system for traceability that might present a better alternative than the COOL legislation.
The process standards specified under the Bioterrorism Act of 2002 do apply to fresh fruits and vegetables, but not to all actors in the produce supply chain. For example, the act exempts farms from the new registration requirement for food facilities. A farm is defined as facilities found in one general physical location, devoted to the growing and harvesting of crops or both. Washing, trimming outer leaves, and cooling produce are all viewed as part of harvesting. The term "farm" also includes facilities that pack or hold food, provided that all food used in such activities is grown, raised, or consumed on that farm or another farm under the same ownership. On the other hand, assembly points, handling facilities and exporter facilities do have to register. There is no actual charge for registering under the Bioterrorism Act; yet as of March 2004, slightly fewer than half of the estimated number of establishments that should register had done so. FDA anticipated that virtually all would have registered by the time the “education period” ended and full enforcement began in August 2004.
FDA is also requiring prior notification (at least 2 hours if overland by road, 4 if by air, or 8 if by sea) of fresh produce shipments offered for import to the United States. Again, there is no charge for submitting notice. Acceptance of submission of prior notice does not imply acceptance of entry of the actual shipment; it simply means that the form has been received (properly filled out or not) and that planned arrival has been noted. In March 2004, FDA reported nearly 100 percent compliance with the prior notice requirement for commercial shipments of food and agricultural products.46
41 http://www.ams.usda.gov/fvpaca/7usc499a.htm. 42 http://www.ams.usda.gov/fvpaca/whatsnew.htm. 43 From secs. 341–43, subchap. IV, FD&C Act. 44 Regulated by sec. 348, subchap. IV, FD&C Act. http://frwebgate.access.gpo.gov/cgi-bin/getdoc.cgi?dbname=browse_usc&docid=Cite:+21USC348. 45 http://www.ams.usda.gov/cool/. 46 Presentation by the FDA official in charge of the imported food registration and prior notice process in a seminar
at the Food Safety Summit, Washington, D.C., March 2003.

36
Various official sanitary and phytosanitary regulations, some of which are of the outcome type and others of the process type, also govern fresh produce imports. USDA’s Animal Plant and Health Inspection Service (APHIS) governs admissibility of fresh fruits and vegetables into U.S. territory first and foremost. APHIS defines its mission as: “protecting and promoting U.S. agricultural health, administering the Animal Welfare Act, and carrying out wildlife damage management activities.”
The methods and objectives used by APHIS for safeguarding and interdiction include:
Domestic market surveys for the presence of prohibited products
Smuggling interdiction efforts at air, land, and sea ports of entry
Transit survey and smuggling interdiction efforts at truck weigh stations inside the country
Education and outreach to importers, market owners, transportation companies, retailers, and the public regarding regulatory compliance
Liaison and cooperative efforts with the state departments of agriculture and other federal agencies such as the U.S. Customs and Border Protection (CBP), U.S. Fish and Wildlife Service, U.S. Food and Drug Administration, and USDA Food Safety and Inspection Service.
Working closely with APHIS’s Investigative and Enforcement Services and USDA's Office of Inspector General to investigate potential regulatory violations and prosecute violators
Gathering information to identify and close down smuggling pathways for prohibited agricultural products.
USDA requires import permits for certain fresh fruits and vegetables (including fresh herbs and sprouts) that come from any foreign country. These fresh fruits, vegetables, and herbs must be intended for consumption rather than propagation. Entry is allowed only for the approved plant part(s) of the fresh fruit, vegetable, or herb. Current entry requirements for any given product can be ascertained through the Import Authorization System.47 The permit is free, and is valid for five years so long as the underlying pest/disease risk has not changed, and/or so long as actual shipments are not found violative. When required, the prescribed plant quarantine treatment is defined as a condition of the permit.
Although the permit application process is simple and straightforward for a new shipper of plants and plant parts that are not deemed to present unacceptable risk to U.S. agriculture or the environment, achieving initial admissibility for a new product from a foreign country can be extremely time-consuming and sometimes costly. APHIS readily admits that the process of risk assessment, appraisal, initial determination, preparation of a proposed rule change, publication in the Federal Register, receipt and analysis of comments, and publication of the final rule requires at least 18 months, even when everything is in order and the risk is deemed acceptable. Yet, informed sources suggest that there are thousands of permit requests in the queue (many of them not realistic from the point of view of market potential). Some applicants have reported five-year delays. Critics allege that the APHIS process of prioritization, analysis, and approval is more political and arbitrary than it should be.
Some fresh produce items from certain source areas may be admissible, but only after appropriate use of an approved plant quarantine treatment. Among the crops selected for this analysis, only mangos currently require routine treatment, based on the “hot water dip.” This process subjects the mangos to certain high temperatures for a specified minimum time, which has been proven to kill any fruit flies or larva that may have been present. However, the hot water treatment (HWT) is just one of various risk mitigation measures used to prevent the entry of the much-feared Mediterranean fruit fly into the United States. The systems approach adopted for this product/pest combination also requires trapping in source areas to prove low infestation, certification of orchards destined for export, pre-approval of the design and then certification of the packing/HWT plant before initiation of each season’s operations, presence of an
47 https://web01.aphis.usda.gov/IAS.nsf/Mainform?OpenForm.

37
APHIS inspector throughout the season, sealing loaded trucks, and re-inspecting at the port of entry. The cost of all of these steps is borne collectively by the producer, packer, and shipper.
Another important official set of SPS standards applicable to fresh produce destined for the United States regulates pesticide use and residues. First of all, pesticides found on produce must have been registered with the United States Environmental Protection Agency (EPA) for use on that particular crop. Pesticide registration is the process through which EPA examines the ingredients of a pesticide; the site or crop on which it is to be used; the amount, frequency and timing of its use; and storage and disposal practices. 48 EPA evaluates the pesticide to ensure that it will not have unreasonable adverse effects on human beings, the environment, and nontarget species. A pesticide cannot be legally used in the United States if it has not been registered with EPA's Office of Pesticide Programs. (Legality of use abroad depends on the regulations of the source country, but prudence dictates that any grower anticipating shipment to the United States should abide by EPA regulations.)
Pesticide registration is widely regarded as too long and expensive. When a process of reregistration49 for older agrochemicals was instituted more than a decade ago under the Federal Insecticide, Fungicide, and Rodenticide (FIFRA) Act50,51 many uses of well-known agrochemicals for minor crops (which include virtually all fruits and vegetables) were lost. This consequence occurred either because the manufacturer did not think that the time and expense of reregistration were commercially justified, or because limitations on Acceptable Daily Intake (ADI) were so tight that the supplier did not want part of that chemical’s ADI quota to be taken up by a minor use. While a more streamlined and less expensive minor use (IR-4 Program52) registration process was later established, and some progress has been made, many agrochemicals viewed as crucial for imported specialty products in particular have still not reregistered for those uses. These registration changes have led to serious problems of pesticide-related detention or rejection for some of the products of interest in this study. For example, the loss of use of Ethylenebisdithiocarbamates (EBDCs)––a group of nonsystemic (that is, surface acting) fungicides that includes maneb, mancozeb, and zineb––was especially serious for imported snow peas, sugarsnaps, and French beans. In addition, an exemption for the very useful but not permitted Chlorothalonil in snow peas is still pending a decade after the loss of inclusion in the label.
Recognizing the issues with minor uses especially, in 2003 Congress passed the Pesticide Registration Improvement Act (PRIA), which became effective on March 23, 2004. Its goal is to create a more predictable evaluation process for affected pesticide decisions.53
The Federal Food, Drug and Cosmetic Act (FFDCA) also requires EPA to establish or change tolerances, which are the maximum residue limits of pesticides permitted on foods, whether domestic or imported.54 FIFRA was amended through the Food Quality Protection Act (FQPA) of 1996.55 FQPA requires EPA also to reassess tolerances to ensure that they met a safety standard defined as “reasonable certainty that no harm will result from aggregate exposure to pesticide residue,“56 as opposed to the earlier zero risk cancer standard known as the Delaney Clause. EPA has integrated the reregistration and tolerance
48 http://www.epa.gov/opp00001/regulating/registering/index.htm. 49 http://www.epa.gov/oppsrrd1/reregistration/index.htm. 50 http://www.epa.gov/opp00001/regulating/fifra.pdf. 51 http://www.epa.gov/opp00001/regulating/page=96. 52 http://www.epa.gov/opp00001/minoruse/index.htm. 53 http://www.epa.gov/pesticides/regulating/fees/index.htm. 54 http://www.epa.gov/pesticides/food/viewtols.htm. 55 http://www.epa.gov/oppfead1/fqpa/. 56 http://www.ipm.iastate.edu/ipm/icm/1996/10-7-1996/pestref.html.

38
reassessment procedures to effectively accomplish the goals of both programs. EPA maintains an online database for tolerances.57 Preharvest intervals (PIs) also are specified on the label.
While EPA determines pesticide tolerances, it is FDA that enforces them, mainly by sampling incoming shipments but occasionally by sampling product already in the distribution channels.58 While the exact sampling policies are not disclosed, it is generally known that some fresh produce (and other) items tend to experience more problems than others, that some countries have higher rates of violative shipments than others, and that some individual shippers are worse than others. For imported fruits, from 1999 through 2001 (the latest years reported), the percentage of violative samples ranged from 1.8 percent–2.6 percent while the percentage of samples that showed residues within tolerances ranged from 29.8 percent–52 percent. For imported vegetables, violative samples ranged from 3.9 percent–6.4 percent for the same three-year period, while samples showing residues within tolerance ranged from 24.5 percent–34.6 percent. In both cases, the remainder of samples showed no residues.59
Recognizing the uniqueness of fresh produce, in 1998 FDA also issued the important “Guide to Minimize Microbial Food Safety Hazards for Fresh Fruits and Vegetables.”60 This guide is generally perceived in the industry as one of the main elements of good agricultural practices (GAP) for fresh produce, particularly for fresh-cut items. While many actors in the U.S. produce industry have voluntarily developed their own HACCP plans, thus far such plans have not been required by FDA for fresh fruits and vegetables, nor are they commonly requested by buyers. The reason is largely the difficulties in specifying hazards, control points, and sanitation sanitary operating procedures (SSOPs) for the plethora of crops, pathogens, and processes inherent in the fruit and vegetable subsector.
Recognizing the increasing importance of imported food, EPA has also had extensive and analogous international involvement with the whole gamut of pesticide-related issues—both SPS and labor-related. These have included regulatory coordination and harmonization, import and export of agrochemicals, national registration, quality control, database management, applicator training, certification and licensing, safe and rational use, laboratory testing, and disposal.61 For example, EPA has been closely involved with the fresh and processed produce industry in Central America for more than 15 years. EPA first got involved at the request of the United States Agency for International Development (USAID) and the Guild of Non-traditional Products Exporters (AGEXPRONT) of Guatemala in the late 1980s when it became clear that the FIFRA reregistration process would cause particular difficulties for specialty vegetables. More recently, EPA’s Office of Pesticide Programs has been providing technical assistance to Central American countries in the management and use of pesticides. This has involved training in the disposal of obsolete pesticides, strengthening laboratory analytical capacity to monitor pesticide residues in food, and helping to implement international chemical conventions such as the Stockholm Convention on Persistent Organic Pollutants and the Rotterdam Convention on Prior Informed Consent. EPA’s Office of Prevention, Pesticides, and Toxic Substances (OPPTS) is also helping regulatory officials in developing countries gain access to the Internet so they can better find information. For this purpose OPPTS has developed with UNEP a training program called "Using the Internet to Research Chemicals Management Questions," which has been given already in several African countries as part of the pilot Chemicals Information Exchange Network project.62 This training will soon be delivered in Mexico and all Central American countries as well.
57 http://www.epa.gov/opprd001/tolerance/tisinfo/. 58 A flowchart for the entire food entry and clearance process is available on the FDA website,
http://vm.cfsan.fda.gov/~lrd/import.html. 59 http://www.cfsan.fda.gov/~dms/pesrpts.html. 60 http://www.cfsan.fda.gov/~dms/prodguid.html. 61 http://www.epa.gov/oppfead1/international/disposal.htm. 62 http://www.epa.gov/cien/partners_centamer.html.

39
Private standards concerned with social accountability have been slow to evolve, as far as the produce-for-export industry in the Americas is concerned. Long recognized as the most progressive country in this field, Chile is arguably the furthest advanced in the Americas in terms of application of both good agricultural practices (GAP) in general, and EurepGAP in particular. The latter is not surprising, given the importance of the EU market to Chile’s fresh produce exports. U.S. importers generally report that suppliers who trade a lot with Europe tend to be more advanced in terms of social (as well as environmental) standards, simply because EurepGAP started earlier and was announced as taking effect starting January 1, 2004. While most versions of GAP also include social and environmental norms, there are inconsistencies across versions. Moreover, GAP still represents more a philosophy and catch-all term for best practices than a set of concrete standards. While SQF 1000 may still take hold in the Americas, the trend seems to be more toward buyer and importer recognition of EurepGAP, even for the U.S. market. All of the above means that grower/shippers in the entire LAC region tend to conform more to labor and environmental standards when they target the EU market rather than because the US market demands or expects it.
Compliance Issues for Selected Fresh Produce Categories
For reasons previously mentioned—unit and total value, growth rate in imports, relevance to multiple developing country source countries, and significance within the SPS field—compliance issues will be examined for just five product categories. They are cantaloupe, mangos, red raspberries, asparagus, and snow peas.
SPS Compliance Issues for Imported Cantaloupes Sanitary issues in cantaloupes. In the late 1980s and 1990s, it was fairly common for FDA sampling to find pesticide residue violations in cantaloupe imports, especially from Central America, but for the last three full years reported by FDA (1999–2001), no violations were found in a total of 194 samples. Thus, it would seem that pesticide residues are no longer a serious issue for imported cantaloupes. It may well be that the industry-driven and USAID-supported quality program instituted in the early 1990s in Central America in response to the bacterial problem discussed below also got rid of the pesticide issue.
However, over the past 15 years, by far the most important problem with cantaloupes has been Salmonella. The U.S. Center for Disease Control (CDC) reports that Salmonella infections have been linked to melons since at least 1990, when Salmonella serotype Chester traced to cantaloupe caused 245 illnesses in 30 states.63 The cantaloupes were imported from either Mexico or Guatemala. Then a 1991 outbreak of cantaloupe-associated Salmonella Poona infections led to 400 illnesses in 23 states. In that situation, illness was associated with eating pre-cut cantaloupe in fruit salads or from salad bars. While industry sources asserted that the lower Rio Grande Valley in Texas was the probable source of the implicated cantaloupe, it is very possible that some might have come from Mexico. In response to this outbreak, FDA conducted a microbiologic survey that isolated a variety of Salmonella serotypes from approximately 1 percent of sampled imported cantaloupe and watermelon. Next, in 1997 there was an outbreak of infections caused by Salmonella serotype Saphra, which affected 25 persons in California. Again illness was associated with cantaloupe imported from Mexico. FDA conducted farm investigations in Mexico after the 2000 and 2001 S. Poona outbreaks, and also issued press releases to warn consumers, placed implicated farms on detention, and conducted sampling surveys of imported cantaloupe. The 1999 and 2000 FDA surveys of produce imported from Mexico indicated that 5 percent of cantaloupe sampled (8 of 151) was contaminated with Salmonella.
While some of the outbreaks describe above could have been the result of isolated problems, over time FDA apparently concluded that there was a systemic issue relating to Mexican cantaloupe production.
63 http://www.cdc.gov/mmwr/preview/mmwrhtml/mm5146a2.htm.

40
This conclusion led to the issuance on October 28, 2002 of an import alert.64 As noted in section 1 (“US Supply, Demand, and Use of Cantaloupe”), Mexican cantaloupe imports into the United States fell precipitously after the FDA ban: from $46.3 million in value in 2001, to $17.5 million in 2002, and then just $2.7 million in 2003.
Phytosanitary issues in cantaloupes. From time to time, cantaloupe shipments do get rejected, or at least fumigated, by USDA/APHIS because actionable pests are encountered. Since APHIS no longer puts pest interception data publicly on-line as it did in the past, detailed information was not available to the authors. Yet, in the authors’ personal experience, the most trade-limiting phytosanitary problem for imported cantaloupes has been the pea leafminer, Liriomyza huidobrensis (Blanchard). This pest can do severe damage to a wide variety of field- and glasshouse-grown vegetables and flowers. It apparently originated in South America and has spread to other continents on which established populations are growing ever more difficult to control. In 1995 it was reported to have spread to most of the vegetable-growing areas around Salinas Valley in California, and has become all but uncontrollable for many crops. Larva-infested produce and cut flowers have been intercepted frequently at Florida ports, and the state authorities as well as the agricultural industry have been quite sensitive about it. Extreme vigilance by APHIS and the Division of Plant Industry in Florida has caused many interceptions, especially in shipment of melons, snow peas, and French beans. On the other hand, growers in Guatemala argue that the leaf miner that is being intercepted is the same species that already exists in Florida, as in California, so the interceptions are unjustified. To the best of the author’s knowledge, the dispute remains unresolved. (It should be noted that fresh produce shipments from California and Mexico have also been intercepted for the same reason.)
SPS Compliance Issues for Imported Mangos Sanitary issues in mangos. Although agrochemicals are certainly used in mango production, the activist Environmental Working Group classifies mangos among the dozen least contaminated fruits. 65 Pesticide residues have been even less of a problem on imported mangos. No violative shipments were found by FDA in the years 1999 and 2000. For the countries that do need to treat mangos before shipment to the United States, the double-dip and high-temperature soaking treatments tend to wash off any superficial pesticide residues, leaving room only for possible systemics (that is, pesticides that penetrate the fruit). On the other hand, in 2001 a surprising 7.7 percent of 26 samples were found violative, but this anomaly probably reflects fruit from Eastern Caribbean islands that are not required to use the hot water treatment. Mangos are widely afflicted with anthracnose, which is caused by Colletotrichum gloeosporoides. It is hard to control anthracnose using chemicals, especially in areas of high rainfall. While the EBDC fungicides were effective, their use was withdrawn by EPA more than a decade back. Other alternative fungicidal treatments have either developed resistance problems or not proven especially effective. Better alternatives such as the strobilurins are being tested but do not yet have EPA registration for mangos.66
In the authors’ personal experience, for some producing areas the microbacteriological and chemical safety of the water used in the hot water treatment itself has been an issue, particularly in Mexico, where the main water source is large, open irrigation canals that serve multiple uses and many farms spread over huge areas. Although chlorine in the hot water dip can help kill the pathogens, some HWT facilities are working to develop alternative water sources more consistent with Good Agricultural Practices.
Phytosanitary issues in mangos. Without doubt, the single biggest phytosanitary issue for mangos destined for the United States market is the Mediterranean fruit fly, Ceratitis capitata (Wiedemann).
64 Excerpts from the import alert are presented in appendix 4. It provides additional useful background, and specifies
the steps that a shipper or importer have to go through to avoid automatic detention and refusal of entry. 65 http://www.pesticideinfo.org/DS.jsp?sk=6007#SiteInfo. 66 http://plantpath.ifas.ufl.edu/Newsletter/Newsletters/Septmeber1999.PDF.

41
Many agriculturalists and regulators in the United States consider the “Medfly” to be the most threatening plant pest because it could infest and destroy the commercial value of a wide range of plant hosts. The larvae can develop and feed on most deciduous, subtropical, and tropical fruits, as well as some vegetables. Although the U.S. citrus industry is the most vociferous in its campaign to prevent the Medfly from establishing itself in agricultural states such as Florida, Texas, Arizona and California, the Medfly has the potential of becoming a more serious pest of deciduous fruits, such as peach, pear, and apple, which are grown elsewhere. The Mediterranean fruit fly can attack some 260 different fruits, flowers, vegetables, and nuts. It prefers thin-skinned, ripe succulent fruits. Host preferences vary in different regions. Although several species of cucurbits (that is, melons and squashes) have been recorded as hosts, they are considered to be poor hosts. The larvae feed upon the pulp of host fruits, sometimes tunneling through and eventually reducing the whole fruit to a juicy, inedible mass. Medfly affects mangos exported from Mexico, all of Central America, the Andean countries, Brazil, Venezuela, Haiti, and some other Caribbean countries. Mexico also has the Mexican Fruit Fly, while the South American countries have other fruit flies of concern.
Although the preferred plant quarantine treatment decades ago was fumigation by ethylene dibromide, EPA suspended all uses of EDB in September 1984, because EDB had been found to be a carcinogen and mutagen. Since researchers had known for a long time that heat treatments can meet the USDA-required Probit 9 security level of quarantine pest control, which permits no more than 3.2 survivors out of 100,000 larvae,67 various heat treatment methods for mangos and other susceptible fruit were tested over the years. The challenge was (is) to make sure that the core of the fruit reaches a sufficiently high temperature for a long enough time without unduly affecting the market quality of the product in question. Hot-water immersion is currently used to successfully treat mangos infested with the Mediterranean fruit fly and several different Anastrepha species of fruit fly before importation. Depending on the type and size of the mango, the fruit has to be heated for 75 or 90 minutes to make sure that the core temperature rises to between 43° –46.7° C (109.4°–116.1° F). A hot-water treatment system can be easily assembled, is durable, and is relatively inexpensive. There are now approximately 85 commercial hot water treatment facilities operating in the LAC region, more than 60 in Mexico alone. The cost for core equipment (dip tanks, boiler, gauges, controls, overhead conveyances) averages approximately $200,000, but the addition of cold rooms, heat exchangers, packing lines, sorting equipment, clean water sources, and other refinements can bring the total investment as high as $1 million. APHIS/PPQ must first certify the design of each facility, then inspect and certify it on completion, and finally during each season, provide an approved local or foreign inspector to check each batch as it is treated as well as each load when it is dispatched by truck. The latter can cost as much as $150,000 per season, not counting room and board.
SPS Compliance Issues for Imported Red Raspberries Sanitary issues in red raspberries. Red raspberries have not experienced any serious pesticide residue problems in the United States market. No violative samples were encountered by FDA in 1999 or 2001, and just 2.2 percent of those tested in 2000 were deemed to be in violation. The resulting annual average was below 1 percent over a 3-year period.
Yet red raspberries are not trusted by some consumers and retailers, because of one of the most publicized microbacteriological infection situations experienced in the last decade of produce history. Through the late 1980s, the only viable foreign sources for fresh product into the U.S. were Canada for several months in the summer and Chile for several month in the winter, with significant gaps in annual supply. For that reason, starting around 1988, development projects in Central America began targeting the open windows for both products. Varietal and management issues were solved, and a new berry industry was created,
67 http://www.epa.gov/spdpublc/mbr/casestudies/volume2/heatcom2.html.

42
especially in Guatemala. The value of exports to the U.S. market went from zero in 1992 to $45,000 in 1993, then $134,000 in 1994, $309,000 in 1995, and $626,000 in 1996.68
The expectation was that exports would surpass $1 million in 1997, but it did not happen because a Cyclospora69 crisis surfaced unexpectedly in 1996. Berries were first implicated during Cyclospora outbreaks in Houston in May. First, 16 of 26 people at a luncheon meeting developed severe diarrhea after eating dessert. Reports conflicted on whether they ate strawberries alone or strawberries, raspberries, and blackberries. Then 10 of 14 people who ate at another Houston restaurant became infected after eating desserts garnished with a strawberry and, possibly, raspberry and blackberry. In the course of that year, similar symptoms appeared to affect more than 900 U.S. and Canadian adults and a few children in 15 states, mainly east of the Rocky Mountains. Many cases were lab-confirmed, and 16 patients were hospitalized.
At first, strawberries were blamed. Represented by the California Strawberry Commission, the U.S. strawberry industry reacted swiftly, testing berries in fields and stores, water used for irrigation and washing, and the harvesting crews. Nothing was found, and no clusters of Cyclospora infection were reported in California, where strawberries are produced and consumed in great quantities.
So raspberries became the main suspect. CDC found that they had been served at the 42 Cyclospora events it studied, which had attack rates of 50 percent to 80 percent. At 12 events they were the only berries, or they were served separately from other berries. The South Carolina health department’s infectious-disease consultant reported that its investigation of 38 cases among 64 adults who attended a lunch near Charleston showed that most of the patients had eaten Guatemalan raspberries. The epidemiologic evidence was “quite compelling” according to a CDC official. So FDA and CDC investigators began visiting Guatemalan farms, with full cooperation of the Guatemalan Berry Commission. However, growers, in private, remained skeptical because no physical evidence had been found. Some suspected that this was a nontariff trade barrier trumped up by competitors in California or Chile.
Since nothing had been proven by the time the 1996 season ended, FDA did not act to detain or refuse entry to Guatemalan raspberries. However, for the 1997 shipping season, the Guatemalan Berry Commission issued voluntary guidelines designed to limit exports to low risk farms. Yet another outbreak of cyclosporiasis occurred in multiple states almost immediately in the spring of that year. A total of 41 clusters of cases were reported in association with events that occurred between April 1 and May 26 in 13 U.S. states, the District of Columbia, and 1 Canadian province. The clusters comprised 762 cases of cyclosporiasis, 192 (25.2 percent) of which were laboratory confirmed. In addition, 250 laboratory-confirmed sporadic cases were reported in persons who developed gastrointestinal symptoms from April through 15 June, for a total of 1012 cases. Fresh raspberries were the only food common to all 41 events and were the only type of berry served at 9 events (22.0 percent). Statistically significant associations between consumption of raspberry-containing items and cyclosporiasis were documented for 15 events (40.5 percent of 37). For 31 of the 33 events with well-documented traceback data, the raspberries either definitely came from Guatemala (8 events) or could have come from Guatemala (23 events).70
On May 30, 1997, the Guatemalan Berry Commission and Guatemalan government voluntarily suspended shipment of fresh raspberries to the United States. For this reason, export value dropped back to $361,000. Supported by CDC, FDA, and other interested institutions, research went into full swing. The challenge of locating, understanding, and protecting against this disease was daunting. CDC
68 http://www.fas.usda.gov/ustrade/USTImHS10.asp?QI=. 69 Cyclospora cayatanensis interferes with small-bowel absorption, causing recurrent diarrhea, cramps, profound
fatigue, and anorexia in children. 70 http://www.ncbi.nlm.nih.gov/entrez/query.fcgi?cmd=Retrieve&db=PubMed&list_uids=10049199&dopt=Abstract

43
describes Cyclospora as “truly emerging.” The reasons for Cyclospora’s seasonal occurrence, its reservoir, and its emergence are unknown. According to CDC, an important feature of the biology of Cyclospora is that oocysts excreted in feces require days to weeks outside the host to sporulate and thus to become infectious. However, the minimum time required for sporulation is unknown. Cyclospora oocysts must survive in the environment long enough to sporulate and infect a susceptible host, which suggests that they are very hardy. Summertime presents the environmental conditions that oocysts of the human species need, which may explain the seasonal occurrence of infections starting in May.
By November 1997 the Guatemalan growers and government had concluded that something more drastic and obligatory had to be done to preserve the raspberry industry and contain the damage to the blackberry and other nontraditional agricultural export industries. The Guatemalan government created a commission with enforcement powers aimed at ensuring food safety. However, FDA was apparently not convinced that these measures would solve the problem, so in December 1997 it issued an import alert that blocked further exports from Guatemala to the U.S.71 In 1998, FDA did allow some shipments of red raspberries to enter the States, but not from March 15–August 15.
With assistance from CDC, FDA, Health Canada, the Canadian Food Inspection Agency and the Food Marketing Institute, the Guatemalan Berry Commission then developed a Model Plan of Excellence for Raspberries (MPE) which incorporated many principles borrowed from HACCP. In effect this was a GAP program for berry (both red raspberry and blackberry) production adapted to local conditions. It included important features such as sealed wells, water quality/safety testing, worker hygiene and sanitation, record-keeping, and traceability. It also involved frequent inspections by PIPAA, the Integrated Program for Agricultural and Environment Protection, which had been started in the early 1990s under the auspices of the exporter association AGEXPRONT and with support from the USAID PROEXAG/EXITOS project. In November and December 1998, FDA representatives visited a number of Guatemalan raspberry farms to determine whether farms wishing to export fresh raspberries to the US in spring 1999 were following the MPE. Raspberries from growers found to be following the MPE would not be subjected to detention without physical examination.72
Although some retailers and importers shied away from Guatemalan berries (of any type) initially, exports began to rebuild slowly—amounting to $156,000 in 1998, $262,000 in 1999, and $255,000 in 2000. However, compliance with the Model Plan for Excellence was expensive, and the damage to Guatemala’s reputation was such that two major shippers decided to start growing in Southern Mexico.
Additional outbreaks of Cyclospora in successive years did not help, even though none, except that of 2000, could be attributed to Guatemalan product. The value of exports fell back to $182,000 in 2001, then rebounded to $640,000 in 2002. However, by that point, the two main shippers that had gone to Mexico decided to stop growing in Guatemala, and others also withdrew, so 2003 exports fell back to $133,000. Effectively, the red raspberry industry in Guatemala had all but died. To this day, an FDA import alert still exists, with automatic detention decreed for shipments received between March 15–August 15 from farms not certified as adhering to MPE.
Phytosanitary issues in red raspberries. Red raspberries, along with all other berries, tend to develop gray mold (Botrytis cinerea) if grown and packed under humid conditions, and/or if the cold chain is not well maintained. While occasionally this mold provides cause for rejection by APHIS at the port of entry, or else by receivers when they take delivery, it is not a major issue in the industry.
71 http://www.ifpri.org/2020/focus/focus10/focus10_07.pdf. 72 http://www.fda.gov/ora/fiars/ora_import_ia2004.html.

44
SPS Compliance Issues for Imported Asparagus Sanitary issues in asparagus. As noted in section 1, most fresh asparagus imported into the United States comes from Chile, Mexico, or Peru. In all three cases, it is mostly grown under desert conditions, which have relatively little pest or disease pressure. Moreover, much of the asparagus is hydrocooled just after packing, which means that already packed plastic boxes are immersed in cold water. The combination of these two circumstances reduces the likelihood of pesticide contamination. FDA annual reports for the latest three-year period for which data is available indicate 2.2 percent of violative samples for 1999, 1.7 percent for 2000, and 0 percent for 2001. Importers and growers do not consider pesticides to be a major SPS issue for asparagus.
Although some years back, Botulism was alleged by Spain in canned asparagus produced in Peru, it was never proven. To prevent its appearance, particularly in small-scale artisanal canning operations, several years ago, the Asparagus Foundation in Peru undertook an ambitious HACCP and Low-Acid Canned Food process control program, with the support of the export promotion commission, PROMPEX.
Phytosanitary issues in asparagus. According to U.S. receivers, the main phytosanitary issue of concern with fresh asparagus is asparagus leaf miner (Ophiomyia simplex). Maggots of a small fly mine in the stalks just below the surface of the soil. These maggots can cause the foliage to turn yellow and die prematurely. APHIS routinely inspects imported asparagus for leaf miner eggs, which can be found in the tips of cut asparagus through close physical examination. Although no such policy has been formally announced by APHIS, industry sources have the impression that Peruvian asparagus is subjected to much closer scrutiny than all others, and that the percentage of shipments inspected is higher during some times of the year than others. It is presumed that the history of leaf miner finds from Peru warrants the increased sampling rates and seasonal adjustment. When leaf miner eggs are found, the asparagus must be subjected to fumigation with methyl bromide. This is performed near the port of entry by an independent contractor who maintains an air-proof container on standby for that purpose. Unfortunately, fumigation not only requires a break in the cold chain but also raising the temperature intentionally. Along with residual effects of the bromides, fumigation hurts the quality and condition of the product and reduces its shelf-life.
Less frequent but also serious is infestation by bacterial soft rot (Erwinia carotovora), which is the most common post-harvest disease in asparagus. It is characterized by pale grey tips and watery stems. Erwinia begins with bacterial growth at the cut surfaces, which exude droplets. Later development results in the lower part becoming soft and watery, and subsequently collapsing. The bacteria enter through the cut surface or areas with mechanical damage and are seen mainly in stems with feathering.
SPS Compliance Issues for Imported Snow Peas/Sugar Snaps Sanitary issues in snow peas/sugar snaps. It is an unfortunate fact that imported edible peas pods have had a long history of difficulty in meeting EPA standards for pesticide use and tolerance levels. Although this problem is largely associated with Guatemalan peas, in fact it began in the 1980s with peas from the Dominican Republic. Growers in the latter country were unable or unwilling to cope with EPA requirements, were put on automatic detention by FDA, and within a decade simply withdrew from the business. By contrast, Guatemala remains very much in the game, shipping $7.8 million in fresh peas in 2003, plus another $1.3 million worth of frozen snow peas and sugar snaps.
Responsible growers, the PIPAA program mentioned earlier, and AGEXPRONT have all worked with development projects and EPA and FDA for more than 15 years to reduce inappropriate pesticide use. Considerable research has been done on integrated pest management (IPM), based on solarization, the use of plastic "traps," the destruction of crop residues, crop rotation, and the rational use of EPA-permitted pesticides. Yet, violative samples remain high for Guatemalan peas: 14.3 percent of all samples in 1999; 12.8 percent in 2000; and 20.2 percent in 2001. The main practical problem is continued partial dependence on sourcing of product from unknown sources at twice-weekly open markets in the
45
highlands. The main technical problems are how to control certain diseases—especially Aschochyta—without access to powerful fungicides such as the EBDCs and chlorothalonil, for which EPA registration no longer exists.
Guatemalan snowpeas have been on automatic detention since as far back as 1988 for certain agrochemicals (Methamidophos, Chlorothalonil, Monocrotophos, Profenofos, Dicrotophos, and Chlorpyrifos). A letter sent February 21, 1995 to the Guatemalan National Snow Pea Committee informed them of an FDA decision to ensure sampling uniformity for all entries of snow peas under automatic detention. FDA district offices were then encouraged to require independent third-party sampling of snow peas from Guatemala to ensure the integrity of the sample collection and analysis.
Samples not collected by an independent sampling service would not be considered sufficient to remove the appearance of a violation. Individual growers or shippers can be exempted from countrywide automatic detention by providing substantial evidence that their product is in compliance. Most of the major shippers have managed to get off of automatic detention, but new and inexperienced exports regularly appear, especially when prices spike, and they tend to add to the perception of a continuing pesticide use problem on Guatemalan snowpeas. Aside from pesticide residues, snowpeas have not experienced any other significant sanitary issues.
Phytosanitary issues in snow peas/sugar snaps. Over the years, this product category has also experienced occasional problems with AHPIS detentions for plant quarantine pests. While detailed data is unavailable, from personal experience, the authors know that the main insect issues have been Thrips (Trips tabaci Frankliniella Panamensis), leaf miner (Liriomyza spp.), stem borer (Epinotia aporema), and the legume pod borer (Maruca testulalis). When found, all of these pests require fumigation at the port of entry, which again means additional direct cost as well as deterioration of condition and reduction in shelf life.
Direct Cost of Compliance Issues in Selected Produce Categories
Since this study did not include interviews with growers or exporters abroad, it is not really possible to discuss in detail the costs incurred offshore to avoid detention or refusal by FDA or APHIS for sanitary or phytosanitary reasons, and to comply with buyer expectations to the extent that they might be even more stringent. While the extent of application of good agricultural practices in offshore fruit and vegetable production is expanding rapidly, movement toward EurepGAP certification is occurring at a much slower pace. Generally, the latter is limited to firms that have already been targeting the EU market. Cost estimates for initial compliance begin at approximately $40,000, and annual costs of recertification appear to run at approximately $5,000.
Beyond that, the personal experience of the authors suggests that very few foreign suppliers of specialty vegetables and tropical fruits actually keep track of their SPS compliance costs. Even if they have a quality assurance department (more commonly a single individual), the corresponding costs are not allocated across products, markets, or topic. Where a supermarket code of practice for these products may require third-party certification or audit, the one-time or recurring fees would be identifiable, but the investment of time and money required to pass the audit or certification would not often be captured in the typical accounting system of a fresh-produce-for-export operation of modest scale.
On the other hand, it is relatively easy to estimate the direct costs of noncompliance as evidenced by detention or refusal at the port of entry, or later rejection by final receivers. When a container is absolutely refused entry, the resulting direct costs incurred may include:
Value of the load (including freight): Although declared CIF value is the main indicator of value, it is common for CIF values to be over- or under-stated as compared with the true market value of the product at the moment of delivery, if it has made good arrival. Whether in an
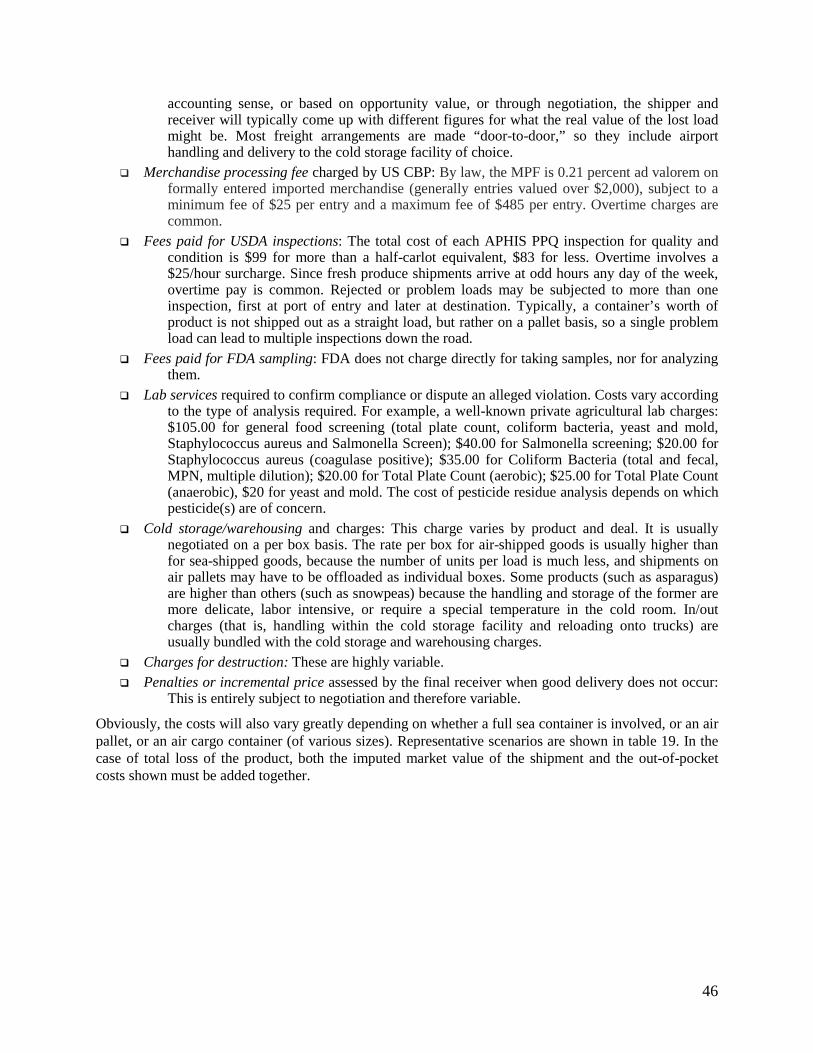
46
accounting sense, or based on opportunity value, or through negotiation, the shipper and receiver will typically come up with different figures for what the real value of the lost load might be. Most freight arrangements are made “door-to-door,” so they include airport handling and delivery to the cold storage facility of choice.
Merchandise processing fee charged by US CBP: By law, the MPF is 0.21 percent ad valorem on formally entered imported merchandise (generally entries valued over $2,000), subject to a minimum fee of $25 per entry and a maximum fee of $485 per entry. Overtime charges are common.
Fees paid for USDA inspections: The total cost of each APHIS PPQ inspection for quality and condition is $99 for more than a half-carlot equivalent, $83 for less. Overtime involves a $25/hour surcharge. Since fresh produce shipments arrive at odd hours any day of the week, overtime pay is common. Rejected or problem loads may be subjected to more than one inspection, first at port of entry and later at destination. Typically, a container’s worth of product is not shipped out as a straight load, but rather on a pallet basis, so a single problem load can lead to multiple inspections down the road.
Fees paid for FDA sampling: FDA does not charge directly for taking samples, nor for analyzing them.
Lab services required to confirm compliance or dispute an alleged violation. Costs vary according to the type of analysis required. For example, a well-known private agricultural lab charges: $105.00 for general food screening (total plate count, coliform bacteria, yeast and mold, Staphylococcus aureus and Salmonella Screen); $40.00 for Salmonella screening; $20.00 for Staphylococcus aureus (coagulase positive); $35.00 for Coliform Bacteria (total and fecal, MPN, multiple dilution); $20.00 for Total Plate Count (aerobic); $25.00 for Total Plate Count (anaerobic), $20 for yeast and mold. The cost of pesticide residue analysis depends on which pesticide(s) are of concern.
Cold storage/warehousing and charges: This charge varies by product and deal. It is usually negotiated on a per box basis. The rate per box for air-shipped goods is usually higher than for sea-shipped goods, because the number of units per load is much less, and shipments on air pallets may have to be offloaded as individual boxes. Some products (such as asparagus) are higher than others (such as snowpeas) because the handling and storage of the former are more delicate, labor intensive, or require a special temperature in the cold room. In/out charges (that is, handling within the cold storage facility and reloading onto trucks) are usually bundled with the cold storage and warehousing charges.
Charges for destruction: These are highly variable. Penalties or incremental price assessed by the final receiver when good delivery does not occur:
This is entirely subject to negotiation and therefore variable.
Obviously, the costs will also vary greatly depending on whether a full sea container is involved, or an air pallet, or an air cargo container (of various sizes). Representative scenarios are shown in table 19. In the case of total loss of the product, both the imputed market value of the shipment and the out-of-pocket costs shown must be added together.
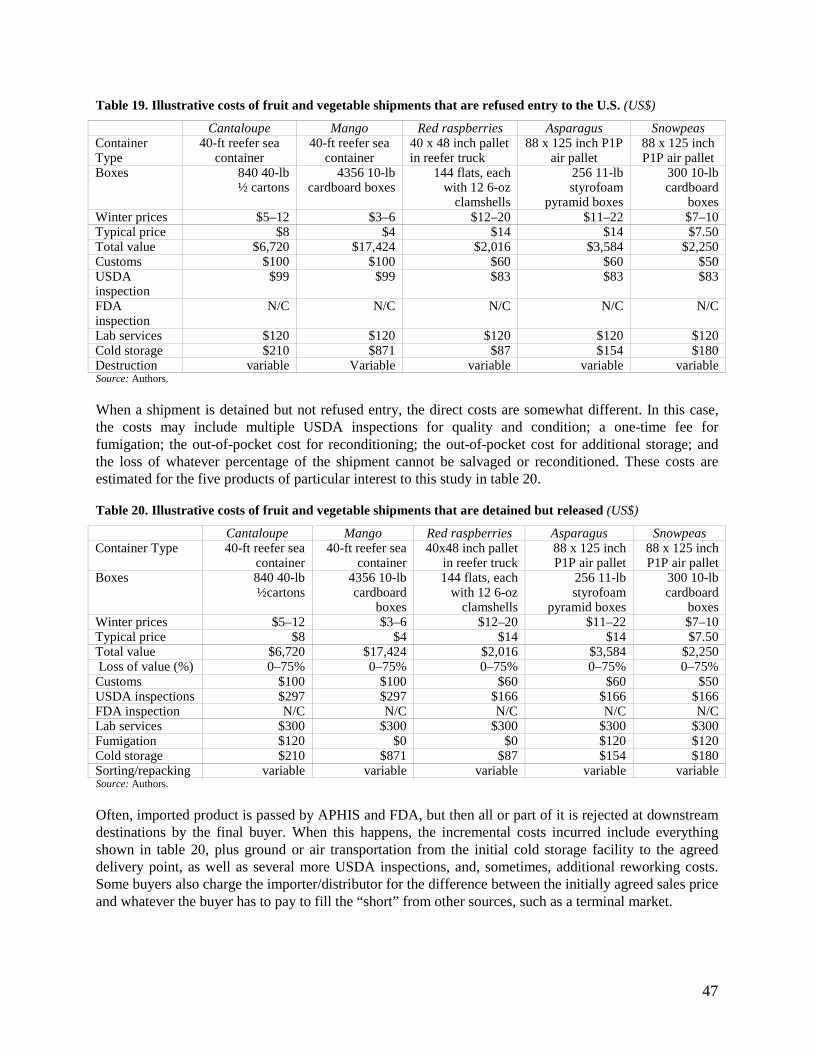
47
Table 19. Illustrative costs of fruit and vegetable shipments that are refused entry to the U.S. (US$)
Cantaloupe Mango Red raspberries Asparagus Snowpeas Container Type
40-ft reefer sea container
40-ft reefer sea container
40 x 48 inch pallet in reefer truck
88 x 125 inch P1P air pallet
88 x 125 inch P1P air pallet
Boxes 840 40-lb ½ cartons
4356 10-lb cardboard boxes
144 flats, each with 12 6-oz
clamshells
256 11-lb styrofoam
pyramid boxes
300 10-lb cardboard
boxes Winter prices $5–12 $3–6 $12–20 $11–22 $7–10 Typical price $8 $4 $14 $14 $7.50 Total value $6,720 $17,424 $2,016 $3,584 $2,250 Customs $100 $100 $60 $60 $50 USDA inspection
$99 $99 $83 $83 $83
FDA inspection
N/C N/C N/C N/C N/C
Lab services $120 $120 $120 $120 $120 Cold storage $210 $871 $87 $154 $180 Destruction variable Variable variable variable variable Source: Authors.
When a shipment is detained but not refused entry, the direct costs are somewhat different. In this case, the costs may include multiple USDA inspections for quality and condition; a one-time fee for fumigation; the out-of-pocket cost for reconditioning; the out-of-pocket cost for additional storage; and the loss of whatever percentage of the shipment cannot be salvaged or reconditioned. These costs are estimated for the five products of particular interest to this study in table 20.
Table 20. Illustrative costs of fruit and vegetable shipments that are detained but released (US$)
Cantaloupe Mango Red raspberries Asparagus Snowpeas Container Type 40-ft reefer sea
container 40-ft reefer sea
container 40x48 inch pallet
in reefer truck 88 x 125 inch P1P air pallet
88 x 125 inch P1P air pallet
Boxes 840 40-lb ½cartons
4356 10-lb cardboard
boxes
144 flats, each with 12 6-oz
clamshells
256 11-lb styrofoam
pyramid boxes
300 10-lb cardboard
boxes Winter prices $5–12 $3–6 $12–20 $11–22 $7–10 Typical price $8 $4 $14 $14 $7.50 Total value $6,720 $17,424 $2,016 $3,584 $2,250 Loss of value (%) 0–75% 0–75% 0–75% 0–75% 0–75% Customs $100 $100 $60 $60 $50 USDA inspections $297 $297 $166 $166 $166 FDA inspection N/C N/C N/C N/C N/C Lab services $300 $300 $300 $300 $300 Fumigation $120 $0 $0 $120 $120 Cold storage $210 $871 $87 $154 $180 Sorting/repacking variable variable variable variable variable Source: Authors.
Often, imported product is passed by APHIS and FDA, but then all or part of it is rejected at downstream destinations by the final buyer. When this happens, the incremental costs incurred include everything shown in table 20, plus ground or air transportation from the initial cold storage facility to the agreed delivery point, as well as several more USDA inspections, and, sometimes, additional reworking costs. Some buyers also charge the importer/distributor for the difference between the initially agreed sales price and whatever the buyer has to pay to fill the “short” from other sources, such as a terminal market.

48
5. Other Costs Associated with Compliance with Emerging Standards
Additional Costs of Noncompliance
At each stage in the supply chains for imported shrimp and fresh produce, companies can readily identify and quantify the immediate impact of noncompliance with either quality and condition or sanitary and phytosanitary standards, to the extent that the noncompliance translates into the kinds of product and out-of-pocket losses summarized in sections 3 and 4. However, sometimes noncompliance leads to more severe consequences, ranging from product recall to liability suits.
FDA guidelines categorize all recalls into 1 of 3 classes according to the level of hazard involved.
Class I recalls are for dangerous or defective products that predictably could cause serious health problems or death. Examples of products that could fall into this category are a food found to contain botulinal toxin or a food with undeclared allergens.
Class II recalls are for products that might cause a temporary health problem, or pose only a slight threat of a serious nature.
Class III recalls are for products that are unlikely to cause any adverse health reaction but that violate FDA labeling or manufacturing regulations. Examples might be a container defect (plastic material delaminating or a lid that does not seal); off-taste, color, or leaks in a bottled drink; or lack of English labeling in a retail food.
Obviously, the direct cost of a recall can vary widely, depending on the nature of the underlying problem, on how much product has been shipped, and how far it has spread through the wholesaling or retailing system. The general perception within the U.S. food industry is that all recalls do serious damage to the image and reputation of the firm, the brand, the category, and the product. Class I recalls are perceived as disastrous and therefore to be avoided at all cost. As noted previously, the Cyclospora problem with red raspberries from Guatemala effectively killed the entire fresh raspberry industry in that country, even though all parties acted very responsibly and swiftly to contain the damage and to prevent further recurrence.
Recalls sometimes foreshadow loss of permission to enter the United States market. As noted earlier, the Salmonella problem with Mexican cantaloupes effectively blocked the border completely for one entire season, and to this date only a few individual shippers have been able to get exempted from automatic refusal under the ongoing Import Alert. While the Mexican cantaloupe industry has stayed alive because domestic consumption is so large, the loss of U.S. market access has cost the industry millions of dollars in lost export sales and foregone profits. Moreover, even if the ban is eventually lifted, receivers will still be reluctant to accept Mexican shipments for years to come.
In worst-case scenarios, the recall occurs after damage to human health has already occurred. In such a situation, lawsuits may follow. These can have even greater financial consequences for the unfortunate firm(s) involved. Incremental costs associated with such suits include legal fees; assessment of regular, consequential, or punitive damages; loss of credibility and image; and, usually, loss of market share.
Of course, noncompliance with emerging environmental or labor standards also presents risks to enterprises involved in food importing, distribution, and marketing. Aside from damage to reputation, brand, and customer acceptance, noncompliance in these two other areas can result in fines, clean-up costs, and lawsuits from either directly injured parties or governments.

49
Industry Perceptions Concerning Costs of Noncompliance
Given the difference in magnitude between direct costs relating to a particular shipment and the much larger costs associated with loss of confidence, image, and market, it is not surprising that the interviews showed that industry actors are much more concerned about the latter than the former.
For importers, the main concerns voiced were loss of an important account, or of a key supplier, or, in the worst case, of a significant product source. Importers are well aware that major foodservice distributors, supermarket chains, and other kinds of retailers have very little patience with proven sanitary issues of significance—especially when the microbacteriological risk is great. Generally speaking, buyer reaction to pesticide residue problems is less drastic, partly because FDA often catches the problem before the product enters channels; if not, the buyer may never know that the problem existed. However, some chains have begun independent testing of products actually delivered, and they are known to react strongly when unacceptable residues are found, usually asking the supplier to submit third-party tests with future shipments on a pre-agreed sampling basis. When a given country goes on detention without physical examination (DWPE) status, importers say that they tend to seek other supply sources. Yet there are limits to that option, because seasonality often dictates the only possible source in a given month. When a particular supplier goes on automatic detention, most importers say that they will show some patience for previously reliable suppliers, while expecting the shipper to absorb all incremental costs associated with higher levels of sampling. When plant quarantine issues surface, again importers say that they will usually wait it out, while expecting the shipper to absorb all fumigation and other costs, usually deducting them from final liquidations. However, if a given shipper consistently has such problems—for example, having to fumigate all incoming shipments of asparagus or snow peas—the importer will begin to seek other sources of supply, because the resulting quality and condition will not be first-rate. Although none of the importers interviewed had an actual food safety department, several did have quality control managers who oversaw all aspects of standards, not just SPS.
Distributors’ stated reactions were similar to importers’, except that distributors have much less control over which offshore supplier is used, and often no direct contact with the actual shipper. As a result, they have less patience and less opportunity to effect change.
Final buyers for chain stores, foodservice operations, and large restaurant chains expressed huge concern over food safety issues, because of the obvious impact that a food-borne illness could have on their brand image and customer loyalty, and because of potential legal liability. The larger operations all had formal quality assurance departments, usually complete with in-house labs and highly qualified staff, but none of them could allocate, or at least would not reveal any possible allocation of, costs between categories, that is, perishables vs. dry goods, or meat vs. fish vs. produce.
Strategies for Dealing with Risks Associated with Noncompliance
For receivers and buyers of all types, the main remedies against SPS and other risks can be found in the terms of sale. Although a considerable volume of perishable imports still reaches the United States based on verbal orders, this is less true for shrimp than fresh produce, because a shipment of shrimp has a much higher market value and because letters of credit are more commonly used for frozen products than for fresh. Interviewees indicated a definite trend toward written contracts and orders documented via fax or email. Whether written or not, the terms of sale for perishable imports almost always predicate acceptance of a shipment on its having passed all USG inspections. When a shipment fails such inspections, typically the shipper and receiver discuss and reach agreement on how best to handle the problem load, whether through reconditioning, re-export, renegotiation of price, or conversion from fixed price to open consignment.
Since full transfer of title (and therefore risk) in shrimp imports typically occurs at or near the initial port of entry, subsequently, all risks associated with quality or condition defects or food safety issues generally

50
should be borne in a legal sense by successive buyers. However, in practice, shrimp buyers expect shippers to take responsibility or else sacrifice the customer relationship.
By contrast, in the case of fresh produce, a substantial percentage of imported volume still arrives on consignment, which means that the importer is acting as grower’s agent rather than actual buyer. Even when the produce is indeed shipped on a firm price basis, it is common for the terms of sale to call for “good delivery” to the hands of the end-receiver. In either case, if it does not “make good arrival” due to problems of quality, condition, pesticide residues found by the buyer, or food-borne pathogens later discovered, the onus usually falls on the exporter, who in turn tries to pass it back to the grower.
Many purchase-sale contracts for perishables also specify who bears the risk of product recalls and product liability. While suppliers operating in the domestic market are almost always required by buyers to purchase surety bonds and liability insurance to cover such risks, again the intermediaries tend to do all they can to pass the actual costs of a recall or liability suit back to their shippers. This may take the form of actual billing, or offsets against future sales liquidations, or, in extreme cases, countersuits.
Aside from these after-the-fact remedies, increasingly the main regulatory and private actors involved in supply chains for perishables are putting into place systems for preventing or at least minimizing SPS-related problems. In the 1980s, even before the phrase “good agricultural practices” was coined, exporters of perishables destined for the United States market were paying considerable attention to pesticide usage. They knew that FDA sampling sooner or later would catch their shipments if excessive residues or nonregistered chemical were found on their shipments. To prevent that from happening, on their own initiative, they began monitoring and sometimes directly controlling the choice and application of agrochemicals, sometimes supplying them in kind to affiliated producers. Those producers and exporters who also dealt with the EU markets, especially the UK, also began getting visits by supermarket sourcing and field agents, who examined a much broader range of agricultural practices. (U.S. supermarkets have done this only rarely).
Then, in the early 1990s, partly in response to the Chilean table grape contamination and Alar-in-apples incidents, some exporters and some receivers began contracting with outside certification services to examine their products on a sampling basis, and declare them (for example) “pesticide-free” or “Nutri-clean” certified. While this approach seemed plausible, focus group research found that consumers actually reacted negatively to any mention of pesticides, and sometimes even to certifications placed on the labels of packages, so the practice was largely abandoned in the United States in the mid-1990s. Yet food safety concerns within the trade and at FDA and CDC remained strong, less so about pesticide residues because practices were improving, but more so about food-borne pathogens. Legislation requiring HACCP in seafood helped address the main concerns with shrimp, but HACCP was much harder to apply in fresh produce. For this case, the FDA’s main approach was to develop with industry associations and representatives the guide to microbial hazards in fresh produce that was mentioned earlier, and also to increase sampling rates and reach out to foreign suppliers and governments through capacity-building efforts.
In parallel, many supermarket chains, restaurant chains, and foodservice enterprises in the United States began developing their own food safety guidelines to go along with quality specifications developed earlier. In the latter 1990s, these guidelines tended to crystallize into codes of practice, which initially had an advisory character, then became expectations and finally requirements for all significant suppliers. While some procurement organizations initially accepted self-certification, over time, most adopted audit requirements. While most U.S. chains continue to do their own quality and safety testing, increasingly they rely on third-party certification and audit by entities such as Primus Labs (no recommendation implied).
While EurepGAP certification is becoming the norm for fresh produce entering the EU from abroad, only recently have major buying organizations in the United States begun to accept it in lieu of third-party

51
certification,. Other schemes, such as SQF 1000, are vying for recognition in this hemisphere. As of this writing, EurepGAP appears to have achieved the larger number of certifications—on the order of 17,000 as compared with approximately 4,500 for SQF.
In any case, it is important to note that the full cost of achieving and maintaining such certifications, as well as periodic recertification and buyer audits, is almost always borne by the supplier. Increasingly it is becoming just another “cost of doing business.”

52
6. Conclusions
Findings
The interviews conducted among receivers, handlers, and buyers of frozen shrimp and selected fresh produce items, together with a literature and statistical review, lead the authors to conclude that:
1. Emerging standards of all types, but especially in the SPS area, are playing an increasingly important role in both facilitating and regulating U.S. imports, and this role is likely to expand into the future.
2. Major actors in the supply chains that were investigated all regard this challenge as necessary and desirable because it serves to (a) reduce commercial risks; (b) enhance consumer confidence; (c) support the emergence of global procurement systems based on arms-length transactions business partners; and (d) contribute to the growth and efficiency of their industry segments.
3. Final buyers—whether supermarket chains, restaurant chains, or foodservice distributors—are the main driving force for the expanding role of standards. These buyers’ expectations and requirements increasingly are embodied in private codes of practice that are backed up by contractual provisions, third-party certification and audit, and sampling and audit by the buying organizations themselves.
4. U.S. regulatory agencies such as FDA, EPA, APHIS, and Homeland Security have been working closely with the U.S. food industry to continue to formalize and improve public standards, especially for food safety and food security.
5. For the most part, suppliers of shrimp and fresh produce have responded willingly and effectively to the expanding role of standards and to the higher levels of expectations, despite the fact that they, the suppliers, must bear most of the investment and recurring costs. Their willingness is directly related to the need to stay competitive and to reduce potential liabilities attached to product recalls and injury to human or plant health, or the environment.
6. Major suppliers apparently encounter few SPS problems at the port of entry, and relatively few problems of poor arrival or rejection at final destination. On the other hand, small suppliers that enter the market sporadically continue to cause and account for most of the refusals that are evident from the data or reported by the interviewees.
7. In the case of shrimp, the main problems found are filth, Salmonella, inappropriate antibiotics, and unacceptable pesticide residues, in this order. For the fresh produce categories explored, the main problems are excessive levels of, or unregistered, pesticides and quarantine action pests (QAP) specific to each crop.
Recommendations
In the view of the authors, the World Bank might want to consider the following:
1. Providing financial and technical support, through both client government agencies and private sector producer and exporter organizations, to expand awareness of, primarily among producers, and compliance with, Good Agricultural Practices, especially for high-value export crops
2. Encouraging and supporting further development of EurepGAP standards for shrimp and tilapia

53
3. Encouraging and supporting further roll-out of EurepGAP standards within developing countries whose main export market is the EU
4. Encouraging and supporting further development and adaptation of SQF 1000 and SQF 2000 by the Food Marketing Institute in the United States to better fit the circumstances of developing countries
5. Encouraging and supporting further roll-out of SQF 1000 and SQF 2000 standards within developing countries whose main export market is the United States
6. Working closely with EurepGAP and SQF to make whatever adjustments in either are needed to achieve mutual recognition of equivalence
7. Expanding its Standards Facility to provide additional financial and technical resources to host country government agencies in client countries that want to upgrade their SPS systems for both domestic and exported food and agricultural items
8. Continuing to serve as a focal point for discussions and exchanges needed to achieve higher levels of harmonization, equivalence, and recognition among the main accreditation bodies, as well as greater outreach to, and adoption by, homologous national agencies.

54
Appendix 1. Value of U.S. Imports of Shrimp from All Countries, 1998–2003 (US$ 000) Countries of origin 1998 1999 2000 2001 2002 2003 Argentina 199 636 878 28,329 25,619 13,347 Bangladesh 90,847 112,670 144,866 92,244 87,626 82,836 Belize 11,119 22,804 22,111 20,623 16,698 40,121 Brazil 7,382 14,889 53,131 63,639 87,803 96,764 Burma 1,281 3,654 26,905 24,262 23,861 16,179 Canada 46,642 45,070 58,728 41,412 48,060 42,206 China, People’s Rep 36,041 50,149 136,526 192,392 298,665 442,440 Colombia 20,978 27,268 32,815 31,479 25,658 17,004 Costa Rica 10,832 15,536 14,192 9,907 8,507 4,259 Ecuador 572,047 403,399 191,411 222,619 199,110 211,283 El Salvador 30,906 25,240 14,790 15,923 6,364 5,229 Guatemala 18,807 16,052 15,776 19,121 15,278 18,949 Guyana 29,717 28,312 40,161 53,188 36,597 37,870 Honduras 67,152 67,322 84,118 72,575 64,078 57,009 Indonesia 188,739 167,327 190,806 155,508 153,093 168,047 India 150,847 160,811 240,318 265,078 363,783 408,942 Mexico 382,517 386,284 402,828 380,973 264,070 294,088 Nicaragua 31,298 37,159 44,132 36,266 31,100 24,187 Peru 45,499 17,988 4,088 6,028 10,781 8,766 Panama 91,552 68,929 64,648 70,452 57,141 50,489 Philippines 20,134 17,350 22,906 17,352 11,105 10,929 Thailand 1,088,179 1,198,105 1,497,949 1,266,872 977,256 997,953 Venezuela 47,698 93,566 141,635 78,557 65,468 60,864 Vietnam 75,909 109,141 235,718 381,608 481,529 595,046 Others 47,892 54,467 78,295 81,313 66,421 58,495 Total 3,114,214 3,144,128 3,759,731 3,627,720 3,425,671 3,763,302
Source: Department of Commerce, US Census Bureau, Foreign Trade Statistics.

55
Appendix 2. Volume of U.S. Imports of Shrimp from All Countries, 1998–2003 (MT) Countries of origin 1998 1999 2000 2001 2002 2003 Argentina 30.8 45.6 70.7 2,302.1 3,155.9 1,721.1 Bangladesh 6,318.0 8,781.1 10,191.2 8,726.3 8,534.8 8,143.4 Belize 1,386.1 2,240.5 2,238.5 2,761.9 2,554.9 6,218.4 Brazil 821.7 1,911.9 5,895.7 9,818.6 17,754.3 21,783.4 Burma 117.2 333.9 2,748.0 2,601.2 2,850.3 1,790.3 Canada 8,000.8 6,795.5 9,141.3 6,870.6 8,141.4 6,593.3 China, People’s Rep 7,006.4 8,965.3 18,176.6 28,159.0 49,689.7 81,100.4 Colombia 2,128.5 2,734.3 2,796.6 3,186.6 3,242.6 2,277.9 Costa Rica 831.3 1,227.1 1,089.4 1,016.6 990.8 468.1 Ecuador 64,547.6 50,450.2 19,141.8 26,653.5 29,714.8 34,030.8 El Salvador 4,008.9 2,723.0 1,409.2 1,542.4 581.0 602.4 Guatemala 2,369.5 1,816.1 1,635.6 2,686.5 2,409.8 3,081.0 Guyana 5,631.1 5,730.5 8,578.2 11,689.7 9,659.5 11,423.2 Honduras 8,614.3 7,411.9 7,870.5 9,684.7 9,795.9 9,706.1 Indonesia 15,284.7 16,028.2 16,758.3 15,847.6 17,436.9 21,662.9 India 20,151.0 21,829.4 28,502.3 32,948.5 44,298.8 45,476.8 Mexico 35,434.9 35,056.9 29,063.3 30,022.5 24,295.4 25,494.0 Nicaragua 3,798.1 4,329.3 4,826.5 5,035.2 4,735.2 4,506.7 Peru 6,947.2 2,156.2 465.8 747.7 1,783.3 1,502.6 Panama 10,190.4 7,757.2 5,850.5 6,884.2 6,403.9 6,153.4 Philippines 1,816.9 1,649.7 1,877.0 1,758.0 1,315.4 1,226.8 Thailand 92,286.8 114,591.6 126,418.8 136,183.9 115,165.6 133,279.7 Venezuela 5,721.6 12,058.8 14,929.6 9,472.4 10,324.7 9,957.7 Vietnam 5,029.5 8,095.9 15,749.7 33,288.4 44,706.2 57,384.2 Others 7,267.3 7,700.9 10,101.1 10,890.5 10,252.4 9,277.8 Total 315,740.6 332,421.0 345,526.2 400,778.6 429,793.5 504,862.4
Source: Department of Commerce, US Census Bureau, Foreign Trade Statistics.
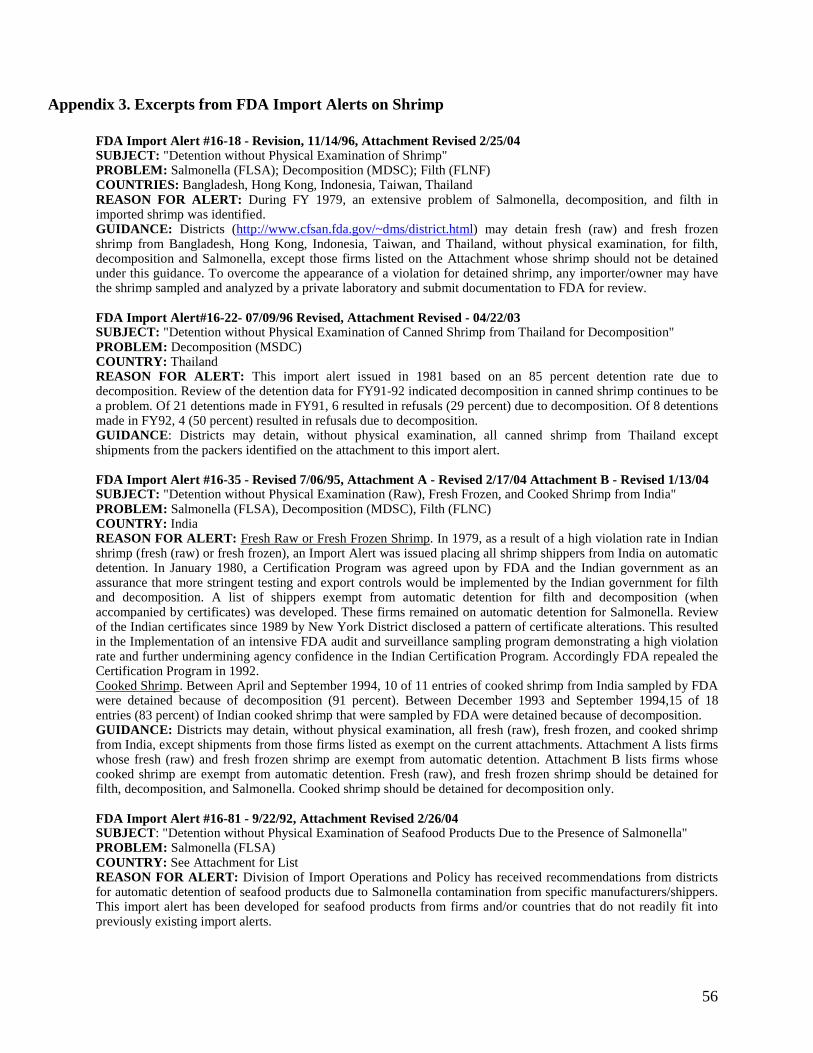
56
Appendix 3. Excerpts from FDA Import Alerts on Shrimp
FDA Import Alert #16-18 - Revision, 11/14/96, Attachment Revised 2/25/04 SUBJECT: "Detention without Physical Examination of Shrimp" PROBLEM: Salmonella (FLSA); Decomposition (MDSC); Filth (FLNF) COUNTRIES: Bangladesh, Hong Kong, Indonesia, Taiwan, Thailand REASON FOR ALERT: During FY 1979, an extensive problem of Salmonella, decomposition, and filth in imported shrimp was identified. GUIDANCE: Districts (http://www.cfsan.fda.gov/~dms/district.html) may detain fresh (raw) and fresh frozen shrimp from Bangladesh, Hong Kong, Indonesia, Taiwan, and Thailand, without physical examination, for filth, decomposition and Salmonella, except those firms listed on the Attachment whose shrimp should not be detained under this guidance. To overcome the appearance of a violation for detained shrimp, any importer/owner may have the shrimp sampled and analyzed by a private laboratory and submit documentation to FDA for review. FDA Import Alert#16-22- 07/09/96 Revised, Attachment Revised - 04/22/03 SUBJECT: "Detention without Physical Examination of Canned Shrimp from Thailand for Decomposition" PROBLEM: Decomposition (MSDC) COUNTRY: Thailand REASON FOR ALERT: This import alert issued in 1981 based on an 85 percent detention rate due to decomposition. Review of the detention data for FY91-92 indicated decomposition in canned shrimp continues to be a problem. Of 21 detentions made in FY91, 6 resulted in refusals (29 percent) due to decomposition. Of 8 detentions made in FY92, 4 (50 percent) resulted in refusals due to decomposition. GUIDANCE: Districts may detain, without physical examination, all canned shrimp from Thailand except shipments from the packers identified on the attachment to this import alert. FDA Import Alert #16-35 - Revised 7/06/95, Attachment A - Revised 2/17/04 Attachment B - Revised 1/13/04 SUBJECT: "Detention without Physical Examination (Raw), Fresh Frozen, and Cooked Shrimp from India" PROBLEM: Salmonella (FLSA), Decomposition (MDSC), Filth (FLNC) COUNTRY: India REASON FOR ALERT: Fresh Raw or Fresh Frozen Shrimp. In 1979, as a result of a high violation rate in Indian shrimp (fresh (raw) or fresh frozen), an Import Alert was issued placing all shrimp shippers from India on automatic detention. In January 1980, a Certification Program was agreed upon by FDA and the Indian government as an assurance that more stringent testing and export controls would be implemented by the Indian government for filth and decomposition. A list of shippers exempt from automatic detention for filth and decomposition (when accompanied by certificates) was developed. These firms remained on automatic detention for Salmonella. Review of the Indian certificates since 1989 by New York District disclosed a pattern of certificate alterations. This resulted in the Implementation of an intensive FDA audit and surveillance sampling program demonstrating a high violation rate and further undermining agency confidence in the Indian Certification Program. Accordingly FDA repealed the Certification Program in 1992. Cooked Shrimp. Between April and September 1994, 10 of 11 entries of cooked shrimp from India sampled by FDA were detained because of decomposition (91 percent). Between December 1993 and September 1994,15 of 18 entries (83 percent) of Indian cooked shrimp that were sampled by FDA were detained because of decomposition. GUIDANCE: Districts may detain, without physical examination, all fresh (raw), fresh frozen, and cooked shrimp from India, except shipments from those firms listed as exempt on the current attachments. Attachment A lists firms whose fresh (raw) and fresh frozen shrimp are exempt from automatic detention. Attachment B lists firms whose cooked shrimp are exempt from automatic detention. Fresh (raw), and fresh frozen shrimp should be detained for filth, decomposition, and Salmonella. Cooked shrimp should be detained for decomposition only. FDA Import Alert #16-81 - 9/22/92, Attachment Revised 2/26/04 SUBJECT: "Detention without Physical Examination of Seafood Products Due to the Presence of Salmonella" PROBLEM: Salmonella (FLSA) COUNTRY: See Attachment for List REASON FOR ALERT: Division of Import Operations and Policy has received recommendations from districts for automatic detention of seafood products due to Salmonella contamination from specific manufacturers/shippers. This import alert has been developed for seafood products from firms and/or countries that do not readily fit into previously existing import alerts.

57
GUIDANCE: Districts may detain, without physical sampling and analysis, all shipments of the specified seafood product(s) from the manufacturers/shippers listed in the Attachment to this alert due to the presence of Salmonella. The Attachment is identified by country. FDA Import Alert #16-124 - 11/16/01, Attachment Revised 2/24/04 SUBJECT: "Detention without Physical Examination of Aquaculture Seafood Products Due to Unapproved Drugs" PROBLEM: Unapproved drug residues REASON FOR ALERT: There has been an extensive commercialization and an increased consumption rate of aquaculture seafood products. As this industry grows, the use of unapproved new animal drugs and the misuse of approved new animal drugs in seafood raised through aquaculture also grows. The use of unapproved new animal drugs will have an impact on the safety of aquaculture products for consumers. GUIDANCE: Districts may detain without physical examination the products from the firms identified on the attachment to this alert.

58
Appendix 4. Excerpts from FDA Import Alerts on Fruits and Vegetables FDA Import Alert #22-01, 11/14/96, Attachment Revised 2/25/04 SUBJECT: "Detention without Physical Examination of Cantaloupes from Mexico” PRODUCT: Cantaloupes, fresh, frozen and processed (This includes fresh cantaloupe sliced/chopped for salad bars.) PROBLEM: Salmonella spp. COUNTRY: Mexico CHARGE: "The article is subject to refusal of admission pursuant to Section 801(a)(3) in that such article appears to contain Salmonella, a poisonous or deleterious substance which may render it injurious to health. [Adulteration, Section 402(a)(1)]." and "The article is subject to refusal of admission pursuant to Section 801(a)(3) in that it appears to have been prepared, packed, or held under insanitary conditions whereby it may have been rendered injurious to health [Adulteration, Section 402(a)(4)]." and "The article is subject to refusal of admission pursuant to Section 801(a)(1) in that it appears to have been prepared, packed, or held under insanitary [sic] conditions [Adulteration]" REASON FOR ALERT: During 2000, 2001, and 2002, there were four multistate Salmonellosis outbreaks traced back to Mexican cantaloupes. The pathogen identified in three of the outbreaks was Salmonella Poona and in the other outbreak Salmonella Anatum. Reported cases per outbreak ranged from 35 to 50. There were two deaths in California associated with the 2001 outbreak. At least 18 people were hospitalized. All outbreaks occurred between March and June. FDA's traceback investigations implicated Mexican cantaloupe from the states of Michoacan and Guerrero as the source of the four outbreaks. In 1999, 2001, and 2002, FDA collected samples of Mexican cantaloupes for Salmonella analysis. The salmonella-positive samples include nearly all the major cantaloupe producing states in Mexico including Sonora (7), Jalisco (1), Colima (1), Coahuila (1), Mexico (1), and Tamauilpas (1). Positive samples cover both the fall/winter and spring/summer season. Salmonella lives in the intestinal tracts of humans and other animals. Thus, the organism may be transmitted to humans by eating foods contaminated with fecal material from humans or other animals.
Random events in nature, such as an animal defecating on a cantaloupe growing in the field, may cause the product to become contaminated with Salmonella and, subsequently, result in illness. However, FDA believes that it is extremely unlikely that there would be repeated multistate outbreaks of salmonellosis, attributable to a specific species of Salmonella with indistinguishable pulse field gel electrophoresis (PFGE) patterns if contamination was derived from random events in nature.
Moreover, in the outbreaks of 2000, 2001, and 2002, the illnesses were spread over a wide geographical area in the U.S., as well as in Canada, and occurred over a 4 to 6 week period. These two facts also suggest that more than one shipment was the cause and make it extremely unlikely that a random natural event or events caused the contamination.
FDA believes that the source of Salmonella contamination is most likely attributable to a broader source of contamination. Sources of contamination may include irrigation of fields with water contaminated with sewage, processing ("cleaning and cooling") produce with Salmonella contaminated water, and/or poor hygienic practices of workers that harvest and process the produce, pests in packing facilities, and lack of adequate cleaning and sanitizing of equipment that comes in contact with the product.
Inspectional findings (conducted in response to the Outbreaks) at a number of cantaloupe growing areas and packing sheds in Mexico reveal that Mexican cantaloupe are indeed manufactured, processed, or packed under gross insanitary conditions. Further, these inspections underscore the lack of an overall environmental sanitation program, as well as apparent lack of regulatory authority in Mexican law to address the insanitary conditions that FDA believes lead to Salmonella contamination. In addition, practices that result in product from different states being commingled means that any shipment of cantaloupe may contain Fruit from states that have been the source of contaminated cantaloupe.
FDA believes that cantaloupe imported from Mexico appear to be adulterated under Section 801(a)(3) of the Act because they appear (1) to contain Salmonella, an added poisonous or deleterious substance that may render food injurious to health within the meaning of section 402(a)(1) of the Act and (2) to have been prepared, packed, or held under insanitary conditions whereby they may have been rendered injurious to health within the meaning of Section 402(a)(4)of the Act. In addition, the cantaloupe violate section 801(a)(1) of the Act in that they appear to have been manufactured, processed, or packed under insanitary conditions.
This alert covers both whole cantaloupe and sliced, chopped, or diced cantaloupe. The processing associated with producing fresh vs. intact produce increases the opportunity for contamination and the chance of cross contamination over an even larger volume of product. Furthermore, processes such as cutting, dicing, and slicing, increase the surface area available for contamination and growth of microorganisms. Nutrients to support microbial growth (that is,, from plant juices and exposed flesh) are also more available. Concerns about pathogens are further

59
amplified when the characteristics of the particular fruit or vegetable (e.g., pH) can support their growth. This is the case with many vegetables, certain soft fruit, and melons, including cantaloupe. GUIDANCE: Districts may detain, without physical examination, all raw fresh and raw fresh refrigerated cantaloupes, frozen and processed cantaloupe, including fresh cantaloupe sliced/chopper for salad bars offered for importation from the country of Mexico…. If a firm, grower, processor, packer, or importer believes that their product should not be recommended for detention under this import alert, they should forward information supporting their position to FDA…To assess the adequacy of the firm's agricultural, processing, and transportation practices, FDA personnel should review information submitted describing the firm's practices in the following areas: • Water quality in irrigation, packing, and cooling; • Manure use and biosolids, animal management; • Worker health and hygiene; • Sanitary facilities in field and packing house, • Disposal of sewage and Silage; • Maintenance program for cleaning, sanitizing equipment; • Field and packing facility sanitation; • Transportation; • If applicable, steps taken to identify and correct insanitary conditions which are indicated by positive analytical
results for Salmonella in the firm's product, or as a result of an epidemiological traceback investigation.
After reviewing these submissions, FDA, either solely or in conjunction with the relevant Mexican regulatory authority, may conduct a limited number of on-site inspections of the growing/processing areas to audit the validity of the information submitted to FDA. FDA intends to give priority in scheduling these inspections to firms or growers who provide certification from an independent institution or third party that has expertise in agricultural and transportation processes.
Since the article is subject to Refusal of Admission per Section 801(a)(1) of the Act, FDA considers submission of analytical results indicating the absence of Salmonella to be insufficient to overcome the appearance of the product having been prepared, packed, or held under unsanitary conditions. In addition, the appearance of a violation per Section 801 (a) (1) of the Act precludes reconditioning under Section 801 (b) of the Act.
60
Bibliography
Aquaculture Certification Council. 2003. “Aquaculture Facility Certification: Guidelines for Standards.” St Louis, MO. http://www.aquaculturecertification.org/accstan.html.
Boyd, C.E. 1999. “Codes of Practice for Responsible Shrimp Farming.” Global Aquaculture Alliance, St. Louis, MO. http://www.gaalliance.org/code.html.
Buzby, Jean, ed. 2003. “International Trade and Food Safety: Economic Theory and Case Studies,” AER No. 828. Economic Research Service, United States Department of Agriculture. November. http://www.ers.usda.gov/publications/aer828/aer828.pdf.
Calvin, L., L. Flores, and W.Foster. 2003. “Case Study: Guatemalan Raspberries and Cyclospora.” “Food Safety in Food Security and Food Trade.” International Food Policy Research Institute 2020 Vision: Focus 10, Brief 7. Washington, DC. September.
Carpenter, D.O., J.A. Foran, M.C. Hamilton, R.A. Hites, B.A. Knuth, and S.J. Swager. 2004. “A Global Assessment of Organic Contaminants in Farmed vs. Wild Salmon: Geographical Differences and Health Risks.” Institute for Health and the Environment. New York (?)University at Albany. Science (January 11). http://albany.edu/ihe/salmonstudy/summary.html.
Center for Disease Control and Prevention. 2002. “Multistate Outbreaks of Salmonella Serotype Poona Infections Associated with Eating Cantaloupe from Mexico --- United States and Canada, 2000–2002, ” Morbidity and Mortality Weekly Report. 51(46):1044–47. CDC, Atlanta, GA. November 22. http://www.cdc.gov/mmwr/preview/mmwrhtml/mm5146a2.htm.
_____. 2003. “Preliminary FoodNet Data on the Incidence of Food-borne Illnesses–Selected Sites, United States, 2002,” Center for Disease Control Health Advisory. Center. April 18. CDC, Atlanta, GA. http://www.cdc.gov/mmwr/preview/mmwrhtml/mm5215a4.htm.
_____. 2003. “From FDA: Consumers Advised that Recent Hepatitis A Outbreaks Have Been Associated with Green Onions.” Center for Disease Control Health Advisory. CDC, Atlanta, GA. November 15. http://www.state.sd.us/doh/Alerts/Alerts/CDC/cdc00164.htm.
Cowen, P., and R.A. Morales. 2002. “Chapter 2: Economic and Trade Implications of Zoonotic Diseases.” The Emergence of Zoonotic Diseases: Understanding the Impact on Animal Health. Workshop Summary, 10–25. Washington, DC: National Academy of Science. http://books.nap.edu/books/0309083273/html/10.html.
European Seafood Safety and Traceability Organisation (ESSTO). 2003. Press release. “New Food Safety and Traceability Organisation Founded.” European Seafood Safety and Traceability Organisation. August. http://www.essto.org/.
EurepGAP. 2004. General Regulations Fruit and Vegetables, Version 2.1. Euro Retailer Produce Working Group. January. http://www.eurep.org/downloads/fresh-pr/genreg/EurepGAP_GR_FP_V2-1Jan04.pdf.
61
Food and Agriculture Organization of the United Nations. 2003. FAO World Fisheries Statistics Website. Fisheries Information Center, FAO. http://www.fao.org/fi/default_all.asp.
_____. 2003. The State of World Fisheries and Aquaculture. Rome: FAO Fisheries Department. http://www.fao.org/docrep/005/y7300e/y7300e00.htm.
Food Safety Network. 2002. “Summary of On-Farm Food Safety Programs or Guidelines for Fresh Fruits and Vegetables Worldwide.” University of Guelph, Canada. http://www.foodsafetynetwork.ca/food/onfarm.htm.
FSIS. 2004. News release. “USDA Issues New Regulations to Address BSE.” Food Safety and Inspection Service, U.S. Department of Agriculture. January 8. http://www.fsis.usda.gov/oa/news/2004/bseregs.htm.
Gateway to Government Food Safety Information. 2003. “Countering Biosafety and Other Threats to the Food Supply” website. http://www.foodsafety.gov/~fsg/bioterr.html.
Georges, B., P.J. Unruh, M.J. Earls, and S.A. Hearne. 2003. “Animal-Borne Epidemics Out of Control: Threatening the Nation’s Health.” Trust for America’s Health (TFAH) website. August. http://healthyamericans.org/reports/files/Animalreport.pdf.
Golan, E., B. Krissoff, and F. Kuchler. 2002. “Traceability for Food Marketing and Food Safety: What’s the Next Step?” Agricultural Outlook 1. Economic Research Service, USDA. January-February. http://www.ers.usda.gov/publications/agoutlook/jan2002/ao288.pdf, 21–25.
International Union for the Protection of New Varieties of Plants. 2003. Texts of the Various Acts of the UPOV Convention. http://www.upov.org/en/publications/conventions/index.html.
Jerardo, A. 2003. “Import Share of U.S. Food Consumption Stable at 11 Percent,” Outlook Series. FAU-79-01. Economic Research Service, USDA. July. http://jan.mannlib.cornell.edu/reports/erssor/trade/fau-bb/text/2003/fau7901.pdf.
Josupeit, H., and I. Jacobsen. 2003. “Aquaculture and Trade,” GLOBEFISH Presentation. September. http://www.globefish.org/presentations/index.htm.
Kanduri, L., and R. Eckhardt. 2002. Food Safety in Shrimp Processing: A Handbook for Shrimp Processors, Importers, Exporters and Retailers. Oxford, UK: Fishing New Books, Blackwell Publishing.
Karst, T. 2001. FDA Bars Nogales Importer from Shipping Cantaloupes.” The Packer. Shawnee Mission, KS. June 4, 2001.
_____. 2002. “Mango Incident to Prompt More Packing Shed Audits.” The Packer. Shawnee Mission, KS. March 18.
_____. 2002. “Mexican Mangoes: Exports Expected to Rise in 2002.” The Packer. Shawnee Mission, KS. April 2.
_____. 2002. “FDA Bans Imports of Mexican Melons.” The Packer. Shawnee Mission, Kansas October 28.
62
_____. 2002. “Canada Closes Door to Mexican Cantaloupes.” The Packer. Shawnee Mission, KS. November 8.
_____. 2002. “Mexican Cantaloupes Still on Hold.” The Packer. Shawnee Mission, KS. November 11.
_____. 2002. “FDA Plans Uncertain for Mexican Cantaloupes.” The Packer. Shawnee Mission, KS.
_____. 2002. “Importer Faces Tainted-Melon Charges.” The Packer. Shawnee Mission, KS. November 25.
_____. 2002. “Offshore Sources Surge with Mexican Cantaloupe.” The Packer. Shawnee Mission, KS. November 27.
_____. 2002. “Sunkist, FFVA Chide APHIS Over Import Plan.” The Packer. Shawnee Mission, KS. December 9.
_____. 2002. “Two Farms Ok-ed to Ship Cantaloupe to the United States.” The Packer. Shawnee Mission, KS. December 9.
_____. 2003. “Eateries Yank Green Onions in Hepatitis Outbreak. The Packer. Shawnee Mission, KS. November 17.
Lucier, G., and C. Plummer. 2001. “Summer Area up, Prices Lower.”Vegetables and Melon Outlook. VGS-285-01. Economic Research Service, USDA. August 21. http://www.ers.usda.gov/publications/vgs/aug01/vgs285.pdf.
_____.2002–03. Vegetables and Melon Outlook. VGS-295 to 299. Economic Research Service, USDA. http://www.ers.usda.gov/publications/vgs/.
Moore, A. 2002. Press release. “Industry Discontented by Outcome and Timing of FDA Cantaloupe Decision.” Fresh Produce Association of the Americas. Nogales, AZ. October 28. http://www.fpaota.org/newsroom/102802.htm.
National Plant Board. 1999. “Safeguarding American Plant Resources: A Stakeholder Review of the APHIS-PPQ Safeguarding System.” Plant Protection and Quarantine, Animal and Plant Health and Inspection Service, U.S. Department of Agriculture, Washington, DC. July 1. http://www.aphis.usda.gov/ppq/safeguarding/.
Ohlemeier, D. 2002. “CDC Finds Decline in Food-borne Illnesses.” The Packer. Shawnee Mission, KS. May 8.
Pollock, S., and A. Perez. 2003. Fruits and Tree Nuts Yearbook-Summary. FTS-2003, Economic Research Service, U.S. Department of Agriculture, Washington, DC. October 21. http://www.ers.usda.gov/publications/fts/Yearbook03/FTS2003s.txt
_____. 2003. Fruits and Tree Nuts Outlook. FTS-304 to 307. Economic Research Service, U.S. Department of Agriculture, Washington, DC. http://www.ers.usda.gov/publications/fts/.
Reardon, T., J.-M. Codron, L. Busch, J. Bingen, and C. Harris. 1999. “Strategic Roles of Food and Agricultural Standards.” Paper presented at IAMA World Food and Agribusiness Forum, Michigan State

63
University, East Lansing, MI. http://www.ifama.org/conferences/9/1999/1999 percent20Congress/Forum percent20Papers_Proposals/Codron_Jean-Marie.PDF.
Regmi, A., ed., with J. Seale Jr., and J.A. Bernstein. 2001. “International Food Consumption Patterns.” “Changing Structure of Global Food Consumption and Trade.” WRS No. 01-1. Economic Research Service, U.S. Department of Agriculture. http://www.ers.usda.gov/publications/wrs011/wrs011.pdf
Scruton, T. 2002. “USDA Establishes San Diego Quarantine.” The Packer. Shawnee Mission, KS. December 9.
Segarra, A.E. 2001. “Agroterrorism: Options in Congress, Resources, Science, and Industry Division.” CRS Report for Congress. Congressional Research Service. December 19. http://fpc.state.gov/documents/organization/7944.pdf.
United Nations. 2003. Commodity Trade Statistics Database (COMTRADE). Statistics Division, United Nations. http://unstats.un.org/unsd/comtrade/.
U.S. Agency for International Development. 2003. “Trade Statistics for International Development.” TradeMapWebsite. USAID and UN/ITC. http://www.trademap-usaid.org/index.php.
U.S. Department of Agriculture (USDA). 2001. “Economics of Food-borne Disease: Food and Pathogens,” Briefing Room. Economic Research Service, U.S. Department of Agriculture. July 17. http://www.ers.usda.gov/Briefing/FoodborneDisease/foodandpathogens/.
_____. “Quality Standards–Fruits (Fresh Market).” Various issue and revision dates. Agricultural Marketing Service, USDA. http://www.ams.usda.gov/standards/frutmrkt.htm.
_____. Various issue and revision dates. “Quality Standards–Vegetables (Fresh Market).” Agricultural Marketing Service, USDA. http://www.ams.usda.gov/standards/vegfm.htm.
_____. 2003. Hot Issues: Spanish Clementines website. Animal and Plant Health Inspection Services, USDA. http://www.aphis.usda.gov/lpa/issues/clementine/clementines.html.
U.S. Food and Drug Administration (FDA). The Bioterrorism Act of 2002 Website. 2002. http://www.fda.gov/oc/bioterrorism/bioact.html.
_____. “FDA and CBP Bolster Safeguards on Imported Food,” FDA Press Release. U. S. Food and Drug Administration, U.S. Department of Health and Human Services. December 3, 2003. http://www.fda.gov/bbs/topics/NEWS/2003/NEW00988.html.
_____. FDA Pesticide Residue and Monitoring Program 1993-2001 Website. Center for Food Safety and Applied Nutrition, FDA, U. S. Department of Health and Human Services. April 2003. http://www.cfsan.fda.gov/~dms/pesrpts.html.
_____. FDA’s Seafood HACCP Program: Mid-Course Correction Website. Center for Food Safety and Applied Nutrition, FDA, U. S. Department of Health and Human Services. February 13, 2001. http://www.cfsan.fda.gov/~comm/shaccp1.html.

64
_____. 2001. Fish and Fisheries Products: Hazards and Control Guidance. 3d ed. Center for Food Safety and Applied Nutrition, FDA, U. S. Department of Health and Human Services. June. http://www.cfsan.fda.gov/ percent7Ecomm/haccp4.html.
_____. 2003. “Food Producers, Processors, and Transporters: Food Security Preventive Measures Guidance.” Guidance for Industry. Center for Food Safety and Applied Nutrition, FDA, U. S. Department of Health and Human Services March 21. http://www.cfsan.fda.gov/~dms/secguid6.html.
_____. 2002. “Food Safety: Current and Emerging Issues Influencing Public Health and Trade.” U.S. Food Safety Outreach Meeting Highlights. FDA, U.S. Department of Health and Human Services. September 17–26.
_____. 1998. “Guide to Minimize Microbial Food Safety Hazards for Fresh Fruits and Vegetables.” Guidance for Industry. Center for Food Safety and Applied Nutrition, FDA, U. S. Department of Health and Human Services. October 26. http://vm.cfsan.fda.gov/~dms/prodguid.html.
_____. 2003. “Importers and Filers: Food Security Preventive Measures Guidance.” Guidance for Industry. Center for Food Safety and Applied Nutrition, FDA, U.S. Department of Health and Human Services. March 21. http://www.cfsan.fda.gov/~dms/secguid7.html.
_____. 2003. “Interim Final Rule: Prior Notice of Imported Food Under the Public Health Security and Bioterrorism Preparedness and Response Act of 2002.” Federal Register 68 (197): 58975–59077. U.S. Government Printing Office. October 10. http://www.fda.gov/OHRMS/DOCKETS/98fr/03-25877.htm.
_____. 2003. ORAImport Program website. Office of Regulatory Affairs, FDA, U.S. Department of Health and Human Services. http://www.fda.gov/ora/import/ora_import_program.html.
_____. 2002. “Detention without Physical Examination of Cantaloupes from Mexico,” ORAImport Alert IA220. Office of Regulatory Affairs, FDA, U.S. Department of Health and Human Services. December 31. http://www.fda.gov/ora/fiars/ora_import_ia2201.html.
_____. 2003. “Prior Notice for Imported Food Questions and Answers,” Guidance for Industry. Center for Food Safety and Applied Nutrition, FDA, U. S. Department of Health and Human Services. December. http://www.cfsan.fda.gov/~pn/pnqaguid.html.
_____. 2003. “Prior Notice of Imported Food Under the Public Health Security and Bioterrorism Preparedness and Response Act of 2002,” Compliance Policy Guide. Center for Food Safety and Applied Nutrition, FDA, U.S. Department of Health and Human Services. December. http://www.cfsan.fda.gov/~pn/cpgpn.html.
_____. 2004. “Questions and Answers Regarding Registration of Food Facilities: Ed. 2 (Final Guidance),” Compliance Policy Guide. Center for Food Safety and Applied Nutrition, FDA, U.S. Department of Health and Human Services. January 12. http://www.cfsan.fda.gov/~dms/ffregui2.html.
_____. 2003. “Registration of Food Facilities Under the Public Health Security and Bioterrorism Preparedness and Response Act of 2002.” Compliance Policy Guide. Center for Food Safety and Applied Nutrition, FDA, U.S. Department of Health and Human Services. December. http://www.cfsan.fda.gov/~furls/cpgreg.html.

65
_____. 2003. “Retail Food Stores and Foodservice Establishments: Food Security Preventive Measures Guidance (Final Guidance).” Center for Food Safety and Applied Nutrition, FDA, U.S. Department of Health and Human Services. December 17. http://www.cfsan.fda.gov/~dms/secgui11.html.
_____. Seafood Information and Resources website. Center for Food Safety and Applied Nutrition, FDA, U. S. Department of Health and Human Services. http://www.cfsan.fda.gov/seafood1.html.
_____. “Food Safety A-Z: Reference Guide.” Center for Food Safety and Applied Nutrition, FDA, U. S. Department of Health and Human Services. http://www.cfsan.fda.gov/~dms/a2z-toc.html.
U.S. National Oceanic and Atmospheric Administration. Foreign Trade Information website. Fisheries Statistics and Economics Division, National Marine Fisheries Service, U.S. NOAA. http://www.st.nmfs.gov/st1/trade/index.html.
_____. 1970. United States Standards for Grades of Fresh and Frozen Shrimp. National Marine Fisheries Service, U.S. NOAA. http://seafood.nmfs.noaa.gov/Shrimp.pdf.
_____. 2002. Imports and Exports of Fishery Products, Annual Summary 2002. Fisheries Economics and Statistics Division, National Marine Fisheries Service, U.S. NOAA.
http://www.st.nmfs.gov/st1/trade/trade2002.pdf.
University of California, Davis. 2003. Seafood Network Information Center website. Sea Grant Extension Center, Food Science and Technology, University of California, Davis. http://seafood.ucdavis.edu/home.htm
Unnevehr, L.J., and N. Hirschhorn. 2000. “Food Safety Issues in the Developing World,” Technical Paper 469. World Bank.
Unnevehr, L.J. ed. 2003. “Food Safety in Food Security and Food Trade,” 2020 Vision for Food, Agriculture, and the Environment. Focus 10. International Food Policy Research Institute, September. http://www.ifpri.org/2020/focus/focus10/focus10.pdf.
World Seafood Market. 2003. “US FDA Enforcement Actions Rise Steeply in Last Four Years,” WSM News Digest. World Seafood Market. July 3.
http://www.worldseafoodmarket.com/NewsDigest/NewsDisplay.jsp?category=Food_Safety&&filename=FOO74.html
_____. 2003. “A Primer on Antidumping Law in the U.S.” WSM News Digest. November 12.
_____. 2004. “ASDA Vows to Fight Antidumping Petitions Against Imported Shrimp.” WSM News Digest. January 1.
_____. 2004. “GAA to Oppose Shrimp Antidumping Petition Before Authorities.” WSM News Digest. January 1.
_____. 2004. “SSA Files Antidumping Petition Against 6 Countries,” WSM News Digest. January 1. http://www.worldseafoodmarket.com/NewsDigest/NewsDisplay.jsp?status=10

66
_____. 2004. “AD Petition May Not Impact U.S. Shrimp Supplies in Near Term.” WSM News Digest. January 2.
World Trade Centers Association. 2003. STAT-USA National Trade Database. http://iserve.wtca.org/intro_ntdb.html.
World Trade Organization. 2003. “Trade by Sector.” International Trade Statistics. http://www.wto.org/english/res_e/statis_e/its2003_e/its03_bysector_e.htm. _____. 2003. WTO Trade Capacity Building Database for the Doha Development Agenda. http://tcbdb.wto.org/index.asp.