agricultural technology, productivity and employment
TRANSCRIPT

Agrekon, Vol 44, No 1 (March 2005) Thirtle, Piesse & Gouse
Agricultural technology, productivity and employment: Policies for poverty reduction C Thirtle1, J Piesse2 & M Gouse3
I have cherished the ideal of a democratic and free society in which all persons live together in harmony with equal opportunities. It is an ideal, which I hope to live for, and to see realised. But my lord, if needs be, it is an ideal for which I am prepared to die.
Nelson Mandela, 20th April 1964, Johannesburg Abstract
This paper begins by arguing that agricultural economics has an important contribution to make to the economic transition of the new democratic South Africa. Policies are required to reduce unemployment, poverty and inequality, but does the work of agricultural economists provide the policy makers with the information necessary to make the correct choices? In this context, we update our recent work on technology, efficiency and productivity in South African agriculture, for both the commercial and smallholder sub-sectors. For the commercial sector, this means extending the total factor productivity index and estimates of the demand for labour. For the smallholder sector, there are new results on the impacts of GM cotton and white maize on output and employment. However, this piecemeal approach treats the two sectors as entirely separate, when they are actually interdependent. Thus, a Ricardian model of dualistic agriculture is used to explain the historical development of dualism in agriculture, especially how the native agriculturalists were impoverished by the colonists. Then this model is adapted to resemble the Harris-Todaro model of urban unemployment is order to represent the present dual agricultural sector. This allows the current policy options to be compared, although real data is needed to estimate the relationships and so the full analysis remains incomplete.
1. Introduction
This paper investigates the contribution that agricultural economics needs to make if Nelson Mandela’s ideal is to be realised. Economic apartheid will not end until reasonable opportunities and incomes are available to the mass of
1 Professor, Department of Environmental Science and Sustainable Development, Imperial College London and Extraordinary Professor, Department of Agricultural Economics, Extension and Rural Development, University of Pretoria. 2 Reader, School of Social Science and Public Policy, King’s College London and Extraordinary Professor, University of Stellenbosch. 3 Researcher, Department of Agricultural Economics, Extension and Rural Development, University of Pretoria.
37
brought to you by COREView metadata, citation and similar papers at core.ac.uk
provided by Research Papers in Economics

Agrekon, Vol 44, No 1 (March 2005) Thirtle, Piesse & Gouse the population rather than being the privilege of the few. Recent data shows that the problems are still enormous. The Labour Force Survey reported by Statistics South Africa put the September 2002 rate of unemployment at 41.8% according to the broad definition (wanting work) and 30.5% by the narrow definition of actively seeking a job. The proportion of the total population classified as living in poverty in 1995 was 50%, but as Table 1 shows, the figure was 70% for the rural population and the disparity between urban and rural dwellers is even more pronounced with respect to access to facilities. There was also a huge racial disparity, with 1% of whites below the poverty line, as compared with 61% of Africans and a pronounced gender bias (May, Woolard & Klasen, 1998). About 60% of female-headed households were poor, as compared with 30% with male heads, but some of this reflects the rural location of a greater proportion of female-headed households. Finally, with respect to inequality, the Gini coefficient is around 0.6, which is as high as the most unequal societies in Latin America (McDonald & Piesse, 1999).
Table 1: Rural–urban distribution of poverty and access to basic services (1995) Location Population share (%) Poverty share (%) Poverty rate (%) Rural 50.4 71.6 70.9 Urban 49.6 28.4 28.5 Total 100 100 49.9 In dwelling facilities Service Running water Sanitation Electricity Telephone Urban (%) 74.1 65.5 82.4 48.4 Rural (%) 16.8 10.9 21.1 7.5
Source: McDonald and Piesse (1999), adapted from May, Woolard and Klasen (1998).
The next section considers the role of agricultural economists and how we can contribute to poverty reduction. Section three reviews and updates the work on productivity in commercial agriculture with emphasis on maintaining employment as wages rise. In South African agriculture, the existence of a semi-subsistence sector may allow poverty to persist in peaceful coexistence with healthy growth of per capita incomes in the rest of the economy. Thus, section four similarly updates our work on technological change in the semi-subsistence sector, with emphasis on genetically modified crops. Section five considers the issue of dualism, showing that the two agricultural sectors need to be modelled together so that policies can be compared. 2. Why agricultural economics matters Forty years after Mandela’s trial, his ideal is closer to realisation than all but the most optimistic would have expected forty years ago. But as Fidel Castro is supposed to have said after his guerrillas had entered Havana and Batista had
38

Agrekon, Vol 44, No 1 (March 2005) Thirtle, Piesse & Gouse
fled, “OK, that was the easy part, now we have the tougher job of running the country”. Within a few years the Cuban economy was in ruins - Che Guevara, may have been a good communist but he was a lousy economist.4 South Africa has also had a revolution, but unless we, as members of LEVSA, do better than Guevara, Mandela’s vision will not become a reality. South Africa is the world’s social science laboratory, so we are in the right place at the right time, with everything to play for. In the European Union, agricultural economists simply add to butter mountains and wine lakes that cripple the taxpayer. In the USA, they increase the exported surpluses that lower world prices and destroy developing country agriculture. However, in South Africa it is the poor majority who will gain most from agricultural growth, which increases the incomes of smallholders. At the same time, growth in the commercial sector leads to lower food prices, benefiting the urban poor. The new South Africa has to succeed in reducing the current levels of unemployment, inequality and poverty as soon as possible, while in the longer run equality of opportunity and economic freedom requires education. 2.1 What do we contribute? What role do agricultural economists play? The stylised facts are quite simple. We obviously generate information on economic relationships. For instance, we estimate price elasticities for inputs and outputs, which should allow policy makers to know what the results of policies such as taxes and minimum wage legislation. But there is another function. The R&D work of agricultural scientists in public institutions (i.e. the Agricultural Research Council (ARC) and the universities) and private companies (such as multinationals like Monsanto and Delta and Pineland) produces new biological, land saving, technologies that increase yields. Mechanical technology, that saves labour, has always been much more the province of private manufacturers, such as the tractor producers. These technologies are taken from the trial plot or the engineering laboratory to the farmers, either by public sector extension agents
4 Guevara served as chief of the Industrial Department of the National Institute of Agrarian Reform, President of the National Bank of Cuba and Minister of Industry, which put him in a fine position to wreck the economy. His performance would not have surprised the Russians, who had a story about the May Day parade. The massive arrays of troops, tanks, guns, rockets and aircraft are followed by a couple of dozen paunchy, shambling middle aged men in business suits. “What on earth are they doing there”, asked a foreign observer and his Russian companion replied, “Ah, those are economists – you cannot imagine their awesome destructive power”.
39

Agrekon, Vol 44, No 1 (March 2005) Thirtle, Piesse & Gouse
or company sales staff. This diffusion process imposes further lags and uses further real resources, but hopefully the result is improved productivity. The agricultural economist has no role in this process except evaluation, so we are practically accountants.5 Is this worth doing? We are increasingly sure that it is. We do know that throughout history, nations with accounting systems do better than those without, provided that the accounting system is informative. Michael Lipton (1989) has long argued the reason behind Africa’s failures. The underlying problem has been that the data and measurement of economic performance has been too poor to guide policy.6 2.2 From data, to analysis, to policy: Can we reduce unemployment,
inequality and poverty? Data is the input for the measurement of economic activity, followed or accompanied by causal explanation. Griliches (1994) makes the case that even in the USA, data is the constraint limiting progress in the study of R&D and productivity. Given data, the economists have to perform their key function, which is to inform the policy process in order to make it more effective. The economist has no business dictating the goals of economic activity (Robbins, 1935), but still has a role to play in the policy process by ensuring that the policies are efficient in obtaining the democratically identified objectives. This means accurate targeting and attributes such as incentive compatibility. They may also play a role in implementation, for example in extension. But there is no positive marginal product unless there is an improvement in social welfare. Ruttan (1982) makes an issue of articulation. The system is only as good as its weakest link and the segments must fit together. The US has been more successful than most and organisation has some part in that. It is not coincidental that the USDA is the primary data collection agency and is also the largest single employer of agricultural economists working in research. The data collectors are not separated from the users as they are in the UK and
5 This is a slightly pejorative term to most economists, but Sir John Hicks was awarded a Nobel prize for his work, which he regarded as basically accountancy. Valuing social science research is an infant industry, which seems to have so far paid little attention to this product, which is simply finding out for the policy makers which new technologies work best. Whatever our contribution, we should live by the same rules as we apply when evaluating R&D systems, which is simply, what is the social rate of return? See Schimmelpfennig and Norton (2003) for a recent contribution and review of the literature. 6 On the need for more information on South African agriculture, see Frick and Groenewald (1999).
40

Agrekon, Vol 44, No 1 (March 2005) Thirtle, Piesse & Gouse
most other countries.7 The rest of the research community is concentrated in the land grant colleges, some with job descriptions that include extension, with the physical scientists and some of the data collectors also at these institutions. Finally, the policy process involves the Deputy Secretary of Agriculture, who is usually on loan from a Land Grant college. South Africa does not have the resources to emulate the USA, but some effort is needed to ensure articulation. The national Department of Agriculture collects good data, although with some gaps. The ARC and the universities do good scientific research. In the work summarised here, we measure agricultural performance and explain successes and failures. If this can be translated into policy and those policies are implemented by the Provincial Departments of Agriculture, the poor will be better fed and have more income. 3. Technology and productivity in commercial agriculture: An update
Technological progress is like an axe in the hands of a pathological criminal. Albert Einstein
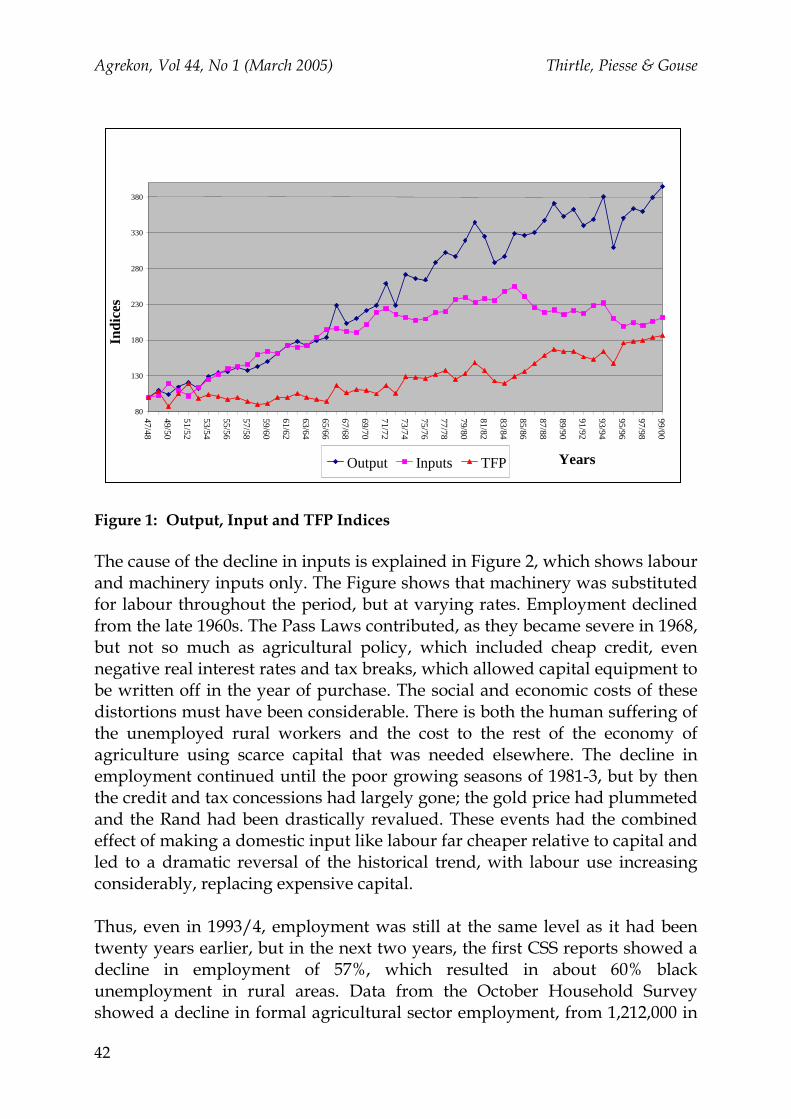
We turn now to the information available from studies of production and productivity in commercial agriculture. The ratio of aggregate output to an aggregate of all inputs combined gives a measure of total factor productivity (TFP) or multifactor productivity. Thirtle, Sartorius von Bach and Van Zyl (1993) used this approach to produce the first TFP index for South African commercial agriculture, which is updated in this paper.8 Figure 1 shows that before 1965, the index of outputs and inputs rose at the same rate, so TFP did not grow. From 1965/66 to 1999/2000 the growth rate was 1.7%, mainly due to the continued growth of output but little change in inputs. Then, from 1984/85, there was a marked decline in inputs, at a rate of 1.1% per annum. The paper was updated from 1991 onwards after the Central Statistical Service (CSS) belatedly released data on farm employment, which had previously been unavailable. The extended series show that there was a marked fall in output in 1994/95, followed by a recovery. The input series also fell in1994/5 and 1995/6, so that TFP continued to grow, after a single year of decline.
7 In the UK, when the Agricultural Research Council (ARC) was formed it had economists, but they found that being surrounded by scientists was not to their liking, so they left and set up the Agricultural Economics Unit at University of Oxford. In South Africa, the Impact Assessment Unit of the ARC is an attempt to include social scientists. 8 Much of the earlier work is easily available in Thirtle, Van Zyl and Vink (2000). Thanks to Ferdi Meyer and PG who helped to update the index.
41
Agrekon, Vol 44, No 1 (March 2005) Thirtle, Piesse & Gouse
80
130
180
230
280
330
380
47/48
49/50
51/52
53/54
55/56
57/58
59/60
61/62
63/64
65/66
67/68
69/70
71/72
73/74
75/76
77/78
79/80
81/82
83/84
85/86
87/88
89/90
91/92
93/94
95/96
97/98
99/00
Years
Indi
ces
Output Inputs TFP
Figure 1: Output, Input and TFP Indices The cause of the decline in inputs is explained in Figure 2, which shows labour and machinery inputs only. The Figure shows that machinery was substituted for labour throughout the period, but at varying rates. Employment declined from the late 1960s. The Pass Laws contributed, as they became severe in 1968, but not so much as agricultural policy, which included cheap credit, even negative real interest rates and tax breaks, which allowed capital equipment to be written off in the year of purchase. The social and economic costs of these distortions must have been considerable. There is both the human suffering of the unemployed rural workers and the cost to the rest of the economy of agriculture using scarce capital that was needed elsewhere. The decline in employment continued until the poor growing seasons of 1981-3, but by then the credit and tax concessions had largely gone; the gold price had plummeted and the Rand had been drastically revalued. These events had the combined effect of making a domestic input like labour far cheaper relative to capital and led to a dramatic reversal of the historical trend, with labour use increasing considerably, replacing expensive capital. Thus, even in 1993/4, employment was still at the same level as it had been twenty years earlier, but in the next two years, the first CSS reports showed a decline in employment of 57%, which resulted in about 60% black unemployment in rural areas. Data from the October Household Survey showed a decline in formal agricultural sector employment, from 1,212,000 in
42

Agrekon, Vol 44, No 1 (March 2005) Thirtle, Piesse & Gouse 1995 to 504,000 in 1997, a fall of 58%. This coincided with the democratically elected government taking office and the introduction of minimum wage legislation, combined with a package of farm workers’ rights. There is little doubt that employment decreased, but the extent of the decline is not clear, as later statistics show a lesser fall. For instance, recent issues of the Abstract of Agricultural Statistics show a fall of 34% in employment in agriculture, hunting, forestry and fishing. The most recent release from Statistics South Africa, the Census of Commercial Agriculture 2002, states there was a decline over the nine years from 1993 of only 13.9%. This includes the recovery years from 1998 to 2002, but it still puts employment at 940,815 in 2002, whereas the Labour Force Survey reports 839,000, 11% lower.
40
90
140
190
240
47/48
49/50
51/52
53/54
55/56
57/58
59/60
61/62
63/64
65/66
67/68
69/70
71/72
73/74
75/76
77/78
79/80
81/82
83/84
85/86
87/88
89/90
91/92
93/94
95/96
97/98
99/00
Years
Indi
ces
Machiner Labour
Figure 2: Machinery and labour inputs These figures are not entirely comparable, but they cannot be reconciled, which illustrates that the margin for error in recoding these important labour statistics is totally unacceptable and makes estimating the employment effects of policies like the 2003 minimum wage almost impossible. To judge the effects of an increase in the minimum wage it is necessary to estimate the elasticity of labour demand with respect to the wage. The South African Department of Labour (1996) reports estimates of this elasticity to be around –0.7, which would mean that a 10% increase in wages would reduce employment by 7%. They note that this is not extreme, but still not acceptable where unemployment is high. The historical estimate of the elasticity of labour demand for commercial agriculture is of a similar magnitude. The two most recent estimates for the
43

Agrekon, Vol 44, No 1 (March 2005) Thirtle, Piesse & Gouse
sector are Bailey et al (2003, Table 2), which reports –0.49 and Balcombe et al (2000), which is -0.59. However, the elasticity is likely to vary by region and crop. Thus, it is useful to have crop specific estimates, such as Conradie (2004), which reports elasticities as low as –0.3 for regular workers in the wine and table grape sectors, and a high of –0.55 for seasonal workers.
TFP growth in South African agriculture is mainly the result of reducing the input of labour, as is the case in the developed countries. But, in the developed countries labour is scarce and hence expensive, whereas in South Africa it is abundant and cheap. The problem with the minimum wage legislation is that it is likely to exacerbate this process, which is unsatisfactory when job creation is a major objective. Much more could be reported on commercial agriculture, but it would detract from the focus on the employment problem. Instead, we now turn to recent research on the African smallholder sector, which is mainly on technical and institutional change. There, lack of data for the sub-sector, apart from scattered sample surveys, is likely to prevent proper investigation of the policy options.9 For instance, the employment potential of GM crops is only now being investigated. 4. GM technology in smallholder agriculture 4.1 Background In the non-commercial or smallholder sector, the introduction of genetically modified crops may improve the welfare of the poor. South Africa is the only African country in which GM cotton and yellow and white maize have been commercially released. Bt crops contain the genes controlling the production of a natural insecticide, Bacillus thuringiensis (Bt), which acts specifically on Lepidoptera, including bollworm in cotton and stem borers in maize and is harmless to all other insects. In 1998, the smallholders in Makhatini Flats, a rain fed cotton area in North East KwaZulu Natal, began adopting Bt cotton. In only four years, adoption spread from handful of pioneers to over 90% of the farms in 2001/2 (Bennett, 2002; ISAAA, 2004). Monsanto owns the Bt gene that is used by Delta Pineland in developing the varieties used, all commonly called Bollgard. Several modern non-GM varieties were also available from Vunisa Cotton (Zulu for “to harvest”), the sole supplier of seeds and chemicals in Makhatini Flats. Vunisa is a private company that also provided support services for the farmers through their extension officers, including credit for land preparation, chemicals and seed.
9 But see the information collected in Lipton, Ellis and Lipton (1996) and Lipton, De Klerk and Lipton (1996).
44

Agrekon, Vol 44, No 1 (March 2005) Thirtle, Piesse & Gouse Credit was crucial, as most farmers cannot afford to grow cotton without it and the forthcoming crop was the only collateral. Vunisa was able to lend on this basis because it was the sole buyer, sending the cotton to their gin in Pongola. The main source of information of cotton production is a survey of 100 farmers, conducted jointly by University of Pretoria and University of Reading, covering the 1998/9 and 1999/2000 seasons. Data were collected on household background, farming practices and problems, the reasons for adopting Bt cotton and input costs and returns. Rather than relying on farmer recall, most of the crucial information used in evaluating the technology came from Vunisa farm. The smallholders are all Zulus, with no large commercial producers. Cropping land is unfenced, so livestock damage crops due to the communal grazing system. Because of out migration of younger men, 42% of the household heads were female and 76% were over forty years old. Mixed cropping is the norm, with an assortment of maize, beans and vegetables, grown for subsistence and cotton is the only cash crop. As is common in South Africa, most households (75%) also kept livestock and almost 30% earned off-farm income from sources such as the police service, truck driving and mining. Over 60% of the farmers “owned” less than five hectares of land, with the largest concentration being 37%, in the 2.5-5 hectare group. Cotton areas varied from one hectare to a single farm of twenty-five hectares. Evaluating the technology is complicated by two factors. In the first year farmers with less than 5 hectares had an average yield of 510kgs/ha and only 15% adopted the Bt variety. Those with over 5 hectares produced only 378 kgs/ha and 25% were adopters. Thus, any simple comparison will be biased by this positive correlation of farm size and adoption and the negative correlation with yield. Farm accounting efficiency measures, based on Vunisa’s data, were reported in Thirtle et al (2003). This showed that there was no clear advantage to the Bt variety in the first year, but the second year results are far clearer and the outcome entirely unambiguous. The yield gain of 40% and the lower chemical cost easily offset the extra seed cost, so that the average gross margin for the adopters is 675 Rand compared with 428 Rand for the non-adopters, or 58% higher. The share attributable to the Bt variety was 28%, which is worth 190 Rand per hectare. This result can be compared with Monsanto’s trial results, which showed a gain of 944 Rand per hectare, due to higher trial plot yields and a greater reduction in chemical use (Bennett, 2002). The 40% yield increase reported by Thirtle et al (2003) for 1999/2000 may not be unreasonable. Studies for developed countries show lower yield gains, but
45

Agrekon, Vol 44, No 1 (March 2005) Thirtle, Piesse & Gouse Qaim, Cap and de Janvry (2003) and Qaim and de Janvry (2005) compare commercial farms and smallholders in Argentina and found that the yield gain to large farms is 19%, while the smallholders gain 41%. This is remarkably similar to the South African results and is attributed to the different financial and human capital constraints that cause smallholders to invest less in chemical pest control, with a resulting increase in crop damage. This is also applies to South African small-farmers. By the time a small-scale farmer has noticed bollworms, bought pesticides with a limited amount of credit and started to spray, severe damage has already been done. Many farmers indicated that they were not even able to apply pesticides on their whole field due to lack of time, knapsacks, labour and the cost of pesticide. With poor education level causing problems with mixing pesticides and the calibration of knapsack spraying nozzles, the efficacy and efficiency of pesticide applications is in doubt for a large number of small-scale farmers. However, the latest results show that single year samples are of limited significance. In 2003/4 there was a small but careful sample survey conducted by University of Pretoria and CIRAD and the preliminary results show that in a drought year there is no significant yield advantage to the Bt variety. Thus, the variations due to the weather mean that any study based on a sample for a single year can be entirely misleading. If it is true that there is no gain in some years and substantial advantages in others, we can say only with confidence that the expectation is positive and that Bt seems to reduce the annual weather-related variance. Even this is a gain to risk averse, poor farmers. 4.2 Pesticide productivity: why yields increase so much in smallholder
agriculture Thirtle et al (2003) also modelled the efficiency of farmers adopting Bt. However, pesticide was treated in exactly the same manner as the other inputs, which is not entirely acceptable. There is no output gain from its use if there are no pests and when there are, the pesticide controls damage, keeping yields close to what they would have been. Thus, in common with Huang et al (2002) for China and Qaim, Cap and de Janvry (2003) and Qaim and de Janvry (2005) for Argentina, Shankar and Thirtle (2005) take a ‘damage control’ approach to estimating the role of pesticides and Bt technology. This explains why Qaim, Cap and de Janvry (2003) found relatively large yield gains in the case of smallholders. As pesticide input increases, the abatement function approaches 1, so there is no destruction due to pest damage and maximum potential output is realized, but as pesticide application declines, it falls towards 0. The results for the conventional part of the model add nothing to those above, but the damage control parameters are highly significant, with signs that
46

Agrekon, Vol 44, No 1 (March 2005) Thirtle, Piesse & Gouse conform to expectations. Particularly, increasing pesticide does reduce damage and the Bt dummy variable is positive, which confirms that adoption of Bt varieties is effective in controlling pest damage, with less pesticide application. The impacts of pesticide use are shown in Figure 3. The significant gap between the non-Bt and Bt curves illustrates the pest control efficacy of Bt adoption. With no pesticide applied, non-Bt producers would realize only about 16% of potential output. By adopting Bt, about 40% of potential output can be recovered even without application of insecticide. At each point, the slope of the Bt curve is lower than the slope of the non-Bt curve, suggesting that Bt adoption reduces the marginal productivity of pesticide by providing a natural substitute. At the current average application rate of 2.2 litres per hectare, a non-adopter reaches only about 36% of potential output. A Bt user, at the current average application rate of 1.1 litres per hectare, half of the non-adopter average, realizes 55% of potential output. Although use efficiency cannot be determined without reference to input costs, realization proportions of 36% and 55% suggest under-use. Almost 9 litres would be required to get close to 100% of potential output. Another important point in the Figure is that the non-Bt damage control curve is convex for a significant portion, indicating increasing marginal efficacy of insecticide input at lower ranges. As will be seen below, this has an important implication for current use efficiencies.
0
0.2
0.4
0.6
0.8
1
1.2
0 2 4 6 8 10
Insecticide per ha (litres/ha)
Prop
ortio
n of
max
imum
pot
entia
l out
put
real
ized
Non-BtBt
Figure 3: Damage control
47

Agrekon, Vol 44, No 1 (March 2005) Thirtle, Piesse & Gouse The efficiency of insecticide use can be assessed by comparing the Value Marginal Product (VMP) of insecticide with the insecticide price. This was calculated holding all other inputs constant at the sample average values, while varying the quantity of insecticide. An additional litre of pesticide costs approximately 9.3 Rand ($0.93) per hectare, as Figure 4 shows.
02468
1012
0 2 4 6 8 10Insecticide (litres/ha)
Ran
d pe
r ha
vmp/haprice/ha
Figure 4: Per-hectare insecticide productivity (non Bt) Figure 4 is striking in that the VMP curve has an inverted U shape instead of the typical monotonically declining shape. However, this is not too surprising given the convex non-Bt damage control curve in Figure 3. Indeed, as Lichtenberg and Zilberman (1986) showed, this shape frequently occurs in the damage control specification and by ruling it out, conventional specifications like the Cobb-Douglas can miscalculate the productivity of pesticide input. The Figure shows that the current average level of 2.1 litres per hectare, is clearly sub-optimal, since it lies on the rising portion of the VMP curve. The correct level is 4.7 litres/ha, where the declining VMP intersects the input price. The calculations indicate that variable profits at this level exceed those at zero insecticide use by about 13 Rand ($1.3) per hectare. Thus, 4.7 litres per hectare is the optimal rate for the average producer and the current level at 2.1 litres per hectare means that application is at less than 50% of the optimum. Thus, whereas Huang et al (2002) reported pesticide overuse of 40 kg/ha in China, African smallholders use far too little and consequently suffer serious crop losses. This is why Bt gives impressive gains in yields in Makhatini Flats. There are several factors that could cause under-use in Makhatini. First, there are financial reasons. Pesticide purchases often require larger cash outlays than are available to smallholders at Makhatini, particularly mid-season when
48

Agrekon, Vol 44, No 1 (March 2005) Thirtle, Piesse & Gouse reserves are low and other crops and activities compete for available cash and many farmers complain they are unable to get sufficient credit. Secondly, those who can afford the chemicals, do not own a knapsack sprayer and would hire someone do perform the task. But, labour availability for spraying poses a similar dilemma. Over the Christmas period, an important time in the South African cotton cycle, hired labour is often unavailable (Gouse, Kirsten & Jenkins, 2003). Thirdly, pest infestations vary considerably between years and if farmers apply insecticide proactively on the basis of long-run experience, applications will be inadequate in a bad year. This highlights the difficulties of cross-sectional analysis. A season that is unusually wet results in pesticide residue being washed off the plants, so that further application is required. A similar analysis of the Bt users showed that the VMP curve was monotonically declining with increased pesticide applications. At current average application rates of about 1 litre per hectare, Bt users are also under-applying insecticide relative to the optima of almost 2 litres per hectare. Thus, having halved pesticide inputs, Bt adopters are using about half the optimal amount of pesticide, like the non-adopters. Although the Bt gene provides resistance to the bollworm, so that bollworm-specific pesticides sprays are no longer needed, Hofs and Kirsten (2002) note that the leaf hoppers and aphids are causing increasing damage. Clearly, the current applications of pesticides to deal with these other pests are inadequate. Indeed, if adequate pesticide was used for these pests, they would replace the bollworm chemicals, leaving the overall application rate close to its initial level. For both the adopters and non-adopters, these optimal application rates take no account of the environmental and health costs of pesticide use. Private optimal application rates exceed the socially optimal application rates. Thus, the under-use reported here would be reduced if these negative externalities could be measured and allowed for. 4.3 Institutional failure in Makhatini Flats This review shows that Bt cotton had been adopted by over 90% of the cotton farmers in Makhatini Flats and seemed to offer substantial advantages over non-Bt cotton varieties. Indeed, despite the variability of benefits the evidence shows that Bt cotton is technologically superior given higher expected yield and lower risk. The institutional arrangements were also successful. The Land Bank supplied credit and the risk of default was shared between the Land Bank and Vunisa. Vunisa administrated production loans from the1998/99 season and there was a loan recovery rate of close to 90%.
49

Agrekon, Vol 44, No 1 (March 2005) Thirtle, Piesse & Gouse Then, in 2001/2 a new company, Makhatini Cotton (Pty) Ltd (MCG) erected a new gin on the Flats, right next to the Vunisa depot. Some farmers avoided repaying their loans by selling to the new gin, effectively reducing their collateral to zero. Vunisa lost substantial sums through the defaulting loans and the following year no longer offered inputs on credit. There is a clear lesson here that is widely understood already in Africa. The only asset that can be used as collateral for a loan is the crop itself. Loans are not made for the purchase of maize seed as the farmers can eat it, but with cotton, if there is only one mill, the company owning the mill can make loans, since the output is a guarantee of repayment. If there is more than one mill the farmers will default and inability of financial corporations to enforce repayment of loans, combined with the fact that most farmers on the Flats cannot finance their own cotton production inputs, means little production. Thus whereas with complete markets there are policies to preserve competition and prevent rent seekers from obtaining monopoly profits, in this situation monopsony needed to be maintained. Until the institutional arrangements are changed in such a way that lenders can recover their loans, an alternative approach is required. The current arrangement is that Makhatini Cotton do the planting and the farmers receive a share of the revenue for weeding, harvesting and otherwise caring for the crop. This approach does not solve the principal and agent problem, as some farmers steal the cotton they have produced and deliver it to Vunisa or even to MCG. It may transpire that MCG is showing great initiative and determination in trying to establish irrigated cotton and maize or wheat production units with the aim of establishing small-scale farmers on these areas over the longer term, but so far it has simply created a monopoly that leaves the farmers no choice at all. The history of Bt cotton in Makhatini Flats shows the technological potential of GM crops in an African smallholder environment. But it also shows that good governance and institutional structure is required or the potential gains will not be realised. Farmers cannot be expected to change their behaviour quickly: they have seen a procession of failed schemes and broken promises. The South African Development Trust Corporation (STK), the Department for Development and Aid (DDA), the KwaZulu Finance and Investment Corporation (KFC) and the Development Bank of South Africa (DBSA) have all had roles in credit provision on the Flats over the years. Advances in science and technology are easy compared with establishing the social and economic conditions necessary for their successful implementation.
50

Agrekon, Vol 44, No 1 (March 2005) Thirtle, Piesse & Gouse
5. Modelling agricultural dualism and poverty reduction Thus far, this paper has claimed that agricultural economics has to play a key role in ensuring that the best policies are chosen to deal with chronic levels of unemployment, poverty and inequality. It also showed that useful information on the commercial sector, such as demand elasticities for labour, allow the effects of a policy such as a minimum wage increase to be assessed. The section on GM technology described the benefits in the non-commercial sector, noted the lack of good data that hampers any attempt to compare policies and that inadequate institutions can prevent development. What is still missing is a model of dualistic agricultural economies, such as Zimbabwe and South Africa are still incomplete. How difficult can it be to adapt existing dual economy models, to cover the dual agricultural sector? This section provides a preliminary discussion on this issue. We begin by offering an explanation of the historical development of dualistic agriculture in South Africa, which shows why the African farmers were impoverished. Mostert (1992) considers the historical forces that shaped the creation of modern South Africa: the terrestrial migration of the West African tribes, which collided with the maritime exodus of Europeans on the frontier of the Cape Colony in the early nineteenth century. By the mid-19th century, the agrarian sector consisted of large-scale farms owned by white settlers, operating largely with hired labour, some settler estates with indigenous tenant farmers, and free indigenous farming on black-owned land. Mbongwa, Vink and Van Zyl (2000) explain how the settlers used the powers of the state to impoverish the indigenous farm population, in order to ensure that there would be cheap labour, first on the farms and then increasingly in the dominant mining sector. This situation has already been modelled and a simplified graphical version is developed next.
5.1 History and the impoverishment of African farmers10
Hansen (1979) provides one of the few attempts to explain how settler agriculture operated, making the extreme assumption that the settlers acquire all the good land and the indigenous population are left with unlimited supplies of marginal land. In this Ricardian model, the colons (settlers, commercial farmers) produce an export crop and the native farmers (subsistence, smallholders) grow food. This is shown in Figure 4, where the horizontal axis is the whole indigenous agrarian labour force divided between commercial and smallholder employment, but not according to the usual
10 See also Binswanger and Deinenger (1996) on the historical issues and Porter (1978) on modelling South African-type economies.
51

Agrekon, Vol 44, No 1 (March 2005) Thirtle, Piesse & Gouse marginal efficiency conditions. The diminishing marginal product of labour in commercial agriculture (MPLC) is measured on the right hand vertical axis, but the wage of the smallholders on the left is equal to the average product of labour (APL). Smallholder average productivity is constant because there is an unlimited supply of marginal land, with zero MP and thus a rent of zero. Hence, rather than the output being divided between rent and wages, according to marginal productivities, labour is the only claimant and thus gets a wage equal to its AP. In the initial equilibrium at E*, the settlers have hired E1C of indigenous labour. The MP in the commercial sector is equal to the AP in the smallholder sector, which determines the wages, W0C = W0S.
VMPLS
VMPLC
Total Rural Labour Force
OS OC
W0S
Smallholder Employment Commercial Employment
W0C
E*
W1S
A
E1C
W1C
Figure 5: Impoverishment of indigenous farmers This surplus land model gives some results that are quite different from the Lewis (1954) model with surplus labour. Most importantly, increases in population do not affect the wage in either sector. The extra labourers simply use more land, so the extensive margin is extended but there is no effect on the intensive margin. The first observation is that the commercial farmers have to pay enough to attract labour and if the productivity curve of the smallholders can be shifted downwards, they will get more labour at a lower wage and so will the mines. Thus, Mbongwa, Vink and Van Zyl (2000) found that the settlers used all the powers of the state to impoverish the indigenous farm population. Withholding technology has the same beneficial effect on the settlers’ profits, as Hansen (1979) shows. The key issue is that the settlers always profit from lower wages in the subsistence sector, which requires only that the value marginal product of smallholder labour and hence its wage be
52

Agrekon, Vol 44, No 1 (March 2005) Thirtle, Piesse & Gouse
reduced, say to W1S. This lowers the commercial wage and expands commercial employment and both increase the return to the intra-marginal land, which was the triangle AW0CE* and now becomes the larger triangle above the line W1SW1C. Historically, this was achieved by depriving the indigenous farmers of land, capital, modern inputs and improved technology.
The results are entirely compatible with the historical evidence for Southern Africa, where apart from taking their best land, other measures used to impoverish the indigenous population included imposing livestock, hut and poll taxes; road rents; location, vagrancy and pass laws and confinement to the reserves. In Hansen’s model, a tax on cultivating marginal land falls entirely on labour and reduces the real wage. Most importantly, the colons gain from technical progress on the intra-marginal land but their returns to land are reduced by any improvement on the marginal lands. They always have a clear interest in keeping the incomes of the subsistence farmers as low as possible.
5.2 Wages and employment in a dualistic agricultural sector11
So, what can be done in the current economic and political environment to undo the unfortunate aspects of South African agrarian history?
MPLS
MPLC
Total Rural Labour Force
OS OC
W0S
Smallholder Employment Commercial Employment
W0C
E*
W1C
W1S
RH
A
LCLU
E1C
Figure 6: Wages and employment The Ricardian model suggested by Hansen can be adapted to modern conditions by dispensing with the assumption of unlimited marginal land and introducing unemployment. The effects can be seen in Figure 6, adapted from the Corden and Findley (1973) version of the Harris and Todaro (1970) model
11 For a review of agricultural employment see Vink and Kirsten (1999).
53

Agrekon, Vol 44, No 1 (March 2005) Thirtle, Piesse & Gouse of urban unemployment.12 Initially, the total supply of rural labour is assumed to work in the smallholder (semi-subsistence) sub-sector, or be employed in commercial agriculture. The marginal productivities and hence the wages of both groups are equal at the equilibrium point E*. The effect of raising the commercial sector wage to W1C is first to reduce employment in the commercial sector. At W1C, commercial employment is reduced from E* to E1C and the difference (LU) is the unemployment generated by the higher wage. Then, there are two possibilities. Either the unemployed return to the smallholder sector, driving smallholder wages down to W1S, or they remain unemployed while seeking new commercial employment. The second case gives the same kind of equilibrium as in gravity models of urban unemployment. In equilibrium, the expected commercial wage (actual wage times by the probability of employment) must equal the smallholder wage:
( ) (Pr . ) ( ) ( ) ( )C C CS
NS
LE W E W W WL
= = C =
SNS
where LC is commercial employment and LNS is all non-smallholder labour (commercial labour, LC and the unemployed, LU). This can be rearranged to give:
CCW L W L=
This condition and the requirement that the wage equal the marginal product in each sector is met only by points A and E*, that lie on a rectangular hyperbola. This has the property that all rectangles beneath it are of equal area, so conceptually, the new commercial wage bill is being spread over the whole non-smallholder labour force. They all get the expected commercial wage, which is the weighted average of the new commercial wage and the zero wage of the unemployed. The two rectangles under the rectangular hyperbola are equal and the expected wage is equal to the wage in smallholder agriculture. Fields (2005) begins by stating that the Harris-Todaro model “has become the workhorse for analysing labour market policies in dualistic labour markets”. He uses the model to compare policies and reaches the conclusion that “traditional sector enrichment”, or rural development, unambiguously improves welfare, whereas modern sector policies are more ambiguous in their effects. The same would almost certainly prove to be true in this model of traditional and commercial agriculture. It the objectives are to reduce
12 See Corden (1974), Chapter 6, for a lengthier presentation.
54

Agrekon, Vol 44, No 1 (March 2005) Thirtle, Piesse & Gouse unemployment, poverty and inequality, it seems to be clear that the minimum wage will not fare too well. Neither of the two possible results considered above is good. In the first case, the smallholder wage falls and the poorest have become still poorer, so poverty has increased. Inequality has also increased as the commercial wage has risen and the smallholder wage has fallen. Also, underemployment in the smallholder sector must increase as it absorbs more labour. The loss of output is the triangle that is the difference between the product of LU of labour in the commercial sector and the smallholder sector. Figure 6 is deliberately constructed to show that in the second, gravity model case, the imposition of a minimum wage simply causes a proportion of those employed in commercial agriculture to become unemployed, so unemployment is obviously greater. The expected commercial wage is unchanged and some are without wages, so inequality has also increased. The loss of output is greater as the unemployed produce nothing. It is the triangle AE1CE* and the entire rectangle below it, instead of just the triangle above the APS schedule. Thus, poverty must also increase. This outcome less likely the greater the degree of tenure granted to workers under the new policy, as there is less point in the unemployed continuing to seek commercial employment. Thus, the effect of the minimum wage on all three policy objectives is negative. If the intention is redistribution from farmers to labourers, then the suggested land tax is far better, but the tax will be more effective in reducing poverty and inequality if it is redistributed to the smallholders, rather than the commercial labourers, as the smallholders are the poorest group. In this model, poverty reduction means increasing the wage, as the poor are the labourers in both sectors. This could be done without changing the marginal conditions by taxing the intra-marginal land, which just takes part, or all, of the rent triangle and if pushed to the limit will result in zero land rents. This does not reduce employment (so long as it is not pushed to the point where farmers go out of business), while it does reduce poverty and especially inequality. Alternatively, land (instead of income) could be redistributed in favour of the subsistence farmers, which is the option studied in Van Zyl, Kirsten and Binswanger (1996). This would be effective in reducing inequality, but the effect of transferring land from the higher productivity sector to the lower productivity sector must have costs. For instance, food for the urban poor may become more expensive. What policy change does this simple model suggest are best? Anything that increases the marginal product of labour, in either sector, will increase the wage in both sectors. So, better technology will shift the AP and MP schedules upwards, but so will giving labour more capital to work with or more modern
55

Agrekon, Vol 44, No 1 (March 2005) Thirtle, Piesse & Gouse intermediate inputs. All policies that actually increase labour productivity will reduce rural poverty. These would include improving the institutions in the non-commercial sector and providing services and credit. Indeed, all measures that increase productivity in the semi-subsistence sector will have the greatest effects on the three policy objectives. 6. Conclusion All the evidence to date suggests that agricultural productivity growth is the most effective way of reducing poverty in the shorter term, and the poorest sector, which is smallholder agriculture, should be the main target. IFPRI (2004) list R&D driven agricultural productivity growth and good governance as the two fundamental prerequisites for success in African agriculture. Similarly, the UK Department for International Development (DfID) lists agricultural productivity growth in Africa as one of its four main research areas for the coming years. Thirtle, Lin and Piesse (2003) use all the available data on $1 per day poverty to show that research led technological change in agriculture generates sufficient productivity growth to give high rates of return in Africa and Asia. This has a substantial impact on poverty, currently reducing the number by 27 million per annum, whereas productivity growth in industry and services has no impact. The per capita “cost” of poverty reduction by means of agricultural research expenditures in Africa is $144 and in Asia $180, or 50 cents per day, but this is paid for by output growth. There must be other ways of reducing poverty, but so far, agricultural productivity growth looks like the best bet. References Bailey A, Balcombe K, Morrison J & Thirtle C (2003). A comparison of proxy variable and Stochastic latent variable approaches to the measurement of the biased technological change in South African agriculture. Economics of Innovation and New Technology 12(4):315-24 (August).
Balcombe K, Bailey A, Morrison J, Rapsomanikis G, Thirtle C (2000). Stochastic biases in disembodied technical change within South African agriculture. Agrekon 39(4):495-503 (December).
Bennett A (2002). The impact of Bt-Cotton on small holder production in the Makhathini Flats, South Africa. Bt-Cotton Report, www.monsantoafrica.com.
Binswanger H & Deinenger K (1996). South African Land Policy: The legacy of history and current options. In: Van Zyl J, Kirsten J & Binswanger H (eds),
56

Agrekon, Vol 44, No 1 (March 2005) Thirtle, Piesse & Gouse Agricultural land reform in South Africa, Chapter 4. Oxford University Press, Cape Town.
Conradie B (2004). Wages and wage elasticities for wine and table grapes in South Africa. Paper presented at the 42nd Annual Conference of the Agricultural Economics Association of South Africa, Stellenbosch.
Corden WM (1974). Trade policy and economic welfare. Oxford University Press.
Corden W & Findley R (1973). Urban unemployment, inter-sectoral capital mobility and development policy. Department of Economics Working Paper 73-7410, Columbia University, New York.
Frick A & Groenewald J (1999). The need for agricultural information in the new South Africa. Agrekon 38(2):241-254.
Gouse M, Kirsten JF & Jenkins L (2003). Bt-Cotton in South Africa: Adoption and the impact on farm incomes amongst small-scale and large-scale farmers. Agrekon 42(1):15-28 (March).
Griliches Z (1994). Productivity, R&D and the Data Constraint. American Economic Review 84(1):1-23.
Hansen B (1979). Colonial economic development with unlimited supply of land: A Ricardian case. Economic Development and Cultural Change 27:611-627.
Harris J & Todaro M (1970). Migration, unemployment and development: A two sector analysis. American Economic Review 60(1):126-142.
Hofs JL & Kirsten J (2002). Genetically modified cotton in South Africa: The solution for rural development. CIRAD/University of Pretoria Working Paper, 18 pages.
Huang J, Hu R, Rozelle S, Qiao F & Pray C (2002). Transgenic varieties and productivity of smallholder cotton farmers in China. Australian Journal of Agricultural Economics 46(3):367-387.
IFPRI (2004). Building on successes in African agriculture: The Pretoria Statement on the future of African agriculture. Focus 12: Brief 10 of 10: April 2004. See http://www.ifpri.org/events/conferences/2003/120103/papers/papers.htm.
ISAAA (2004). Bt-Cotton: South Africa case study. www.isaaa.org.
Lewis W (1954). Economic development with unlimited supplies of labour. The Manchester School 22:139-191.
57

Agrekon, Vol 44, No 1 (March 2005) Thirtle, Piesse & Gouse Lichtenberg E & Zilberman D (1986). The econometrics of damage control: Why specification matters. American Journal of Agricultural Economics 68(2):261-273.
Lipton M (1989). Agricultural research and modern plant varieties in Sub-Saharan Africa: Generalizations, realities and conclusions. Journal of International Development 1(1):168-179.
Lipton M, Ellis F & Lipton M (1996). Land, labour and livelihoods in rural South Africa, Volume Two: KwaZulu-Natal and Northern Province. Indicator Press, University of Natal, Durban, South Africa.
Lipton M, De Klerk M & Lipton M (1996). Land, labour and livelihoods in rural South Africa, Volume One: Western Cape. Indicator Press, University of Natal, Durban, South Africa.
May J, Woolard I & Klasen S (1998). The nature and measurement of poverty and inequality, Chapter 2. In: May J (ed), Poverty and inequality in South Africa. Praxis Publishing, Durban.
Mbongwa M, Vink N & Van Zyl J (2000). The agrarian structure and empowerment: The legacy. In: Thirtle C, Van Zyl J & Vink N (eds), South African agriculture at the crossroads: An Empirical analysis of efficiency, technology and productivity. Macmillan, 2000, Basingstoke.
McDonald S & Piesse J (1999). Rural poverty and income distribution in South Africa. Agrekon 38(4):603-619.
Mostert N (1992). Frontiers: The epic of South Africa’s creation and the tragedy of the Xhosa people. Jonathan Cape, London.
Porter R (1978). A model of the Southern African-type economy. American Economic Review 68(5):743-755.
Qaim M, Cap EJ & de Janvry A (2003). Agronomics and sustainability of transgenic cotton in Argentina. AgBioForum 6(1&2):41-47.
Qaim M & de Janvry A (2005). Bt-Cotton and pesticide use in Argentina: Economic and environmental effects. Journal of Environment and Development Economicst (forthcoming).
Robbins L (1935). Essay on the nature and significance of economic science. 2nd Edition, Macmillan, London.
58

Agrekon, Vol 44, No 1 (March 2005) Thirtle, Piesse & Gouse Ruttan V (1982). Agricultural research policy. University of Minnesota Press, Minneapolis.
Schimmelpfennig D & Norton G (2003). What is the value of agricultural economics research? American Journal of Agricultural Economics 85(1):81-94.
Shankar B & Thirtle C (2005). Pesticide productivity and transgenic cotton technology: The South African smallholder case. Journal of Agricultural Economics 56(1): (forthcoming).
South African Department of Labour (1996). Restructuring the South African labour market: Report on the Presidential Commission to investigate labour market policy, www.labour.gov.za/docs/policy.
Thirtle C, Beyers L, Ismaël Y & Piesse J (2003). Can GM-technologies help the poor? The impact of Bt-Cotton in the Makhathini Flats of KwaZulu-Natal. World Development 31(4):717-732.
Thirtle C, Lin L & Piesse J (2003). The impact of research led productivity growth on poverty in Africa, Asia and Latin America. World Development 31(12):1959-1975.
Thirtle C, Sartorius von Bach H & Van Zyl J (1993). Total factor productivity in South African agriculture, 1947-91. Development Southern Africa 10(3):301-18 (August).
Thirtle C, Van Zyl J & Vink N (eds) (2000). South African agriculture at the crossroads: An empirical analysis of efficiency, technology and productivity. Macmillan, Basingstoke.
Van Zyl J, Kirsten J & Binswanger H (eds) (1996). Agricultural land reform in South Africa. Oxford University Press, Cape Town.
Vink N & Kirsten J (1999). A descriptive analysis of employment trends in South African agriculture. Agrekon 38(2):204-28.
59