agricultural research council implementing strategic...
TRANSCRIPT
AGRICULTURAL RESEARCH COUNCIL
Implementing Strategic Plan: 2015/16 – 2019/20Through
Annual Business Plan: 2017/18
Presentation to Portfolio CommitteeMay 2017
ARC TEAM
Prof. Sibusiso Vil – Nkomo: Chair of Council
Dr. Shadrack R. Moephuli: CEO
Ms. Makgomo Umlaw: GE: Human Resources & Legal
Mr. Gabriel Maluleke: Chief Financial Officer
Dr. Nthabiseng Motete: GE: Crop Sciences
Dr. Jasper Rees: GE: Research & Innovation Systems
Dr. Andrew Magadlela: GE: Animal Sciences
Dr. Litha Magingxa: GE: Agric. Econ. & Capacity Building
Mr. Frans Monkwe: GE: ICT & Infrastructure
2
ARC MANDATE, VISION & MISSION
MANDATE: In terms of the Agricultural Research ActTo promote the agricultural and related sectors through:
Research
Development, and,
Technology Transfer
VISION:
Excellence in agricultural research and development
MISSION:The Agricultural Research Council is premier science institution that
conducts research with partners, develops human capital and fosters
innovation to support and develop the agriculture sector
3
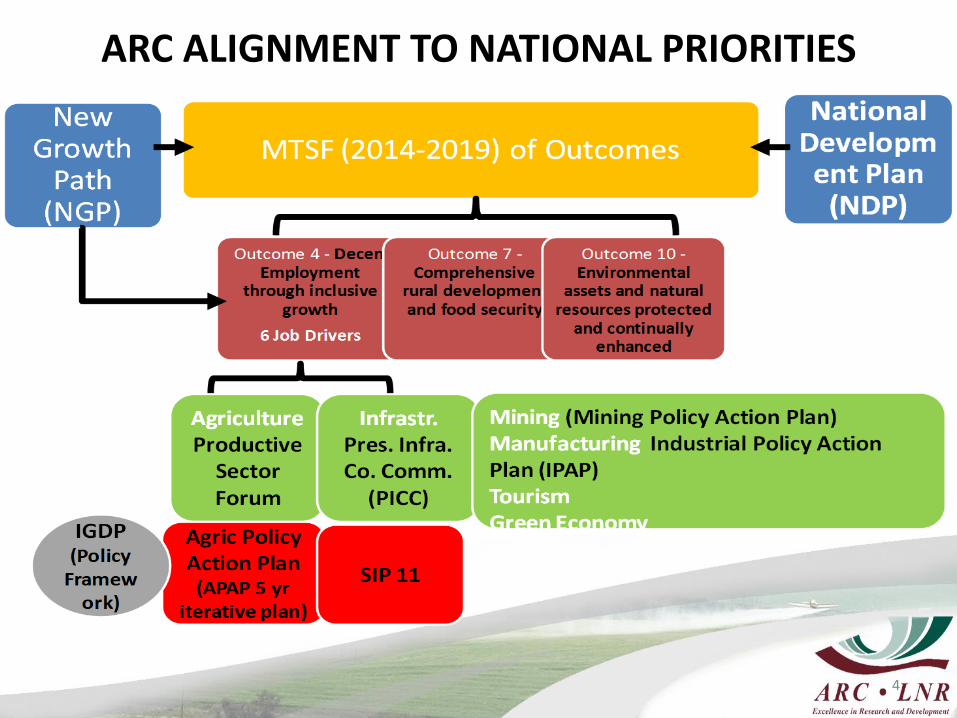
ARC ALIGNMENT TO NATIONAL PRIORITIES
4
ARC CONTRIBUTION TO GOVERNMENT
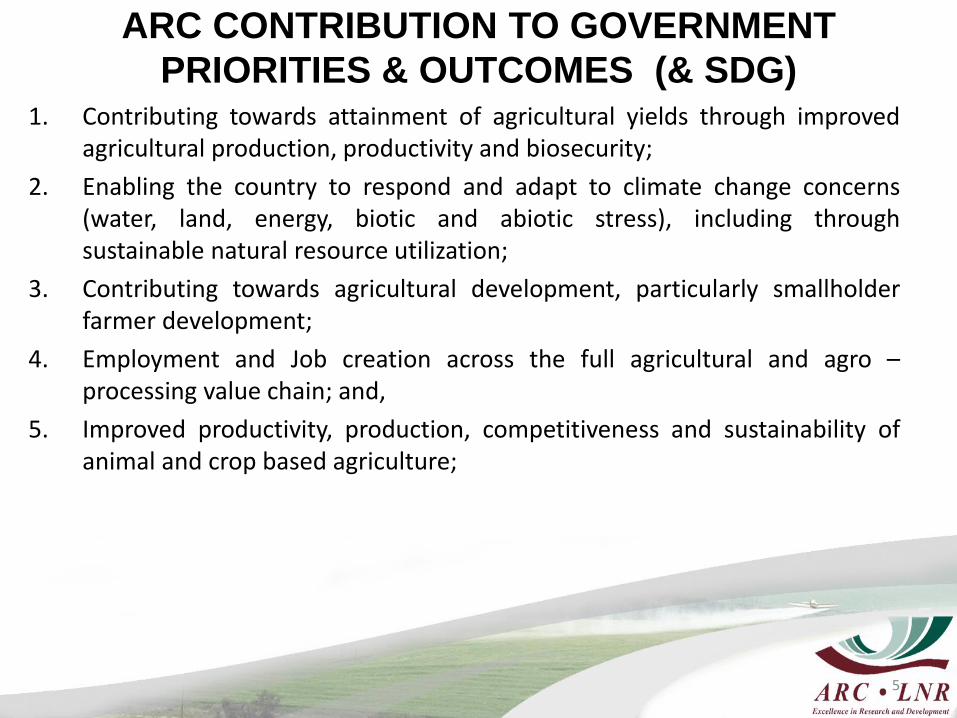
PRIORITIES & OUTCOMES (& SDG)1. Contributing towards attainment of agricultural yields through improved
agricultural production, productivity and biosecurity;
2. Enabling the country to respond and adapt to climate change concerns(water, land, energy, biotic and abiotic stress), including throughsustainable natural resource utilization;
3. Contributing towards agricultural development, particularly smallholderfarmer development;
4. Employment and Job creation across the full agricultural and agro –processing value chain; and,
5. Improved productivity, production, competitiveness and sustainability ofanimal and crop based agriculture;
5
ARC STRATEGIC GOALS
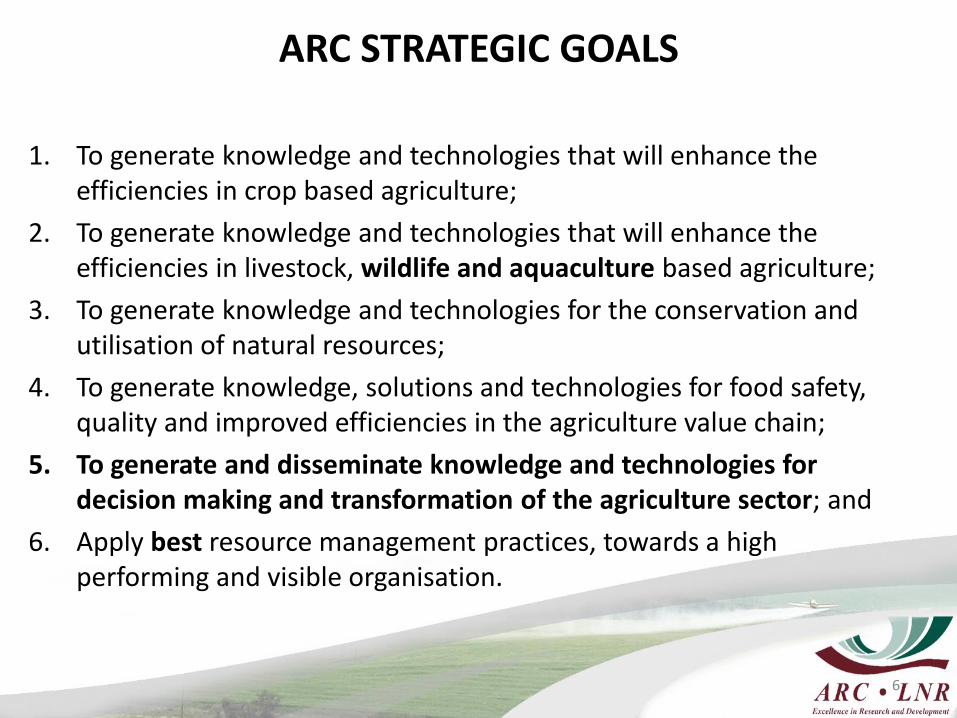
1. To generate knowledge and technologies that will enhance the efficiencies in crop based agriculture;
2. To generate knowledge and technologies that will enhance the efficiencies in livestock, wildlife and aquaculture based agriculture;
3. To generate knowledge and technologies for the conservation and utilisation of natural resources;
4. To generate knowledge, solutions and technologies for food safety, quality and improved efficiencies in the agriculture value chain;
5. To generate and disseminate knowledge and technologies for decision making and transformation of the agriculture sector; and
6. Apply best resource management practices, towards a high performing and visible organisation.
6
ARC PROGRAMMES
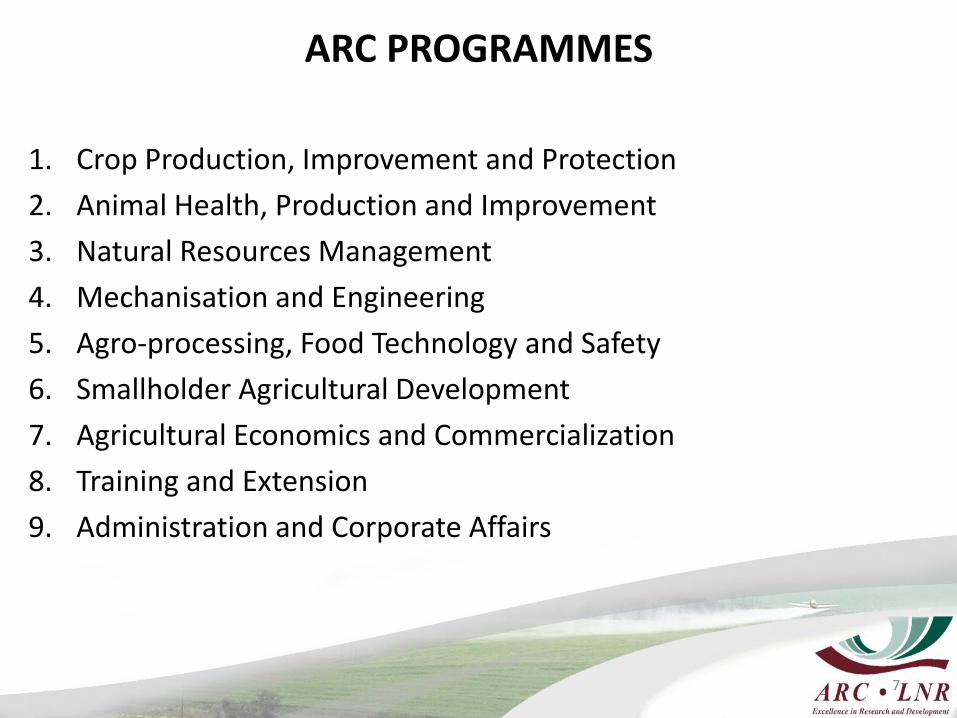
1. Crop Production, Improvement and Protection
2. Animal Health, Production and Improvement
3. Natural Resources Management
4. Mechanisation and Engineering
5. Agro-processing, Food Technology and Safety
6. Smallholder Agricultural Development
7. Agricultural Economics and Commercialization
8. Training and Extension
9. Administration and Corporate Affairs
7
ARC SCIENTIFIC IMPACT FOR AGRICULTURAL ECONOMY
8
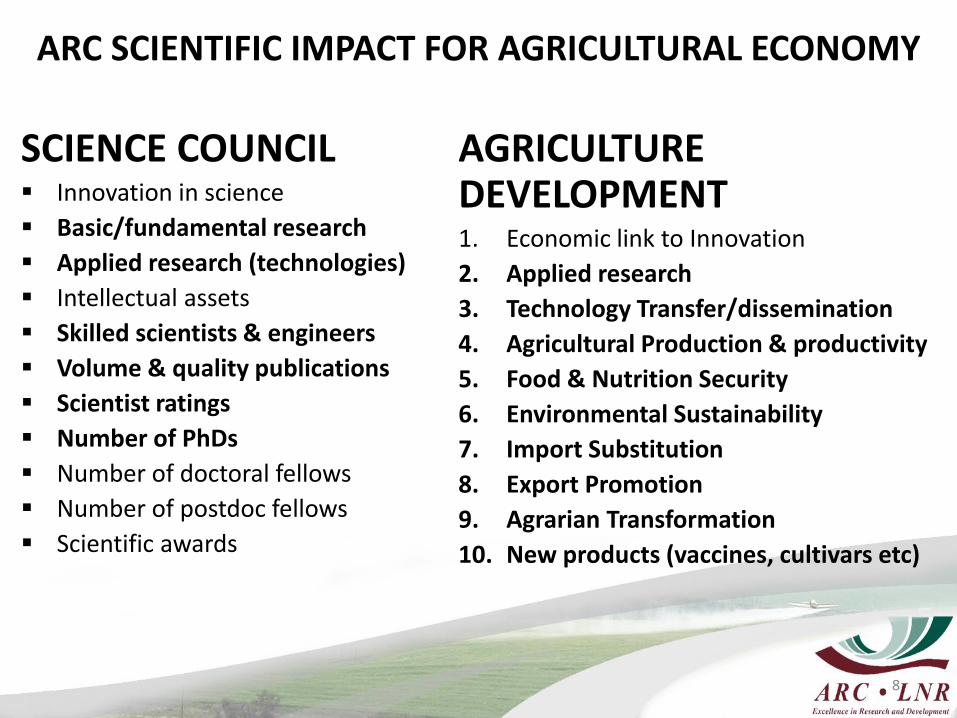
SCIENCE COUNCIL Innovation in science
Basic/fundamental research
Applied research (technologies)
Intellectual assets
Skilled scientists & engineers
Volume & quality publications
Scientist ratings
Number of PhDs
Number of doctoral fellows
Number of postdoc fellows
Scientific awards
AGRICULTURE DEVELOPMENT1. Economic link to Innovation
2. Applied research
3. Technology Transfer/dissemination
4. Agricultural Production & productivity
5. Food & Nutrition Security
6. Environmental Sustainability
7. Import Substitution
8. Export Promotion
9. Agrarian Transformation
10. New products (vaccines, cultivars etc)
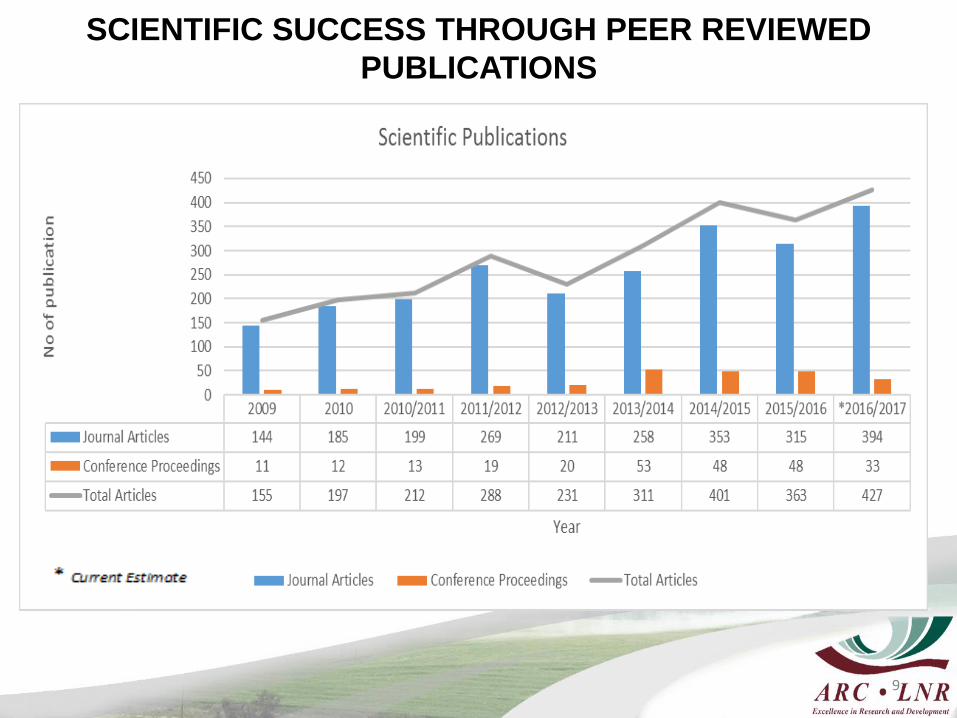
SCIENTIFIC SUCCESS THROUGH PEER REVIEWED
PUBLICATIONS
9
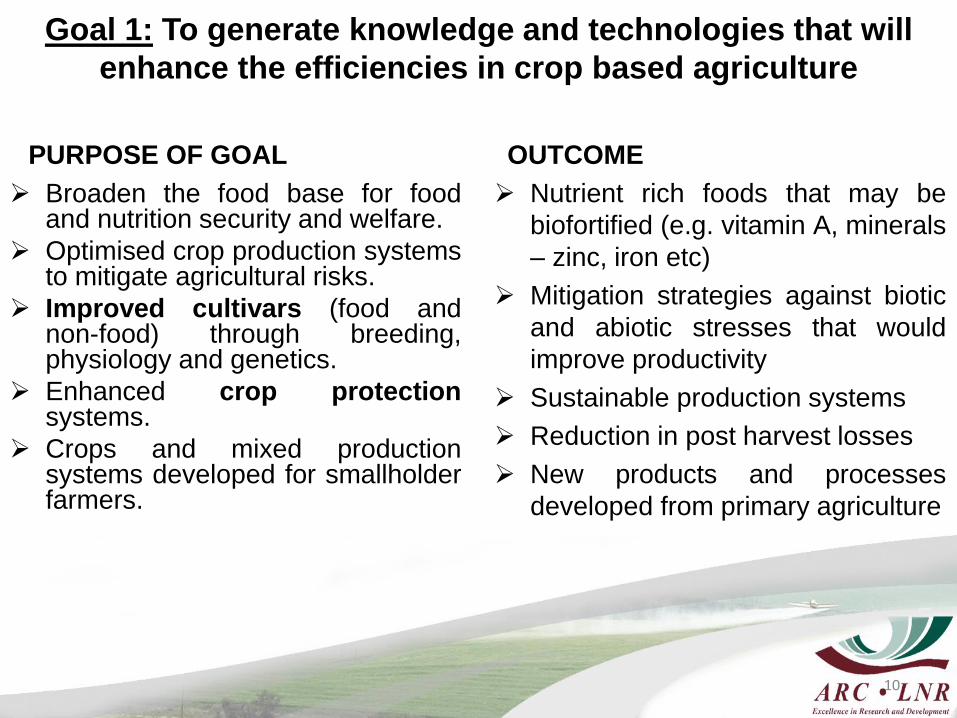
Goal 1: To generate knowledge and technologies that will
enhance the efficiencies in crop based agriculture
PURPOSE OF GOAL OUTCOME
10
Broaden the food base for foodand nutrition security and welfare.
Optimised crop production systemsto mitigate agricultural risks.
Improved cultivars (food andnon-food) through breeding,physiology and genetics.
Enhanced crop protectionsystems.
Crops and mixed productionsystems developed for smallholderfarmers.
Nutrient rich foods that may be
biofortified (e.g. vitamin A, minerals
– zinc, iron etc)
Mitigation strategies against biotic
and abiotic stresses that would
improve productivity
Sustainable production systems
Reduction in post harvest losses
New products and processes
developed from primary agriculture
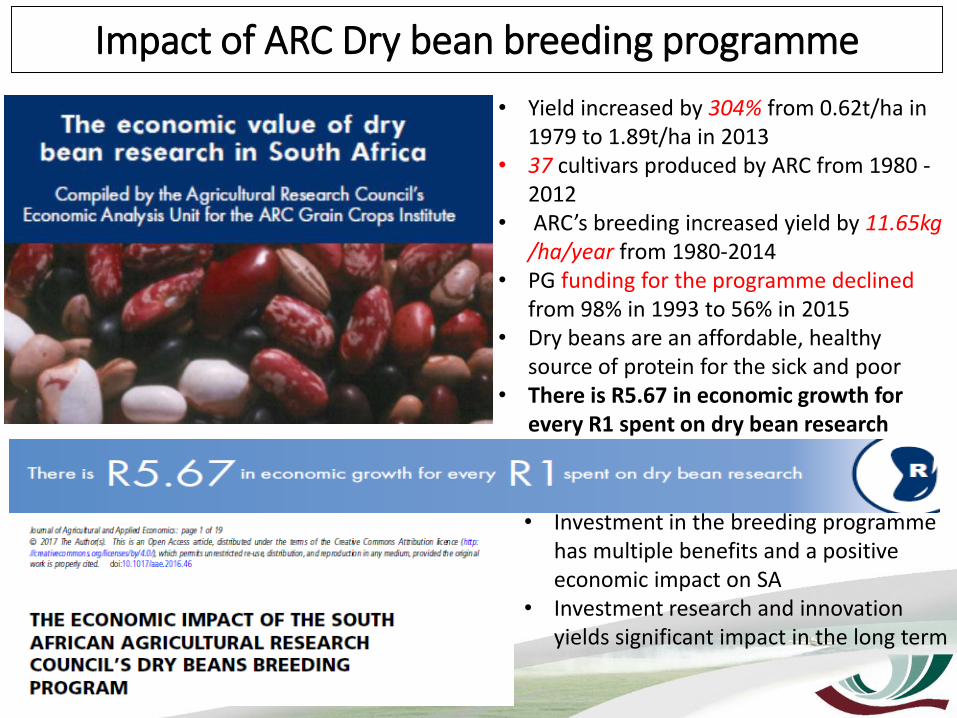
Impact of ARC Dry bean breeding programme
• Yield increased by 304% from 0.62t/ha in 1979 to 1.89t/ha in 2013
• 37 cultivars produced by ARC from 1980 -2012
• ARC’s breeding increased yield by 11.65kg /ha/year from 1980-2014
• PG funding for the programme declined from 98% in 1993 to 56% in 2015
• Dry beans are an affordable, healthy source of protein for the sick and poor
• There is R5.67 in economic growth for every R1 spent on dry bean research
• Investment in the breeding programme has multiple benefits and a positive economic impact on SA
• Investment research and innovation yields significant impact in the long term
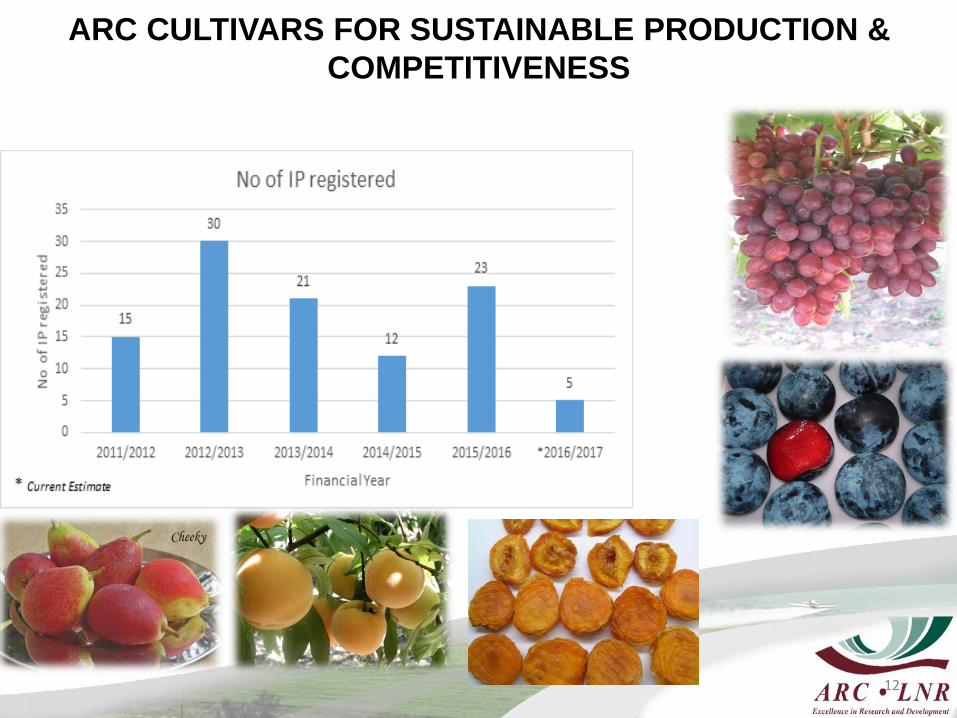
ARC CULTIVARS FOR SUSTAINABLE PRODUCTION &
COMPETITIVENESS
12
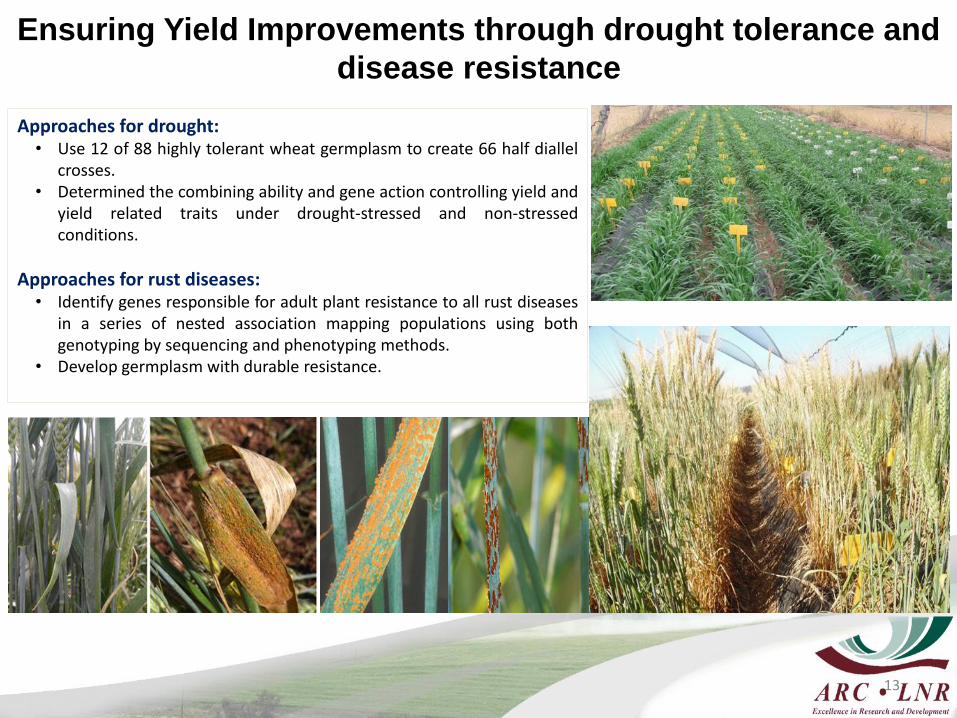
Ensuring Yield Improvements through drought tolerance and
disease resistance
13
Approaches for drought:• Use 12 of 88 highly tolerant wheat germplasm to create 66 half diallel
crosses.• Determined the combining ability and gene action controlling yield and
yield related traits under drought-stressed and non-stressedconditions.
Approaches for rust diseases:• Identify genes responsible for adult plant resistance to all rust diseases
in a series of nested association mapping populations using bothgenotyping by sequencing and phenotyping methods.
• Develop germplasm with durable resistance.
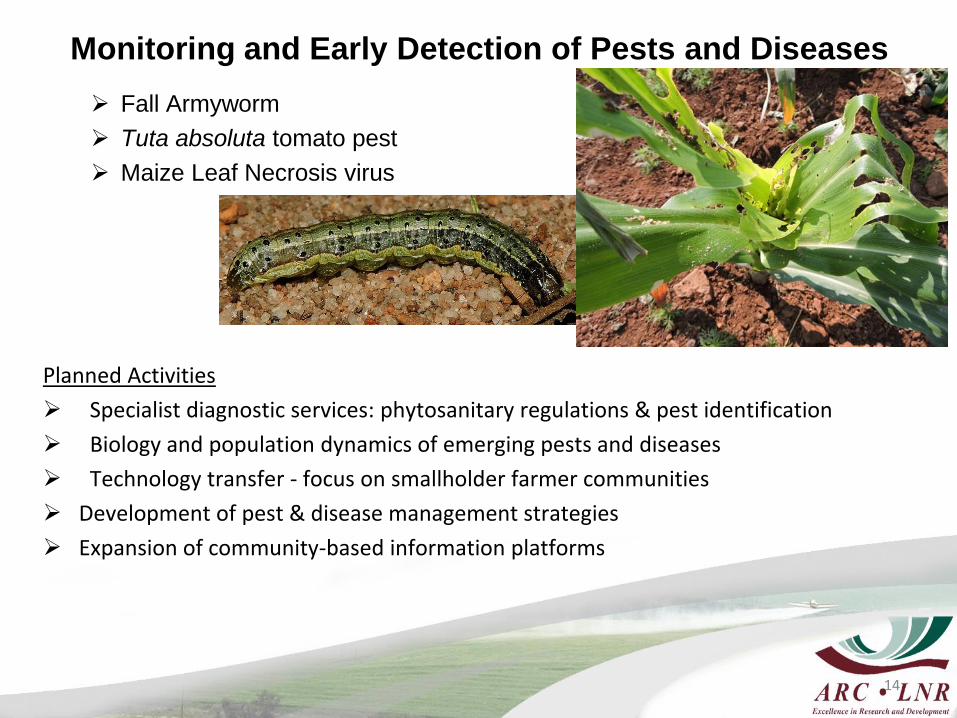
Monitoring and Early Detection of Pests and Diseases
Fall Armyworm
Tuta absoluta tomato pest
Maize Leaf Necrosis virus
Planned Activities
Specialist diagnostic services: phytosanitary regulations & pest identification
Biology and population dynamics of emerging pests and diseases
Technology transfer - focus on smallholder farmer communities
Development of pest & disease management strategies
Expansion of community-based information platforms
14
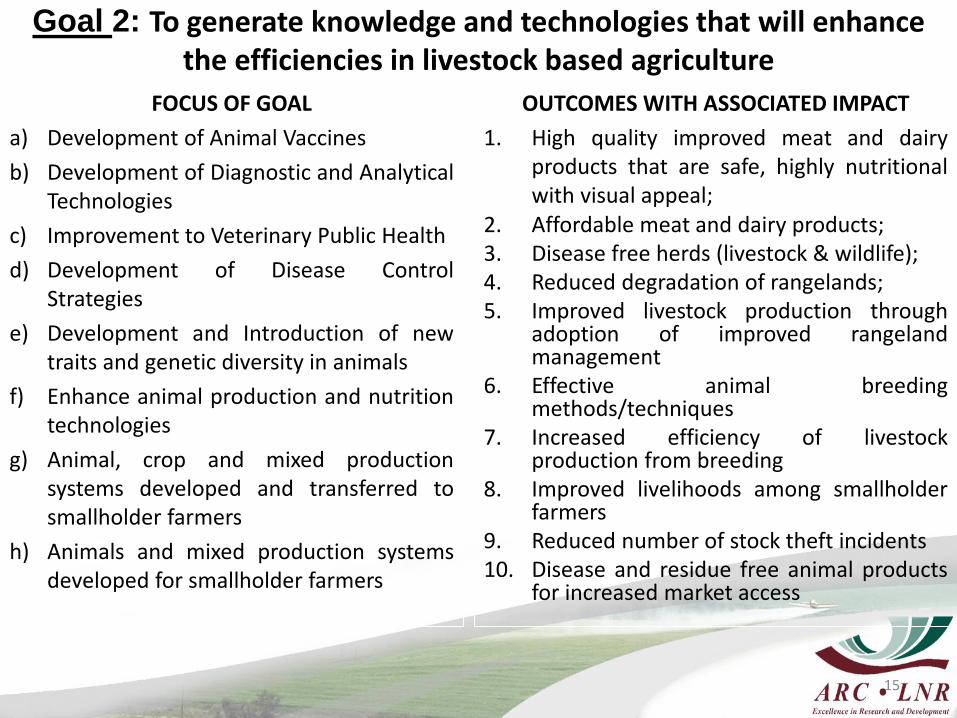
Goal 2: To generate knowledge and technologies that will enhance the efficiencies in livestock based agriculture
15
FOCUS OF GOAL
a) Development of Animal Vaccines
b) Development of Diagnostic and AnalyticalTechnologies
c) Improvement to Veterinary Public Health
d) Development of Disease ControlStrategies
e) Development and Introduction of newtraits and genetic diversity in animals
f) Enhance animal production and nutritiontechnologies
g) Animal, crop and mixed productionsystems developed and transferred tosmallholder farmers
h) Animals and mixed production systemsdeveloped for smallholder farmers
OUTCOMES WITH ASSOCIATED IMPACT
1. High quality improved meat and dairyproducts that are safe, highly nutritionalwith visual appeal;
2. Affordable meat and dairy products;3. Disease free herds (livestock & wildlife);4. Reduced degradation of rangelands;5. Improved livestock production through
adoption of improved rangelandmanagement
6. Effective animal breedingmethods/techniques
7. Increased efficiency of livestockproduction from breeding
8. Improved livelihoods among smallholderfarmers
9. Reduced number of stock theft incidents10. Disease and residue free animal products
for increased market access
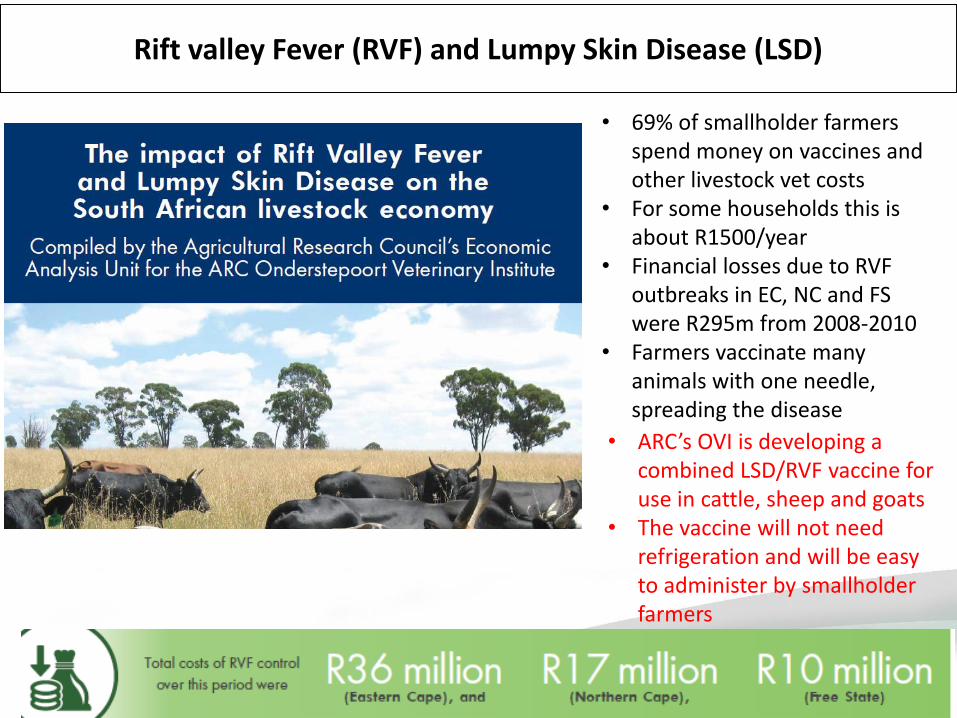
Rift valley Fever (RVF) and Lumpy Skin Disease (LSD)
• 69% of smallholder farmers spend money on vaccines and other livestock vet costs
• For some households this is about R1500/year
• Financial losses due to RVF outbreaks in EC, NC and FS were R295m from 2008-2010
• Farmers vaccinate many animals with one needle, spreading the disease
• ARC’s OVI is developing a combined LSD/RVF vaccine for use in cattle, sheep and goats
• The vaccine will not need refrigeration and will be easy to administer by smallholder farmers
Mitigating the effects of Climate Change on Livestock
Production
17
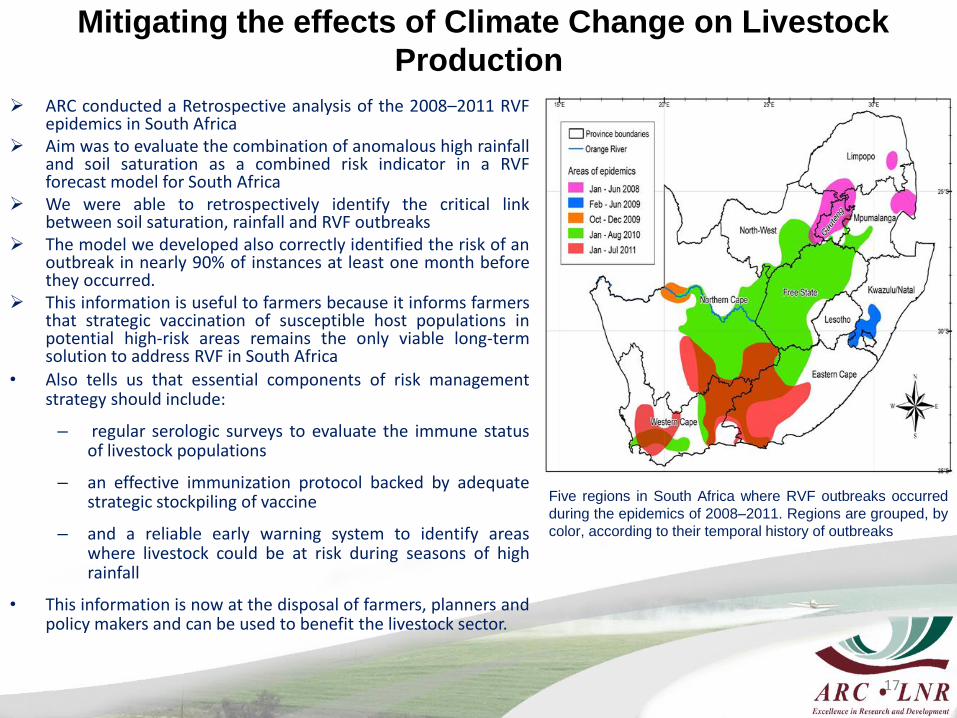
ARC conducted a Retrospective analysis of the 2008–2011 RVFepidemics in South Africa
Aim was to evaluate the combination of anomalous high rainfalland soil saturation as a combined risk indicator in a RVFforecast model for South Africa
We were able to retrospectively identify the critical linkbetween soil saturation, rainfall and RVF outbreaks
The model we developed also correctly identified the risk of anoutbreak in nearly 90% of instances at least one month beforethey occurred.
This information is useful to farmers because it informs farmersthat strategic vaccination of susceptible host populations inpotential high-risk areas remains the only viable long-termsolution to address RVF in South Africa
• Also tells us that essential components of risk managementstrategy should include:
– regular serologic surveys to evaluate the immune statusof livestock populations
– an effective immunization protocol backed by adequatestrategic stockpiling of vaccine
– and a reliable early warning system to identify areaswhere livestock could be at risk during seasons of highrainfall
• This information is now at the disposal of farmers, planners andpolicy makers and can be used to benefit the livestock sector.
Five regions in South Africa where RVF outbreaks occurred
during the epidemics of 2008–2011. Regions are grouped, by
color, according to their temporal history of outbreaks
Enabling Livestock Production and Productivity through
Vaccine Development
18
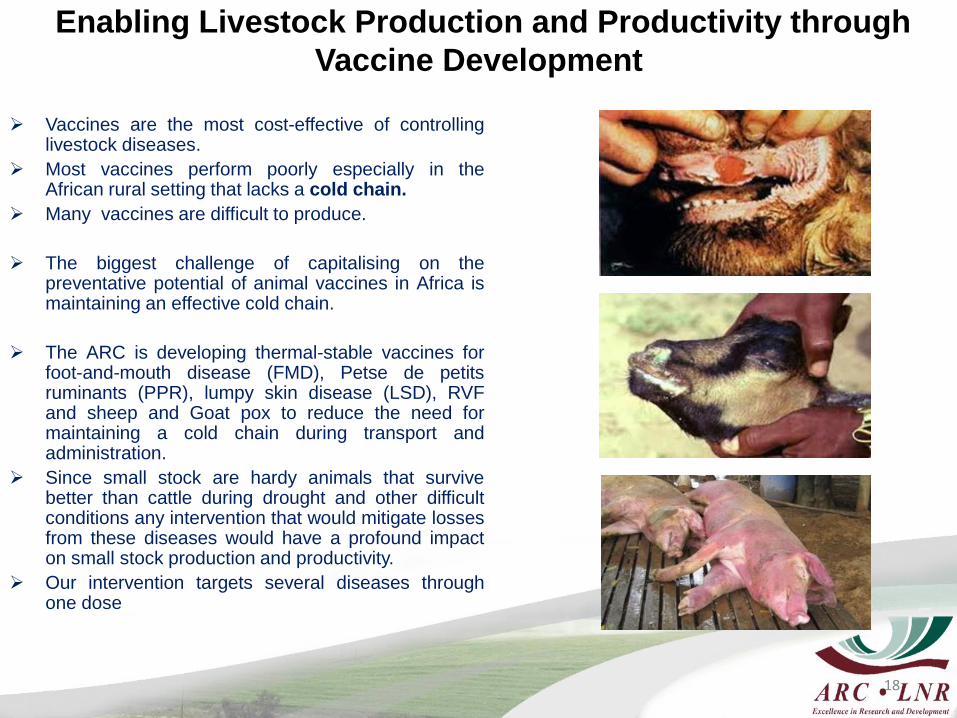
Vaccines are the most cost-effective of controllinglivestock diseases.
Most vaccines perform poorly especially in theAfrican rural setting that lacks a cold chain.
Many vaccines are difficult to produce.
The biggest challenge of capitalising on thepreventative potential of animal vaccines in Africa ismaintaining an effective cold chain.
The ARC is developing thermal-stable vaccines forfoot-and-mouth disease (FMD), Petse de petitsruminants (PPR), lumpy skin disease (LSD), RVFand sheep and Goat pox to reduce the need formaintaining a cold chain during transport andadministration.
Since small stock are hardy animals that survivebetter than cattle during drought and other difficultconditions any intervention that would mitigate lossesfrom these diseases would have a profound impacton small stock production and productivity.
Our intervention targets several diseases throughone dose
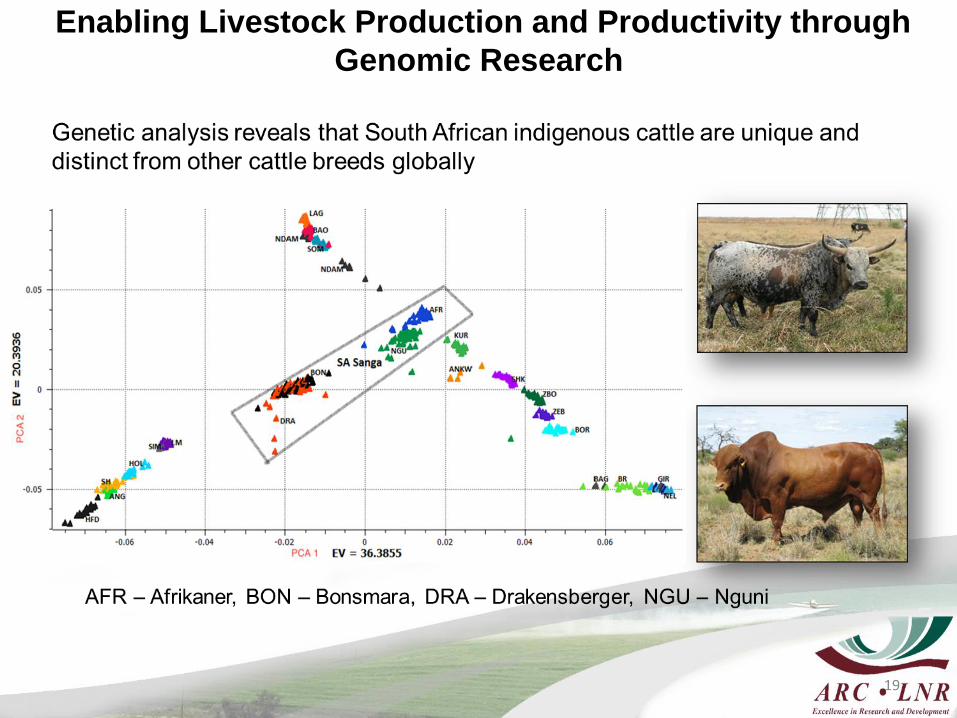
Enabling Livestock Production and Productivity through
Genomic Research
19
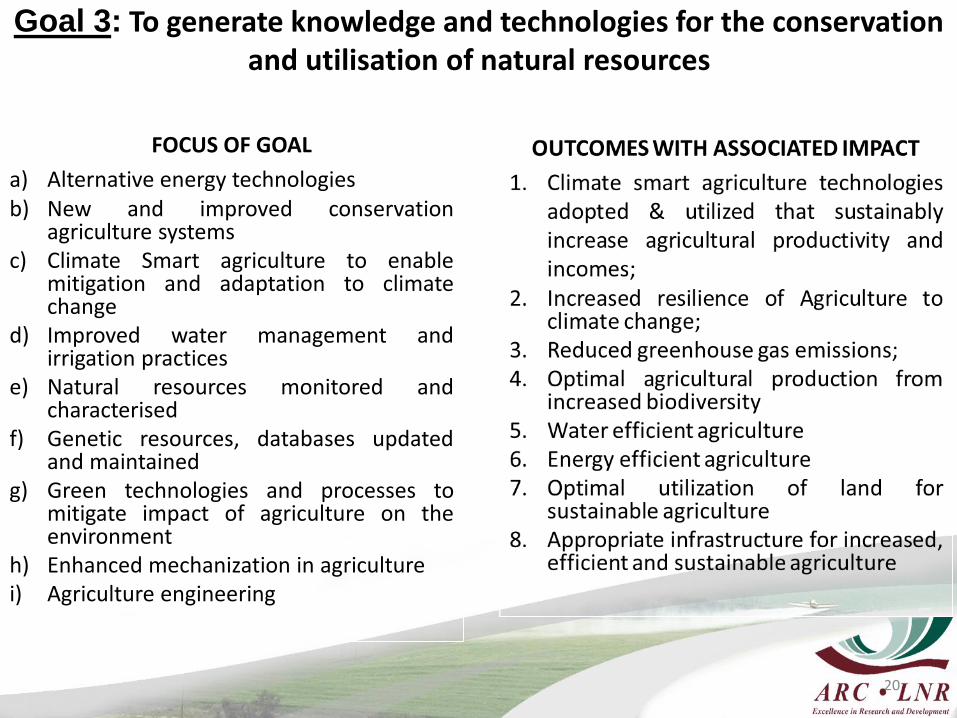
Goal 3: To generate knowledge and technologies for the conservation and utilisation of natural resources
20
FOCUS OF GOAL
a) Alternative energy technologiesb) New and improved conservation
agriculture systemsc) Climate Smart agriculture to enable
mitigation and adaptation to climatechange
d) Improved water management andirrigation practices
e) Natural resources monitored andcharacterised
f) Genetic resources, databases updatedand maintained
g) Green technologies and processes tomitigate impact of agriculture on theenvironment
h) Enhanced mechanization in agriculturei) Agriculture engineering
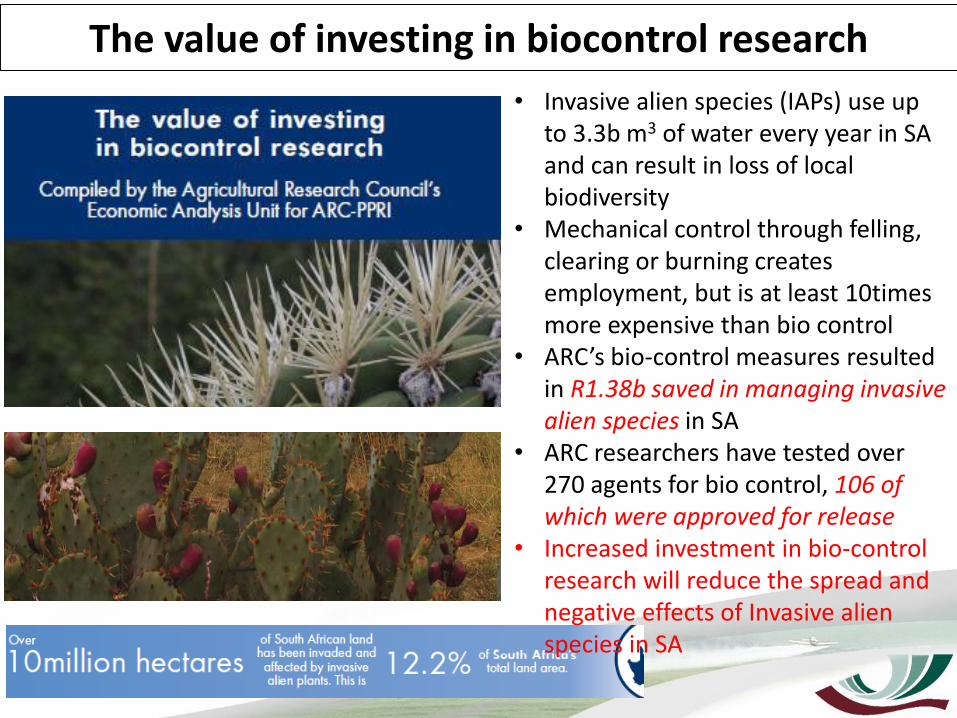
The value of investing in biocontrol research
• Invasive alien species (IAPs) use up to 3.3b m3 of water every year in SA and can result in loss of local biodiversity
• Mechanical control through felling, clearing or burning creates employment, but is at least 10times more expensive than bio control
• ARC’s bio-control measures resulted in R1.38b saved in managing invasive alien species in SA
• ARC researchers have tested over 270 agents for bio control, 106 of which were approved for release
• Increased investment in bio-control research will reduce the spread and negative effects of Invasive alien species in SA
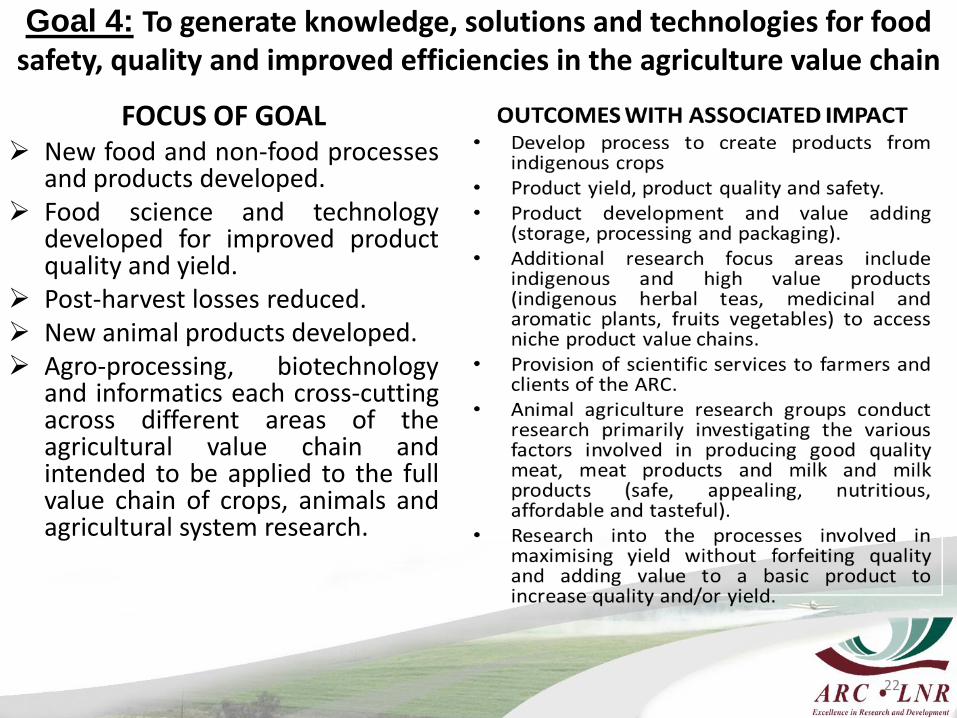
Goal 4: To generate knowledge, solutions and technologies for food safety, quality and improved efficiencies in the agriculture value chain
22
FOCUS OF GOAL New food and non-food processes
and products developed. Food science and technology
developed for improved productquality and yield.
Post-harvest losses reduced. New animal products developed. Agro-processing, biotechnology
and informatics each cross-cuttingacross different areas of theagricultural value chain andintended to be applied to the fullvalue chain of crops, animals andagricultural system research.
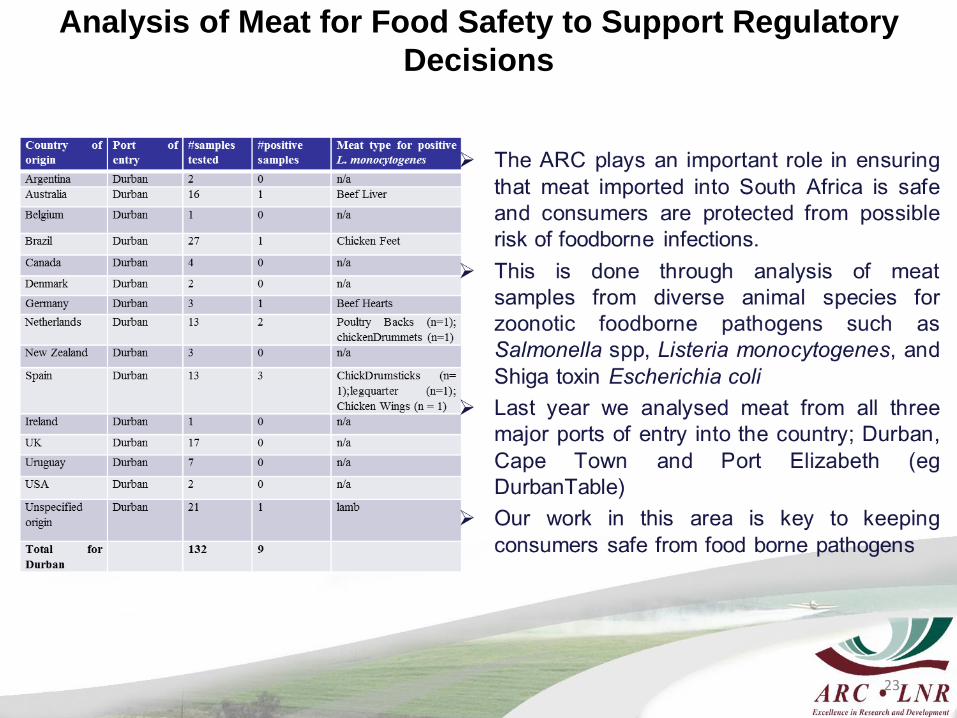
Analysis of Meat for Food Safety to Support Regulatory
Decisions
23
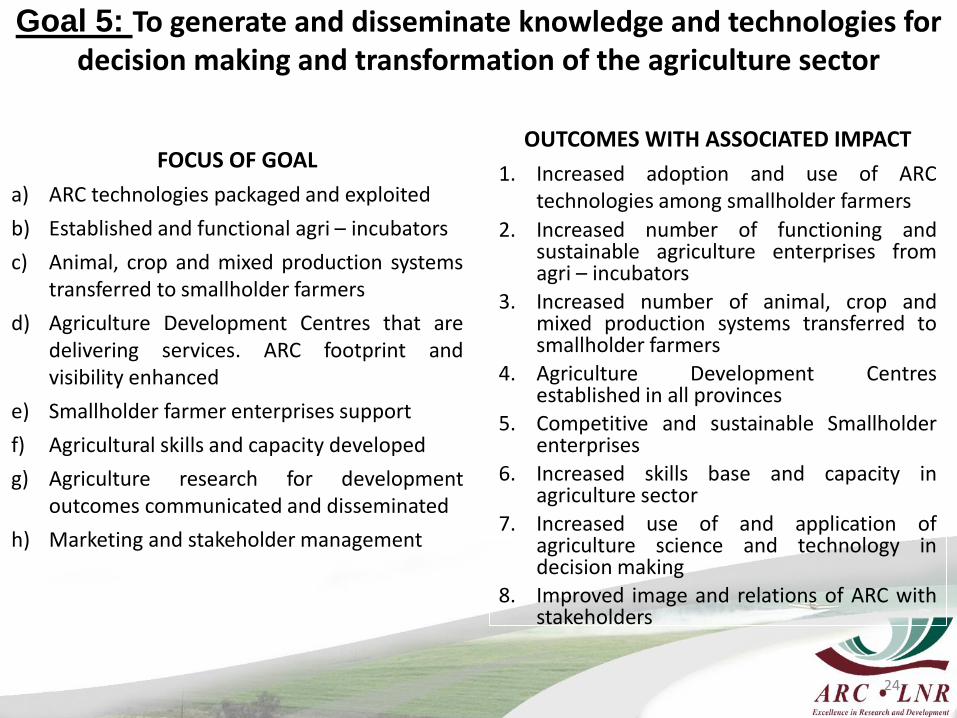
Goal 5: To generate and disseminate knowledge and technologies for decision making and transformation of the agriculture sector
24
FOCUS OF GOAL
a) ARC technologies packaged and exploited
b) Established and functional agri – incubators
c) Animal, crop and mixed production systemstransferred to smallholder farmers
d) Agriculture Development Centres that aredelivering services. ARC footprint andvisibility enhanced
e) Smallholder farmer enterprises support
f) Agricultural skills and capacity developed
g) Agriculture research for developmentoutcomes communicated and disseminated
h) Marketing and stakeholder management
OUTCOMES WITH ASSOCIATED IMPACT
1. Increased adoption and use of ARCtechnologies among smallholder farmers
2. Increased number of functioning andsustainable agriculture enterprises fromagri – incubators
3. Increased number of animal, crop andmixed production systems transferred tosmallholder farmers
4. Agriculture Development Centresestablished in all provinces
5. Competitive and sustainable Smallholderenterprises
6. Increased skills base and capacity inagriculture sector
7. Increased use of and application ofagriculture science and technology indecision making
8. Improved image and relations of ARC withstakeholders
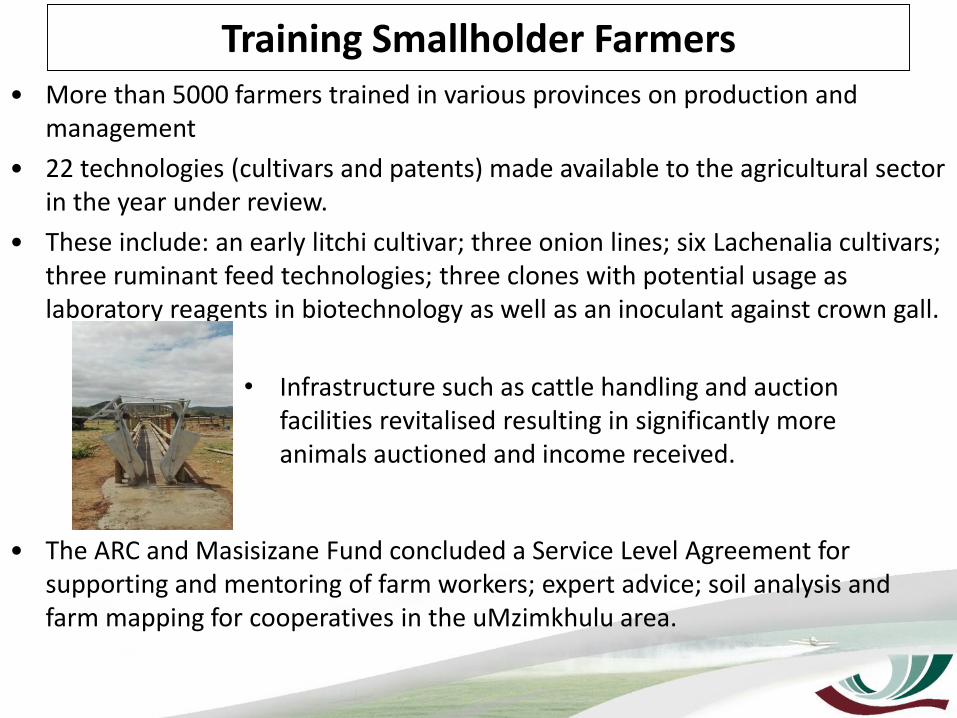
Training Smallholder Farmers• More than 5000 farmers trained in various provinces on production and
management
• 22 technologies (cultivars and patents) made available to the agricultural sector in the year under review.
• These include: an early litchi cultivar; three onion lines; six Lachenalia cultivars; three ruminant feed technologies; three clones with potential usage as laboratory reagents in biotechnology as well as an inoculant against crown gall.
• The ARC and Masisizane Fund concluded a Service Level Agreement for supporting and mentoring of farm workers; expert advice; soil analysis and farm mapping for cooperatives in the uMzimkhulu area.
• Infrastructure such as cattle handling and auction facilities revitalised resulting in significantly more animals auctioned and income received.
STRATEGIC GOAL 6
Apply best resource management practices,
towards a high performing and visible organisation
HUMAN RESOURCES & ASSOCIATED CHALLENGES
27
A high proportion of experienced researchers are approaching retirement.
The national education system is not providing a strong enough pool ofSET manpower to meet current and future ARC demands.
Higher–end specialist skills to ensure future growth of ARC thereforecannot be provided by conventional educational streams.
These skills are in global demand, need long-term development and requireresources, including funding, equipment, study materials and infrastructure.
The need for a higher ratio of scientists to total staff, particularly at postgraduate level.
The urgent need to improve ratios of women, black and young researchers.
The need to improve the qualifications profile of ARC and to expand itsScience Engineering and Technology base.
The need to train and deploy young graduates into ARC researcherpositions.
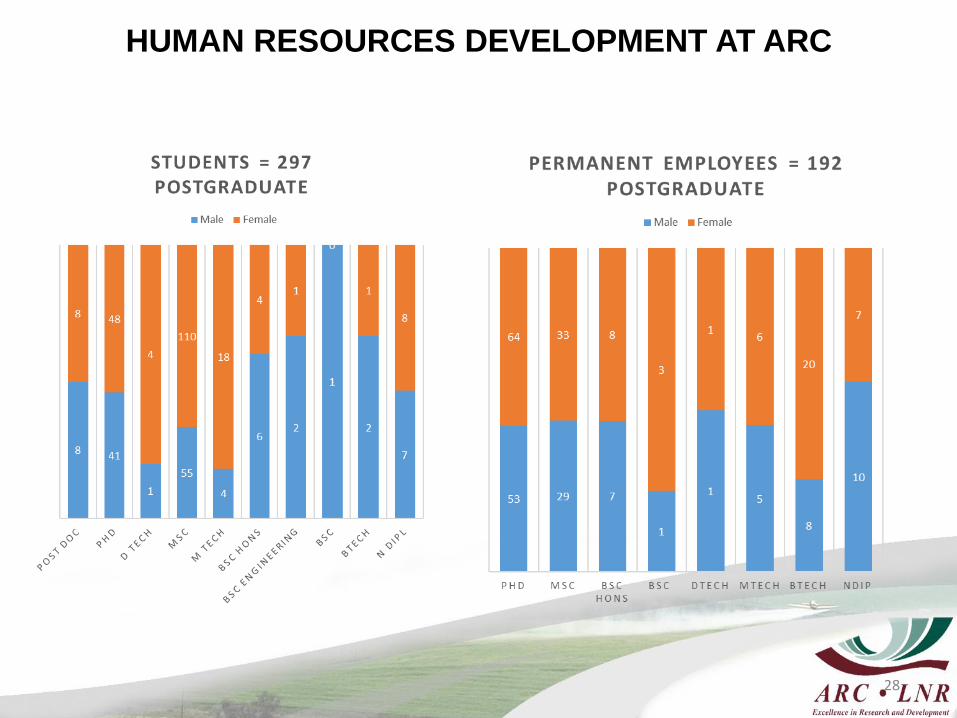
HUMAN RESOURCES DEVELOPMENT AT ARC
28
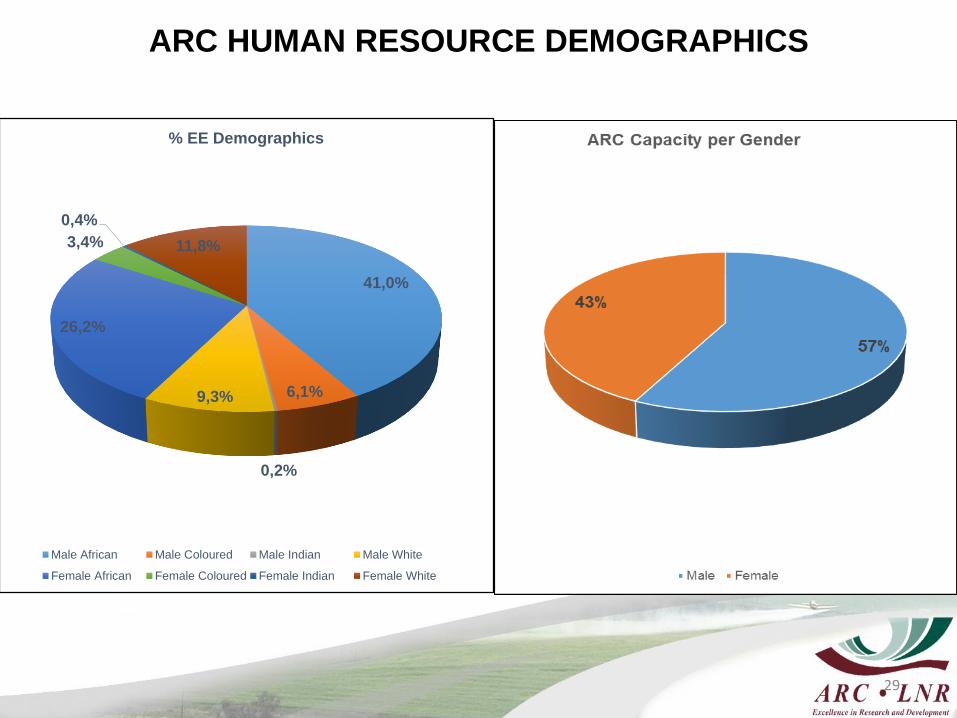
ARC HUMAN RESOURCE DEMOGRAPHICS
29
41,0%
6,1%
0,2%
9,3%
26,2%
3,4%
0,4%
11,8%
% EE Demographics
Male African Male Coloured Male Indian Male White
Female African Female Coloured Female Indian Female White
SUSTAINABLE ASSET MANAGEMENT FOR RESEARCH AND
DEVELOPMENT
30
Information & Communications Technologies
Investigating adoption and use of cloud services, among other technology innovations, with appropriate justification, as an opportunity for reducing cost of ownership of technology platforms;
Investigating and assessing applicability of innovations such as the “internet of things” (IoT), mobility, big data - planning for a pilot IoT in progress;
Defining and developing an “ARC big data” framework/strategy as a contributor to knowledge management (KM);
Exploring and developing solutions for meaningful, interactive farmer/stakeholder engagements, namely, mobile applications for information capture and/or dissemination;
Continuing with enablement of platforms for enhanced stakeholder engagement, namely
Dedicated, continuous process improvements across various business process domains
Infrastructure, Security
Against a background of constrained and declining funding, initiatives in Infrastructure include the following:
commercial production – this supports optimum utilization of our land properties and has potential to supplement other income sources;
increased rental income from facilities/infrastructure that can in turn fund critical maintenance of our facilities and infrastructure critical to research and development;
is there an appetite/willingness for engage the consolidation topic meaningfully?
Review of current approved asset management plan, as well as executing approved business cases for disposal of certain assets – this will eventually have a cost reduction impact on the ARC
Cost-saving initiatives relating to energy consumption, water, etc
FINANCIAL PERFORMANCE
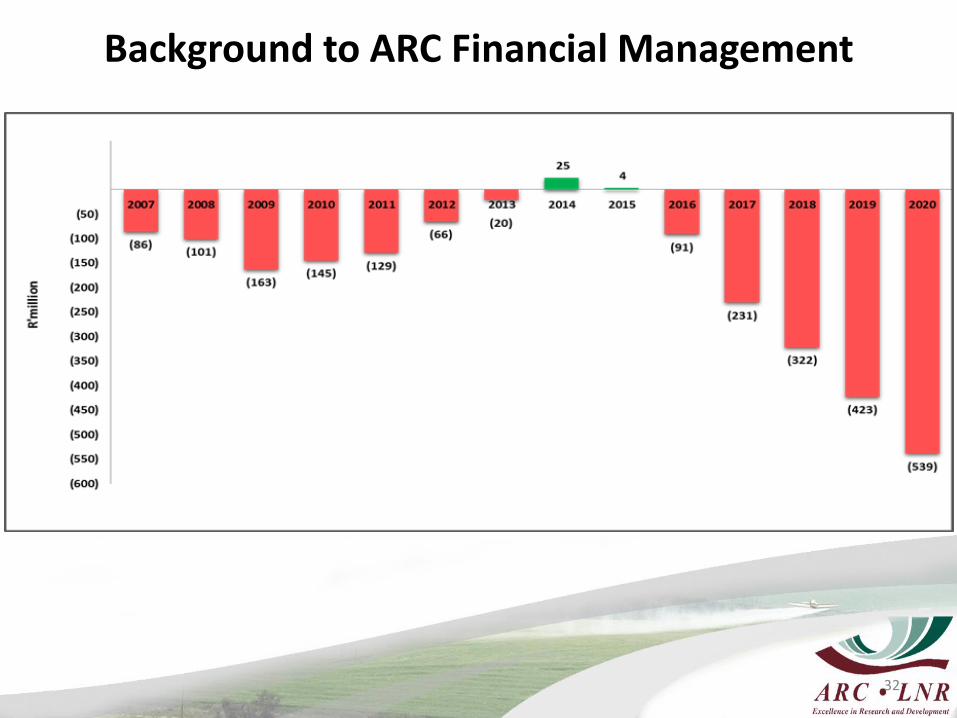
Background to ARC Financial Management
32
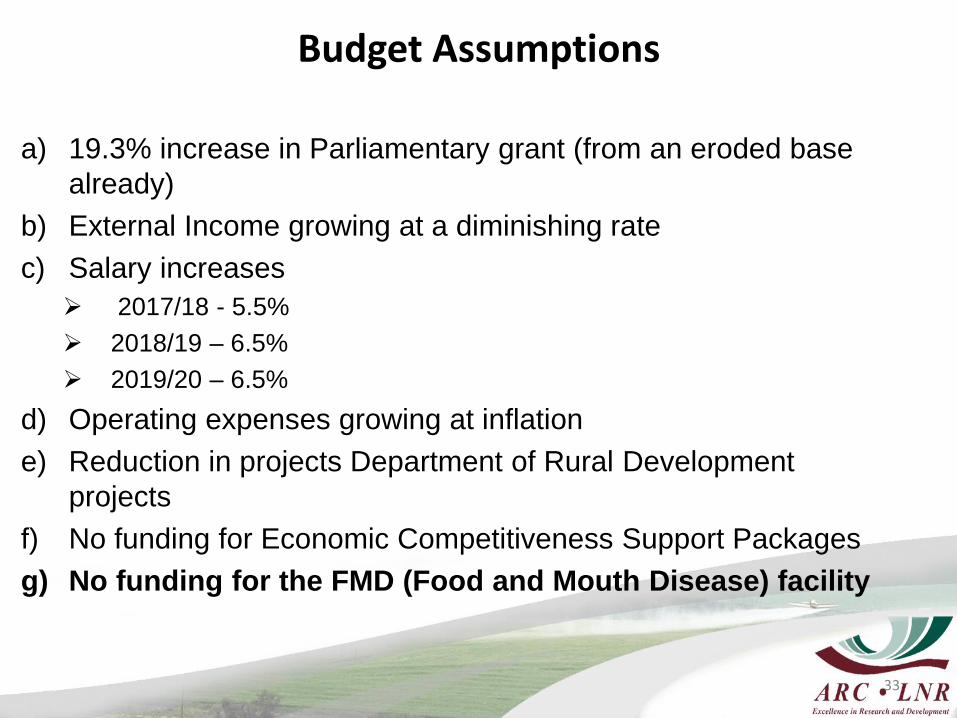
Budget Assumptions
a) 19.3% increase in Parliamentary grant (from an eroded base
already)
b) External Income growing at a diminishing rate
c) Salary increases
2017/18 - 5.5%
2018/19 – 6.5%
2019/20 – 6.5%
d) Operating expenses growing at inflation
e) Reduction in projects Department of Rural Development
projects
f) No funding for Economic Competitiveness Support Packages
g) No funding for the FMD (Food and Mouth Disease) facility
33
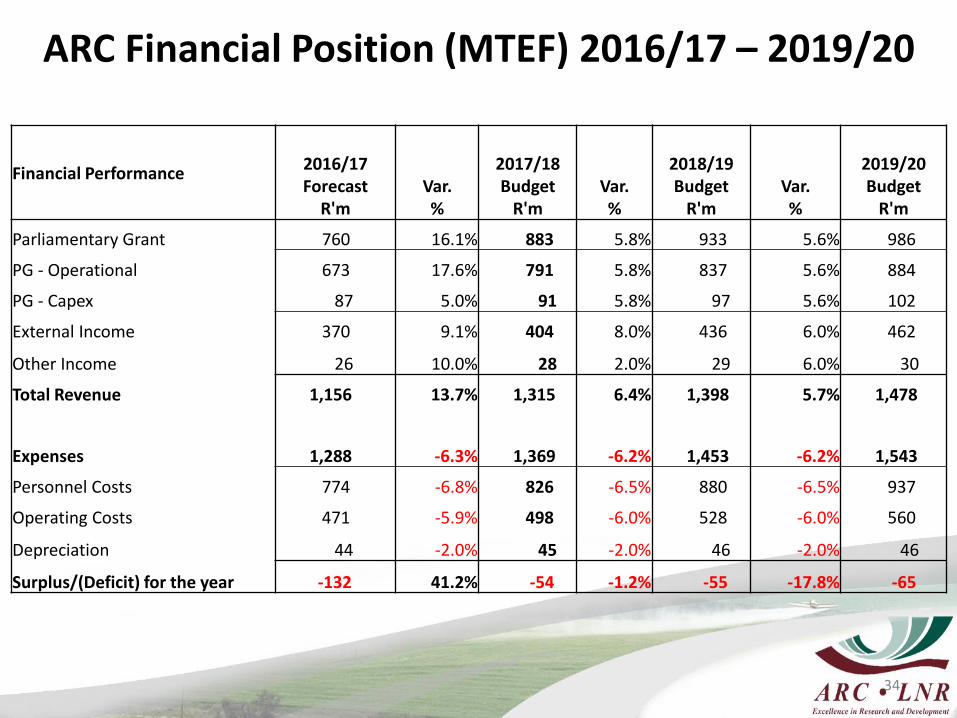
ARC Financial Position (MTEF) 2016/17 – 2019/20
34
Financial Performance2016/17Forecast
R'mVar. %
2017/18Budget
R'mVar. %
2018/19Budget
R'mVar. %
2019/20Budget
R'm
Parliamentary Grant 760 16.1% 883 5.8% 933 5.6% 986
PG - Operational 673 17.6% 791 5.8% 837 5.6% 884
PG - Capex 87 5.0% 91 5.8% 97 5.6% 102
External Income 370 9.1% 404 8.0% 436 6.0% 462
Other Income 26 10.0% 28 2.0% 29 6.0% 30
Total Revenue 1,156 13.7% 1,315 6.4% 1,398 5.7% 1,478
Expenses 1,288 -6.3% 1,369 -6.2% 1,453 -6.2% 1,543
Personnel Costs 774 -6.8% 826 -6.5% 880 -6.5% 937
Operating Costs 471 -5.9% 498 -6.0% 528 -6.0% 560
Depreciation 44 -2.0% 45 -2.0% 46 -2.0% 46
Surplus/(Deficit) for the year -132 41.2% -54 -1.2% -55 -17.8% -65
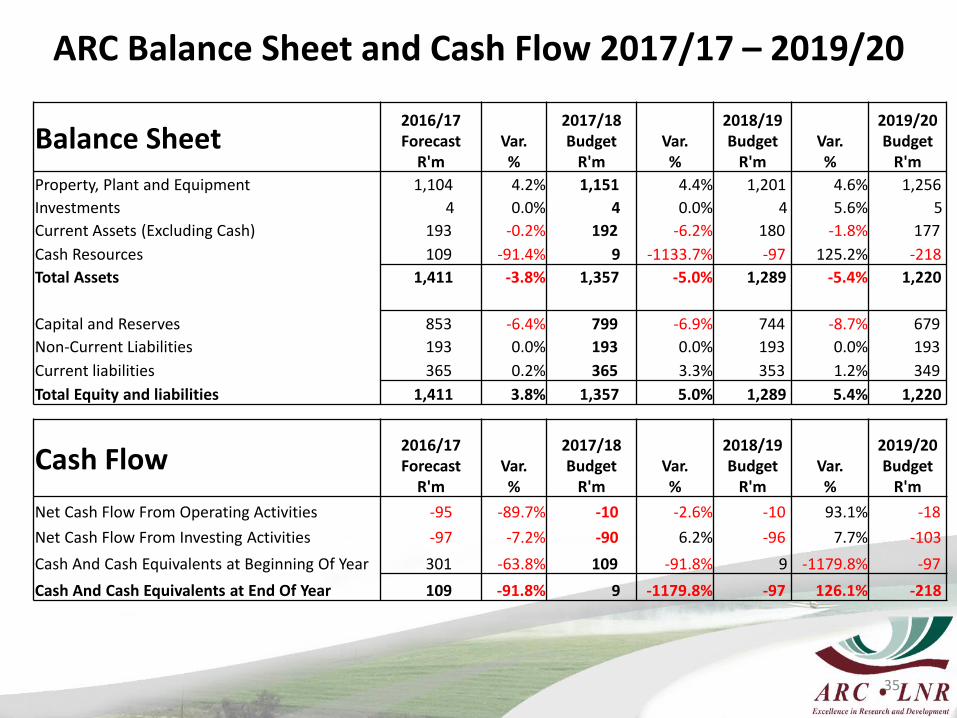
ARC Balance Sheet and Cash Flow 2017/17 – 2019/20
35
Balance Sheet2016/17Forecast
R'mVar. %
2017/18Budget
R'mVar. %
2018/19Budget
R'mVar. %
2019/20Budget
R'm
Property, Plant and Equipment 1,104 4.2% 1,151 4.4% 1,201 4.6% 1,256
Investments 4 0.0% 4 0.0% 4 5.6% 5
Current Assets (Excluding Cash) 193 -0.2% 192 -6.2% 180 -1.8% 177
Cash Resources 109 -91.4% 9 -1133.7% -97 125.2% -218
Total Assets 1,411 -3.8% 1,357 -5.0% 1,289 -5.4% 1,220
Capital and Reserves 853 -6.4% 799 -6.9% 744 -8.7% 679
Non-Current Liabilities 193 0.0% 193 0.0% 193 0.0% 193
Current liabilities 365 0.2% 365 3.3% 353 1.2% 349
Total Equity and liabilities 1,411 3.8% 1,357 5.0% 1,289 5.4% 1,220
Cash Flow2016/17Forecast
R'mVar. %
2017/18Budget
R'mVar. %
2018/19Budget
R'mVar. %
2019/20Budget
R'm
Net Cash Flow From Operating Activities -95 -89.7% -10 -2.6% -10 93.1% -18
Net Cash Flow From Investing Activities -97 -7.2% -90 6.2% -96 7.7% -103
Cash And Cash Equivalents at Beginning Of Year 301 -63.8% 109 -91.8% 9 -1179.8% -97
Cash And Cash Equivalents at End Of Year 109 -91.8% 9 -1179.8% -97 126.1% -218
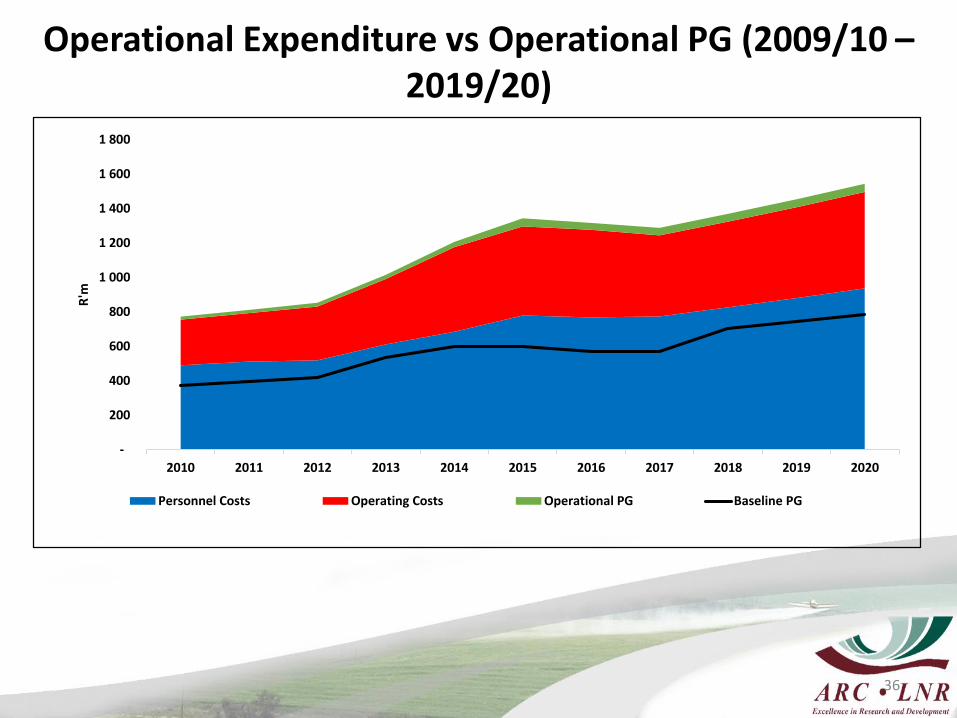
Operational Expenditure vs Operational PG (2009/10 –2019/20)
36
-
200
400
600
800
1 000
1 200
1 400
1 600
1 800
2010 2011 2012 2013 2014 2015 2016 2017 2018 2019 2020
R'm
Personnel Costs Operating Costs Operational PG Baseline PG
Implications of Budget Cuts
a) Income statements – Deficits over the MTEF
b) Return to negative cash position over MTEF
c) Student intake will be limited- capacity building
d) Possible Retrenchments
e) Vaccine development projects negatively affected
f) Review ARC pricing of Diagnostic and Analytical Services
g) Require full prepayments from Government Departments
h) Possible closure of some research facilities
i) KyD (Kaonafatso ya Dikgomo) activities to be curtailed
j) Animal Vaccine Development to be curtailed
37

Comments or Questions
Re a Leboha!
Siyabonga!
Ria Livhuwa!
Ha Khensa!
Siyathokoza!
Re a leboga
Siyabulela!
Baie Dankie!
Thank You
38