agricultural research 2009
TRANSCRIPT

AGRICULTURAL
RESEARCH
2009Report of Progress 1013
Kansas State UniversityAgricultural Experiment Station and Cooperative
Extension Service
SOUTHEASTAGRICULTURAL
RESEARCH CENTER
This publication from the Kansas State University Agricultural Experiment Station and Cooperative Extension Service has been archived. Current information is available from http://www.ksre.ksu.edu.
LYLE LOMASResearch Center Head and Animal Scientist
B.S., M.S., Animal Husbandry, University of Missouri Ph.D., Animal Husbandry, Michigan State University
Lyle provides administrative and research leadership and directs beef cattle research at the Kansas State University Southeast Agricultural Research Center. Lyle joined the staff in 1979 as an animal scientist and became head in 1986. His research interests are beef cattle nutrition and forage utilization by grazing beef cattle.
KEN KELLEYCrops and Soils Agronomist
B.S., Agricultural Education; M.S., Agronomy, Kansas State University
Ken has been a staff member since 1975. His research includes evaluating crop rotation systems, wheat management practices, and herbicides.
JIM LONGCrop Variety Development Agronomist
B.S., Missouri Southern State CollegeM.S., Ph.D., Agronomy, University of Arkansas
Jim joined the staff in 1990. He directs variety performance testing of grains, works with plant breeders to develop and evaluate new wheat and soybean cultivars, and conducts soybean production research.
JOE MOYERForage Agronomist
B.S., M.S., Ph.D., Agronomy, Kansas State University
Joe has been a staff member since 1978. His research evaluates forage grass and legume cultivars and management practices and forage utilization by grazing beef cattle.
DAN SWEENEYSoil and Water Management Agronomist
B.S., Chemistry, Kentucky Wesleyan CollegeM.S., Agronomy, Purdue UniversityPh.D., Soil Science, University of Florida
Dan joined the staff in 1983. His research focuses on soil fertility, tillage and compaction, water quality, and irrigation.
This publication from the Kansas State University Agricultural Experiment Station and Cooperative Extension Service has been archived. Current information is available from http://www.ksre.ksu.edu.

I
AGRICULTURAL
RESEARCH
2009Contents
1 Beef Cattle Research1 Supplementation of Grazing Stocker Cattle with Distillers Grains
9 Distillers Grains Supplementation Strategy for Grazing Stocker Cattle
13 Evaluation of Forage Production and Grazing Performance of Steers Grazing Tall Fescue Cultivars with the Novel Endophyte
18 Forage Crops Research18 Evaluation of Tall Fescue Cultivars
21 Forage Production of Seeded Bermudagrass Cultivars
23 Winter Annual Crops for Forage
28 Nitrogen Fertilization of Bermudagrass
30 Biomass Production of Switchgrass Lines
32 Soil and Water Management Research32 Tillage and Nitrogen Placement Effects on Yields in a Short-Season
Corn/Wheat/Double-Crop Soybean Rotation
34 Effect of Nitrogen and Phosphorus Starters on Short-Season Corn Grown in Conservation-Tillage Systems
37 Effects of Population, Planting Date, and Timing of Supplemental Irrigation on Sweet Corn
39 Crops and Soils Research39 Effects of Tillage on Full-Season Soybean Yield
41 Effects of Nitrogen Fertilizer Rate and Time of Application on Corn and Grain Sorghum Yields
This publication from the Kansas State University Agricultural Experiment Station and Cooperative Extension Service has been archived. Current information is available from http://www.ksre.ksu.edu.

IIII
43 Effects of Phosphorus and Potassium Fertilizer Rate and Time of Application in a Wheat Double-Cropping System
45 Effect of Soil pH on Crop Yield
46 Crop Variety Development Research46 Soybean Foliar Fungicide Trial
48 Foliar Fungicide Application on Full-Season and Double-Crop Soybean
50 Effect of Plant Population and Hybrid Maturity on Corn Grain Yield in Southeast Kansas
52 Corn Fungicide Effectiveness in Southeast Kansas for 2008
54 Planting Date, Plant Population, and Drying Agent Effects on Late-Planted Sunflower in Southeast Kansas
56 Other56 Annual Summary of Weather Data for Parsons, KS
58 Research Center Personnel
59 Acknowledgments
This publication from the Kansas State University Agricultural Experiment Station and Cooperative Extension Service has been archived. Current information is available from http://www.ksre.ksu.edu.
1
AGRICULTURAL RESEARCH 2009
Supplementation of Grazing Stocker Cattle with Distillers Grains
L. W. Lomas and J. L. Moyer
SummaryA total of 108 steers grazing smooth bromegrass pastures in 2005, 2006, and 2007 and 120 steers grazing bermudagrass pastures in 2006, 2007, and 2008 were used to evaluate the effects of supplementation with dried distillers grains (DDG) at 0.5 or 1.0% of body weight daily on available forage, grazing gains, subsequent finishing gains, and carcass characteristics. Supplementation with DDG resulted in significantly higher (P<0.05) grazing gains and gain per acre than feeding no supplement but had no effect (P>0.05) on forage availability. Supplementation with 1.0% DDG resulted in higher (P<0.05) grazing gains and gain per acre than supplementation with 0.5% DDG. Sup-plementation during the grazing phase had no effect (P>0.05) on finishing gains or feed efficiency of steers that grazed bermudagrass. However, steers that received no supple-ment while grazing bromegrass had greater (P<0.05) finishing gains than those supple-mented with 1% DDG and were more (P<0.05) efficient in converting feed to gain than steers supplemented with DDG during the grazing phase. Finishing gain, slaughter weight, hot carcass weight, yield grade, and overall gain were not different (P>0.05) be-tween steers supplemented with 0.5 or 1.0% DDG while grazing bromegrass pastures. Steers supplemented with 1.0% DDG while grazing bermudagrass had greater final slaughter weight, hot carcass weight, backfat thickness, and overall gain than those that received no grazing supplement. Unsupplemented steers and those that received 0.5% DDG had similar (P>0.05) finishing performance, carcass traits, and overall gains.
IntroductionDistillers grains are a by-product of the ethanol industry. Ethanol production from feed grains is a rapidly growing industry that is making a major contribution to the American agricultural economy. Total ethanol production in the United States has nearly qua-drupled in the past 10 years and is expected to increase even more in the future. Cur-rently, Kansas has 10 operating dry mill ethanol plants that have a combined production capacity of more than 329 million gallons of ethanol annually, and additional plants are in various stages of planning. Current ethanol production in Kansas creates a market for more than 116 million bushels of corn and sorghum and yields more than 1 million tons of DDG annually. With further growth of the ethanol industry, availability of this coprod-uct likely will increase, and cost likely will decrease. Therefore, efficient, cost-effective uses of this feedstuff need to be identified. The value of distillers grains as a supplement for grazing cattle also needs to be determined.
Currently, more than 80% of distillers grains are being fed to ruminants, but they also are used in swine and poultry diets. Distillers grains commonly are included in diets of dairy and finishing cattle at 20 to 30% of diet dry matter. A limiting factor in feeding large amounts of distillers grains is the environmental effect of excess nitrogen and phos-phorus. A South Dakota study revealed that protein was in excess of requirements when distillers grains were included at 30% of the diet dry matter in cows producing either
This publication from the Kansas State University Agricultural Experiment Station and Cooperative Extension Service has been archived. Current information is available from http://www.ksre.ksu.edu.
2
AGRICULTURAL RESEARCH 2009
53 or 66 lb/day of milk. Care also must be taken to balance diets containing distillers grains to avoid overfeeding phosphorus and sulfur.
Forage-based livestock production is a vital component of the Kansas economy. Kansas has more than 18 million acres of pastureland and ranks sixth in the United States in the number of beef cows, with more than 1.5 million head. Cash receipts from cattle produc-tion in Kansas exceeded $6.25 billion in 2006. Forages account for 80% of the feed units consumed by beef cattle and, therefore, represent an extremely important resource to the industry. Increasing the proportion of feed that is harvested directly by grazing cattle and balancing their diets with low-cost supplements such as distillers grains could improve sustainability and profitability of the beef cattle industry in Kansas and create additional demand for corn and sorghum coproducts.
Productivity of forage-livestock systems is limited by seasonality of forage growth. Energy and protein content of cool-season grasses can decline as much as 30 and 60% from vegetative stage to maturity, respectively. Livestock growth rates and reproductive performance generally decline in response to these seasonal changes in forage avail-ability and quality unless diets are supplemented with additional nutrients. Depending on price, use of supplemental feeds may be a cost-effective risk management strategy if amounts and/or nutritional quality of forages are inadequate. Because of the expansion of the grain processing industries, coproducts like distillers grains or gluten feed can be purchased at a price that is competitive with corn on a net energy basis and, with further growth of the industry, likely will be less expensive in the future. Because the coprod-ucts generally have high concentrations of protein and phosphorus, their composition complements mature forages that are typically deficient in these nutrients.
Experimental ProceduresThirty-six steers of predominately Angus breeding were weighed on two consecutive days, stratified by weight, and randomly allotted to nine 5-acre smooth bromegrass pas-tures on Apr. 5, 2005 (437 lb), Apr. 11, 2006 (484 lb), and Apr. 3, 2007 (497 lb). Three pastures of steers were randomly assigned to one of three supplementation treat-ments (three replicates per treatment) and were grazed for 196 days, 161 days, and 182 days in 2005, 2006, and 2007, respectively. Supplementation treatments were 0, 0.5, and 1.0% of body weight of DDG per head daily. Pastures were assigned to the same treatment during all 3 years. Pastures were fertilized with 100-40-40 lb/a N-P2O5-K2O5 on Mar. 5, 2005, Mar. 6, 2006, and Mar. 8, 2007. Pastures were stocked with 0.8 steers per acre and grazed continuously until Oct. 18, 2005 (196 days), Sept. 19, 2006 (161 days), and Oct. 2, 2007 (182 days), when steers were weighed on two consecutive days and grazing was terminated.
Forty mixed black yearling steers were weighed on two consecutive days, stratified by weight, and randomly allotted to eight 5-acre ‘Hardie’ bermudagrass pastures on June 1, 2006 (749 lb), May 22, 2007 (734 lb), and June 4, 2008 (812 lb). Supplementation treatments were 0, 0.5, and 1.0% of body weight of DDG per head daily. There were two replicates of the 0 level and three replicates each of the 0.5 and 1.0% levels. Pastures were fertilized with 100-30-30 lb/a N-P2O5-K2O5 on June 1, 2006, and June 6, 2007, 100 lb/a N on July 7, 2006, and 50 lb/a N on July 16, 2007, and 150-30-30 lb/a N-P2O5-K2O5 on July 2, 2008. Pastures were stocked with one steer per acre and grazed
This publication from the Kansas State University Agricultural Experiment Station and Cooperative Extension Service has been archived. Current information is available from http://www.ksre.ksu.edu.
3
AGRICULTURAL RESEARCH 2009
continuously until Sept. 6, 2006 (89 days), Sept. 11, 2007 (112 days), and Sept. 17, 2008 (105 days), when steers were weighed on two consecutive days and grazing was terminated.
Cattle in each pasture were group fed DDG in meal form on a daily basis, and pasture was the experimental unit. No implants or feed additives were used during the grazing phase. Weight gain was the primary measurement. Cattle were weighed every 28 days; quantity of distillers grain fed was adjusted at that time. Cattle were treated for internal and external parasites before being turned out to pasture and later were vaccinated for protection from pinkeye. Cattle had free access to commercial mineral blocks that con-tained 12% calcium, 12% phosphorous, and 12% salt.
Forage availability was measured approximately every 28 days with a disk meter cali-brated for the respective forage being grazed. In 2005, one steer was removed from the study for reasons unrelated to experimental treatment.
After the grazing period, cattle were shipped to a finishing facility, implanted with Synovex S, and fed a diet of 80% ground milo (whole-shelled corn in 2008), 15% corn silage, and 5% supplement (dry matter basis). Steers that grazed smooth bromegrass pastures in 2005, 2006, and 2007 were fed a finishing diet for 126, 126, and 119 days, respectively. Steers that grazed bermudagrass pastures in 2006, 2007, and 2008 were fed a finishing diet for 85, 112, and 86 days, respectively. All cattle were slaughtered in a commercial facility at the end of the finishing period, and carcass data were collected.
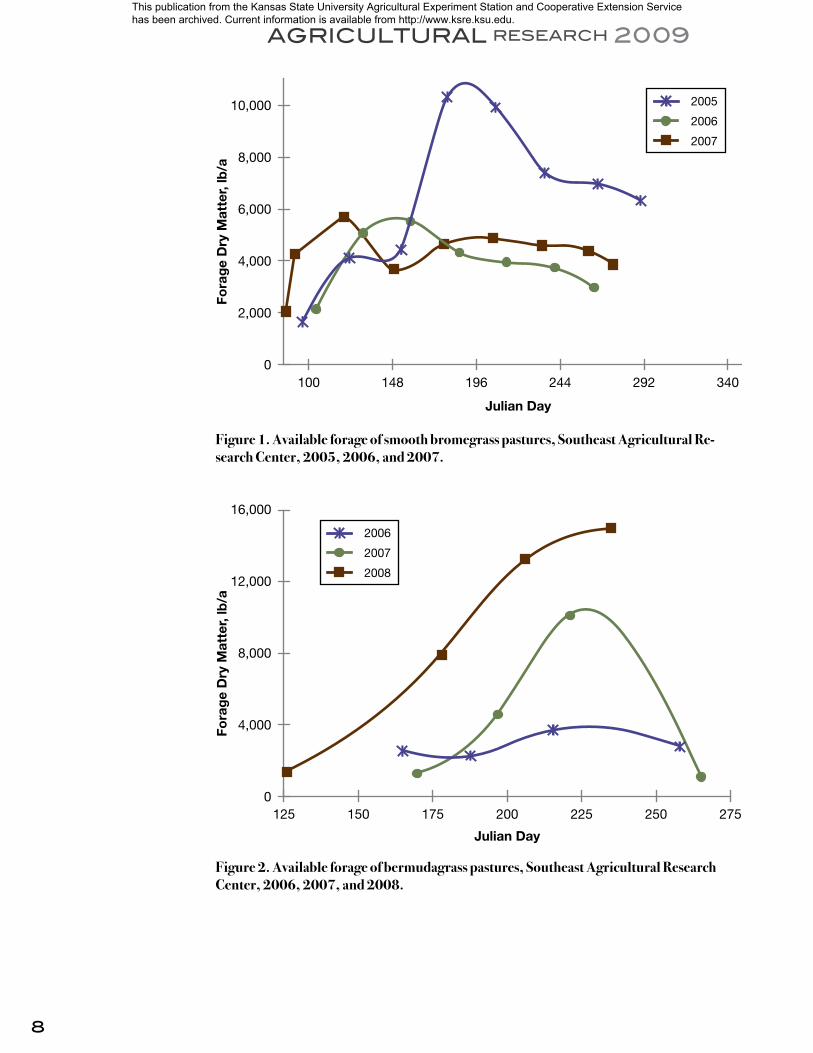
Results and DiscussionAvailable forage for the smooth bromegrass pastures during the grazing phase is pooled across treatments and presented by date and year in Figure 1 because supplementation with DDG had no effect (P>0.05) on quantity of forage available for grazing. In general, the quantity of available forage closely mirrored the level of rainfall. Quantity of available bromegrass forage varied by sampling date as expected. In 2005 and 2006, available for-age was lowest in early April, increased with each successive sampling date to its highest level in June, and gradually declined as the grazing season progressed. In 2007, available forage reached its highest level in late April, declined in May because of an armyworm invasion, increased in June and July because of timely rainfall, and then declined gradu-ally as the grazing season progressed. Average available forage was approximately 2,400 lb/a less in 2006 than in 2005, reflecting the lower level of precipitation in 2006, and 540 lb/a less in 2006 than in 2007 despite an armyworm invasion. Feeding DDG either caused a reduction in forage intake that our forage measurement technique was not sensitive enough to detect or improved forage digestibility sufficiently enough to increase forage intake and offset any substitution effects.
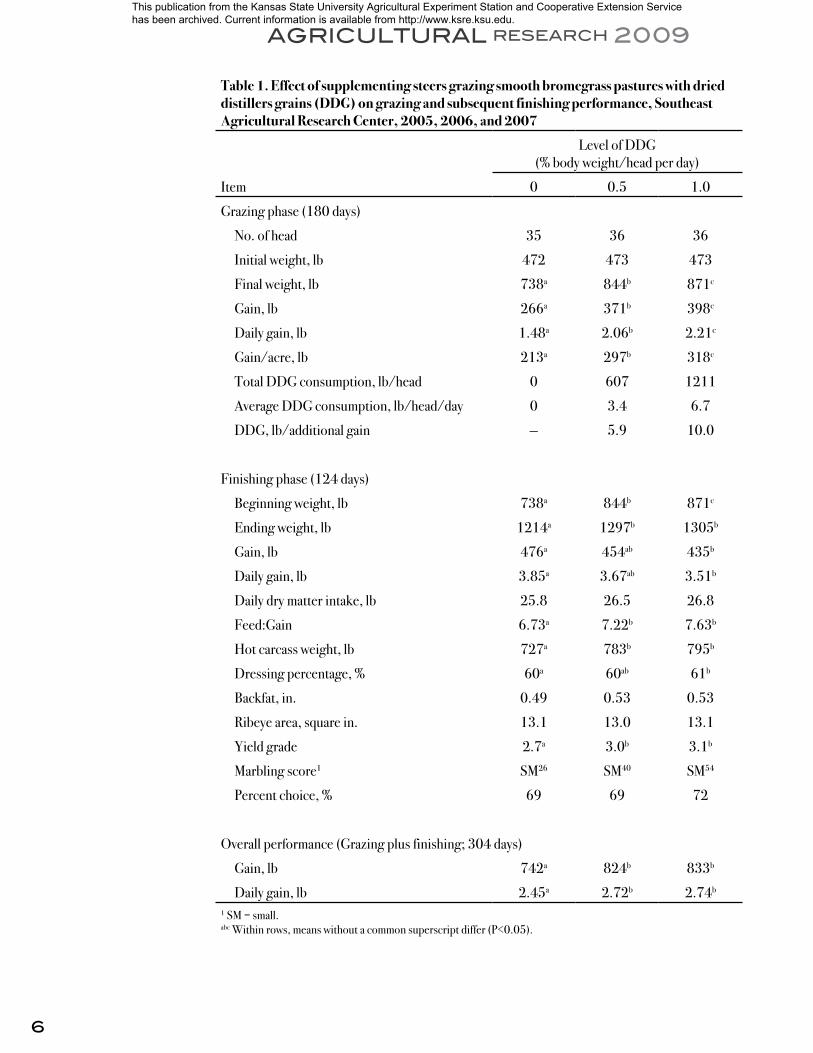
Grazing and subsequent finishing performance of steers supplemented with DDG while grazing smooth bromegrass in 2005, 2006, and 2007 are pooled across years and pre-sented by supplementation treatment in Table 1. Steers supplemented with 0.5 or 1.0% DDG during the grazing phase had 39 or 50% higher (P<0.05) weight gain, daily gain, and steer gain per acre, respectively, than those that received no supplement. Steers supplemented with 0.5 or 1.0% DDG had 105 or 132 lb higher (P<0.05) total weight gain, 0.58 or 0.73 lb higher (P<0.05) daily gain, and 84 or 105 lb higher (P<0.05) gain
This publication from the Kansas State University Agricultural Experiment Station and Cooperative Extension Service has been archived. Current information is available from http://www.ksre.ksu.edu.

4
AGRICULTURAL RESEARCH 2009
per acre, respectively, than those that received no supplementation. Supplementation of grazing steers with 1.0% DDG resulted in 7% higher (P<0.05) weight gain (27 lb), daily gain (0.15 lb), and gain per acre (27 lb), than supplementation with 0.5% DDG. Steers supplemented with DDG at 0.5 or 1.0% of body weight per head daily consumed a total of 607 or 1,211 lb of DDG, respectively, during the 180-day grazing period. Average consumption of DDG was 3.4 or 6.7 lb/head daily for steers supplemented with 0.5 or 1.0% DDG per head daily, respectively. Steers supplemented with 0.5 or 1.0% DDG per head daily required 5.9 or 10.0 lb of DDG for each additional pound of body weight gained during the grazing phase.
Steers supplemented with 0.5 or 1.0% DDG during the grazing phase were heavier (P<0.05) at slaughter, had higher (P<0.05) hot carcass weights and higher (P<0.05) nu-merical yield grades, but required more (P<0.05) feed per unit of gain than those that re-ceived no supplement. Steers that received no supplement during the grazing phase had higher (P<0.05) finishing gains than those supplemented with 1.0% DDG. Finishing gains of steers supplemented with 0.5% DDG were not different (P>0.05) from those of steers that received no supplement or 1.0% DDG. Supplementation with DDG during the grazing phase had no effect (P<0.05) on finishing feed intake, backfat, marbling score, or percentage of carcasses grading Choice. Steers supplemented with 0.5 or 1.0% DDG had 82 or 91 lb higher (P<0.05) overall gain and 0.27 or 0.29 lb higher (P<0.05) daily gain, respectively, than those that received no supplement while grazing. Most of the difference in overall gain observed was achieved during the grazing phase and carried through the finishing phase.
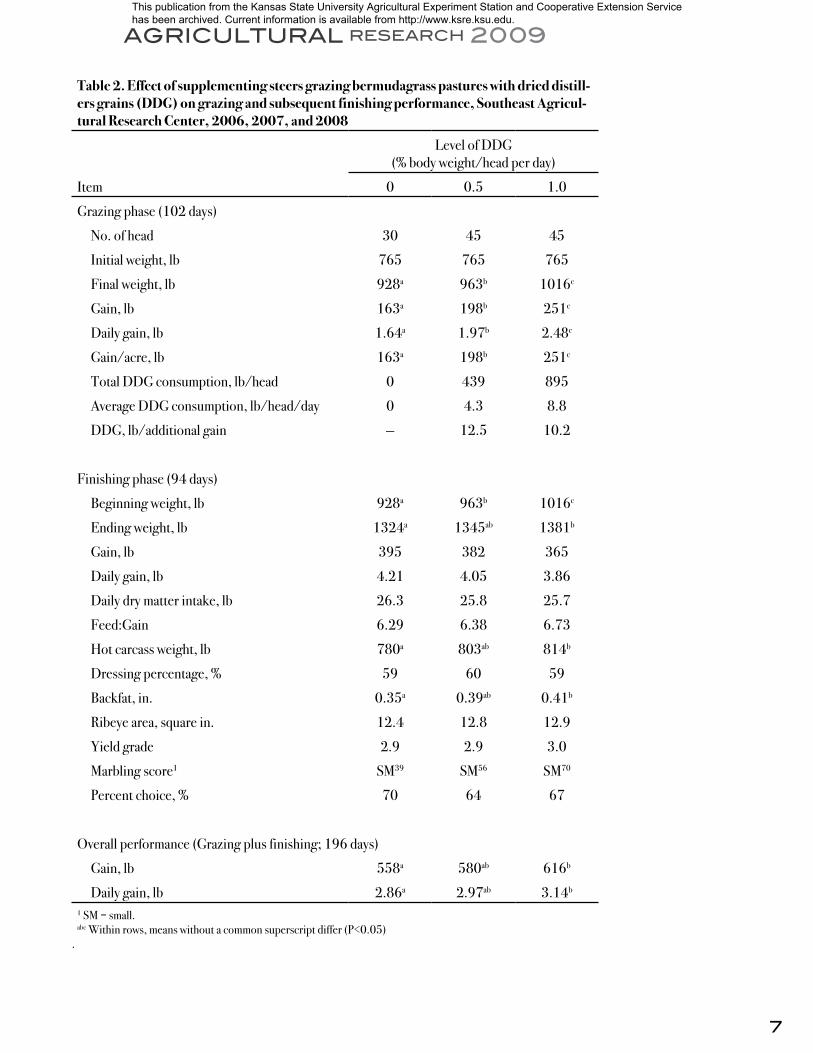
Available forage during the grazing phase is pooled across treatments and presented by date and year for the bermudagrass pastures in Figure 2 because supplementation with DDG had no effect (P>0.05) on quantity of forage available for grazing. Available forage was highest in 2008 and lowest in 2006, which followed the same trend as rainfall. Avail-able forage tended to reach maximum level each year in mid-August. Grazing and finish-ing performance of steers supplemented with DDG while grazing bermudagrass pastures in 2006, 2007, and 2008 are pooled and presented by supplementation treatment in Table 2. Steers supplemented with 0.5 or 1.0% DDG during the grazing phase had 21 or 54% higher (P<0.05) weight gain, daily gain, and steer gain per acre, respectively, than those that received no supplement. Steers supplemented with 0.5 or 1.0% DDG had 35 or 88 lb higher (P<0.05) total weight gain, 0.33 or 0.84 lb higher (P<0.05) daily gain, and 35 or 88 lb higher (P<0.05) gain per acre, respectively, than those that re-ceived no supplementation. Supplementation of grazing steers with 1.0% DDG resulted in 27% higher (P<0.05) weight gain (53 lb), daily gain (0.51 lb), and gain per acre (53 lb) than supplementation with 0.5% DDG. Steers supplemented with DDG at 0.5 or 1.0% of body weight per head daily consumed a total of 439 or 895 lb of DDG, respec-tively, during the 96-day grazing period. Average consumption of DDG was 4.3 or 8.8 lb/head daily for steers supplemented with 0.5 or 1.0% DDG per head daily, respec-tively. Consumption of DDG for each additional pound of body weight gain averaged 12.5 or 10.2 lb for steers supplemented with 0.5 or 1.0% DDG, respectively, during the 3 years of the study. Supplement conversion was likely not efficient enough to make supplementation of cattle grazing bermudagrass with DDG economically feasible. This may be partially due to these cattle being heavier and having a lower protein requirement that was being met by the bermudagrass forage alone.
This publication from the Kansas State University Agricultural Experiment Station and Cooperative Extension Service has been archived. Current information is available from http://www.ksre.ksu.edu.
5
AGRICULTURAL RESEARCH 2009
Supplementation with DDG during the grazing phase had no effect (P>0.05) on finish-ing gain, daily gain, dry matter intake, or feed:gain. Steers supplemented with 1.0% DDG while grazing were heavier (P<0.05) at the end of the finishing phase and had higher (P<0.05) hot carcass weights and greater (P<0.05) backfat thickness than steers that received no supplement. Ribeye area, yield grade, marbling score, and percentage of carcasses grading Choice were not different (P>0.05) between supplementation treat-ments. Steers supplemented with 1.0% DDG had 58 lb higher (P<0.05) overall gain and 0.28 lb higher (P<0.05) daily gain than those that received no supplement while grazing. Overall performance of cattle supplemented with 0.5 or 1.0% DDG was not different (P>0.05).
Under the conditions of this study, supplementation of stocker cattle grazing smooth bromegrass pasture with DDG at 0.5% of body weight daily resulted in more efficient supplement conversion and, therefore, a greater potential return on dollars invested in DDG than supplementation at the 1.0% level. Supplementation of stocker cattle grazing bermudagrass pastures with DDG appeared to be less beneficial than supplementation of cattle grazing smooth bromegrass pastures.
This publication from the Kansas State University Agricultural Experiment Station and Cooperative Extension Service has been archived. Current information is available from http://www.ksre.ksu.edu.
6
AGRICULTURAL RESEARCH 2009
Table 1. Effect of supplementing steers grazing smooth bromegrass pastures with dried distillers grains (DDG) on grazing and subsequent finishing performance, Southeast Agricultural Research Center, 2005, 2006, and 2007
Level of DDG(% body weight/head per day)
Item 0 0.5 1.0
Grazing phase (180 days)
No. of head 35 36 36
Initial weight, lb 472 473 473
Final weight, lb 738a 844b 871c
Gain, lb 266a 371b 398c
Daily gain, lb 1.48a 2.06b 2.21c
Gain/acre, lb 213a 297b 318c
Total DDG consumption, lb/head 0 607 1211
Average DDG consumption, lb/head/day 0 3.4 6.7
DDG, lb/additional gain — 5.9 10.0
Finishing phase (124 days)
Beginning weight, lb 738a 844b 871c
Ending weight, lb 1214a 1297b 1305b
Gain, lb 476a 454ab 435b
Daily gain, lb 3.85a 3.67ab 3.51b
Daily dry matter intake, lb 25.8 26.5 26.8
Feed:Gain 6.73a 7.22b 7.63b
Hot carcass weight, lb 727a 783b 795b
Dressing percentage, % 60a 60ab 61b
Backfat, in. 0.49 0.53 0.53
Ribeye area, square in. 13.1 13.0 13.1
Yield grade 2.7a 3.0b 3.1b
Marbling score1 SM26 SM40 SM54
Percent choice, % 69 69 72
Overall performance (Grazing plus finishing; 304 days)
Gain, lb 742a 824b 833b
Daily gain, lb 2.45a 2.72b 2.74b
1 SM = small.abc Within rows, means without a common superscript differ (P<0.05).
This publication from the Kansas State University Agricultural Experiment Station and Cooperative Extension Service has been archived. Current information is available from http://www.ksre.ksu.edu.
7
AGRICULTURAL RESEARCH 2009
Table 2. Effect of supplementing steers grazing bermudagrass pastures with dried distill-ers grains (DDG) on grazing and subsequent finishing performance, Southeast Agricul-tural Research Center, 2006, 2007, and 2008
Level of DDG(% body weight/head per day)
Item 0 0.5 1.0
Grazing phase (102 days)
No. of head 30 45 45
Initial weight, lb 765 765 765
Final weight, lb 928a 963b 1016c
Gain, lb 163a 198b 251c
Daily gain, lb 1.64a 1.97b 2.48c
Gain/acre, lb 163a 198b 251c
Total DDG consumption, lb/head 0 439 895
Average DDG consumption, lb/head/day 0 4.3 8.8
DDG, lb/additional gain — 12.5 10.2
Finishing phase (94 days)
Beginning weight, lb 928a 963b 1016c
Ending weight, lb 1324a 1345ab 1381b
Gain, lb 395 382 365
Daily gain, lb 4.21 4.05 3.86
Daily dry matter intake, lb 26.3 25.8 25.7
Feed:Gain 6.29 6.38 6.73
Hot carcass weight, lb 780a 803ab 814b
Dressing percentage, % 59 60 59
Backfat, in. 0.35a 0.39ab 0.41b
Ribeye area, square in. 12.4 12.8 12.9
Yield grade 2.9 2.9 3.0
Marbling score1 SM39 SM56 SM70
Percent choice, % 70 64 67
Overall performance (Grazing plus finishing; 196 days)
Gain, lb 558a 580ab 616b
Daily gain, lb 2.86a 2.97ab 3.14b
1 SM = small.abc Within rows, means without a common superscript differ (P<0.05)
.
This publication from the Kansas State University Agricultural Experiment Station and Cooperative Extension Service has been archived. Current information is available from http://www.ksre.ksu.edu.
8
AGRICULTURAL RESEARCH 2009
Fora
ge
Dry
Mat
ter,
lb/a
10,000
8,000
6,000
4,000
2,000
0
2005
2006
2007
100 292244196148 340
Julian Day
Figure 1. Available forage of smooth bromegrass pastures, Southeast Agricultural Re-search Center, 2005, 2006, and 2007.
Fora
ge
Dry
Mat
ter,
lb/a
16,000
12,000
8,000
4,000
0
2006
2007
2008
125 250225175150 275200
Julian Day
Figure 2. Available forage of bermudagrass pastures, Southeast Agricultural Research Center, 2006, 2007, and 2008.
This publication from the Kansas State University Agricultural Experiment Station and Cooperative Extension Service has been archived. Current information is available from http://www.ksre.ksu.edu.
9
AGRICULTURAL RESEARCH 2009
Distillers Grains Supplementation Strategy for Grazing Stocker Cattle
L. W. Lomas and J. L. Moyer
SummaryThirty-six steers grazing smooth bromegrass pastures were used to evaluate the effects of distillers grains supplementation strategy on available forage, grazing gains, subsequent finishing gains, and carcass characteristics. Supplementation treatments evaluated were no supplement, dried distillers grains (DDG) at 0.5% of body weight per head daily dur-ing the entire grazing phase, or no supplementation during the first 56 days and DDG at 0.5% of body weight per head daily during the remainder of the grazing phase. Supple-mentation with DDG during the entire grazing phase or only during the latter part of the grazing phase resulted in higher (P<0.05) grazing gains than feeding no supplement. Supplementation treatment had no effect (P>0.05) on available forage during the graz-ing phase. Grazing performance and supplement conversion efficiency were not different (P<0.05) between the two DDG supplementation treatments. Supplementation during the grazing phase had no effect (P>0.05) on finishing performance, carcass characteris-tics, or overall performance.
IntroductionDistillers grains are a by-product of the ethanol industry and have tremendous potential as an economical and nutritious supplement for grazing cattle. Because the coproducts generally have high concentrations of protein and phosphorus, their nutrient composi-tion complements that of mature forages, which are typically deficient in these nutrients. Previous research at this location evaluating DDG supplementation of stocker cattle grazing smooth bromegrass has shown DDG at 0.5% of body weight per head daily to be the most efficacious level from both an animal performance and economics perspective. This research was conducted to evaluate DDG supplementation strategies that might potentially increase the efficiency of supplement conversion by delaying supplementa-tion until later in the grazing season, when forage quality starts to decline.
Experimental ProceduresThirty-six steers (450 lb) of predominately Angus breeding were weighed on two con-secutive days, stratified by weight, and randomly allotted to nine 5-acre smooth brome-grass pastures on Apr. 9, 2008. Three pastures of steers were randomly assigned to one of three supplementation treatments (three replicates per treatment) and were grazed for 140 days. Supplementation treatments were no supplement, DDG at 0.5% of body weight per head daily, or no DDG during the first 56 days of grazing then DDG at 0.5% of body weight per head daily for the remaining 140 days of the grazing phase. Pastures were fertilized with 100 lb/a N on Feb. 29, 2008. Pastures were stocked with 0.8 steers per acre and grazed continuously until Oct. 22, 2008, when steers were weighed on two consecutive days and grazing was terminated.
This publication from the Kansas State University Agricultural Experiment Station and Cooperative Extension Service has been archived. Current information is available from http://www.ksre.ksu.edu.
10
AGRICULTURAL RESEARCH 2009
Cattle in each pasture were group-fed DDG in meal form on a daily basis in metal feed bunks, and pasture was the experimental unit. No implants or feed additives were used during the grazing phase. Weight gain was the primary measurement. Cattle were weighed every 28 days; quantity of distillers grain fed was adjusted at that time. Cattle were treated for internal and external parasites before being turned out to pasture and later were vaccinated for protection from pinkeye. Cattle had free access to commercial mineral blocks that contained 12% calcium, 12% phosphorous, and 12% salt.
Forage availability was measured approximately every 28 days with a disk meter calibrat-ed for smooth bromegrass.
After the grazing period, cattle were shipped to a finishing facility, implanted with Synovex S, and fed a diet of 80% whole-shelled corn, 15% corn silage, and 5% supple-ment (dry matter basis) for 112 days. All cattle were slaughtered in a commercial facility at the end of the finishing period, and carcass data were collected.
Results and DiscussionAverage available forage for the smooth bromegrass pastures during the grazing phase and grazing and subsequent finishing performance of grazing steers are presented by supplementation treatment in Table 1. Supplementation with DDG had no effect (P>0.05) on quantity of forage available for grazing. Average available forage for all treatments was high (greater than 9,000 lb/a of dry matter), likely because of signifi-cantly greater than average rainfall in 2008.
Steers supplemented with 0.5% DDG during the entire grazing season or only during the latter part of the grazing season had 31 or 23% greater (P<0.05) weight gain, daily gain, and steer gain per acre, respectively, than those that received no supplement. Steers supplemented with 0.5% DDG throughout the grazing season or only during the latter part had 100 or 75 lb greater (P<0.05) total weight gain, 0.51 or 0.38 lb greater (P<0.05) daily gain, and 80 or 60 lb greater (P<0.05) gain per acre, respectively, than those that received no supplementation. Grazing weight gain, daily gain, and gain per acre were not different (P>0.05) between steers that were supplemented with 0.5% DDG during the entire grazing season or only during the latter part of the season. Steers supplemented with DDG at 0.5% of body weight per head daily during the entire 196-day grazing season consumed a total of 651 lb of DDG, whereas steers supplemented only during the latter 140 days of the grazing season consumed 496 lb of DDG. Average consumption of DDG was 3.3 or 3.5 lb/head daily for steers supplemented the entire grazing season or only during the last 140 days, respectively. Steers supplemented with DDG during the entire grazing season or only during the latter part consumed 6.5 or 6.6 lb of DDG for each additional pound of body weight gained during the grazing phase above steers that received no supplement.
Supplementation during the grazing phase had no effect (P>0.05) on finishing weight gain, feed intake, feed:gain, hot carcass weight, backfat, ribeye area, yield grade, or marbling score. Overall performance (grazing plus finishing) was not different (P>0.05) between supplementation treatments.
This publication from the Kansas State University Agricultural Experiment Station and Cooperative Extension Service has been archived. Current information is available from http://www.ksre.ksu.edu.
11
AGRICULTURAL RESEARCH 2009
Under the conditions of this study, supplementation of stocker cattle grazing smooth bromegrass pasture with DDG at 0.5% of body weight during the entire grazing season or only during the latter part of the grazing season would likely have been profitable if the cattle had been marketed as feeder cattle at the end of the grazing phase. Delaying supplementation until early June would have reduced labor requirements for the first 56 days of the grazing phase, when cattle received no supplement, but resulted in similar grazing gains. If ownership of the cattle was to be retained through slaughter, there was no advantage to supplementation with DDG during the grazing phase in the current study. This is contrary to previous research in which stocker cattle supplemented with DDG during the grazing phase maintained their weight advantage through slaughter.
This publication from the Kansas State University Agricultural Experiment Station and Cooperative Extension Service has been archived. Current information is available from http://www.ksre.ksu.edu.

12
AGRICULTURAL RESEARCH 2009
Table 1. Effect of dried distillers grains (DDG) supplementation strategy on available smooth bromegrass forage and grazing and subsequent finishing performance of steers grazing smooth bromegrass pastures, Southeast Agricultural Research Center, 2008
Level of DDG (% body weight/head per day)
Item 0 0.5 0.5 delayed1
Grazing phase (196 days)
No. of head 12 12 12
Initial weight, lb 450 450 450
Final weight, lb 772a 871b 846b
Gain, lb 321a 421b 396b
Daily gain, lb 1.64a 2.15b 2.02b
Gain/acre, lb 257a 337b 317b
Total DDG consumption, lb/head 0 651 496
Average DDG consumption, lb/head/day 0 3.3 3.5
DDG, lb/additional gain — 6.5 6.6
Average available smooth bromegrass forage, lb of dry matter/acre
9264 9020 9240
Finishing phase (112 days)
Beginning weight, lb 772a 871b 846b
Ending weight, lb 1306 1369 1357
Gain, lb 535 498 511
Daily gain, lb 4.77 4.44 4.56
Daily dry matter intake, lb 26.0 25.8 25.7
Feed:Gain 5.46 5.83 5.64
Hot carcass weight, lb 764 821 813
Dressing percentage, % 58 60 60
Backfat, in. 0.43 0.45 0.41
Ribeye area, square in. 11.1 11.6 11.5
Yield grade 3.2 2.9 2.8
Marbling score2 MT75 MT45 MT40
Percent choice, % 100 100 100
Overall performance (Grazing plus finishing; 308 days)
Gain, lb 856 918 907
Daily gain, lb 2.78 2.98 2.941 Steers were supplemented with DDG only during the last 140 days of the grazing phase.2 MT = modest.abc Within rows, means without a common superscript differ (P<0.05).
This publication from the Kansas State University Agricultural Experiment Station and Cooperative Extension Service has been archived. Current information is available from http://www.ksre.ksu.edu.
13
AGRICULTURAL RESEARCH 2009
Evaluation of Forage Production and Grazing Performance of Steers Grazing Tall Fescue Cultivars with the Novel Endophyte
L. W. Lomas and J. L. Moyer
SummaryA total of 288 mixed black steers were used to evaluate the effect of tall fescue cultivar on grazing gains, forage production, and stand persistence in 2004, 2005, 2006, and 2007. Cultivars evaluated were high-endophyte Kentucky 31, low-endophyte Ken-tucky 31, ArkPlus, and MaxQ. Pastures with low-endophyte Kentucky 31, ArkPlus, or MaxQ produced higher (P<0.05) steer grazing gains and more (P<0.05) gain per acre than high-endophyte Kentucky 31. Steer live weight gain and gain per acre were similar (P>0.05) among pastures with low-endophyte Kentucky 31, ArkPlus, or MaxQ. There was no difference (P>0.05) in available forage dry matter between varieties in 2004. However, in 2005, 2006, 2007, and 2008, high-endophyte Kentucky 31 pastures had greater (P<0.05) available forage than low-endophyte Kentucky 31 ArkPlus, and MaxQ pastures.
IntroductionTall fescue, the most widely adapted cool-season perennial grass in the United States, is grown on approximately 66 million acres. Although tall fescue is well adapted in the eastern half of the country between the temperate North and mild South, presence of a fungal endophyte results in poor performance of grazing livestock, especially during the summer.
Until recently, producers with high-endophyte tall fescue pastures had two primary options for improving grazing livestock performance. One option was to destroy exist-ing stands and replace them with endophyte-free fescue or other forages. Although it supports greater grazing animal performance than endophyte-infected fescue, endo-phyte-free fescue is less persistent under grazing and more susceptible to stand loss from drought stress. In situations where high-endophyte tall fescue must be grown, the other option was for producers to adopt management strategies that reduce the negative effects of the endophyte on grazing animals, such as incorporating legumes into exist-ing pastures. Adding legumes can improve nutritive quality of fescue pastures, increase gains of grazing livestock, and reduce nitrogen fertilizer rates.
During the past few years, new tall fescue cultivars have been developed that have a “novel” endophyte that provides vigor to the fescue plant but does not have the nega-tive effect on performance of grazing livestock. Objectives of this study were to evaluate grazing and subsequent finishing performance of stocker steers, forage availability, and stand persistence of two of these new cultivars and compare them with high- and low-endophyte Kentucky 31 tall fescue.
This publication from the Kansas State University Agricultural Experiment Station and Cooperative Extension Service has been archived. Current information is available from http://www.ksre.ksu.edu.
14
AGRICULTURAL RESEARCH 2009
Experimental ProceduresSixty-four mixed black steers in 2004, 2005, and 2006 and 48 mixed black steers in 2007 and 2008 were weighed on two consecutive days and allotted to 16 five-acre pas-tures (12 pastures in 2008) of high-endophyte Kentucky 31, low-endophyte Kentucky 31, ArkPlus, or MaxQ tall fescue (four replications per cultivar in 2004, 2005, 2006, and 2007 and 3 replications in 2008) on Mar. 18, 2004 (513 lb), Mar. 24, 2005 (501 lb), Mar. 29, 2006 (568 lb), Apr. 10, 2007 (626 lb), and Apr. 2, 2008 (575 lb). All pastures were seeded in the fall of 2002 and harvested for hay in 2003. All pastures were fertilized with 80 lb/a N and P2O5 and K2O as required by soil test on Jan. 15, 2004, and with 80 lb/a N on Feb. 2, 2005, Jan. 19, 2006, Mar. 7, 2007, and Mar. 11, 2008, and with 40-40-30 lb/a N-P2O5-K2O on Sept. 3, 2004, Sept. 13, 2005, Sept. 11, 2006, and Sept. 4, 2007, and with 20 lb/a N and P2O5 and K2O as required by soil test on Oct. 17, 2008.
Cattle were treated for internal and external parasites before being turned out to pasture and later were vaccinated for protection from pinkeye. Steers had free access to commer-cial mineral blocks that contained 12% calcium, 12% phosphorus, and 12% salt.
Cattle were weighed every 28 days, and forage availability was measured approximately every 28 days with a disk meter calibrated for tall fescue. In both 2006 and 2008, two steers were removed from the study for reasons unrelated to experimental treatment. Pastures were grazed continuously until Nov. 30, 2004 (257 days), Dec. 6, 2005 (257 days), Aug. 15, 2006 (139 days), Nov. 20, 2007 (224 days), and Nov. 26, 2008 (236 days), when steers were weighed on two consecutive days and grazing was terminated. Drought stress reduced the length of the grazing season in 2006. Pastures were stocked with four steers per pasture in 2004, 2005, 2006, and 2008 and three steers per pas-ture in 2007 because of stand reduction that occurred following the drought in 2006.
After the grazing period, cattle were moved to a finishing facility, implanted with Synovex S, and fed a diet of 80% ground milo (whole-shelled corn in 2008), 15% corn silage, and 5% supplement (dry matter basis). Cattle grazed in 2006 were reimplanted with Synovex S on day 84 of the finishing period. Cattle grazed during 2004, 2005, 2007, and 2008 were fed a finishing diet for 112, 112, 100, and 98 days, respectively. Steers grazed during 2006 on low-endophyte Kentucky 31, ArkPlus, or MaxQ were fed a finishing diet for 142 days, and steers that grazed high-endophyte Kentucky 31 were fed a finishing diet for 168 days. All steers were slaughtered in a commercial facility, and carcass data were collected.
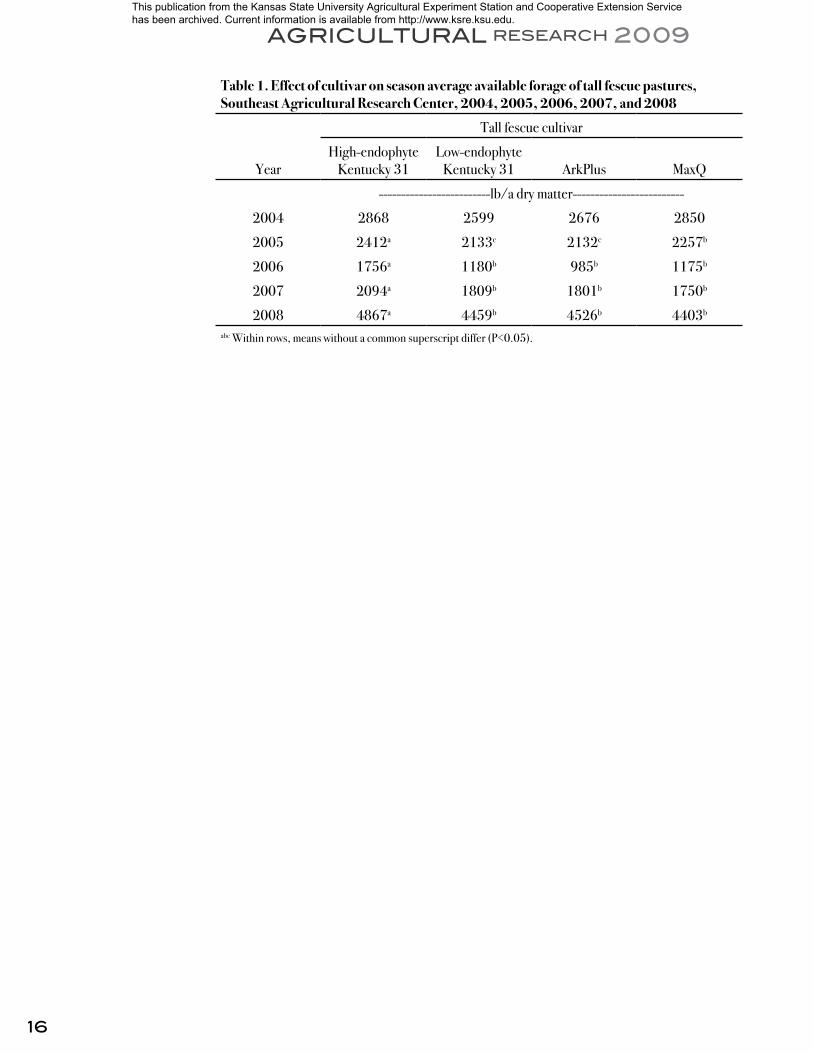
Results and DiscussionAverage available forage dry matter of each cultivar is presented by year in Table 1. There was no difference (P>0.05) among cultivars for average available forage for the 2004 grazing season. However, high-endophyte Kentucky 31 pastures had greater (P<0.05) average available forage than low-endophyte Kentucky 31, ArkPlus, or MaxQ pastures in 2005, 2006, 2007, and 2008. MaxQ pastures had greater (P<0.05) average available forage dry matter than low-endophyte Kentucky 31, ArkPlus, or MaxQ pastures in 2005. However, average available forage was similar (P>0.05) among low-endophyte Kentucky 31, ArkPlus, and MaxQ in 2006, 2007, and 2008.
This publication from the Kansas State University Agricultural Experiment Station and Cooperative Extension Service has been archived. Current information is available from http://www.ksre.ksu.edu.

15
AGRICULTURAL RESEARCH 2009
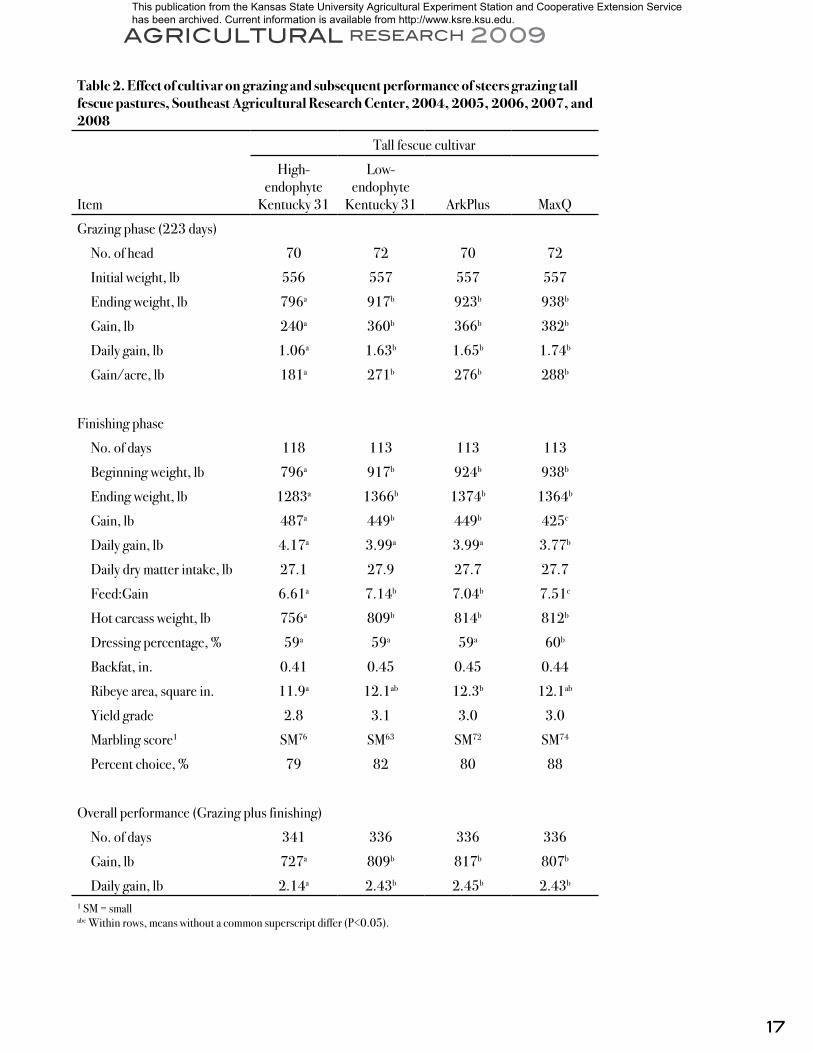
Grazing and subsequent finishing performance averaged across years is presented by cultivar in Table 2. Steers that grazed pastures of low-endophyte Kentucky 31, MaxQ, or ArkPlus gained significantly more (P<0.05) and produced more (P<0.05) gain per acre than those that grazed high-endophyte Kentucky 31 pastures. Gains of cattle that grazed low-endophyte Kentucky 31, ArkPlus, or MaxQ were similar (P>0.05). Daily gains of steers grazing pastures with high-endophyte Kentucky 31, low-endophyte Kentucky 31, ArkPlus, and MaxQ were 1.06, 1.63, 1.65, and 1.74 lb/head daily, respectively. Gains per acre from pastures with high-endophyte Kentucky 31, low-endophyte Kentucky 31, ArkPlus, and MaxQ were 181, 271, 276, and 288 lb/a, respectively. In general, low-endophyte Kentucky 31, ArkPlus, or MaxQ pastures had less (P<0.05) available forage dry matter and produced greater (P<0.05) steer gains than high-endophyte Kentucky 31 pastures that had greater (P<0.05) available forage dry matter. This could indicate that the lower available dry matter was the result of greater forage intake by grazing steers, which resulted in higher gains and/or less vigor of the fescue cultivar.
Steers that previously grazed high-endophyte Kentucky 31 had lower (P<0.05) final finishing weights and lower (P<0.05) hot carcass weights than steers that grazed low-endophyte Kentucky 31, ArkPlus, or MaxQ. Final live weights and hot carcass weights were similar (P>0.05) for steers that grazed low-endophyte Kentucky 31, ArkPlus, or MaxQ. However, steers that grazed high-endophyte Kentucky 31, low-endophyte Ken-tucky 31, or ArkPlus had higher (P<0.05) finishing daily gains than those that grazed MaxQ. Steers that had previously grazed high-endophyte Kentucky 31 required less (P<0.05) feed per unit of gain during the finishing phase than those that had grazed low-endophyte Kentucky 31, ArkPlus, or MaxQ. Steers that grazed low-endophyte Kentucky 31 or ArkPlus were more (P<0.05) efficient in converting feed to gain than those that grazed MaxQ. Feed:Gain was similar (P>0.05) for steers that had grazed low-endophyte Kentucky 31 or ArkPlus.
Steers that grazed ArkPlus had greater (P<0.05) ribeye area than those that grazed high-endophyte Kentucky 31. This was likely partially due to the lower (P<0.05) hot carcass weight of steers that grazed high-endophyte Kentucky 31. Fat thickness, yield grade, marbling score, and percentage of carcasses grading Choice were not different (P>0.05) between grazing treatments.
Overall gain and daily gain of steers that grazed low-endophyte Kentucky 31, ArkPlus, or MaxQ were greater (P<0.05) than those of steers that grazed high-endophyte Ken-tucky 31. Overall gain and daily gain of steers that grazed low-endophyte Kentucky 31, ArkPlus, or MaxQ were similar (P>0.05).
Cattle grazing ArkPlus or MaxQ tall fescue, new varieties with the novel endophyte, appear to have gains similar to those of cattle grazing low-endophyte Kentucky 31 and significantly greater than those of cattle grazing high-endophyte Kentucky 31 tall fescue.
This publication from the Kansas State University Agricultural Experiment Station and Cooperative Extension Service has been archived. Current information is available from http://www.ksre.ksu.edu.
16
AGRICULTURAL RESEARCH 2009
Table 1. Effect of cultivar on season average available forage of tall fescue pastures, Southeast Agricultural Research Center, 2004, 2005, 2006, 2007, and 2008
Tall fescue cultivar
YearHigh-endophyte
Kentucky 31Low-endophyte
Kentucky 31 ArkPlus MaxQ
-------------------------lb/a dry matter-------------------------
2004 2868 2599 2676 2850
2005 2412a 2133c 2132c 2257b
2006 1756a 1180b 985b 1175b
2007 2094a 1809b 1801b 1750b
2008 4867a 4459b 4526b 4403b
abc Within rows, means without a common superscript differ (P<0.05).
This publication from the Kansas State University Agricultural Experiment Station and Cooperative Extension Service has been archived. Current information is available from http://www.ksre.ksu.edu.
17
AGRICULTURAL RESEARCH 2009
Table 2. Effect of cultivar on grazing and subsequent performance of steers grazing tall fescue pastures, Southeast Agricultural Research Center, 2004, 2005, 2006, 2007, and 2008
Tall fescue cultivar
Item
High-endophyte
Kentucky 31
Low-endophyte
Kentucky 31 ArkPlus MaxQ
Grazing phase (223 days)
No. of head 70 72 70 72
Initial weight, lb 556 557 557 557
Ending weight, lb 796a 917b 923b 938b
Gain, lb 240a 360b 366b 382b
Daily gain, lb 1.06a 1.63b 1.65b 1.74b
Gain/acre, lb 181a 271b 276b 288b
Finishing phase
No. of days 118 113 113 113
Beginning weight, lb 796a 917b 924b 938b
Ending weight, lb 1283a 1366b 1374b 1364b
Gain, lb 487a 449b 449b 425c
Daily gain, lb 4.17a 3.99a 3.99a 3.77b
Daily dry matter intake, lb 27.1 27.9 27.7 27.7
Feed:Gain 6.61a 7.14b 7.04b 7.51c
Hot carcass weight, lb 756a 809b 814b 812b
Dressing percentage, % 59a 59a 59a 60b
Backfat, in. 0.41 0.45 0.45 0.44
Ribeye area, square in. 11.9a 12.1ab 12.3b 12.1ab
Yield grade 2.8 3.1 3.0 3.0
Marbling score1 SM76 SM63 SM72 SM74
Percent choice, % 79 82 80 88
Overall performance (Grazing plus finishing)
No. of days 341 336 336 336
Gain, lb 727a 809b 817b 807b
Daily gain, lb 2.14a 2.43b 2.45b 2.43b
1 SM = smallabc Within rows, means without a common superscript differ (P<0.05).
This publication from the Kansas State University Agricultural Experiment Station and Cooperative Extension Service has been archived. Current information is available from http://www.ksre.ksu.edu.
18
AGRICULTURAL RESEARCH 2009
Evaluation of Tall Fescue Cultivars
J. L. Moyer
SummarySpring 2008 yields of the 2003 trial were higher for FA 120 and ‘Ky 31’ LE than for ‘AU Triumph’ and ‘Select’. Fall production of AU Triumph and Ky 31 LE was higher than 18 other entries. Total 2008 production was higher for FA 111, FA 2860, and Ky 31 LE than for ‘Jesup MaxQ’. Total 2007-2008 production of Ky 31 LE was greater than 19 other cultivars, whereas 5-year production of FTF-24 was greater than 9 other cultivars.
IntroductionTall fescue (Festuca arundinacea Schreb.) is the most widely grown forage grass in southeast Kansas. Its tolerance to extremes in climate and soils of the region is partly attributable to its association with a fungal endophyte, Neotyphodium coenophialum. However, most ubiquitous endophytes also are responsible for production of substances toxic to some herbivores, including cattle, sheep, and horses.
Endophytes that purportedly lack toxins but augment plant vigor have been identified and inserted into tall fescue cultivars adapted to the United States. These cultivars and others that are fungus-free or contain a ubiquitous endophyte are included in this test.
Experimental ProceduresAll trials were seeded at the Mound Valley Unit of the Southeast Agricultural Research Center in 10-in. rows on Parsons silt loam soil. Plots (30 × 5 ft) were arranged in four randomized complete blocks. Tests were seeded with 19 lb/a of pure, live seed on Sept. 17, 2003.
Fertilizer to supply 120 lb/a nitrogen (N) was applied to all plots on Mar. 12, 2008, and 60 lb/a N was applied on September 18. Harvest was performed on a 3-ft-wide and 15- to 20-ft long strip from each plot cut to a 3-in. height with a flail-type harvester after all plots were headed (May 21, 2008). Regrowth that occurred primarily in fall was har-vested on Jan. 7, 2009. A forage subsample was collected and dried at 140°F for mois-ture determination, and forage was removed from the rest of the plot at the same height.
Results and DiscussionSpring 2008 forage yield of entries in the 2003 trial was greater (P<0.05) for FA 120 than for AU Triumph, Select, and FA 2850 (Table 1). KY 31 LE had greater spring yield than AU Triumph. For fall production, AU Triumph and Ky 31 LE yields were higher than 18 other entries, FTF-24 yield was higher than 12 other entries, and ‘ArkPlus’ and Jesup MaxQ yields were lower than 12 other entries. Total 2008 production was higher for FA 111, FA 2860, and Ky 31 LE than for Jesup MaxQ.
The droughty year of 2006 resulted in extremely low fescue yields (Table 2) and may have affected fescue stands. Because 2007 and 2008 had abundant moisture, yields from those years should reflect productivity of the remaining plants. Total 2007-2008 pro-
This publication from the Kansas State University Agricultural Experiment Station and Cooperative Extension Service has been archived. Current information is available from http://www.ksre.ksu.edu.
19
AGRICULTURAL RESEARCH 2009
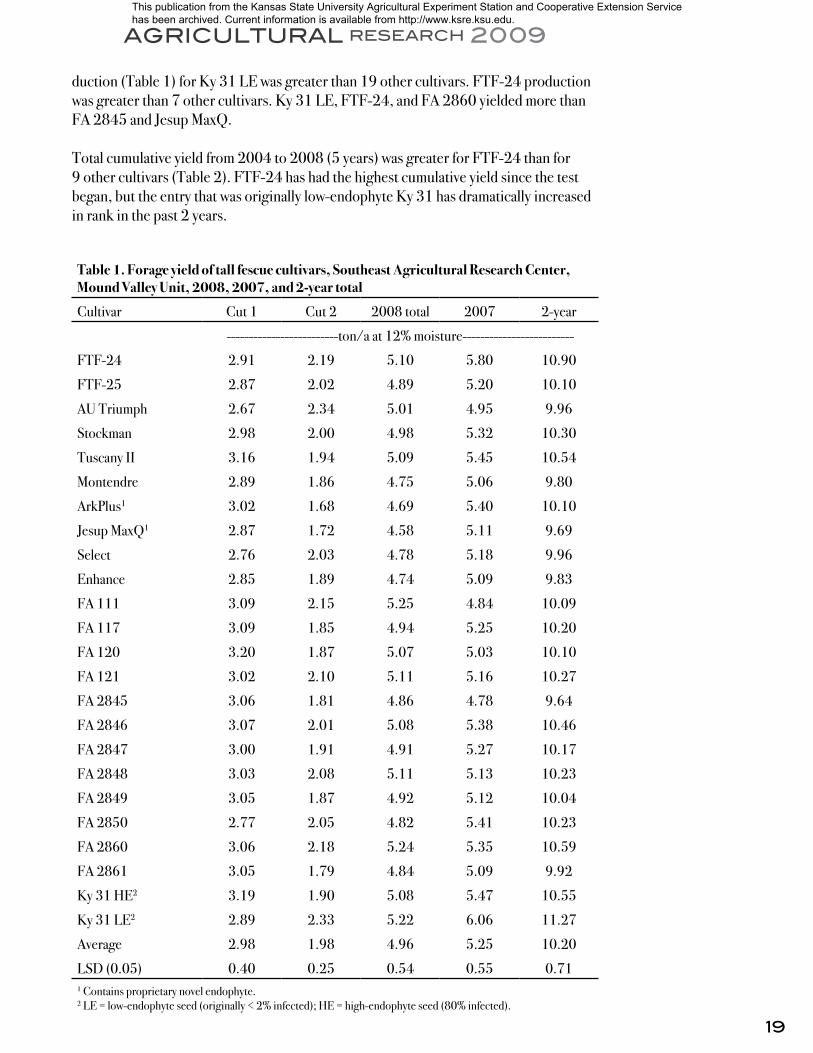
duction (Table 1) for Ky 31 LE was greater than 19 other cultivars. FTF-24 production was greater than 7 other cultivars. Ky 31 LE, FTF-24, and FA 2860 yielded more than FA 2845 and Jesup MaxQ.
Total cumulative yield from 2004 to 2008 (5 years) was greater for FTF-24 than for 9 other cultivars (Table 2). FTF-24 has had the highest cumulative yield since the test began, but the entry that was originally low-endophyte Ky 31 has dramatically increased in rank in the past 2 years.
Table 1. Forage yield of tall fescue cultivars, Southeast Agricultural Research Center, Mound Valley Unit, 2008, 2007, and 2-year total
Cultivar Cut 1 Cut 2 2008 total 2007 2-year
-------------------------ton/a at 12% moisture-------------------------
FTF-24 2.91 2.19 5.10 5.80 10.90
FTF-25 2.87 2.02 4.89 5.20 10.10
AU Triumph 2.67 2.34 5.01 4.95 9.96
Stockman 2.98 2.00 4.98 5.32 10.30
Tuscany II 3.16 1.94 5.09 5.45 10.54
Montendre 2.89 1.86 4.75 5.06 9.80
ArkPlus1 3.02 1.68 4.69 5.40 10.10
Jesup MaxQ1 2.87 1.72 4.58 5.11 9.69
Select 2.76 2.03 4.78 5.18 9.96
Enhance 2.85 1.89 4.74 5.09 9.83
FA 111 3.09 2.15 5.25 4.84 10.09
FA 117 3.09 1.85 4.94 5.25 10.20
FA 120 3.20 1.87 5.07 5.03 10.10
FA 121 3.02 2.10 5.11 5.16 10.27
FA 2845 3.06 1.81 4.86 4.78 9.64
FA 2846 3.07 2.01 5.08 5.38 10.46
FA 2847 3.00 1.91 4.91 5.27 10.17
FA 2848 3.03 2.08 5.11 5.13 10.23
FA 2849 3.05 1.87 4.92 5.12 10.04
FA 2850 2.77 2.05 4.82 5.41 10.23
FA 2860 3.06 2.18 5.24 5.35 10.59
FA 2861 3.05 1.79 4.84 5.09 9.92
Ky 31 HE2 3.19 1.90 5.08 5.47 10.55
Ky 31 LE2 2.89 2.33 5.22 6.06 11.27
Average 2.98 1.98 4.96 5.25 10.20
LSD (0.05) 0.40 0.25 0.54 0.55 0.711 Contains proprietary novel endophyte.2 LE = low-endophyte seed (originally < 2% infected); HE = high-endophyte seed (80% infected).
This publication from the Kansas State University Agricultural Experiment Station and Cooperative Extension Service has been archived. Current information is available from http://www.ksre.ksu.edu.

20
AGRICULTURAL RESEARCH 2009
Table 2. Forage yield of tall fescue cultivars in previous years and 5-year total, Southeast Agricultural Research Center, Mound Valley Unit
Cultivar 2004 2005 2006 5-year total
------------------ton/a at 12% moisture------------------
FTF-24 5.11 4.63 1.36 22.00
FTF-25 4.80 4.61 1.25 20.76
AU Triumph 4.15 4.20 1.30 19.60
Stockman 4.85 4.28 1.24 20.67
Tuscany II 4.57 4.41 1.22 20.74
Montendre 4.13 4.20 1.15 19.28
ArkPlus1 4.83 4.13 1.30 20.35
Jesup MaxQ1 4.80 4.18 1.14 19.81
Select 4.34 3.72 1.18 19.21
Enhance 4.19 4.10 1.02 19.14
FA 111 4.37 3.84 1.16 19.45
FA 117 4.94 4.39 1.29 20.82
FA 120 4.48 4.29 1.24 20.12
FA 121 4.85 4.43 1.22 20.77
FA 2845 4.30 3.92 1.16 19.02
FA 2846 4.44 3.94 1.08 19.92
FA 2847 4.75 4.36 1.18 20.46
FA 2848 4.46 4.32 1.17 20.17
FA 2849 4.46 3.94 1.11 19.55
FA 2850 4.65 4.28 1.18 20.33
FA 2860 4.61 4.05 1.05 20.30
FA 2861 4.91 4.08 1.16 20.07
Ky 31 HE2 4.62 4.10 1.38 20.66
Ky 31 LE2 4.40 4.04 1.09 20.79
Average 4.58 4.18 1.19 20.22
LSD (0.05) 0.82 0.47 0.14 1.431 Contains proprietary novel endophyte.2 LE = low-endophyte seed (originally < 2% infected); HE = high-endophyte seed (80% infected).
This publication from the Kansas State University Agricultural Experiment Station and Cooperative Extension Service has been archived. Current information is available from http://www.ksre.ksu.edu.
21
AGRICULTURAL RESEARCH 2009
Forage Production of Seeded Bermudagrass Cultivars
J. L. Moyer
SummaryYields from three cuttings in 2008 were higher for ‘SG 19’ than for eight other entries. Six seeded types yielded more than ‘Midland 99’, a sprigged type included as a check cultivar.
IntroductionBermudagrass can be a high-producing, warm-season perennial forage for eastern Kan-sas when not affected by winterkill. Producers in southeast Kansas have profited from the use of winter-hardy varieties that produced more than common bermudas. Seeded types may offer cost savings or other advantages in marginal areas. Further developments in bermudagrass breeding should be monitored to speed adoption of improved, cold-hardy types.
Experimental ProceduresThirteen bermudagrass entries were seeded at 8 lb/a of pure, live seed for hulled seed or 5 lb/a for hulless seed at the Mound Valley Unit of the Southeast Agricultural Research Center on June 21, 2005, and Midland 99 plugs were planted 2 weeks later. In 2008, plots were fertilized on April 15 with 165-50-60 lb/a N-P2O5-K2O and on July 15 with 60 lb/a N as ammonium nitrate.
Plots were cut July 14, August 18, and October 13, and subsamples were collected from the 20 × 3 ft harvested strips to determine moisture content of forage.
Results and DiscussionRainfall each month of the 2008 growing season was greater than the 30-year average. More than 45 in. were received in April through September, which is greater than the average annual precipitation and 17 in. above average for the period. The first cutting was delayed by wet weather, such that forage dry matter averaged 37%, compared with 28% in the second cutting. The late first cutting accounted for 47% of the seasonal total. It was also unusual that late-season yield (after August 18) amounted to 27% of the total.
First-cut yield was higher for SG 19 and ‘Sungrazer’ than for 10 of the other 12 cultivars (Table 1). A group of eight cultivars produced more than 3.5 ton/a in the first cutting, which was significantly greater than yields of the other six cultivars.
Second-cut yield of Midland 99 was greater than that of the other cultivars (Table 1). Yield of SG 19 for Cut 2 was greater than that of three other cultivars. Yields from the third cutting were relatively uniform, with a range of less than 0.6 ton/a. The high-yield-ing cultivar ‘Jackpot’ produced more than only three other cultivars.
This publication from the Kansas State University Agricultural Experiment Station and Cooperative Extension Service has been archived. Current information is available from http://www.ksre.ksu.edu.

22
AGRICULTURAL RESEARCH 2009
Total-season yield for 2008 was higher for SG 19 than for eight other entries. SG 19 and Sungrazer yielded more than six cultivars, including Midland 99, a sprigged type includ-ed as a check cultivar. In fact, six seeded types yielded more than Midland 99 in 2008.
Yield totals have been obtained for two post-seeding years, 2006 and 2008. The 2-year total yield of SG 19 was greater than that of 9 of the other 13 cultivars. ‘Chero-kee’, ‘CIS-CD-4’, and ‘Riata’ produced less than eight of the other cultivars.
Table 1. Forage yield in 2008 and 2-year total yields (2006 and 2008) for bermudagrass seeded in 2005, Southeast Agricultural Research Center, Mound Valley Unit
2008 forage yield 2-year totalSource Entry 7/14 8/18 10/13 Total
---------- ton/a at 12% moisture----------
K-F Seeds KF 888 3.70 1.65 1.93 7.28 10.81
K-F Seeds KF 194 3.92 1.48 1.71 7.11 11.09
K-F Seeds KF 111 3.78 1.68 1.75 7.21 12.08
K-F Seeds KF 222 3.51 1.57 1.88 6.96 10.57
K-F Seeds SG 19 4.54 1.76 1.88 8.19 12.39
Genetic Seed & Chemical Sungrazer 4.48 1.67 1.65 7.80 12.03
Genetic Seed & Chemical Sungrazer I 3.90 1.58 1.82 7.30 11.16
Genetic Seed & Chemical Sungrazer Plus 3.60 1.70 1.88 7.18 10.74
Nixa Hardware & Seed Cherokee 2.08 1.41 1.46 4.94 8.01
Genetic Seed & Chemical Jackpot 1.81 1.75 1.98 5.54 9.74
Oklahoma State University Wrangler 1.94 1.62 1.41 4.96 9.78
Oklahoma State University Midland 991 1.95 2.37 1.81 6.13 10.98
Johnston Seed Riata 1.69 1.39 1.61 4.68 9.27
DLF International Seeds CIS-CD 4 1.67 1.45 1.86 4.98 8.94
Average 3.04 1.65 1.76 6.45 10.54
LSD (0.05 ) 0.64 0.29 0.36 1.04 1.371 Sprigged cultivar.
This publication from the Kansas State University Agricultural Experiment Station and Cooperative Extension Service has been archived. Current information is available from http://www.ksre.ksu.edu.
23
AGRICULTURAL RESEARCH 2009
Winter Annual Crops for Forage
J. L. Moyer, V. Martin1, and B. Kindiger2
SummaryEarly-cut total cereal forage yields, which simulate grazing, were usually highest for one or more of the rye cultivars. A single late cutting in 2007 produced best yields from two triticale cultivars, whereas in two harvests of reproductive growth in 2008, ‘Maton’ and ‘Elbon’ ryes and ‘Bess’ wheat gave higher yields than four other entries.
Of the dicotyledonous species tested, hairy vetch (Figure 1) production was most consistent. ‘Wichita’ canola produced relatively higher in early spring, whereas field pea production was later.
IntroductionPastures in eastern Kansas consist mainly of cool-season grasses that produce mostly in spring and early summer. Stockpiled forages can be used in fall and early winter, but grazing is usually lacking in late winter and early spring. A complementary system that uses annuals for late-winter grazing would provide high-quality forage when quality of stockpiled forages is low. Designing such a system requires basic information about growth and development of winter annual species. The objective of this research was to evaluate the adaptability, yield, and quality of winter annual forages at this site for use in complementary forage systems.
Experimental ProceduresWinter annual cereals and other crops were planted in blocks with three replications. Cereals were planted at the rate of 100 lb/a of pure, live seed, brassicas at 5 lb/a, and legumes and ryegrass at 30 lb/a. Plots (10 × 30 ft) were planted on Sept. 19, 2006, and Sept. 18, 2007, in 10-in. rows. Fertilizer was applied preplant at 20-50-60 lb/a N-P2O5-K2O. Additional nitrogen (60 lb/a) was applied Mar. 8, 2007, and Mar. 12, 2008.
Plots were harvested from either side of each plot on an early-cut or late-cut schedule with a 3 × 20-ft flail cutter. Early-cut strips were cut to simulate grazing when growth of most plots produced a harvestable amount (4 to 6 in.) and soil conditions permitted. Late-cut strips were cut near physiological maturity in 2007 and after cereal stem initia-tion and again after physiological maturity (hard dough) in 2008. Subsamples of forage were collected at each harvest for moisture and crude protein determination.
Results and DiscussionWinter CerealsIn the early-cut harvest of 2007, rye cultivars produced more (P<0.05) than other winter cereals in the first harvest (Table 1), whereas barley produced less than five other culti-vars. In the other early-cut harvest, ‘Post 90’ barley produced more forage than all other
1 KSU Dept. of Agronomy, South Central Experiment Field, Hutchinson, KS2 USDA-ARS Grazinglands Research Laboratory, El Reno, OK
This
pub
licat
ion
from
the
Kan
sas
Sta
te U
nive
rsity
Agr
icul
tura
l Exp
erim
ent S
tatio
n an
d C
oope
rativ
e E
xten
sion
Ser
vice
ha
s be
en a
rchi
ved.
Cur
rent
info
rmat
ion
is a
vaila
ble
from
http
://w
ww
.ksr
e.ks
u.ed
u.

24
AGRICULTURAL RESEARCH 2009
entries. Total production from early-cut harvests was higher from barley and the two ryes than from all of the wheat cultivars except ‘Danby’ (Table 1).
Late-cut 2007 forage yield was higher for the triticale cultivars than for the wheat cultivars and ‘Oklon’ rye. In addition, Post 90 barley and Elbon rye yielded more than ‘Trego’ and ‘Overley’ wheats (Table 1).
In the first 2008 early-cut harvest, Overley wheat produced more than the other winter cereals (Table 2), whereas ‘Karl 92’ produced less. Post 90 barley produced more forage than the triticales and two of the rye cultivars. In the second early-cut harvest, all rye cul-tivars produced more forage than six other entries, whereas Post 90 produced less than all but two other cultivars (Table 2).
In the third early-cut harvest, ‘Boreal’ triticale produced more than the other winter cere-als, and all triticales produced more than three of the four rye cultivars (Table 2). How-ever, total production from early-cut harvests was higher from Maton rye than from all cultivars except Elbon rye and Overley wheat. Karl 92 produced less forage than all other cultivars, and the triticales and barley produced less than Maton and Elbon (Table 2).
Yield from the first harvest of late-cut 2008 forage was higher for all rye cultivars than for the other eight cultivars (Table 2). Conversely, Karl 92 wheat and Boreal triticale yielded less than the other entries. In the other late-cut harvest, Danby and Bess wheats yielded more than the barley, rye, and hard wheat cultivars. The three triticale cultivars also yielded more than Post 90 barley, Karl 92 wheat, and ‘Chason’ and Maton ryes. Total production from late-cut harvests was higher from Maton, Elbon, and Bess than from Karl 92, Post 90, Boreal, and Overley.
Total forage yield from the early-cut harvests averaged 62 and 70% of yield from late-cut harvests in 2007 and 2008, respectively. In the early-cut system, about half of the production occurred by the first week of April each year. In 2007, rye production was most pronounced before the first cutting, whereas Post 90 barley produced relatively more in the later period, a pattern consistent with previous studies. In 2008, however, Overley and Post production appeared earlier than rye production, which was most pro-nounced between April 7 and May 5. Triticale production seemed more prominent later in the harvest period. Generally, rye forage production seemed most consistent for early pasture production.
The late-cut harvests generally demonstrated the later growth of triticales compared with the ryes. In 2007, triticales generally had better production than wheats, whereas in 2008, ryes yielded more than wheats.
Other Winter Annuals Of the six dicotyledonous forages tested in 2006-2007, Wichita canola produced more spring forage in the first early-cut harvest and in the late harvest than the other species (Table 1). Hairy vetch produced as much forage as Wichita in the second early-cut har-vest and for the total of the early-cut harvests. Field pea forage yield was numerically but not significantly (P<0.05) less than that of canola or hairy vetch in the second early-cut harvest or of hairy vetch in the other harvests. In 2007-2008 (Table 3), only the late-cut
This publication from the Kansas State University Agricultural Experiment Station and Cooperative Extension Service has been archived. Current information is available from http://www.ksre.ksu.edu.
25
AGRICULTURAL RESEARCH 2009
harvest was measured. First-cut yield was higher for ‘Passerel Plus’ ryegrass than for field pea and hairy vetch. Canola and hairy vetch also yielded more than field pea. Second-cut yield was greater for ryegrass than for field pea and hairy vetch but was nonexistent for canola. Total late-cut yield was greatest for ryegrass and similar for the other three forages. Besides ryegrass, Wichita canola (a brassica) and hairy vetch (a legume) appear to be promising spring forages. Annual ryegrass forage production seemed later and somewhat less than that of cereals.
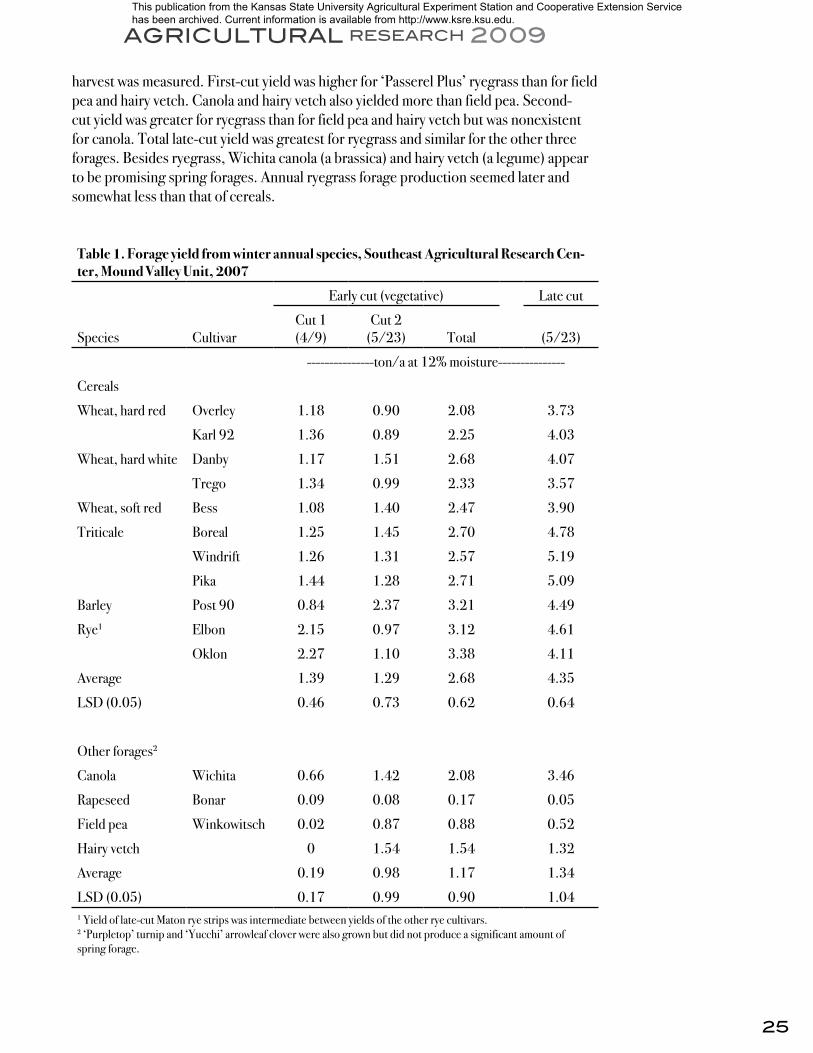
Table 1. Forage yield from winter annual species, Southeast Agricultural Research Cen-ter, Mound Valley Unit, 2007
Early cut (vegetative) Late cut
Species CultivarCut 1 (4/9)
Cut 2 (5/23) Total (5/23)
---------------ton/a at 12% moisture---------------
Cereals
Wheat, hard red Overley 1.18 0.90 2.08 3.73
Karl 92 1.36 0.89 2.25 4.03
Wheat, hard white Danby 1.17 1.51 2.68 4.07
Trego 1.34 0.99 2.33 3.57
Wheat, soft red Bess 1.08 1.40 2.47 3.90
Triticale Boreal 1.25 1.45 2.70 4.78
Windrift 1.26 1.31 2.57 5.19
Pika 1.44 1.28 2.71 5.09
Barley Post 90 0.84 2.37 3.21 4.49
Rye1 Elbon 2.15 0.97 3.12 4.61
Oklon 2.27 1.10 3.38 4.11
Average 1.39 1.29 2.68 4.35
LSD (0.05) 0.46 0.73 0.62 0.64
Other forages2
Canola Wichita 0.66 1.42 2.08 3.46
Rapeseed Bonar 0.09 0.08 0.17 0.05
Field pea Winkowitsch 0.02 0.87 0.88 0.52
Hairy vetch 0 1.54 1.54 1.32
Average 0.19 0.98 1.17 1.34
LSD (0.05) 0.17 0.99 0.90 1.041 Yield of late-cut Maton rye strips was intermediate between yields of the other rye cultivars.2 ‘Purpletop’ turnip and ‘Yucchi’ arrowleaf clover were also grown but did not produce a significant amount of spring forage.
This publication from the Kansas State University Agricultural Experiment Station and Cooperative Extension Service has been archived. Current information is available from http://www.ksre.ksu.edu.

26
AG
RIC
UL
TU
RA
L R
ES
EA
RC
H 2
00
9
Table 2. Forage production from winter cereals, Southeast Agricultural Research Center, Mound Valley Unit, 2008
Early cut (vegetative) Late cut
Species CultivarCut 1
(1/23)Cut 2 (4/7)
Cut 3 (5/5) Total
Crude protein (5/5)
Cut 1 (4/7)
Cut 2 (6/12) Total
-----------------ton/a at 12% moisture----------------- % -------- ton/a at 12% moisture--------
Wheat, hard red Overley 2.34 1.32 0.58 4.25 17.4 3.61 1.79 5.40
Karl 92 0.66 1.77 0.53 2.96 18.6 2.60 1.45 4.05
Wheat, hard white Danby 1.96 1.38 0.65 3.98 13.0 3.38 2.60 5.98
Wheat, soft red Bess 1.93 1.40 0.54 3.87 17.3 3.61 2.51 6.12
Triticale Boreal 1.24 1.30 0.95 3.49 13.6 2.72 2.16 4.89
Windrift 1.21 1.69 0.68 3.58 13.3 3.40 2.41 5.81
Pika 1.78 1.44 0.63 3.85 14.1 3.36 2.30 5.66
Barley Post 90 2.08 1.11 0.65 3.84 13.9 3.43 0.82 4.25
Rye Chason 1.79 1.89 0.33 4.02 18.0 4.48 1.12 5.60
Elbon 1.82 1.95 0.50 4.27 16.0 4.48 1.69 6.17
Oklon 1.95 1.34 0.31 3.49 11.6 4.39 1.53 5.92
Maton 2.05 2.03 0.34 3.80 15.5 4.81 1.49 6.30
Average 1.73 1.60 0.56 3.87 15.2 3.69 1.82 5.51
LSD (0.05) 0.25 0.21 0.19 0.41 3.4 0.39 0.64 0.69
This publication from the Kansas State University Agricultural Experiment Station and Cooperative Extension Service has been archived. Current information is available from http://www.ksre.ksu.edu.
27
AGRICULTURAL RESEARCH 2009
Table 3. Forage yield from winter annual species, Southeast Agricultural Research Cen-ter, Mound Valley Unit, 2008
Species1 Cultivar Cut 1 (4/7) Cut 2 (6/12) Total
-------------ton/a at 12% moisture-------------
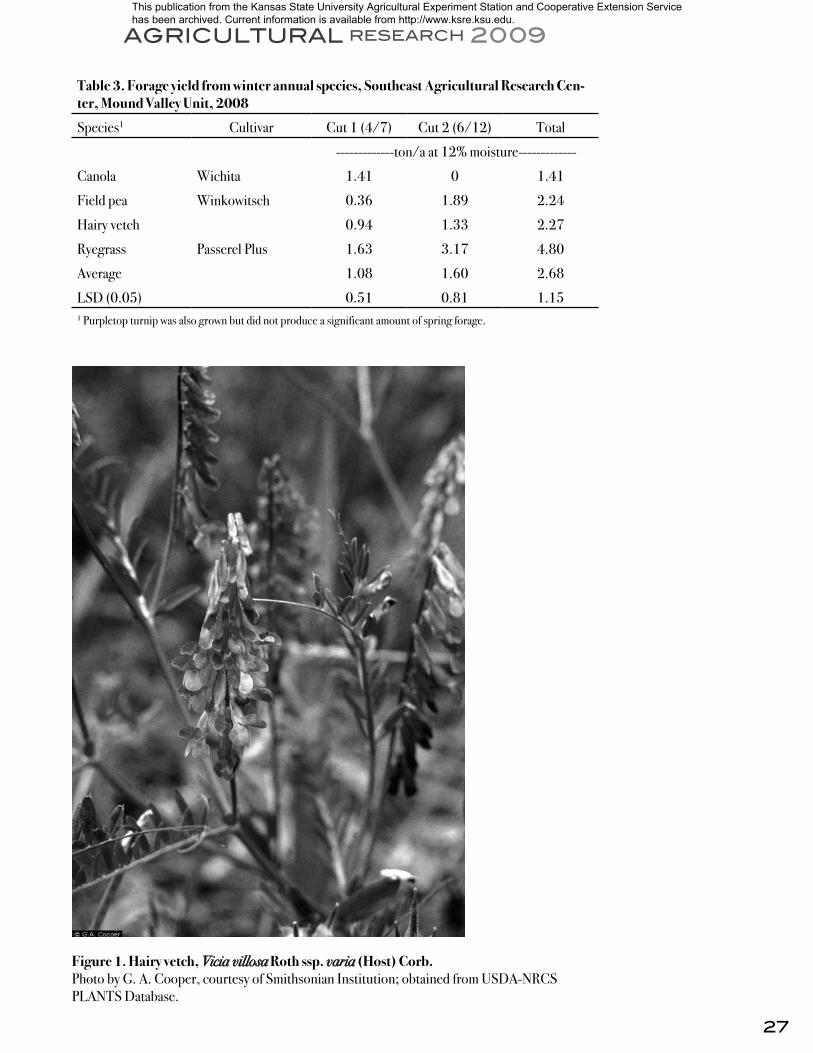
Canola Wichita 1.41 0 1.41
Field pea Winkowitsch 0.36 1.89 2.24
Hairy vetch 0.94 1.33 2.27
Ryegrass Passerel Plus 1.63 3.17 4.80
Average 1.08 1.60 2.68
LSD (0.05) 0.51 0.81 1.151 Purpletop turnip was also grown but did not produce a significant amount of spring forage.
Figure 1. Hairy vetch, Vicia villosa Roth ssp. varia (Host) Corb.Photo by G. A. Cooper, courtesy of Smithsonian Institution; obtained from USDA-NRCS PLANTS Database.
This publication from the Kansas State University Agricultural Experiment Station and Cooperative Extension Service has been archived. Current information is available from http://www.ksre.ksu.edu.
28
AGRICULTURAL RESEARCH 2009
Nitrogen Fertilization of Bermudagrass
J. L. Moyer and K. W. Kelley
SummaryBermudagrass forage yield response to nitrogen (N) fertilization was measured for rates up to 300 lb/a N in 2006 and 2008. Total yield of bermudagrass cultivar ‘Midland 99’ from two cuttings was higher in 2006 than in 2008, reaching an optimum at about 250 lb/a N. In 2008, yield was still increasing linearly at 300 lb/a. Nutrisphere applied at the higher rates in 2008 had no effect on yield.
IntroductionBermudagrass can be a high-producing, warm-season perennial forage for hay or pasture in eastern Kansas when sufficient N is applied. Newer, high-yielding cultivars may have different N responses than older varieties, so optimum rates of N need to be determined for newer cultivars.
Split applications of N are generally recommended for bermudagrass. However, use of N stabilizers may make single applications more efficient. Nutrisphere, a urease inhibitor, may preserve N for uptake throughout the summer.
Experimental ProceduresEstablished Midland 99 bermudagrass plots received one of six rates (0, 60, 120, 180, 240, and 300 lb/a) of N as urea on Apr. 12, 2006, and May 23, 2008. In 2008, some urea was treated with Nutrisphere and applied to additional plots at 240 and 300 lb/a N. Plots were 20 × 6 ft in 2006, and 40 × 6 ft in 2008, arranged in randomized complete blocks with four replications each year.
Plots were harvested on June 21 and Aug. 16, 2006, and June 25 and Aug. 18, 2008 from 3-ft strips of varying length; subsamples were collected to determine moisture content of forage.
Results and DiscussionIn 2006, first-cut yield was higher for each 60-lb increment of N applied up to the 180 lb/a rate (Table 1). Second-cut yield was higher for the 300 lb/a rate than for the 120 through 240 lb/a rates, which were, in turn, higher than the check and 60 lb/a rate. Trends of total yield reflected those of the second cutting, in that yield responses contin-ued to occur up to the highest N rates. In 2008, first-cut yield was higher for each of the first two 60-lb increments of N applied (Table 1). However, yield from the 180 lb/a rate was not significantly (P=0.05) greater than yield from the 120 lb/a rate, and none of the higher rates increased yield beyond that achieved with the 180 lb/a rate. Second-cut yield was not increased compared with the check by the first two 60-lb increments of N applied but was increased by the 180 and 240 lb/a rates. The 300 lb/a rate resulted in a further yield increase compared with the lower rates. Total 2008 yield was higher for each 60-lb increment of N applied up to
This publication from the Kansas State University Agricultural Experiment Station and Cooperative Extension Service has been archived. Current information is available from http://www.ksre.ksu.edu.
29
AGRICULTURAL RESEARCH 2009
the 180 lb/a rate. Yield from the 240 lb/a rate with Nutrisphere was significantly higher than yield from the 180 lb/a rate of urea alone. This was the only case in which Nutri-sphere resulted in a significant yield difference. The 300 lb/a rate resulted in a further yield increase compared with the lower rates, regardless of whether Nutrisphere was added (Table 1).
Rainfall in the 3-month growing season of 2006 was about 80% of normal, whereas rainfall in the 2008 growing season was 155% of the 30-year average. In April through September of 2008, more than 42 in. of rainfall were received; this is near the average annual precipitation and 15 in. above average for the period. This hindered efficient use of applied N and contributed to the lower yield in 2008 compared with the drier year of 2006 (Table 1).
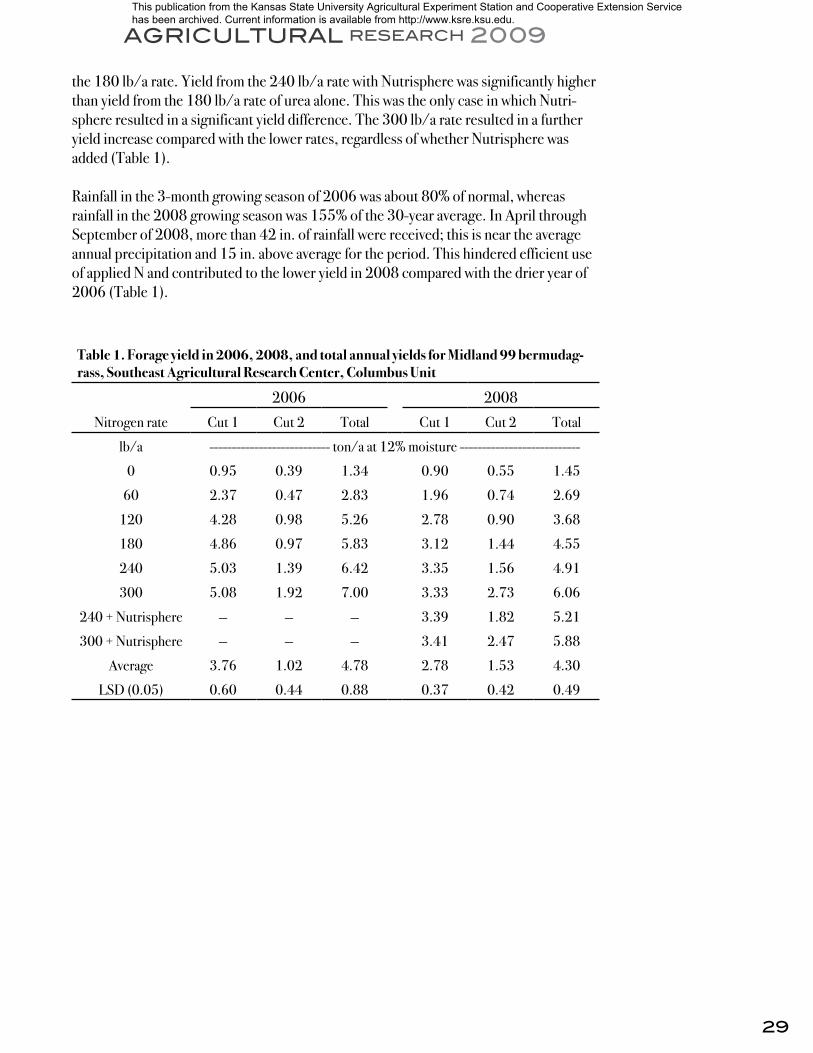
Table 1. Forage yield in 2006, 2008, and total annual yields for Midland 99 bermudag-rass, Southeast Agricultural Research Center, Columbus Unit
2006 2008
Nitrogen rate Cut 1 Cut 2 Total Cut 1 Cut 2 Total
lb/a --------------------------- ton/a at 12% moisture ---------------------------
0 0.95 0.39 1.34 0.90 0.55 1.45
60 2.37 0.47 2.83 1.96 0.74 2.69
120 4.28 0.98 5.26 2.78 0.90 3.68
180 4.86 0.97 5.83 3.12 1.44 4.55
240 5.03 1.39 6.42 3.35 1.56 4.91
300 5.08 1.92 7.00 3.33 2.73 6.06
240 + Nutrisphere — — — 3.39 1.82 5.21
300 + Nutrisphere — — — 3.41 2.47 5.88
Average 3.76 1.02 4.78 2.78 1.53 4.30
LSD (0.05) 0.60 0.44 0.88 0.37 0.42 0.49
This publication from the Kansas State University Agricultural Experiment Station and Cooperative Extension Service has been archived. Current information is available from http://www.ksre.ksu.edu.
30
AGRICULTURAL RESEARCH 2009
Biomass Production of Switchgrass Lines
J. L. Moyer and C. Christensen1
SummaryBiomass production for the seeding year of 2007 was higher for experimental lines 56 and 60 than for the other eight entries in this study. In both years and for the 2-year total, experimental line 58 and ‘Cave-in-Rock’ produced less than the other entries.
IntroductionSwitchgrass is a perennial grass that is native to the prairies of North America. It has been identified by the U.S. Department of Energy as a preferred dedicated energy crop. Because switchgrass has been subjected to less intense breeding efforts than most com-modity crops, rapid and significant improvements can be made through advanced plant breeding and biotechnology. This study was established to compare standard cultivars with advanced lines for adaptation in eastern Kansas and to test the biomass for suitabil-ity as a bioenergy crop.
Experimental ProceduresTen switchgrass entries obtained from Ceres, Inc. were seeded at 5 lb/a of pure, live seed in 20-in. rows at the Mound Valley Unit of the Southeast Agricultural Research Center on May 21, 2007. Seed was planted no-till after a wheat-soybean double crop, then sprayed with 1 qt/a glyphosate (0.75 lb a.e./gal). Plots (20 × 10 ft) were arranged in a randomized complete block with six replications. On June 21, stands were rated as good to excellent. Plots were sprayed on June 25 with 0.1 oz/a (60 DF) metsulfuron + 1 lb a.i./a 2,4-D amine + 1 lb a.i./a atrazine.
Two rows (40 in.) for a length of 14 ft/plot were harvested at a 2.5-in. height on Novem-ber 27. Biomass was subsampled for moisture content and chemical constituents, and the residual was burned that winter. In 2008, plots were sprayed for weed control with 1 qt/a S-metolachlor (1.9 lb a.e./gal). They were fertilized on April 15 with 50-40-60 lb/a N-P2O5-K2O and again on May 15 with 50 lb/a N as ammonium nitrate. Plots were harvested on November 25 as described previously from two 13-ft-long rows, and the residual was cut and removed.
Results and DiscussionConditions for establishment were excellent in 2007, with wetter-than-normal precipita-tion and cooler temperatures. The 14.73 in. of precipitation received in June was more than 9 in. above the 30-year average, and July precipitation was 1.8 in. above average. In the 2008 growing season, rainfall each month was greater than the 30-year average. In April through September, more than 45 in. were received, which is greater than the average annual precipitation and 17 in. above average for the period.
1 Product Manager, Ceres, Inc., Thousand Oaks, CA
This publication from the Kansas State University Agricultural Experiment Station and Cooperative Extension Service has been archived. Current information is available from http://www.ksre.ksu.edu.

31
AGRICULTURAL RESEARCH 2009
First-year (2007) yield was higher (P<0.05) for experimental lines 56 and 60 than for the other eight entries (Table 1). Experimental line 58, Cave-in-Rock, and ‘Kanlow’ produced less than the four highest-yielding entries. In 2008, experimental line 59 produced more than five other entries (Table 1). Cave-in-Rock and experimental line 58 produced less than the other eight entries in this study. Kanlow and ‘Alamo’ produced amounts similar to six other entries in the “high-yield” group. Total 2-year production was higher for members of that same “high-yield” group than for experimental line 58 and Cave-in-Rock.
Table 1. Biomass production in 2007 and 2008 for switchgrass seeded in 2007, South-east Agricultural Research Center, Mound Valley Unit
Entry Status 2007 2008 Total
--------------------lb/a dry matter--------------------
54 Experimental 6440 14150 20590
55 Experimental 6930 13760 20685
56 Experimental 8380 13280 21660
57 Experimental 6400 13820 20220
58 Experimental 4120 9630 13760
59 Experimental 6310 15760 22070
60 Experimental 8220 14180 22395
Cave-in-Rock Variety 4740 9270 14020
Alamo Variety 6950 14455 21400
Kanlow Variety 5660 14540 20196
Average 6415 13284 19700
LSD (0.05) 1240 1690 2350
This publication from the Kansas State University Agricultural Experiment Station and Cooperative Extension Service has been archived. Current information is available from http://www.ksre.ksu.edu.

32
AGRICULTURAL RESEARCH 2009
Tillage and Nitrogen Placement Effects on Yields in a Short-Season Corn/Wheat/Double-Crop Soybean Rotation
D. W. Sweeney and K. W. Kelley
SummaryOverall in 2008, adding nitrogen (N) increased wheat yields, but the advantage of knifing compared with broadcast and dribble placement was apparent only in no-till. Double-crop soybean yields were slightly decreased with no-till but were unaffected by the residual from N placement treatments.
IntroductionMany crop rotation systems are used in southeast Kansas. This experiment is designed to determine the long-term effect of selected tillage and N fertilizer placement options on yields of short-season corn, wheat, and double-crop soybean in rotation.
Experimental ProceduresA split-plot design with four replications was initiated in 1983 with tillage system as the whole plot and N treatment as the subplot. In 2005, the rotation was changed to begin a short-season corn/wheat/double-crop soybean sequence. Use of three tillage systems (conventional, reduced, and no-till) continues in the same areas as during the previous 22 years. The conventional system consists of chiseling, disking, and field cultivation. Chiseling occurs in the fall preceding corn or wheat crops. The reduced-tillage sys-tem consists of disking and field cultivation prior to planting. Glyphosate (Roundup) is applied to the no-till areas. The four N treatments for the crop are: no N (control), broadcast urea-ammonium nitrate (UAN; 28% N) solution, dribble UAN solution, and knife UAN solution at 4 in. deep. The N rate for the corn crop grown in odd-numbered years is 125 lb/a. The N rate of 120 lb/a for wheat is split as 60 lb/a applied preplant as broadcast, dribble, or knifed UAN. All plots except for the controls are top-dressed in the spring with broadcast UAN at 60 lb/a N.
Results and DiscussionIn 2008, adding fertilizer N, in general, doubled wheat yields compared with the no-N controls (Figure 1). Wheat yield was affected by a tillage and N placement interaction. With conventional and reduced tillage, there were no differences in yield due to place-ment method. In no-till, knife application of fertilizer N resulted in nearly 50% greater yield than broadcast or dribble applications but did not fully compensate for yield reduc-tion with no-till. Although double-crop soybean yields were not affected by the residual effect of N placement or an interaction of N placement with tillage (data not shown), no-till soybean yield was 3 to 4 bu/a less than yields with conventional or reduced tillage (Figure 2).
This publication from the Kansas State University Agricultural Experiment Station and Cooperative Extension Service has been archived. Current information is available from http://www.ksre.ksu.edu.
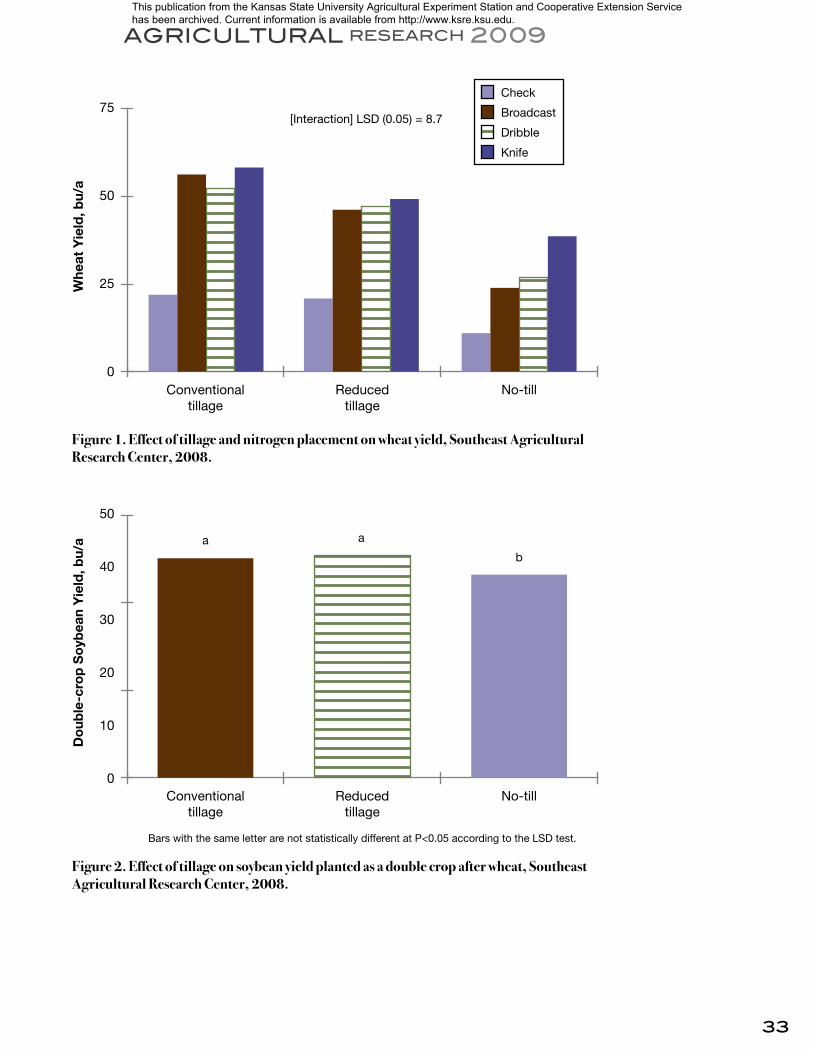
33
AGRICULTURAL RESEARCH 2009
Whe
at Y
ield
, bu/
a
75
50
25
0Conventional
tillageNo-tillReduced
tillage
Check
Broadcast
Dribble
Knife
[Interaction] LSD (0.05) = 8.7
Figure 1. Effect of tillage and nitrogen placement on wheat yield, Southeast Agricultural Research Center, 2008.
Do
uble
-cro
p S
oyb
ean
Yie
ld, b
u/a
50
40
30
20
10
0Conventional
tillageNo-tillReduced
tillage
aab
Bars with the same letter are not statistically different at P<0.05 according to the LSD test.
Figure 2. Effect of tillage on soybean yield planted as a double crop after wheat, Southeast Agricultural Research Center, 2008.
This publication from the Kansas State University Agricultural Experiment Station and Cooperative Extension Service has been archived. Current information is available from http://www.ksre.ksu.edu.

34
AGRICULTURAL RESEARCH 2009
Effect of Nitrogen and Phosphorus Starters on Short-Season Corn Grown in Conservation-Tillage Systems
D. W. Sweeney, D. B. Mengel1, and K. W. Kelley
SummaryOverall corn yields in 2008 averaged near 150 bu/a. Corn yields were not improved by use of starters. Even though early corn growth appeared to be improved with the highest phosphorus (P) rate in the starter, this effect did not persist by the reproductive stages of growth.
IntroductionCorn acreage has increased in southeast Kansas in recent years because of the introduc-tion of short-season cultivars that enable producers to plant in the upland, claypan soils typical of the area. Short-season hybrids reach reproductive stages earlier than full-sea-son hybrids and thus may partially avoid midsummer droughts, which are often severe on these claypan soils that have limited plant-available moisture storage.
Optimum corn production results from proper management of soil fertility, tillage, and other practices. However, ideal soil fertility and other management options have not been well defined for short-season corn production in southeast Kansas. Reducing till-age has the potential to reduce soil and nutrient losses to the environment, and maintain-ing proper plant nutrition is critical for crop production. Starter fertilizers have been used to improve early plant growth in no-till or reduced-tillage systems, and this often translates to additional yield. However, data are limited regarding the effect of starter fertilization on yield of short-season corn grown on the claypan soils found in areas of the eastern Great Plains. The objective of this study was to determine the effect of nitrogen (N) and P rates in starter fertilizers on short-season corn planted with reduced tillage or no-till.
Experimental ProceduresThe experiment was conducted in 2008 at the Kansas State University Southeast Agri-cultural Research Center at Parsons, KS. The soil was a Parsons silt loam with a claypan subsoil. Selected background soil chemical analyses in the 0- to 6-in. depth were pH 6.5 (1:1 soil:water), 5 ppm P (Bray-1), 65 ppm K (1 M NH4C2H3O2 extract), 5.3 ppm NH4-N, 6.4 ppm NO3-N, and 2.8% organic matter. The experimental design was a split-plot arrangement of a randomized complete block with three replications. The whole plots were tillage system (reduced tillage and no-till), and subplots were starter N-P com-binations. Nine of the subplots were starter fertilizer combinations in which N rates were 20, 40, and 60 lb/a and P rates were 0, 25, and 50 lb/acre P2O5. In addition, there were two reference subplot treatments: a no-starter treatment (all N and P applied preplant) and a control with no N or P. All plots except the no N-P control were balanced to receive a total of 120 lb/a N and 50 lb/a P2O5. The N and P fertilizer sources were 28-0-0 and
1 KSU Dept. of Agronomy, Manhattan, KS
This publication from the Kansas State University Agricultural Experiment Station and Cooperative Extension Service has been archived. Current information is available from http://www.ksre.ksu.edu.
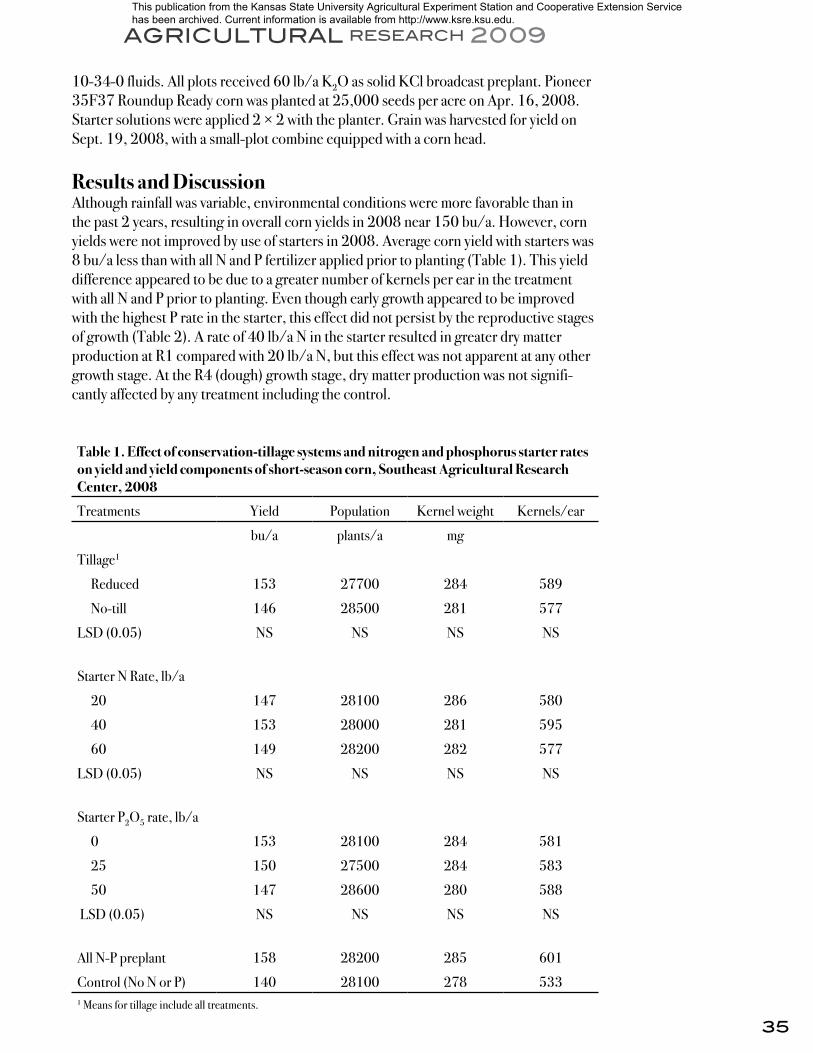
35
AGRICULTURAL RESEARCH 2009
10-34-0 fluids. All plots received 60 lb/a K2O as solid KCl broadcast preplant. Pioneer 35F37 Roundup Ready corn was planted at 25,000 seeds per acre on Apr. 16, 2008. Starter solutions were applied 2 × 2 with the planter. Grain was harvested for yield on Sept. 19, 2008, with a small-plot combine equipped with a corn head.
Results and DiscussionAlthough rainfall was variable, environmental conditions were more favorable than in the past 2 years, resulting in overall corn yields in 2008 near 150 bu/a. However, corn yields were not improved by use of starters in 2008. Average corn yield with starters was 8 bu/a less than with all N and P fertilizer applied prior to planting (Table 1). This yield difference appeared to be due to a greater number of kernels per ear in the treatment with all N and P prior to planting. Even though early growth appeared to be improved with the highest P rate in the starter, this effect did not persist by the reproductive stages of growth (Table 2). A rate of 40 lb/a N in the starter resulted in greater dry matter production at R1 compared with 20 lb/a N, but this effect was not apparent at any other growth stage. At the R4 (dough) growth stage, dry matter production was not signifi-cantly affected by any treatment including the control.
Table 1. Effect of conservation-tillage systems and nitrogen and phosphorus starter rates on yield and yield components of short-season corn, Southeast Agricultural Research Center, 2008
Treatments Yield Population Kernel weight Kernels/ear
bu/a plants/a mg
Tillage1
Reduced 153 27700 284 589
No-till 146 28500 281 577
LSD (0.05) NS NS NS NS
Starter N Rate, lb/a
20 147 28100 286 580
40 153 28000 281 595
60 149 28200 282 577
LSD (0.05) NS NS NS NS
Starter P2O5 rate, lb/a
0 153 28100 284 581
25 150 27500 284 583
50 147 28600 280 588
LSD (0.05) NS NS NS NS
All N-P preplant 158 28200 285 601
Control (No N or P) 140 28100 278 5331 Means for tillage include all treatments.
This publication from the Kansas State University Agricultural Experiment Station and Cooperative Extension Service has been archived. Current information is available from http://www.ksre.ksu.edu.
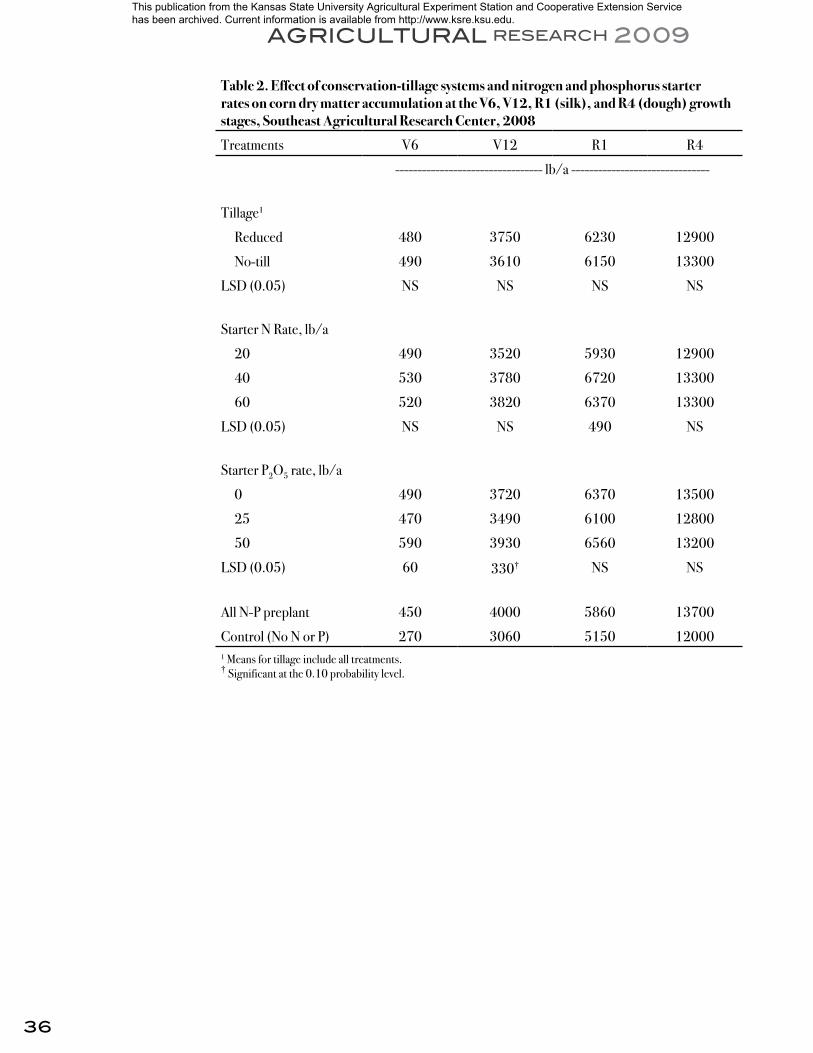
36
AGRICULTURAL RESEARCH 2009
Table 2. Effect of conservation-tillage systems and nitrogen and phosphorus starter rates on corn dry matter accumulation at the V6, V12, R1 (silk), and R4 (dough) growth stages, Southeast Agricultural Research Center, 2008
Treatments V6 V12 R1 R4
--------------------------------- lb/a -------------------------------
Tillage1
Reduced 480 3750 6230 12900
No-till 490 3610 6150 13300
LSD (0.05) NS NS NS NS
Starter N Rate, lb/a
20 490 3520 5930 12900
40 530 3780 6720 13300
60 520 3820 6370 13300
LSD (0.05) NS NS 490 NS
Starter P2O5 rate, lb/a
0 490 3720 6370 13500
25 470 3490 6100 12800
50 590 3930 6560 13200
LSD (0.05) 60 330† NS NS
All N-P preplant 450 4000 5860 13700
Control (No N or P) 270 3060 5150 120001 Means for tillage include all treatments.† Significant at the 0.10 probability level.
This publication from the Kansas State University Agricultural Experiment Station and Cooperative Extension Service has been archived. Current information is available from http://www.ksre.ksu.edu.

37
AGRICULTURAL RESEARCH 2009
Effects of Population, Planting Date, and Timing of Supplemental Irrigation on Sweet Corn
D. W. Sweeney and M. B. Kirkham1
SummaryIn 2008, irrigation applied at both the VT and R2 growth stages increased total fresh weight but not number of ears or individual ear weight. Earlier planting increased total ears, total fresh weight, and individual ear weight. Knife application increased total sweet corn fresh weight, but nitrogen (N) placement had no effect on number of ears or indi-vidual ear weight.
IntroductionSweet corn is a possible value-added, alternative crop for producers in southeast Kansas. Corn responds to irrigation, and timing of water deficits can affect yield components. Even though large irrigation sources, such as aquifers, are lacking in southeast Kansas, supplemental irrigation could be supplied from the substantial number of small lakes and ponds in the area. However, there is a lack of information on effects of irrigation manage-ment, N placement, and planting date on performance of sweet corn, which may hinder producers’ adoption of this crop.
Experimental ProceduresThe experiment was established on a Parsons silt loam in spring 2008 as a split-plot arrangement of a randomized complete block with three replications. The whole plots included two planting dates (targets of late April and mid-May) and four irrigation schemes: (1) no irrigation, (2) 1.5 in. at VT (tassel), (3) 1.5 in. at R2 (blister), and (4) 1.5 in. at both VT and R2. Subplots were three N treatments consisting of no N and 100 lb/a N applied broadcast or as a subsurface band (knife) at 4 in. Sweet corn was planted on Apr. 22 and May 19, 2008. Sweet corn from the first planting date was picked on July 14 and 18, and corn from the second planting date was picked on Aug. 1 and 6, 2008.
Results and DiscussionThe total number of ears was 15% greater from sweet corn planted in April than sweet corn planted in May (Table 1), and there was a similar difference in individual ear weight. As a result, total fresh weight was more than 30% greater for sweet corn planted in April than in May. Limited irrigation applied at both the VT and R2 growth stages resulted in more than 10% greater total fresh weight than no irrigation or irrigation at only one growth stage. Irrigation did not increase number of ears per acre or individual ear weight. Nitrogen placement did not affect number of ears or individual ear weight, but knifing increased total fresh weight by about 10% above broadcast N or no N fertilizer. The minimal response to fertilizer N may be a result of the plot area being fallowed the previous year.
1 KSU Dept. of Agronomy, Manhattan, KS
This publication from the Kansas State University Agricultural Experiment Station and Cooperative Extension Service has been archived. Current information is available from http://www.ksre.ksu.edu.
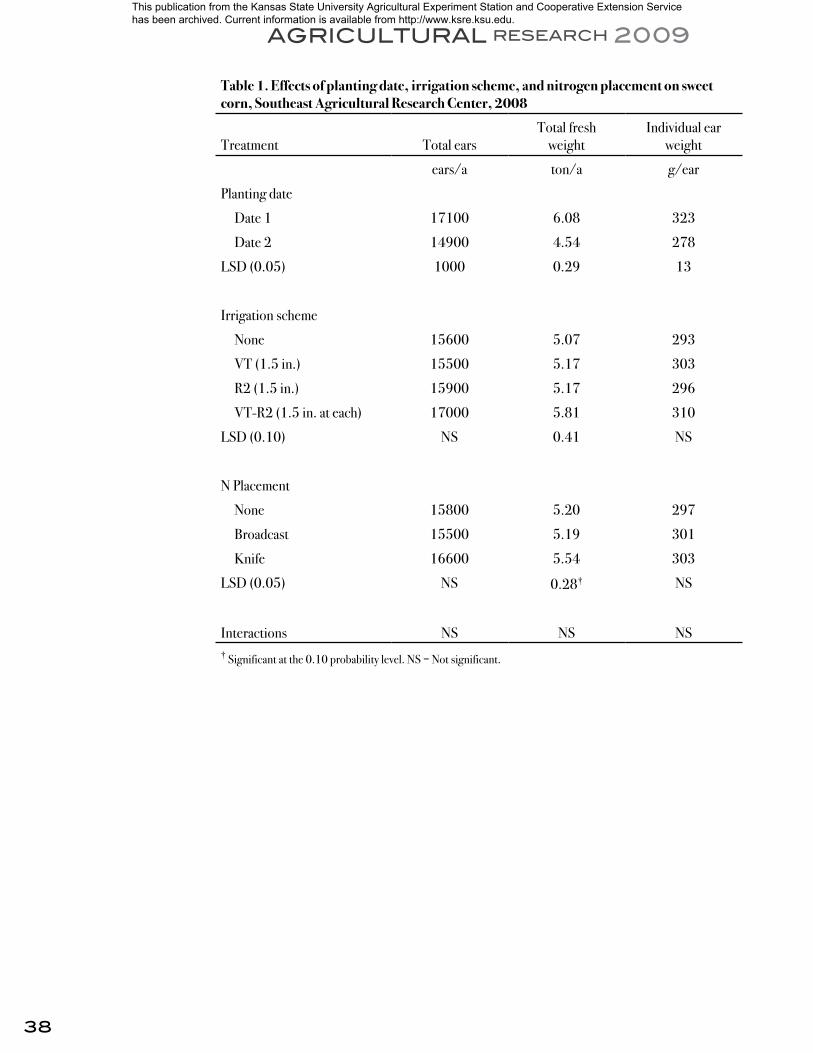
38
AGRICULTURAL RESEARCH 2009
Table 1. Effects of planting date, irrigation scheme, and nitrogen placement on sweet corn, Southeast Agricultural Research Center, 2008
Treatment Total earsTotal fresh
weightIndividual ear
weight
ears/a ton/a g/ear
Planting date
Date 1 17100 6.08 323
Date 2 14900 4.54 278
LSD (0.05) 1000 0.29 13
Irrigation scheme
None 15600 5.07 293
VT (1.5 in.) 15500 5.17 303
R2 (1.5 in.) 15900 5.17 296
VT-R2 (1.5 in. at each) 17000 5.81 310
LSD (0.10) NS 0.41 NS
N Placement
None 15800 5.20 297
Broadcast 15500 5.19 301
Knife 16600 5.54 303
LSD (0.05) NS 0.28† NS
Interactions NS NS NS† Significant at the 0.10 probability level. NS = Not significant.
This publication from the Kansas State University Agricultural Experiment Station and Cooperative Extension Service has been archived. Current information is available from http://www.ksre.ksu.edu.

39
AGRICULTURAL RESEARCH 2009
Effects of Tillage on Full-Season Soybean Yield
K. W. Kelley and D. W. Sweeney
SummaryLong-term effects of tillage method (conventional and no-till) on full-season soybean yield are being evaluated at the Parsons and Columbus Units. Soybean yields have been more affected by tillage at the Columbus Unit, which has a longer cropping history than the Parsons Unit.
IntroductionIn southeast Kansas, full-season soybean often is rotated with other crops, such as corn and grain sorghum, to diversify cropping systems. Soybean was typically planted with conventional tillage (chisel – disk – field cultivate), but improved equipment technology has made no-till planting more feasible. This research evaluates the long-term effects of tillage method on yield of full-season soybean grown in rotation with corn or grain sorghum.
Experimental ProceduresFrom 1995 through 2002, a 3-year crop rotation was evaluated at both the Columbus and Parsons Units. The rotation consisted of (corn and grain sorghum)/soybean/(wheat and double-crop soybean), and tillage effects on full-season soybean yield were evaluated every 3 years. Tillage treatments were: (1) all crops planted with conventional tillage (CT), (2) all crops planted with no-till (NT), and (3) alternate CT and NT systems. Beginning in 2003, the 3-year rotation was changed to a 2-year rotation that consisted of soybean following grain sorghum. Since then, tillage effects on soybean yield have been evaluated each year at both the Columbus and Parsons Units.
Results and DiscussionEffects of tillage method on full-season soybean yield are shown in Table 1. At the Columbus Unit, soybean yields were greater with CT than with NT during the first two cropping cycles. In recent years, however, soybean yields with continuous NT have been equal to or greater than yields with CT. But soybean yields for NT following CT have been significantly lower than yields for continuous NT or continuous CT. Tillage has had less effect on soybean yields at the Parsons Unit, except for the last two cropping years. The Columbus Unit has a significantly longer cropping history than the Parsons Unit, which may be affecting tillage responses.
This publication from the Kansas State University Agricultural Experiment Station and Cooperative Extension Service has been archived. Current information is available from http://www.ksre.ksu.edu.
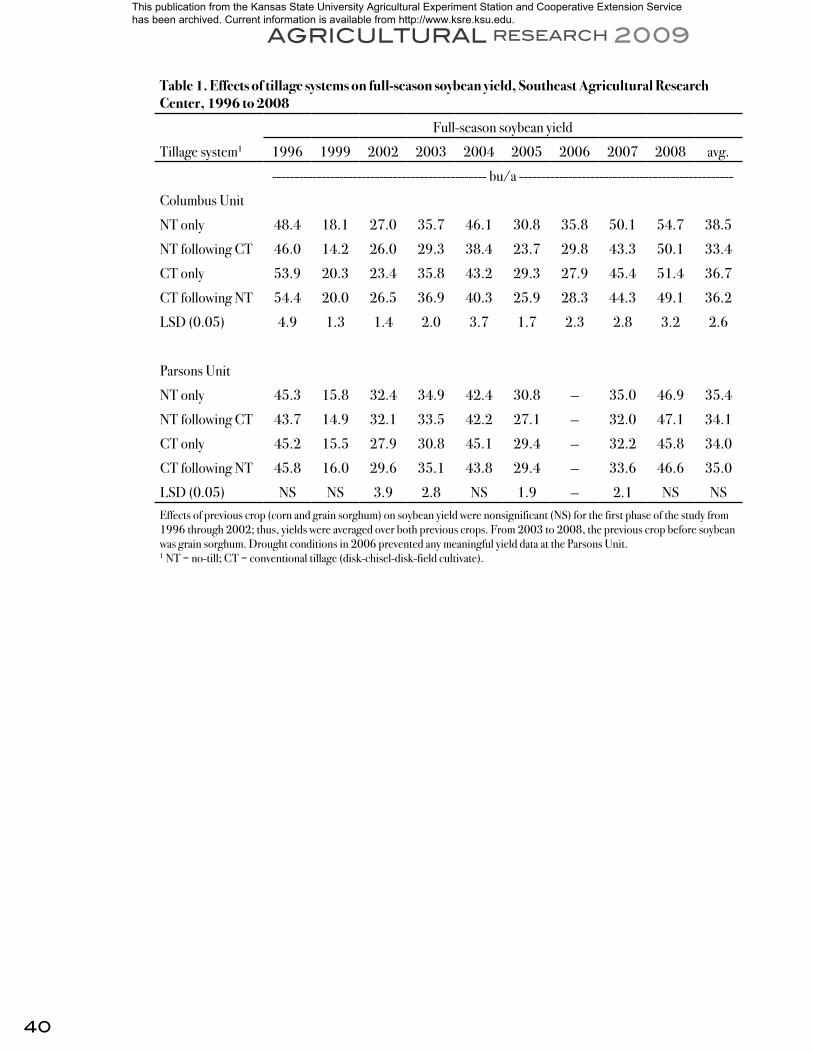
40
AGRICULTURAL RESEARCH 2009
Table 1. Effects of tillage systems on full-season soybean yield, Southeast Agricultural Research Center, 1996 to 2008
Full-season soybean yield
Tillage system1 1996 1999 2002 2003 2004 2005 2006 2007 2008 avg.
------------------------------------------------ bu/a ------------------------------------------------
Columbus Unit
NT only 48.4 18.1 27.0 35.7 46.1 30.8 35.8 50.1 54.7 38.5
NT following CT 46.0 14.2 26.0 29.3 38.4 23.7 29.8 43.3 50.1 33.4
CT only 53.9 20.3 23.4 35.8 43.2 29.3 27.9 45.4 51.4 36.7
CT following NT 54.4 20.0 26.5 36.9 40.3 25.9 28.3 44.3 49.1 36.2
LSD (0.05) 4.9 1.3 1.4 2.0 3.7 1.7 2.3 2.8 3.2 2.6
Parsons Unit
NT only 45.3 15.8 32.4 34.9 42.4 30.8 — 35.0 46.9 35.4
NT following CT 43.7 14.9 32.1 33.5 42.2 27.1 — 32.0 47.1 34.1
CT only 45.2 15.5 27.9 30.8 45.1 29.4 — 32.2 45.8 34.0
CT following NT 45.8 16.0 29.6 35.1 43.8 29.4 — 33.6 46.6 35.0
LSD (0.05) NS NS 3.9 2.8 NS 1.9 — 2.1 NS NSEffects of previous crop (corn and grain sorghum) on soybean yield were nonsignificant (NS) for the first phase of the study from 1996 through 2002; thus, yields were averaged over both previous crops. From 2003 to 2008, the previous crop before soybean was grain sorghum. Drought conditions in 2006 prevented any meaningful yield data at the Parsons Unit. 1 NT = no-till; CT = conventional tillage (disk-chisel-disk-field cultivate).
This publication from the Kansas State University Agricultural Experiment Station and Cooperative Extension Service has been archived. Current information is available from http://www.ksre.ksu.edu.

41
AGRICULTURAL RESEARCH 2009
Effects of Nitrogen Fertilizer Rate and Time of Application on Corn and Grain Sorghum Yields
K. W. Kelley and D. W. Sweeney
Summary Effects of various rates of fertilizer nitrogen (N) applied preplant or side-dressed have been evaluated with corn and grain sorghum in southeast Kansas since 2005. Averaged over 3 years, fertilizer N rate has influenced both corn and grain sorghum yields more than time of N application when these crops follow double-crop soybean in a 2-year cropping rotation.
IntroductionBecause of recent increases in N fertilizer prices, producers are looking to reduce pro-duction costs for feed-grain crops, such as corn and grain sorghum. There is renewed interest in applying some of the fertilizer N requirement after the crop has emerged, referred to as side-dressing. Some research has shown that a subsurface application of banded N after the crop has emerged results in more efficient N use and often increases net return. In southeast Kansas, excessive spring rainfall also increases the potential for greater N loss where fertilizer N is applied preplant.
Experimental ProceduresStudies were established at the Columbus Unit of the Southeast Agricultural Research Center in 2005 to evaluate effects of time and rate of N fertilizer application on both corn and grain sorghum. Fertilizer (28% liquid N) treatments consisted of different N rates applied preplant or side-dressed. Preplant N fertilizer was subsurface applied be-fore planting on 15-in. centers at a depth of 4 to 6 in. Side-dress N also was subsurface applied between 30-in. rows. All plots received 30 lb/a N preplant as 18-46-0. In 2008, corn was planted in late April and grain sorghum near May 20. Side-dress N was applied June 18 for both crops. The previous crop was double-crop soybean.
Results and DiscussionCorn and grain sorghum yield responses to fertilizer N for 2008 and 3-year averages are shown in Table 1. In the spring of 2008, above-normal rainfall (28 in.) occurred during the 3-month period from April through June. Even though soil moisture was excessive during early spring, water did not pond on the soil surface. Corn yields in 2008 showed no increase above the 120 lb/a N rate, but 3-year corn yield averages were greater for the 150 lb/a N rate. Corn yields responded more to rate than time of fertilizer N applica-tion. Under conditions in this study, in which denitrification N loses were likely small, corn yields were greater when fertilizer N was applied preplant than when it was side-dressed, although grain yield differences were not large over the 3-year period.
Similar to corn, grain sorghum yields generally increased with increasing N rates, although 3-year average yields showed the 120 lb/a N rate was most efficient. Time of fertilizer N application did not have a significant effect on grain sorghum yields.
This publication from the Kansas State University Agricultural Experiment Station and Cooperative Extension Service has been archived. Current information is available from http://www.ksre.ksu.edu.
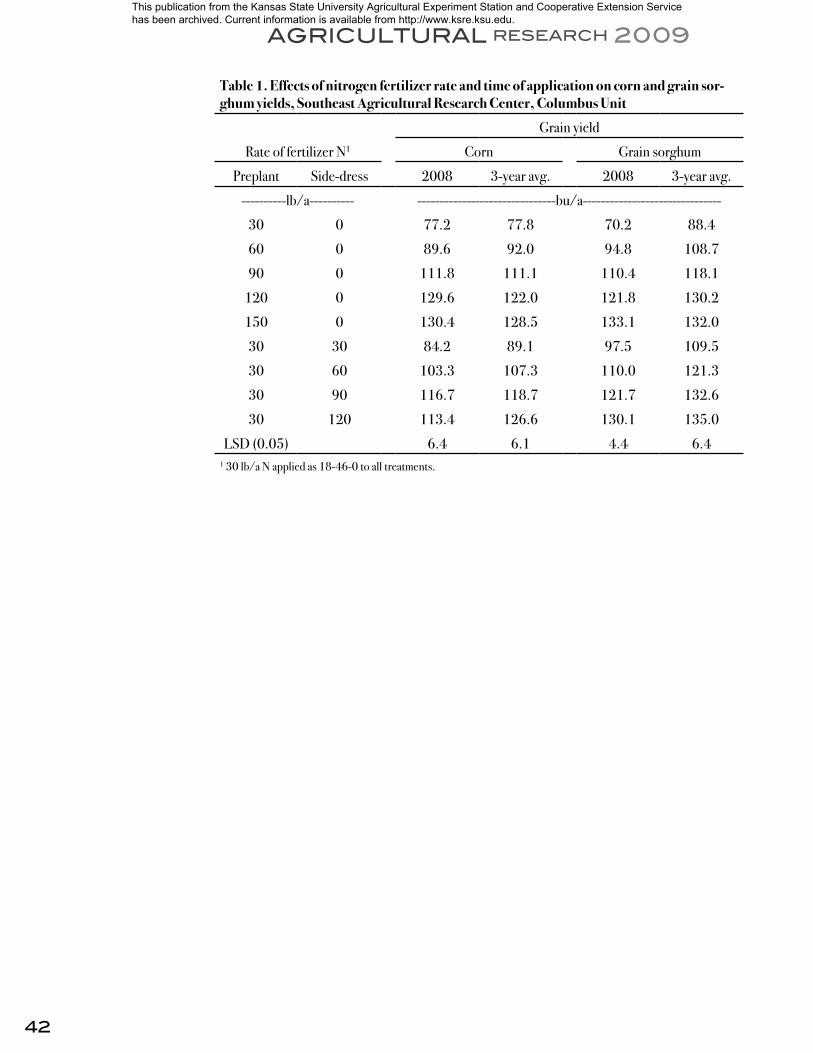
42
AGRICULTURAL RESEARCH 2009
Table 1. Effects of nitrogen fertilizer rate and time of application on corn and grain sor-ghum yields, Southeast Agricultural Research Center, Columbus Unit
Grain yield
Rate of fertilizer N1 Corn Grain sorghum
Preplant Side-dress 2008 3-year avg. 2008 3-year avg.
----------lb/a---------- -------------------------------bu/a-------------------------------
30 0 77.2 77.8 70.2 88.4
60 0 89.6 92.0 94.8 108.7
90 0 111.8 111.1 110.4 118.1
120 0 129.6 122.0 121.8 130.2
150 0 130.4 128.5 133.1 132.0
30 30 84.2 89.1 97.5 109.5
30 60 103.3 107.3 110.0 121.3
30 90 116.7 118.7 121.7 132.6
30 120 113.4 126.6 130.1 135.0
LSD (0.05) 6.4 6.1 4.4 6.41 30 lb/a N applied as 18-46-0 to all treatments.
This publication from the Kansas State University Agricultural Experiment Station and Cooperative Extension Service has been archived. Current information is available from http://www.ksre.ksu.edu.

43
AGRICULTURAL RESEARCH 2009
Effects of Phosphorus and Potassium Fertilizer Rate and Time of Application in a Wheat Double-Cropping System
K. W. Kelley and D. W. Sweeney
SummaryNeither rate nor timing of phosphorus (P) and potassium (K) fertilizer application sig-nificantly affected grain yields of grain sorghum, wheat, and double-crop soybean during initial stages of this long-term study.
IntroductionTiming and rate of fertilizer P and K application are important crop production manage-ment decisions. In southeast Kansas, producers often plant wheat following harvest of a feed-grain crop, such as grain sorghum or corn, and then plant double-crop soybean after wheat, giving three crops in 2 years. In these multiple-crop systems, producers typi-cally apply fertilizer P and K only to the feed-grain and wheat crops. Because fertilizer costs are increasing, this research seeks to determine direct and residual effects of rate and timing of P and K fertilizer application on grain yields in a double-cropping system.
Experimental ProceduresThis study was established in 2004 at the Columbus Unit of the Southeast Agricul-tural Research Center. Crop rotation consists of grain sorghum/(wheat – double-crop soybean), giving three crops in a 2-year period. Grain sorghum is planted with conven-tional tillage, and wheat and double-crop soybean are planted with no-till. Different P and K fertilizer rates are applied preplant to the grain sorghum crop only or to both the grain sorghum and wheat crops. Initial soil test values before study establishment were 23 ppm Bray-1 P and 160 ppm exchangeable K for the 0- to 6-in. soil depth. Soil has been sampled each year since study establishment for nutrient availability following the double-crop soybean harvest.
Results and DiscussionEffects of various P and K fertilizer treatments on grain sorghum, wheat, and double-crop soybean yields are shown in Table 1. Fertilizer treatments have affected grain yields very little during initial years of study establishment. The nonsignificant yield response was not unexpected because initial soil test values indicated soil P and K values were suf-ficient for expected yield goals.
Nutrient removal in harvested grain for 100 bu/a grain sorghum, 50 bu/a wheat, and 25 bu/a double-crop soybean is 87 lb/a P2O5 and 72 lb/a K2O. Thus, this study will continue for several cropping cycles to monitor residual effects of P and K fertilizer treat-ments on grain yields and soil nutrient concentrations of P and K.
This publication from the Kansas State University Agricultural Experiment Station and Cooperative Extension Service has been archived. Current information is available from http://www.ksre.ksu.edu.
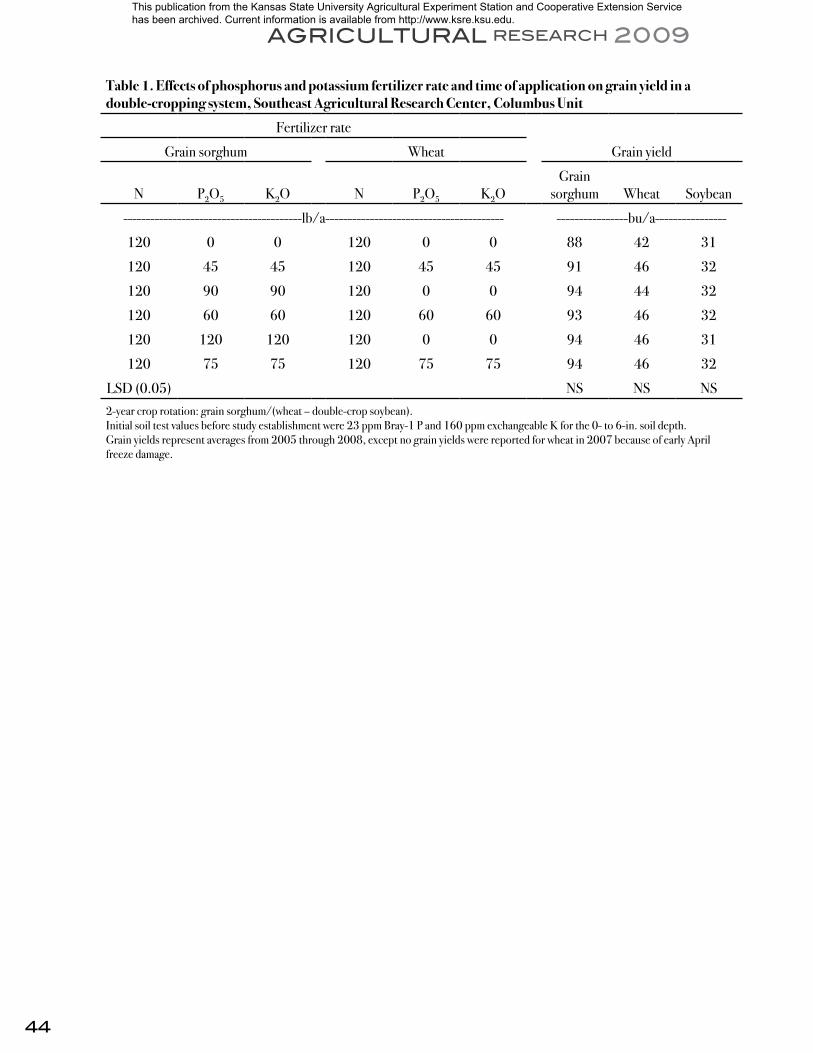
44
AGRICULTURAL RESEARCH 2009
Table 1. Effects of phosphorus and potassium fertilizer rate and time of application on grain yield in a double-cropping system, Southeast Agricultural Research Center, Columbus Unit
Fertilizer rate
Grain sorghum Wheat Grain yield
N P2O5 K2O N P2O5 K2OGrain
sorghum Wheat Soybean
----------------------------------------lb/a---------------------------------------- ----------------bu/a----------------
120 0 0 120 0 0 88 42 31
120 45 45 120 45 45 91 46 32
120 90 90 120 0 0 94 44 32
120 60 60 120 60 60 93 46 32
120 120 120 120 0 0 94 46 31
120 75 75 120 75 75 94 46 32
LSD (0.05) NS NS NS2-year crop rotation: grain sorghum/(wheat – double-crop soybean).Initial soil test values before study establishment were 23 ppm Bray-1 P and 160 ppm exchangeable K for the 0- to 6-in. soil depth.Grain yields represent averages from 2005 through 2008, except no grain yields were reported for wheat in 2007 because of early April freeze damage.
This publication from the Kansas State University Agricultural Experiment Station and Cooperative Extension Service has been archived. Current information is available from http://www.ksre.ksu.edu.
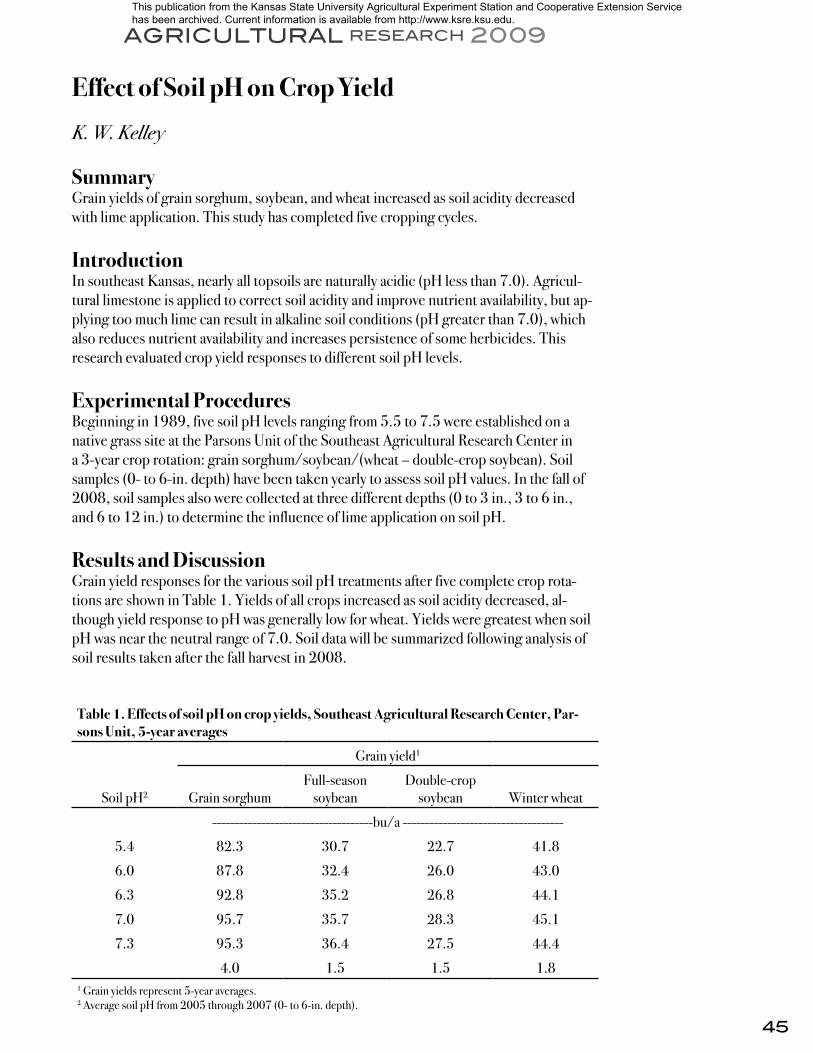
45
AGRICULTURAL RESEARCH 2009
Effect of Soil pH on Crop Yield
K. W. Kelley
SummaryGrain yields of grain sorghum, soybean, and wheat increased as soil acidity decreased with lime application. This study has completed five cropping cycles.
IntroductionIn southeast Kansas, nearly all topsoils are naturally acidic (pH less than 7.0). Agricul-tural limestone is applied to correct soil acidity and improve nutrient availability, but ap-plying too much lime can result in alkaline soil conditions (pH greater than 7.0), which also reduces nutrient availability and increases persistence of some herbicides. This research evaluated crop yield responses to different soil pH levels.
Experimental ProceduresBeginning in 1989, five soil pH levels ranging from 5.5 to 7.5 were established on a native grass site at the Parsons Unit of the Southeast Agricultural Research Center in a 3-year crop rotation: grain sorghum/soybean/(wheat – double-crop soybean). Soil samples (0- to 6-in. depth) have been taken yearly to assess soil pH values. In the fall of 2008, soil samples also were collected at three different depths (0 to 3 in., 3 to 6 in., and 6 to 12 in.) to determine the influence of lime application on soil pH.
Results and DiscussionGrain yield responses for the various soil pH treatments after five complete crop rota-tions are shown in Table 1. Yields of all crops increased as soil acidity decreased, al-though yield response to pH was generally low for wheat. Yields were greatest when soil pH was near the neutral range of 7.0. Soil data will be summarized following analysis of soil results taken after the fall harvest in 2008.
Table 1. Effects of soil pH on crop yields, Southeast Agricultural Research Center, Par-sons Unit, 5-year averages
Grain yield1
Soil pH2 Grain sorghumFull-season
soybeanDouble-crop
soybean Winter wheat
------------------------------------bu/a ------------------------------------
5.4 82.3 30.7 22.7 41.8
6.0 87.8 32.4 26.0 43.0
6.3 92.8 35.2 26.8 44.1
7.0 95.7 35.7 28.3 45.1
7.3 95.3 36.4 27.5 44.4
4.0 1.5 1.5 1.81 Grain yields represent 5-year averages.2 Average soil pH from 2005 through 2007 (0- to 6-in. depth).
This publication from the Kansas State University Agricultural Experiment Station and Cooperative Extension Service has been archived. Current information is available from http://www.ksre.ksu.edu.
46
AGRICULTURAL RESEARCH 2009
Soybean Foliar Fungicide Trial
J. H. Long, D. Jardine1, and E. DeWolf1
SummaryEight fungicide treatments were applied at the Parsons Unit on full-season soybean to evaluate their control of soybean rust (Phakopsora pachyrhizi). These plots were evaluated for grain yield and other agronomic characteristics throughout the summer of 2008. Soybean rust did not infect plants during 2008, but other diseases did, including Septoria brown spot. These diseases had strong visual effects on plants but did not affect grain yields. Grain yields ranged from 53 to 58 bu/a for all treatments, whereas the untreated check averaged 55 bu/a.
IntroductionSoybean rust is a new disease that is capable of causing severe grain yield loss. It can completely defoliate a soybean plant in just a few weeks. This disease spread from South America to the United States in 2004 and has infected most major soybean-producing areas in the United States. There are no known resistant varieties, so disease manage-ment through fungicide application is the only reliable remedy for this disease. Many fungicide treatments are available to manage soybean rust, but little is known regarding their effectiveness in Kansas. Treatments were determined by contacting retail outlets that sell soybean fungicides and determining treatments available to the farming public. This study established best management practices for control of this quick-acting disease and determined if fungicides should be applied at predetermined growth stages to pro-tect the crop
Experimental ProceduresSoybean variety NK S52U3 was planted into good moisture at the Parsons Unit of the Southeast Agricultural Research Center. The soil is a Parsons silt loam. Soil was conven-tionally tilled, and soybean was planted with John Deere 7000 planter units on June 21, 2008, at 10 seeds per foot of row. Dual II Magnum herbicide was applied preemergence at the rate of 1 pint/a. Roundup WeatherMax at 22 oz/a was sprayed after planting to control weeds. Fungicide applications were then applied at three growth stages with a 10-ft-wide boom sprayer using a 20 gal/a mixture. Harvest occurred Nov. 8, 2008.
Results and DiscussionMost foliar fungicide treatments were applied at the R3 growth stage of soybean (begin-ning to pod), which is early in the reproductive stages of the soybean plant. One treat-ment was applied very early at R1 (first bloom), and another was applied late at R5 (pod fill). Soybean rust was not present in these plots in 2008, yet several diseases occurred in the season. Grain yield of the untreated check was equal to that of fungicide treatments (Table 1). Grain yields ranged from 53 to 58 bu/a. Fungicide treatment also had little effect on grain yield components. Folicure at R3 yielded less than several top treatments
1 KSU Dept. of Plant Pathology, Manhattan, KS
This publication from the Kansas State University Agricultural Experiment Station and Cooperative Extension Service has been archived. Current information is available from http://www.ksre.ksu.edu.

47
AGRICULTURAL RESEARCH 2009
including Headline at R3, Quadris at R3, and Quilt at both R5 and multiple treatments. Leaf bronzing did occur with Folicure, but the exact cause of the yield reduction is unknown.
Table 1. Foliar fungicide effects on soybean grain yields, Parsons, 2007 and 2008
Treatment RateSoybean growth
stage at application
Grain yield
2007 2008 2-year avg.
--------------------bu/a-------------------
Folicure 4 R3 34 53 43.5
Domark 5.5 R3 33 55 44.0
Headline 12 R3 — 57 —
Quadris 12.3 R3 36 58 47.0
Quilt 14 R1 34 56 45.0
Quilt 14 R3 36 56 46.0
Quilt 14 R5 33 58 45.5
Quilt 14 R1, R3, R5 — 57 —
Check - None — — 35 55 45.0
LSD (0.05) NS 4
This publication from the Kansas State University Agricultural Experiment Station and Cooperative Extension Service has been archived. Current information is available from http://www.ksre.ksu.edu.

48
AGRICULTURAL RESEARCH 2009
Foliar Fungicide Application on Full-Season and Double-Crop Soybean
J. H. Long, D. Jardine1, and E. DeWolf1
SummaryEight fungicide timing treatments were applied at the Parsons Unit on full-season and double-crop soybean (late-planted) to evaluate their control of soybean rust (Phakop-sora pachyrhizi). These plots were evaluated for grain yield and other agronomic charac-teristics throughout the summer of 2008. Soybean rust did not affect yields. Grain yields ranged from 34.7 to 51.2 bu/a.
IntroductionSoybean rust is a new disease that is capable of causing severe grain yield loss. It can completely defoliate a soybean plant in just a few weeks. This disease spread from South America to the United States in 2004 and has infected most major soybean-producing areas in the United States. There are no known resistant varieties, so disease manage-ment through fungicide application is the only reliable remedy for this disease. The time of fungicide application depends on two factors. It is important to determine when the disease arrives from the southern region of the United States via wind-borne spores, and the growth stage of soybean in surrounding fields determines how vulnerable the crop is to the disease. Growth stages of the crop are influenced by the maturity grouping of the variety and planting time of the variety being grown. Many soybean fields in southeast Kansas are planted late in the growing season and thus may be more susceptible to dis-ease development. This study also helped determine the effect of soybean maturity group and planting date on disease development as well as the effect of the disease on soybean grain yield in 2008.
Experimental ProceduresTwo soybean varieties (Asgrow 3802 and Asgrow 5605) were planted on June 17 and June 29 at 10 seeds per foot of row. Conventional tillage was used for early planted soy-bean, and late-planted soybean was planted without tillage. Dual II Magnum herbicide was applied preemergence at the rate of 1 pint/a. Plants emerged to form an excellent stand. All varieties were glyphosate tolerant, and Roundup WeatherMax herbicide at 22 oz/a was applied postemergence. The soybean was harvested on Nov. 8, 2008.
Results and DiscussionFungicide had mixed effects on soybean grain yield or yield components in 2008 (Table 1). Early planted Asgrow 5605 with Headline fungicide yielded more than As-grow 5605 without fungicide. Fungicide-treated soybean had more pods than untreated soybean. Early planted Asgrow 5605 outyielded early planted Asgrow 3802 by produc-ing more pods, whereas late-planted Asgrow 5602 yielded the same as Asgrow 3802 yet
1 KSU Dept. of Plant Pathology, Manhattan, KS
This publication from the Kansas State University Agricultural Experiment Station and Cooperative Extension Service has been archived. Current information is available from http://www.ksre.ksu.edu.
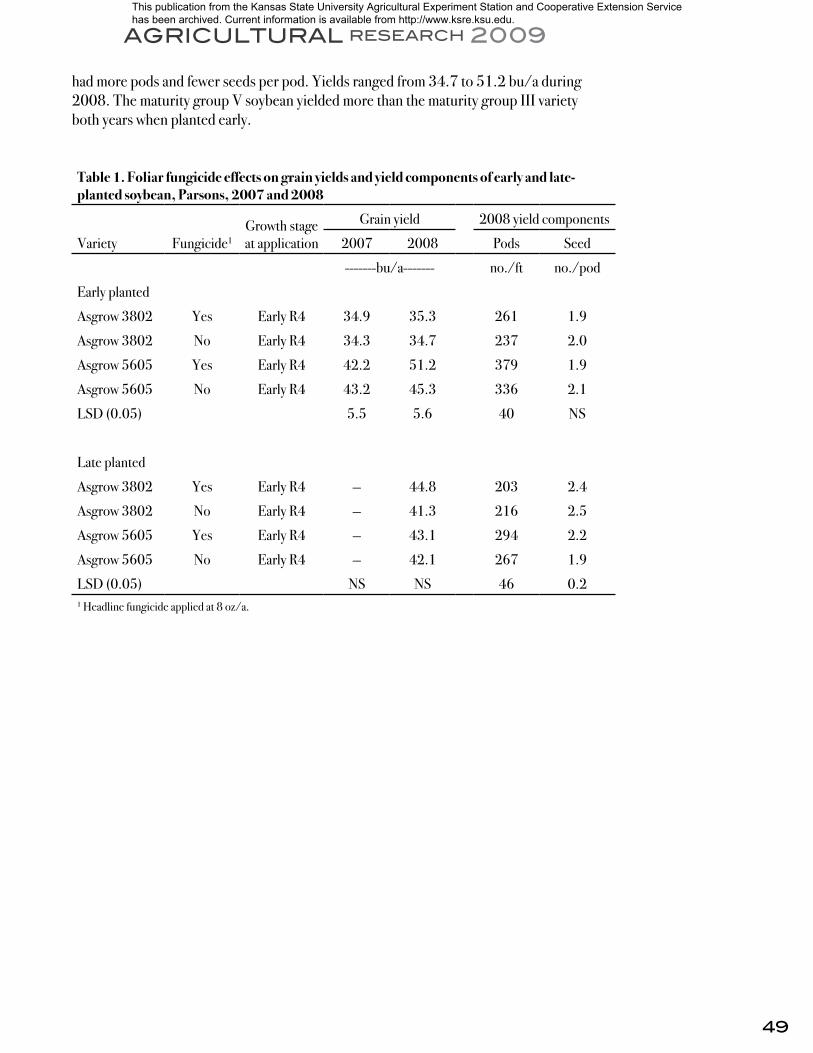
49
AGRICULTURAL RESEARCH 2009
had more pods and fewer seeds per pod. Yields ranged from 34.7 to 51.2 bu/a during 2008. The maturity group V soybean yielded more than the maturity group III variety both years when planted early.
Table 1. Foliar fungicide effects on grain yields and yield components of early and late-planted soybean, Parsons, 2007 and 2008
Variety Fungicide1Growth stage at application
Grain yield 2008 yield components
2007 2008 Pods Seed
-------bu/a------- no./ft no./pod
Early planted
Asgrow 3802 Yes Early R4 34.9 35.3 261 1.9
Asgrow 3802 No Early R4 34.3 34.7 237 2.0
Asgrow 5605 Yes Early R4 42.2 51.2 379 1.9
Asgrow 5605 No Early R4 43.2 45.3 336 2.1
LSD (0.05) 5.5 5.6 40 NS
Late planted
Asgrow 3802 Yes Early R4 — 44.8 203 2.4
Asgrow 3802 No Early R4 — 41.3 216 2.5
Asgrow 5605 Yes Early R4 — 43.1 294 2.2
Asgrow 5605 No Early R4 — 42.1 267 1.9
LSD (0.05) NS NS 46 0.21 Headline fungicide applied at 8 oz/a.
This publication from the Kansas State University Agricultural Experiment Station and Cooperative Extension Service has been archived. Current information is available from http://www.ksre.ksu.edu.

50
AGRICULTURAL RESEARCH 2009
Effect of Plant Population and Hybrid Maturity on Corn Grain Yield in Southeast Kansas
J. H. Long
SummaryCorn hybrids DeKalb 50-44 and DeKalb 62-99 were planted at Parsons, Pittsburg, and Columbus, KS, in plant population studies during 2008. DeKalb 50-44 is a 100-day relative maturity hybrid, and DeKalb 62-99 is a 112-day relative maturity hybrid. Weather conditions were very wet in 2008 at Parsons and Columbus and affected grain yields. Still, final populations of 23,000 on early maturity hybrids yielded at or near 100 bu/a at both Parsons and Columbus. Grain yields ranged from 65 to 100 bu/a at both locations.
IntroductionShort-season corn has rapidly become a major crop in southeast Kansas. Crop acreage has grown from fewer than 50,000 to nearly 350,000 acres in the last 25 years, with most of the acreage increase in the last 10 years. This increase in acreage has been influ-enced by the release of well-adapted, high-yielding corn hybrids. Newer hybrids are short to silk with extended grain fill periods but are 5 to 7 days longer in maturity than cur-rent 105-day hybrids. Longer-maturity hybrids outyield shorter-maturity hybrids when moisture is not a limiting factor.
Experimental ProceduresDeKalb 50-44 and DeKalb 62-99 were planted at two locations, Parsons and Colum-bus, during 2008. Original stands were thinned back to four different final stands. Final stands were 18,000, 23,000, 28,000, and 33,000 plants per acre. During 2008, Parsons was planted on April 21, and Columbus was planted on May 5. All locations followed a previous crop of soybean. Prior to planting, fields were field cultivated. Fol-lowing planting, Dual II Magnum herbicide was applied preemergence to help control weeds. Fertilizer was applied following soil test recommendations for corn. Grain was harvested in August and September at both locations. Yield was determined at 15.5% moisture.
Results and DiscussionThe summer of 2008 began very wet and delayed planting. Both locations were consid-ered late, but the Columbus location was planted in May, which is very late for southeast Kansas. Stands were adequate for the required population; however, some plots were lost to water and considered missing. There was a 3-week dry period during the last 2 weeks of July and first week of August, which is considered normal for this part of Kansas. No differences were seen with 18,000 plants per acre. The short-season DeKalb 50-44 outyielded the full-season DeKalb 62-99, with final populations of 23,000 and 28,000 plants per acre having yields of 93 to 100 bu/a (Figure 1). Although DeKalb 62-99 silked relatively early, the extended grain fill pushed maturity into the hot, dry period of July and August. The short-season hybrid that silked during June and reached dent by the middle of July was best for southeast Kansas in 2008. Tests will be continued during 2009 and 2010.
This publication from the Kansas State University Agricultural Experiment Station and Cooperative Extension Service has been archived. Current information is available from http://www.ksre.ksu.edu.
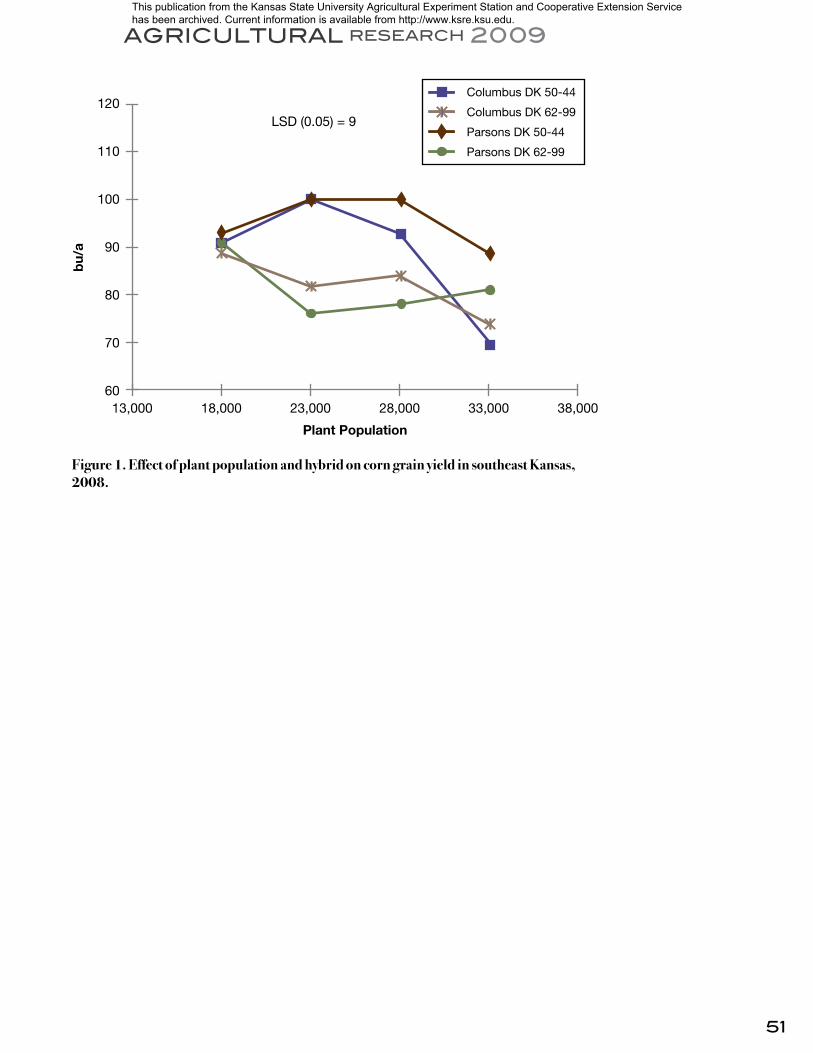
51
AGRICULTURAL RESEARCH 2009
bu/
a
120
110
100
90
80
70
60
Columbus DK 50-44
Columbus DK 62-99
Parsons DK 50-44
Parsons DK 62-99
13,000 33,00023,00018,000 38,00028,000
Plant Population
LSD (0.05) = 9
Figure 1. Effect of plant population and hybrid on corn grain yield in southeast Kansas, 2008.
This publication from the Kansas State University Agricultural Experiment Station and Cooperative Extension Service has been archived. Current information is available from http://www.ksre.ksu.edu.
52
AGRICULTURAL RESEARCH 2009
Corn Fungicide Effectiveness in Southeast Kansas for 2008
J. H. Long
SummaryCorn fungicide studies were conducted at three locations in southeast Kansas during 2008: Parsons, Columbus, and Coffeyville. Hybrid DeKalb 50-44 was planted at each location, and then three treatments were used at silk to evaluate fungicide effectiveness on foliar diseases. Early planted corn had higher grain yields and showed no effect of fungicide use on grain yields. Late-planted corn had lower grain yields but showed some positive effects from foliar fungicide use. Grain yields ranged from 101 to 138 bu/a for all treatments.
IntroductionUse of foliar fungicides on corn is not generally a recommended practice when corn is planted on time and matures before the threat of disease has developed. However, many producers would use fungicides, especially if high grain prices warranted. A study was begun in 2008 to evaluate the effectiveness of foliar fungicides on corn in southeast Kansas.
Experimental ProceduresHybrid DeKalb 50-44 (100-day relative maturity) was planted at Columbus, Parsons, and Coffeyville during 2008. Corn was planted on March 27 and April 21 at Parsons, April 23 at Coffeyville, and May 1 at Columbus. Soil at all locations was a Parsons silt loam. Soil was conventionally tilled, and corn was planted with John Deere finger pick-up units dropping 27,500 seeds per acre. Dual II Magnum herbicide was applied preemergence at the rate of 1 pint/a at both Columbus and Parsons. Fertility included 150 lb of nitrogen applied both as broadcast urea and side-dressed as urea ammonium nitrate. Fungicide applications were then applied at silk with a 10-ft-wide boom sprayer using a 20 gal/a mixture. Harvest was conducted with a Gleaner K2 combine outfitted with a HarvestMaster grain gauge weighing system.
Results and DiscussionFoliar fungicides had little effect on grain yield at Parsons (Table 1). Seed was planted at or near optimum time, and little disease was seen during the season. Grain yields were greater than 130 bu/a. However, at Columbus, where planting was very late, and Cof-feyville, where foliar diseases can be a problem with later planting, fungicide treatments were effective in preserving grain yields. Grain yields increased by at least 10 bu/a at both locations. More information needs to be gathered to determine any long-term trends for foliar fungicide use; however, data from 2008 indicate that late-planted corn can benefit from fungicide use if disease is present.
This publication from the Kansas State University Agricultural Experiment Station and Cooperative Extension Service has been archived. Current information is available from http://www.ksre.ksu.edu.
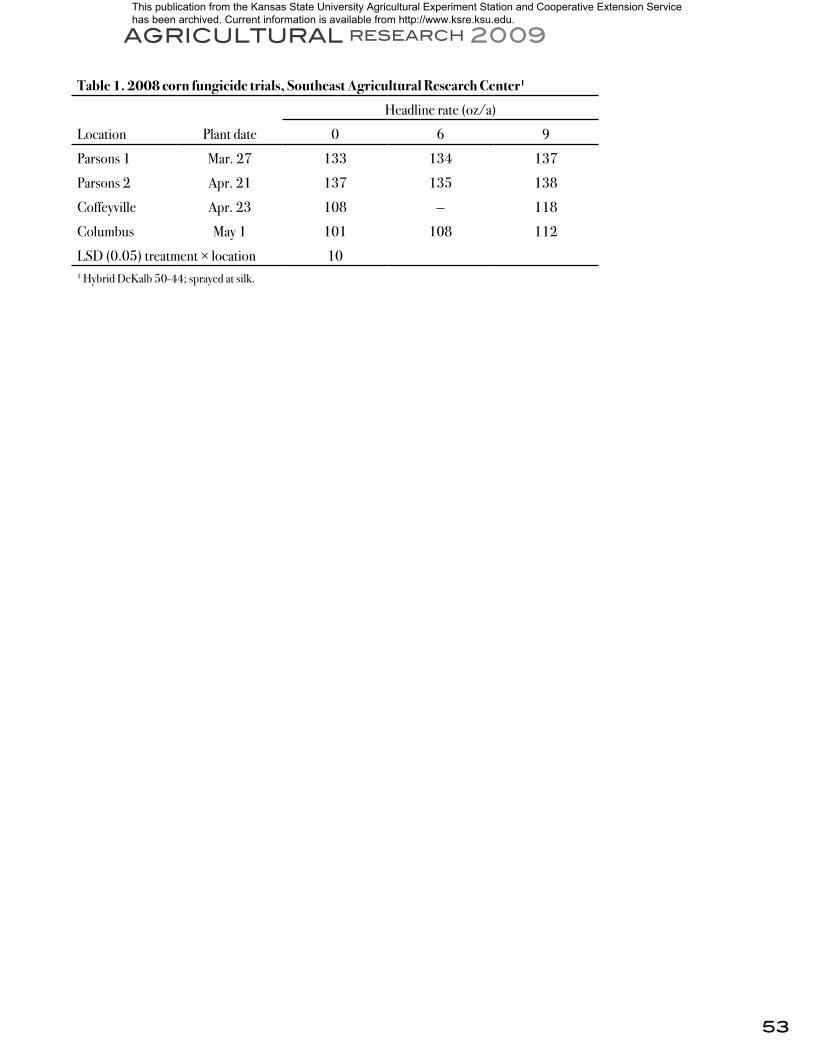
53
AGRICULTURAL RESEARCH 2009
Table 1. 2008 corn fungicide trials, Southeast Agricultural Research Center1
Headline rate (oz/a)
Location Plant date 0 6 9
Parsons 1 Mar. 27 133 134 137
Parsons 2 Apr. 21 137 135 138
Coffeyville Apr. 23 108 — 118
Columbus May 1 101 108 112
LSD (0.05) treatment × location 101 Hybrid DeKalb 50-44; sprayed at silk.
This publication from the Kansas State University Agricultural Experiment Station and Cooperative Extension Service has been archived. Current information is available from http://www.ksre.ksu.edu.
54
AGRICULTURAL RESEARCH 2009
Planting Date, Plant Population, and Drying Agent Effects on Late-Planted Sunflower in Southeast Kansas
J. H. Long
SummarySunflower was planted at five populations on three dates during July and August. Prior to harvest, three drying treatments were sprayed to hasten grain in-the-shell drydown to levels that would permit earlier combining of the crop. Grain yield and other agro-nomic characteristics were collected during the summer of 2008. Results indicate that July-planted sunflower gave greatest yields and that final plant stands of 15,000 and 20,000 plants per acre were best. Results were affected by excessive wind and rain from remnants of late-summer hurricanes, and final rainfall totals for 2008 were nearly 20 in. above normal.
IntroductionSunflower has been grown as a catch crop in eastern Kansas for many years. It has never been grown on more than a few thousand acres per county in this part of the state, but sunflower has great potential as a crop if management practices can be developed to en-able greater grain yield. Little is known about the effect of late planting dates (following wheat harvest) and plant populations needed in southeast Kansas, so a study was con-ducted to determine these important practices.
Experimental ProceduresSunflower hybrid Pioneer 63M91 was planted into good moisture at the Parsons Unit of the Southeast Agricultural Research Center. The soil is a Parsons silt loam. Because of very high rainfall, soil was conventionally tilled to dry the ground before planting. Sun-flower was planted with John Deere planter units on July 3, July 15, and Aug. 4, 2008, according to planting populations needed. Each population was overplanted then thinned to final stands of 15,000, 20,000, 25,000, 30,000, or 35,000 plants per acre. Trifluralin herbicide was applied preemergence at the rate of 1 pint/a. Roundup Weath-erMax or Kixor was sprayed late in the season at growth stage R9 to evaluate their use as drying agents to facilitate earlier harvest. Harvest occurred October 2 for the July 3 planting, October 28 for the July 15 planting, and November 21 for the August 4 plant-ing date.
Results and DiscussionGrain yields were affected by planting date and plant population (Figure 1). July 3 planting of sunflower at 20,000 plants final stand and July 15 planting at 15,000 plants final stand both had seed yields greater than 1,500 lb/a. The August 3 planting gener-ally yielded less than the July plantings but still gave 1,076 lb/a when 15,000 plants per acre were used. Yield decreased as population increased. The drydown treatments of Roundup and Kixor were effective in drying the plants to harvestable levels, and seed yields were nearly 10% greater than those in sunflower with no drydown treatment. One
This publication from the Kansas State University Agricultural Experiment Station and Cooperative Extension Service has been archived. Current information is available from http://www.ksre.ksu.edu.

55
AGRICULTURAL RESEARCH 2009
possible explanation is that quicker drydown of the head held seed tighter and did not al-low shattering to occur. Further study is needed to provide more reliable data, especially on final stands. High winds and heavy rain caused more lodging in high populations and resulted in very low yields in 2008.
See
d W
eig
ht, l
b/a
2,000
1,500
1,000
500
July 3
July 15
Aug. 4
10,000 30,00020,00015,000 40,00025,000
Plant Population
LSD (0.05) = 264
35,000
Figure 1. Effect of plant population on sunflower seed yield with three planting dates in southeast Kansas, 2008.
This publication from the Kansas State University Agricultural Experiment Station and Cooperative Extension Service has been archived. Current information is available from http://www.ksre.ksu.edu.
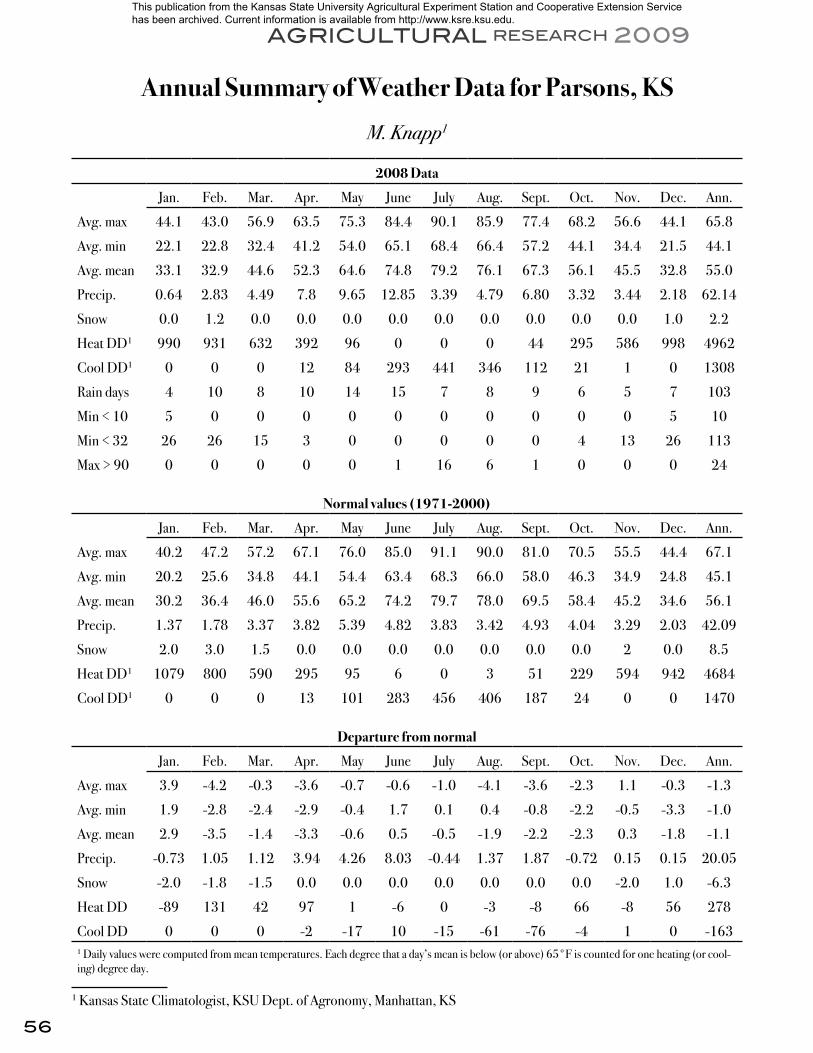
56
AGRICULTURAL RESEARCH 2009
Annual Summary of Weather Data for Parsons, KS
M. Knapp1
2008 Data
Jan. Feb. Mar. Apr. May June July Aug. Sept. Oct. Nov. Dec. Ann.
Avg. max 44.1 43.0 56.9 63.5 75.3 84.4 90.1 85.9 77.4 68.2 56.6 44.1 65.8
Avg. min 22.1 22.8 32.4 41.2 54.0 65.1 68.4 66.4 57.2 44.1 34.4 21.5 44.1
Avg. mean 33.1 32.9 44.6 52.3 64.6 74.8 79.2 76.1 67.3 56.1 45.5 32.8 55.0
Precip. 0.64 2.83 4.49 7.8 9.65 12.85 3.39 4.79 6.80 3.32 3.44 2.18 62.14
Snow 0.0 1.2 0.0 0.0 0.0 0.0 0.0 0.0 0.0 0.0 0.0 1.0 2.2
Heat DD1 990 931 632 392 96 0 0 0 44 295 586 998 4962
Cool DD1 0 0 0 12 84 293 441 346 112 21 1 0 1308
Rain days 4 10 8 10 14 15 7 8 9 6 5 7 103
Min < 10 5 0 0 0 0 0 0 0 0 0 0 5 10
Min < 32 26 26 15 3 0 0 0 0 0 4 13 26 113
Max > 90 0 0 0 0 0 1 16 6 1 0 0 0 24
Normal values (1971-2000)
Jan. Feb. Mar. Apr. May June July Aug. Sept. Oct. Nov. Dec. Ann.
Avg. max 40.2 47.2 57.2 67.1 76.0 85.0 91.1 90.0 81.0 70.5 55.5 44.4 67.1
Avg. min 20.2 25.6 34.8 44.1 54.4 63.4 68.3 66.0 58.0 46.3 34.9 24.8 45.1
Avg. mean 30.2 36.4 46.0 55.6 65.2 74.2 79.7 78.0 69.5 58.4 45.2 34.6 56.1
Precip. 1.37 1.78 3.37 3.82 5.39 4.82 3.83 3.42 4.93 4.04 3.29 2.03 42.09
Snow 2.0 3.0 1.5 0.0 0.0 0.0 0.0 0.0 0.0 0.0 2 0.0 8.5
Heat DD1 1079 800 590 295 95 6 0 3 51 229 594 942 4684
Cool DD1 0 0 0 13 101 283 456 406 187 24 0 0 1470
Departure from normal
Jan. Feb. Mar. Apr. May June July Aug. Sept. Oct. Nov. Dec. Ann.
Avg. max 3.9 -4.2 -0.3 -3.6 -0.7 -0.6 -1.0 -4.1 -3.6 -2.3 1.1 -0.3 -1.3
Avg. min 1.9 -2.8 -2.4 -2.9 -0.4 1.7 0.1 0.4 -0.8 -2.2 -0.5 -3.3 -1.0
Avg. mean 2.9 -3.5 -1.4 -3.3 -0.6 0.5 -0.5 -1.9 -2.2 -2.3 0.3 -1.8 -1.1
Precip. -0.73 1.05 1.12 3.94 4.26 8.03 -0.44 1.37 1.87 -0.72 0.15 0.15 20.05
Snow -2.0 -1.8 -1.5 0.0 0.0 0.0 0.0 0.0 0.0 0.0 -2.0 1.0 -6.3
Heat DD -89 131 42 97 1 -6 0 -3 -8 66 -8 56 278
Cool DD 0 0 0 -2 -17 10 -15 -61 -76 -4 1 0 -1631 Daily values were computed from mean temperatures. Each degree that a day’s mean is below (or above) 65°F is counted for one heating (or cool-ing) degree day.
1 Kansas State Climatologist, KSU Dept. of Agronomy, Manhattan, KS
This publication from the Kansas State University Agricultural Experiment Station and Cooperative Extension Service has been archived. Current information is available from http://www.ksre.ksu.edu.

57
AG
RIC
UL
TU
RA
L R
ES
EA
RC
H 2
00
9Te
mp
erat
ure,
˚F
120
100
80
60
40
20
0
1-Ja
n
Date
1-Ju
l
16-D
ec
2-D
ec
18-N
ov
4-N
ov
21-O
ct
7-O
ct
23-S
ep
9-S
ep
26-A
ug
12-A
ug
29-J
ul
15-J
ul
17-J
un
3-Ju
n
20-M
ay
6-M
ay
22-A
pr
8-A
pr
25-M
ar
11-M
ar
26-F
eb
12-F
eb
29-J
an
15-J
an
30-D
ec
Pre
cip
itat
ion,
in.
70.00
60.00
50.00
40.00
30.00
20.00
10.00
0.00
Tmax
Normal Precipitation
Tmin
Normal Tmin
Precipitation
Normal Tmax
Weather Summary for Parsons, KS – 2008
This publication from the Kansas State University Agricultural Experiment Station and Cooperative Extension Service has been archived. Current information is available from http://www.ksre.ksu.edu.
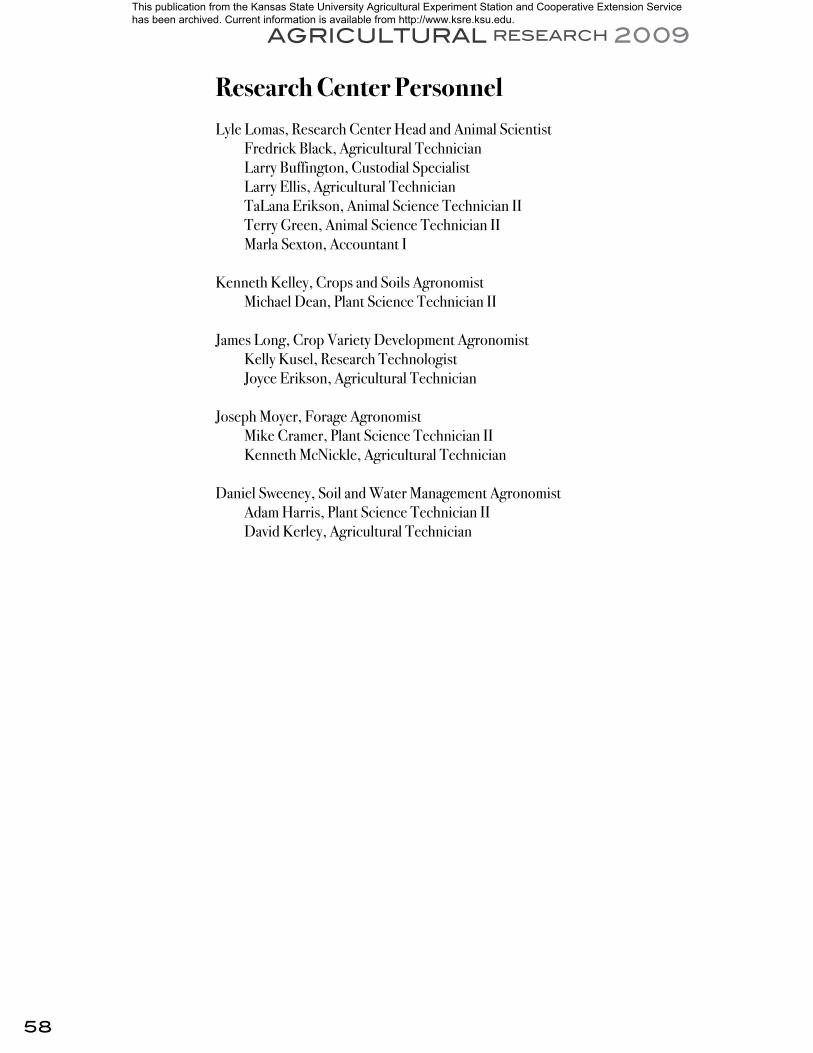
58
AGRICULTURAL RESEARCH 2009
Research Center PersonnelLyle Lomas, Research Center Head and Animal Scientist Fredrick Black, Agricultural Technician Larry Buffington, Custodial Specialist Larry Ellis, Agricultural Technician TaLana Erikson, Animal Science Technician II Terry Green, Animal Science Technician II Marla Sexton, Accountant I
Kenneth Kelley, Crops and Soils Agronomist Michael Dean, Plant Science Technician II
James Long, Crop Variety Development Agronomist Kelly Kusel, Research Technologist Joyce Erikson, Agricultural Technician
Joseph Moyer, Forage Agronomist Mike Cramer, Plant Science Technician II Kenneth McNickle, Agricultural Technician
Daniel Sweeney, Soil and Water Management Agronomist Adam Harris, Plant Science Technician II David Kerley, Agricultural Technician
This publication from the Kansas State University Agricultural Experiment Station and Cooperative Extension Service has been archived. Current information is available from http://www.ksre.ksu.edu.
59
AGRICULTURAL RESEARCH 2009
AcknowledgmentsWe thank the following individuals, organizations, and firms that contributed to this year’s research programs through financial support, product donations, or services.
ADM Alliance Nutrition, Quincy, IL
AgriPro Biosciences, Inc., Shawnee Mission, KS
AGSECO, Girard, KS
Bartlett Coop Association
Beachner Grain, St. Paul, KS
BioTracking, LLC, Moscow, ID
Ceres, Inc., Thousand Oaks, CA
Coffeyville Feed & Farm Supply, Coffeyville, KS
Coffeyville Livestock Market, Coffeyville, KS
Commercial Bank, Parsons, KS
DeLange Seed Co., Girard, KS
DLF International, Tangent, OR
Dow AgroSciences LLC, Indianapolis, IN
Ernie and Sharon Draeger, Columbus, KS
Roger Draeger, Galena, KS
DuPont Agricultural Products, Wilmington, DE
East Kansas Agri-Energy, Garnett, KS
Elanco Animal Health, Indianapolis, IN
Farm Talk, Inc., Parsons, KS
Farmers Coop, Columbus, KS
Foundation for Agronomic Research, GA
Frontier Farm Credit, Chanute, KS
Ft. Dodge Animal Health, Overland Park, KS
Genetic Seed & Chemical, Bonham, TX
Joe Harris, St. Paul, KS
Johnson Seed Co., Mound Valley, KS
Johnston Seed, Enid, OK
Kansas Corn Commission, Garnett, KS
Kansas Crop Improvement Assn., Manhattan, KS
Kansas Fertilizer Research Fund, Topeka, KS
Kansas Forage and Grassland Council, Chanute, KS
Kansas Soybean Commission, Topeka, KS
Kansas Sunflower Commission, Rossville, KS
K-F Seeds, Brawley, CA
Manners Oil Co., Parsons, KS
Merial Ltd., Duluth, GA
MFA Incorporated, Columbia, MO
Monsanto Ag Products, St. Louis, MO
National Sunflower Association, Bismarck, ND
Nixa Hardware & Seed Co., Nixa, MO
Parsons Livestock Market, Parsons, KS
Pennington Seed, Inc., Madison, GA
Pioneer Hi-Bred International, Johnston, IA
Producers Coop, Girard, KS
R & F Farm Supply, Inc., Erie, KS
Rinck Seed Farms, Niotaze, KS
Sorghum Partners, Inc., New Deal, TX
South Coffeyville Stockyards, South Coffeyville, OK
Stockade Brands, Inc., Pittsburg, KS
Syngenta Crop Protection, Greensboro, NC
Emmet and Virginia Terril, Catoosa, OK
Triple D Seed, Coffeyville, KS
Tri-State Agri Services, Carl Junction, MO
Westbred, LLC, Bozeman, MT
Wilkinson Farms, Pittsburg, KS
This publication from the Kansas State University Agricultural Experiment Station and Cooperative Extension Service has been archived. Current information is available from http://www.ksre.ksu.edu.

Kansas State University Agricultural Experiment Station and Cooperative Extension Service
SRP 1013 April 2009 K-State Research and Extension is an equal opportunity provider and employer. 520
Copyright 2009 Kansas State University Agricultural Experiment Station and Cooperative Extension Service. Contents of this publication may be freely reproduced for educational purposes. All other rights reserved. In each case, give credit to the author(s), Agricultural Research 2009, Southeast Agricultural Research Center, Kansas State University, April 2009. Contribution no. 09-264-S from the Kansas Agricultural Experiment Station.
Chemical DisclaimerBrand names appearing in this publication are for product identification purposes only. No endorsement is intended, nor is criticism implied of similar products not mentioned. Experiments with pesticides on nonlabeled crops or target species do not imply endorsement or recommendation of nonlabeled use of pesticides by Kansas State University. All pesticides must be used consistent with current label directions. Current information on weed control in Kansas is available in 2009 Chemical Weed Control for Field Crops, Pastures, Rangeland, and Noncropland, Report of Progress 1007, available from the Distribution Center, Umberger Hall, Kansas State University, or on the World Wide Web at: www.ksre.ksu.edu/library (type Chemical Weed Control in search box).
Publications from Kansas State University are available on the World Wide Web at: www.ksre.ksu.edu
AGRICULTURAL
RESEARCH
2009
This publication from the Kansas State University Agricultural Experiment Station and Cooperative Extension Service has been archived. Current information is available from http://www.ksre.ksu.edu.