agricultural and forest meteorology · 1998usingthestandardizedchangeofndvi(dndvi)derivedfrom avhrr...
TRANSCRIPT

Agricultural and Forest Meteorology 150 (2010) 122–132
Contents lists available at ScienceDirect
Agricultural and Forest Meteorology
journal homepage: www.e lsev ier .com/ locate /agr formet
Post-hurricane forest damage assessment using satellite remote sensing
Wanting Wang a,*, John J. Qu a, Xianjun Hao a, Yongqiang Liu b, John A. Stanturf b
a EastFIRE Lab, Environmental Science and Technology Center (ESTC), College of Science, George Mason University, 4400 University Drive MS 6A2, Fairfax, VA 22030, USAb Center for Forest Disturbance Science, US Forest Service, Athens, GA 30602, USA
A R T I C L E I N F O
Article history:
Received 15 April 2009
Received in revised form 10 September 2009
Accepted 15 September 2009
Keywords:
Forest disturbance
Vegetation index
NDII
MODIS
Algorithm
A B S T R A C T
This study developed a rapid assessment algorithm for post-hurricane forest damage estimation using
moderate resolution imaging spectroradiometer (MODIS) measurements. The performance of five
commonly used vegetation indices as post-hurricane forest damage indicators was investigated through
statistical analysis. The Normalized Difference Infrared Index (NDII) was identified as the optimal
damage indicator among these vegetation indices. An approach for detecting forest damage at a regional
scale, without relying on ground inventory or sampling, was designed and validated. The validation
showed that the relative change of pre- and post-hurricane NDII was linearly related to the damage
severity estimated by the ground inventory with the coefficient of determination 0.79. This approach
was applied to evaluate forest damage severity and the impacted region caused by Hurricane Katrina.
Published by Elsevier B.V.
1. Introduction
Hurricanes are one of the major natural disturbances to forestecosystems in the southeastern United States. A severe hurricanecan extensively influence the composition, structure and succes-sion of forests, and consequently affect the terrestrial carbon sink(Foster, 1988; Boutet and Weishampel, 2003). From the perspec-tive of fire management, the most immediate impacts ofhurricanes are a massive conversion of living forest biomass todead fuel (McNulty, 2002), an increase in fuel bed depth (Miranda,1996), and decrease in dead fuel moisture (Gill et al., 1990; Loopeet al., 1994). Previous studies have indicated that the occurrenceand intensity of wildland fires increase in hurricane-impactedareas in the years after landfall (Gardner et al., 1991; Hook et al.,1991; Wade et al., 1993; Myers and van Lear, 1998; Liu et al., 2003).
The increased frequency and severity of resulting forestdisturbances in recent years requires rapid and accurate regionalforest damage assessment to support post-hurricane forestmanagement, hazardous fuel management, post-hazard reliefactivities, and government compensation claims. Fuel loading is akey parameter in fire danger rating systems, which are notdesigned to assess increment of fire risk in hurricane-impactedforest regions. As a result, fixed fuel models in the National FireDanger Rating System (NFDRS) (Schlobohm and Brain, 2002)introduce uncertainties in fire risk estimation due to the highspatial and temporal variability of hurricane-induced dead fuels.
* Corresponding author. Tel.: +1 703 994 1532; fax: +1 703 993 9299.
E-mail address: [email protected] (W. Wang).
0168-1923/$ – see front matter . Published by Elsevier B.V.
doi:10.1016/j.agrformet.2009.09.009
Therefore, fuel models need to be adjusted to account for suchvariability, which require an efficient approach to measure abruptfuel changes. Post-hazard relief activities (e.g. logging and fuelreduction) also require knowledge of the location and severity offorest damage to effectively carry out their missions (Stanturf et al.,2007). A map of forest damage severity also provides a objectiveevidence for verifying post-hurricane compensation claims andrelated government decisions.
Few studies have focused on satellite remote sensing of storm-induced forest damage. No operational, well tested and validatedsatellite remote sensing algorithm has been developed to rapidlyassess post-hurricane forest damage and the severity in terms ofdefoliation, branch loss, stem loss and other changes in foreststructure. Most studies to date have been based on passive opticalremote sensing, in which the change or standardized change ofvarious vegetation indices are adopted as damage indicators withfew efforts to evaluate their quantitative relationship with forestdamage at the pixel level, and with few comparative analyses onthe performance of these vegetation indices. Studies on selecting aproper indicator for estimating post-hurricane forest damage havenot been reported. Ramsey et al. (1997) analyzed forest damagecaused by Hurricane Andrew 1992, using advanced very high-resolution radiometer (AVHRR) multi-temporal images. Theyfound that the regional averaged Normalized Difference Vegeta-tion Index (NDVI) change followed damage severity, but did notprovide quantitative relation of NDVI change and damage severity.In their later research, they inferred that damage extent andinformation on damage severity and type might be extracted fromthe NDVI change (Ramsey et al., 1998). Ayala-Silva and Twumasi(2004) investigated forest damage caused by Hurricane Georges
Table 1Summary of studies on post-storm forest damage assessment.
Storm Time Sensors Channels Indicator Change detection Literature
Hurricane Andrew 08/1992 AVHRR Red, NIR NDVI UID Ramsey et al. (1997, 1998, 2001)
Hurricane Georges 09/1998 AVHRR Red, NIR NDVI UID Ayala-Silva and Twumasi (2004)
Typhoon Herb 07/1996 SPOT Red, NIR NDVI UID Lee et al. (2008)
Typhoon Songda 09/2004 ASTER Red, NIR, SWIR NDVI, NDII, LAI UID Aosier and Kaneko (2007)
Ice Storm 1994 Landsat TM Red, NIR NDVI UID Stueve et al. (2007)
Ice Storm 01/1998 Landsat TM Red, NIR NDVI UID Millward and Kraft (2004)
Partial Harvesting 2000-2004 Landsat TM NIR, SWIR, Visible NDVI, TCW UID Jin and Sader (2005)
Hurricane Katrina 08/2005 Landsat TM/MODIS NIR, SWIR, Visible Non-photosynthetic
vegetation
Spectral mixture
analysis
Chambers et al. (2007)
Hurricane Fran 09/1996 SLICER NIR laser Canopy height – Boutet and Weishampel (2003)
Hurricane Lothar 12/1999 ERS SAR C-band (6 cm) InSAR coherence Classification Dwyer et al. (1999) and
Wiesmann et al. (2001)
CARABAS-II SAR VHF-band (3.3–15 m) Backscattering amplitude Linear regression Fransson et al. (2002)
W. Wang et al. / Agricultural and Forest Meteorology 150 (2010) 122–132 123
1998 using the standardized change of NDVI (DNDVI) derived fromAVHRR images. They indirectly proved that regional averagedDNDVI was linearly related to the distance of the hurricane track.Aosier and Kaneko (2007) studied tree damage caused by TyphoonSongda 2004 using advanced spaceborne thermal emission andreflection radiometer (ASTER) images at local scale. They foundthat the NDVI change for damaged trees was greater than thechange of adjusted Normalized Difference Infrared Index (NDII).Their finding was inconsistent with prior studies, in whichvegetation modifications were better detected by NIR-SWIR basedvegetation indices than NIR–Red based vegetation indices (e.g.Ceccato et al., 2001; Wilson and Sader, 2002; Sader et al., 2003;Bowyer and Danson, 2004; Jin and Sader, 2005).
The purpose of this paper is to evaluate the performance ofcommonly used vegetation indices in identifying post-hurricaneforest damage, and to develop an algorithm to rapidly assessdamage severity in hurricane-impacted forest regions. The specificobjectives of this study are to (1) identify a reliable indicator fordetecting impacted forest region and damage severity, (2) developan algorithm for rapid post-hurricane damage assessment, and (3)validate this algorithm. In the next section, the approaches andsatellite sensors used for detecting post-hurricane forest damageare reviewed. Datasets and methods are introduced in Section 3.Section 4 presents the results, including the identification of aproper damage indicator, development of a rapid assessmentalgorithm, and its application towards evaluating forest damagecaused by Hurricane Katrina. Validation results are discussed inSection 5.
2. Existing approaches for estimating post-hurricane forestdamage
The assessment of a hurricane-impacted forest region andforest damage severity has been traditionally based on the groundsurvey, aerial photography, ecological models, storm models, andtopographic exposure models or combination of these methods(Sheffield and Thompson, 1992; Wade et al., 1993; Boose et al.,1994; Kovacs et al., 2001; McNulty, 2002; Clark et al., 2006; Jacobs,2007; Kupfer et al., 2008; Wang and Xu, 2009). Research onsatellite remote sensing of hurricane-induced forest damagestarted in the 1990s, because satellite data have high temporaland spatial resolution, and extensive coverage relative to groundand aerial measurements. The primary literature from peer-reviewed journals and government documents were summarizedin Table 1. These previous approaches can be classified into fourcategories based on the respective physical principles used indetecting the forest canopy: (1) detection based on changes inchlorophyll content (Ramsey et al., 1997, 1998, 2001; Millward andKraft, 2004; Ayala-Silva and Twumasi, 2004; Jin and Sader, 2005;Aosier and Kaneko, 2007; Stueve et al., 2007; Lee et al., 2008), (2)
detection based on changes in leaf water content (Jin and Sader,2005; Aosier and Kaneko, 2007), (3) detection based on spectralmixture analysis (Chambers et al., 2007), and (4) detection basedon structural changes of damaged forests (Dwyer et al., 1999;Wiesmann et al., 2001; Fransson et al., 2002; Boutet andWeishampel, 2003). Approaches in category 1 and 2 use NDVI,NDII, or variations of NDVI and NDII as damage indicators. Theimage differencing method is used to derive the change of damageindicators before and after a hurricane. Most studies adoptedmethods in category 1, since NDVI is a well-known and mostpopular vegetation index. Few studies are in category 2 despitemuch evidence indicating that NDII is more sensitive to vegetationmodifications. Approaches in both categories are relatively simple,straightforward, and easy to implement and interpret for large-scale investigations. However, they are sensitive to errors in imagegeo-registration, sensor view geometry and vegetation phenology.NDVI is easier to saturate over dense canopies than NDII becausered bands have weaker penetration capability than SWIR bandsunder the clear-sky condition. Since regions that are prone to thehurricane hazard usually have relatively dense canopies, NDVI-based indicators are more sensitive to the saturation problem. Theapplication of spectral mixture analysis was reported by Chamberset al. (2007), which demonstrated a potential way to retrieve non-photosynthetic vegetation (i.e. wood, dead vegetation and surfacelitter). Their approach relied on the endmember classificationbased on high-resolution satellite data and field samples. Studiesbased on structural changes of post-hurricane forests are morepreliminary. Synthetic Aperture Radar (SAR) coherence data hasbeen shown effective on identifying forest and non-forest areasbased on various classification techniques (Floury et al., 1997).However, few studies reported the quantitative assessment ofpost-hurricane forest damage.
3. Data and methods
3.1. Post-Hurricane Katrina field inventory in the
De Soto National Forest
The De Soto National Forest (De Soto NF) is located in southernMississippi. The De Soto NF encompasses 1532 km2 (378,538acres) of upland forest and bottomland forest, and is managed bythe United States Department of Agriculture (USDA) Forest Service.The sub-tropical climate in the De Soto NF is characterized by mild,short winters and hot, humid summers (Kupfer et al., 2008). Highprecipitation is evenly distributed throughout the year. Thetopography is characterized by gently sloping uplands andfloodplains.
The De Soto NF includes the Chickasawhay and De SotoDistricts. Both of these districts are dominated by longleaf pine(Pinus palustris) forest, representing 44% of the forest cover

Fig. 1. Forest health evaluation stands and land cover type. Yellow dots are locations of Forest health evaluation stands. (For interpretation of the references to color in this
figure legend, the reader is referred to the web version of the article.)
W. Wang et al. / Agricultural and Forest Meteorology 150 (2010) 122–132124
(Windham, 2005). Slash pine (P. elliottiii) and hardwood covers 23%and 8%, respectively. A combination of loblolly (P. taeda), shortleaf(P. echinata) and mixed yellow pine represents 14%. Pine andhardwood mixtures cover 10%. Bottomlands are dominated byhardwoods and sweetgum (Liquidambar styraciflua). Uplands aredominated by longleaf pine, loblolly pine, shortleaf pine and slashpine.
Hurricane Katrina landed as a category 3 hurricane withsustained wind speeds of 180–200 km h�1 on August 29 2005 insoutheast Louisiana (Stanturf et al., 2007). Its eye passed within8 km of the western boundary of the De Soto NF (Bryant andBoykin, 2007), and the storm’s strong winds caused widespreadforest damage in Mississippi. The USDA Forest Inventory Analysis(FIA) reported that 8300 km2 National Forests in Mississippiwere impacted. The De Soto NF suffered forest damage over2270 km2 of land. The De Soto NF experienced storm winds forseveral hours with maximum sustained winds averaging 135–160 km h�1 and peak gusts of 145–225 km h�1 (Kupfer et al.,2008).
The USDA Forest Service conducted forest health evaluation ofthe De Soto NF one month after the hurricane landfall. A total of 54plots (405 m2/0.1 acre per plot) within 18 separate stands wereexamined, which provided a representative range of hurricanedamage from light to heavy levels (Meeker et al., 2006). Thehurricane damage was then classified using four damagecategories, including severe damage, moderate damage, lightdamage and no damage. The percentage of damaged trees in thesefour categories was calculated for each stand, and used as groundtruth data in this study. The locations of these 18 stands are shownin Fig. 1 (yellow dots), overlaid with the MODIS IGBP land covertypes (2004). The land pixels covered by evergreen needle-leafforest, evergreen broadleaf forest, deciduous broad-leaf forest,mixed forests and woody savannas were studied in this research.Out of 54 plots, 20 plots were identified as evergreen needle-leafforest; 22 plots were covered by evergreen broad-leaf forest; 1 plotwas deciduous broad-leaf forest; 9 plots were dominated by mixedforests; and 2 plots were woody savannas.
3.2. MODIS products
The MODIS Nadir BRDF-Adjusted Reflectance (NBAR) Product(MOD43B4) contains visible and shortwave infrared (SWIR)surface reflectance adjusted to nadir views with a resolution of1 km at the mean solar zenith angle of each 16-day period (Schaafet al., 2002). This product provides the surface spectral reflectance
as it would have been measured at ground level withoutatmospheric scattering or absorption. The correction scheme usedfor the NBAR product compensated for the effects of atmosphericgases, aerosols and thin cirrus clouds. Since the BRDF andatmospheric effects have been removed from the MODIS NBARproduct, the MODIS NBAR product is more stable and consistentthan other reflectance products for observing vegetation status.Therefore, it is an optimal choice for monitoring vegetation changeon land surfaces across broad spatial scales (Coppin et al., 2004). Inthis study, the MODIS NBAR product was adopted to derive NDVI,Enhanced Vegetation Index (EVI) and NDII. The Leaf Area Index(LAI) and Fraction of Photosynthetically Active Radiation (Fpar) inthe MODIS LAI and FPAR product (MOD/MYD15A2) were used toderive the change of LAI and Fpar caused by hurricanes. Forestareas were identified by the IGBP land cover type in the MODISland cover product (MOD12Q1). All these MODIS products wereobtained from the LP DAAC, the EOS Data Gateway (EDG).
3.3. Change detection methods
One of the primary challenges to detecting large-scale abruptvegetation modification is to eliminate or reduce errors caused byvegetation phenology (Zhang et al., 2003). Furthermore, varia-tions caused by atmospheric effects, the BRDF effect and soilreflectance before and after change events constitute noise fordetecting vegetation modification. Using the georegisteredMODIS NBAR product eliminated most noise caused by atmo-spheric effects and BRDF effect. First, the CLEAN algorithm(Roberts et al., 1987; Baisch and Bokelmann, 1999), a nonlineardeconvolution approach based on Fourier transform theory, wasused to fill in missing or low quality observations in the time seriesof vegetation indices (2003–2006) for each 1 km grid cell in thefocus region.
Fig. 2 shows an example of estimated missing NDII observationswithin a NDII time series. The missing data were filled with theestimated values (solid dots) derived from the CLEAN algorithm.Then, the Fourier transform was used as a high-pass filter toseparate phenological signals (low frequencies) and the signalscaused by forest damage (high frequencies). Fig. 3 is an example ofa complete NDII time series (solid line), its seasonal component(dash-dotted line) and the seasonally detrended disturbancecomponent (dotted line). Finally, the seasonally detrendedvegetation indices were subtracted using the Univariate ImagingDifferencing (UID) method to derive the change in vegetationindices before and after a hurricane.
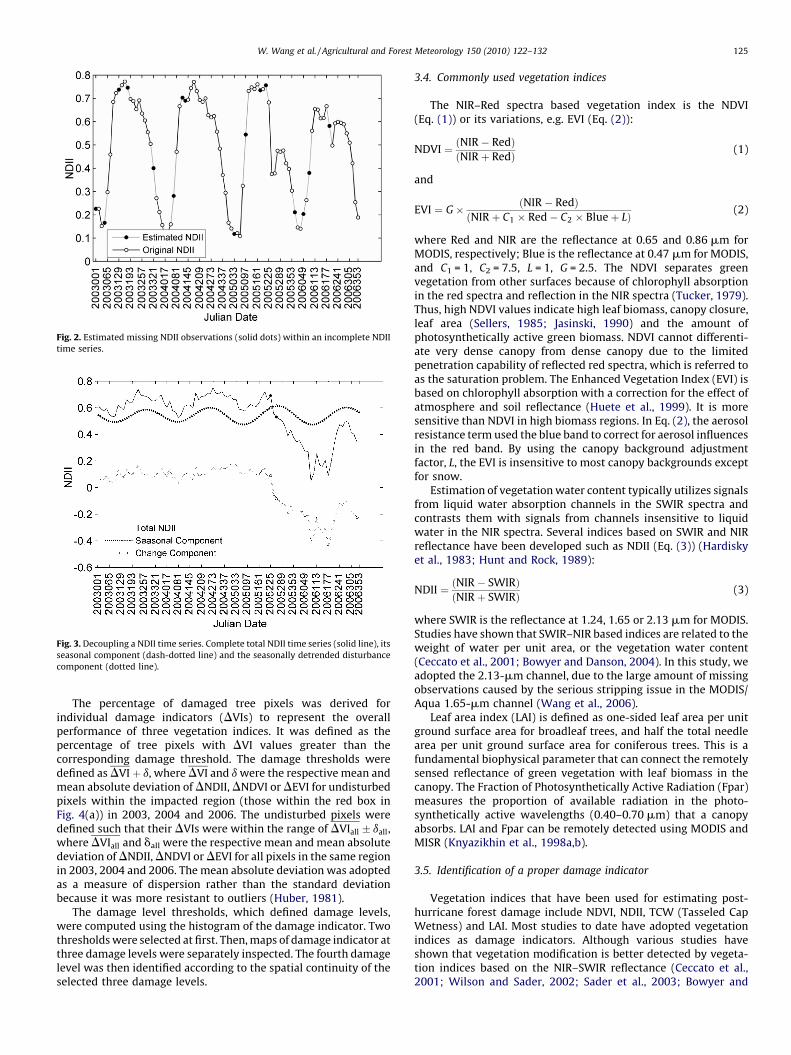
Fig. 2. Estimated missing NDII observations (solid dots) within an incomplete NDII
time series.
Fig. 3. Decoupling a NDII time series. Complete total NDII time series (solid line), its
seasonal component (dash-dotted line) and the seasonally detrended disturbance
component (dotted line).
W. Wang et al. / Agricultural and Forest Meteorology 150 (2010) 122–132 125
The percentage of damaged tree pixels was derived forindividual damage indicators (DVIs) to represent the overallperformance of three vegetation indices. It was defined as thepercentage of tree pixels with DVI values greater than thecorresponding damage threshold. The damage thresholds weredefined as DVIþ d, where DVI and d were the respective mean andmean absolute deviation of DNDII, DNDVI or DEVI for undisturbedpixels within the impacted region (those within the red box inFig. 4(a)) in 2003, 2004 and 2006. The undisturbed pixels weredefined such that their DVIs were within the range of DVIall � dall,where DVIall and dall were the respective mean and mean absolutedeviation of DNDII, DNDVI or DEVI for all pixels in the same regionin 2003, 2004 and 2006. The mean absolute deviation was adoptedas a measure of dispersion rather than the standard deviationbecause it was more resistant to outliers (Huber, 1981).
The damage level thresholds, which defined damage levels,were computed using the histogram of the damage indicator. Twothresholds were selected at first. Then, maps of damage indicator atthree damage levels were separately inspected. The fourth damagelevel was then identified according to the spatial continuity of theselected three damage levels.
3.4. Commonly used vegetation indices
The NIR–Red spectra based vegetation index is the NDVI(Eq. (1)) or its variations, e.g. EVI (Eq. (2)):
NDVI ¼ ðNIR � RedÞðNIR þ RedÞ (1)
and
EVI ¼ G� ðNIR � RedÞðNIR þ C1 � Red� C2 � Blueþ LÞ (2)
where Red and NIR are the reflectance at 0.65 and 0.86 mm forMODIS, respectively; Blue is the reflectance at 0.47 mm for MODIS,and C1 = 1, C2 = 7.5, L = 1, G = 2.5. The NDVI separates greenvegetation from other surfaces because of chlorophyll absorptionin the red spectra and reflection in the NIR spectra (Tucker, 1979).Thus, high NDVI values indicate high leaf biomass, canopy closure,leaf area (Sellers, 1985; Jasinski, 1990) and the amount ofphotosynthetically active green biomass. NDVI cannot differenti-ate very dense canopy from dense canopy due to the limitedpenetration capability of reflected red spectra, which is referred toas the saturation problem. The Enhanced Vegetation Index (EVI) isbased on chlorophyll absorption with a correction for the effect ofatmosphere and soil reflectance (Huete et al., 1999). It is moresensitive than NDVI in high biomass regions. In Eq. (2), the aerosolresistance term used the blue band to correct for aerosol influencesin the red band. By using the canopy background adjustmentfactor, L, the EVI is insensitive to most canopy backgrounds exceptfor snow.
Estimation of vegetation water content typically utilizes signalsfrom liquid water absorption channels in the SWIR spectra andcontrasts them with signals from channels insensitive to liquidwater in the NIR spectra. Several indices based on SWIR and NIRreflectance have been developed such as NDII (Eq. (3)) (Hardiskyet al., 1983; Hunt and Rock, 1989):
NDII ¼ ðNIR � SWIRÞðNIR þ SWIRÞ (3)
where SWIR is the reflectance at 1.24, 1.65 or 2.13 mm for MODIS.Studies have shown that SWIR–NIR based indices are related to theweight of water per unit area, or the vegetation water content(Ceccato et al., 2001; Bowyer and Danson, 2004). In this study, weadopted the 2.13-mm channel, due to the large amount of missingobservations caused by the serious stripping issue in the MODIS/Aqua 1.65-mm channel (Wang et al., 2006).
Leaf area index (LAI) is defined as one-sided leaf area per unitground surface area for broadleaf trees, and half the total needlearea per unit ground surface area for coniferous trees. This is afundamental biophysical parameter that can connect the remotelysensed reflectance of green vegetation with leaf biomass in thecanopy. The Fraction of Photosynthetically Active Radiation (Fpar)measures the proportion of available radiation in the photo-synthetically active wavelengths (0.40–0.70 mm) that a canopyabsorbs. LAI and Fpar can be remotely detected using MODIS andMISR (Knyazikhin et al., 1998a,b).
3.5. Identification of a proper damage indicator
Vegetation indices that have been used for estimating post-hurricane forest damage include NDVI, NDII, TCW (Tasseled CapWetness) and LAI. Most studies to date have adopted vegetationindices as damage indicators. Although various studies haveshown that vegetation modification is better detected by vegeta-tion indices based on the NIR–SWIR reflectance (Ceccato et al.,2001; Wilson and Sader, 2002; Sader et al., 2003; Bowyer and

Fig. 4. Relative reduction of NDII, NDVI, EVI, LAI and Fpar before (August 13, 2005) and after (September 14, 2005) Hurricane Katrina. (a) Damage severity mapped by FIA,
USDA Forest Service (Clark et al., 2006); (b) DNDII; (c) DNDVI; (d) DEVI; (e) DLAI; and (f) DFpar.
W. Wang et al. / Agricultural and Forest Meteorology 150 (2010) 122–132126
Danson, 2004; Jin and Sader, 2005), little research has been carriedout to evaluate the sensitivity of commonly used vegetationindices for assessing hurricane-caused forest damage. Therefore,the performance of NDVI, EVI, NDII, LAI and Fpar was analyzed inthis study. The Tasseled Cap Wetness (TCW) was not included in
the comparison because NDII and TCW are highly correlated(R2 > 0.98) (Jin and Sader, 2005).
First, we compared the maps of relative reduction of seasonallydetrended vegetation indices (DVIs) pre- and post-hurricaneKatrina with the damage severity assessed by the USDA Forest

Fig. 5. Histograms of DVIs within the major impacted region, during August 13 and September 14, 2003 (dotted line) and the same period in 2005 (solid line).
W. Wang et al. / Agricultural and Forest Meteorology 150 (2010) 122–132 127
Service, Forest Inventory and Analysis (Clark et al., 2006). The DVIis defined as the ratio of a seasonally detrended vegetation index(VI) reduction before and after the hurricane and the seasonallydetrended VI before the hurricane (Eq. (4)):
DVI ¼ ðVIaug13 � VIsept14ÞVIaug13
(4)
In this study, the MODIS NBAR products observed on August 13,2005 and September 14, 2005 were chosen as the observationsbefore and after Hurricane Katrina, respectively. These observa-tions are hereafter referred to as the observations before and afterthe hurricane. The DVIs derived from this period were referred toas DVIs2005.
Then, we compared the statistical distributions of DVIs2005 withthe DVIs derived from the observations on August 13 andSeptember 14, 2003 (DVIs2003) and the same periods in 2004(DVIs2004) and 2006 (DVIs2006) over the same forest area withinthe major impacted region (severely and moderately damagedregion, assessed by Clark et al. (2006)). We assumed that (1)DVIs2005 carried the forest damage information; and (2) DVIs2003,DVIs2004, and DVIs2006 represented the status of DVIs withoutmajor large-scale natural disturbances, since no hurricane landedor other large-scale ecosystem disturbances occurred in this regionduring those three years. The mean of DVIs (DVIs), shift amplitude(the difference of DVI2005 and DVI2003), statistical dispersion(Interquartile of Range (IQR) of DVIs2005), and percentage ofdetected damaged forest pixels were calculated to evaluate the
sensitivity of DVIs as post-hurricane damage indicators. Thedistribution of DVIs in 2003, 2004 and 2006 should have had asymmetric bell-shape distribution with DVIs equal to or approxi-mately 0, while DVIs in 2005 should have had a skeweddistribution because of large-scale forest damage. Shift amplitudemeasures the sensitivity of an indicator to a hurricane’s impact onthe forest area. The shift amplitude increases when an indicator ismore sensitive to forest damage. Statistical dispersion indicatesthe capability of an indicator to distinguish severity levels of theforest damage. An indicator with a large dispersion can betterdifferentiate damage severity levels than other indicators. Thepercentage of damaged forest pixels that an indicator can detect isalso indicative of that indicator’s overall capability to detect forestdamage.
4. Results and analysis
4.1. Post-hurricane damage indicator, DNDII
To visually compare the sensitivity of different indicators fordetecting forest damage, the DNDII2005, DNDVI2005, DEVI2005,DLAI2005 and DFpar2005 are presented in Fig. 4(b)–(f), respectively.Fig. 4(a) presents a damage severity map reported by the USDAForest Service (Clark et al., 2006), where the area within the blackbox represents the major impacted region. The major impactedregion was later used to derive the statistical variables aspresented in Fig. 5 and Table 2. The impacted region, used toderive damage thresholds, is the area within the red box in

Table 2Statistics of DVIs in 2003 and 2005.
Statistical variables DNDII DNDVI DEVI
% DVIs2003 within [�0.4, 0.4] 99.3 99.9 99.3
% DVIs2005 within [�0.4, 0.4] 96.8 99.9 99.4
DVIs2003 (m2003) �0.03 0.0 0.0
DVIs2005 (m2005) 0.14 0.06 0.04
Shift amplitude 0.17 0.06 0.04
IQR of DVIs2003 0.101 0.056 0.090
IQR of DVIs2005 0.243 0.063 0.096
Damage threshold 0.04 0.02 0.03
% Damaged pixels 86.2 81.8 55.8Fig. 6. Workflow of the rapid assessment algorithm.
Fig. 7. Forest damage severity at the pixel level.
W. Wang et al. / Agricultural and Forest Meteorology 150 (2010) 122–132128
Fig. 4(a). On Panels (b)–(f), the magenta line represents thehurricane track, and the red belt on the left is centered alongMississippi River, where the major land cover type is croplands.Because this study focused only on forested regions, it did notconsider other land cover types. To facilitate comparison, the samescale was used – as shown in the color bars on Panels (b)–(f) –where green and blue represent the increase of vegetation indicesafter the hurricane, and yellow, orange and red indicate forestdamage caused by the hurricane.
The most distinct feature of abrupt canopy modificationdetectable by optical remote sensing is the loss of green leaves,which should be directly correlated with a decrease in LAI, andindirectly correlated with a reduction of total chlorophyll andwater content at the canopy level. However, Fig. 4 (e) and (f)showed that DLAI and DFpar could not detect the most impactedregions as shown in Panel (a). One of the reasons was that theMODIS Fpar product significantly underestimated the amplitude ofground Fpar change (Huemmrich et al., 2005). The hurricaneimpact identified by DNDII (Fig. 4b) was more consistent withdamage severity assessed by the USDA Forest Service, ForestInventory and Analysis (Clark et al., 2006) (Fig. 4(a)) than DNDVI(Fig. 4(c)) or DEVI (Fig. 4(d)). The impacted area (in yellow, orangeand red) detected by DNDVI was smaller than DNDII, while DEVIunderestimated the impacted area and did not differentiate thedamage level as well as DNDII. Based on the above analysis, wefound that DNDVI, DNDII and DEVI could detect post-hurricaneforest damage to a certain extent, while DLAI and DFpar wereunable to identify the most damaged forest regions. Therefore, wefurther analyzed only the statistical properties of DNDVI, DNDIIand DEVI.
The histograms (Fig. 5) of DVIs within the major impactedregion (within the black box in Fig. 4(a)) are DVIs distributionswith or without the hurricane impact. These distributions werebased on 13628 valid forest pixels within the DVIs range [�0.4,0.4], which represented more than 99% of valid pixels, except forDNDII2005 (96.8%). To facilitate the analysis, the histograms uselines instead of conventional bar charts to represent thedistribution of DVIs. The relative decreases of the vegetationindices during the examined periods were represented by DVIs > 0.0. The solid lines with filled marks are the histograms of DVIs2005,which illustrate the distribution of DVIs after the hurricane. Thedotted lines with hollow marks show the distributions of DVIs in2003, which represent the distributions of DVIs without the impactof large-scale natural disturbances. The histograms of DVIs in 2004and 2006 were similar to the ones in 2003, therefore we onlypresented the results from 2003 and 2005. The filled and hollowmarks show the number of pixels within the correspondingintervals of DVIs, as they would be presented in the conventionalhistogram with bars. Fig. 5(b)–(d) shows, respectively, the mean ofDVIs2003 and DVIs2005 (m2003 and m2005, respectively), the shiftamplitude between DVI2003 and DVI2005 (m2005–m2003), the 25%and 75% quantiles of DVIs2005, the Interquantile Range (IQR) ofDVIs2005, and the damage threshold. Fig. 5(a) includes the
distributions of DVIs2003 and DVIs2005, as shown in Fig. 5(b)–(d),to ease the comparison among DNDII, DNDVI and DEVI. To analyzethe distributions of the same DVI in 2003 and 2005 with theinformation of statistical properties, DNDII2003,2005, DNDVI2003,2005
and DEVI2003,2005 are separately presented in Panels (b)–(d).The histograms of DVIs2003 (Fig. 5(a), dotted lines) had
approximately a symmetric bell-shape distribution, with themean (m2003 in Fig. 5(b)–(d), and DVIs2003 in Table 2) equal to 0or approximately 0, as shown in Table 2. This pattern of DVIs2003
distribution was as expected because no large-scale naturaldisturbance was observed during August 13 and September 14,2003. However, DVIs distributions in 2005 (Fig. 5(a), solid lines)shift to the direction of VIs decreasing when compared with thecorresponding DVIs distributions in 2003. This reflects the impactof Hurricane Katrina, the only major large-scale disturbanceobserved in this region within the same period in 2005.
The shift amplitude was directly related to the sensitivity ofthese indices to hurricane impacts. The shift amplitude of DNDII(0.17) was greater than those of DNDVI and DEVI, as shown inPanels (b)–(d) and Table 2. The large shift amplitude of DNDIImeans the number of pixels with decreased NDII after thehurricane increased significantly, as shown in Panel (b). The shiftamplitude of DNDVI (0.06) was slightly greater than the one ofDEVI (0.04), but still insignificant when compared to the shiftamplitude of DNDII.
The statistical dispersion (IQR) of DVIs2005 (Table 2) indicatedthe sensitivity of an indicator to the damage severity levels. Thelarge IQR of DNDII2005 (0.24) implied the number of large DNDIIvalues towards the right tail was greater than DNDVI and DEVI, soDNDII was more sensitive to the damage severity than othervegetation indices. The IQR of DNDII2003 (0.101) was similar to thatof DEVI2003 (0.090), however, the IQR of DNDII2005 (0.243) wasmuch wider than that of DEVI2005 (0.096). The IQR increase of
W. Wang et al. / Agricultural and Forest Meteorology 150 (2010) 122–132 129
DNDII between 2003 and 2005 was 0.142, while the IQR increase ofDNDVI and DEVI was insignificant (0.007 and 0.006, respectively).Less than 1% of the valid DVIs2003 and DVIs2005 were larger than 0.4except for DNDII2005, while more than 3% of the valid DNDII2005
values were larger than 0.4 (Table 2). This further supports thefinding that the effects of the hurricane not only shifted, but alsostretched the DNDII2005 distribution curve towards the positivedirection more than it affected the other DVIs distributions.
The damaged pixels identified by DNDII were 86.2% of the totalnumber of tree pixels within the major impacted region. This ratiowas higher than what DNDVI and DEVI detected (81.8% and 55.8%,
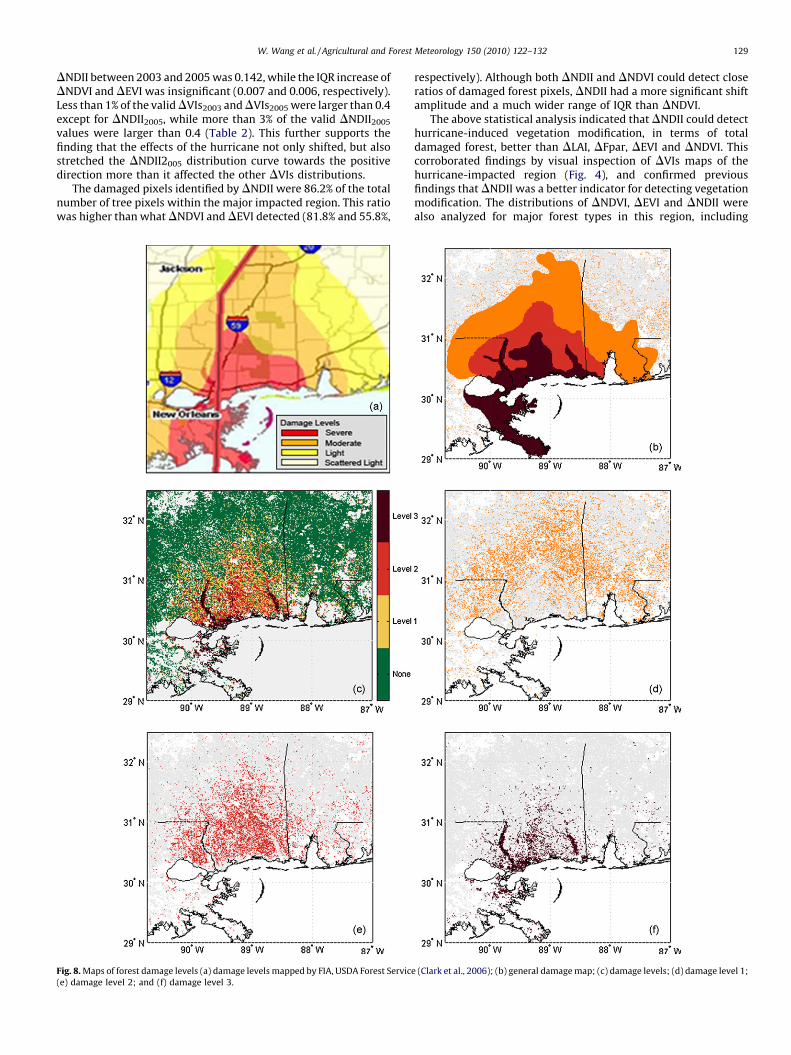
Fig. 8. Maps of forest damage levels (a) damage levels mapped by FIA, USDA Forest Servic
(e) damage level 2; and (f) damage level 3.
respectively). Although both DNDII and DNDVI could detect closeratios of damaged forest pixels, DNDII had a more significant shiftamplitude and a much wider range of IQR than DNDVI.
The above statistical analysis indicated that DNDII could detecthurricane-induced vegetation modification, in terms of totaldamaged forest, better than DLAI, DFpar, DEVI and DNDVI. Thiscorroborated findings by visual inspection of DVIs maps of thehurricane-impacted region (Fig. 4), and confirmed previousfindings that DNDII was a better indicator for detecting vegetationmodification. The distributions of DNDVI, DEVI and DNDII werealso analyzed for major forest types in this region, including
e (Clark et al., 2006); (b) general damage map; (c) damage levels; (d) damage level 1;

Fig. 9. The relationship of DNDII and the total damage severity. The dark grey dotted
line is a 1:1 line.
W. Wang et al. / Agricultural and Forest Meteorology 150 (2010) 122–132130
evergreen broadleaf forest, evergreen needle-leaf forest, deciduousbroadleaf forest and mixed forest. The distributions for four majorforest types had the same pattern as shown in Fig. 5.
4.2. Rapid assessment of post-hurricane forest damage
We developed a rapid post-hurricane forest damage assess-ment algorithm that comprised seven steps (Fig. 6). In Step 1,MODIS NBAR products that included at least 3 years of observa-tions were checked to reject invalid or poor-quality observationsusing accessory quality flags. Then, reflectance at 0.86 and 2.13-mm channels was extracted and used to derive original NDII timeseries (Eq. (3)). In Step 2, the quality of original NDII time series waschecked to eliminate anomalous high and low values, of which thenext observations immediately return to approximately theprevious values. The CLEAN algorithm was then used to estimatemissing data, including abnormal high or low values, missingobservations, and low quality observations. In Step 3, a Fouriertransform technique was used to decouple seasonal signals andseasonally detrended disturbance signals, followed by Step 4, NDIIimage differencing (Eq. (4)). The damage indicator DNDII2005 wasdefined as the difference of seasonally detrended NDII pre- andpost-hurricane divided by the complete NDII pre-hurricane. Thedamage indicator DNDII2005 was then rescaled to [0,1] to constructdamage severity in Step 5. The upper and lower limits for rescalewere decided by the statistical analysis of DNDII. For example, anupper boundary 0.6 was selected, which covers 99.7% of validDNDII2005 in the case of Hurricane Katrina impacts. A value of 0.6was then assigned to pixels with DNDII2005 greater than 0.6. Thelower boundary was the damage threshold, decided by thedistribution of DNDII2003, 2004, 2006, as elaborated in Section 3.3.The damage severity was then stratified in Step 6 to identify theimpacted areas by damage levels, which were determined throughstatistical analysis. In Step 7, damage areas were identified basedon the spatial density and continuity of damaged forest pixels atindividual damage levels.
This rapid assessment algorithm was applied to estimate forestdamage after Hurricane Katrina. The forest damage severity map(Fig. 7) is the product of the algorithm at Step 5. It illustrates thedistribution of forest damage on a scale of [0,1] at the pixel level.The pixels colored in light grey show no damage, while the otherpixels colored in gradual blue, green, yellow and red representdamage in degrees from light to most severe. Although this mapprovided detailed damage information at the nominal 1 km2 perpixel level, forest managers may need more general information tomanage post-hurricane hazard relief activities.
A forest damage level map (Fig. 8(b)) can serve such a purpose.Fig. 8(a) is the distribution of forest damage levels estimated by theUSDA Forest Service (Clark et al., 2006), where four levels wereidentified. Fig. 8(c) is the distribution of forest damage levels at thepixel level, derived from Step 6 of the rapid assessment algorithm.For the case of post-hurricane Katrina assessment, three levelswere selected at first, including light (Level 1), moderate (Level 2)and severe (Level 3) damage, as shown in Fig. 8(c). Pixels withoutdamage were in green, and those with land cover type other thanforest were masked in grey. Pixels in the same damage level weremapped separately, as shown in Fig. 8(d) (light damage, orange),Fig. 8(e) (moderate damage, red) and Fig. 8(f) (severe damage, darkred). Based on the density and continuity of individual damagelevel maps, Fig. 8(b), a map of general damage levels wasgenerated. The light damage level shown in Fig. 8(d) was separatedinto two levels, including light damage (orange belt in Fig. 8(b))and scattered light damage (grey area with orange dots inFig. 8(b)). Therefore, the general damage severity map had a totalof four levels, i.e. scattered light, light, moderate and severe.Compared with Fig. 8(a), the area combining severely and
moderately damage areas in Fig. 8(b) was similar to the severelydamage area estimated by the USDA Forest Service. The rapidassessment algorithm described in this paper was able todistinguish a new category of severity that represented the mostseverely damage area. The area with light damage in Fig. 8(b) wassimilar to the area with moderate damage in Fig. 8(a). The area inFig. 8(b) with scattered light damage was comparable to the areacombining the light and scatted light damage in Fig. 8(a).
5. Validation
The rapid assessment algorithm was validated using the groundtruth data investigated by the USDA Forest Service, FIA. The forestdamage estimated in the ground inventory for each plot wasrepresented as the percentage of basal area that suffered no, light,moderate or severe damage. To validate the rapid assessmentalgorithm, the ground damage data were converted to the totaldamage severity (DS) for each plot using:
DSi ¼ ai � biðg1 � Li þ g2 �Mi þ g3 � Si þ g4 � NiÞ (5)
where DSi stands for the total damage severity for the ith plot. Theai is a tree size factor for the ith plot (Eq. (6)),
ai ¼ðmean tree DBH at ith plotÞðmean tree DBH of all plotsÞ (6)
in which, DBH stands for the stem diameter at breast height. The bi
represents the effect of plot density for the ith plot (Eq. (7)),
bi ¼ðtree density at ith plotÞ
ðmaximum tree density of all plotsÞ (7)
The constants g1, g2, g3, and g4, are weight factors that measure therelative contribution of the four damage categories to the totaldamage severity. Li, Mi, Si and Ni are the percentage of basal areathat suffered no, light, moderate or severe damage for the ith plot,respectively.
Using Eqs. (5)–(7), the total damage severity for 54 plots wasderived. The DNDII2005 at these plots was retrieved using thenearest neighbor method. Despite the coarse damage categoriesused in the ground inventory, the scatter plot (Fig. 9) still showed alinear relationship between DNDII2005 and the total damageseverity. This indicates that DNDII can quantitatively measure thedamage severity of the hurricane-impacted forest region based ona strong linear relationship. The linear fitting line was y = a + bx,

W. Wang et al. / Agricultural and Forest Meteorology 150 (2010) 122–132 131
where a = �0.01, b = 1.06, r2 = 0.79, SD (standard deviation) = 0.03,p-value < 0.0001.
6. Conclusions
This study has developed a new approach for identifying forestregions impacted by hurricanes, and estimating damage severity.Using this approach, we have identified the impacted region andquantified the severity of forest damage post-Hurricane Katrina.The statistical analysis and comparison with the damage severityestimated by the USDA Forest Service revealed that DNDII was anoptimal indicator for detecting hurricane-induced forest damageout of five commonly used vegetation indices, including NDVI, EVI,NDII, LAI and Fpar. Validation of this rapid assessment algorithm,compared with field measurements in the De Soto NF, showed alinear relationship between DNDII and the total damage severitywith r2 = 0.79 and p-value < 0.0001.
This study has shown that hurricane-induced forest damageseverity can be quantified from satellite observed DNDII timeseries. However, DNDII presents primarily the change in total leafwater content in the forest canopy. The change of totalchlorophyll content carried by the visible spectra is notconsidered in this algorithm. To improve the accuracy of thisapproach, an indicator that can integrate changes caused by totalcanopy chlorophyll and water content variations still needs to beinvestigated. The normalized damage severity (Fig. 7) representsthe relative degrees of damage for a forest damage event. It is notsuitable for comparison among various cases. However, thedamage indicator DNDII, along with the forest type information,can be used to construct a standard damage severity scale forcross-case analysis. Additionally, the algorithm should be furthervalidated by application to other areas to determine if it can beused in other vegetation types with dissimilar levels of damage.Because our damage thresholds were determined from thestatistical properties of the data from the De Soto National Forest,it is likely that the thresholds in other forests would be different;such improvements could extend this approach to other post-disturbance assessments involving impacts on forest canopiessuch as insect or disease outbreaks or severe wildfire. The abilityto assess degrees of damage, and not just mortality, would bebeneficial in any schemes to compensate landowners forproviding ecosystem services such as payments for carbonsequestration (Patenaude et al., 2005), for example ReducedEmissions from Deforestation and Degradation (REDD; see Zarinet al., 2009). This would benefit government decision processesby providing objective evidence for verifying post-hurricanecompensation claims. For example, the European Union com-pensates member states for large-scale damage from wind andwildfire, and insurance schemes have been proposed tocompensate individual landowners (Holecy and Hanewinkel,2006). Providing that the MODIS NBAR product is available every8 days, this algorithm is able to evaluate post-hurricane forestdamage within a few weeks of an event.
Acknowledgements
This study was funded by the USDA Forest Service, SouthernResearch Station SRS-07-CA-11330136-167. The authors thank Dr.George Taylor, Dr. Ruixin Yang and the anonymous reviewers fortheir comments and suggestions.
References
Aosier, B., Kaneko, M., 2007. Evaluation of the forest damage by typhoon usingremote sensing technique. In: IEEE International Conference on Geoscience andRemote Sensing Symposium, IGARSS 2007, Barcelona, Spain, July 23–27.
Ayala-Silva, T., Twumasi, Y.A., 2004. Hurricane Georges and vegetation change inPuerto Rico using AVHRR satellite data. International Journal of Remote Sensing25 (9), 1629–1640.
Baisch, S., Bokelmann, G.H.R., 1999. Spectral analysis with incomplete time series:an example from seismology. Computers and Geosciences 25 (7), 739–750.
Boose, E.R., Foster, D.R., Fluet, M., 1994. Hurricane impacts to tropical and temperateforest landscapes. Ecological Monographs 64, 369–400.
Boutet Jr., J.C., Weishampel, J.F., 2003. Spatial pattern analysis of pre- and post-hurricane forest canopy structure in North Carolina, USA. Landscape Ecology 18,553–559.
Bowyer, P., Danson, F.M., 2004. Sensitivity of spectral reflectance to variation in livefuel moisture content at leaf and canopy level. Remote Sensing of Environment92, 297–308.
Bryant, D., Boykin, J., 2007. Fuels management on the National Forests in Mississippiafter Hurricane Katrina. In: Butler, Bret W.; Cook, Wayne, comps. The fireenvironment—innovations, management, and policy; conference proceedings.26–30 March 2007; Destin, FL. Proceedings RMRS-P-46CD. Fort Collins, CO: U.S.Department of Agriculture, Forest Service, Rocky Mountain Research Station.CD-ROM, pp. 287–292.
Ceccato, P., Flasse, S., Tarantola, S., Jacquemond, S., Gregoire, J.M., 2001. Detectingvegetation water content using reflectance in the optical domain. RemoteSensing of Environment 77, 22–33.
Chambers, J.Q., Fisher, J.I., Zeng, H., Chapman, E.L., Baker, D.B., Hurtt, G.C., 2007.Hurricane Katrina’s carbon footprint on US gulf coast forests. Science 318, 1107.
Clark, J., Finco, M., Schwind, B., Megown, K., 2006. Rapid assessment of forestdamage using multi-temporal Landsat TM imagery and high resolution aerialphotography. In: 8th Annual Forest Inventory and Analysis Symposium, Mon-terey, California, October 16–19.
Coppin, P., Jonckheere, I., Nackaerts, K., Muys, B., Lambin, E., 2004. Digital changedetection methods in ecosystem monitoring: a review. International Journal ofRemote Sensing 25 (9), 1565–1596.
Dwyer, E., Pasquali, P., Holecz, F., Arino, O., 1999. Mapping forest damage caused bythe 1999 Lothar Storm in Jura (France), using SAR Interferometry. ESA EarthObservation Quarterly 65, 28–29.
Floury, N., Toan, T.L., Souyris, J.C., Singh, K., Stussi, N., Hsu, C.C., Kong, J.A., 1997.Interferometry for forest studies. In: Proceedings of the Fringe 96 Workshop onERS SAR Interferometry, ESA SP-406, vol. 2, December 1997, Zurich, Switzer-land, September 30–October 2, 1996, pp. 57–70.
Foster, D.R., 1988. Species and stand response to catastrophic wind in central NewEngland, USA. Journal of Ecology 76, 135–151.
Fransson, J.E., Walter, F., Blennow, K., Gustavsson, A., Ulander, L.M.H., 2002. Detec-tion of storm-damaged forested areas using airborne CARABAS-II VHF SARimage data. IEEE Transactions on Geoscience and Remote Sensing 40 (10),2170–2175.
Gardner, L.R., Michener, W.K., Blood, E.R., Williams, T.M., Lipscomb, D.J., Jefferson,W.H., 1991. Ecological impact of Hurricane Hugo-salinization of a coastal forest.Journal of Coastal Research 8, 301–317.
Gill, A.M., Moore, J.R.L., Cheney, N.P., 1990. Fires and their effects on the wet-drytropics of Australia. In: Goldammer, J. (Ed.), Fire in the Tropical Biota: EcologicalStudies. Springer, Berlin, pp. 159–178.
Hardisky, M.A., Lemas, V., Smart, R.M., 1983. The influence of soil salinity, growthform, and leaf moisture on the spectral reflectance of Spartina alternifoliacanopies. Photogrammetric Engineering and Remote Sensing 49, 77–83.
Holecy, J., Hanewinkel, M., 2006. A forest management risk insurance model and itsapplication to coniferous stands in southwest Germany. Forest Policy andEconomics 8, 161–174.
Hook, D.D., Buford, M.A., Williams, T.M., 1991. The impact of Hurricane Hugo on theSouth Carolina coastal plain forest. Journal of Coastal Research 8, 291–300.
Huber, P., 1981. Robust Statistics. Wiley, New York.Huemmrich, K.F., Privette, J.L., Mukelabai, M., Myneni, R.B., Knyazikhin, Y., 2005.
Time-series validation of MODIS land biophysical products in a Kalahari wood-land, Africa. International Journal of Remote Sensing 26 (19), 4381–4398.
Huete, A., Justice, C., Leeuwen, W.V., 1999. MODIS vegetation index (MOD13)algorithm theoretical basis document. Link: http://modis.gsfc.nasa.gov/data/atbd/atbd_mod 13.pdf.
Hunt, E.R., Rock, B.N., 1989. Detection of changes in leaf water content using near-and middle-infrared reflectances. Remote Sensing of Environment 30, 43–54.
Jacobs, D.M., 2007. Forest inventory, catastrophic events and historic geospatialassessment in the South. In: Proceedings of the American Society of Photo-grammetry and Remote Sensing 2007 Annual Conference-Identifying Geospa-tial Solutions [CD-ROM], Society of Photogrammetry and Remote Sensing,Tampa, Florida, May 7–11.
Jasinski, M.F., 1990. Sensitivity of the normalized difference vegetation index tosubpixel canopy cover, soil albedo, and pixel scale. Remote Sensing of Environ-ment 32, 169–187.
Jin, S., Sader, S.A., 2005. Comparison of time-series tasseled cap wetness and thenormalized difference moisture index in detecting forest disturbances. RemoteSensing of Environment 94 (3), 364–372.
Knyazikhin, Y., Martonchik, J.V., Myneni, R.B., Diner, D.J., Running, S.W., 1998a.Synergistic algorithm for estimating vegetation canopy leaf area index andfraction of absorbed photosynthetically active radiation from MODIS and MISRdata. Journal of Geophysical Research 103, 32257–32276.
Knyazikhin, Y., Martonchik, J.V., Diner, D.J., Myneni, R.B., Verstraete, M., Pinty, B.,Gobron, N., 1998b. Estimation of vegetation canopy leaf area index and fractionof absorbed photosynthetically active radiation from atmosphere-correctedMISR data. Journal of Geophysical Research 103 (D24), 32239–32256.
W. Wang et al. / Agricultural and Forest Meteorology 150 (2010) 122–132132
Kovacs, J.M., Blanco-Correa, M., Flores-Verdugo, F., 2001. A logistic regression modelof hurricane impacts in a mangrove forest of the Mexican Pacific. Journal ofCoastal Research 17 (1), 30–37.
Kupfer, J.A., Myers, A.T., McLane, S.E., Melton, G.N., 2008. Patterns of forest damagein a southern Mississippi landscape caused by Hurricane Katrina. Ecosystems11, 45–60.
Lee, M., Lin, T., Vadeboncoeur, M.A., Hwong, J., 2008. Remote sensing assessment offorest damage in relation to the 1996 strong typhoon Herb at LienhuachiExperimental Forest, Taiwan. Forest Ecology and Management 255, 3297–3306.
Liu, K., Lu, H., Shen, C., 2003. Assessing the vulnerability of the Alabama Gulf Coast tointense hurricane strikes and forest fires in the light of long-term climaticchanges. In: Ning, Z.H., Turner, R.E., Doyle, T., Abdollahi, K.K. (Eds.), IntegratedAssessment of the Climate Change Impacts on the Gulf Coast Region. The GulfCoast Climate Change Assessment Council (GCRCC) and Louisana State Uni-versity (LSU) Graphic Services, Baton Rouge, pp. 223–230.
Loope, L., Duever, M., Herndon, A., Snyder, J., Jansen, D., 1994. Hurricane impact onuplands and freshwater swamp forest. Bioscience 44, 238–246.
McNulty, S.G., 2002. Hurricane impacts on US forest carbon sequestration. Envir-onmental Pollution 116, 17–24.
Meeker, J.R., Haley, T.J., Petty, S.D., Windham, J.W., 2006. Forest Health Evaluation ofHurricane Katrina damage on the De Soto National Forest. Report No. 2006-02-02, Forest Health Evaluation Alexandria Field Office, USDA Forest Service,Atlanta, GA.
Millward, A.A., Kraft, C.E., 2004. Physical influences of landscape on a large-extentecological disturbance: the northeastern North American ice storm of 1998.Landscape Ecology 19, 99–111.
Miranda, M.L., 1996. Final report: an evaluation of the Post-Hugo forest recoveryprograms: salvage, wildfire hazard mitigation and reforestation. In: Haymond,J.L., Hook, D.D., Harms, W.R. (Eds.), Hurricane Hugo: South Carolina Forest LandResearch and Management Related to the Storm. USDA Forest Service, GeneralTechnical Report SRS-5, pp. 498–532.
Myers, R.K., van Lear, D.H., 1998. Hurricane–fire interactions in coastal forests of thesouth: a review and hypothesis. Forest Ecology and Management 103, 265–276.
Patenaude, G., Milne, R., Dawson, T.P., 2005. Synthesis of remote sensing approachesfor forest carbon estimation: reporting to the Kyoto Protocol. EnvironmentalScience & Policy 8, 161–178.
Ramsey, E.W., Chappell, D.K., Baldwin, D.G., 1997. AVHRR imagery used to identifyhurricane damage in a forested wetland of Louisiana. Photogrammetric Engi-neering and Remote Sensing 63 (3), 293–297.
Ramsey, E.W., Chappell, D.K., Jacobs, D.M., Sapkota, S.K., Baldwin, D.G., 1998.Resource management of forested wetlands: hurricane impact and recoverymapped by combining Landsat TM and NOAA AVHRR data. PhotogrammetricEngineering and Remote Sensing 64 (7), 733–738.
Ramsey, E.W., Hodgson, M.E., Sapkota, S.K., Nelson, G.A., 2001. Forest impactestimated with NOAA AVHRR and Landsat TM data related to an empiricalhurricane wind-field distribution. Remote Sensing of Environment 77, 279–292.
Roberts, D.H., Lehar, J., Dreher, J.W., 1987. Time series analysis with CLEAN. I.Derivation of a spectrum. Astronomical Journal 93 (4), 968–989.
Sader, S.A., Bertrand, M., Wilson, E.H., 2003. Satellite change detection of forest harvestpatterns on an industrial forest landscape. Forest Science 49 (3), 341–353.
Schaaf, C.B., Gao, F., Strahler, A.H., Lucht, W., Li, X., Tsang, T., Strugnell, N.C., Zhang,X., Jin, Y., Muller, J.P., Lewis, P., Barnsley, M., Hobson, P., Disney, M., Roberts, G.,Dunderdale, M., Doll, C., d’Entremont, R., Hu, B., Liang, S., Privette, J.L., 2002. Firstoperational BRDF, Albedo and Nadir reflectance products from MODIS. RemoteSensing of Environment 83, 135–148.
Schlobohm, P., Brain, J., 2002. Gaining an Understanding of the National FireDamage Rating System. National Wildfire Coordinating Group, National Inter-agency Fire Center, Boise. PMS 932, NFES 2665.
Sellers, P.J., 1985. Canopy reflectance, photosynthesis, and transpiration. Interna-tional Journal of Remote Sensing 6, 1335–1372.
Sheffield, R.M., Thompson, M.T., 1992. Hurricane Hugo effects on South Carolina’sForest Resource. USDA Forest Service, Southeastern Forest Experiment StationResearch Paper SE-284.
Stanturf, J.A., Goodrick, S.L., Outcalt, K.W., 2007. Disturbance and coastal forests: astrategic approach to forest management in hurricane impact zones. ForestEcology and Management 250, 119–135.
Stueve, K.M., Lafon, C.W., Isaacs, R.E., 2007. Spatial patterns of ice storm disturbanceon a forested landscape in the Appalachian Mountains, Virginia. Areas 39 (1),20–30.
Tucker, C.J., 1979. Red and photographic infrared linear combinations for monitor-ing vegetation. Remote Sensing of Environment 8, 127–150.
Wade, D.D., Forbus, J.K., Saveland, J.M., 1993. Photo Series for Estimating Post-hurricane Residues and Fire Behavior in Southern Pine. USDA Forest Service,Southeastern Forest Experiment Station General Technical Report SE-82.
Wang, F., Xu, Y., 2009. Hurricane Katrina-induced forest damage in relation toecological factors at landscape scale. Environmental Monitoring and Assess-ment 156 (1–4), 491–507.
Wang, L., Qu, J.J., Xiong, J., Hao, X., Xie, Y., Che, N., 2006. A new method for retrievingBand 6 of Aqua MODIS. IEEE Geoscience and Remote Sensing Letters 3 (2), 267–270.
Wiesmann, A., Wegmuller, U., Honikel, M., Strozzi, T., Werner, C.L., 2001. Potentialand methodology of satellite based SAR for hazard mapping. In: Proceedings ofGeoscience and Remote Sensing Symposium, IGARSS 2001, Sydney, Australia,July 9–13.
Wilson, E.H., Sader, S.A., 2002. Detection of forest type using multiple dates ofLandsat TM imagery. Remote Sensing of Environment 80, 385–396.
Windham, J.W., 2005. Forest vegetation analysis, Hurricane Katrina damaged treeremoval and hazardous fuels treatment. USDA Forest Service, Link: http://www.fs.fed.us/r8/mississippi/katrina/EA/Supporting_Documentation/Katrina_Forest_Vegetation_Analysis.pdf (last accessed 10/22/2008).
Zarin, D., Angelsen, A., Brown, S., Loisel, C., Peskett, L., Streck, C. 2009. ReducingEmissions from Deforestation and Forest Degradation (REDD): An OptionsAssessment Report. Prepared for the Government of Norway. Meridian Insti-tute, available online at http://www.REDD-OAR.org.
Zhang, X., Friedl, M.A., Schaaf, C.B., Strahler, A.H., Hodges, J.C.F., Gao, F., Reed, B.C.,Huete, A., 2003. Monitoring vegetation phenology using MODIS. Remote Sen-sing of Environment 84, 471–475.