agreement no. ce 27/2007 (ep) upgrade of a regional air ... · privileged and confidential final...
TRANSCRIPT
Privileged and Confidential
Final Report Agreement No. CE 27/2007 (EP) Upgrade of a Regional
Air Quality Modelling System (PATH) –––– Feasibility Study
F I N AL
HK1100066
Final Report
Agreement No. CE 27/2007 (EP) Upgrade of a Regional Air Quality Modelling System (PATH)
– Feasibility Study
Prepared for:
Environmental Protection Department Hong Kong
Prepared by: ENVIRON Hong Kong Limited
Date: November, 2011
Project Number: HK1100066
Report Reference: R1703_V2.1

Privileged and Confidential
Final Report Agreement No. CE 27/2007 (EP) Upgrade of a Regional
Air Quality Modelling System (PATH) –––– Feasibility Study
F I N AL
HK1100066 i
Table of Contents
1. INTRODUCTION 1
1.1 Background 1
1.2 Objective 1
1.3 Organisation of the Report 1
2. SYSTEM OVERVIEW 1
2.1 Operating System Environment 1
2.2 Input /Output System 1
2.3 System Flow Diagram 2
2.4 Control Program 2
3. PATH EMISSION MODULE 1
3.1 Introduction 1
3.2 Overview of The Selected Models 1
3.2.1 SMOKE 1
3.2.2 CONCEPT 1
3.2.3 MEGAN 2
3.2.4 BEIS 2
3.3 Modelling Episodes for PATH Testing 3
3.3.1 Selected Modelling Episodes 3
3.3.2 Modelling Year for Emission Inventories 3
3.3.3 Emission Modelling Temporal Periods 3
3.3.4 Forecast Year Demonstration 3
3.4 Modelling Domains 3
3.4.1 Horizontal Modelling Domain 3
3.4.2 Vertical Modelling Domain 6
3.5 Model Input preparation 8
3.5.1 Set-up of SMOKE and CONCEPT 8
3.5.2 Emissions Data Availability 8
3.5.3 Spatial Surrogate Data 9
3.5.4 Temporal Allocation Data 9
3.5.5 Chemical Speciation Profile Data 9
3.5.6 Development of Point Source Emissions Inputs/ Area and Non-Road Source Emissions Inputs 9
Privileged and Confidential
Final Report Agreement No. CE 27/2007 (EP) Upgrade of a Regional
Air Quality Modelling System (PATH) –––– Feasibility Study
F I N AL
HK1100066 ii
3.5.7 Development of Non-Link On-Road Mobile Source Emissions 9
3.5.8 Development of Biogenic Source Emissions 9
3.6 Quality Assurance Plan 10
4. THE PATH METEOROLOGICAL MODEL 11
4.1 Introduction 11
4.2 Methodology 11
4.2.1 Model Selection 11
4.2.2 MM5 Modelling System 11
4.2.3 The Weather research and Forecasting Model (WRF) 13
4.2.4 WRF ARW Configuration 14
4.2.5 Model Input Data 14
4.2.6 Modelling Domain 14
4.3 Performance Evaluation 17
4.3.1 Statistical Evaluation 17
4.3.2 The METSTAT Programe 18
4.3.3 Qualitative Model Evaluation Results 18
4.3.4 Quantitative Model Evaluation Results 20
4.3.5 Scatter Plots of Observation vs. Model (Surface Winds and Temperature) 20
4.3.6 Comparison of MM5/WRF Radiation and PBL Height with Data from HKO at King’s Park 21
4.4 Sensitivity Runs 21
4.4.1 Analyses of the Sensitivity Runs 21
5. TRANSPORT DATA COMPILATION AND MODELLING 23
5.1 Introduction 23
5.2 EMFAC-HK 23
5.3 MOBILE6-HK 24
5.4 CONCEPT-HK for Estimating Link-Level Emissions 25
5.4.1 Link-Level Activity Data 26
5.4.2 HKSAR TDM Data 26
5.4.3 Estimation of Overnight Link Volumes 26
5.4.4 Speed Adjustment 27
5.4.5 Weekday/Weekend Time Period 27
5.4.6 Back-Casting and Growth 27
5.4.7 Supplement local VKT 27
5.5 Temporal profiles 27
5.6 Results of the four Episodes 28
Privileged and Confidential
Final Report Agreement No. CE 27/2007 (EP) Upgrade of a Regional
Air Quality Modelling System (PATH) –––– Feasibility Study
F I N AL
HK1100066 iii
6. CHEMICAL TRANSPORT MODEL 34
6.1 Introduction 34
6.2 Model Selection 34
6.2.1 Community Multiscale Air Quality (CMAQ) Modelling System 34
6.2.2 Comprehensive Air-Quality Model with Extensions (CAMx) 34
6.3 Modelling Domains and Data Availability 35
6.3.1 Horizontal Modelling Domain 35
6.3.2 Vertical layer 36
6.3.3 Data Availability 36
6.4 Model Input Preparation Procedures 36
6.4.1 Meteorological Inputs 36
6.4.2 Development of Emission Inputs 37
6.4.3 Development of Initial and Boundary Conditions 37
6.5 Initial Model Performance Evaluation 37
6.5.1 Overview 37
6.5.2 Model Performance Evaluation Conclusions 38
6.6 Diagnostic Sensitivity Test 38
6.7 Final Model Configuration 42
7. DATA ANALYSIS AND VISUALISATION SOFTWARE IMPLEMENTATION 45
7.1 Overview 45
7.2 Meteorological Model (MM) Analysis and Visualisation 45
7.2.1 MM Model Evaluation 45
7.2.2 The METSTAT Program 45
7.2.3 MM Visualization Software 47
7.3 EMISSIONS MODELLING (EM) ANALYSIS AND VISUALISATION 51
7.3.1 SMOKE Reports 51
7.3.2 EM Visualization Software 52
7.4 Chemical Transport Modelling (CTM) Analysis and Visualisation 52
7.4.1 UCR Analysis Tool 52
7.4.2 ENVIRON Model Performance Software 54
7.5 CTM Visualisation Software 54
8. SYSTEM OPTIMIZATION AND DEMONSTRATION 56
8.1 Definitions of Final Sensitivity Tests 56
8.2 Updated to Latest Versions of the CTMs 56
8.3 Diagnostic Analysis of the July 2006 Episode 57
8.4 Source Apportionment Modelling 58
Privileged and Confidential
Final Report Agreement No. CE 27/2007 (EP) Upgrade of a Regional
Air Quality Modelling System (PATH) –––– Feasibility Study
F I N AL
HK1100066 iv
8.5 Final Optimization and Demonstration Run Results 62
8.6 Final optimization and Demonstration Run Conclusion 66
9. POST IMPLEMENTATION REVIEW 67
9.1 EPD Forecasting Methodology 67
9.2 Post Implementation Review Report Evaluation 67
9.3 Ozone Evaluation 68
9.4 2010 Annual Evaluation all Species 74
9.5 2010 Episodic Model Performance Evaluation 77
9.5.1 September 8-10, 2010 77
9.5.2 September 18-20, 2011 77
9.5.3 August 28-31, 2010 81
9.5.4 October 23-25, 2010 81
9.6 Post Implementation Review Conclusions 85
10. CONCLUSIONS 86
11. REFERENCES 87
Tables
Table 3-1. Selected Modelling Episode Definitions. 3
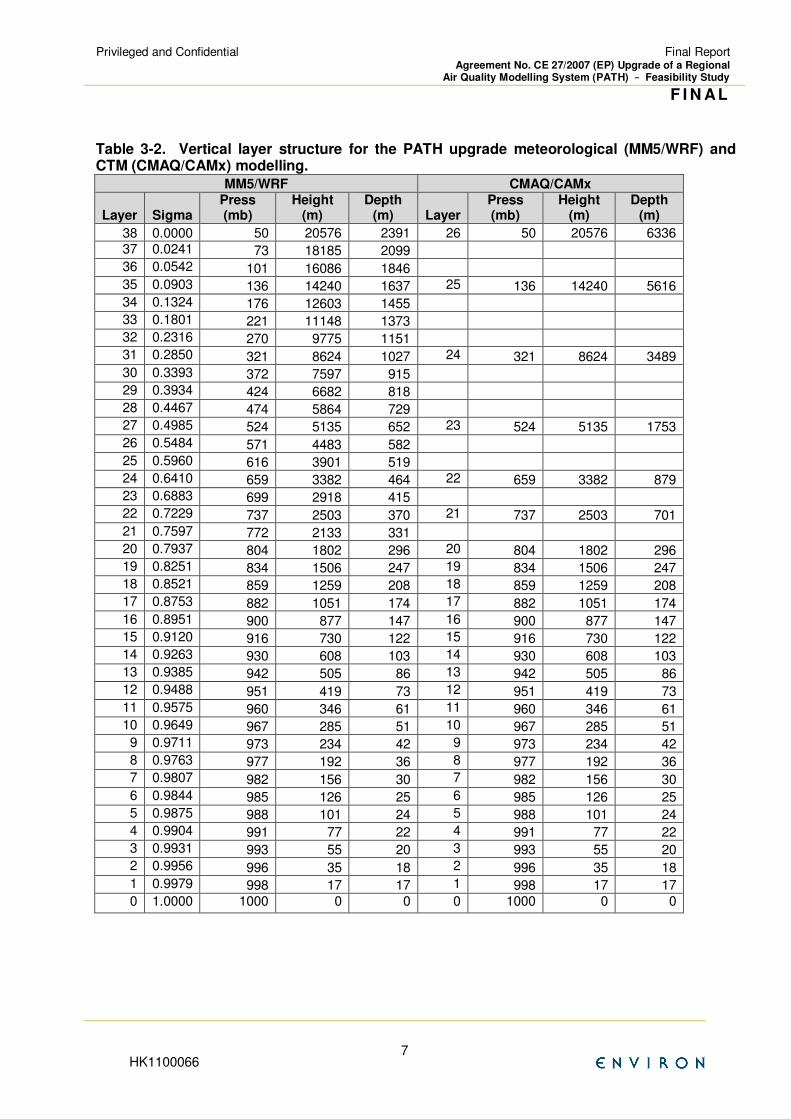
Table 3-2. Vertical layer structure for the PATH upgrade meteorological (MM5/WRF)
and CTM (CMAQ/CAMx) modelling. 7
Table 5-1. Summary of similarities and differences between EMFAC-HK and
MOBILE6-HK. 25
Table 6-1. Diagnostic sensitivity tests performed as part of the PATH upgrade
study. 40
Table 6-2. Comparison of model sensitivity tests to examine model sensitivity to
specific models, configuration and options. 41
Table 6-3. Initial and final configuration for the CMAQ modelling system in the
PATH upgrade project. 43
Table 6-4. Initial and final configuration of the CAMx modelling system used in the
PATH upgrade project. 44
Table 8-1. Final ten CTM sensitivity tests to identify optimal CTM configuration for
the final demonstration runs and investigate model performance for the
July 2006 episode (Episode 3). 56
Table 8-2. Comparison of CAMx hourly ozone fractional bias using a 40 ppb
observed concentration cutoff using combinations of the MM5 and WRF
meteorological, emissions and Kz inputs (Episode 3, July 2006). 58

Privileged and Confidential
Final Report Agreement No. CE 27/2007 (EP) Upgrade of a Regional
Air Quality Modelling System (PATH) –––– Feasibility Study
F I N AL
HK1100066 v
Table 9-1. Ozone model performance metrics for the 2010 CMAQ demonstration
run and comparisosn with USEPA’s ozone performance goals
(EPA, 1991). 69
Privileged and Confidential
Final Report Agreement No. CE 27/2007 (EP) Upgrade of a Regional
Air Quality Modelling System (PATH) –––– Feasibility Study
F I N AL
HK1100066 vi
Figures
Figure 2-1. PATH System diagram. 1
Figure 3-1. 27-km MM5 domain with the 27-km CTM domain (red) and the 9-km
MM5 domain (blue). 4
Figure 3-2. 27-km CTM domain with the 9-km MM5 domain (blue) and the 9-km
CTM domain (red). 5
Figure 3-3. 9-km CTM domain with the 3-km MM5 domain (blue) and the 3-km CTM
domain (red). 5
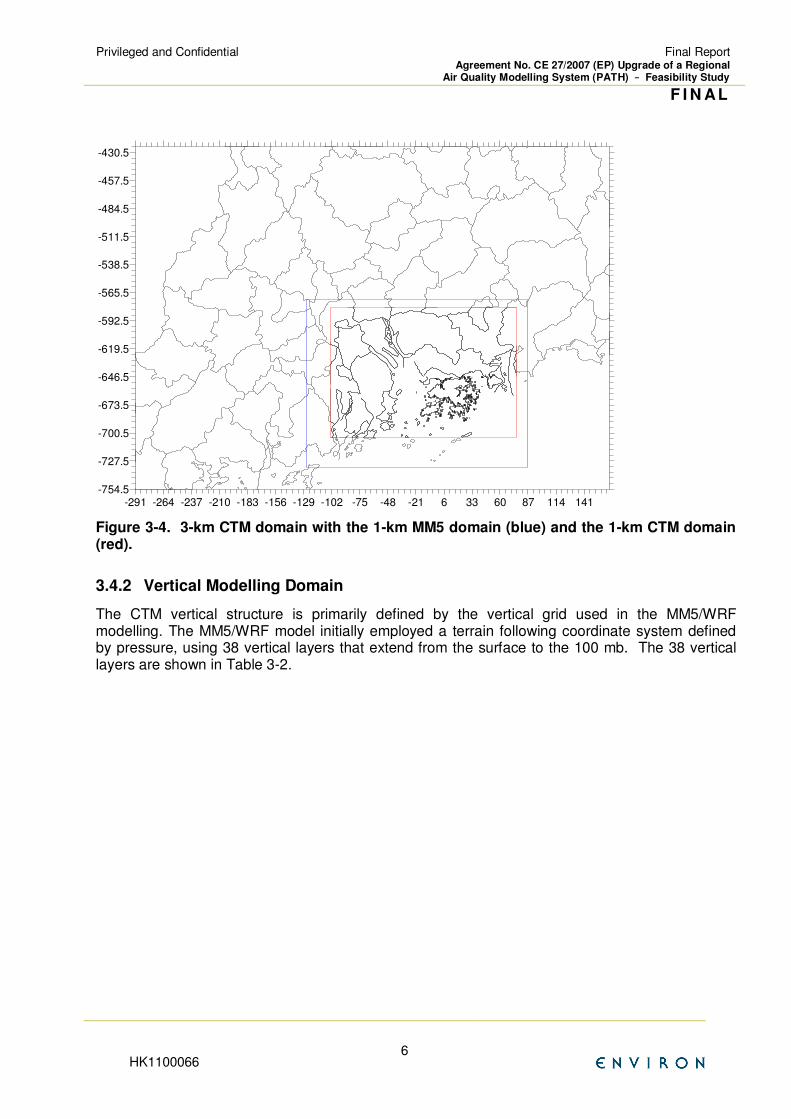
Figure 3-4. 3-km CTM domain with the 1-km MM5 domain (blue) and the 1-km CTM
domain (red). 6
Figure 4-1. The MM5 Modelling System Flow Chart. 12
Figure 4-2. The WRF ARW Modelling System Flow Chart. 13
Figure 4-3. Dimension and terrain (m) of the 27 km domain (D1) for the
meteorological models. 15
Figure 4-4. Dimension and terrain (m) of the 9 km domain (D2) for the
meteorological models. 15
Figure 4-5. Dimension and terrain (m) of the 3 km domain (D3) for the
meteorological models. 16
Figure 4-6. Dimension and terrain (m) of the 1 km domain (D4) for the
meteorological models. 16
Figure 5-1a. VKT mix by hour of day, 2003 episode weekday. 29
Figure 5-1b. VKT mix by hour of day, 2003 episode Saturday. 29
Figure 5-1c. VKT mix by hour of day, 2003 episode Sunday. 30
Figure 5-2a. TOG emissions by episode day and emissions mode, 2004 episode. 30
Figure 5-3b. NOx emissions by episode day and vehicle class, 2004 episode. 32
Figure 5-4a. PM2.5 emissions by episode day and emissions mode, 2004 episode. 32
Figure 5-4b. PM2.5 emissions by episode day and vehicle class, 2004 episode. 33
Figure 5-5. Example PAVE plot of gridded model-ready PM emissions. 33
Figure 6-1. Definition of the 27/9/3/1 km modelling domain used for the CTM and EM
modelling in the upgraded modelling system for the EPD. 35
Figure 6-2. Definition of the nested 3 km and 1 km modelling domains for the
upgraded EPD modelling system. 36
Figure 7-1. Daily statistics comparing in Domain 3 (GTS stations) wind observations
to paired MM5 wind predictions from control run in the 3-km domain
during the Sep-Oct 2004 episode. 46
Figure 7-2. Example PAVE plots: u component winds (top left); v component winds
(top right); w component winds (bottom left); air temperature (bottom
right). 48
Figure 7-3. Example VERDI plots: u component winds (top left); v component winds
(top right); horizontal wind vectors (bottom left); time series plot of air
temperature averaged by whole domain in first layer (bottom right). 48
Figure 7-4. Example Vis5D display for wind speed (m/s) at ground level. 49
Privileged and Confidential
Final Report Agreement No. CE 27/2007 (EP) Upgrade of a Regional
Air Quality Modelling System (PATH) –––– Feasibility Study
F I N AL
HK1100066 vii
Figure 7-5. HYSPLIT 24-hr backward trajectories (every 1h) calculated by the wind
field from MM5 simulations. The end points are at 100m AGL at HKIA
(red) and HKO (blue). 50
Figure 7-6. Example display generated using Python scripts. 51
Figure 7-7. Spatial displays of daily total on-road mobile TOG emissions in the 3 km
modelling domain generated with VERDI. 52
Figure 7-8. Time series of predicted and observed PM2.5 concentrations at the Tsuen
Wan monitoring site for the initial (run2, dark blue) and revised (run2.a0,
light blue) MM5/CMAQ preliminary base case simulation for episode#1. 53
Figure 7-9. Scatter plot of predicted and observed ozone concentrations for the initial
(run2, dark blue) and revised (run2.a0, light blue) MM5/CMAQ
preliminary base case simulation for episode#1. 53
Figure 7-10a. Example VERDI spatial tile plots of CMAQ-estimate ozone
concentrations for Julian Day 259 from Episode#1 (Sep-Oct 2004). 54
Figure 7-10b. Example VERDI spatial tile plots of CMAQ-estimate PM2.5
concentrations for Julian Day 259 from Episode#1 (Sep-Oct 2004). 55
Figure 8-1. Time series of predicted and observed (red) hourly ozone concentrations
(top) for CAMx/MM5 (blue) and CAMx/WRF (purple) and ozone source
apportionment results for CAMx/MM5 (left) and CAMx/WRF (right) on
June 24, 2006 (middle) and June 25, 2006 (bottom) at TC. 59
Figure 8-2a. PM source apportionment results for Tung Chung (TC) and PM2.5
concentrations on July 24, 2006 (205) using MM5 (middle) and WRF
(bottom) meteorological inputs. 60
Figure 8-2b. PM source apportionment results for Tung Chung (TC) and PM2.5
concentrations on July 25, 2006 (206) using MM5 (middle) and WRF
(bottom) meteorological inputs. 61
Figure 8-3. Comparison of ozone model performance on July 23-25, 2006 for the
CMAQ V4.71 (left) and CAMx V5.3 (right) final optimisation and
demonstration runs using MM5 and WRF meteorological inputs at the Tung
Chung (top) and Yuen Long (bottom) monitoring sites. 63
Figure 8-4. Comparison of PM2.5 model performance on July 23-25, 2006 for the
CMAQ V4.71 (left) and CAMx V5.3 (right) final optimisation and
demonstration runs using MM5 and WRF meteorological inputs at the
Tung Chung (top) and Yuen Long (bottom) monitoring sites. 64
Figure 8-5. Comparison of Sulfate (SO4, top) and Organic Aerosol (OA, bottom)
model performance on July 23-25, 2006 for the CMAQ V4.71 (left) and
CAMx V5.3 (right) final optimisation and demonstration runs using MM5
and WRF meteorological inputs at the Yuen Long monitoring sites. 65
Figure 9-1a. Ozone fractional bias and gross error by monitoring site for January 2010
and CMAQ forecast demonstration run (USEPA performance goals of
FBias ≤ ±15% and FError ≤ 35%). 70
Figure 9-1b. Ozone fractional bias and gross error by monitoring site for April 2010
and CMAQ forecast demonstration run (USEPA performance goals of
FBias ≤ ±15% and FError ≤ 35%). 71
Privileged and Confidential
Final Report Agreement No. CE 27/2007 (EP) Upgrade of a Regional
Air Quality Modelling System (PATH) –––– Feasibility Study
F I N AL
HK1100066 viii
Figure 9-1c. Ozone fractional bias and gross error by monitoring site for August 2010
and CMAQ forecast demonstration run (USEPA performance goals of
FBias ≤ ±15% and FError ≤ 35%). 72
Figure 9-1d. Ozone fractional bias and gross error by monitoring site for October 2010
and CMAQ forecast demonstration run (USEPA performance goals of
FBias ≤ ±15% and FError ≤ 35%). 73
Figure 9-2a. Scatter plots of predicted and observed hourly ozone (top), NO2 (middle)
and NO (bottom) concentrations for January 1 – September 17, 2010
(left) and September 18-December 31, 2010 (right) and the 2010 CMAQ
forecast demonstration run. 75
Figure 9-2b. Scatter plots of predicted and observed hourly PM2.5 (top), SO2 (middle)
and CO (bottom) concentrations for January 1 – September 17, 2010
(left) and September 18 - December 31, 2010 (right) and the 2010
CMAQ forecast demonstration run. 76
Figure 9-3. Time series of predicted and observed hourly ozone concentrations at
six Hong Kong monitoring sites for September 8-10, 2010. 78
Figure 9-4. Time series of predicted and observed hourly PM2.5 concentrations at
six Hong Kong monitoring sites for September 8-10, 2010. 79
Figure 9-5. Time series of predicted and observed hourly PM2.5 concentrations at
six Hong Kong monitoring sites for September 18-20, 2010. 80
Figure 9-6. Time series of predicted and observed hourly ozone concentrations at
six Hong Kong monitoring sites for August 28-31, 2010. 82
Privileged and Confidential
Final Report Agreement No. CE 27/2007 (EP) Upgrade of a Regional
Air Quality Modelling System (PATH) –––– Feasibility Study
F I N AL
HK1100066 1
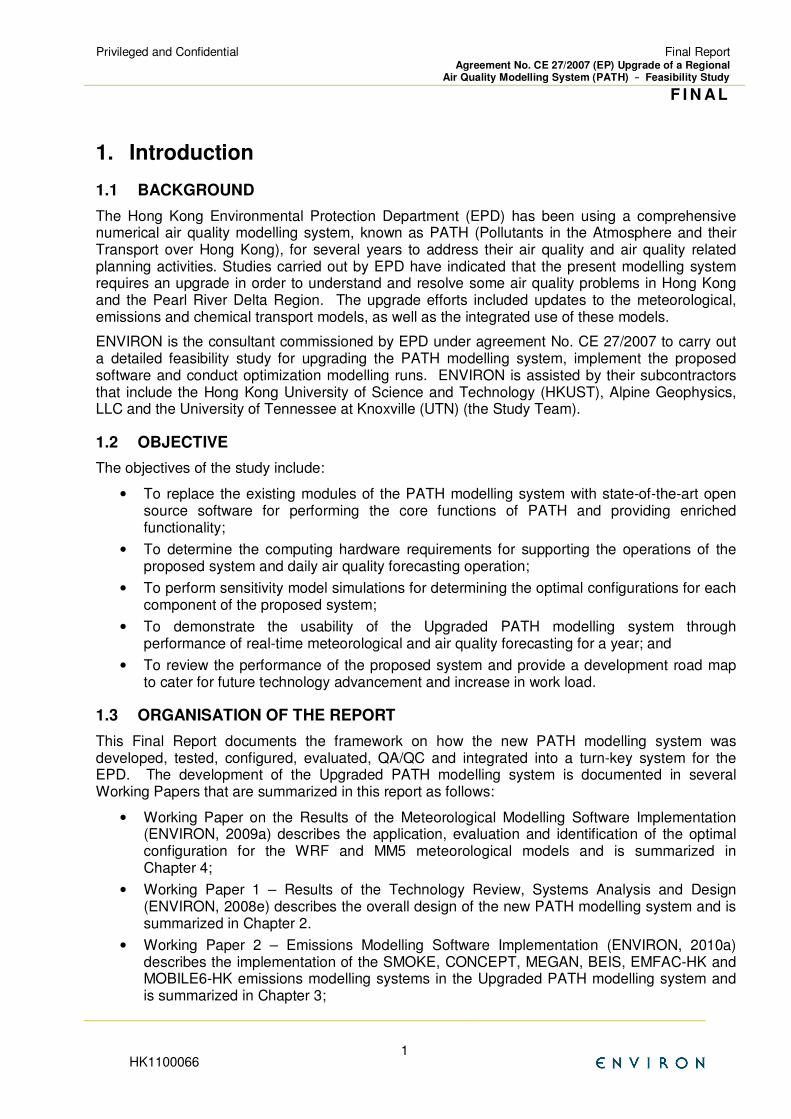
1. Introduction
1.1 BACKGROUND
The Hong Kong Environmental Protection Department (EPD) has been using a comprehensive numerical air quality modelling system, known as PATH (Pollutants in the Atmosphere and their Transport over Hong Kong), for several years to address their air quality and air quality related planning activities. Studies carried out by EPD have indicated that the present modelling system requires an upgrade in order to understand and resolve some air quality problems in Hong Kong and the Pearl River Delta Region. The upgrade efforts included updates to the meteorological, emissions and chemical transport models, as well as the integrated use of these models.
ENVIRON is the consultant commissioned by EPD under agreement No. CE 27/2007 to carry out a detailed feasibility study for upgrading the PATH modelling system, implement the proposed software and conduct optimization modelling runs. ENVIRON is assisted by their subcontractors that include the Hong Kong University of Science and Technology (HKUST), Alpine Geophysics, LLC and the University of Tennessee at Knoxville (UTN) (the Study Team).
1.2 OBJECTIVE
The objectives of the study include:
• To replace the existing modules of the PATH modelling system with state-of-the-art open source software for performing the core functions of PATH and providing enriched functionality;
• To determine the computing hardware requirements for supporting the operations of the proposed system and daily air quality forecasting operation;
• To perform sensitivity model simulations for determining the optimal configurations for each component of the proposed system;
• To demonstrate the usability of the Upgraded PATH modelling system through performance of real-time meteorological and air quality forecasting for a year; and
• To review the performance of the proposed system and provide a development road map to cater for future technology advancement and increase in work load.
1.3 ORGANISATION OF THE REPORT
This Final Report documents the framework on how the new PATH modelling system was developed, tested, configured, evaluated, QA/QC and integrated into a turn-key system for the EPD. The development of the Upgraded PATH modelling system is documented in several Working Papers that are summarized in this report as follows:
• Working Paper on the Results of the Meteorological Modelling Software Implementation (ENVIRON, 2009a) describes the application, evaluation and identification of the optimal configuration for the WRF and MM5 meteorological models and is summarized in Chapter 4;
• Working Paper 1 – Results of the Technology Review, Systems Analysis and Design (ENVIRON, 2008e) describes the overall design of the new PATH modelling system and is summarized in Chapter 2.
• Working Paper 2 – Emissions Modelling Software Implementation (ENVIRON, 2010a) describes the implementation of the SMOKE, CONCEPT, MEGAN, BEIS, EMFAC-HK and MOBILE6-HK emissions modelling systems in the Upgraded PATH modelling system and is summarized in Chapter 3;
Privileged and Confidential
Final Report Agreement No. CE 27/2007 (EP) Upgrade of a Regional
Air Quality Modelling System (PATH) –––– Feasibility Study
F I N AL
HK1100066 2
• Working Paper 3 – Transportation Data Compilation and Modelling Implementation (ENVIRON, 2010b) describes the traffic demand modelling (TDM)of the Hong Kong region that was used to define link-based vehicle data for use with the CONCEPT-MV emissions modelling system and is described in Chapter 5.
• Working Paper 4 – Chemical Transport Modelling Software Implementation (ENVIRON, 2010c) describes the initial application and evaluation of the CMAQ and CAMx Chemical Transport Models (CTMs) for the four demonstration episodes and is described in Chapter 6;
• Working Paper 6 – Data Analysis and Visualization Software Implementation (ENVIRON, 2010d) describes the various software used to analyze and visualize the Upgraded PATH modelling system results. Examples of the data analysis and visualization software are presented in Chapter 7;
• Working Paper 8 – System Optimisation and Demonstration Model Run (ENVIRON, 2011) discusses the final CTM sensitivity simulations designed to identify the optimal CTM configuration for simulating air quality in the HK/PRD region. This report also presents ozone and PM source apportionment modelling results and is summarized in Chapter 8;
• Working Paper on the Systems Integration, Installation and Testing (ENVIRON, 2010e) describes how the Upgraded PATH modelling system was installed and tested on the EPD computer systems; and
• Working Paper 9 – Post Implementation Review (ENVIRON, 2010f) evaluates the Upgraded PATH modelling system run in real-time forecast mode for the August-November 2010 period. In this report this evaluation is expanded to the entire 2010 calendar year and is presented in Chapter 9 and Appendix A.
Privileged and Confidential
Final Report Agreement No. CE 27/2007 (EP) Upgrade of a Regional
Air Quality Modelling System (PATH) –––– Feasibility Study
F I N AL
HK1100066 1
2. System Overview
2.1 OPERATING SYSTEM ENVIRONMENT
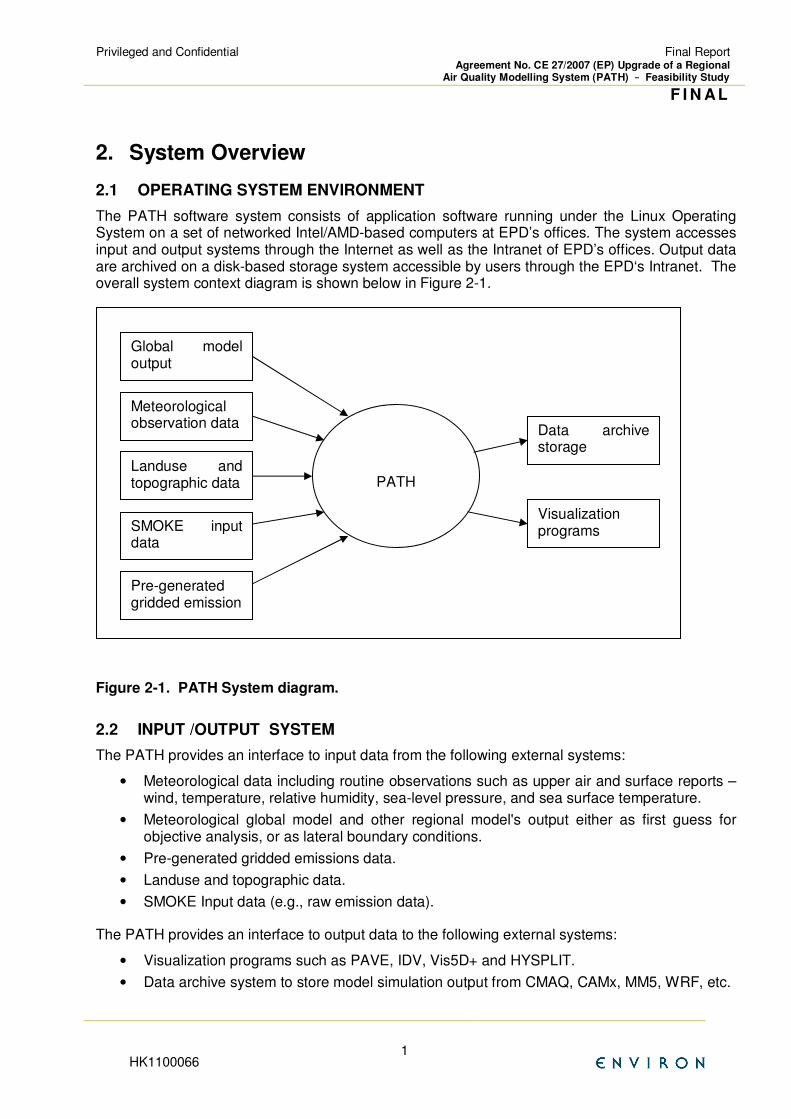
The PATH software system consists of application software running under the Linux Operating System on a set of networked Intel/AMD-based computers at EPD’s offices. The system accesses input and output systems through the Internet as well as the Intranet of EPD’s offices. Output data are archived on a disk-based storage system accessible by users through the EPD‘s Intranet. The overall system context diagram is shown below in Figure 2-1.
Figure 2-1. PATH System diagram.
2.2 INPUT /OUTPUT SYSTEM
The PATH provides an interface to input data from the following external systems:
• Meteorological data including routine observations such as upper air and surface reports – wind, temperature, relative humidity, sea-level pressure, and sea surface temperature.
• Meteorological global model and other regional model's output either as first guess for objective analysis, or as lateral boundary conditions.
• Pre-generated gridded emissions data.
• Landuse and topographic data.
• SMOKE Input data (e.g., raw emission data).
The PATH provides an interface to output data to the following external systems:
• Visualization programs such as PAVE, IDV, Vis5D+ and HYSPLIT.
• Data archive system to store model simulation output from CMAQ, CAMx, MM5, WRF, etc.
Global model output
Pre-generated gridded emission
PATH
Meteorological observation data
Landuse and topographic data
SMOKE input data
Data archive storage
Visualization programs
Privileged and Confidential
Final Report Agreement No. CE 27/2007 (EP) Upgrade of a Regional
Air Quality Modelling System (PATH) –––– Feasibility Study
F I N AL
HK1100066 2
2.3 SYSTEM FLOW DIAGRAM
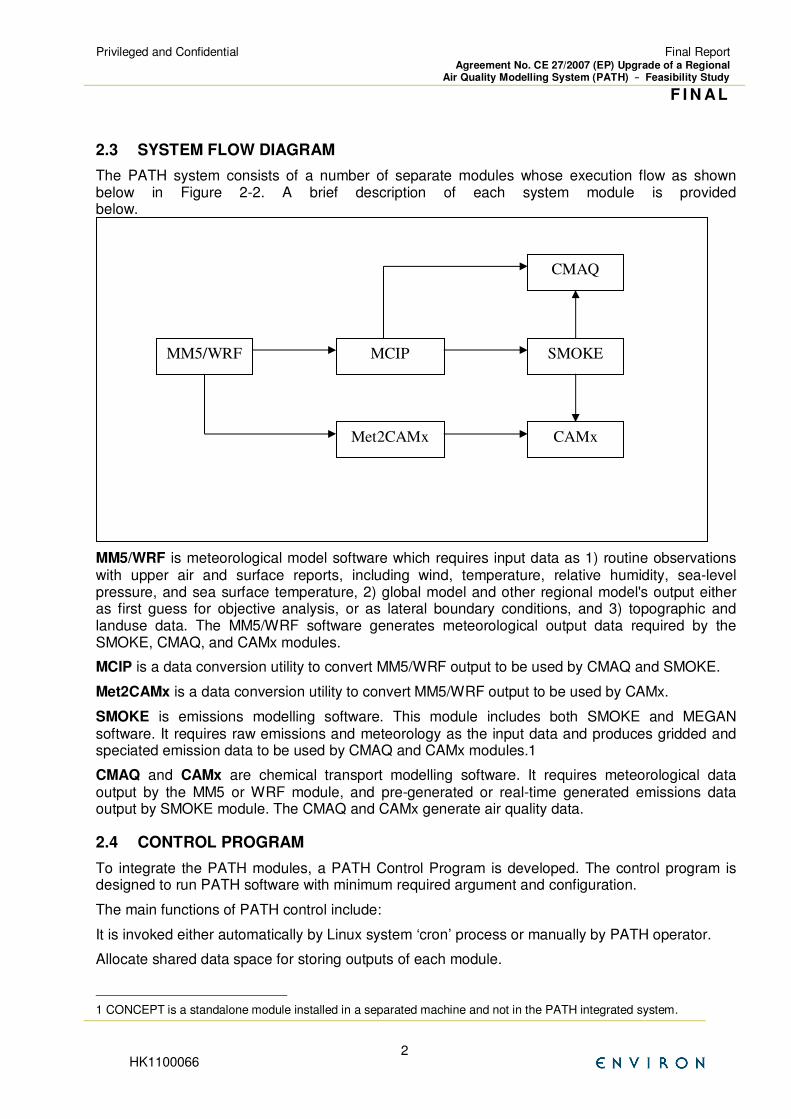
The PATH system consists of a number of separate modules whose execution flow as shown below in Figure 2-2. A brief description of each system module is provided below.
MM5/WRF is meteorological model software which requires input data as 1) routine observations with upper air and surface reports, including wind, temperature, relative humidity, sea-level pressure, and sea surface temperature, 2) global model and other regional model's output either as first guess for objective analysis, or as lateral boundary conditions, and 3) topographic and landuse data. The MM5/WRF software generates meteorological output data required by the SMOKE, CMAQ, and CAMx modules.
MCIP is a data conversion utility to convert MM5/WRF output to be used by CMAQ and SMOKE.
Met2CAMx is a data conversion utility to convert MM5/WRF output to be used by CAMx.
SMOKE is emissions modelling software. This module includes both SMOKE and MEGAN software. It requires raw emissions and meteorology as the input data and produces gridded and speciated emission data to be used by CMAQ and CAMx modules.1
CMAQ and CAMx are chemical transport modelling software. It requires meteorological data output by the MM5 or WRF module, and pre-generated or real-time generated emissions data output by SMOKE module. The CMAQ and CAMx generate air quality data.
2.4 CONTROL PROGRAM
To integrate the PATH modules, a PATH Control Program is developed. The control program is designed to run PATH software with minimum required argument and configuration.
The main functions of PATH control include:
It is invoked either automatically by Linux system ‘cron’ process or manually by PATH operator.
Allocate shared data space for storing outputs of each module.
1 CONCEPT is a standalone module installed in a separated machine and not in the PATH integrated system.
MM5/WRF
CAMx Met2CAMx
SMOKE MCIP
CMAQ

Privileged and Confidential
Final Report Agreement No. CE 27/2007 (EP) Upgrade of a Regional
Air Quality Modelling System (PATH) –––– Feasibility Study
F I N AL
HK1100066 3
Start up meteorological module, MM5 or WRF, in forecast mode or project mode.
Run MCIP or Met2CAMx to convert meteorological data to the format ready to be used by SMOKE, CMAQ, or CAMx.
If in project mode, start up emission model SMOKE to generate gridded emission data.
Start up CMAQ or CAMx model software. If it is in forecast mode, CMAQ/CAMx uses pre-generated gridded emission data. If project mode, CMAQ/CAMx uses gridded emission data generated by SMOKE in step e).
Keep track of status of each module in software system log.
If any module is failed due to unrecoverable error, it stops the rest of PATH software modules, and exits with error status.
Report the software run status to the PATH operator by email if it is configured.
Privileged and Confidential
Final Report Agreement No. CE 27/2007 (EP) Upgrade of a Regional
Air Quality Modelling System (PATH) –––– Feasibility Study
F I N AL
HK1100066 1
3. PATH Emission Module
3.1 INTRODUCTION
The Study Team has obtained and installed the most current versions (at the time of the project inception) of the SMOKE, CONCEPT and MEGAN emissions modelling systems and updated various components, as necessary, to the latest science, including capability of generating emissions inputs for the CB05 and SAPRC99 chemical mechanisms, along with interface to both the MM5 and WRF meteorological models. Geophysical data used for spatial allocation of emissions, temporal allocation factors and speciation profile data have all been reviewed and updated into the modelling systems.
The raw emission data for point, area, non-link mobile and marine sources, provided by EPD, has been reviewed and incorporated into the SMOKE and CONCEPT emission models. SMOKE and CONCEPT have been exercised to generate hourly gridded and speciated emission inputs for the CMAQ and CAMx models for the three one-week and one one-month episodes considered in the Study.
Biogenic emission inventories have been developed using both the Biogenic Emission Inventory System (BEIS), and the Model of Emissions of Gases and Aerosols from Nature (MEGAN) using meteorological data generated by the MM5 meteorological model.
3.2 OVERVIEW OF THE SELECTED MODELS
3.2.1 SMOKE
The Sparse Matrix Operator Kernel Emissions (SMOKE) is principally an emission processing system and not a true emissions modelling system in which emissions estimates are simulated from ‘first principles’. This means that, with the exception of mobile and biogenic sources, its purpose is to provide an efficient, modern tool for converting emissions inventory data into the formatted emission files required by an air quality simulation model.
SMOKE was originally designed to allow emissions data processing methods to utilize emergent high-performance-computing (HPC) as applied to sparse-matrix algorithms. Indeed, SMOKE is the fastest emissions processing tool currently available to the air quality modelling community. The sparse matrix approach utilized throughout SMOKE permits both rapid and flexible processing of emissions data. The processing is rapid because SMOKE utilizes a series of matrix calculations instead of less efficient algorithms used in previous systems. The processing is flexible because the processing steps of temporal projection, controls, chemical speciation, temporal allocation, and spatial allocation have been separated into independent operations wherever possible. The results from these steps are merged together at a final stage of processing.
3.2.2 CONCEPT
The Consolidated Community Emissions Processing Tool (CONCEPT) is a new emissions processing model that performs the three key features of emissions processing models: temporal allocation of the emissions (to hourly), spatial allocation of the hourly emissions to the grid cells in the modelling domain, and emissions speciation for use in air quality modelling.
The CONCEPT emissions model has been developed in a modular fashion, with five primary source category models, and a group of secondary support models that will serve each of the primary models. The major emission source categories are treated as the primary models:
• Area Source;
• Point Source;
Privileged and Confidential
Final Report Agreement No. CE 27/2007 (EP) Upgrade of a Regional
Air Quality Modelling System (PATH) –––– Feasibility Study
F I N AL
HK1100066 2
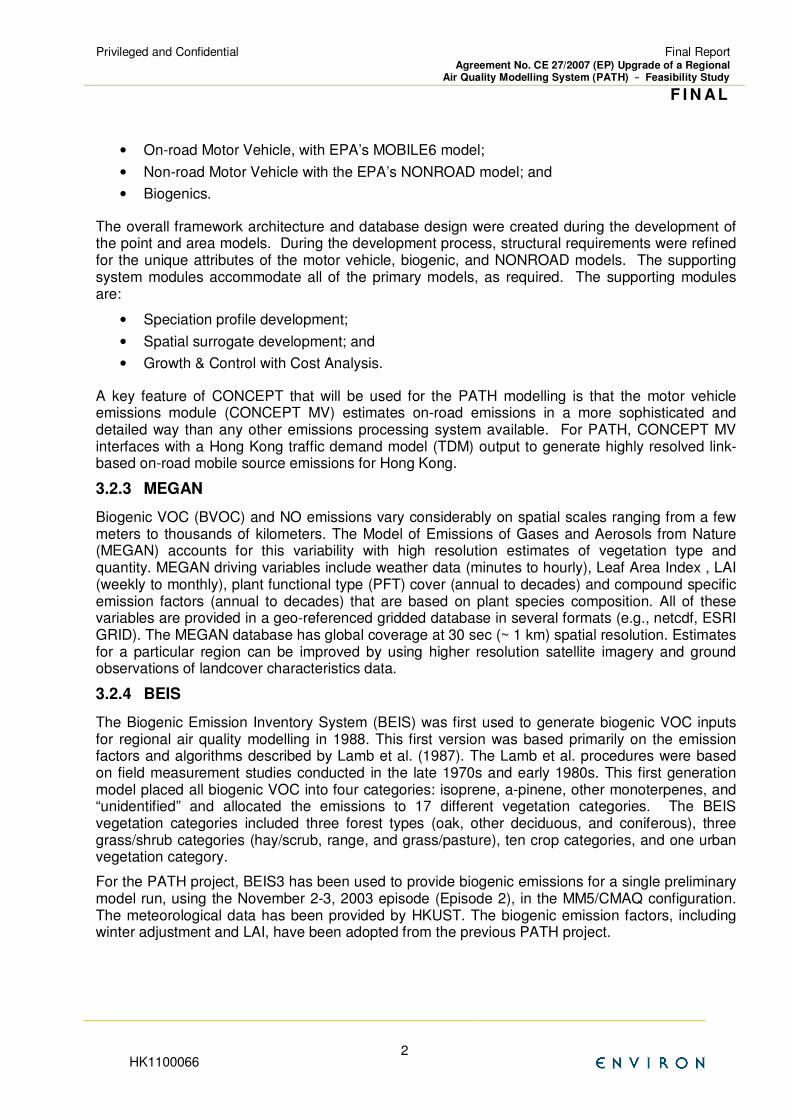
• On-road Motor Vehicle, with EPA’s MOBILE6 model;
• Non-road Motor Vehicle with the EPA’s NONROAD model; and
• Biogenics.
The overall framework architecture and database design were created during the development of the point and area models. During the development process, structural requirements were refined for the unique attributes of the motor vehicle, biogenic, and NONROAD models. The supporting system modules accommodate all of the primary models, as required. The supporting modules are:
• Speciation profile development;
• Spatial surrogate development; and
• Growth & Control with Cost Analysis.
A key feature of CONCEPT that will be used for the PATH modelling is that the motor vehicle emissions module (CONCEPT MV) estimates on-road emissions in a more sophisticated and detailed way than any other emissions processing system available. For PATH, CONCEPT MV interfaces with a Hong Kong traffic demand model (TDM) output to generate highly resolved link-based on-road mobile source emissions for Hong Kong.
3.2.3 MEGAN
Biogenic VOC (BVOC) and NO emissions vary considerably on spatial scales ranging from a few meters to thousands of kilometers. The Model of Emissions of Gases and Aerosols from Nature (MEGAN) accounts for this variability with high resolution estimates of vegetation type and quantity. MEGAN driving variables include weather data (minutes to hourly), Leaf Area Index , LAI (weekly to monthly), plant functional type (PFT) cover (annual to decades) and compound specific emission factors (annual to decades) that are based on plant species composition. All of these variables are provided in a geo-referenced gridded database in several formats (e.g., netcdf, ESRI GRID). The MEGAN database has global coverage at 30 sec (~ 1 km) spatial resolution. Estimates for a particular region can be improved by using higher resolution satellite imagery and ground observations of landcover characteristics data.
3.2.4 BEIS
The Biogenic Emission Inventory System (BEIS) was first used to generate biogenic VOC inputs for regional air quality modelling in 1988. This first version was based primarily on the emission factors and algorithms described by Lamb et al. (1987). The Lamb et al. procedures were based on field measurement studies conducted in the late 1970s and early 1980s. This first generation model placed all biogenic VOC into four categories: isoprene, a-pinene, other monoterpenes, and “unidentified” and allocated the emissions to 17 different vegetation categories. The BEIS vegetation categories included three forest types (oak, other deciduous, and coniferous), three grass/shrub categories (hay/scrub, range, and grass/pasture), ten crop categories, and one urban vegetation category.
For the PATH project, BEIS3 has been used to provide biogenic emissions for a single preliminary model run, using the November 2-3, 2003 episode (Episode 2), in the MM5/CMAQ configuration. The meteorological data has been provided by HKUST. The biogenic emission factors, including winter adjustment and LAI, have been adopted from the previous PATH project.
Privileged and Confidential
Final Report Agreement No. CE 27/2007 (EP) Upgrade of a Regional
Air Quality Modelling System (PATH) –––– Feasibility Study
F I N AL
HK1100066 3
3.3 MODELLING EPISODES FOR PATH TESTING
3.3.1 Selected Modelling Episodes
The following episodes were selected for the initial testing of the Upgraded PATH system. Note that for each episode, initialization days have been added, as appropriate:
Table 3-1. Selected Modelling Episode Definitions.
Episode # Model Episode Initialization Period
1 September 10 - October 12, 2004 September 1 – 9, 2004
2 November 2-3, 2003 October 23 – November 1, 2003
3 July 24-25, 2006 July 14- July 24, 2006
4 March 16-17, 2006 March 6-15, 2006
3.3.2 Modelling Year for Emission Inventories
Although the selected modelling episodes span calendar years 2003-2006, all emissions have been developed for calendar year 2005 as uncertainties in the emissions are greater than the year-to-year adjustment factors. Additionally, there are limited temporal adjustment factors (e.g., monthly and day-of-week) available for implementation of the emissions modelling system which further adds to the uncertainty of estimating episodic emissions for any particular historical modelling year.
3.3.3 Emission Modelling Temporal Periods
The base contract with HKEPD states ENVRION should perform everyday modelling of the three 1-week and one 1-month episodes. Given the limited available temporal adjustment factors (e.g., monthly and day-of-week), maximum temporal variability can be achieved running 1-seven day week per month. However, the SMOKE processing times over the 1 and 3 km grids are not excessive, and the emissions were run for each day of each episode. Biogenic and link-based on-road mobile source emissions were also generated for every episode day as these source categories require the incorporation of day-specific meteorological adjustments for their proper estimation. All emissions source categories were processed and output using Greenwich Mean Time (GMT).
CONCEPT modelling requires longer run times and computing resources. Since the area and point source processing for CAMx is independent of meteorology, the CONCEPT model was run for a single representative week of emissions during Episode 3. This week covered all possible temporal variability of the emissions data available during the episode.
3.3.4 Forecast Year Demonstration
In addition to the initial testing of the Upgraded PATH modelling system for the four historical episodes, the modelling system was also exercised in real-time forecasting mode for the entire 2010 calendar year. The annual real-time forecasting demonstration of the Upgraded PATH modelling system provides a rigorous and robust testing and evaluation of the new modelling system under current conditions.
3.4 MODELLING DOMAINS
3.4.1 Horizontal Modelling Domain
Originally the intent of the Upgraded PATH modelling system was to use the same grid structure is the previous version. However, those domains were too small and ENVIRON identified an alternative grid system that was used for the Upgraded PATH modelling system. The alternative
Privileged and Confidential
Final Report Agreement No. CE 27/2007 (EP) Upgrade of a Regional
Air Quality Modelling System (PATH) –––– Feasibility Study
F I N AL
HK1100066 4
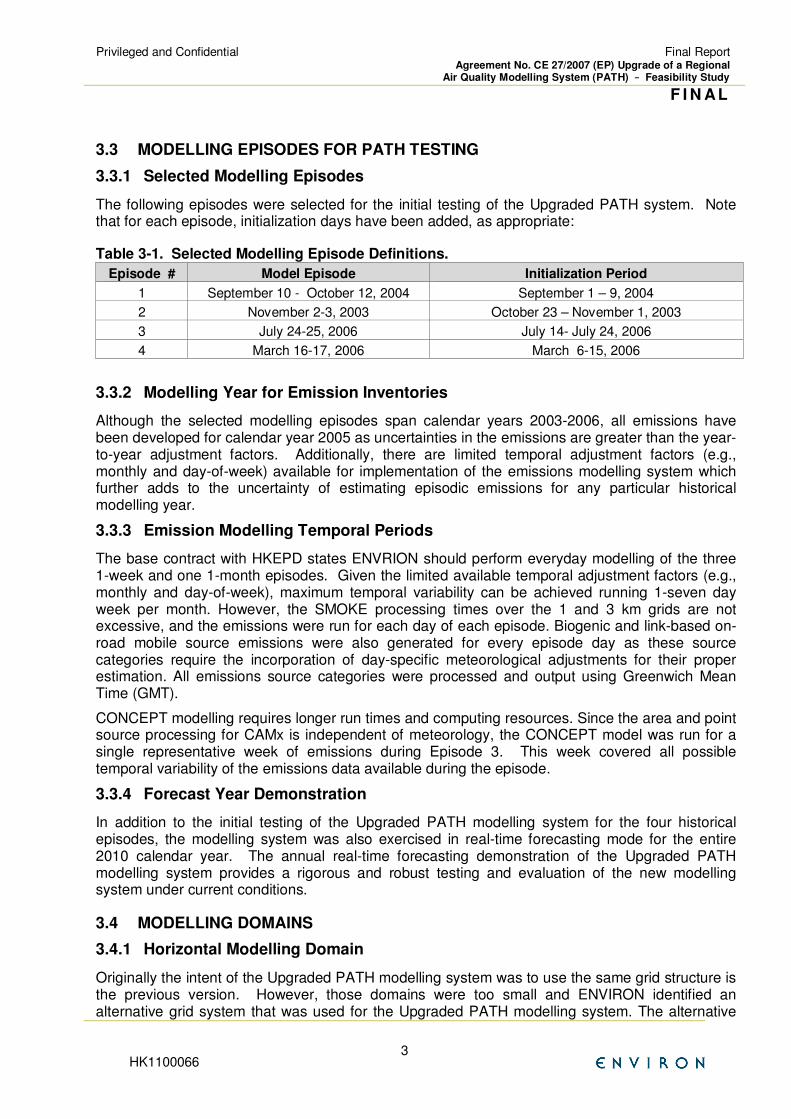
grid system consists of a 27/9/3/1 km configuration with four nested grids, as shown in Figures 3-1 through 3-4. Note that while these figures display both the meteorological and chemical transport modelling domains, the emission inventories need only to be developed only for the chemical transport modelling domains.
Figure 3-1. 27-km MM5 domain with the 27-km CTM domain (red) and the 9-km MM5 domain (blue).
-3807 -2943 -2079 -1215 -351 513 1377 2241 3105-2470.5
-2038.5
-1606.5
-1174.5
-742.5
-310.5
121.5
553.5
985.5
1417.5
1849.5
2281.5
Privileged and Confidential
Final Report Agreement No. CE 27/2007 (EP) Upgrade of a Regional
Air Quality Modelling System (PATH) –––– Feasibility Study
F I N AL
HK1100066 5
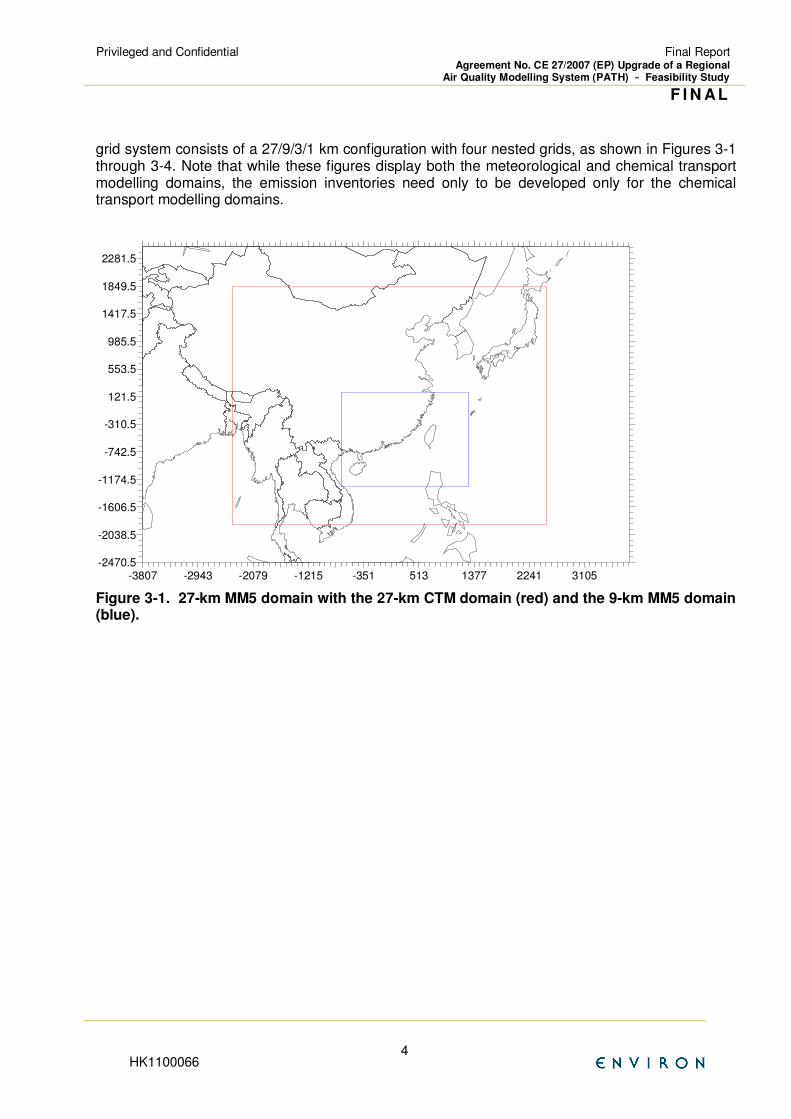
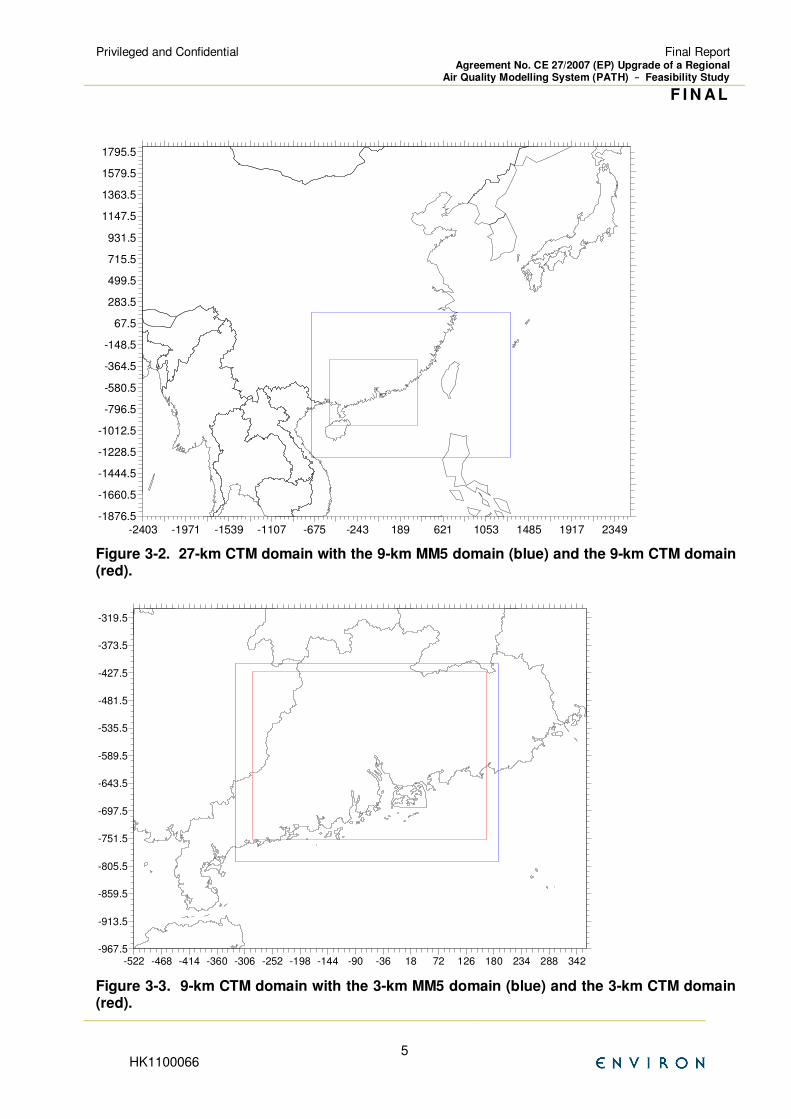
Figure 3-2. 27-km CTM domain with the 9-km MM5 domain (blue) and the 9-km CTM domain (red).
Figure 3-3. 9-km CTM domain with the 3-km MM5 domain (blue) and the 3-km CTM domain (red).
-2403 -1971 -1539 -1107 -675 -243 189 621 1053 1485 1917 2349-1876.5
-1660.5
-1444.5
-1228.5
-1012.5
-796.5
-580.5
-364.5
-148.5
67.5
283.5
499.5
715.5
931.5
1147.5
1363.5
1579.5
1795.5
-522 -468 -414 -360 -306 -252 -198 -144 -90 -36 18 72 126 180 234 288 342-967.5
-913.5
-859.5
-805.5
-751.5
-697.5
-643.5
-589.5
-535.5
-481.5
-427.5
-373.5
-319.5
Privileged and Confidential
Final Report Agreement No. CE 27/2007 (EP) Upgrade of a Regional
Air Quality Modelling System (PATH) –––– Feasibility Study
F I N AL
HK1100066 6
Figure 3-4. 3-km CTM domain with the 1-km MM5 domain (blue) and the 1-km CTM domain (red).
3.4.2 Vertical Modelling Domain
The CTM vertical structure is primarily defined by the vertical grid used in the MM5/WRF modelling. The MM5/WRF model initially employed a terrain following coordinate system defined by pressure, using 38 vertical layers that extend from the surface to the 100 mb. The 38 vertical layers are shown in Table 3-2.
-291 -264 -237 -210 -183 -156 -129 -102 -75 -48 -21 6 33 60 87 114 141-754.5
-727.5
-700.5
-673.5
-646.5
-619.5
-592.5
-565.5
-538.5
-511.5
-484.5
-457.5
-430.5
Privileged and Confidential
Final Report Agreement No. CE 27/2007 (EP) Upgrade of a Regional
Air Quality Modelling System (PATH) –––– Feasibility Study
F I N AL
HK1100066 7
Table 3-2. Vertical layer structure for the PATH upgrade meteorological (MM5/WRF) and CTM (CMAQ/CAMx) modelling.
MM5/WRF CMAQ/CAMx
Layer Sigma Press (mb)
Height (m)
Depth (m) Layer
Press (mb)
Height (m)
Depth (m)
38 0.0000 50 20576 2391 26 50 20576 6336 37 0.0241 73 18185 2099 36 0.0542 101 16086 1846 35 0.0903 136 14240 1637 25 136 14240 5616 34 0.1324 176 12603 1455 33 0.1801 221 11148 1373 32 0.2316 270 9775 1151 31 0.2850 321 8624 1027 24 321 8624 3489 30 0.3393 372 7597 915 29 0.3934 424 6682 818 28 0.4467 474 5864 729 27 0.4985 524 5135 652 23 524 5135 1753 26 0.5484 571 4483 582 25 0.5960 616 3901 519 24 0.6410 659 3382 464 22 659 3382 879 23 0.6883 699 2918 415 22 0.7229 737 2503 370 21 737 2503 701 21 0.7597 772 2133 331 20 0.7937 804 1802 296 20 804 1802 296 19 0.8251 834 1506 247 19 834 1506 247 18 0.8521 859 1259 208 18 859 1259 208 17 0.8753 882 1051 174 17 882 1051 174 16 0.8951 900 877 147 16 900 877 147 15 0.9120 916 730 122 15 916 730 122 14 0.9263 930 608 103 14 930 608 103 13 0.9385 942 505 86 13 942 505 86 12 0.9488 951 419 73 12 951 419 73 11 0.9575 960 346 61 11 960 346 61 10 0.9649 967 285 51 10 967 285 51 9 0.9711 973 234 42 9 973 234 42 8 0.9763 977 192 36 8 977 192 36 7 0.9807 982 156 30 7 982 156 30 6 0.9844 985 126 25 6 985 126 25 5 0.9875 988 101 24 5 988 101 24 4 0.9904 991 77 22 4 991 77 22 3 0.9931 993 55 20 3 993 55 20 2 0.9956 996 35 18 2 996 35 18 1 0.9979 998 17 17 1 998 17 17 0 1.0000 1000 0 0 0 1000 0 0
Privileged and Confidential
Final Report Agreement No. CE 27/2007 (EP) Upgrade of a Regional
Air Quality Modelling System (PATH) –––– Feasibility Study
F I N AL
HK1100066 8
3.5 MODEL INPUT PREPARATION
This section summarized the development and preparation of some of the critical emissions data sets for the Upgraded PATH modelling system and episodes.
3.5.1 Set-up of SMOKE and CONCEPT
SMOKE and CONCEPT were configured to generate point, area, on-road mobile and marine shipping source emissions. For all of these categories, pre-computed annual emissions were processed using month, day, and hour specific temporal profiles to produce daily, hourly emissions estimates for input into an air quality model.
Customarily, the temporal distribution of emissions is processed by month and representative days from that month. For each month of the year, a representative group of days are modeled, depending on the availability and detail of the temporal allocation data. For example, area sources tend to be best represented by a 5 day sample –Thursday, Friday, Saturday, Sunday, and Monday. Non-link on-road motor vehicles may be better represented by a full seven day sample per month. A review of the temporal adjustment factors indicated that there were limited adjustment factors (e.g., monthly and day-of-week) available in this modelling region. However, due to the short modelling episodes, all episode days were run for all emissions source categories using the SMOKE model. Due to longer processing times, the CONCEPT model was run for a representative week of the episode.
3.5.2 Emissions Data Availability
Processing of emissions was divided into 2 separate phases, based on emissions data availability. Emissions for the D1/D2 grids (27 and 9 km domains) were based on the INTEX-B 2006 regional emission inventory (Zhang and Streets et al.,2009) and 2000 TRACE-P ship emission and biomass burning (Streets et al., 2003), supplemented with episode specific biogenic emissions. Whereas emissions for the D3/D4 grids (3 and 1 km domains) were developed based on the detailed emission estimates provided for Hong Kong and the PRD regions.
3.5.2.1 D1/D2 Emissions Development
To develop CTM-ready emissions for D1/D2, the following datasets have been used.
The INTEX-B 2006 regional emission inventory (Zhang and Streets et al.,2009) and 2000 TRACE-P ship emission and biomass burning (Streets et al., 2003) have been reconciled as a basis for D1/D2 emission development.
The administrative boundary for Asia has been extracted from the Regional Air Pollution INformation and Simulation - Asia (RAINS-Asia) model, the Digital Chart of the World (DCW) [Defense Mapping Agency, 1989] and TRACE-P emission program. [Streets et al, 2003]
The LandScan 2006 population dataset with a geographic coordinates system from Oak Ridge National Laboratory (ORNL) has been adopted as population distribution data.
The road networks in the Digital Chart of the World (DCW) have been extracted for D1/D2. [ESRI, 1997], which are polyline shapefiles to generate the spatial surrogates for emission in the transportation sector.
The Land Cover and Land Use (LCLU) information has been extracted from Global Land Cover Characteristic Database version 2.0 (GLCC v2.0) available at United States Geological Survey (USGS) Earth Resources Observation and Science Center (EROS) for D1/D2. [Loveland, 2000]
Large power plants typically have high emission rates and elevated emission height, like stacks of power plants and industrial facilities. They will be treated as large point sources (LPS) during the gridding process. Their installed power capacities and annual power generation in 2005 were
Privileged and Confidential
Final Report Agreement No. CE 27/2007 (EP) Upgrade of a Regional
Air Quality Modelling System (PATH) –––– Feasibility Study
F I N AL
HK1100066 9
collected from the ‘Chinese Electricity Statistical Yearbook 2006’ and ‘Statistical Materials for Chinese Electrical Industry’. [2006]
6.5.2.2 D3/D4 Emissions Development
Although the selected modelling episodes span calendar years 2003-2006, all emissions for the D3/D4 grids have been developed using calendar year 2005 emissions estimates, as uncertainties in the emissions are greater than the year-to-year adjustment factors. Emissions estimates and related data for the D3/D4 grids were received from a variety of sources, including HKEPD and Mr. Allen Zheng.
3.5.3 Spatial Surrogate Data
Spatial surrogate files for area sources have been developed based on the cross reference table linking spatial surrogate codes (SSC) and SCC provided by HKEPD. For D3/D4, spatial surrogate files have been generated in SMOKE-ready format through Multimedia Integrated Modelling System (MIMS) Spatial Allocator 3.5 using the GIS coverage provided by HKEPD.
3.5.4 Temporal Allocation Data
Temporal emission adjustment factors for allocation of annual emissions by month, day-of-week (weekday, Saturday and Sunday) and hour-of-day were received in spreadsheet format from HKEPD and these spreadsheets were translated into the file formats required by SMOKE and CONCEPT.
3.5.5 Chemical Speciation Profile Data
Emission estimates for total VOC were converted to the more detailed chemical speciation used by the Carbon Bond 4 (CB-IV), Carbon Bond 5 (CB05) and SAPRC99 chemical mechanism used in CAMx and CMAQ. The SMOKE emission model includes default CB-IV speciation profiles by SCC codes. These profiles are based on US EPA default data as well as on various updates and improvements incorporated to account for such things as variations in fuels, solvent composition, and chemical mechanisms used in the air quality models. ENVIRON updated these standard profiles for US EPA to CB05 and SAPRC to use with SMOKE (Jimenez, et al., 2007).
3.5.6 Development of Point Source Emissions Inputs/ Area and Non-Road Source Emissions Inputs
Point source emissions estimates were received from EPD as spreadsheets. Stack parameter and emissions data required for input into both SMOKE and CONCEPT was extracted from the spreadsheet. Area source emissions, including marine sources, were received from EPD as spreadsheets as well.
3.5.7 Development of Non-Link On-Road Mobile Source Emissions
Link based on-road mobile source emissions were developed and modeled using SMOKE and CONCEPT for Hong Kong. For all other areas (e.g., the PRD), the mobile source emissions were modeled in SMOKE and CONCEPT as area source emission, where PRD motor vehicle emissions were delivered as gridded 3 km annual total emissions for CO, NOX, PM10, PM2.5, VOC and SO2, for all on-road motor vehicle sources. Data regarding vehicle distributions, and temporal variability was also provided. These data were being process to that the area source format for SMOKE and CONCEPT.
3.5.8 Development of Biogenic Source Emissions
Biogenic emissions were developed using both the BEIS3 and MEGAN biogenic emissions models.

Privileged and Confidential
Final Report Agreement No. CE 27/2007 (EP) Upgrade of a Regional
Air Quality Modelling System (PATH) –––– Feasibility Study
F I N AL
HK1100066 10
3.5.6.1 BEIS3
BEIS3 use MCIP outputs as meteorological inputs, while it can also make use of other spatially and temporally resolved meteorological data including temperatures, solar radiation and surface pressures as long as they are in netcdf format.
BEIS3 uses updated vegetation database Biogenic Emission Landcover Database version 3 (BELD3) in NetCDF format only while BEIS2 accept ASCII format vegetation input. BELD3 contains 230 land use types in 1 km resolution grids while BELD2, the vegetation database for BEIS2, contains 156 land use types.
BEIS3 consist of species-specific biogenic emissions factors (including a winter adjustment) for isoprene, monoterpene, nitrogen oxide and other VOC factors for all BELD3 land use types. The emissions factors are the flux-rate that each species emits under standard environmental conditions. Leaf area index (LAI) is used to adjust the isoprene emissions for the effects of Photosynthetically Active Radiation (PAR) penetrating through the leaf canopy.
3.5.6.2 MEGAN
Two main inputs to MEGAN are ECMAP and plant functional type fraction (PFTF) data. The ECMAP input file provides gridded annual emission factors for 20 MEGAN species and monthly leaf area index (LAI) data. It also includes optional daily average temperature and solar radiation data, which will be ignored if online calculation from met input file is selected by the user. PFTF input file contains fractions for 5 plant functional types: broad leaf, needle leaf, shrub/bush, cropland and herbaceous. The ECMAP and PFTF data can be spatially allocated to specific domains and resolutions using GIS processing procedures.
3.6 QUALITY ASSURANCE PLAN
Emissions Quality Assurance (QA) and Quality Control (QC) are the single most critical step in performing air quality modelling studies. Because emissions processing is tedious, time consuming and involves complex manipulation of many different types of large data sets, errors are frequently made in emissions processing and, if rigorous QA measures are not in place, these errors may remain undetected.
During initial set-up stage, raw input such as emission data received, temporal and spatial allocation, etc. were reviewed to assure adequate representation and completeness.
SMOKE and CONCEPT provide various warning messages during the emissions processing and a suite of built-in emissions reporting and summary programs is also provided during each phase of the modelling process. This warning messages and summary programs will be routinely reviewed and evaluated, corrective actions taken if required.
Spatial Summary, vertical Profile plots and short term temporal summary: are aims to detect possible errors in the final, model ready emissions files by characterize spatial and temporal patterns in the emissions data. This step is designed to catch errors that may be missed in the internal emissions model QA procedures.
Privileged and Confidential
Final Report Agreement No. CE 27/2007 (EP) Upgrade of a Regional
Air Quality Modelling System (PATH) –––– Feasibility Study
F I N AL
HK1100066 11
4. The PATH Meteorological Model
4.1 INTRODUCTION
The Study Team develop hourly, three-dimensional, multi-scale meteorological fields using the PSU/NCAR MM5 and WRF prognostic meteorological models to support photochemical modelling to address HKEPD’s air quality and air quality related planning activities. Several simulations were undertaken in order to settle upon a model configuration that resulted in acceptable meteorological model performance in replicating observed patterns of winds, temperature, and humidity.
4.2 METHODOLOGY
The methodology for this approach is very straightforward. The basic methodology was to apply the MM5/WRF models at the various grid resolutions (27 km, 9 km, 3 km and 1 km) and to then compare the model results (wind speeds, wind directions, temperatures, etc.) with available surface meteorological observations (both GTS data and Hong Kong Observatory surface stations data).
4.2.1 Model Selection
The Fifth-Generation NCAR / Penn State Mesoscale Model Version 3.7 (MM5; Grell et al. 1994) and the NCAR Advanced Research Weather Research and Forecasting Model Version 3 (WRF; Skamarock et al. 2008) were selected as the two meteorological models to be implemented in the upgraded PATH modelling system. Preprocessor programs of the MM5 modelling system including terrain, REGRID, LITTLE_R, and INTERPF were used to develop model inputs.
4.2.2 MM5 Modelling System
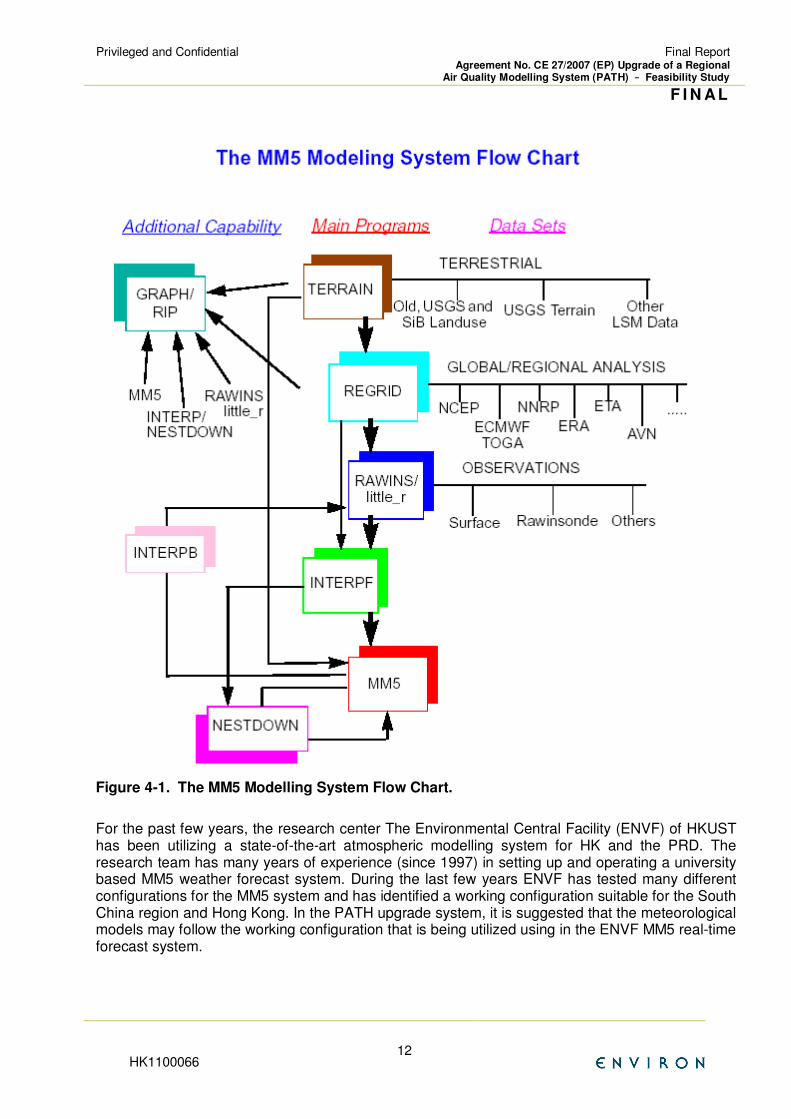
The PSU/NCAR mesoscale model is a limited-area, nonhydrostatic, terrain-following sigma-coordinate model designed to simulate or predict mesoscale and regional-scale atmospheric circulation. A schematic diagram (Fig. 4-1) is provided to show the order of the programs and the flow of the data, and to briefly describe their primary functions.
Privileged and Confidential
Final Report Agreement No. CE 27/2007 (EP) Upgrade of a Regional
Air Quality Modelling System (PATH) –––– Feasibility Study
F I N AL
HK1100066 12
Figure 4-1. The MM5 Modelling System Flow Chart.
For the past few years, the research center The Environmental Central Facility (ENVF) of HKUST has been utilizing a state-of-the-art atmospheric modelling system for HK and the PRD. The research team has many years of experience (since 1997) in setting up and operating a university based MM5 weather forecast system. During the last few years ENVF has tested many different configurations for the MM5 system and has identified a working configuration suitable for the South China region and Hong Kong. In the PATH upgrade system, it is suggested that the meteorological models may follow the working configuration that is being utilized using in the ENVF MM5 real-time forecast system.
Privileged and Confidential
Final Report Agreement No. CE 27/2007 (EP) Upgrade of a Regional
Air Quality Modelling System (PATH) –––– Feasibility Study
F I N AL
HK1100066 13
4.2.3 The Weather research and Forecasting Model (WRF)
The Weather Research and Forecasting (WRF) Model is a mesoscale numerical weather prediction system designed to serve both operational forecasting and atmospheric research needs. It features multiple dynamic cores, a 3-dimensional variational (3DVAR without time involves, 3DVAR is computationally cheaper to run that 4DVAR) data assimilation system, and a software architecture allowing for computational parallelism and system extensibility. WRF is suitable for a broad spectrum of applications across scales ranging from meters to thousands of kilometers.
The Advanced Research WRF (ARW) modelling system has been in development for the past few years by the National Center for Atmospheric Research Microscale Meteorology Division (NCAR MMM). WRF-ARW Version 3, available since April 2008, was implemented in the Upgraded PATH modelling system. The ARW is designed to be a flexible, state-of-the-art atmospheric simulation system that is portable and efficient on available parallel computing platforms.
Considering that the WRF-ARW can have any odd grid nesting ratio and more map projections than MM5, is well supported by the NCAR MMM (MM5 is no longer supported), in particular the component WRF-Var (supports 3D-VAR capability) for assimilating observations, then the latest released WRF ARW Version 3 was implemented in the PATH upgrade project.
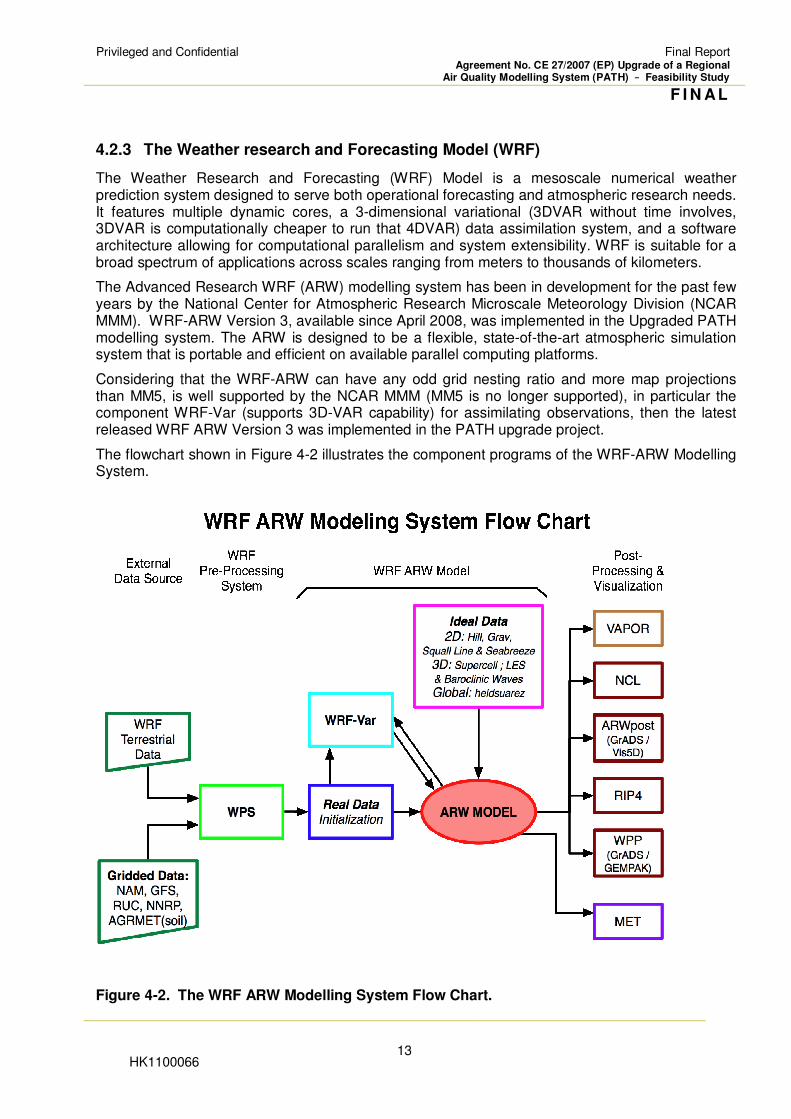
The flowchart shown in Figure 4-2 illustrates the component programs of the WRF-ARW Modelling System.
Figure 4-2. The WRF ARW Modelling System Flow Chart.
Privileged and Confidential
Final Report Agreement No. CE 27/2007 (EP) Upgrade of a Regional
Air Quality Modelling System (PATH) –––– Feasibility Study
F I N AL
HK1100066 14
As shown in the flowchart in Figure 4-2, the WRF Modelling System consists of several major programs: the WPS program is used primarily for real-data simulations; the WRF-Var program can be used to ingest observations into the interpolated analyses created by WPS; the ARW Solver is composed of several initialization programs for idealized, real-data simulations and the numerical integration program. It also includes a program to do one-way grid nesting.
4.2.4 WRF ARW Configuration
The WRF ARW allows the users to select some options for physics, diffusion and damping, and advection. To have consistent performance and for the ease of comparison with MM5, the options of the physical parameterizations and configuration of the WRF model will generally follow those used in MM5. If the options are not present in MM5, the options closest to those in MM5 will be selected.
4.2.5 Model Input Data
To run the meteorological models, some basic input data are required. The data can be classified into two categories: those required for model setup and operation, and those required for initial and boundary conditions to run the model. The basic input data that will be used for the meteorological models are listed below:
• Topographic Data:
• Vegetation Type and Landuse Data:
• Atmospheric Data:
• Sea Surface Temperature:
• Data for FDDA Observational Nudging
4.2.6 Modelling Domain
4.2.6.1 Horizontal Dimensions of the Model Domains
The original PATH modelling system used a 40.5/13.5/4.5/1.5/0.5 km grid structure. The modelling domains were developed over a decade ago and represented an appropriate trade-off between computational requirements and resolving emissions and air quality in the highly dense Hong Kong area. The Study Team has identified an alternative grid system that was used for the Upgraded PATH modelling system.
Four nested meshes with grid spacing of 27, 9, 3 and 1 km is used for the modelling domains of the meteorological models. The characteristics of the approved alternative configuration are as follows:
Grid 1 (27 km): The coarsest outer grid would include almost all of China and Japan as well as Taiwan, Vietnam, Laos, Cambodia, Thailand, etc. This is much larger than the current PATH modelling system outer grid that just covers Southeastern China, Taiwan and North Vietnam.
Grid 2 (9 km): The second grid would cover Southeastern China including Guangdong Province, Hong Kong and Macao. This is in contrast to the current PATH model configuration whose second (13.5 km) grid covers the majority of Guangdong Province.
Grid 3 (3 km): The third nested grid covers most of Guangdong Province, Hong Kong and Macau. The current PATH system third (4.5 km) grid covers mainly Hong Kong and the PRD.
Grid 4 (1 km): The final grid in the alternative domain configuration is focused on the PRD region, as compared to just Hong Kong with the current PATH configuration.
Privileged and Confidential
Final Report Agreement No. CE 27/2007 (EP) Upgrade of a Regional
Air Quality Modelling System (PATH) –––– Feasibility Study
F I N AL
HK1100066 15
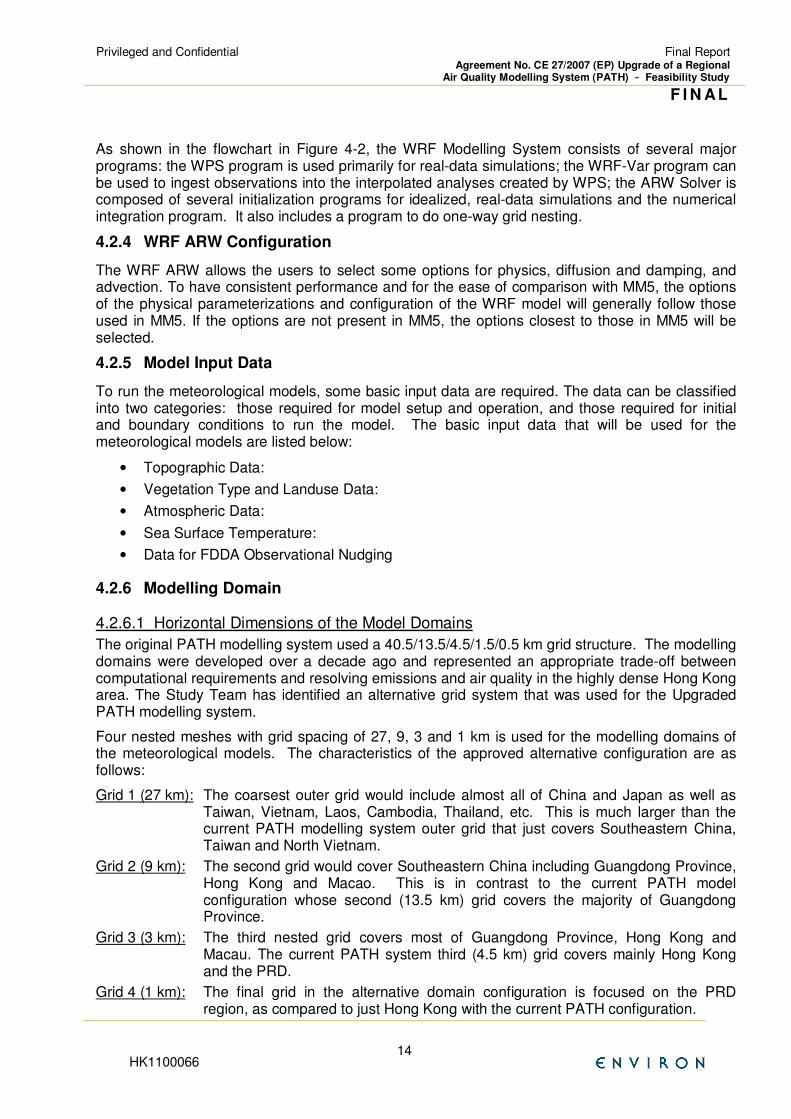
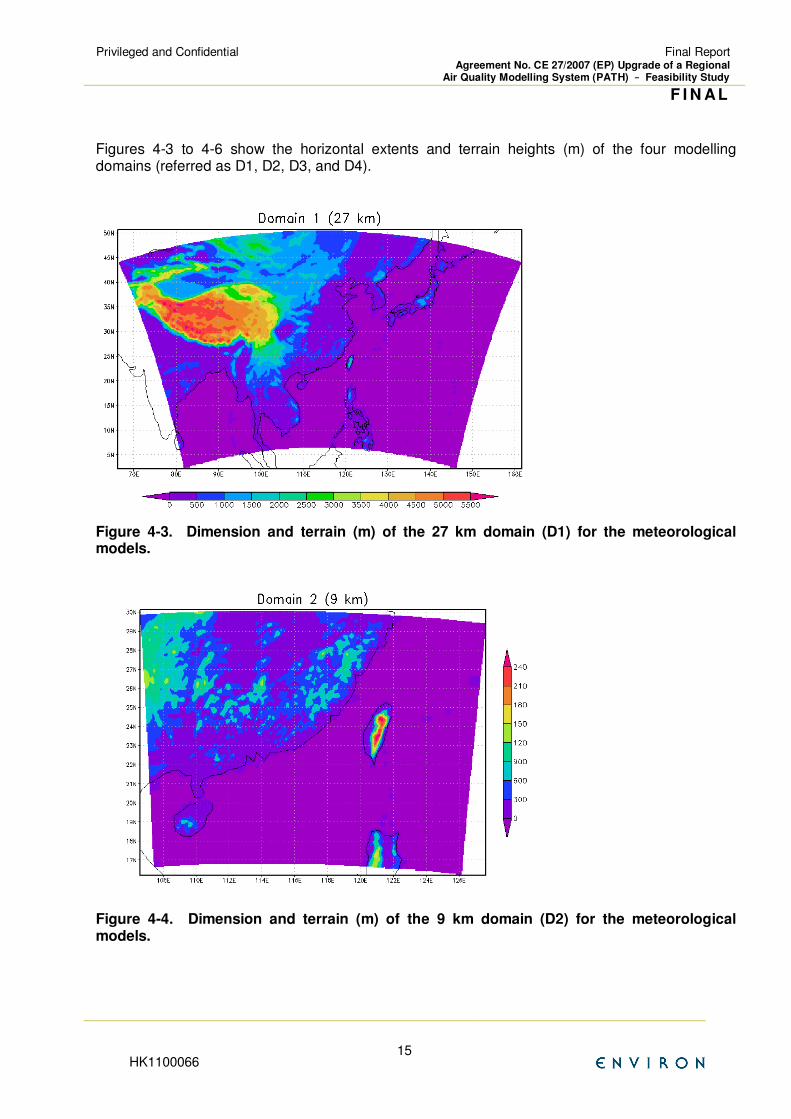
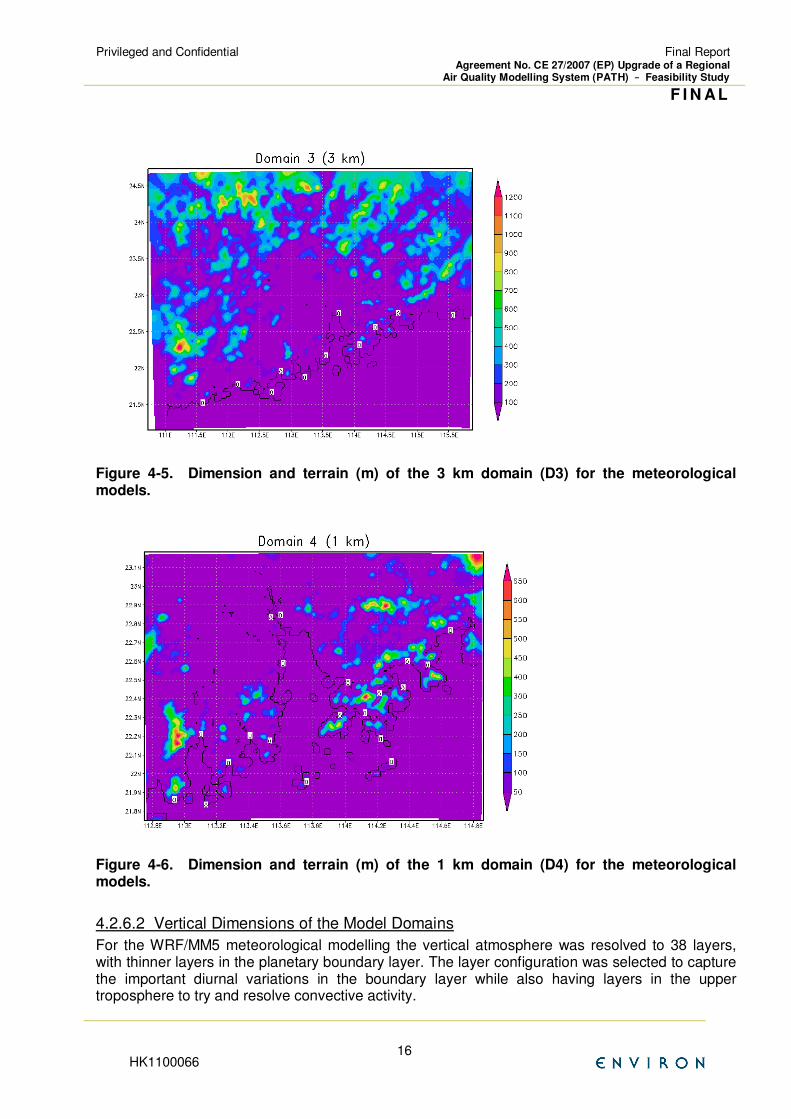
Figures 4-3 to 4-6 show the horizontal extents and terrain heights (m) of the four modelling domains (referred as D1, D2, D3, and D4).
Figure 4-3. Dimension and terrain (m) of the 27 km domain (D1) for the meteorological models.
Figure 4-4. Dimension and terrain (m) of the 9 km domain (D2) for the meteorological models.
Privileged and Confidential
Final Report Agreement No. CE 27/2007 (EP) Upgrade of a Regional
Air Quality Modelling System (PATH) –––– Feasibility Study
F I N AL
HK1100066 16
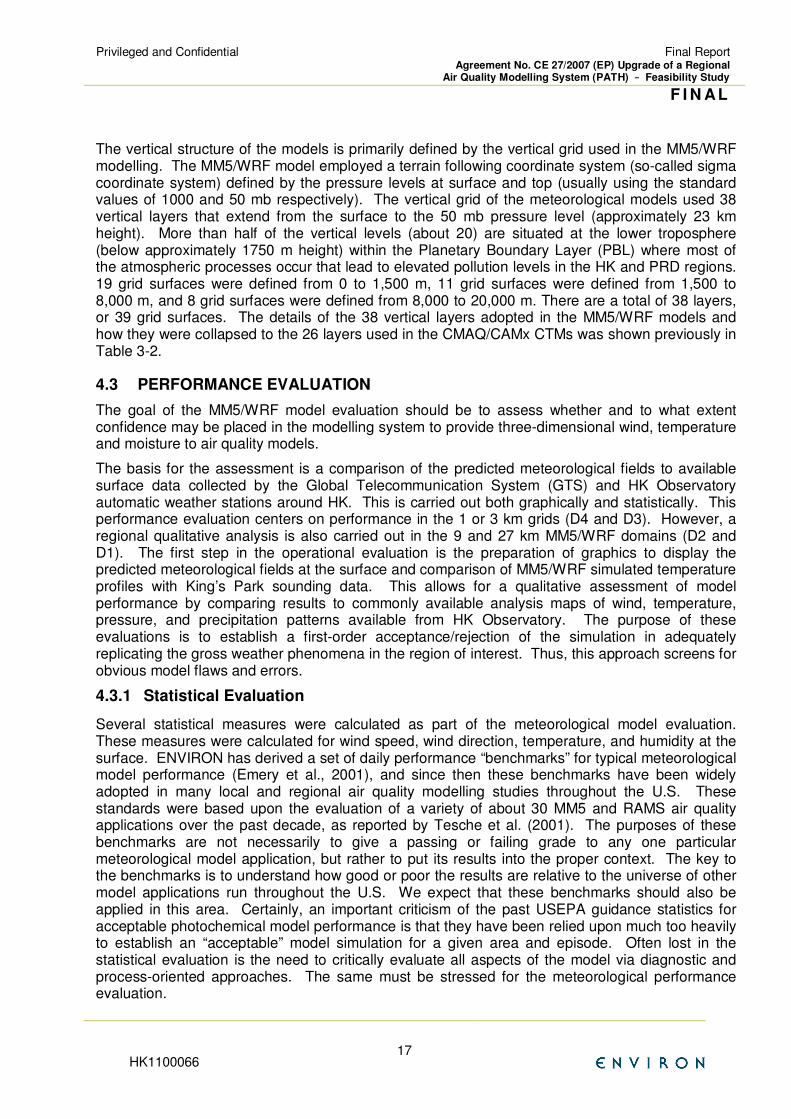
Figure 4-5. Dimension and terrain (m) of the 3 km domain (D3) for the meteorological models.
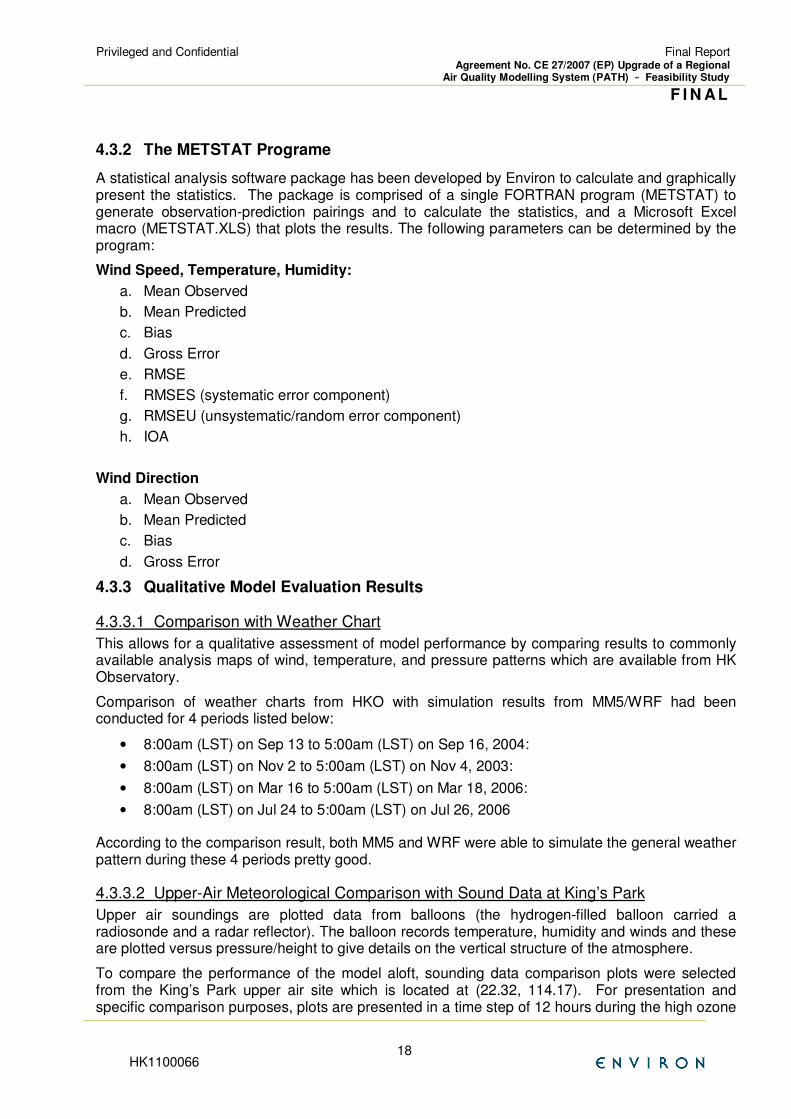
Figure 4-6. Dimension and terrain (m) of the 1 km domain (D4) for the meteorological models.
4.2.6.2 Vertical Dimensions of the Model Domains
For the WRF/MM5 meteorological modelling the vertical atmosphere was resolved to 38 layers, with thinner layers in the planetary boundary layer. The layer configuration was selected to capture the important diurnal variations in the boundary layer while also having layers in the upper troposphere to try and resolve convective activity.
Privileged and Confidential
Final Report Agreement No. CE 27/2007 (EP) Upgrade of a Regional
Air Quality Modelling System (PATH) –––– Feasibility Study
F I N AL
HK1100066 17
The vertical structure of the models is primarily defined by the vertical grid used in the MM5/WRF modelling. The MM5/WRF model employed a terrain following coordinate system (so-called sigma coordinate system) defined by the pressure levels at surface and top (usually using the standard values of 1000 and 50 mb respectively). The vertical grid of the meteorological models used 38 vertical layers that extend from the surface to the 50 mb pressure level (approximately 23 km height). More than half of the vertical levels (about 20) are situated at the lower troposphere (below approximately 1750 m height) within the Planetary Boundary Layer (PBL) where most of the atmospheric processes occur that lead to elevated pollution levels in the HK and PRD regions. 19 grid surfaces were defined from 0 to 1,500 m, 11 grid surfaces were defined from 1,500 to 8,000 m, and 8 grid surfaces were defined from 8,000 to 20,000 m. There are a total of 38 layers, or 39 grid surfaces. The details of the 38 vertical layers adopted in the MM5/WRF models and how they were collapsed to the 26 layers used in the CMAQ/CAMx CTMs was shown previously in Table 3-2.
4.3 PERFORMANCE EVALUATION
The goal of the MM5/WRF model evaluation should be to assess whether and to what extent confidence may be placed in the modelling system to provide three-dimensional wind, temperature and moisture to air quality models.
The basis for the assessment is a comparison of the predicted meteorological fields to available surface data collected by the Global Telecommunication System (GTS) and HK Observatory automatic weather stations around HK. This is carried out both graphically and statistically. This performance evaluation centers on performance in the 1 or 3 km grids (D4 and D3). However, a regional qualitative analysis is also carried out in the 9 and 27 km MM5/WRF domains (D2 and D1). The first step in the operational evaluation is the preparation of graphics to display the predicted meteorological fields at the surface and comparison of MM5/WRF simulated temperature profiles with King’s Park sounding data. This allows for a qualitative assessment of model performance by comparing results to commonly available analysis maps of wind, temperature, pressure, and precipitation patterns available from HK Observatory. The purpose of these evaluations is to establish a first-order acceptance/rejection of the simulation in adequately replicating the gross weather phenomena in the region of interest. Thus, this approach screens for obvious model flaws and errors.
4.3.1 Statistical Evaluation
Several statistical measures were calculated as part of the meteorological model evaluation. These measures were calculated for wind speed, wind direction, temperature, and humidity at the surface. ENVIRON has derived a set of daily performance “benchmarks” for typical meteorological model performance (Emery et al., 2001), and since then these benchmarks have been widely adopted in many local and regional air quality modelling studies throughout the U.S. These standards were based upon the evaluation of a variety of about 30 MM5 and RAMS air quality applications over the past decade, as reported by Tesche et al. (2001). The purposes of these benchmarks are not necessarily to give a passing or failing grade to any one particular meteorological model application, but rather to put its results into the proper context. The key to the benchmarks is to understand how good or poor the results are relative to the universe of other model applications run throughout the U.S. We expect that these benchmarks should also be applied in this area. Certainly, an important criticism of the past USEPA guidance statistics for acceptable photochemical model performance is that they have been relied upon much too heavily to establish an “acceptable” model simulation for a given area and episode. Often lost in the statistical evaluation is the need to critically evaluate all aspects of the model via diagnostic and process-oriented approaches. The same must be stressed for the meteorological performance evaluation.
Privileged and Confidential
Final Report Agreement No. CE 27/2007 (EP) Upgrade of a Regional
Air Quality Modelling System (PATH) –––– Feasibility Study
F I N AL
HK1100066 18
4.3.2 The METSTAT Programe
A statistical analysis software package has been developed by Environ to calculate and graphically present the statistics. The package is comprised of a single FORTRAN program (METSTAT) to generate observation-prediction pairings and to calculate the statistics, and a Microsoft Excel macro (METSTAT.XLS) that plots the results. The following parameters can be determined by the program:
Wind Speed, Temperature, Humidity:
a. Mean Observed
b. Mean Predicted
c. Bias
d. Gross Error
e. RMSE
f. RMSES (systematic error component)
g. RMSEU (unsystematic/random error component)
h. IOA
Wind Direction
a. Mean Observed
b. Mean Predicted
c. Bias
d. Gross Error
4.3.3 Qualitative Model Evaluation Results
4.3.3.1 Comparison with Weather Chart
This allows for a qualitative assessment of model performance by comparing results to commonly available analysis maps of wind, temperature, and pressure patterns which are available from HK Observatory.
Comparison of weather charts from HKO with simulation results from MM5/WRF had been conducted for 4 periods listed below:
• 8:00am (LST) on Sep 13 to 5:00am (LST) on Sep 16, 2004:
• 8:00am (LST) on Nov 2 to 5:00am (LST) on Nov 4, 2003:
• 8:00am (LST) on Mar 16 to 5:00am (LST) on Mar 18, 2006:
• 8:00am (LST) on Jul 24 to 5:00am (LST) on Jul 26, 2006
According to the comparison result, both MM5 and WRF were able to simulate the general weather pattern during these 4 periods pretty good.
4.3.3.2 Upper-Air Meteorological Comparison with Sound Data at King’s Park
Upper air soundings are plotted data from balloons (the hydrogen-filled balloon carried a radiosonde and a radar reflector). The balloon records temperature, humidity and winds and these are plotted versus pressure/height to give details on the vertical structure of the atmosphere.
To compare the performance of the model aloft, sounding data comparison plots were selected from the King’s Park upper air site which is located at (22.32, 114.17). For presentation and specific comparison purposes, plots are presented in a time step of 12 hours during the high ozone
Privileged and Confidential
Final Report Agreement No. CE 27/2007 (EP) Upgrade of a Regional
Air Quality Modelling System (PATH) –––– Feasibility Study
F I N AL
HK1100066 19
episodic period of Sep 14-15, 2004 starting with 00Z on Sep 14, 2004. Thus, there are three 00Z soundings and three 12Z soundings on Sep 14, 15, and 16. No regard to synoptic-scale weather patterns was considered in interpreting these comparisons.
According to the comparison result, both the temperature and moisture profiles match reasonably well with the greatest disparities at the lower levels. Comparisons are best above the 550-600 mb height away from influences of the earth’s surface. The magnitude of the winds is in reasonable agreement throughout the soundings but the wind directions agree best above about 500mb. Surface wind directions are matched quite well too, especially above 850mb.
4.3.3.3 Phenomenological Evaluation
In order to demonstrate that the metrological models (MM5/WRF) were able to reproduce key features, such as sea breeze or cold front, 2D spatial plots of the simulated results were prepared and compared with the weather charts from Hong Kong Observatory.
The Study Team plotted a sequence of velocity vector plots in 2D for both MM5 and WRF to demonstrate that the meteorological models were able to simulate the sea breeze phenomenon in the PRD region which was developed during the day with the land being heated up by the sun. A sequence of plots from 9:00am to 9:00pm on July 22, 2006 were prepared, these plots demonstrated how sea breeze was developed during the day. Surface winds were generally easterly during the morning, but by mid-afternoon western and southern sea breezes became well established with a convergence line running approximately north-south through the HK SAR. Surface winds at the corresponding hours from the HKO stations were also plotted for comparisons The MM5 model does match the observed results quite well and during the mid-day there was a strong sea breeze along the coast line of the Pearl River Estuary and became weaker as the land surface became colder during the early evening.
The Study Team also plotted a sequence of velocity vector plots in 2D for both MM5 and WRF and compared with the weather chart from HKO, where the MM5/WRF cool frontal lines are co-located nicely both in time and space with the frontal zone of the HKO weather charts. This demonstrated that the meteorological models were able to simulate the frontal passage phenomenon.
4.3.3.4 Comparison of Surface Wind Vector Plots of Modeled and Observed Winds for 9/3/1 km Domains
2D velocity vector fields were plotted for both MM5 and WRF and compared that with the GTS stations in D2 (9 km), D3 (3 km), and D4 (1 km) in order to demonstrate that the meteorological models were able to simulate the observed weather pattern. Zoom-in velocity vector plots around HK for MM5/WRF were also plotted so as to compare HKO stations at time 8:00am and 8:00pm on Sep 12, 2004.
4.3.3.5 Precipitation Analysis
A qualitative comparison of MM5/WRF estimated precipitation with the GTS (Synop data), where spatial displays of 24-hour observed and model-estimated total accumulated precipitation for the 27-km grid for July 24, 2006 , March 12, 2006, Sep 21, 2004 and Sep 30, 2004 are compared. According to these comparison results, the modeled and observed 24 hour rainfall totals show good agreement spatially and in terms of magnitude for all four cases, replicating the observed precipitation field. Given that the Synop data are considered to be good, both MM5 and WRF provide a reasonable representation of the spatial distribution of precipitation over China.
Privileged and Confidential
Final Report Agreement No. CE 27/2007 (EP) Upgrade of a Regional
Air Quality Modelling System (PATH) –––– Feasibility Study
F I N AL
HK1100066 20
4.3.4 Quantitative Model Evaluation Results
MM5/WRF performance in replicating surface observations was evaluated: (a) for winds, temperature, and humidity (mixing ratio) on daily time scales using performance statistics and goals, on all four simulation grids of 27/9/3/1 km by using GTS data -- typically we use all available surface data to maximize the observation-prediction pairings for statistics; and (b) for winds and temperature on a hourly time scale by using HKO data in Hong Kong on just the 1 km grid domain (D4). Other domains were not included in the hourly analysis because the GTS network had many stations that only reported every several hours which would complicate the analysis. Given the length of these episodes we felt that the daily graphics are already on the edge of being too complicated to be able to interpret.
4.3.4.1 Daily Comparison
Performance for wind speed and direction is considered to be rather good in all 4 domains, especially, considering the influences of local topography and the relatively small number of observation-prediction pairings in the 3 and 1 km PRD domains (usually statistics look better with larger numbers of pairings, while results from just a few pairings look much more disorganized). For temperature, MM5/WRF seems to be under predicted a little. For humidity, the atmosphere is simulated to be appropriately dry, and close to observations. Overall, this is a very promising result for the initial MM5/WRF simulations.
4.3.4.2 Spatial analysis
From the 2D spatial plots of the four episodes of the 12 performance metrics within the 27 km domain show that the models (both MM5 and WRF) are positively biased with regards to wind speed for the all four episodes. The bias is especially acute along the coast as well as around Japan, presumably due to the model does not produce enough friction on the surface to slow the wind down. The temperature spatial plot shows how the temperature biases vary throughout in all four episodes. Note that biases are generally small.
4.3.4.3 Hourly Comparison
MM5/WRF performance in replicating surface observations of winds and temperature were also evaluated statistically on an hourly time scale by using HKO data (with about 42 observation stations) in HK on 1 km grid.
Generally the study team concluded that both MM5/WRF simulated wind direction agreed quite well with observation, considering that HK has a very complex terrain. In terms of wind speed, MM5/WRF tends to overestimate the surface wind since the surface is not producing enough surface friction as in real situation, in addition, traditional mesoscale NWP falls short of effectively capturing the “urban effects” near the bottom of the planetary boundary layer. This problem can
be alleviated by using the urban version of MM5, so called uMM5, but it would require a lot of input data and increase of computational time and it would not be practical enough to be used on as an operational model.
4.3.5 Scatter Plots of Observation vs. Model (Surface Winds and Temperature)
Scatter plots of simulated versus measured wind speed at various HKO stations are plotted for MM5 simulation period from September 1, 2004 to October 12, 2004, a total of 42 days. The value of these plots is that they allow the simulations to be compared with observations. In this way, consistent features, and systematic differences between observations and simulations, can be identified and possible causes for systematic errors more easily diagnosed. As can be seen, MM5 tends to over predict the surface wind speed. According to the plots, the simulated temperature seems to have a better correlation with the observed temperature than that of wind speed.
Privileged and Confidential
Final Report Agreement No. CE 27/2007 (EP) Upgrade of a Regional
Air Quality Modelling System (PATH) –––– Feasibility Study
F I N AL
HK1100066 21
4.3.6 Comparison of MM5/WRF Radiation and PBL Height with Data from HKO at King’s Park
4.3.6.1 Radiation
At King's Park, the amount of solar radiation reaching Hong Kong is recorded continuously by thermo-electric pyranometers which is a type of actinometer used to measure broadband solar irradiance on a planar surface. This sensor is designed to measure the solar radiation flux density (in watts per meter square) from a field of view of 180 degrees. Solar radiation is only valid when there is daylight/sunshine; therefore HKO only has hourly data from 6 am to 8 pm.
The performance of MM5/WRF, in particular the shortwave down welling flux calculations, was evaluated. For the 2003 episode it is apparent that the model did correctly capture the diurnal variation of surface solar radiation at King’s Park quite well for both MM5 and WRF which implied that the modeled overlying cloud cover was correctly located in the model domain. Similar conclusion can also be drawn for the 2004, the March 2006 and the July 2004 episodes.
4.3.6.2 PBL Height
In HKO, temperature data from radio-stoned or tethered-stoned ascents are available; these heights can be deduced from the temperature profiles. HKO only use the sounding data at 00UTC to come up with the morning mixing height (8:00am LST) and this data was used to compare with PBL height estimated by MM5/WRF.
The comparison at 8:00am (LST) of the PBL height development from MM5 simulations and wind profiler data during the four episodic cases show both MM5 and WRF simulations fail to capture the high values of observed PBL heights at 8:00 am. In particular, MM5 tends to estimate a very low values of PBL (around 16 m) when there is no solar radiation, while WRF seems to do a slightly better job. Similar conclusion can also be drawn for the other episodes.
4.4 SENSITIVITY RUNS
Several meteorological model sensitivity simulations were performed to determine the optimal model configuration for simulating meteorology in the HK and PRD region. These sensitivity tests include:
1. One-way nesting
D3 with no observational nudging
D3 and D4 with no observational nudging as in forecast mode
Boundary layer scheme (use MYJ scheme).
Cumulus scheme with Kain-Fritsch for both WRF and MM5.
The episode chosen for the sensitivity runs was September 2004, and the exact period of simulation was from September 7 to 24, 2004, a total of 18 days. The sensitivity of MM5/WRF modelling to the various model configurations was assessed and quantified by comparing model output against observations from the meteorological monitoring networks within the D1 and D4 domains.
4.4.1 Analyses of the Sensitivity Runs
Various statistics performance measures were used to evaluate the meteorological model sensitivity tests. In terms of the overall skill of the runs, the Index of Agreement (IA) is a robust performance metric that ranges from 0.0 to 1.0, with a perfect model receiving a score of 1.0. Based on the IA performance metrics for the meteorological model sensitivity tests we can draw the following observations:
Privileged and Confidential
Final Report Agreement No. CE 27/2007 (EP) Upgrade of a Regional
Air Quality Modelling System (PATH) –––– Feasibility Study
F I N AL
HK1100066 22
• The IA for the MM5 runs are
0.55 (control run) and 0.49 to 0.57 (sensitivity runs) for wind speed
0.85 (control run) and 0.83 to 0.85 (sensitivity runs) for wind direction, and
1. 0.80 (control run) and 0.71 to 0.79 (sensitivity runs) for temperature.
We note that the IA for the control runs are typically in the high end as compared to the ranges of IA found in the sensitivity runs, suggesting that the control runs compared more favorably with the available observations. The only case of higher IA in the MM5 runs in the sensitivity runs is the PBL scheme wind speed (4% higher than the control), but this run is associated with a much lower IA for temperature (11% lower than the control). Hence, we would not conclude that the PBL scheme is a better run as compared to the control.
We also found that the “No nudging for D3 and D4” case typically have the lowest IA values, confirming that nudging does help to improve the simulation. This suggests that, even though nudging cannot be applied in the forecast mode, it should be applied in historical case studies to allow a better representation of the meteorological simulations.
• The IA for the WRF runs are
0.52 (control run) and 0.51 to 0.53 (sensitivity runs) for wind speed
0.84 (control run) and 0.83 to 0.84 (sensitivity runs) for wind direction, and
0.73 (control run) and 0.73 to 0.75 (sensitivity runs) for temperature.
Different from the MM5 runs, the WRF control run does not appear to be either better or worse than other sensitivity runs. The only exception is that “No Nudging for Domain D3 and D4” still appears to have the lowest set of IA. Other than this, the control run does not appear to score much better than the other sensitivity runs.
On the other hand, we note that the range of the IA are smaller in the WRF cases as compared to the MM5 cases, suggesting that the WRF runs tend to more stable (i.e. behave more similarly in different configurations) as compared with their MM5 counterparts.
The IA for wind speed, wind direction and temperature of the MM5 runs are higher than that of the WRF runs. This suggests that the MM5 runs have better skill than that WRF runs for our 2-week study. However, we must caution that the differences in IA and other statistics in the control and the sensitivity runs, as well as the MM5 and the WRF runs, are quite small, and that the current study covers only a short 2-week period; it is possible that the skill may differ for other seasons, or under different large-scale meteorological conditions.
Privileged and Confidential
Final Report Agreement No. CE 27/2007 (EP) Upgrade of a Regional
Air Quality Modelling System (PATH) –––– Feasibility Study
F I N AL
HK1100066 23
5. Transport Data Compilation and Modelling
5.1 INTRODUCTION
The EPD currently uses the EMFAC-HK vehicle emissions model for air quality planning and related activities. EMFAC-HK is not readily adaptable for use within CONCEPT for emissions processing, a step included in the upgrade of the PATH modelling system. The EMFAC-HK was adapted from the 2002 EMFAC software used in U.S. State of California. The U.S. EPA MOBILE6 model is the latest on-road emissions model currently approved for regulatory air quality analyses in the U.S. for all states other than California. As required by the Study Brief, the USEPA MOBILE6 was adapted for use in estimating vehicle emissions in Hong Kong and the Study Team developed a version of the MOBILE6 for Hong Kong.
MOBILE6-HK emission factors were combined with vehicle kilometers travelled (VKT) data, by roadway link, to estimate overall mass emissions. The VKT and speeds by roadway link were obtained from a transportation demand model developed for use in Hong Kong by MVA Hong Kong Limited. The MVA model was exercised for the 2005 base year. The VKT activity data were projected or backcast to the other years of the study (2003, 2004, and 2006) using forecast/backcast factors developed from analysis of Transport Department annual traffic count data. The MOBILE6-HK emissions model and the link-based VKT data were used in the CONCEPT MV to develop a highly resolved, temporally and spatially, on-road vehicle emission inventory for Hong Kong. The gridded temperature and humidity from the MM5 and WRF meteorological modelling runs were used to implement appropriate adjustments to the MOBILE6-HK emission factors.
5.2 EMFAC-HK
EMFAC-HK is a computer model that estimates vehicle on-road emissions for the Hong Kong vehicle fleet. EMFAC-HK estimates both on-road vehicle emission rates (grams per kilometer) and total mass emissions (tonnes per day). Pollutants estimated by the model include HC, CO, NOX, and PM from running exhaust, idling, start, and evaporative emission modes.
EMFAC-HK was modified from the California Air Resources Board (CARB) on-road vehicle emissions model EMFAC2002 by Dr. Carol Wong of EPD primarily during an extended visit at CARB. Dr. Wong extensively incorporated characteristics about the Hong Kong vehicle fleet including:
• Vehicle classes
• Vehicle certification standards (European emissions standards)
• Engine deterioration with vehicle age
• Daily trips per vehicle
• Vehicle class annual mileage accrual
• Vehicle class retention rates used for population back and forecasting
• Vehicle kilometers traveled (VKT) by hour of day
• Vehicle speeds by hour of the day
• Fuel sulfur and Reid vapor pressure (RVP)
• Distribution of high emitters with vehicle age
ENVIRON was tasked to estimate on-road emissions in Hong Kong and implement them in the upgraded PATH modelling system. It would have been prohibitively expensive to re-code CONCEPT for compatibility with EMFAC-HK. Similarly, re-coding MOBILE6 to use the exact
Privileged and Confidential
Final Report Agreement No. CE 27/2007 (EP) Upgrade of a Regional
Air Quality Modelling System (PATH) –––– Feasibility Study
F I N AL
HK1100066 24
same raw local data and modelling methods as EMFAC-HK would have been impractical given the lack of technical EMFAC-HK code documentation. ENVIRON instead created a new version of MOBILE6 specific to Hong Kong vehicles using the most relevant parts of the EMFAC-HK model. In short, ENVIRON extracted running exhaust emission factors from EMFAC-HK under a wide range of conditions and forced them into MOBILE6-HK, creating a separate MOBILE6-HK model for each calendar year.
5.3 MOBILE6-HK
In order to incorporate EMFAC-HK emission rates into MOBILE6, ENVIRON had to account for a number of model differences. Key among these are:
• Idling: EMFAC-HK accounts for idling with a gram per minute idling factor while MOBILE6 does not account for idling.
• PM starts: EMFAC-HK estimates PM exhaust emissions separately for starts and running mode while MOBILE6 estimates PM exhaust emissions with a composite emission factor.
• NH3 and SO2: EMFAC-HK does not estimate NH3. EMFAC-HK contains SO2 estimates but the guidance instructs the user to instead calculate SO2 using EPA methodology instead of using EMFAC. EPA MOBILE6 estimates both NH3 and SO2.
ENVIRON created MOBILE6-HK from EPA MOBILE6 by renaming vehicle classes, converting units, hard-coding new BERs, removing inappropriate adjustments, and adding capability to read additional external files for SCF and CCFs. Table 5-1 provides an overall summary of EMFAC-HK and MOBILE6-HK showing similarities and differences between the two models
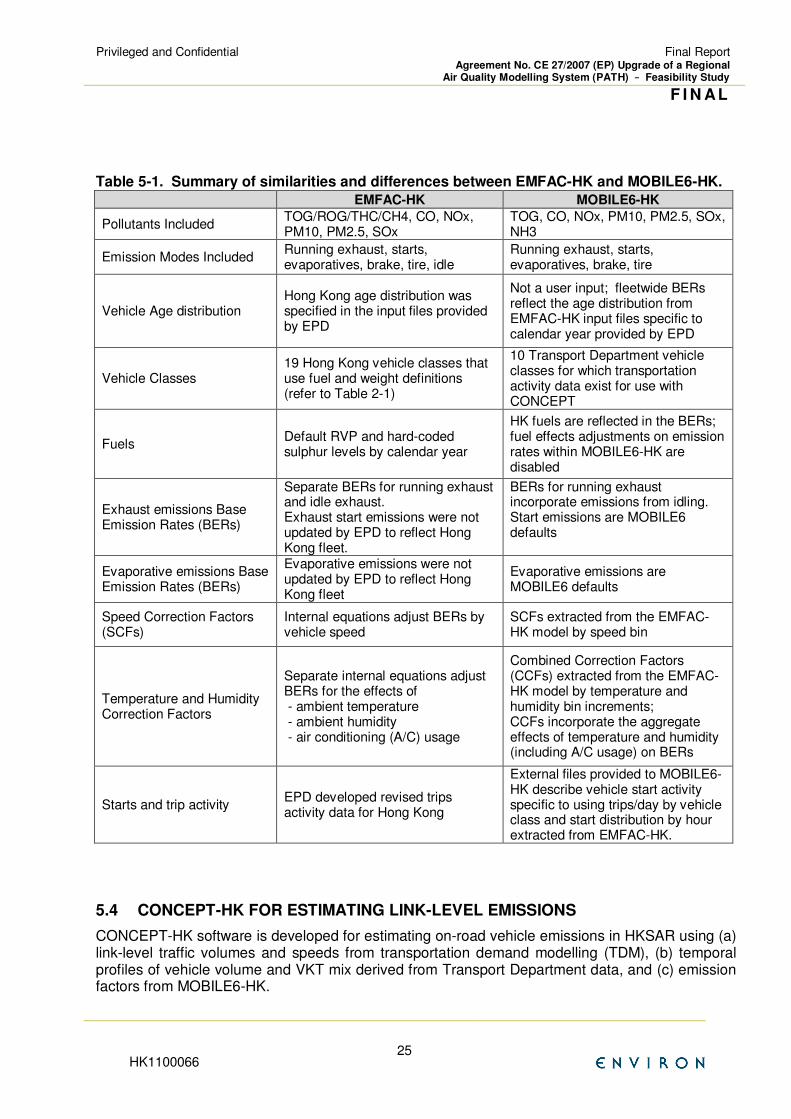
Privileged and Confidential
Final Report Agreement No. CE 27/2007 (EP) Upgrade of a Regional
Air Quality Modelling System (PATH) –––– Feasibility Study
F I N AL
HK1100066 25
Table 5-1. Summary of similarities and differences between EMFAC-HK and MOBILE6-HK. EMFAC-HK MOBILE6-HK
Pollutants Included TOG/ROG/THC/CH4, CO, NOx, PM10, PM2.5, SOx
TOG, CO, NOx, PM10, PM2.5, SOx, NH3
Emission Modes Included Running exhaust, starts, evaporatives, brake, tire, idle
Running exhaust, starts, evaporatives, brake, tire
Vehicle Age distribution Hong Kong age distribution was specified in the input files provided by EPD
Not a user input; fleetwide BERs reflect the age distribution from EMFAC-HK input files specific to calendar year provided by EPD
Vehicle Classes 19 Hong Kong vehicle classes that use fuel and weight definitions (refer to Table 2-1)
10 Transport Department vehicle classes for which transportation activity data exist for use with CONCEPT
Fuels Default RVP and hard-coded sulphur levels by calendar year
HK fuels are reflected in the BERs; fuel effects adjustments on emission rates within MOBILE6-HK are disabled
Exhaust emissions Base Emission Rates (BERs)
Separate BERs for running exhaust and idle exhaust. Exhaust start emissions were not updated by EPD to reflect Hong Kong fleet.
BERs for running exhaust incorporate emissions from idling. Start emissions are MOBILE6 defaults
Evaporative emissions Base Emission Rates (BERs)
Evaporative emissions were not updated by EPD to reflect Hong Kong fleet
Evaporative emissions are MOBILE6 defaults
Speed Correction Factors (SCFs)
Internal equations adjust BERs by vehicle speed
SCFs extracted from the EMFAC-HK model by speed bin
Temperature and Humidity Correction Factors
Separate internal equations adjust BERs for the effects of - ambient temperature - ambient humidity - air conditioning (A/C) usage
Combined Correction Factors (CCFs) extracted from the EMFAC-HK model by temperature and humidity bin increments; CCFs incorporate the aggregate effects of temperature and humidity (including A/C usage) on BERs
Starts and trip activity EPD developed revised trips activity data for Hong Kong
External files provided to MOBILE6-HK describe vehicle start activity specific to using trips/day by vehicle class and start distribution by hour extracted from EMFAC-HK.
5.4 CONCEPT-HK FOR ESTIMATING LINK-LEVEL EMISSIONS
CONCEPT-HK software is developed for estimating on-road vehicle emissions in HKSAR using (a) link-level traffic volumes and speeds from transportation demand modelling (TDM), (b) temporal profiles of vehicle volume and VKT mix derived from Transport Department data, and (c) emission factors from MOBILE6-HK.
Privileged and Confidential
Final Report Agreement No. CE 27/2007 (EP) Upgrade of a Regional
Air Quality Modelling System (PATH) –––– Feasibility Study
F I N AL
HK1100066 26
5.4.1 Link-Level Activity Data
Transportation demand models (TDMs) are used by transportation planning agencies to model transportation networks in local areas, and to project future transportation needs. TDMs work with links in a roadway network. A link is a section of roadway, e.g. from one freeway interchange to the next, or a short local road. For each link, transportation planners estimate the traffic volume and speed, among other factors. The development of TDMs for a local area typically includes the use of travel surveys (in which drivers report all travel and trips for a week or more) and also data from tube and or in-road traffic counters.
Because there are several transportation models in use, all with different requirements and inputs/outputs, ENVIRON developed the TDM Transformation Tool, or T3, to process and provide a conduit from the projections of traffic demand modelers regarding vehicle types, road networks, and vehicle activity to the activity data and file formats required by CONCEPT MV. The primary goals of T3 are to provide an easy mechanism for incorporating TDM model outputs in as “raw” a format as possible, while simultaneously providing a great degree of flexibility in representing the TDM projections in terms acceptable to most air quality models.
5.4.2 HKSAR TDM Data
Transportation network data were provided by MVA Hong Kong Ltd. MVA’s TDM model, MVCTS, provides link-level volumes in passenger car units, speeds, free-flow speeds, and period-level congested speeds from 7am to 11pm for an average weekday. MVA modeled an am peak period from 8am to 9am, and a pm peak period from 6pm to 7pm. For the “inter-peak” period, time from 7am to 8am, 9am to 6pm, and from 7pm until 11pm, MVA modeled an average hourly volume.
Transportation network data were provided by MVA Hong Kong Ltd. MVA’s TDM model, MVCTS, provides link-level volumes in passenger car units, speeds, free-flow speeds, and period-level congested speeds from 7am to 11pm for an average weekday. MVA modeled an am peak period from 8am to 9am, and a pm peak period from 6pm to 7pm. For the “inter-peak” period, time from 7am to 8am, 9am to 6pm, and from 7pm until 11pm, MVA modeled an average hourly volume.
MVCTS has the architecture of a conventional four-stage transport model and has been specially extended to meet the particular requirements of Hong Kong. The basic four stages are:
Trip Generation – this determines how many trips are made.
Trip Distribution – this determines where trips are made.
Modal Choice – this determines which mode of transport is used
Assignment – this determines which route is taken
The modelling approach has been used extensively in Hong Kong and once calibrated is capable of producing useful and accurate forecasts, depending of course on the accuracy of the input assumptions. MVA also provided GIS shapefiles for the end node coordinates of the 3473 links in the model along with roadway type designations; the link coordinates were converted to the Lambert Conformal projection of the modelling domain by ENVIRON to ensure their correct placement in the modelling domain.
5.4.3 Estimation of Overnight Link Volumes
The link volumes input to CONCEPT must be provided for 24 hours, or for groups of hours that cover the full 24-hour day. The link volumes from the transportation model did not include the hours from 11pm until 7am. The 11pm to 7am overnight volumes for each link were estimated using data from the Transport Department; these estimates were made in T3 (TDM Transformation Tool).
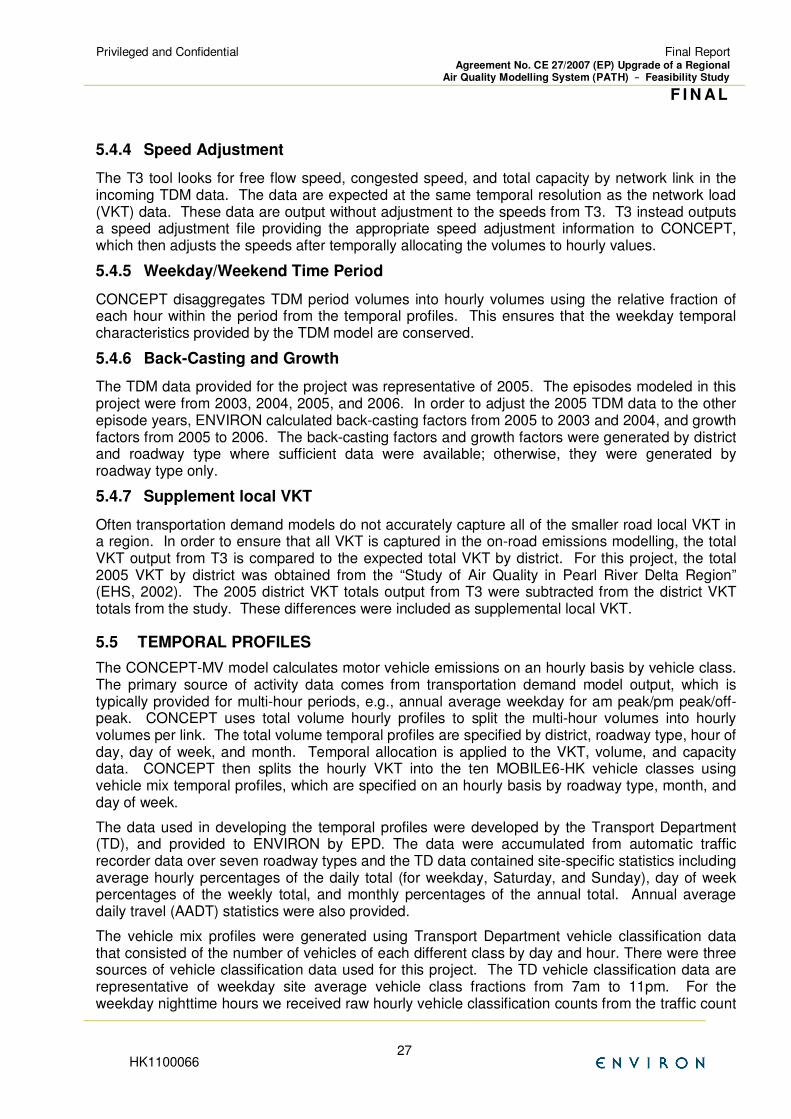
Privileged and Confidential
Final Report Agreement No. CE 27/2007 (EP) Upgrade of a Regional
Air Quality Modelling System (PATH) –––– Feasibility Study
F I N AL
HK1100066 27
5.4.4 Speed Adjustment
The T3 tool looks for free flow speed, congested speed, and total capacity by network link in the incoming TDM data. The data are expected at the same temporal resolution as the network load (VKT) data. These data are output without adjustment to the speeds from T3. T3 instead outputs a speed adjustment file providing the appropriate speed adjustment information to CONCEPT, which then adjusts the speeds after temporally allocating the volumes to hourly values.
5.4.5 Weekday/Weekend Time Period
CONCEPT disaggregates TDM period volumes into hourly volumes using the relative fraction of each hour within the period from the temporal profiles. This ensures that the weekday temporal characteristics provided by the TDM model are conserved.
5.4.6 Back-Casting and Growth
The TDM data provided for the project was representative of 2005. The episodes modeled in this project were from 2003, 2004, 2005, and 2006. In order to adjust the 2005 TDM data to the other episode years, ENVIRON calculated back-casting factors from 2005 to 2003 and 2004, and growth factors from 2005 to 2006. The back-casting factors and growth factors were generated by district and roadway type where sufficient data were available; otherwise, they were generated by roadway type only.
5.4.7 Supplement local VKT
Often transportation demand models do not accurately capture all of the smaller road local VKT in a region. In order to ensure that all VKT is captured in the on-road emissions modelling, the total VKT output from T3 is compared to the expected total VKT by district. For this project, the total 2005 VKT by district was obtained from the “Study of Air Quality in Pearl River Delta Region” (EHS, 2002). The 2005 district VKT totals output from T3 were subtracted from the district VKT totals from the study. These differences were included as supplemental local VKT.
5.5 TEMPORAL PROFILES
The CONCEPT-MV model calculates motor vehicle emissions on an hourly basis by vehicle class. The primary source of activity data comes from transportation demand model output, which is typically provided for multi-hour periods, e.g., annual average weekday for am peak/pm peak/off-peak. CONCEPT uses total volume hourly profiles to split the multi-hour volumes into hourly volumes per link. The total volume temporal profiles are specified by district, roadway type, hour of day, day of week, and month. Temporal allocation is applied to the VKT, volume, and capacity data. CONCEPT then splits the hourly VKT into the ten MOBILE6-HK vehicle classes using vehicle mix temporal profiles, which are specified on an hourly basis by roadway type, month, and day of week.
The data used in developing the temporal profiles were developed by the Transport Department (TD), and provided to ENVIRON by EPD. The data were accumulated from automatic traffic recorder data over seven roadway types and the TD data contained site-specific statistics including average hourly percentages of the daily total (for weekday, Saturday, and Sunday), day of week percentages of the weekly total, and monthly percentages of the annual total. Annual average daily travel (AADT) statistics were also provided.
The vehicle mix profiles were generated using Transport Department vehicle classification data that consisted of the number of vehicles of each different class by day and hour. There were three sources of vehicle classification data used for this project. The TD vehicle classification data are representative of weekday site average vehicle class fractions from 7am to 11pm. For the weekday nighttime hours we received raw hourly vehicle classification counts from the traffic count

Privileged and Confidential
Final Report Agreement No. CE 27/2007 (EP) Upgrade of a Regional
Air Quality Modelling System (PATH) –––– Feasibility Study
F I N AL
HK1100066 28
survey projects performed for EPD (Mercado Solutions Associates, 2006 and 2007; ENVIRON, 2008). Finally, estimates of the weekend hourly vehicle class splits were provided by MVA.
5.6 RESULTS OF THE FOUR EPISODES
CONCEPT MV modelling was performed for the four air quality episodes of interest:
1. September 10 - October 12, 2004
2. November 2 - 3, 2003
3. July 24 - 25, 2006
4. March 16 - 17, 2006
For each of these episodes, CONCEPT MV modelling was done for each episode day, and also for ten spinup days to be used in air quality modelling. CONCEPT MV generates a large number of output reports in text format.
Figure 5-1a through Figure 5-1c show the total VKT by hour of day as well as the VKT by vehicle class for each hour for a weekday, Saturday, and Sunday from the 2003 episode. Figure 5-1a shows the weekday peaks in the morning and afternoon commutes; Figure 5-1b shows relatively uniform VKT during typical working hours; and Figure 5-1c shows overall lower VKT on Sunday as well as relatively lower VKT during the morning hours. On all day types, passenger cars (PC) account for the largest fraction of VKT and taxis (TX) account for the second largest fraction during daytime hours. During overnight hours, taxis account for most of the VKT. Diesel-fueled Light Goods Vehicles (GV) account for the next highest fraction of emissions; for these vehicles Saturday VKT is about 20 percent less than weekday, and Sunday GV VKT is about half of Saturday.
Figure 5-2a shows TOG emissions by episode day and emissions mode for the 2004 episode (including model spinup days); Figure 5-2b shows the same TOG emissions by episode day with contribution by vehicle class. Similarly, Figure 5-3a and Figure 5-3b show NOx emissions and Figure 5-4a and Figure 5-4b show PM2.5 emissions by episode day. Total emissions for all pollutants vary by day of week because of differences in VKT and speed activity; emissions for TOG and NOx also vary across different run days because of differences in meteorological data. Figure 5-4a and Figure 5-4b show a repeating pattern week-to-week for PM2.5 as PM2.5 emissions do not depend on temperature or humidity. For TOG, exhaust emissions dominate, and the majority of the emissions are from passenger cars (HKPC) and taxis (HKTX). NOx emissions are predominantly from exhaust running emissions from gasoline and diesel-fueled vehicles; a small fraction of NOx emissions is from starts for gasoline-fueled vehicles. About half of NOx emissions are from diesel-fueled medium-heavy goods vehicles (HKMHG). PM2.5 emissions are almost all exhaust, with a small fraction from brake and tire wear. Medium-heavy goods vehicles also dominate PM2.5 emissions, with light goods vehicles contributing about a quarter of the emissions.
As part of the quality assurance effort for the CONCEPT modelling, PAVE plots are made of the gridded model-ready emissions to check that the emissions are in the correct locations and of expected magnitudes. An example PAVE plot is shown in Figure 5-5 for PM emissions; the pattern of emissions conforms to the distribution of roadways and expected areas of high vehicle activity.
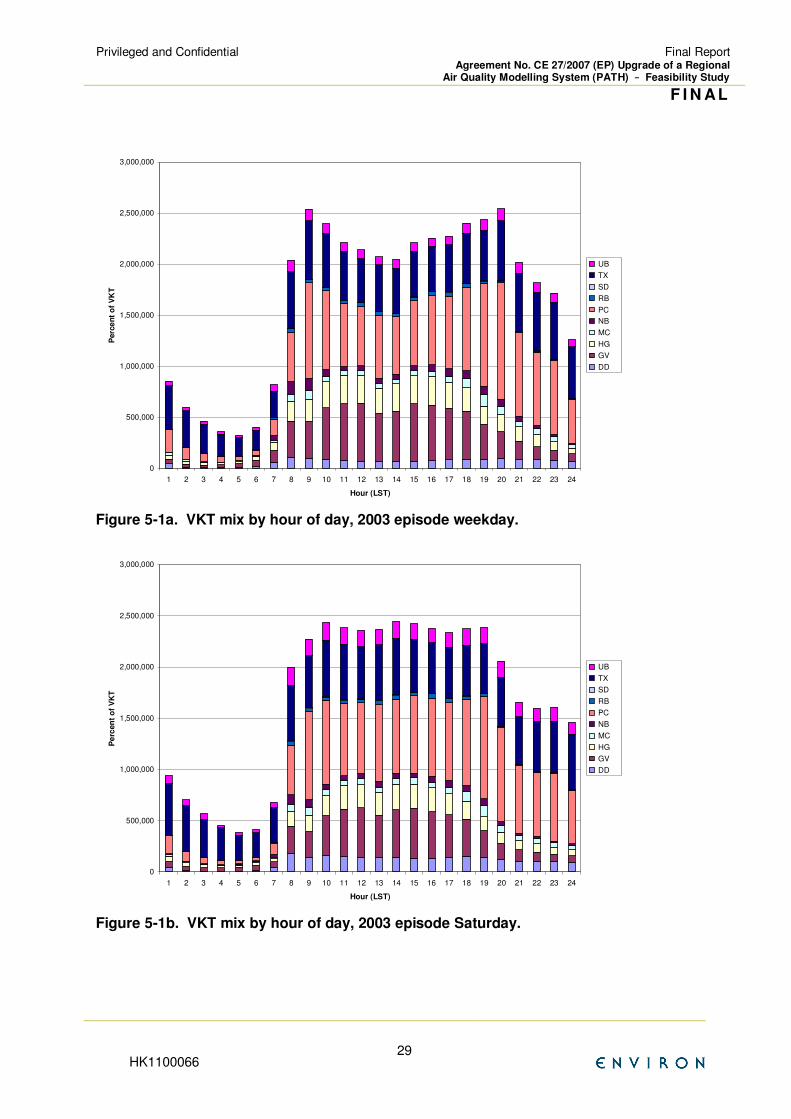
Privileged and Confidential
Final Report Agreement No. CE 27/2007 (EP) Upgrade of a Regional
Air Quality Modelling System (PATH) –––– Feasibility Study
F I N AL
HK1100066 29
Figure 5-1a. VKT mix by hour of day, 2003 episode weekday.
Figure 5-1b. VKT mix by hour of day, 2003 episode Saturday.
0
500,000
1,000,000
1,500,000
2,000,000
2,500,000
3,000,000
1 2 3 4 5 6 7 8 9 10 11 12 13 14 15 16 17 18 19 20 21 22 23 24
Hour (LST)
Perc
en
t o
f V
KT
UB
TX
SD
RB
PC
NB
MC
HG
GV
DD
0
500,000
1,000,000
1,500,000
2,000,000
2,500,000
3,000,000
1 2 3 4 5 6 7 8 9 10 11 12 13 14 15 16 17 18 19 20 21 22 23 24
Hour (LST)
Pe
rcen
t o
f V
KT
UB
TX
SD
RB
PC
NB
MC
HG
GV
DD
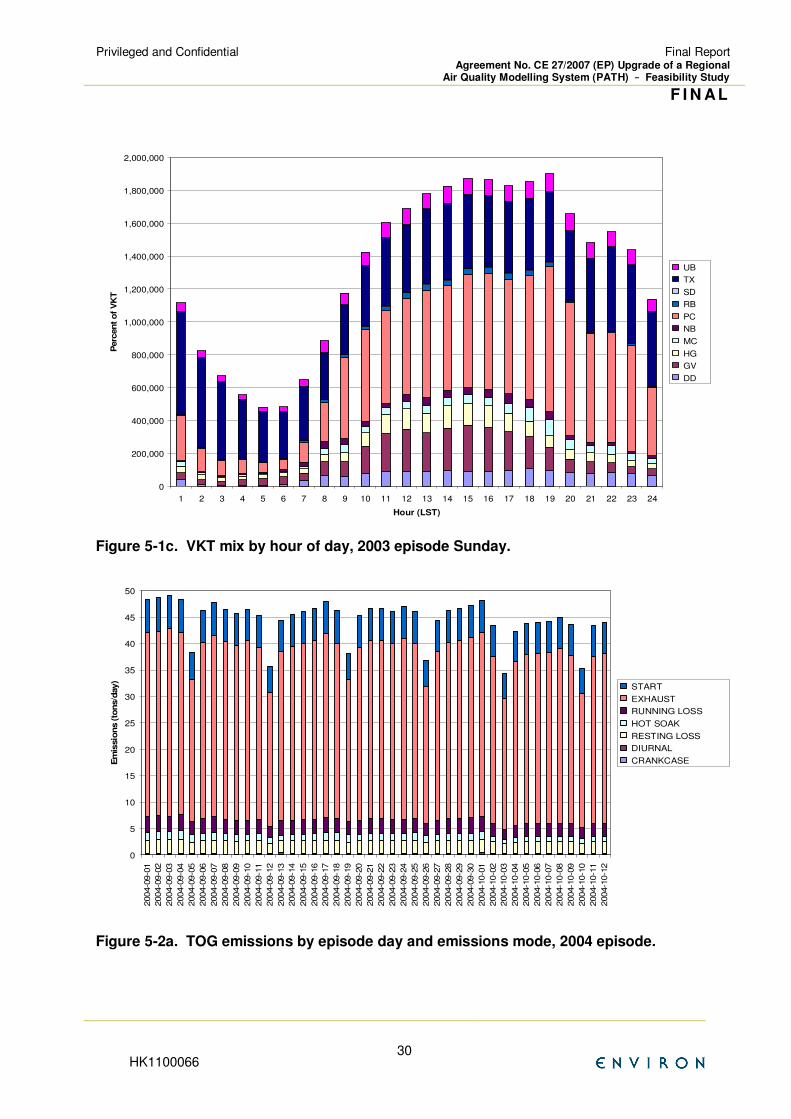
Privileged and Confidential
Final Report Agreement No. CE 27/2007 (EP) Upgrade of a Regional
Air Quality Modelling System (PATH) –––– Feasibility Study
F I N AL
HK1100066 30
Figure 5-1c. VKT mix by hour of day, 2003 episode Sunday.
Figure 5-2a. TOG emissions by episode day and emissions mode, 2004 episode.
0
200,000
400,000
600,000
800,000
1,000,000
1,200,000
1,400,000
1,600,000
1,800,000
2,000,000
1 2 3 4 5 6 7 8 9 10 11 12 13 14 15 16 17 18 19 20 21 22 23 24
Hour (LST)
Perc
en
t o
f V
KT
UB
TX
SD
RB
PC
NB
MC
HG
GV
DD
0
5
10
15
20
25
30
35
40
45
50
2004-0
9-0
1
2004-0
9-0
2
2004-0
9-0
3
2004-0
9-0
4
2004-0
9-0
5
2004-0
9-0
6
2004-0
9-0
7
2004-0
9-0
8
2004-0
9-0
9
2004-0
9-1
0
2004-0
9-1
1
2004-0
9-1
2
2004-0
9-1
3
2004-0
9-1
4
2004-0
9-1
5
2004-0
9-1
6
2004-0
9-1
7
2004-0
9-1
8
2004-0
9-1
9
2004-0
9-2
0
2004-0
9-2
1
2004-0
9-2
2
2004-0
9-2
3
2004-0
9-2
4
2004-0
9-2
5
2004-0
9-2
6
2004-0
9-2
7
2004-0
9-2
8
2004-0
9-2
9
2004-0
9-3
0
2004-1
0-0
1
2004-1
0-0
2
2004-1
0-0
3
2004-1
0-0
4
2004-1
0-0
5
2004-1
0-0
6
2004-1
0-0
7
2004-1
0-0
8
2004-1
0-0
9
2004-1
0-1
0
2004-1
0-1
1
2004-1
0-1
2
Em
issio
ns (to
ns/d
ay)
START
EXHAUST
RUNNING LOSS
HOT SOAK
RESTING LOSS
DIURNAL
CRANKCASE
Privileged and Confidential
Final Report Agreement No. CE 27/2007 (EP) Upgrade of a Regional
Air Quality Modelling System (PATH) –––– Feasibility Study
F I N AL
HK1100066 31
Figure 5-2b. TOG emissions by episode day and vehicle class, 2004 episode.
Figure 5-3a. NOx emissions by episode day and emissions mode, 2004 episode.
0
5
10
15
20
25
30
35
40
45
50 2
00
4-0
9-0
1
200
4-0
9-0
2
200
4-0
9-0
3
200
4-0
9-0
4
200
4-0
9-0
5
200
4-0
9-0
6
200
4-0
9-0
7
200
4-0
9-0
8
200
4-0
9-0
9
200
4-0
9-1
0
200
4-0
9-1
1
200
4-0
9-1
2
200
4-0
9-1
3
200
4-0
9-1
4
200
4-0
9-1
5
200
4-0
9-1
6
200
4-0
9-1
7
200
4-0
9-1
8
200
4-0
9-1
9
200
4-0
9-2
0
200
4-0
9-2
1
200
4-0
9-2
2
200
4-0
9-2
3
200
4-0
9-2
4
200
4-0
9-2
5
200
4-0
9-2
6
200
4-0
9-2
7
200
4-0
9-2
8
200
4-0
9-2
9
200
4-0
9-3
0
200
4-1
0-0
1
200
4-1
0-0
2
200
4-1
0-0
3
200
4-1
0-0
4
200
4-1
0-0
5
200
4-1
0-0
6
200
4-1
0-0
7
200
4-1
0-0
8
200
4-1
0-0
9
200
4-1
0-1
0
200
4-1
0-1
1
200
4-1
0-1
2
Em
iss
ion
s (
ton
s/d
ay
)
HKTAX
HKPUL
HKPRL
HKPC
HKNFB
HKMHG
HKMC
HKLGV
HKFBS
HKFBD
0
20
40
60
80
100
120
2004-0
9-0
1
2004-0
9-0
2
2004-0
9-0
3
2004-0
9-0
4
2004-0
9-0
5
2004-0
9-0
6
2004-0
9-0
7
2004-0
9-0
8
2004-0
9-0
9
2004-0
9-1
0
2004-0
9-1
1
2004-0
9-1
2
2004-0
9-1
3
2004-0
9-1
4
2004-0
9-1
5
2004-0
9-1
6
2004-0
9-1
7
2004-0
9-1
8
2004-0
9-1
9
2004-0
9-2
0
2004-0
9-2
1
2004-0
9-2
2
2004-0
9-2
3
2004-0
9-2
4
2004-0
9-2
5
2004-0
9-2
6
2004-0
9-2
7
2004-0
9-2
8
2004-0
9-2
9
2004-0
9-3
0
2004-1
0-0
1
2004-1
0-0
2
2004-1
0-0
3
2004-1
0-0
4
2004-1
0-0
5
2004-1
0-0
6
2004-1
0-0
7
2004-1
0-0
8
2004-1
0-0
9
2004-1
0-1
0
2004-1
0-1
1
2004-1
0-1
2
Em
issio
ns (
ton
s/d
ay)
START
EXHAUST
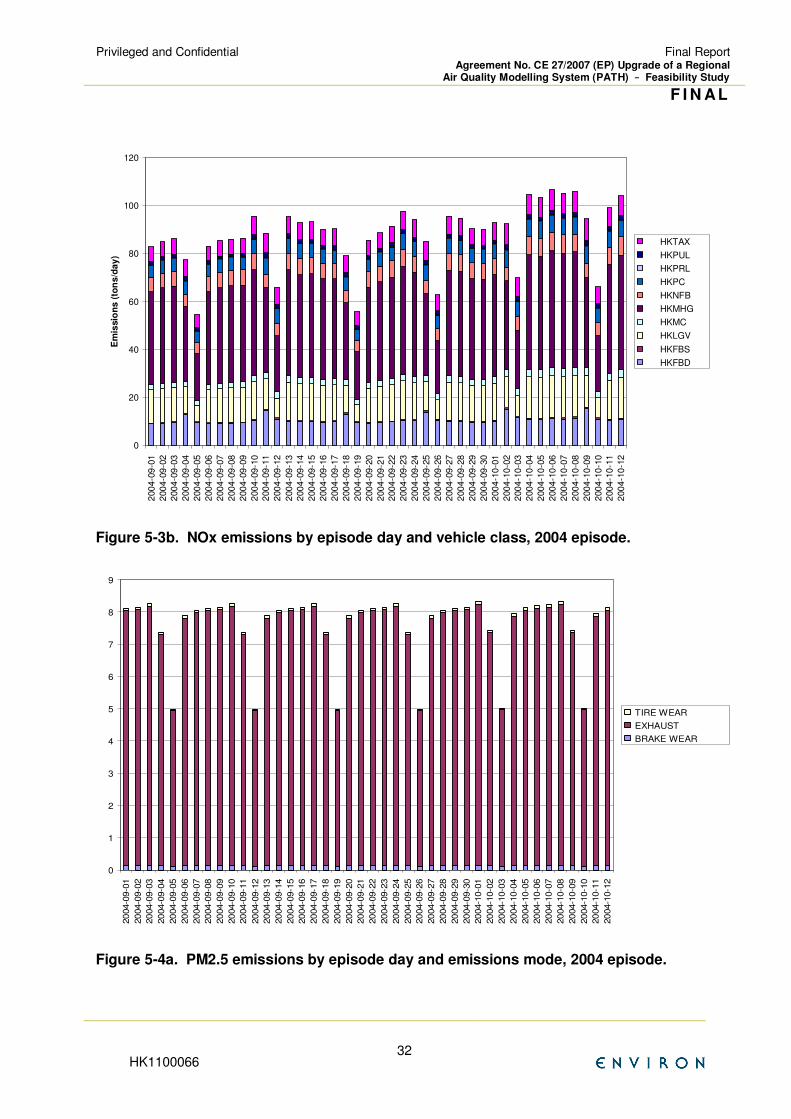
Privileged and Confidential
Final Report Agreement No. CE 27/2007 (EP) Upgrade of a Regional
Air Quality Modelling System (PATH) –––– Feasibility Study
F I N AL
HK1100066 32
Figure 5-3b. NOx emissions by episode day and vehicle class, 2004 episode.
Figure 5-4a. PM2.5 emissions by episode day and emissions mode, 2004 episode.
0
20
40
60
80
100
120 2
00
4-0
9-0
1
200
4-0
9-0
2
200
4-0
9-0
3
200
4-0
9-0
4
200
4-0
9-0
5
200
4-0
9-0
6
200
4-0
9-0
7
200
4-0
9-0
8
200
4-0
9-0
9
200
4-0
9-1
0
200
4-0
9-1
1
200
4-0
9-1
2
200
4-0
9-1
3
200
4-0
9-1
4
200
4-0
9-1
5
200
4-0
9-1
6
200
4-0
9-1
7
200
4-0
9-1
8
200
4-0
9-1
9
200
4-0
9-2
0
200
4-0
9-2
1
200
4-0
9-2
2
200
4-0
9-2
3
200
4-0
9-2
4
200
4-0
9-2
5
200
4-0
9-2
6
200
4-0
9-2
7
200
4-0
9-2
8
200
4-0
9-2
9
200
4-0
9-3
0
200
4-1
0-0
1
200
4-1
0-0
2
200
4-1
0-0
3
200
4-1
0-0
4
200
4-1
0-0
5
200
4-1
0-0
6
200
4-1
0-0
7
200
4-1
0-0
8
200
4-1
0-0
9
200
4-1
0-1
0
200
4-1
0-1
1
200
4-1
0-1
2
Em
issio
ns
(to
ns
/da
y)
HKTAX
HKPUL
HKPRL
HKPC
HKNFB
HKMHG
HKMC
HKLGV
HKFBS
HKFBD
0
1
2
3
4
5
6
7
8
9
2004-0
9-0
1
2004-0
9-0
2
2004-0
9-0
3
2004-0
9-0
4
2004-0
9-0
5
2004-0
9-0
6
2004-0
9-0
7
2004-0
9-0
8
2004-0
9-0
9
2004-0
9-1
0
2004-0
9-1
1
2004-0
9-1
2
2004-0
9-1
3
2004-0
9-1
4
2004-0
9-1
5
2004-0
9-1
6
2004-0
9-1
7
2004-0
9-1
8
2004-0
9-1
9
2004-0
9-2
0
2004-0
9-2
1
2004-0
9-2
2
2004-0
9-2
3
2004-0
9-2
4
2004-0
9-2
5
2004-0
9-2
6
2004-0
9-2
7
2004-0
9-2
8
2004-0
9-2
9
2004-0
9-3
0
2004-1
0-0
1
2004-1
0-0
2
2004-1
0-0
3
2004-1
0-0
4
2004-1
0-0
5
2004-1
0-0
6
2004-1
0-0
7
2004-1
0-0
8
2004-1
0-0
9
2004-1
0-1
0
2004-1
0-1
1
2004-1
0-1
2
TIRE WEAR
EXHAUST
BRAKE WEAR

Privileged and Confidential
Final Report Agreement No. CE 27/2007 (EP) Upgrade of a Regional
Air Quality Modelling System (PATH) –––– Feasibility Study
F I N AL
HK1100066 33
Figure 5-4b. PM2.5 emissions by episode day and vehicle class, 2004 episode.
Figure 5-5. Example PAVE plot of gridded model-ready PM emissions.
0
1
2
3
4
5
6
7
8
9
2004-0
9-0
1
2004-0
9-0
2
2004-0
9-0
3
2004-0
9-0
4
2004-0
9-0
5
2004-0
9-0
6
2004-0
9-0
7
2004-0
9-0
8
2004-0
9-0
9
2004-0
9-1
0
2004-0
9-1
1
2004-0
9-1
2
2004-0
9-1
3
2004-0
9-1
4
2004-0
9-1
5
2004-0
9-1
6
2004-0
9-1
7
2004-0
9-1
8
2004-0
9-1
9
2004-0
9-2
0
2004-0
9-2
1
2004-0
9-2
2
2004-0
9-2
3
2004-0
9-2
4
2004-0
9-2
5
2004-0
9-2
6
2004-0
9-2
7
2004-0
9-2
8
2004-0
9-2
9
2004-0
9-3
0
2004-1
0-0
1
2004-1
0-0
2
2004-1
0-0
3
2004-1
0-0
4
2004-1
0-0
5
2004-1
0-0
6
2004-1
0-0
7
2004-1
0-0
8
2004-1
0-0
9
2004-1
0-1
0
2004-1
0-1
1
2004-1
0-1
2
HKTAX
HKPUL
HKPRL
HKPC
HKNFB
HKMHG
HKMC
HKLGV
HKFBS
HKFBD
Privileged and Confidential
Final Report Agreement No. CE 27/2007 (EP) Upgrade of a Regional
Air Quality Modelling System (PATH) –––– Feasibility Study
F I N AL
HK1100066 34
6. Chemical Transport Model
6.1 INTRODUCTION
The Study Team reviewed the current configuration of PATH and, based on the findings, recommended a set of preliminary configurations for the Community Multiscale Air Quality (CMAQ) and Comprehensive Air-quality Model with extensions (CAMx) CTMs, including photolysis rates, albedo, chemical mechanism, advection and diffusion schemes, chemistry solver, plume-in-grid scheme, aerosol scheme, cloud physics, and other model options. In addition, the current initial concentration and boundary condition (ICBC) data for PATH was reviewed and recommendations provided for alternative sources of ICBC data based on global chemistry model output.
The Study Team prepared model-ready emission and meteorological input data for the CMAQ and CAMx models from the output data of the SMOKE and CONCEPT emissions models and the MM5 and WRF meteorological models for all four modelling episodes.
6.2 MODEL SELECTION
6.2.1 Community Multiscale Air Quality (CMAQ) Modelling System
For more than a decade, the United States Environmental Protection Agency (EPA) has been developing the Models-3 Community Multiscale Air Quality (CMAQ) modelling system with the overarching aim of producing a ‘One-Atmosphere’ air quality modelling system capable of addressing ozone, particulate matter (PM), visibility and acid deposition within a common platform. The most recent renditions at this time are CMAQ Version 4.7 (V4.7) publicly released in October 2008 and Version 4.7.1 released in June 2010, although the current Study started with the CMAQ V4.6 that was released in October 2006.
CMAQ consists of a core Chemical Transport Model (CTM) and several pre-processors including the Meteorological-Chemistry Interface Processor (MCIP), initial and boundary conditions processors (ICON and BCON) and a photolysis rates processor (JPROC). A number of features in CMAQ’s theoretical formulation and technical implementation make the model well-suited for ozone and particulate matter (PM) modelling.
The CMAQ Version 4.6 was used initially in the HK/PRD modelling. We updated to the October 2008 version of CMAQ (V4.7) as part of the sensitivity test modelling. In particular, the new October 2008 V4.7 of CMAQ includes many SOA processes that are missing in the standard version of CMAQ, which was initially addressed with the SOAmods enhancement that was used extensively for regional PM and visibility modelling in the U.S. (Morris et al., 2006)
6.2.2 Comprehensive Air-Quality Model with Extensions (CAMx)
The Comprehensive Model with Extensions (CAMx; ENVIRON, 2008d) modelling system is a publicly available (www.camx.com) three-dimensional multi-scale photochemical/aerosol grid modelling system that has been developed and maintained by ENVIRON International Corporation. The version of CAMx most used in the PATH upgrade study was Version 5.2 released in April 2010, although the PATH upgrade study started with CAMx Version 4.51 released in May 2008.
The CAMx V4.51 was employed and the model was set up and exercised on the same 27/9/3/1 km grid as CMAQ. However, in the initial configuration CAMx was run using two-way grid nesting on the 27/9 km domains with one-way nesting employed between the 9 km and 3 km and 3 km and 1 km domains (CMAQ does not support two-way grid nesting). The entire 27/9/3/1 km grid structure was too large to model using two-way grid nesting among all four domains using typical computer memory. Most sensitivity tests just varied parameters within the 3 km and 1 km domains so
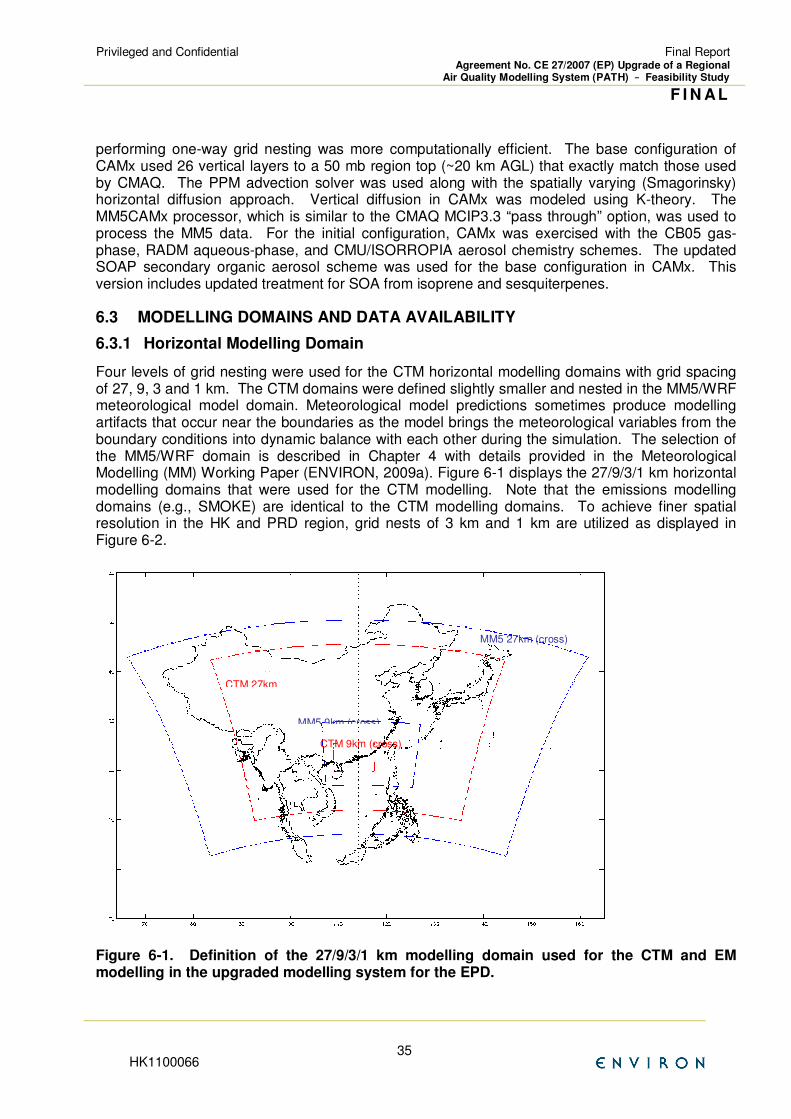
Privileged and Confidential
Final Report Agreement No. CE 27/2007 (EP) Upgrade of a Regional
Air Quality Modelling System (PATH) –––– Feasibility Study
F I N AL
HK1100066 35
performing one-way grid nesting was more computationally efficient. The base configuration of CAMx used 26 vertical layers to a 50 mb region top (~20 km AGL) that exactly match those used by CMAQ. The PPM advection solver was used along with the spatially varying (Smagorinsky) horizontal diffusion approach. Vertical diffusion in CAMx was modeled using K-theory. The MM5CAMx processor, which is similar to the CMAQ MCIP3.3 “pass through” option, was used to process the MM5 data. For the initial configuration, CAMx was exercised with the CB05 gas-phase, RADM aqueous-phase, and CMU/ISORROPIA aerosol chemistry schemes. The updated SOAP secondary organic aerosol scheme was used for the base configuration in CAMx. This version includes updated treatment for SOA from isoprene and sesquiterpenes.
6.3 MODELLING DOMAINS AND DATA AVAILABILITY
6.3.1 Horizontal Modelling Domain
Four levels of grid nesting were used for the CTM horizontal modelling domains with grid spacing of 27, 9, 3 and 1 km. The CTM domains were defined slightly smaller and nested in the MM5/WRF meteorological model domain. Meteorological model predictions sometimes produce modelling artifacts that occur near the boundaries as the model brings the meteorological variables from the boundary conditions into dynamic balance with each other during the simulation. The selection of the MM5/WRF domain is described in Chapter 4 with details provided in the Meteorological Modelling (MM) Working Paper (ENVIRON, 2009a). Figure 6-1 displays the 27/9/3/1 km horizontal modelling domains that were used for the CTM modelling. Note that the emissions modelling domains (e.g., SMOKE) are identical to the CTM modelling domains. To achieve finer spatial resolution in the HK and PRD region, grid nests of 3 km and 1 km are utilized as displayed in Figure 6-2.
Figure 6-1. Definition of the 27/9/3/1 km modelling domain used for the CTM and EM modelling in the upgraded modelling system for the EPD.
CTM 27km
MM5 27km (cross)
CTM 9km (cross)
MM5 9km (cross)
Center (28.5N, 114OE)
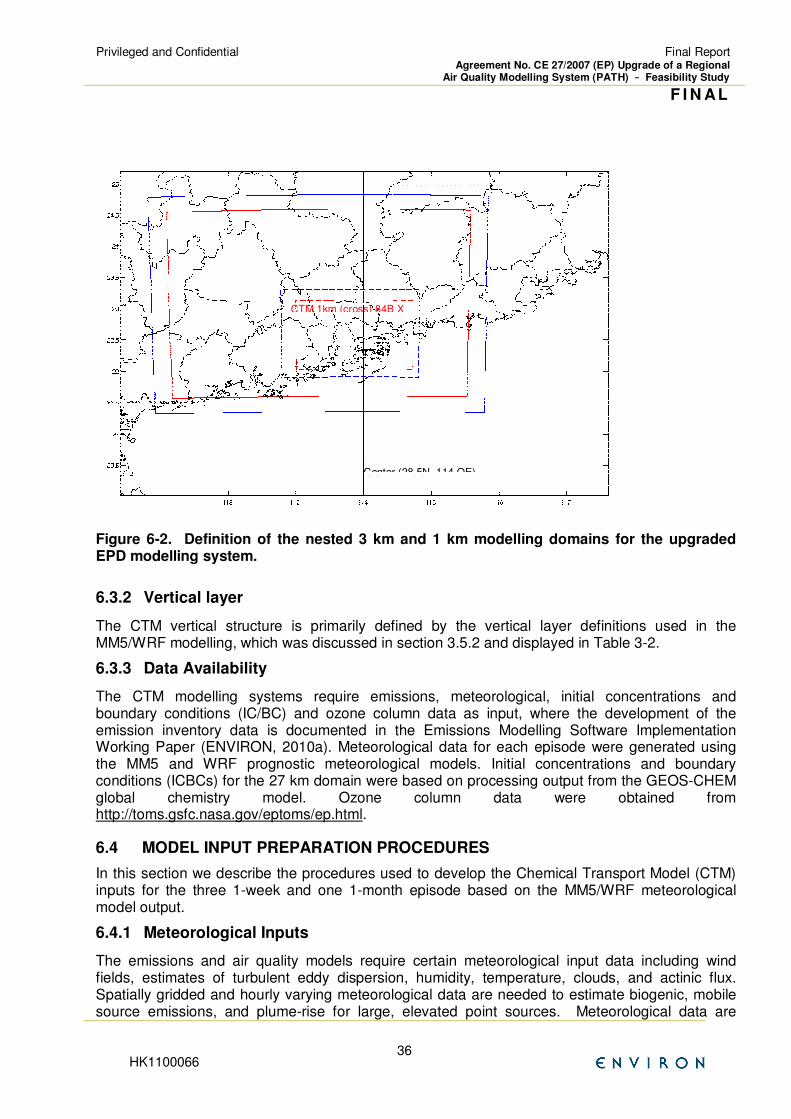
Privileged and Confidential
Final Report Agreement No. CE 27/2007 (EP) Upgrade of a Regional
Air Quality Modelling System (PATH) –––– Feasibility Study
F I N AL
HK1100066 36
Figure 6-2. Definition of the nested 3 km and 1 km modelling domains for the upgraded EPD modelling system.
6.3.2 Vertical layer
The CTM vertical structure is primarily defined by the vertical layer definitions used in the MM5/WRF modelling, which was discussed in section 3.5.2 and displayed in Table 3-2.
6.3.3 Data Availability
The CTM modelling systems require emissions, meteorological, initial concentrations and boundary conditions (IC/BC) and ozone column data as input, where the development of the emission inventory data is documented in the Emissions Modelling Software Implementation Working Paper (ENVIRON, 2010a). Meteorological data for each episode were generated using the MM5 and WRF prognostic meteorological models. Initial concentrations and boundary conditions (ICBCs) for the 27 km domain were based on processing output from the GEOS-CHEM global chemistry model. Ozone column data were obtained from http://toms.gsfc.nasa.gov/eptoms/ep.html.
6.4 MODEL INPUT PREPARATION PROCEDURES
In this section we describe the procedures used to develop the Chemical Transport Model (CTM) inputs for the three 1-week and one 1-month episode based on the MM5/WRF meteorological model output.
6.4.1 Meteorological Inputs
The emissions and air quality models require certain meteorological input data including wind fields, estimates of turbulent eddy dispersion, humidity, temperature, clouds, and actinic flux. Spatially gridded and hourly varying meteorological data are needed to estimate biogenic, mobile source emissions, and plume-rise for large, elevated point sources. Meteorological data are
CTM 1km (cross) 84B X
Center (28.5N, 114.OE)
Privileged and Confidential
Final Report Agreement No. CE 27/2007 (EP) Upgrade of a Regional
Air Quality Modelling System (PATH) –––– Feasibility Study
F I N AL
HK1100066 37
needed to drive chemical transport models for solving atmospheric diffusion and chemistry equations for model species. Because observed data are not available for the full gridded model domain, numerical meteorological models are used to provide these inputs.
The National Center for Atmospheric Research (NCAR)/Pennsylvania State University (PSU) Fifth-Generation Mesoscale Model (MM5) (v3.6) and the NCAR Weather Research Forecast (WRF) meteorological models were applied by Hong Kong UST to simulate meteorology at a 27/9/3/1 km resolution for the three 1-week and one 1-month episodes. A separate Working Paper describes the meteorological modelling application and evaluation performed as part of this Study (ENVIRON, 2009a). After the MM5/WRF simulations were completed, the output files were processed using Version 3.3 of the Models-3 CMAQ Meteorological-Chemical Interface Processor (MCIP) and the latest version of the Met2CAMx processor to generate meteorological fields that were used for emissions processing and air quality simulations.
6.4.2 Development of Emission Inputs
The base year emissions inventory for the PATH upgrade modelling was based on a 2005 emission inventories that was obtained from the EPD for the HK and PRD region (i.e., domains D3 and D4) and from the INTEX-B emissions for the greater China area covered by the 27 and 9 km grids (i.e., domains D1 and D2). The INTEX-B emissions were re-gridded for the 27 and 9 km domains, whereas the HK and EPD emissions were processed for the 3 and 1 km domains.
The HK and PRD emissions were converted to Inventory Data Analyzer (IDA) format and the data were processed for air quality modelling using the SMOKE model for all four modelling episodes. The emissions data were also converted to the format required by CONCEPT and processed by SMOKE for episode 3 (July 2006). With the exception of on-road mobile sources for the HK region where the CONCEPT MV emissions model uses highly resolved link-based VKT and fleet data, the SMOKE and CONCEPT emissions models produced nearly identical emission inputs for the CTMs. However, the SMOKE emissions model runs substantially faster than CONCEPT. Thus, with one exception, the SMOKE emissions model was selected as the primary emissions modelling for generating CTM emission inputs for the 3/1 km modelling domains. The exception is for on-road mobile sources where the CONCEPT MV model was the primary emissions model for the 1 km modelling domain. The development of emission inventories for the PATH system upgrade study is documented in the Emissions Modelling (EM) Software Implementation Working Paper (ENVIRON, 2010a) and the Transportation Data (TD) Compilation and Modelling Implementation Working Paper (ENVIRON, 2010b)
6.4.3 Development of Initial and Boundary Conditions
Initial Concentrations (ICs) and Boundary Condition (BCs) concentrations for the 27 km regional Asia modelling domain were based on processing of output data from the GEOS-CHEM Global Chemistry Model. The two CTMs were initialized ~10 days before the first episode day to eliminate the influence of the Initial Concentrations (ICs). For example, for Episode#1 (September 10 – October 12, 2004), the CTM 27 km Asia modelling domain was initialized on September 1, 2004 using three-dimensional concentration output from the GEOS-CHEM global chemistry model.
6.5 INITIAL MODEL PERFORMANCE EVALUATION
6.5.1 Overview
A critical component of every air quality modelling study is the model performance evaluation (MPE) where the model estimates for the current year base case are compared against observed values to assess the model’s accuracy and provide an indication of its reliability. The MPE approach that has been adopted is consistent with the approach recommended by the U.S. EPA
Privileged and Confidential
Final Report Agreement No. CE 27/2007 (EP) Upgrade of a Regional
Air Quality Modelling System (PATH) –––– Feasibility Study
F I N AL
HK1100066 38
for regulatory decision-making as part of the development of U.S. State Implementation Plans (SIPs) as outlined in the U.S. EPA’s modelling guidance (EPA, 2007).
The main focus of the PATH modelling system at this time is on ozone and fine particulate matter (PM2.5). In order to assure that the modelling system is operating correctly, it must not only be evaluated for ozone and PM, but also for its precursors and other key indicator species. In addition, PM is made up of numerous components each of which should be evaluated separately. These components are:
• Sulfate (SO4);
• Nitrate (NO3);
• Ammonium (NH4);
• Organic Aerosol (OA, also referred to as Organic Carbon);
• Elemental Carbon (EC);
• Sea Salt
• Other Inorganic fine Particulate (also referred to as other PM2.5, crustal material and Soil); and
• Coarse Particulate (PMC).
Various statistical performance measures, graphical tools, and related analytical procedures were used to evaluate the grid-based CTMs with details presented in the Chemical Transport Model Implementation Working Paper (ENVIRON 2010c)
6.5.2 Model Performance Evaluation Conclusions
The two CTMs were evaluated against ozone, PM2.5, SO2, NO2 and CO concentrations within the Hong Kong SAR using the four historical test episodes from 2003 to 2006. The performance for several precursor concentrations in the HK region (e.g., NO2) was quite good suggesting that the emissions inventory for the HK SAR was well characterized. However, the representation of the historical emissions for the PRD outside of the HK region is highly questionable. For example, Zhang and co-workers (2009) found that in order to resolve the mainland China emissions and their global chemistry modelling results, the NOX emissions had to be increased substantially. Thus, in addition to the usual uncertainties associated with meteorology and emissions, we are dealing with a regional emissions inventory that under-represents actual emissions. Given these caveats, the performance of the two CTMs was quite encouraging with the models generally estimating higher ozone and PM concentrations when observed concentrations were higher and also reproducing the clean out days. In fact, on some ozone episode days the ozone performance was fairly good. For example, the CAMx and CMAQ performance for the July 2006 episode using the WRF meteorological inputs was quite good. However, the CAMx and CMAQ ozone performance for the July 2006 episode using the MM5 meteorological inputs was not as good as when WRF inputs were utilized. The reasons for this were unclear.
6.6 DIAGNOSTIC SENSITIVITY TEST
Diagnostic sensitivity tests were performed to determine whether alternative model configuration and options can improve model performance. Model diagnostic sensitivity tests were also used to help understand model sensitivity to key inputs, including emissions that can help guide future air pollution abatement strategies.
Several CTM sensitivity tests were performed as given in Table 6-1 and were designed to examine the following issues:
• Corrected HK off-link and elevated marine emissions;
Privileged and Confidential
Final Report Agreement No. CE 27/2007 (EP) Upgrade of a Regional
Air Quality Modelling System (PATH) –––– Feasibility Study
F I N AL
HK1100066 39
• Alternative meteorological model (MM: WRF vs. MM5);
• Alternative chemical transport model (CTM: CMAQ vs. CAMx);
• Alternative photochemical mechanism (CB05 vs. SAPRC99);
• Alternative biogenic emissions model (MEGAN vs. BEIS);
• Alternative on-road mobile source emissions factor model (EMFAC-HK vs. MOBILE6);
• Alternative emissions processing system for area, non-road and point sources (CONCEPT vs. SMOKE);
• More recent version of the CMAQ modelling system (CMAQ V4.7 released October 2008) (CMAQ V4.6 vs. CMAQ V4.7);
• More recent versions of the CAMx modelling system (CAMx V5.21 variant of CAMx V5.2 released April 2010) (CAMx V4.51 vs. CAMx V5.21);
• Use of the Eddy vertical exchange algorithm in CMAQ instead of the Asymmetric Convective Mixing (ACM2) algorithm used in the initial configuration (Eddy vs. ACM2);
• Use of in-line plume rise in CMAQ (in-line plume rise vs. 3-D emissions);
• Use of ORSM MM to drive MM5 (ORSM/MM5/CMAQ vs. FNL/MM5/CMAQ); and
• Use of ECMWF MM to drive MM5 (ECMWF/MM5/CMAQ vs. FNL/MM5/CMAQ).
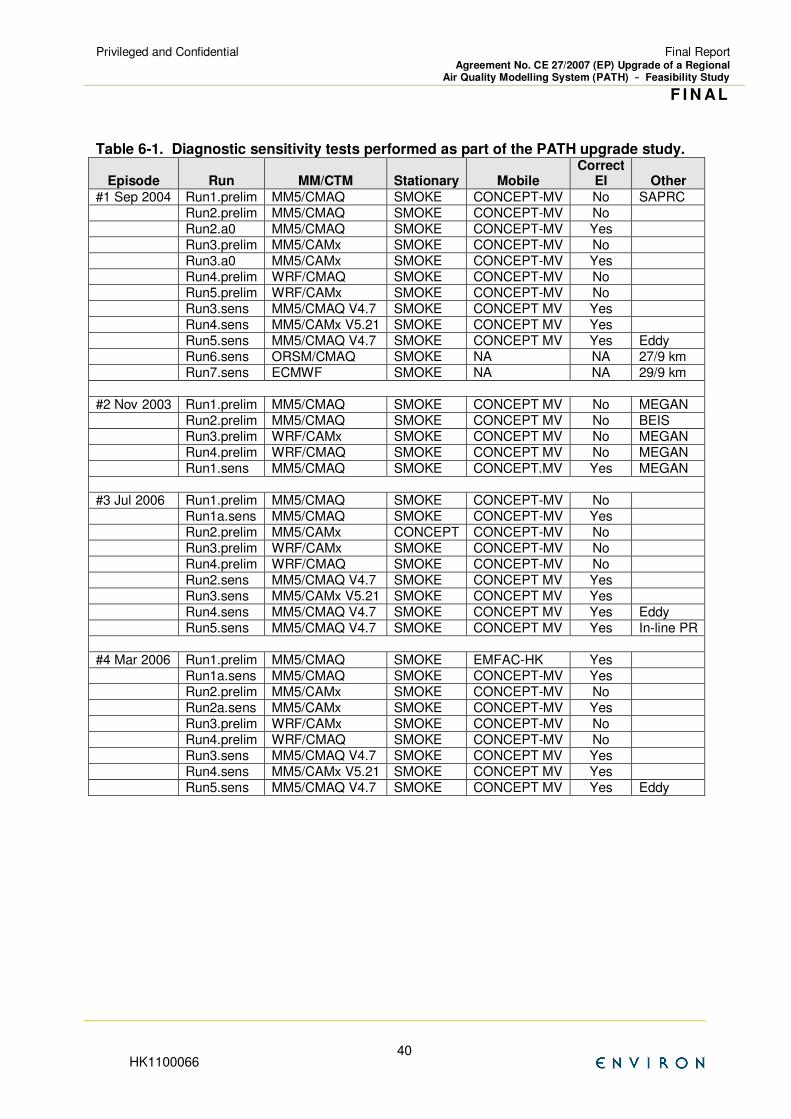
Privileged and Confidential
Final Report Agreement No. CE 27/2007 (EP) Upgrade of a Regional
Air Quality Modelling System (PATH) –––– Feasibility Study
F I N AL
HK1100066 40
Table 6-1. Diagnostic sensitivity tests performed as part of the PATH upgrade study.
Episode Run MM/CTM Stationary Mobile Correct
EI Other
#1 Sep 2004 Run1.prelim MM5/CMAQ SMOKE CONCEPT-MV No SAPRC Run2.prelim MM5/CMAQ SMOKE CONCEPT-MV No Run2.a0 MM5/CMAQ SMOKE CONCEPT-MV Yes Run3.prelim MM5/CAMx SMOKE CONCEPT-MV No Run3.a0 MM5/CAMx SMOKE CONCEPT-MV Yes Run4.prelim WRF/CMAQ SMOKE CONCEPT-MV No Run5.prelim WRF/CAMx SMOKE CONCEPT-MV No Run3.sens MM5/CMAQ V4.7 SMOKE CONCEPT MV Yes Run4.sens MM5/CAMx V5.21 SMOKE CONCEPT MV Yes Run5.sens MM5/CMAQ V4.7 SMOKE CONCEPT MV Yes Eddy Run6.sens ORSM/CMAQ SMOKE NA NA 27/9 km Run7.sens ECMWF SMOKE NA NA 29/9 km
#2 Nov 2003 Run1.prelim MM5/CMAQ SMOKE CONCEPT MV No MEGAN Run2.prelim MM5/CMAQ SMOKE CONCEPT MV No BEIS Run3.prelim WRF/CAMx SMOKE CONCEPT MV No MEGAN Run4.prelim WRF/CMAQ SMOKE CONCEPT MV No MEGAN Run1.sens MM5/CMAQ SMOKE CONCEPT.MV Yes MEGAN
#3 Jul 2006 Run1.prelim MM5/CMAQ SMOKE CONCEPT-MV No Run1a.sens MM5/CMAQ SMOKE CONCEPT-MV Yes Run2.prelim MM5/CAMx CONCEPT CONCEPT-MV No Run3.prelim WRF/CAMx SMOKE CONCEPT-MV No Run4.prelim WRF/CMAQ SMOKE CONCEPT-MV No Run2.sens MM5/CMAQ V4.7 SMOKE CONCEPT MV Yes Run3.sens MM5/CAMx V5.21 SMOKE CONCEPT MV Yes Run4.sens MM5/CMAQ V4.7 SMOKE CONCEPT MV Yes Eddy Run5.sens MM5/CMAQ V4.7 SMOKE CONCEPT MV Yes In-line PR
#4 Mar 2006 Run1.prelim MM5/CMAQ SMOKE EMFAC-HK Yes Run1a.sens MM5/CMAQ SMOKE CONCEPT-MV Yes Run2.prelim MM5/CAMx SMOKE CONCEPT-MV No Run2a.sens MM5/CAMx SMOKE CONCEPT-MV Yes Run3.prelim WRF/CAMx SMOKE CONCEPT-MV No Run4.prelim WRF/CMAQ SMOKE CONCEPT-MV No Run3.sens MM5/CMAQ V4.7 SMOKE CONCEPT MV Yes Run4.sens MM5/CAMx V5.21 SMOKE CONCEPT MV Yes Run5.sens MM5/CMAQ V4.7 SMOKE CONCEPT MV Yes Eddy

Privileged and Confidential
Final Report Agreement No. CE 27/2007 (EP) Upgrade of a Regional
Air Quality Modelling System (PATH) –––– Feasibility Study
F I N AL
HK1100066 41
Although comparisons of the alternative MM and CTM were investigated using all four test episodes, the model sensitivity for most alternative configuration or option was investigated using just some of the four episodes, and in some cases just one episode. Table 6-2 lists the comparisons of the alternative models or configurations that were investigated for each episode. Details on the results of the model sensitivity tests are provided in the CTM Working Paper (ENVIRON, 2010c).
Table 6-2. Comparison of model sensitivity tests to examine model sensitivity to specific models, configuration and options.
Pairings for Comparison of Specific Model Sensitivity Parameter by Episode
Episode Model One
Model Two Effect
#1 Sep 2004 Run2.prelim Run2.a0 Corrected HK off-link and marine EI in CMAQ Run3.prelim Run3.a0 Corrected HK off-link and marine EI in CAMx Run2.a0 Run3.a0 CMAQ vs. CAMx using MM5 Run2.prelim Run1.prelim CB05 vs. SAPRC chemistry Run2.prelim Run4.prelim MM5 vs. WRF in CMAQ Run3.prelim Run5.prelim MM5 vs. WRF in CAMx Run4.prelim Run5.prelim CMAQ vs. CAMx using WRF Run2.a0 Run3.sens CMAQ V4.6 vs. V4.7 Run3.a0 Run4.sens CAMx V4.521 vs. V5.21 Run3.sens Run5.sens ACM2 vs. Eddy VDIF Run3.sens Run6.sens FNL/MM5 vs. ORSM/MM5 in CMAQ Run3.sens Run7.sens FNL/MM5 vs. ECMWF/MM5 in CMAQ #2 Nov 2003 Run1.prelim Run1.sens Corrected HK off-link and marine EI in CMAQ Run1.prelim Run2.prelim Effect of MEGAN vs. BEIS in CMAQ Run1.prelim Run4.prelim MM5 vs. WRF in CMAQ Run3.prelim Run4.prelim CMAQ vs. CAMx using WRF #3 Jul 2006 Run1.prelim Run1a.sens Corrected HK off-link and marine EI Run1.prelim Run2.prelim CAMx vs. CMAQ using MM5 (w/
SMOKE/CONCEPT confusion) Run1.prelim Run4.prelim MM5 vs. WRF in CMAQ Run2.prelim Run3.prelim MM5 vs. WRF in CAMx (w/ SMOKE/CONCEPT
confusion) Run4.prelim Run3.prelim CMAQ vs. CAMx using WRF Run1a.sens Run2.sens CMAQ V4.6 vs. V4.7 Run2.prelim Run3.sens CAMx V4.51 vs. V5.21 Run2.sens Run4.sens ACM2 vs. Eddy VDIF Run2.sens Run5.sens 3-D EI vs. in-line plume rise #4 Mar 2006 Run1a.sens Run1.prelim EMFAC-HK vs. CONCEPT MV in CMAQ Run1a.sens Run2.prelim CMAQ vs. CAMx using MM5 (w/ corrected EI
confusion) Run2a.sens Run2.prelim Corrected HK off-link and marine EI Run2.prelim Run3.prelim MM5 vs. WRF in CAMx Run1a.sens Run4.prelim MM5 vs. WRF in CMAQ Run4.prelim Run3.prelim CMAQ vs. CAMx using WRF Run1a.sens Run3.sens CMAQ V4.6 vs. V4.7 Run2a.sens Run4.sens CAMx V4.51 vs. V5.21 (w/ corrected EI
confusion) Run1a.sens Run5.sens ACM2 vs. Eddy VDIF
Privileged and Confidential
Final Report Agreement No. CE 27/2007 (EP) Upgrade of a Regional
Air Quality Modelling System (PATH) –––– Feasibility Study
F I N AL
HK1100066 42
6.7 FINAL MODEL CONFIGURATION
The definition of the final model configurations was based on the results of the preliminary modelling results and model performance evaluation, as well as the results of the model sensitivity simulations. Tables 6-3 and 6-4 contain the initial and final configurations for the, respectively, CMAQ and CAMx CTMs. The biggest difference in the initial and final versions of the CTMs for the PATH upgrade study are the versions of the CTMs. As the PATH upgrade study has progressed, newer improved versions of the CTMs have been released and we adopted the very latest versions available at the time of the study. In some cases by adopting the newer version of the CTM we obtain technical improvements to the models not reflected in Tables 6-3 and 6-4. For example, the ISORROPIA aerosol thermodynamics module in CMAQ V4.7.1 has many improvements over the one in CMAQ V4.6. In other cases, the newer CTMs have new improved algorithms or options. For example, CAMx has upgraded its chemistry solver from the CMC to EBI. In addition, the newer CAMx CTM has a newer dry deposition scheme (Zhang et al., 2003; 2006) than used in the initial configuration (Wesely, 1989).
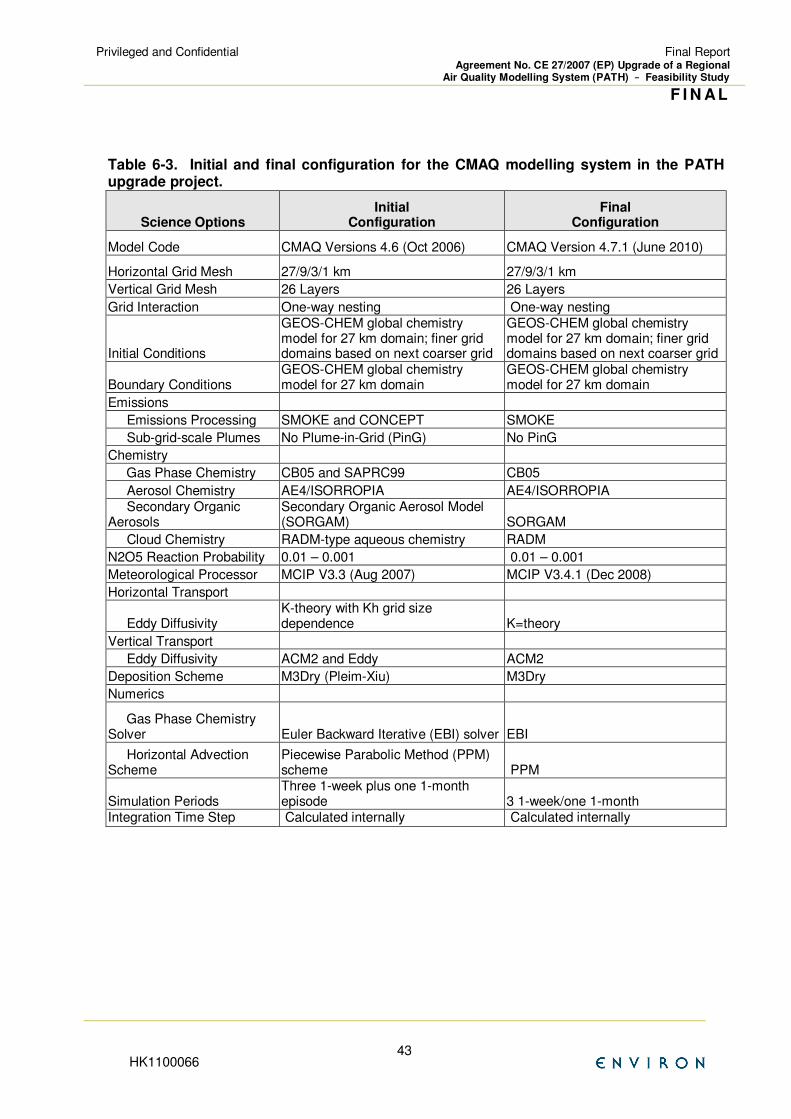
Privileged and Confidential
Final Report Agreement No. CE 27/2007 (EP) Upgrade of a Regional
Air Quality Modelling System (PATH) –––– Feasibility Study
F I N AL
HK1100066 43
Table 6-3. Initial and final configuration for the CMAQ modelling system in the PATH upgrade project.
Science Options Initial
Configuration Final
Configuration
Model Code CMAQ Versions 4.6 (Oct 2006) CMAQ Version 4.7.1 (June 2010)
Horizontal Grid Mesh 27/9/3/1 km 27/9/3/1 km
Vertical Grid Mesh 26 Layers 26 Layers
Grid Interaction One-way nesting One-way nesting
Initial Conditions
GEOS-CHEM global chemistry model for 27 km domain; finer grid domains based on next coarser grid
GEOS-CHEM global chemistry model for 27 km domain; finer grid domains based on next coarser grid
Boundary Conditions GEOS-CHEM global chemistry model for 27 km domain
GEOS-CHEM global chemistry model for 27 km domain
Emissions
Emissions Processing SMOKE and CONCEPT SMOKE
Sub-grid-scale Plumes No Plume-in-Grid (PinG) No PinG
Chemistry
Gas Phase Chemistry CB05 and SAPRC99 CB05
Aerosol Chemistry AE4/ISORROPIA AE4/ISORROPIA Secondary Organic Aerosols
Secondary Organic Aerosol Model (SORGAM) SORGAM
Cloud Chemistry RADM-type aqueous chemistry RADM
N2O5 Reaction Probability 0.01 – 0.001 0.01 – 0.001
Meteorological Processor MCIP V3.3 (Aug 2007) MCIP V3.4.1 (Dec 2008)
Horizontal Transport
Eddy Diffusivity K-theory with Kh grid size dependence K=theory
Vertical Transport
Eddy Diffusivity ACM2 and Eddy ACM2
Deposition Scheme M3Dry (Pleim-Xiu) M3Dry
Numerics
Gas Phase Chemistry Solver Euler Backward Iterative (EBI) solver EBI
Horizontal Advection Scheme
Piecewise Parabolic Method (PPM) scheme PPM
Simulation Periods Three 1-week plus one 1-month episode 3 1-week/one 1-month
Integration Time Step Calculated internally Calculated internally
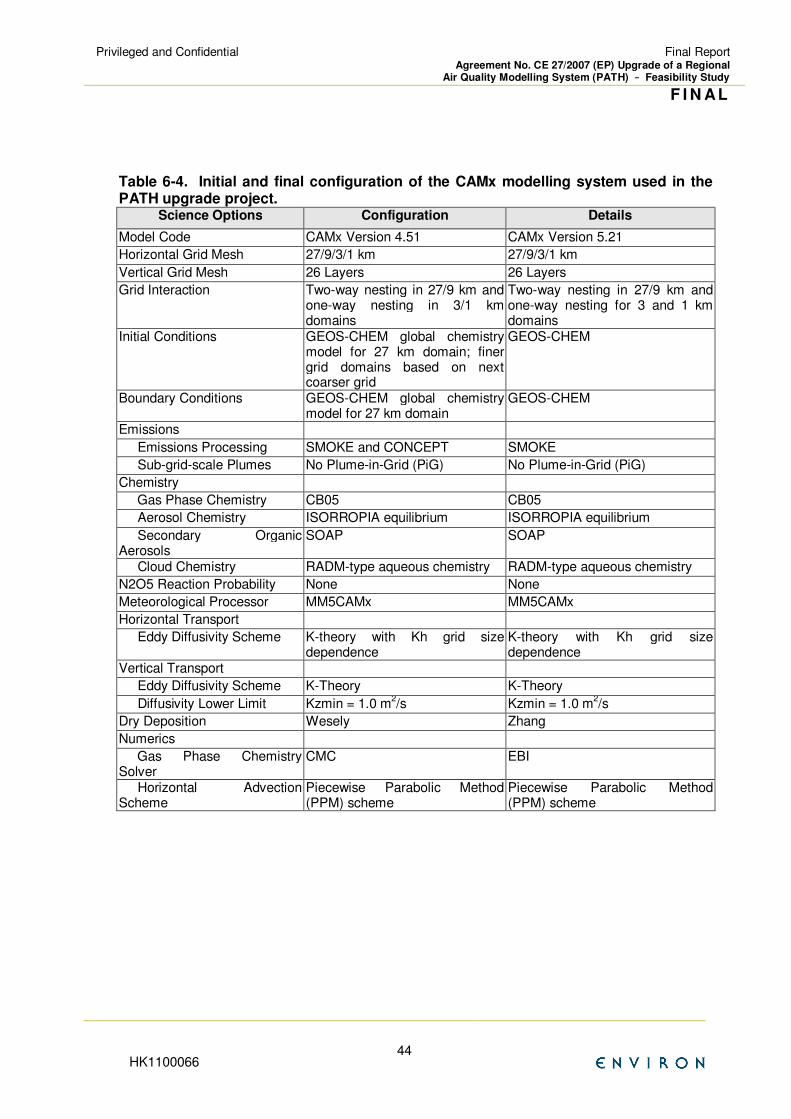
Privileged and Confidential
Final Report Agreement No. CE 27/2007 (EP) Upgrade of a Regional
Air Quality Modelling System (PATH) –––– Feasibility Study
F I N AL
HK1100066 44
Table 6-4. Initial and final configuration of the CAMx modelling system used in the PATH upgrade project.
Science Options Configuration Details
Model Code CAMx Version 4.51 CAMx Version 5.21
Horizontal Grid Mesh 27/9/3/1 km 27/9/3/1 km
Vertical Grid Mesh 26 Layers 26 Layers
Grid Interaction Two-way nesting in 27/9 km and one-way nesting in 3/1 km domains
Two-way nesting in 27/9 km and one-way nesting for 3 and 1 km domains
Initial Conditions GEOS-CHEM global chemistry model for 27 km domain; finer grid domains based on next coarser grid
GEOS-CHEM
Boundary Conditions GEOS-CHEM global chemistry model for 27 km domain
GEOS-CHEM
Emissions
Emissions Processing SMOKE and CONCEPT SMOKE
Sub-grid-scale Plumes No Plume-in-Grid (PiG) No Plume-in-Grid (PiG)
Chemistry
Gas Phase Chemistry CB05 CB05
Aerosol Chemistry ISORROPIA equilibrium ISORROPIA equilibrium
Secondary Organic Aerosols
SOAP SOAP
Cloud Chemistry RADM-type aqueous chemistry RADM-type aqueous chemistry
N2O5 Reaction Probability None None
Meteorological Processor MM5CAMx MM5CAMx
Horizontal Transport
Eddy Diffusivity Scheme K-theory with Kh grid size dependence
K-theory with Kh grid size dependence
Vertical Transport
Eddy Diffusivity Scheme K-Theory K-Theory
Diffusivity Lower Limit Kzmin = 1.0 m2/s Kzmin = 1.0 m
2/s
Dry Deposition Wesely Zhang
Numerics
Gas Phase Chemistry Solver
CMC EBI
Horizontal Advection Scheme
Piecewise Parabolic Method (PPM) scheme
Piecewise Parabolic Method (PPM) scheme
Privileged and Confidential
Final Report Agreement No. CE 27/2007 (EP) Upgrade of a Regional
Air Quality Modelling System (PATH) –––– Feasibility Study
F I N AL
HK1100066 45
7. Data Analysis and Visualisation Software Implementation
7.1 OVERVIEW
The Study Team implemented data analysis and visualisation software for displaying the results of the MM, EM and CTM modelling. The data analysis tools were customized to process the emission modelling, meteorological modelling and chemical transport modelling results to generate scatter plots, time series plots and model performance statistics. In addition, these tools were customized to display the input and output data from the Emissions, Meteorological and Chemical Transport Models and provide interactive 2-D and 3-D visualisation functions. These data analysis and visualization (DAV) tools are described in detail in the DAV Working Paper (ENVIRON, 2010d) and are summarized below.
7.2 METEOROLOGICAL MODEL (MM) ANALYSIS AND VISUALISATION
7.2.1 MM Model Evaluation
A critical component of every meteorological modelling study is the model performance evaluation where the modeled estimates for the studied case are compared against observed values to assess the model’s accuracy and provide an indication of its reliability.
Outputs from meteorological models are compared against meteorological observations from the various networks operating in the region of interest. This is carried out both graphically and statistically to evaluate model performance for winds, temperatures, humidity, and evolution of key weather phenomena. Graphical comparisons allow for a qualitative assessment of model performance by comparing results to commonly available analysis maps or imagery of wind, temperature, pressure, and precipitation patterns. The purpose of these evaluations is to establish a first-order acceptance/rejection of the simulation in adequately replicating the gross weather phenomena in the region of interest. Thus, this approach screens for obvious model flaws and errors.
Statistical comparisons provide a quantitative assessment of model performance. The problem with evaluating statistics is that the more data pairings that are summarized in a given metric, the better the statistics generally look, and so calculating a single set of statistics for a very large area would not yield significant insight into performance. Therefore, the spatial statistical analysis is plotted within each of the modelling domain.
7.2.2 The METSTAT Program
A statistical analysis software package has been developed to calculate and graphically present the statistics described above using MM model output and surface meteorological observations. The package is comprised of a single FORTRAN program (METSTAT) to generate observation-prediction pairings and to calculate the statistics, and a Microsoft Excel macro (METSTAT.XLS) that plots the results.
The program spatially and temporally pairs model predictions with observations for a user-defined time and space window. The program also calculates the statistics for each hour and for each day of the time window. Figure 7-1 displays an example of the METSTAT output for an MM5 evaluation of the first (September-October 2004) episode being analyzed as part of the study.
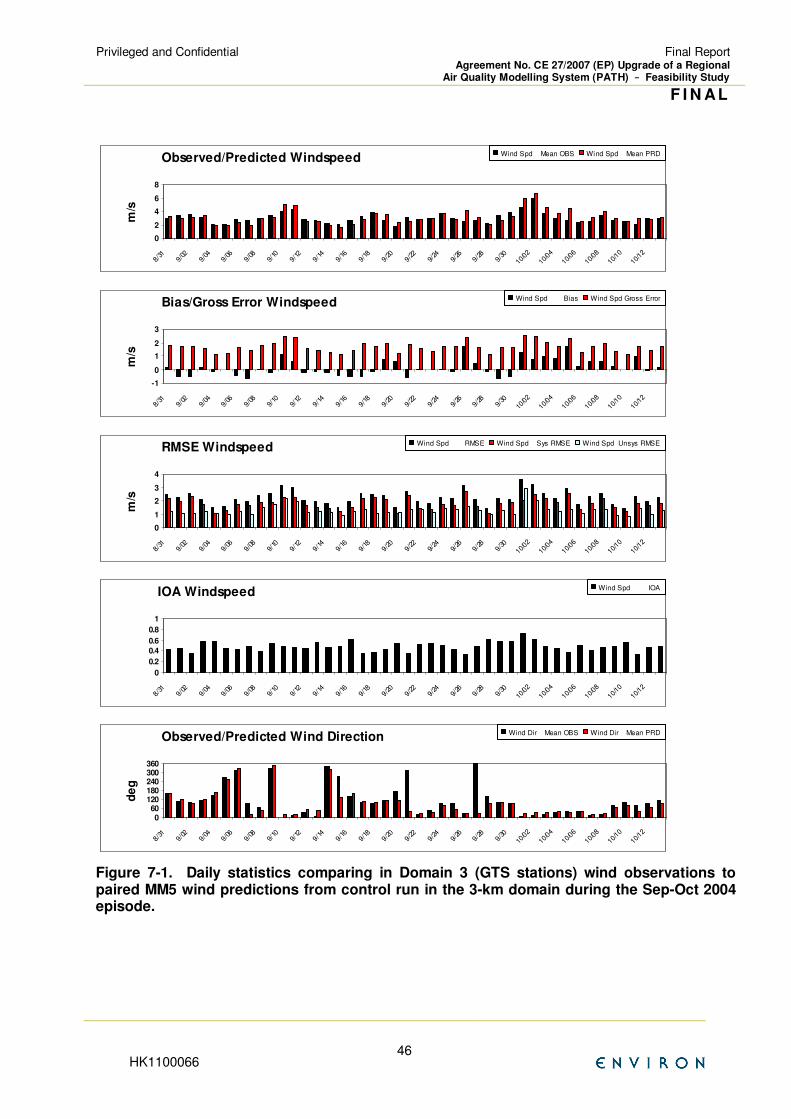
Privileged and Confidential
Final Report Agreement No. CE 27/2007 (EP) Upgrade of a Regional
Air Quality Modelling System (PATH) –––– Feasibility Study
F I N AL
HK1100066 46
Figure 7-1. Daily statistics comparing in Domain 3 (GTS stations) wind observations to paired MM5 wind predictions from control run in the 3-km domain during the Sep-Oct 2004 episode.
Observed/Predicted Windspeed
0
2
4
6
8
8
/31
9
/02
9
/04
9
/06
9
/08
9
/10
9
/12
9
/14
9
/16
9
/18
9
/20
9
/22
9
/24
9
/26
9
/28
9
/30
1
0/02
1
0/04
1
0/06
1
0/08
1
0/10
1
0/12
m/s
Wind Spd Mean OBS Wind Spd Mean PRD
Bias/Gross Error Windspeed
-1
0
1
2
3
8
/31
9
/02
9
/04
9
/06
9
/08
9
/10
9
/12
9
/14
9
/16
9
/18
9
/20
9
/22
9
/24
9
/26
9
/28
9
/30
1
0/02
1
0/04
1
0/06
1
0/08
1
0/10
1
0/12
m/s
Wind Spd Bias Wind Spd Gross Error
RMSE Windspeed
0
1
2
3
4
8
/31
9
/02
9
/04
9
/06
9
/08
9
/10
9
/12
9
/14
9
/16
9
/18
9
/20
9
/22
9
/24
9
/26
9
/28
9
/30
1
0/02
1
0/04
1
0/06
1
0/08
1
0/10
1
0/12
m/s
Wind Spd RMSE Wind Spd Sys RMSE Wind Spd Unsys RMSE
IOA Windspeed
0
0.2
0.4
0.6
0.8
1
8
/31
9
/02
9
/04
9
/06
9
/08
9
/10
9
/12
9
/14
9
/16
9
/18
9
/20
9
/22
9
/24
9
/26
9
/28
9
/30
1
0/02
1
0/04
1
0/06
1
0/08
1
0/10
1
0/12
Wind Spd IOA
Observed/Predicted Wind Direction
060
120180240300360
8
/31
9
/02
9
/04
9
/06
9
/08
9
/10
9
/12
9
/14
9
/16
9
/18
9
/20
9
/22
9
/24
9
/26
9
/28
9
/30
1
0/02
1
0/04
1
0/06
1
0/08
1
0/10
1
0/12
de
g
Wind Dir Mean OBS Wind Dir Mean PRD

Privileged and Confidential
Final Report Agreement No. CE 27/2007 (EP) Upgrade of a Regional
Air Quality Modelling System (PATH) –––– Feasibility Study
F I N AL
HK1100066 47
7.2.3 MM Visualization Software
The PATH upgrade meteorological model evaluation utilizes numerous graphical displays to facilitate quantitative and qualitative comparisons between MM5/WRF predictions and measurements. Together with the statistical calculation, the graphical procedures are intended to help: (a) identify obviously flawed model simulations, (b) guide the implementation of performance improvements in the model input files in a logical, defensible manner, and (c) elucidate the similarities and differences between the alternative MM5/WRF simulations. These graphical tools are intended to depict the model’s ability to predict the observed meteorological fields.
The core graphical displays to be considered for use in the MM5/WRF model evaluation include the following:
• Spatial hourly scalar time series plots;
• Time series plots at monitoring locations;
• The temporal correlation between estimates and observations;
• The spatial distribution of estimated ground-level meteorological state variable maps;
• Scalar scatter plots stratified by station, by time
• Bias and error stratified by time; and
• Histogram plots of the statistical metrics, stratified by day, by variable.
7.2.3.1 PAVE and VERDI
The Package for Analysis and Visualisation of Environmental Data (PAVE) is developed for visualize scientific data and model output. The VERDI visualization tool has many of the same functionality as PAVE and was developed by US EPA as a replacement to PAVE, which they no longer support. Examples of PAVE and VERDI plots generated by the Study Team for various applications in the project are presented below in Figures 7-2 and 7-3.
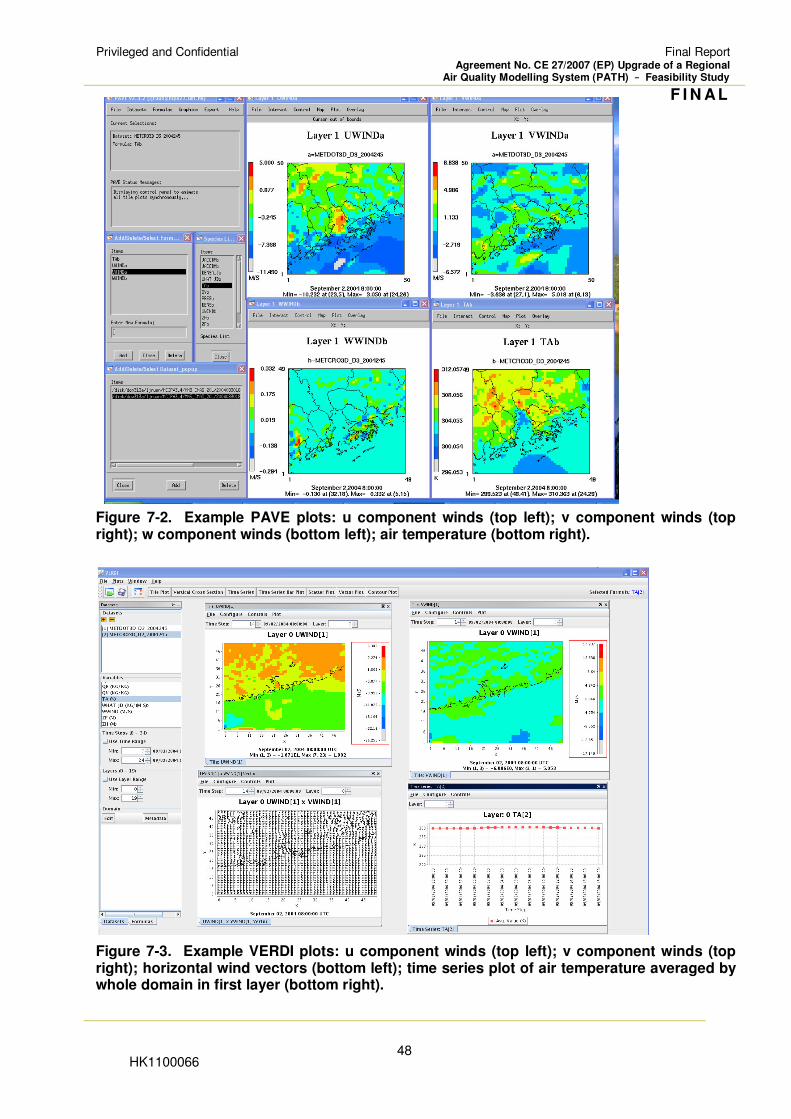
Privileged and Confidential
Final Report Agreement No. CE 27/2007 (EP) Upgrade of a Regional
Air Quality Modelling System (PATH) –––– Feasibility Study
F I N AL
HK1100066 48
Figure 7-2. Example PAVE plots: u component winds (top left); v component winds (top right); w component winds (bottom left); air temperature (bottom right).
Figure 7-3. Example VERDI plots: u component winds (top left); v component winds (top right); horizontal wind vectors (bottom left); time series plot of air temperature averaged by whole domain in first layer (bottom right).
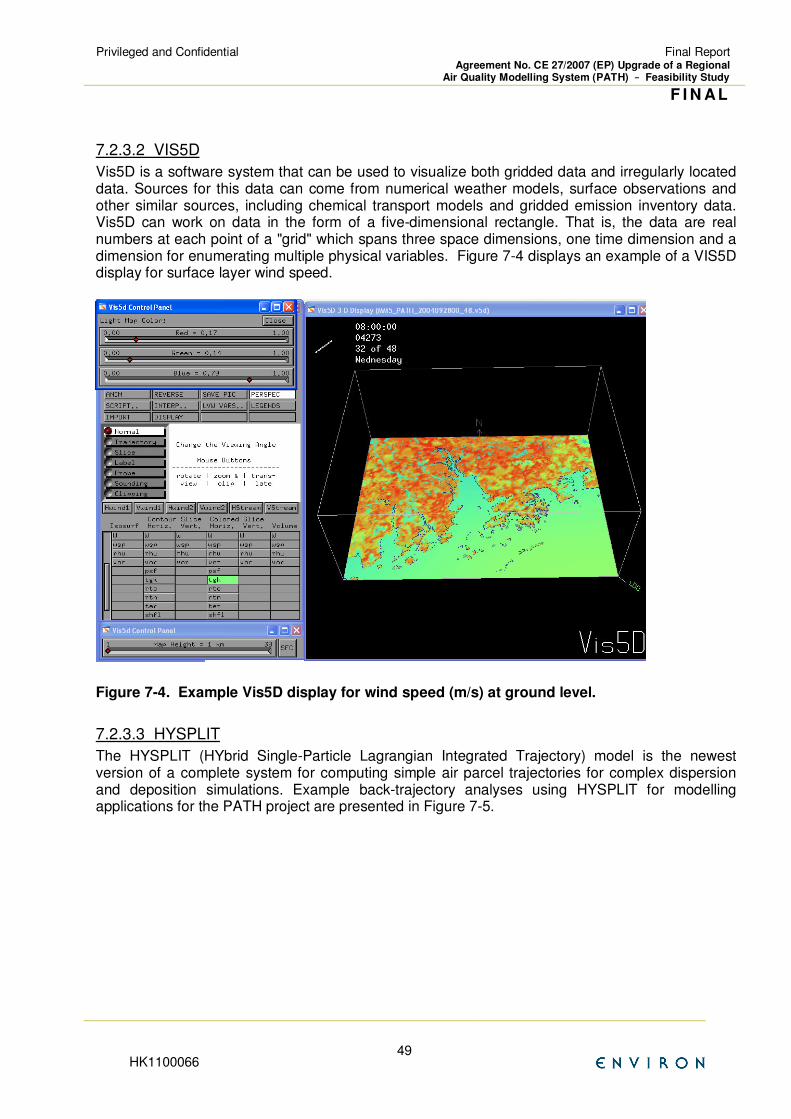
Privileged and Confidential
Final Report Agreement No. CE 27/2007 (EP) Upgrade of a Regional
Air Quality Modelling System (PATH) –––– Feasibility Study
F I N AL
HK1100066 49
7.2.3.2 VIS5D
Vis5D is a software system that can be used to visualize both gridded data and irregularly located data. Sources for this data can come from numerical weather models, surface observations and other similar sources, including chemical transport models and gridded emission inventory data. Vis5D can work on data in the form of a five-dimensional rectangle. That is, the data are real numbers at each point of a "grid" which spans three space dimensions, one time dimension and a dimension for enumerating multiple physical variables. Figure 7-4 displays an example of a VIS5D display for surface layer wind speed.
Figure 7-4. Example Vis5D display for wind speed (m/s) at ground level.
7.2.3.3 HYSPLIT
The HYSPLIT (HYbrid Single-Particle Lagrangian Integrated Trajectory) model is the newest version of a complete system for computing simple air parcel trajectories for complex dispersion and deposition simulations. Example back-trajectory analyses using HYSPLIT for modelling applications for the PATH project are presented in Figure 7-5.
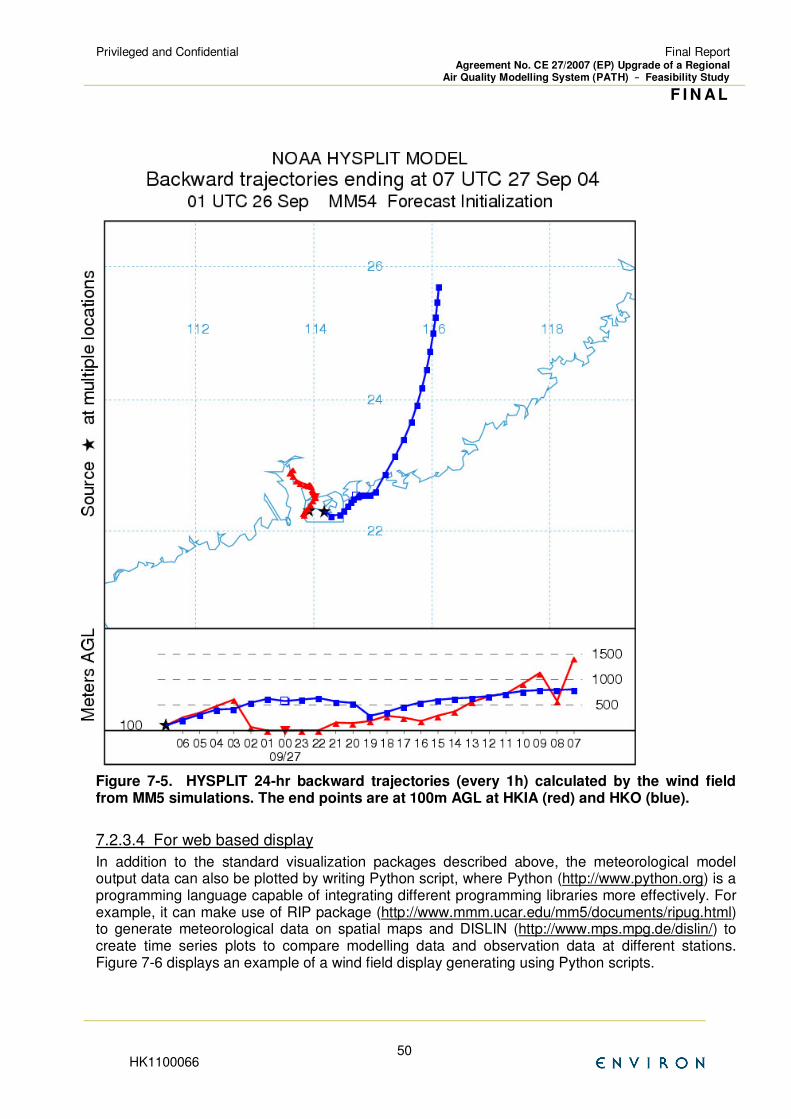
Privileged and Confidential
Final Report Agreement No. CE 27/2007 (EP) Upgrade of a Regional
Air Quality Modelling System (PATH) –––– Feasibility Study
F I N AL
HK1100066 50
Figure 7-5. HYSPLIT 24-hr backward trajectories (every 1h) calculated by the wind field from MM5 simulations. The end points are at 100m AGL at HKIA (red) and HKO (blue).
7.2.3.4 For web based display
In addition to the standard visualization packages described above, the meteorological model output data can also be plotted by writing Python script, where Python (http://www.python.org) is a programming language capable of integrating different programming libraries more effectively. For example, it can make use of RIP package (http://www.mmm.ucar.edu/mm5/documents/ripug.html) to generate meteorological data on spatial maps and DISLIN (http://www.mps.mpg.de/dislin/) to create time series plots to compare modelling data and observation data at different stations. Figure 7-6 displays an example of a wind field display generating using Python scripts.
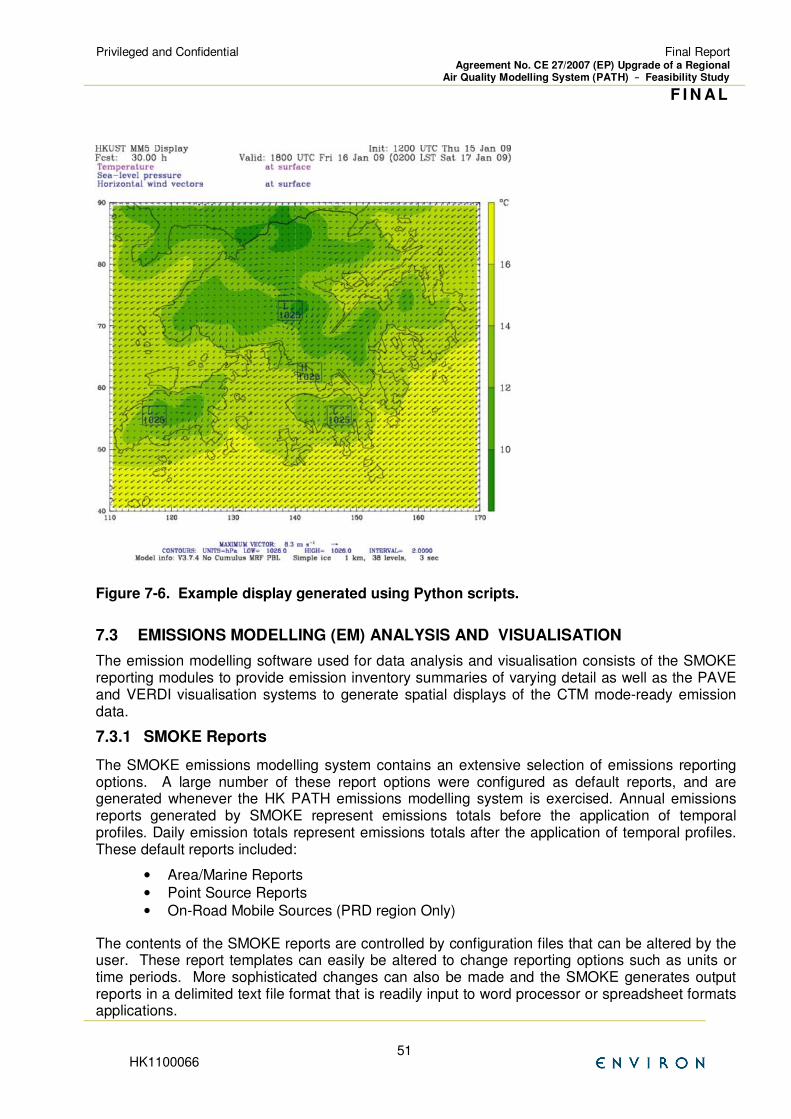
Privileged and Confidential
Final Report Agreement No. CE 27/2007 (EP) Upgrade of a Regional
Air Quality Modelling System (PATH) –––– Feasibility Study
F I N AL
HK1100066 51
Figure 7-6. Example display generated using Python scripts.
7.3 EMISSIONS MODELLING (EM) ANALYSIS AND VISUALISATION
The emission modelling software used for data analysis and visualisation consists of the SMOKE reporting modules to provide emission inventory summaries of varying detail as well as the PAVE and VERDI visualisation systems to generate spatial displays of the CTM mode-ready emission data.
7.3.1 SMOKE Reports
The SMOKE emissions modelling system contains an extensive selection of emissions reporting options. A large number of these report options were configured as default reports, and are generated whenever the HK PATH emissions modelling system is exercised. Annual emissions reports generated by SMOKE represent emissions totals before the application of temporal profiles. Daily emission totals represent emissions totals after the application of temporal profiles. These default reports included:
• Area/Marine Reports
• Point Source Reports
• On-Road Mobile Sources (PRD region Only)
The contents of the SMOKE reports are controlled by configuration files that can be altered by the user. These report templates can easily be altered to change reporting options such as units or time periods. More sophisticated changes can also be made and the SMOKE generates output reports in a delimited text file format that is readily input to word processor or spreadsheet formats applications.
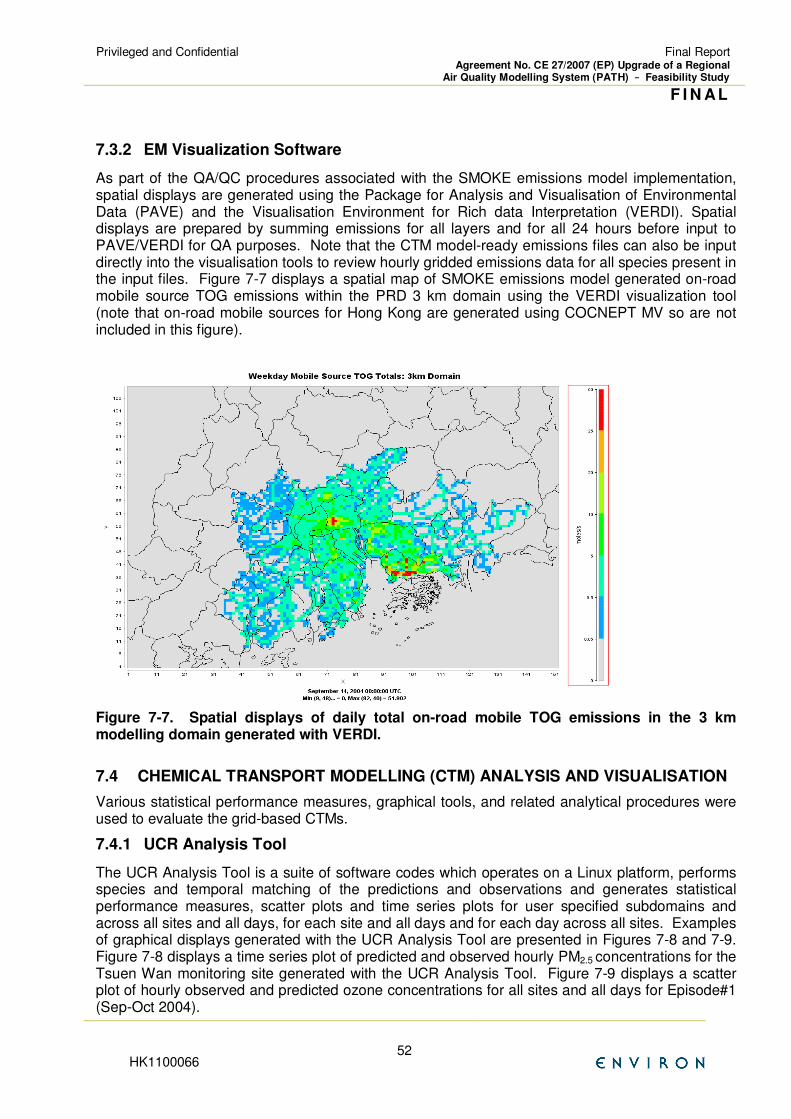
Privileged and Confidential
Final Report Agreement No. CE 27/2007 (EP) Upgrade of a Regional
Air Quality Modelling System (PATH) –––– Feasibility Study
F I N AL
HK1100066 52
7.3.2 EM Visualization Software
As part of the QA/QC procedures associated with the SMOKE emissions model implementation, spatial displays are generated using the Package for Analysis and Visualisation of Environmental Data (PAVE) and the Visualisation Environment for Rich data Interpretation (VERDI). Spatial displays are prepared by summing emissions for all layers and for all 24 hours before input to PAVE/VERDI for QA purposes. Note that the CTM model-ready emissions files can also be input directly into the visualisation tools to review hourly gridded emissions data for all species present in the input files. Figure 7-7 displays a spatial map of SMOKE emissions model generated on-road mobile source TOG emissions within the PRD 3 km domain using the VERDI visualization tool (note that on-road mobile sources for Hong Kong are generated using COCNEPT MV so are not included in this figure).
Figure 7-7. Spatial displays of daily total on-road mobile TOG emissions in the 3 km modelling domain generated with VERDI.
7.4 CHEMICAL TRANSPORT MODELLING (CTM) ANALYSIS AND VISUALISATION
Various statistical performance measures, graphical tools, and related analytical procedures were used to evaluate the grid-based CTMs.
7.4.1 UCR Analysis Tool
The UCR Analysis Tool is a suite of software codes which operates on a Linux platform, performs species and temporal matching of the predictions and observations and generates statistical performance measures, scatter plots and time series plots for user specified subdomains and across all sites and all days, for each site and all days and for each day across all sites. Examples of graphical displays generated with the UCR Analysis Tool are presented in Figures 7-8 and 7-9. Figure 7-8 displays a time series plot of predicted and observed hourly PM2.5 concentrations for the Tsuen Wan monitoring site generated with the UCR Analysis Tool. Figure 7-9 displays a scatter plot of hourly observed and predicted ozone concentrations for all sites and all days for Episode#1 (Sep-Oct 2004).
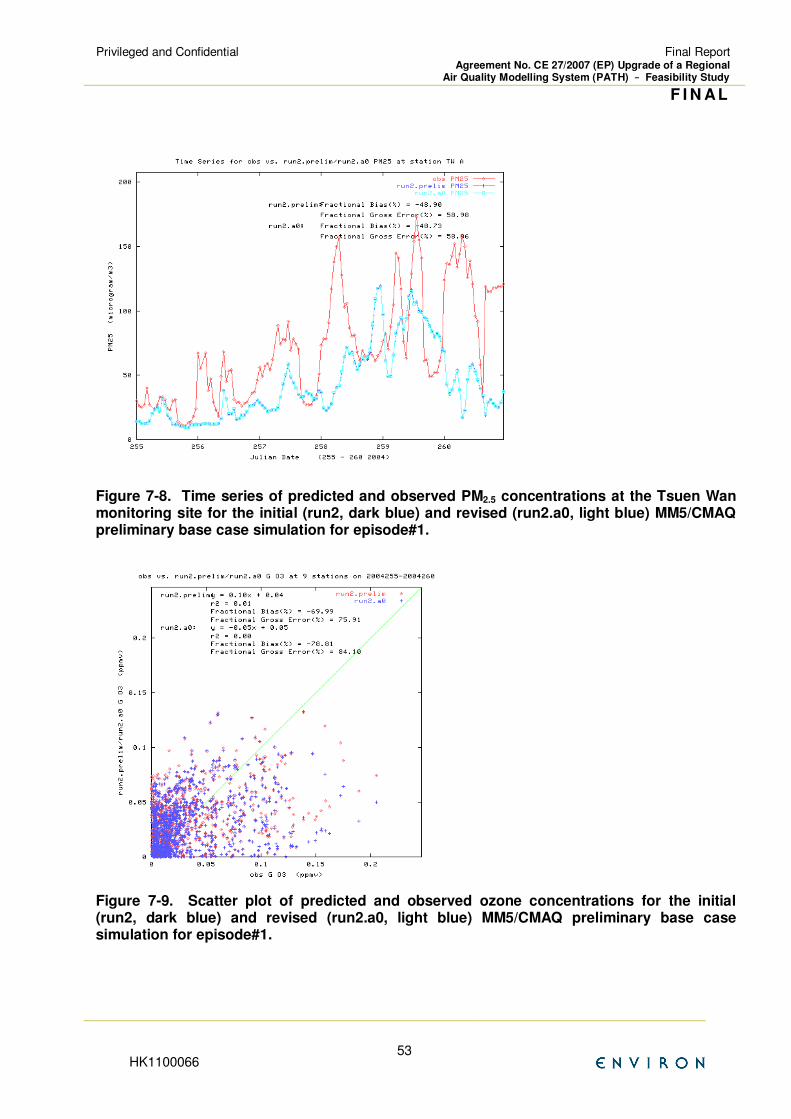
Privileged and Confidential
Final Report Agreement No. CE 27/2007 (EP) Upgrade of a Regional
Air Quality Modelling System (PATH) –––– Feasibility Study
F I N AL
HK1100066 53
Figure 7-8. Time series of predicted and observed PM2.5 concentrations at the Tsuen Wan monitoring site for the initial (run2, dark blue) and revised (run2.a0, light blue) MM5/CMAQ preliminary base case simulation for episode#1.
Figure 7-9. Scatter plot of predicted and observed ozone concentrations for the initial (run2, dark blue) and revised (run2.a0, light blue) MM5/CMAQ preliminary base case simulation for episode#1.
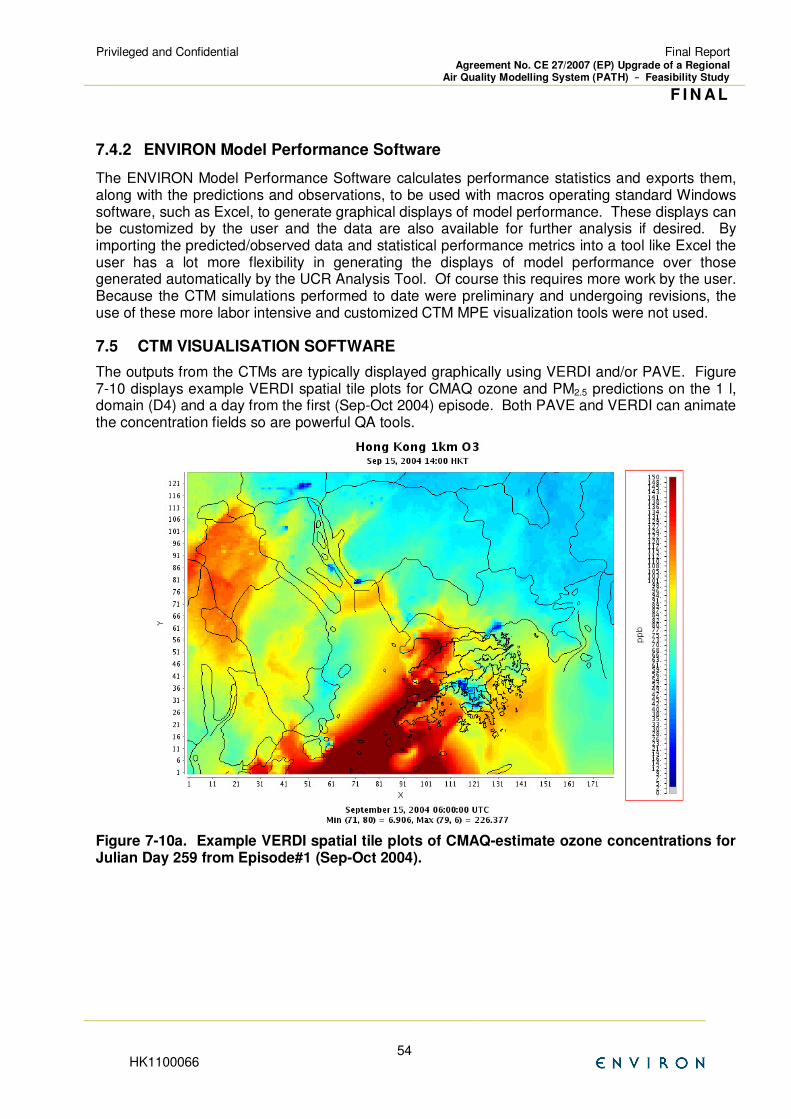
Privileged and Confidential
Final Report Agreement No. CE 27/2007 (EP) Upgrade of a Regional
Air Quality Modelling System (PATH) –––– Feasibility Study
F I N AL
HK1100066 54
7.4.2 ENVIRON Model Performance Software
The ENVIRON Model Performance Software calculates performance statistics and exports them, along with the predictions and observations, to be used with macros operating standard Windows software, such as Excel, to generate graphical displays of model performance. These displays can be customized by the user and the data are also available for further analysis if desired. By importing the predicted/observed data and statistical performance metrics into a tool like Excel the user has a lot more flexibility in generating the displays of model performance over those generated automatically by the UCR Analysis Tool. Of course this requires more work by the user. Because the CTM simulations performed to date were preliminary and undergoing revisions, the use of these more labor intensive and customized CTM MPE visualization tools were not used.
7.5 CTM VISUALISATION SOFTWARE
The outputs from the CTMs are typically displayed graphically using VERDI and/or PAVE. Figure 7-10 displays example VERDI spatial tile plots for CMAQ ozone and PM2.5 predictions on the 1 l, domain (D4) and a day from the first (Sep-Oct 2004) episode. Both PAVE and VERDI can animate the concentration fields so are powerful QA tools.
Figure 7-10a. Example VERDI spatial tile plots of CMAQ-estimate ozone concentrations for Julian Day 259 from Episode#1 (Sep-Oct 2004).
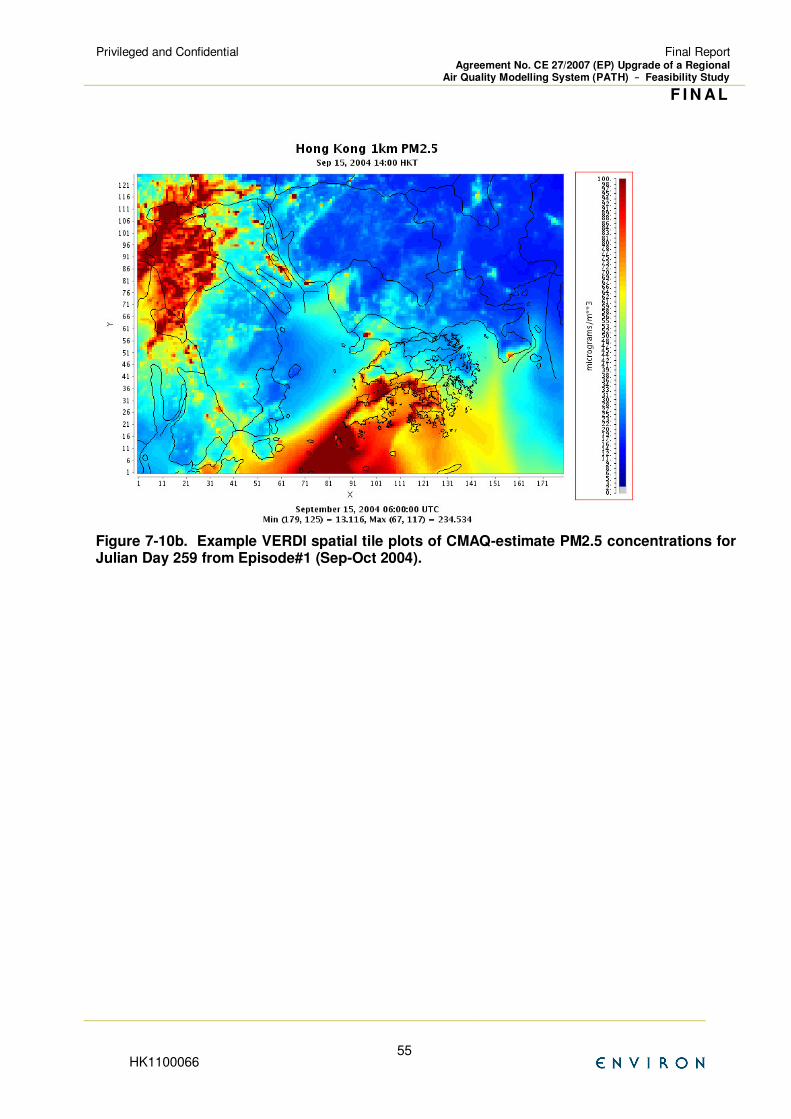
Privileged and Confidential
Final Report Agreement No. CE 27/2007 (EP) Upgrade of a Regional
Air Quality Modelling System (PATH) –––– Feasibility Study
F I N AL
HK1100066 55
Figure 7-10b. Example VERDI spatial tile plots of CMAQ-estimate PM2.5 concentrations for Julian Day 259 from Episode#1 (Sep-Oct 2004).
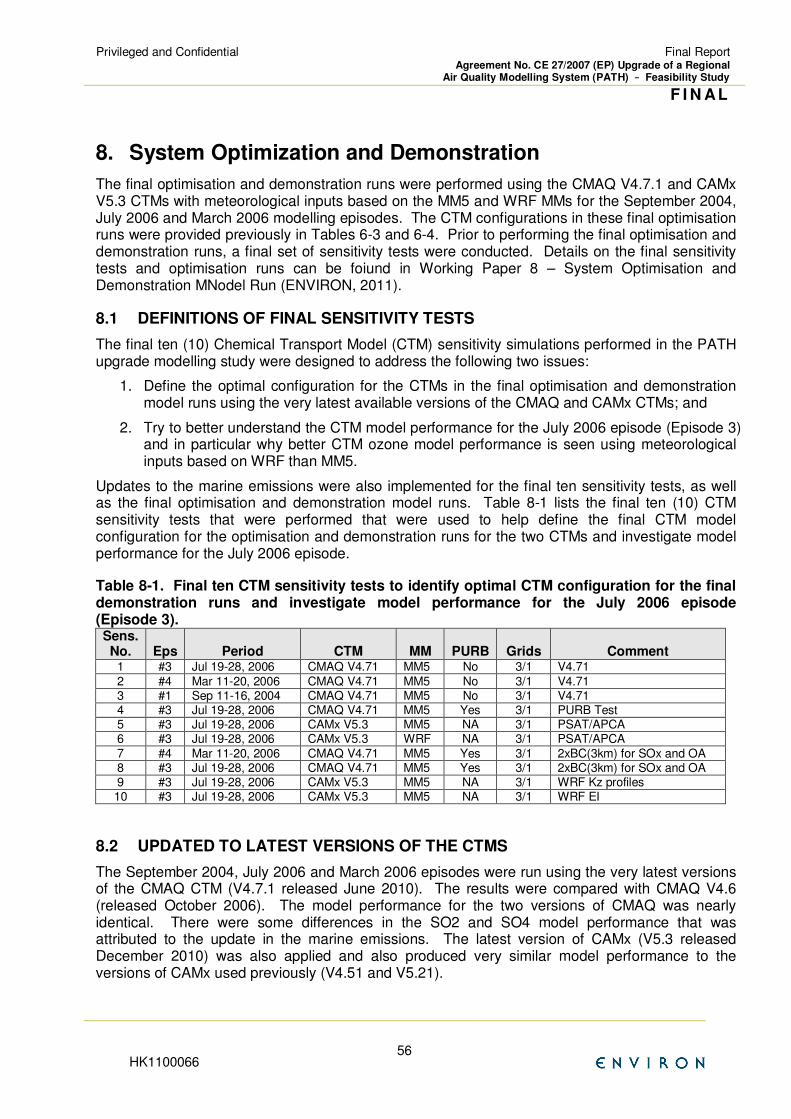
Privileged and Confidential
Final Report Agreement No. CE 27/2007 (EP) Upgrade of a Regional
Air Quality Modelling System (PATH) –––– Feasibility Study
F I N AL
HK1100066 56
8. System Optimization and Demonstration
The final optimisation and demonstration runs were performed using the CMAQ V4.7.1 and CAMx V5.3 CTMs with meteorological inputs based on the MM5 and WRF MMs for the September 2004, July 2006 and March 2006 modelling episodes. The CTM configurations in these final optimisation runs were provided previously in Tables 6-3 and 6-4. Prior to performing the final optimisation and demonstration runs, a final set of sensitivity tests were conducted. Details on the final sensitivity tests and optimisation runs can be foiund in Working Paper 8 – System Optimisation and Demonstration MNodel Run (ENVIRON, 2011).
8.1 DEFINITIONS OF FINAL SENSITIVITY TESTS
The final ten (10) Chemical Transport Model (CTM) sensitivity simulations performed in the PATH upgrade modelling study were designed to address the following two issues:
1. Define the optimal configuration for the CTMs in the final optimisation and demonstration model runs using the very latest available versions of the CMAQ and CAMx CTMs; and
2. Try to better understand the CTM model performance for the July 2006 episode (Episode 3) and in particular why better CTM ozone model performance is seen using meteorological inputs based on WRF than MM5.
Updates to the marine emissions were also implemented for the final ten sensitivity tests, as well as the final optimisation and demonstration model runs. Table 8-1 lists the final ten (10) CTM sensitivity tests that were performed that were used to help define the final CTM model configuration for the optimisation and demonstration runs for the two CTMs and investigate model performance for the July 2006 episode.
Table 8-1. Final ten CTM sensitivity tests to identify optimal CTM configuration for the final demonstration runs and investigate model performance for the July 2006 episode (Episode 3). Sens. No. Eps Period CTM MM PURB Grids Comment
1 #3 Jul 19-28, 2006 CMAQ V4.71 MM5 No 3/1 V4.71
2 #4 Mar 11-20, 2006 CMAQ V4.71 MM5 No 3/1 V4.71 3 #1 Sep 11-16, 2004 CMAQ V4.71 MM5 No 3/1 V4.71 4 #3 Jul 19-28, 2006 CMAQ V4.71 MM5 Yes 3/1 PURB Test 5 #3 Jul 19-28, 2006 CAMx V5.3 MM5 NA 3/1 PSAT/APCA 6 #3 Jul 19-28, 2006 CAMx V5.3 WRF NA 3/1 PSAT/APCA
7 #4 Mar 11-20, 2006 CMAQ V4.71 MM5 Yes 3/1 2xBC(3km) for SOx and OA 8 #3 Jul 19-28, 2006 CMAQ V4.71 MM5 Yes 3/1 2xBC(3km) for SOx and OA 9 #3 Jul 19-28, 2006 CAMx V5.3 MM5 NA 3/1 WRF Kz profiles 10 #3 Jul 19-28, 2006 CAMx V5.3 MM5 NA 3/1 WRF EI
8.2 UPDATED TO LATEST VERSIONS OF THE CTMS
The September 2004, July 2006 and March 2006 episodes were run using the very latest versions of the CMAQ CTM (V4.7.1 released June 2010). The results were compared with CMAQ V4.6 (released October 2006). The model performance for the two versions of CMAQ was nearly identical. There were some differences in the SO2 and SO4 model performance that was attributed to the update in the marine emissions. The latest version of CAMx (V5.3 released December 2010) was also applied and also produced very similar model performance to the versions of CAMx used previously (V4.51 and V5.21).
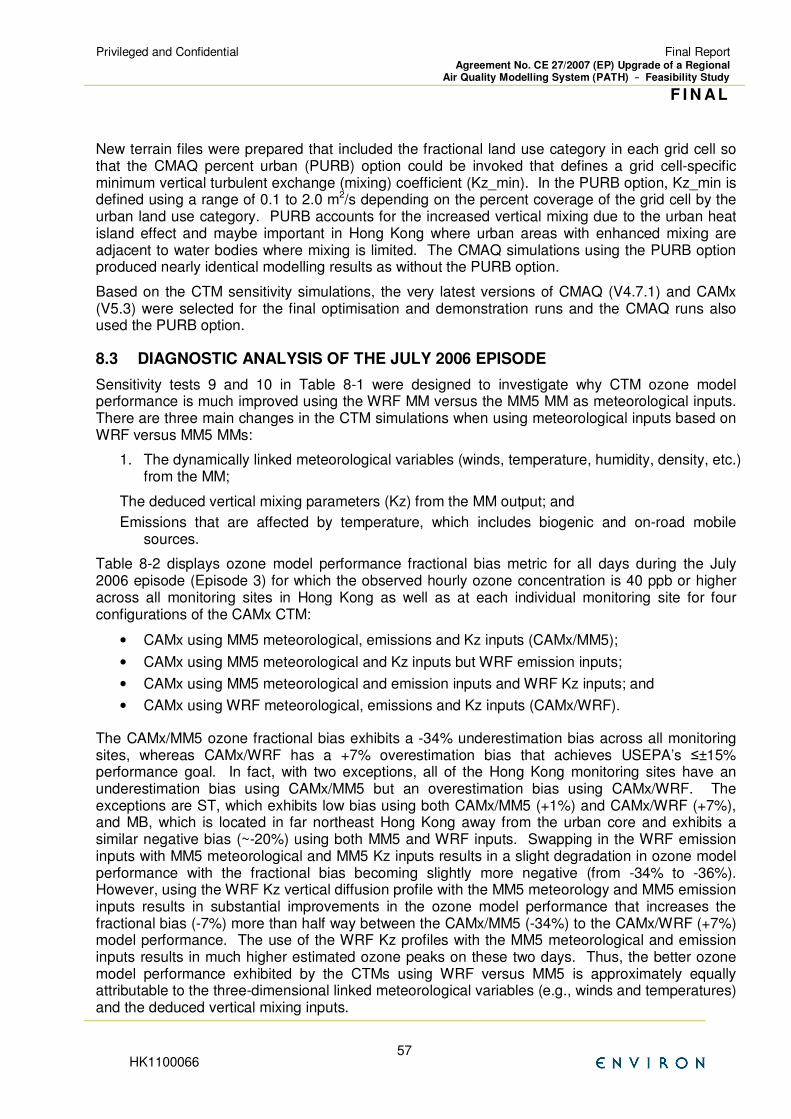
Privileged and Confidential
Final Report Agreement No. CE 27/2007 (EP) Upgrade of a Regional
Air Quality Modelling System (PATH) –––– Feasibility Study
F I N AL
HK1100066 57
New terrain files were prepared that included the fractional land use category in each grid cell so that the CMAQ percent urban (PURB) option could be invoked that defines a grid cell-specific minimum vertical turbulent exchange (mixing) coefficient (Kz_min). In the PURB option, Kz_min is defined using a range of 0.1 to 2.0 m2/s depending on the percent coverage of the grid cell by the urban land use category. PURB accounts for the increased vertical mixing due to the urban heat island effect and maybe important in Hong Kong where urban areas with enhanced mixing are adjacent to water bodies where mixing is limited. The CMAQ simulations using the PURB option produced nearly identical modelling results as without the PURB option.
Based on the CTM sensitivity simulations, the very latest versions of CMAQ (V4.7.1) and CAMx (V5.3) were selected for the final optimisation and demonstration runs and the CMAQ runs also used the PURB option.
8.3 DIAGNOSTIC ANALYSIS OF THE JULY 2006 EPISODE
Sensitivity tests 9 and 10 in Table 8-1 were designed to investigate why CTM ozone model performance is much improved using the WRF MM versus the MM5 MM as meteorological inputs. There are three main changes in the CTM simulations when using meteorological inputs based on WRF versus MM5 MMs:
1. The dynamically linked meteorological variables (winds, temperature, humidity, density, etc.) from the MM;
The deduced vertical mixing parameters (Kz) from the MM output; and
Emissions that are affected by temperature, which includes biogenic and on-road mobile sources.
Table 8-2 displays ozone model performance fractional bias metric for all days during the July 2006 episode (Episode 3) for which the observed hourly ozone concentration is 40 ppb or higher across all monitoring sites in Hong Kong as well as at each individual monitoring site for four configurations of the CAMx CTM:
• CAMx using MM5 meteorological, emissions and Kz inputs (CAMx/MM5);
• CAMx using MM5 meteorological and Kz inputs but WRF emission inputs;
• CAMx using MM5 meteorological and emission inputs and WRF Kz inputs; and
• CAMx using WRF meteorological, emissions and Kz inputs (CAMx/WRF).
The CAMx/MM5 ozone fractional bias exhibits a -34% underestimation bias across all monitoring sites, whereas CAMx/WRF has a +7% overestimation bias that achieves USEPA’s ≤±15% performance goal. In fact, with two exceptions, all of the Hong Kong monitoring sites have an underestimation bias using CAMx/MM5 but an overestimation bias using CAMx/WRF. The exceptions are ST, which exhibits low bias using both CAMx/MM5 (+1%) and CAMx/WRF (+7%), and MB, which is located in far northeast Hong Kong away from the urban core and exhibits a similar negative bias (~-20%) using both MM5 and WRF inputs. Swapping in the WRF emission inputs with MM5 meteorological and MM5 Kz inputs results in a slight degradation in ozone model performance with the fractional bias becoming slightly more negative (from -34% to -36%). However, using the WRF Kz vertical diffusion profile with the MM5 meteorology and MM5 emission inputs results in substantial improvements in the ozone model performance that increases the fractional bias (-7%) more than half way between the CAMx/MM5 (-34%) to the CAMx/WRF (+7%) model performance. The use of the WRF Kz profiles with the MM5 meteorological and emission inputs results in much higher estimated ozone peaks on these two days. Thus, the better ozone model performance exhibited by the CTMs using WRF versus MM5 is approximately equally attributable to the three-dimensional linked meteorological variables (e.g., winds and temperatures) and the deduced vertical mixing inputs.
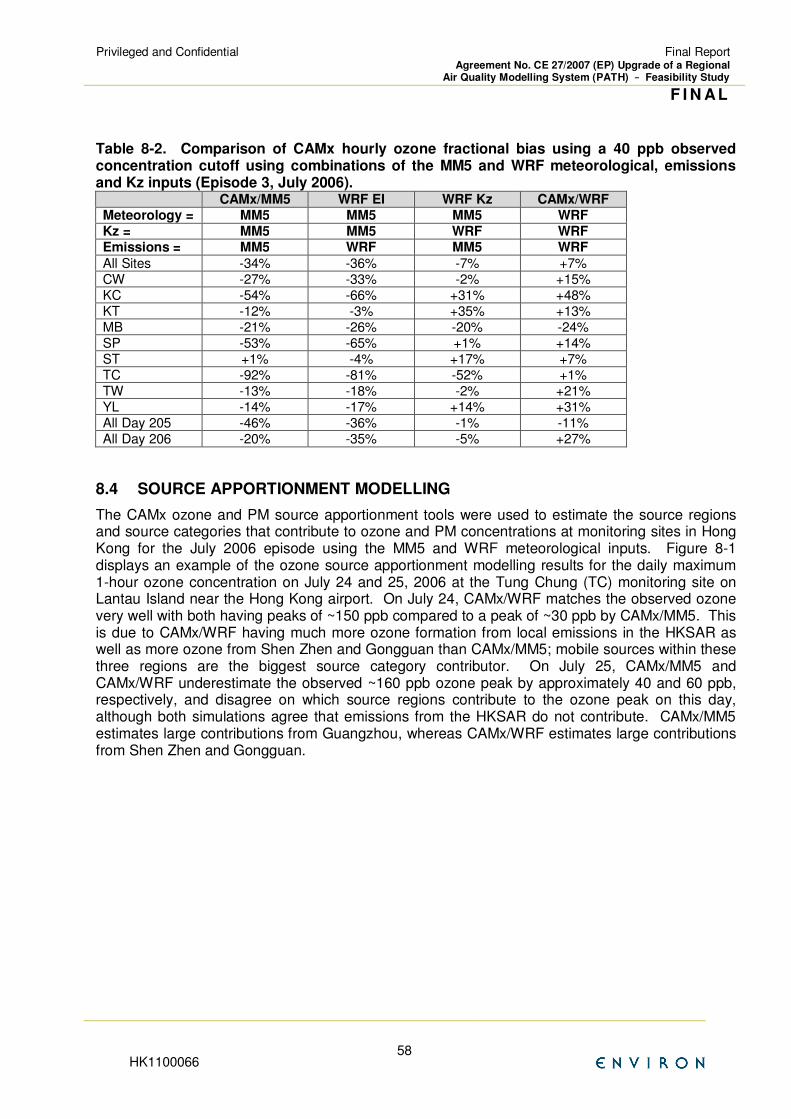
Privileged and Confidential
Final Report Agreement No. CE 27/2007 (EP) Upgrade of a Regional
Air Quality Modelling System (PATH) –––– Feasibility Study
F I N AL
HK1100066 58
Table 8-2. Comparison of CAMx hourly ozone fractional bias using a 40 ppb observed concentration cutoff using combinations of the MM5 and WRF meteorological, emissions and Kz inputs (Episode 3, July 2006). CAMx/MM5 WRF EI WRF Kz CAMx/WRF Meteorology = MM5 MM5 MM5 WRF Kz = MM5 MM5 WRF WRF Emissions = MM5 WRF MM5 WRF
All Sites -34% -36% -7% +7% CW -27% -33% -2% +15% KC -54% -66% +31% +48% KT -12% -3% +35% +13% MB -21% -26% -20% -24% SP -53% -65% +1% +14% ST +1% -4% +17% +7% TC -92% -81% -52% +1% TW -13% -18% -2% +21% YL -14% -17% +14% +31% All Day 205 -46% -36% -1% -11% All Day 206 -20% -35% -5% +27%
8.4 SOURCE APPORTIONMENT MODELLING
The CAMx ozone and PM source apportionment tools were used to estimate the source regions and source categories that contribute to ozone and PM concentrations at monitoring sites in Hong Kong for the July 2006 episode using the MM5 and WRF meteorological inputs. Figure 8-1 displays an example of the ozone source apportionment modelling results for the daily maximum 1-hour ozone concentration on July 24 and 25, 2006 at the Tung Chung (TC) monitoring site on Lantau Island near the Hong Kong airport. On July 24, CAMx/WRF matches the observed ozone very well with both having peaks of ~150 ppb compared to a peak of ~30 ppb by CAMx/MM5. This is due to CAMx/WRF having much more ozone formation from local emissions in the HKSAR as well as more ozone from Shen Zhen and Gongguan than CAMx/MM5; mobile sources within these three regions are the biggest source category contributor. On July 25, CAMx/MM5 and CAMx/WRF underestimate the observed ~160 ppb ozone peak by approximately 40 and 60 ppb, respectively, and disagree on which source regions contribute to the ozone peak on this day, although both simulations agree that emissions from the HKSAR do not contribute. CAMx/MM5 estimates large contributions from Guangzhou, whereas CAMx/WRF estimates large contributions from Shen Zhen and Gongguan.
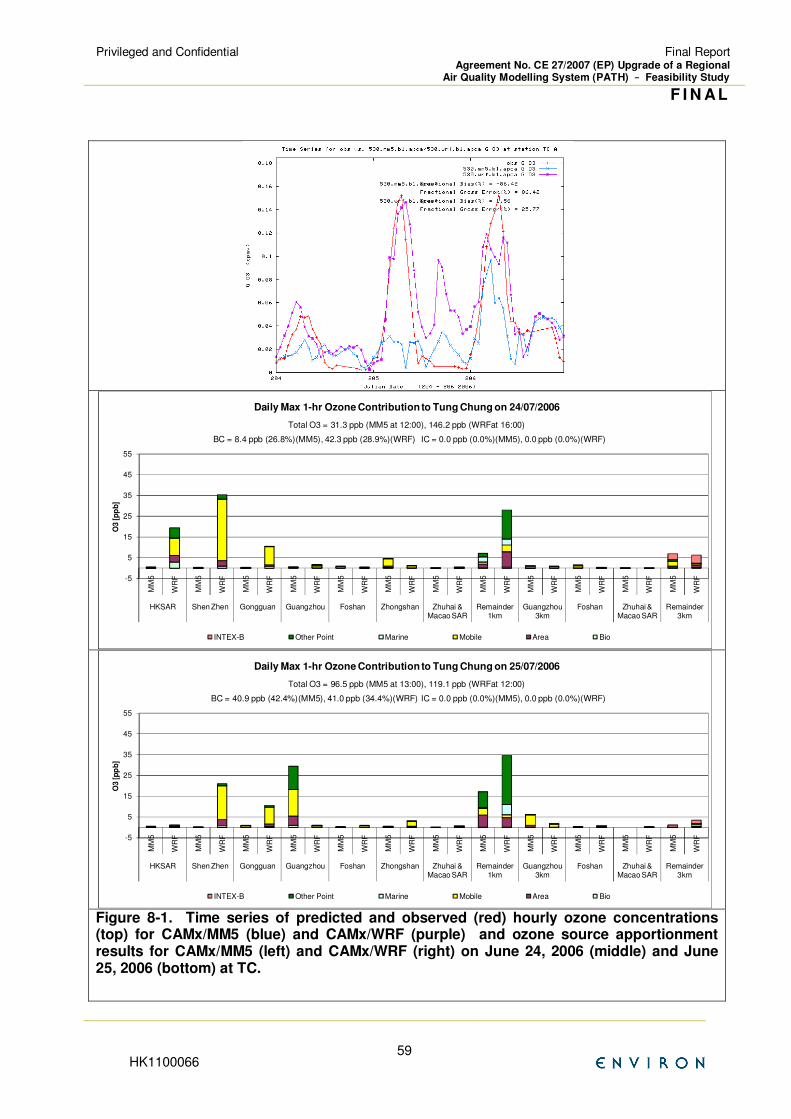
Privileged and Confidential
Final Report Agreement No. CE 27/2007 (EP) Upgrade of a Regional
Air Quality Modelling System (PATH) –––– Feasibility Study
F I N AL
HK1100066 59
Figure 8-1. Time series of predicted and observed (red) hourly ozone concentrations (top) for CAMx/MM5 (blue) and CAMx/WRF (purple) and ozone source apportionment results for CAMx/MM5 (left) and CAMx/WRF (right) on June 24, 2006 (middle) and June 25, 2006 (bottom) at TC.
-5
5
15
25
35
45
55
MM
5
WR
F
MM
5
WR
F
MM
5
WR
F
MM
5
WR
F
MM
5
WR
F
MM
5
WR
F
MM
5
WR
F
MM
5
WR
F
MM
5
WR
F
MM
5
WR
F
MM
5
WR
F
MM
5
WR
F
HKSAR Shen Zhen Gongguan Guangzhou Foshan Zhongshan Zhuhai & Macao SAR
Remainder 1km
Guangzhou 3km
Foshan Zhuhai & Macao SAR
Remainder 3km
O3
[p
pb
]
Daily Max 1-hr Ozone Contribution to Tung Chung on 24/07/2006
INTEX-B Other Point Marine Mobile Area Bio
BC = 8.4 ppb (26.8%)(MM5), 42.3 ppb (28.9%)(WRF) IC = 0.0 ppb (0.0%)(MM5), 0.0 ppb (0.0%)(WRF)
Total O3 = 31.3 ppb (MM5 at 12:00), 146.2 ppb (WRFat 16:00)
-5
5
15
25
35
45
55
MM
5
WR
F
MM
5
WR
F
MM
5
WR
F
MM
5
WR
F
MM
5
WR
F
MM
5
WR
F
MM
5
WR
F
MM
5
WR
F
MM
5
WR
F
MM
5
WR
F
MM
5
WR
F
MM
5
WR
F
HKSAR Shen Zhen Gongguan Guangzhou Foshan Zhongshan Zhuhai & Macao SAR
Remainder 1km
Guangzhou 3km
Foshan Zhuhai & Macao SAR
Remainder 3km
O3
[p
pb
]
Daily Max 1-hr Ozone Contribution to Tung Chung on 25/07/2006
INTEX-B Other Point Marine Mobile Area Bio
BC = 40.9 ppb (42.4%)(MM5), 41.0 ppb (34.4%)(WRF) IC = 0.0 ppb (0.0%)(MM5), 0.0 ppb (0.0%)(WRF)
Total O3 = 96.5 ppb (MM5 at 13:00), 119.1 ppb (WRFat 12:00)
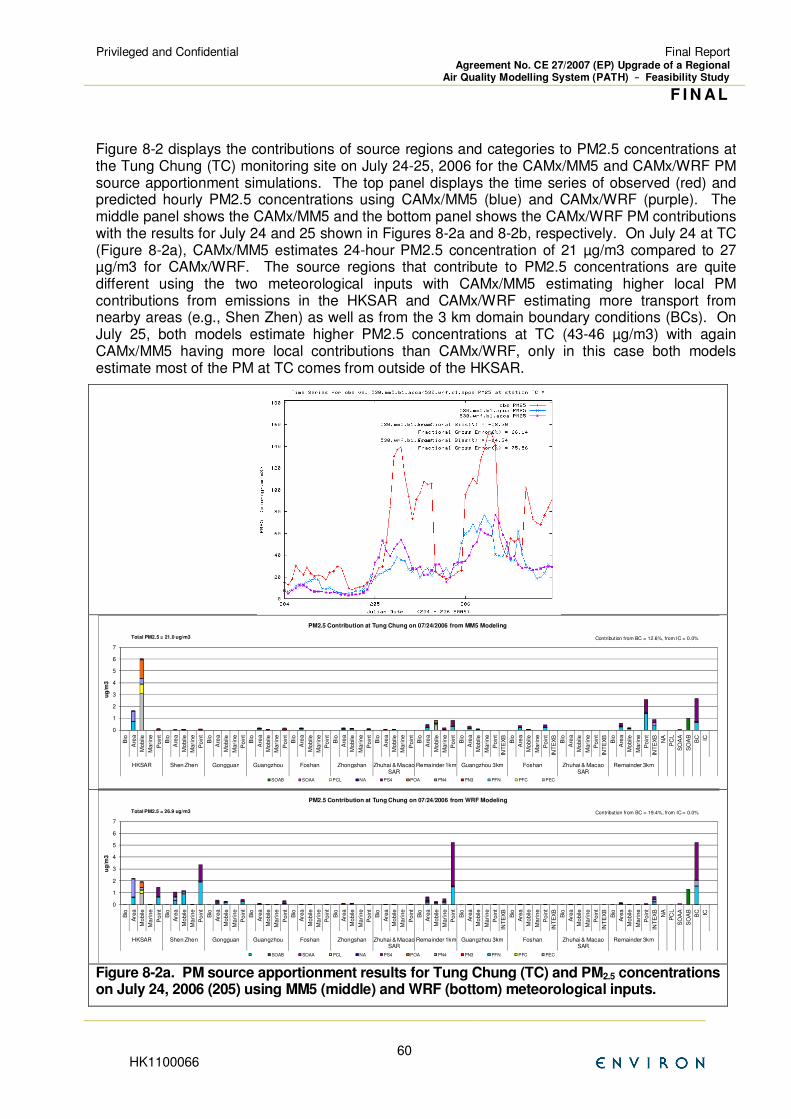
Privileged and Confidential
Final Report Agreement No. CE 27/2007 (EP) Upgrade of a Regional
Air Quality Modelling System (PATH) –––– Feasibility Study
F I N AL
HK1100066 60
Figure 8-2 displays the contributions of source regions and categories to PM2.5 concentrations at the Tung Chung (TC) monitoring site on July 24-25, 2006 for the CAMx/MM5 and CAMx/WRF PM source apportionment simulations. The top panel displays the time series of observed (red) and predicted hourly PM2.5 concentrations using CAMx/MM5 (blue) and CAMx/WRF (purple). The middle panel shows the CAMx/MM5 and the bottom panel shows the CAMx/WRF PM contributions with the results for July 24 and 25 shown in Figures 8-2a and 8-2b, respectively. On July 24 at TC (Figure 8-2a), CAMx/MM5 estimates 24-hour PM2.5 concentration of 21 µg/m3 compared to 27 µg/m3 for CAMx/WRF. The source regions that contribute to PM2.5 concentrations are quite different using the two meteorological inputs with CAMx/MM5 estimating higher local PM contributions from emissions in the HKSAR and CAMx/WRF estimating more transport from nearby areas (e.g., Shen Zhen) as well as from the 3 km domain boundary conditions (BCs). On July 25, both models estimate higher PM2.5 concentrations at TC (43-46 µg/m3) with again CAMx/MM5 having more local contributions than CAMx/WRF, only in this case both models estimate most of the PM at TC comes from outside of the HKSAR.
Figure 8-2a. PM source apportionment results for Tung Chung (TC) and PM2.5 concentrations on July 24, 2006 (205) using MM5 (middle) and WRF (bottom) meteorological inputs.
0
1
2
3
4
5
6
7
Bio
Are
a
Mobile
Mari
ne
Poin
t
Bio
Are
a
Mobile
Mari
ne
Poin
t
Bio
Are
a
Mobile
Mari
ne
Poin
t
Bio
Are
a
Mobile
Mari
ne
Poin
t
Bio
Are
a
Mobile
Mari
ne
Poin
t
Bio
Are
a
Mobile
Mari
ne
Poin
t
Bio
Are
a
Mobile
Mari
ne
Poin
t
Bio
Are
a
Mobile
Mari
ne
Poin
t
Bio
Are
a
Mobile
Mari
ne
Poin
t
INT
EX
B
Bio
Are
a
Mobile
Mari
ne
Poin
t
INT
EX
B
Bio
Are
a
Mobile
Mari
ne
Poin
t
INT
EX
B
Bio
Are
a
Mobile
Mari
ne
Poin
t
INT
EX
B
NA
PC
L
SO
AA
SO
AB
BC IC
HKSAR Shen Zhen Gongguan Guangzhou Foshan Zhongshan Zhuhai & Macao SAR
Remainder 1km Guangzhou 3km Foshan Zhuhai & Macao SAR
Remainder 3km
ug
/m3
PM2.5 Contribution at Tung Chung on 07/24/2006 from MM5 Modeling
SOAB SOAA PCL NA PS4 POA PN4 PN3 PFN PFC PEC
Total PM2.5 = 21.0 ug/m3 Contribution from BC = 12.6%, from IC = 0.0%
0
1
2
3
4
5
6
7
Bio
Are
a
Mobile
Ma
rine
Poin
t
Bio
Are
a
Mobile
Ma
rine
Poin
t
Bio
Are
a
Mobile
Ma
rine
Poin
t
Bio
Are
a
Mobile
Ma
rine
Poin
t
Bio
Are
a
Mobile
Ma
rine
Poin
t
Bio
Are
a
Mobile
Ma
rine
Poin
t
Bio
Are
a
Mobile
Ma
rine
Poin
t
Bio
Are
a
Mobile
Ma
rine
Poin
t
Bio
Are
a
Mobile
Ma
rine
Poin
t
INT
EX
B
Bio
Are
a
Mobile
Ma
rine
Poin
t
INT
EX
B
Bio
Are
a
Mobile
Ma
rine
Poin
t
INT
EX
B
Bio
Are
a
Mobile
Ma
rine
Poin
t
INT
EX
B
NA
PC
L
SO
AA
SO
AB
BC IC
HKSAR Shen Zhen Gongguan Guangzhou Foshan Zhongshan Zhuhai & Macao SAR
Remainder 1km Guangzhou 3km Foshan Zhuhai & Macao SAR
Remainder 3km
ug
/m3
PM2.5 Contribution at Tung Chung on 07/24/2006 from WRF Modeling
SOAB SOAA PCL NA PS4 POA PN4 PN3 PFN PFC PEC
Total PM2.5 = 26.9 ug/m3 Contribution from BC = 19.4%, from IC = 0.0%

Privileged and Confidential
Final Report Agreement No. CE 27/2007 (EP) Upgrade of a Regional
Air Quality Modelling System (PATH) –––– Feasibility Study
F I N AL
HK1100066 61
Figure 8-2b. PM source apportionment results for Tung Chung (TC) and PM2.5 concentrations on July 25, 2006 (206) using MM5 (middle) and WRF (bottom) meteorological inputs.
0
2
4
6
8
10
12
14
16
18
Bio
Are
a
Mo
bile
Ma
rine
Poin
t
Bio
Are
a
Mo
bile
Ma
rine
Poin
t
Bio
Are
a
Mo
bile
Ma
rine
Poin
t
Bio
Are
a
Mo
bile
Ma
rine
Poin
t
Bio
Are
a
Mo
bile
Ma
rine
Poin
t
Bio
Are
a
Mo
bile
Ma
rine
Poin
t
Bio
Are
a
Mo
bile
Ma
rine
Poin
t
Bio
Are
a
Mo
bile
Ma
rine
Poin
t
Bio
Are
a
Mo
bile
Ma
rine
Poin
t
INT
EX
B
Bio
Are
a
Mo
bile
Ma
rine
Poin
t
INT
EX
B
Bio
Are
a
Mo
bile
Ma
rine
Poin
t
INT
EX
B
Bio
Are
a
Mo
bile
Ma
rine
Poin
t
INT
EX
B
NA
PC
L
SO
AA
SO
AB
BC IC
HKSAR Shen Zhen Gongguan Guangzhou Foshan Zhongshan Zhuhai & Macao SAR
Remainder 1km Guangzhou 3km Foshan Zhuhai & Macao SAR
Remainder 3km
ug
/m3
PM2.5 Contribution at Tung Chung on 07/25/2006 from MM5 Modeling
SOAB SOAA PCL NA PS4 POA PN4 PN3 PFN PFC PEC
Total PM2.5 = 46.4 ug/m3 Contribution from BC = 30.5%, from IC = 0.0%
0
2
4
6
8
10
12
14
16
18
Bio
Are
a
Mob
ile
Marine
Po
int
Bio
Are
a
Mob
ile
Marine
Po
int
Bio
Are
a
Mob
ile
Marine
Po
int
Bio
Are
a
Mob
ile
Marine
Po
int
Bio
Are
a
Mob
ile
Marine
Po
int
Bio
Are
a
Mob
ile
Marine
Po
int
Bio
Are
a
Mob
ile
Marine
Po
int
Bio
Are
a
Mob
ile
Marine
Po
int
Bio
Are
a
Mob
ile
Marine
Po
int
INT
EX
B
Bio
Are
a
Mob
ile
Marine
Po
int
INT
EX
B
Bio
Are
a
Mob
ile
Marine
Po
int
INT
EX
B
Bio
Are
a
Mob
ile
Marine
Po
int
INT
EX
B
NA
PC
L
SO
AA
SO
AB
BC IC
HKSAR Shen Zhen Gongguan Guangzhou Foshan Zhongshan Zhuhai & Macao SAR
Remainder 1km Guangzhou 3km Foshan Zhuhai & Macao SAR
Remainder 3km
ug
/m3
PM2.5 Contribution at Tung Chung on 07/25/2006 from WRF Modeling
SOAB SOAA PCL NA PS4 POA PN4 PN3 PFN PFC PEC
Total PM2.5 = 43.0 ug/m3 Contribution from BC = 36.0%, from IC = 0.0%
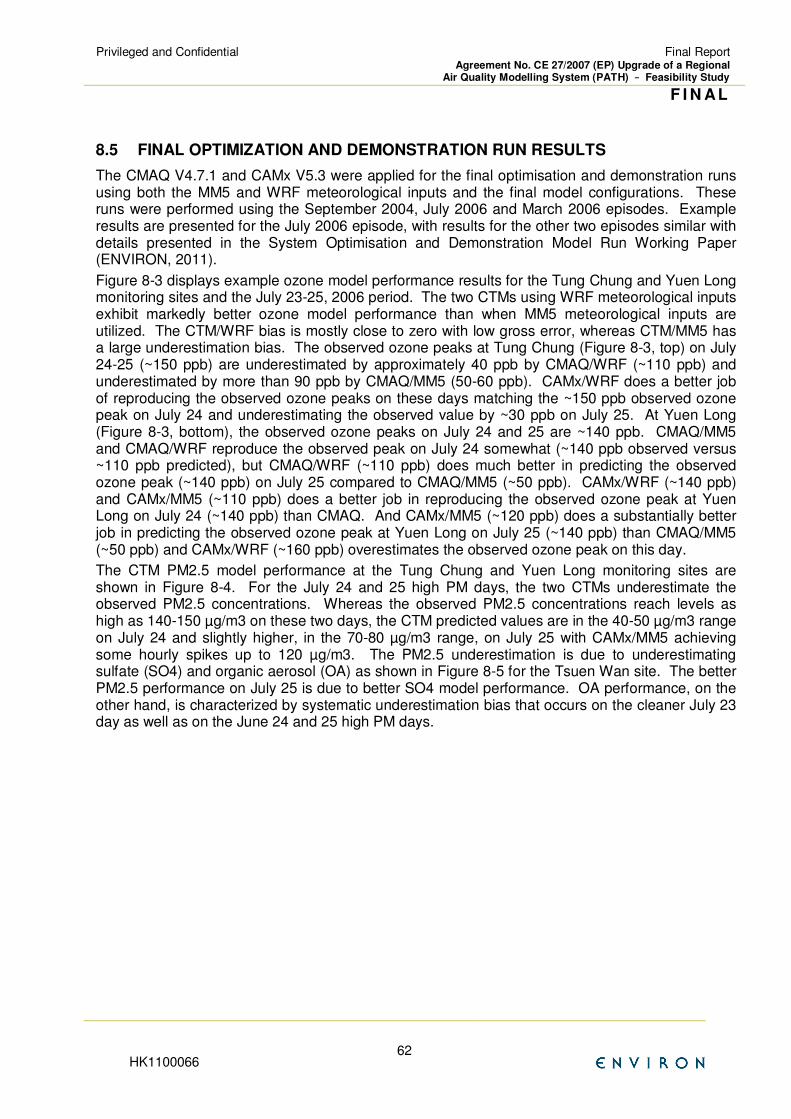
Privileged and Confidential
Final Report Agreement No. CE 27/2007 (EP) Upgrade of a Regional
Air Quality Modelling System (PATH) –––– Feasibility Study
F I N AL
HK1100066 62
8.5 FINAL OPTIMIZATION AND DEMONSTRATION RUN RESULTS
The CMAQ V4.7.1 and CAMx V5.3 were applied for the final optimisation and demonstration runs using both the MM5 and WRF meteorological inputs and the final model configurations. These runs were performed using the September 2004, July 2006 and March 2006 episodes. Example results are presented for the July 2006 episode, with results for the other two episodes similar with details presented in the System Optimisation and Demonstration Model Run Working Paper (ENVIRON, 2011).
Figure 8-3 displays example ozone model performance results for the Tung Chung and Yuen Long monitoring sites and the July 23-25, 2006 period. The two CTMs using WRF meteorological inputs exhibit markedly better ozone model performance than when MM5 meteorological inputs are utilized. The CTM/WRF bias is mostly close to zero with low gross error, whereas CTM/MM5 has a large underestimation bias. The observed ozone peaks at Tung Chung (Figure 8-3, top) on July 24-25 (~150 ppb) are underestimated by approximately 40 ppb by CMAQ/WRF (~110 ppb) and underestimated by more than 90 ppb by CMAQ/MM5 (50-60 ppb). CAMx/WRF does a better job of reproducing the observed ozone peaks on these days matching the ~150 ppb observed ozone peak on July 24 and underestimating the observed value by ~30 ppb on July 25. At Yuen Long (Figure 8-3, bottom), the observed ozone peaks on July 24 and 25 are ~140 ppb. CMAQ/MM5 and CMAQ/WRF reproduce the observed peak on July 24 somewhat (~140 ppb observed versus ~110 ppb predicted), but CMAQ/WRF (~110 ppb) does much better in predicting the observed ozone peak (~140 ppb) on July 25 compared to CMAQ/MM5 (~50 ppb). CAMx/WRF (~140 ppb) and CAMx/MM5 (~110 ppb) does a better job in reproducing the observed ozone peak at Yuen Long on July 24 (~140 ppb) than CMAQ. And CAMx/MM5 (~120 ppb) does a substantially better job in predicting the observed ozone peak at Yuen Long on July 25 (~140 ppb) than CMAQ/MM5 (~50 ppb) and CAMx/WRF (~160 ppb) overestimates the observed ozone peak on this day.
The CTM PM2.5 model performance at the Tung Chung and Yuen Long monitoring sites are shown in Figure 8-4. For the July 24 and 25 high PM days, the two CTMs underestimate the observed PM2.5 concentrations. Whereas the observed PM2.5 concentrations reach levels as high as 140-150 µg/m3 on these two days, the CTM predicted values are in the 40-50 µg/m3 range on July 24 and slightly higher, in the 70-80 µg/m3 range, on July 25 with CAMx/MM5 achieving some hourly spikes up to 120 µg/m3. The PM2.5 underestimation is due to underestimating sulfate (SO4) and organic aerosol (OA) as shown in Figure 8-5 for the Tsuen Wan site. The better PM2.5 performance on July 25 is due to better SO4 model performance. OA performance, on the other hand, is characterized by systematic underestimation bias that occurs on the cleaner July 23 day as well as on the June 24 and 25 high PM days.
Privileged and Confidential
Final Report Agreement No. CE 27/2007 (EP) Upgrade of a Regional
Air Quality Modelling System (PATH) –––– Feasibility Study
F I N AL
HK1100066 63
Figure 8-3. Comparison of ozone model performance on July 23-25, 2006 for the CMAQ V4.71 (left) and CAMx V5.3 (right) final optimisation and demonstration runs using MM5 and WRF meteorological inputs at the Tung Chung (top) and Yuen Long (bottom) monitoring sites.
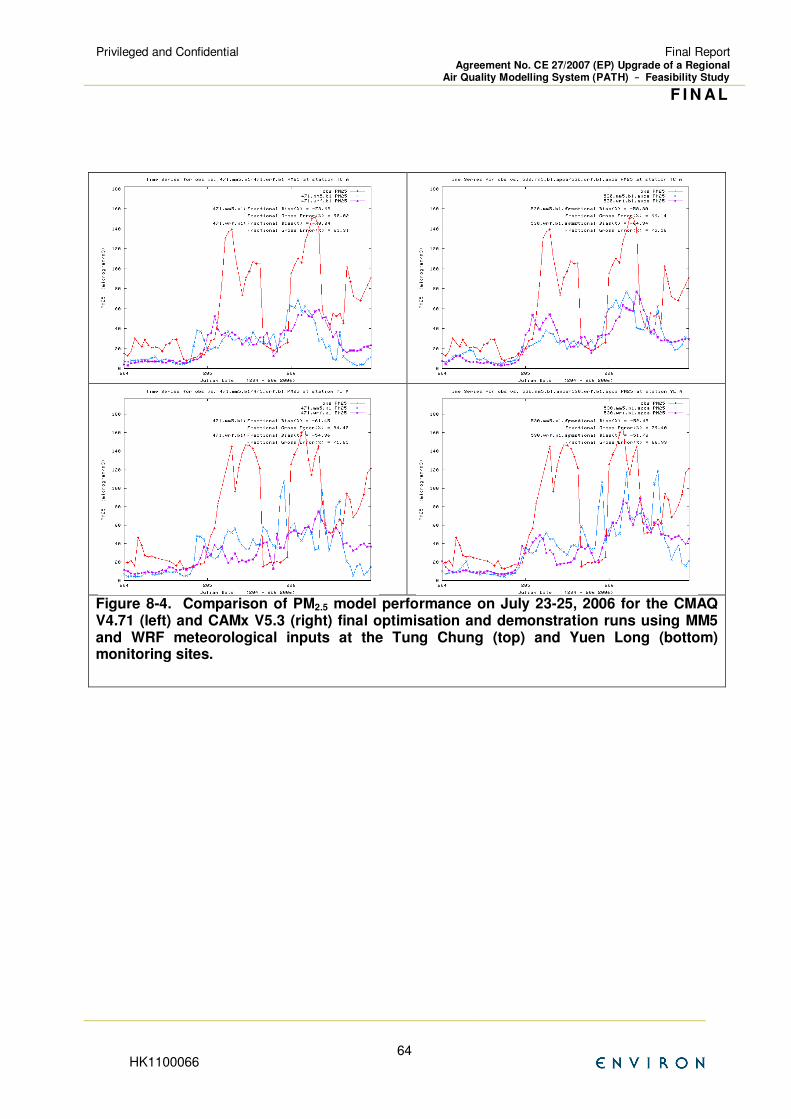
Privileged and Confidential
Final Report Agreement No. CE 27/2007 (EP) Upgrade of a Regional
Air Quality Modelling System (PATH) –––– Feasibility Study
F I N AL
HK1100066 64
Figure 8-4. Comparison of PM2.5 model performance on July 23-25, 2006 for the CMAQ V4.71 (left) and CAMx V5.3 (right) final optimisation and demonstration runs using MM5 and WRF meteorological inputs at the Tung Chung (top) and Yuen Long (bottom) monitoring sites.

Privileged and Confidential
Final Report Agreement No. CE 27/2007 (EP) Upgrade of a Regional
Air Quality Modelling System (PATH) –––– Feasibility Study
F I N AL
HK1100066 65
Figure 8-5. Comparison of Sulfate (SO4, top) and Organic Aerosol (OA, bottom) model performance on July 23-25, 2006 for the CMAQ V4.71 (left) and CAMx V5.3 (right) final optimisation and demonstration runs using MM5 and WRF meteorological inputs at the Yuen Long monitoring sites.
Privileged and Confidential
Final Report Agreement No. CE 27/2007 (EP) Upgrade of a Regional
Air Quality Modelling System (PATH) –––– Feasibility Study
F I N AL
HK1100066 66
8.6 FINAL OPTIMIZATION AND DEMONSTRATION RUN CONCLUSION
The latest versions of CMAQ (V4.7.1) and CAMx (V5.30) Chemical Transport Models (CTMs) were successfully applied to the Hong Kong and Pearl River Delta region using three historical episodes, September 2004, July 2006 and March 2006, using meteorological inputs based on the MM5 and WRF Meteorological Models (MMs). Ozone model performance was markedly better in both CTMs using the WRF meteorological inputs versus using ones based on MM5. The results were very promising for both CTMs. Aside from the roadway monitoring sites that are affected by highly localized sources that are not captured by the 1 km resolution grid used by the CTMs, the magnitude of the observed NO2 concentrations was produced very well by the two CTMs. As expected due to local source contributions CO concentrations were underestimated at the roadside monitoring sites, but was reproduced well at the Hong Kong urban core monitoring sites. SO2 performance was characterized by numerous predicted and observed hourly spikes and low bias. The generally good model performance results for the gaseous precursor species (i.e., NO2, NO, CO and SO2) suggest that emissions are well characterized within the Hong Kong urban core, but may be understated outside of Hong Kong including within the PRD region and other mainland regions.
PM is underestimated by both CTMs with the underestimation tendency greatest for organic aerosol (OA). Sulfate (SO4) is underestimated during high episode periods. Nitrate (NO3) performance was variable, with the CTMs typically estimating much lower values than observed that are near zero and much higher spikes. The magnitudes of the observed Elemental Carbon (EC) are reproduced well. These underestimations are likely due to understated emissions in the PRD and mainland resulting in an understatement of long range transport of PM into Hong Kong.
The final CMAQ and CAMx optimisation and demonstration runs demonstrated the successful application of the CTMs to Asia and Hong Kong and the Pearl River Delta (PRD) region and offer the new HK/PRD modelling system as a useful air quality planning tool for the region.
Privileged and Confidential
Final Report Agreement No. CE 27/2007 (EP) Upgrade of a Regional
Air Quality Modelling System (PATH) –––– Feasibility Study
F I N AL
HK1100066 67
9. Post Implementation Review
Once the upgraded PATH modelling system was delivered to EPD, installed on their computer system and EPD was trained on its use, EPD set up the modelling system to perform forecasting of meteorological and air quality conditions in the Hong Kong and surrounding areas. A Post Implementation Review report was prepared (ENVIRON, 2010f) which reviewed and evaluated the EPD forecasting results for the four month period of August through November 2010. Since then EPD has provided CTM forecasting results for the entire 2010 calendar year that are discussed in this Chapter
9.1 EPD FORECASTING METHODOLOGY
The EPD meteorological and air quality forecasting was performed using the MM5 Meteorological Model (MM) and the CMAQ Chemical Transport Model (CTM). 72 hour MM5 and CMAQ forecast simulations were initialized at 00 UTC (00 GMT) everyday. Meteorological data for initializing the MM5 model were obtained from the Global Telecommunications System (GTS). (GTS) is a global network for the transmission of meteorological data from weather stations, satellites and numerical weather prediction centres. Day-specific hourly biogenic emissions were generated using the MM5 forecast meteorological data and the MEGAN biogenic emissions modelling system. Day-specific plume rise calculations were also made using the MM5 forecast data. The remainder of the emission inputs were pre-computed. The MM5 and CMAQ forecasts were run on all four of the 27/9/3/1 km nested grid domains. MM5 Version 3.7 and CMAQ Version 4.6 were used in the EPD’s forecast modelling.
9.2 POST IMPLEMENTATION REVIEW REPORT EVALUATION
The Post Implementaytion Review Report (ENVIRON, 2010f) evaluated the MM5 and CMAQ forecasts against meteorological and air qualoty observations for the four month period of August through November 2010 for all sites in Hong Kong and the following variables:
• Wind Speed (m/s)
• Wind Direction (degrees)
• Temperature (°C)
• Ozone (µg/m3)
• RSP/PM10 (µg/m3)
• NO2 (µg/m3)
• NO (µg/m3)
• SO2 (µg/m3)
• CO (µg/m3)
The MM5 meteorological model tends to perform best at inland sites when there is a steady and organized flow regime. At coastal and island monitoring sites, the MM5 performance for temperature is frequently quite poor. For example, at the Cheung Chao and Wagland Island sites on islands south of Hong Kong, the diurnal temperature profile estimated by MM5 has much less variation than observed. This is likely due to the fact that the monitoring site lies on land, whereas MM5 is using an average land use characteristic across the 1 km grid cell that is influenced by water. Thus, the MM5 temperature estimates are more reflective of being overwater where there is much less diurnal variation than over land, where surface heating and cooling affects the diurnal temperature profiles.
Privileged and Confidential
Final Report Agreement No. CE 27/2007 (EP) Upgrade of a Regional
Air Quality Modelling System (PATH) –––– Feasibility Study
F I N AL
HK1100066 68
The Hong Kong air quality network includes three roadside air quality monitoring stations:
• Causeway Bay;
• Central; and
• Mong Kokl.
Since the roadside monitoring sites are located adjacent to (or even within) major roadways, a CTM grid model is not expected to reproduce the observed concentrations very well. This is because the CTM is estimating a grid cell average concentration that is representative of a 1 km by 1 km grid cell so fails to simulate the high concentration gradients across the grid cell and the higher concentrations next to the roadway. Thus, we expect the CTM to underestimate pollutants that are emitted by motor vehicles at these sites, such as NO, NO2, CO and RSP, and overestimate ozone concentrations because it does not fully account for the local ozone titration due to fresh NO emissions from the motor vehicles. As shown in the Post Implementation and Review Report (ENVIRON, 2010f) the CMAQ model overestimates ozone but underestimates RSP, NO2 and CO concentrations at these roadside monitoring sites as expected.
The evaluation of the CMAQ forecast runs for the 2010 calendar year is discussed below, more details on the MM5 forecast evaluation and evaluation at the roadside monitors can be found in ENVIRON (2010f).
9.3 OZONE EVALUATION
In 1991, USEPA formulated their first ozone modelling guidance and published performance goals for hourly ozone concentrations of bias within ±15% and gross error within 35%. Table 9-1 compares the CMAQ forecasting results ozone model performance for fractional bias (FB or FBias) and Fractional Gross Error (FE or FError) with the USEPA perfomance goals. The FBias and FError performance metrics were calculated using a 40 ppb observed hourly ozone concentration cutoff threshold. The ozone performance statistics are calculated by month, with the exception that because there was a day in September 2010 with missing CMAQ modelling results, September was split in half. Similarly, when calculating annual ozone statistics they were also split in half. Figure 9-1 displays the ozone performance statistics by monitoring sites for four seasonal representtaive months of January, April, August and October.
The PATH upgrade 2010 CMAQ simulation is achieving USEPA’s ozone performance goals for bias and error most of the time. Of the 30 bias and error ozone performance metrics in Table 9-1, 25 achieve USEPA’s performance goals (i.e., achieves USEPA’s performance goals 83% of the time). Table 9-1 also lists the total number of sites with performance statistics and the number of sites that achieve USEPA’s performance goal for each month of 2010. For March, June, July and the first half of September 2010, CMAQ fails to achieves USEPA’s performance goal for bias due to too high overestimation bias in March and too much of an underestimation bias in the other months. In July there were only 4 sites that had ozone above 40 ppb and none of them achieved USEPA’s performance goal; this month is characterized by monsoon rain activity so ozone is not typically an issue. For most months (~70 percent of the time) a majority of the monitoring sites achieve USEPA”s performance goals.
CMAQ is exhibiting much better model performance for the 2010 demonstration modelling than seen for the four historical episodes. This may be due to more representtaive emisisons inventory. The MM5 simulations were run in forecast mode and we would expect even better model performance if the MM5 simulations used data assimilation.
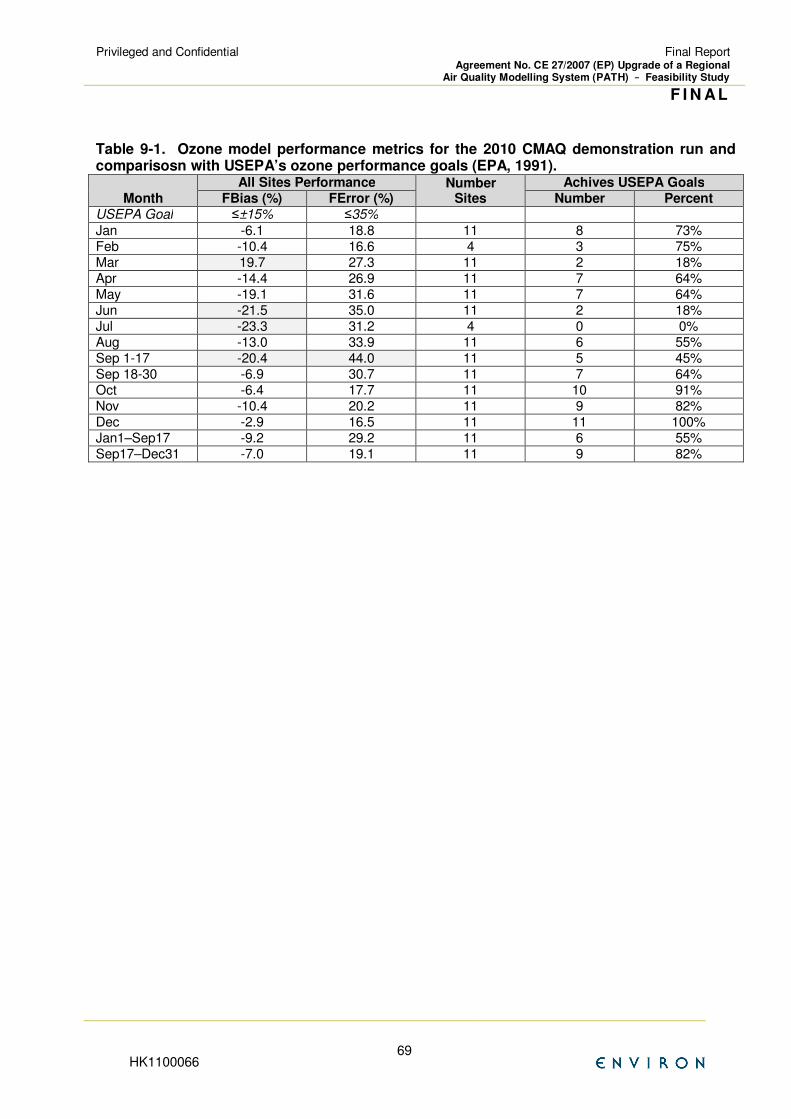
Privileged and Confidential
Final Report Agreement No. CE 27/2007 (EP) Upgrade of a Regional
Air Quality Modelling System (PATH) –––– Feasibility Study
F I N AL
HK1100066 69
Table 9-1. Ozone model performance metrics for the 2010 CMAQ demonstration run and comparisosn with USEPA’s ozone performance goals (EPA, 1991).
Month
All Sites Performance Number Sites
Achives USEPA Goals FBias (%) FError (%) Number Percent
USEPA Goal ≤±15% ≤35%
Jan -6.1 18.8 11 8 73% Feb -10.4 16.6 4 3 75% Mar 19.7 27.3 11 2 18% Apr -14.4 26.9 11 7 64% May -19.1 31.6 11 7 64% Jun -21.5 35.0 11 2 18% Jul -23.3 31.2 4 0 0% Aug -13.0 33.9 11 6 55% Sep 1-17 -20.4 44.0 11 5 45% Sep 18-30 -6.9 30.7 11 7 64% Oct -6.4 17.7 11 10 91% Nov -10.4 20.2 11 9 82% Dec -2.9 16.5 11 11 100% Jan1–Sep17 -9.2 29.2 11 6 55% Sep17–Dec31 -7.0 19.1 11 9 82%

Privileged and Confidential
Final Report Agreement No. CE 27/2007 (EP) Upgrade of a Regional
Air Quality Modelling System (PATH) –––– Feasibility Study
F I N AL
HK1100066 70
Figure 9-1a. Ozone fractional bias and gross error by monitoring site for January 2010 and CMAQ forecast demonstration run (USEPA performance goals of FBias ≤ ±15% and FError ≤ 35%).
-30
-25
-20
-15
-10
-5
0
5
10
15
20
25
30
Fra
ctti
on
al B
ias
(%)
Site
January Fractional Bias (%)
Ozone (40ppb cutoff)
0
5
10
15
20
25
30
35
40
45
Fra
ctti
on
al G
ross
Err
or
(%)
Site
January Fractional Gross Error (%)
Ozone (40ppb cutoff)
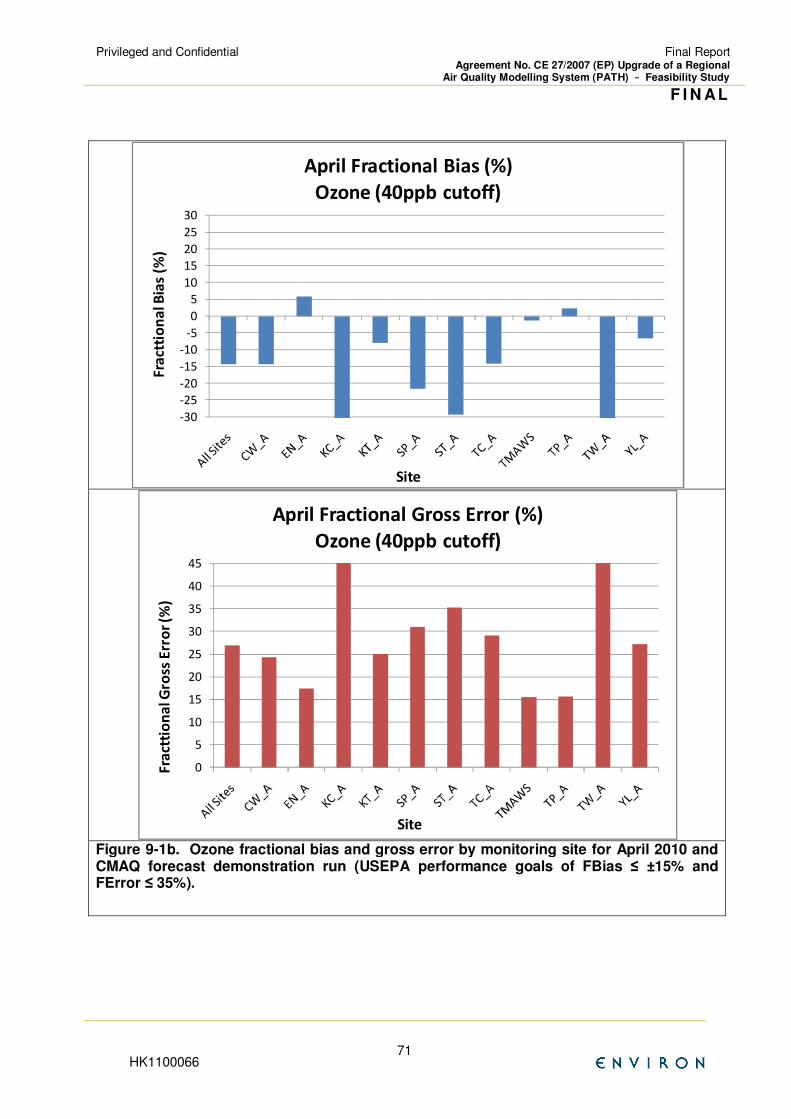
Privileged and Confidential
Final Report Agreement No. CE 27/2007 (EP) Upgrade of a Regional
Air Quality Modelling System (PATH) –––– Feasibility Study
F I N AL
HK1100066 71
Figure 9-1b. Ozone fractional bias and gross error by monitoring site for April 2010 and CMAQ forecast demonstration run (USEPA performance goals of FBias ≤ ±15% and FError ≤ 35%).
-30
-25
-20
-15
-10
-5
0
5
10
15
20
25
30
Fra
ctti
on
al B
ias
(%)
Site
April Fractional Bias (%)
Ozone (40ppb cutoff)
0
5
10
15
20
25
30
35
40
45
Fra
ctti
on
al G
ross
Err
or
(%)
Site
April Fractional Gross Error (%)
Ozone (40ppb cutoff)

Privileged and Confidential
Final Report Agreement No. CE 27/2007 (EP) Upgrade of a Regional
Air Quality Modelling System (PATH) –––– Feasibility Study
F I N AL
HK1100066 72
Figure 9-1c. Ozone fractional bias and gross error by monitoring site for August 2010 and CMAQ forecast demonstration run (USEPA performance goals of FBias ≤ ±15% and FError ≤ 35%).
-30
-25
-20
-15
-10
-5
0
5
10
15
20
25
30
Fra
ctti
on
al B
ias
(%)
Site
August Fractional Bias (%)
Ozone (40ppb cutoff)
0
5
10
15
20
25
30
35
40
45
Fra
ctti
on
al G
ross
Err
or
(%)
Site
August Fractional Gross Error (%)
Ozone (40ppb cutoff)
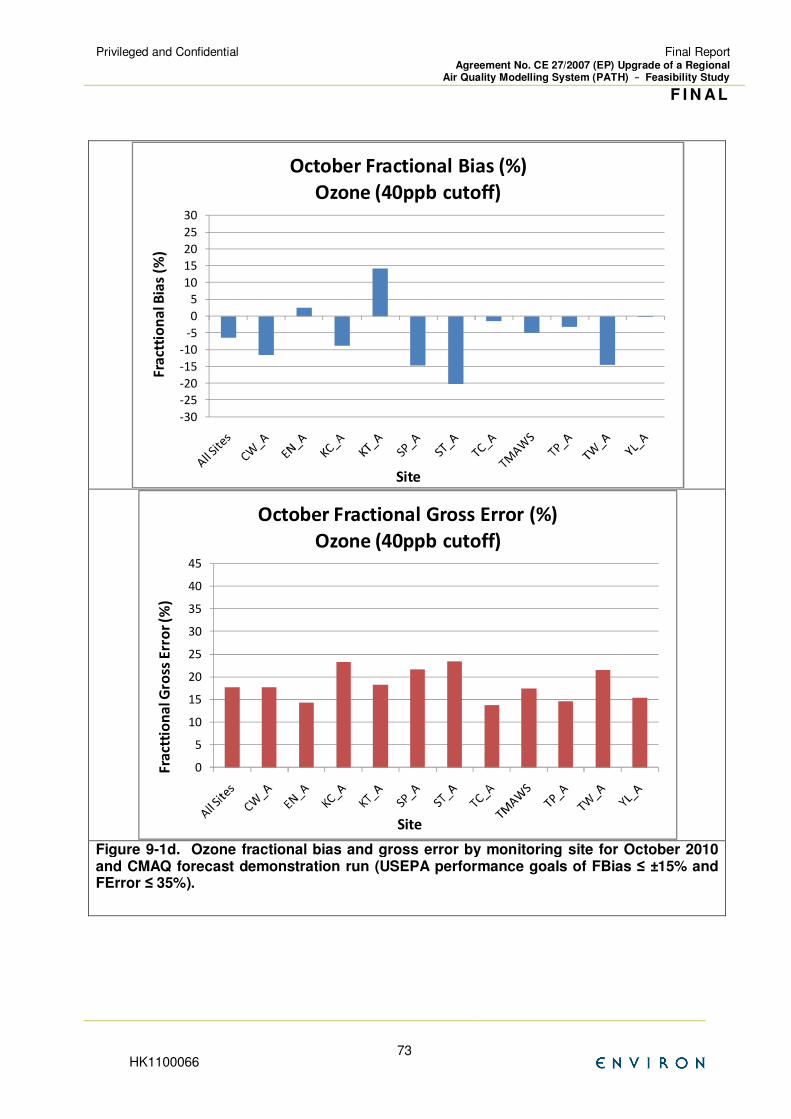
Privileged and Confidential
Final Report Agreement No. CE 27/2007 (EP) Upgrade of a Regional
Air Quality Modelling System (PATH) –––– Feasibility Study
F I N AL
HK1100066 73
Figure 9-1d. Ozone fractional bias and gross error by monitoring site for October 2010 and CMAQ forecast demonstration run (USEPA performance goals of FBias ≤ ±15% and FError ≤ 35%).
-30
-25
-20
-15
-10
-5
0
5
10
15
20
25
30
Fra
ctti
on
al B
ias
(%)
Site
October Fractional Bias (%)
Ozone (40ppb cutoff)
0
5
10
15
20
25
30
35
40
45
Fra
ctti
on
al G
ross
Err
or
(%)
Site
October Fractional Gross Error (%)
Ozone (40ppb cutoff)
Privileged and Confidential
Final Report Agreement No. CE 27/2007 (EP) Upgrade of a Regional
Air Quality Modelling System (PATH) –––– Feasibility Study
F I N AL
HK1100066 74
9.4 2010 ANNUAL EVALUATION ALL SPECIES
Figure 9-2 displays scatter plots and performance statistics of predicted and observed hourly ozone, NO2, NO, PM2.5, SO2 and CO concentrations across all Hong Kong monitoring sites and for two portions of the 2010 calendar year, January 1 through September 17 and September 18 through December 31, 2010. Because modelling results were missing in mid-September, the model performance displays were split into two parts of the year.
Although there is a fair amount of scatter, the CMAQ 2010 forecast demonstration run ozone performance is quite good (Figure 9-2a, top) with low fractional bias (-9% and -7%) and fractional error (29% and 19%) that achieves USEPA’s performance goals (≤±15% and ≤35%, respectively). The NO2 performance has an under-prediction bias (-60% and -72%), which is due in part to comparing point measurements with grid cell average model prediction (Figure 9-2a, middle). The under-prediction bias is also affected by the three roadway monitoring sites where the model is not expected to reproduce the observed NO2 concentations and where the fractional bias exceeds -100%; fractional bias at many of the other sites is approximatelyt -40%. The model also has difficulty in estimateing the NO concentations with fractional bias of over -100% (Figure 9-2a, bottom). The point measurement versus grid cell average prediction has even a greater affect on the NO concentrations. For example, most of the NO emissions affecting the monitors in Hong Kong are released near the surface from mobile sources, with the sampling probe of the monitoring site also typically being within a few meters from the surface. However, the lowest layer of CMAQ is 17 meters thick. We would expect there to be a very steep vertical concentration gradient in NO2 and NO concentrations in the lowest 17 m of the atmosphere. Thus, the NO2 and NO underestimation bias is not necessarily indicative of a poor performing model, but of inconsistencies in comparing a point measurement with a grid cell volume average prediction. In fact, the seemingly good ozone model performance is testamount that the model is probably producing the correct amount of NO2 and NO concentrations across the grid cell.
The most striking feature of the CMAQ PM2.5 performance during the first portion of 2010 are the extremely high observed PM2.5 concentations starting on March 21, 2010 (Figure 9-2b, top left). These high PM concentrations were due to a sand storm 2 that produced observed PM.5 concentations at all monitors in Hong Kong in the 500-700 µg/m3 range. The emissions from the sand storm were not included in the model inputs so the model underestoimation bias is expected. However, even in the second part of the 2010, the PM2.5 has an underestimation bias. As for the historical episodic modelling, a lot of this underestimation bias is due to understated emissions in the PRD and mainland China, as well as possibly other areas in Asia, that in turn result in understated regional PM loadings (e.g., sulfate). Zhang and co-workers (2009) saw much better performance in their global chemistry model when the mainland China emissions were increased. The upgraded PATH model performance will also improve with more accurate mainland China emissions. The observed SO2 concentrations in Hong Kong are overestimated with fractional bias values of 35% and 58% (Figure 9-2b, middle). A portion of the marine emissions are treated as elevated and we would expect in the real world that they would reman aloft in the stable air over water. However, in the model the grid cell averaging may be bringing the SO2 concentrations down to the ground too quickly resulting in higher ground-level SO2 concentations in the model than observed. The CO model performance also suffers from the point measurement and grid cell average model prediction incomensurability. Most of the CO emissions in Hong Kong come from mobile soures whose emissions are released near the ground. This results in a fairly large underestimation bias (-91% and -76%) when compared to the grid cell average model predictions. The CO underestimation bias is even greater at the roadside monitorig sites (e.g., Causway Bay -107% bias).
2 http://www.hko.gov.hk/blog/en/archives/00000054.htm
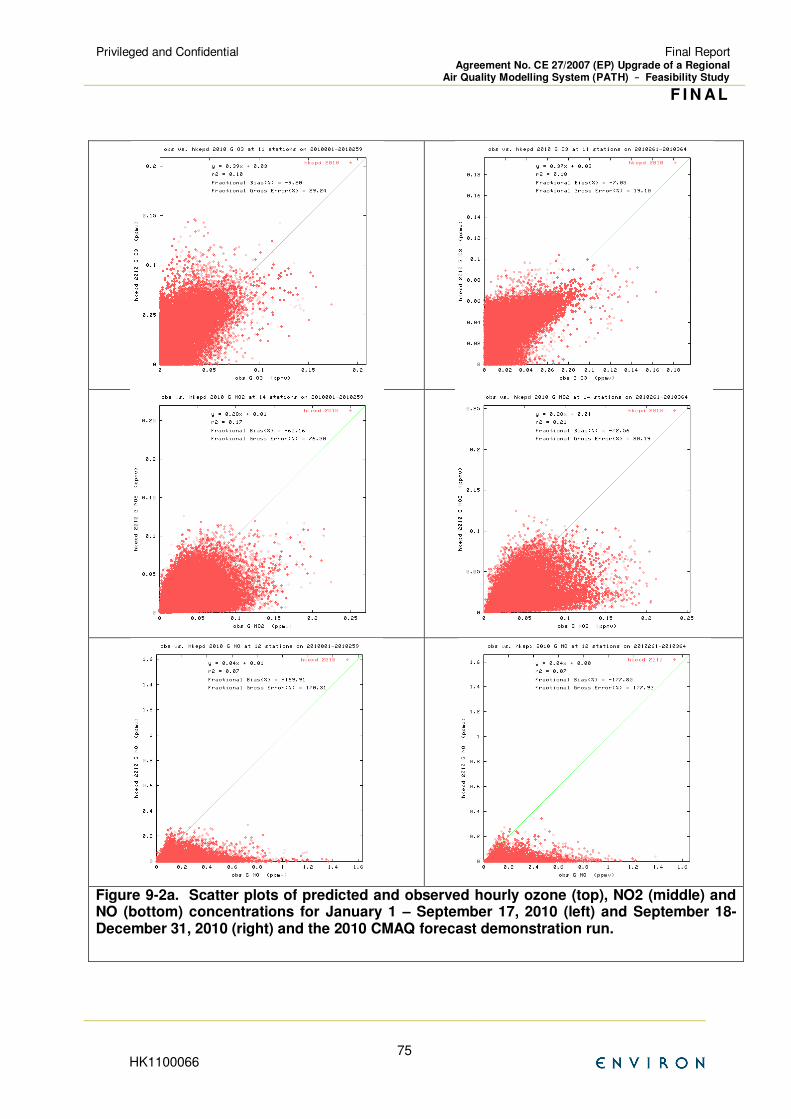
Privileged and Confidential
Final Report Agreement No. CE 27/2007 (EP) Upgrade of a Regional
Air Quality Modelling System (PATH) –––– Feasibility Study
F I N AL
HK1100066 75
Figure 9-2a. Scatter plots of predicted and observed hourly ozone (top), NO2 (middle) and NO (bottom) concentrations for January 1 – September 17, 2010 (left) and September 18-December 31, 2010 (right) and the 2010 CMAQ forecast demonstration run.
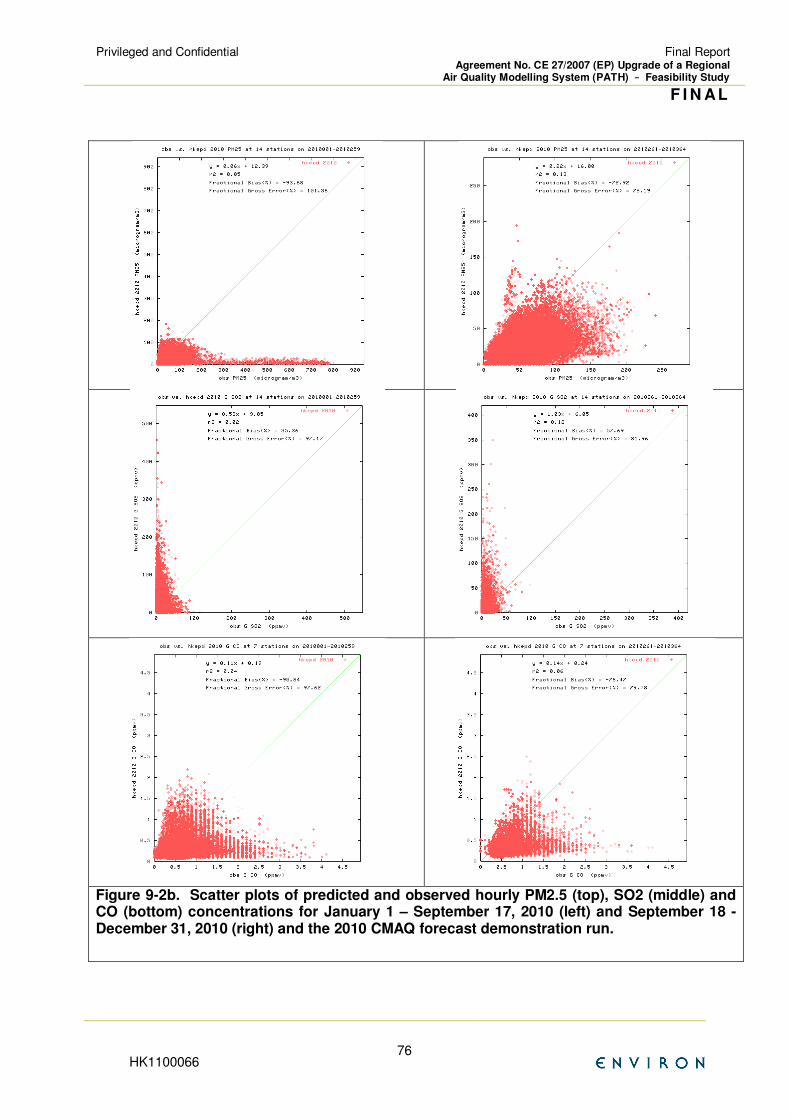
Privileged and Confidential
Final Report Agreement No. CE 27/2007 (EP) Upgrade of a Regional
Air Quality Modelling System (PATH) –––– Feasibility Study
F I N AL
HK1100066 76
Figure 9-2b. Scatter plots of predicted and observed hourly PM2.5 (top), SO2 (middle) and CO (bottom) concentrations for January 1 – September 17, 2010 (left) and September 18 - December 31, 2010 (right) and the 2010 CMAQ forecast demonstration run.
Privileged and Confidential
Final Report Agreement No. CE 27/2007 (EP) Upgrade of a Regional
Air Quality Modelling System (PATH) –––– Feasibility Study
F I N AL
HK1100066 77
9.5 2010 EPISODIC MODEL PERFORMANCE EVALUATION
A more detailed model performance evaluation was conducted for several high ozone and PM2.5 episodes that occurred during the 2010 demonstration run period:
• September 8-10, 2010 (ozone and PM2.5)
• September 18-20, 2010 (PM2.5 only)
• August 28-31, 2010 (ozone and PM2.5)
• October 23-25, 2010 (ozone only)
9.5.1 September 8-10, 2010
Figure 9-3 displays time series of predicted and observed hourly ozone concentations at six Hong Kong monitoring sites for the September 8-10, 2010 episode. At all six sites the model reproduces the observed high ozone on September 8 and 10 well (Julian Days 251 and 253) as well as the lower ozone on the day in between. On September 8, the modeled ozone tends to rise too early, but the daily maximum hourly ozone is matched well, although it tends to occur two hours earlier than observed.
Figure 9-4 displays time series of predicted and observed hourly PM2.5 concentrations for September 8-10, 2010. Although the model does not always reproduce the observed PM2.5 spikes, the systematic underestiomation bias seen in the 2003-2006 histroical episode modelling is not seen in the more current 2010 modelling; four of the six sites even exhibit fractional bias that achieves the stringent ozone ≤±15% performance goal. Note that because particulate matter is a mixture of numerous compounds and is defined by the measurement technique we would not expect a model to reproduce PM as well as ozone. Again, the understatement of emissions in the PRD and mainland likely contribute to the PM underestimation bias.
9.5.2 September 18-20, 2011
September 18-20, 2010 was a high PM2.5 episode across all sites in Hong Kong with observed peaks in the 120-160 µg/m3 on September 19 and slightly lower values (100-120 µg/m3) on September 20. As seen for six example monitoring sites in Figure 9-5, the model does a good job in reproducing the high observed PM2.5 peaks on September 19, but underestimates on September 20. The model even predicts higher PM2.5 on September 18 at those sites in north Hong Kong that exhibited higher observd PM2,.5 levels on this day (e.g., YL). The ability of the model to predict the observed high PM2.5 concentrations on September 19, 2010 is quite encouraging.
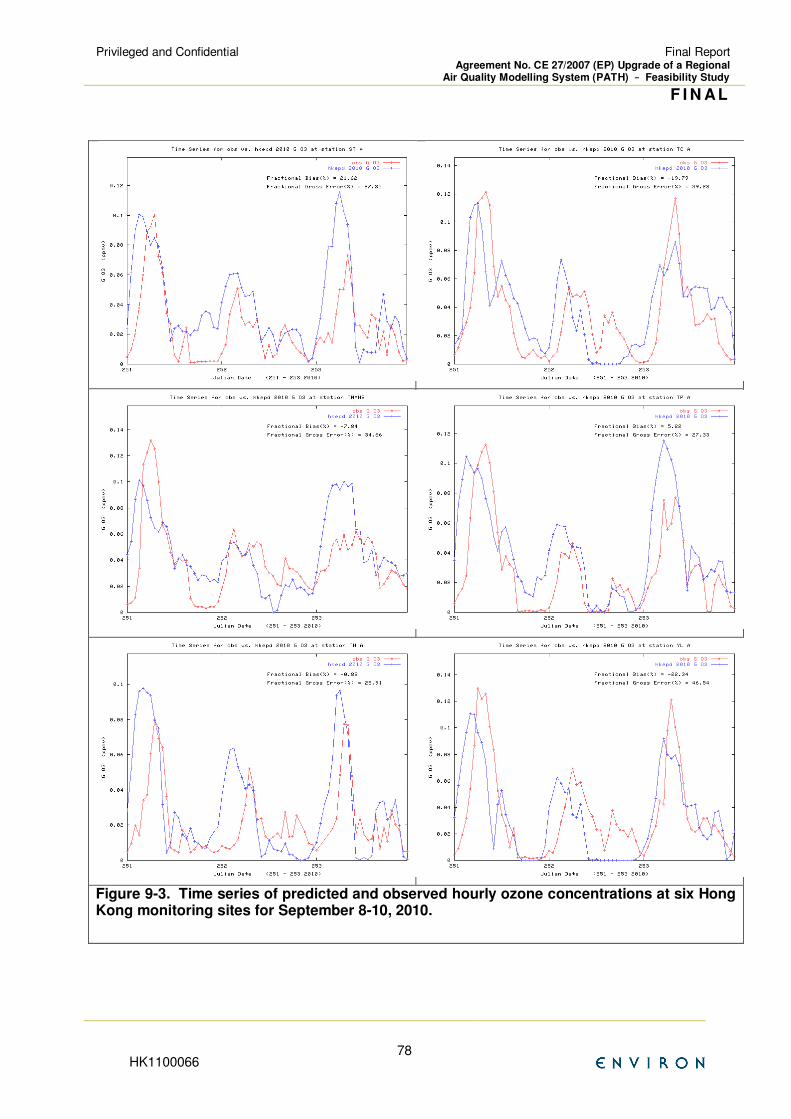
Privileged and Confidential
Final Report Agreement No. CE 27/2007 (EP) Upgrade of a Regional
Air Quality Modelling System (PATH) –––– Feasibility Study
F I N AL
HK1100066 78
Figure 9-3. Time series of predicted and observed hourly ozone concentrations at six Hong Kong monitoring sites for September 8-10, 2010.
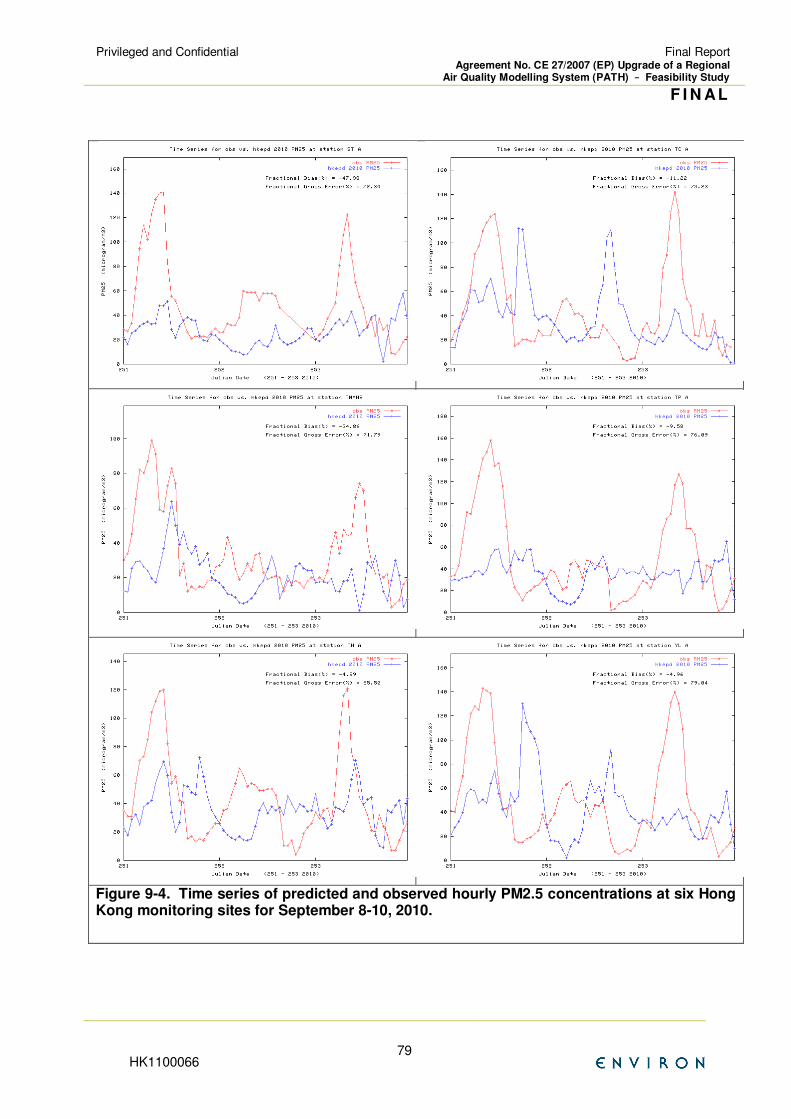
Privileged and Confidential
Final Report Agreement No. CE 27/2007 (EP) Upgrade of a Regional
Air Quality Modelling System (PATH) –––– Feasibility Study
F I N AL
HK1100066 79
Figure 9-4. Time series of predicted and observed hourly PM2.5 concentrations at six Hong Kong monitoring sites for September 8-10, 2010.
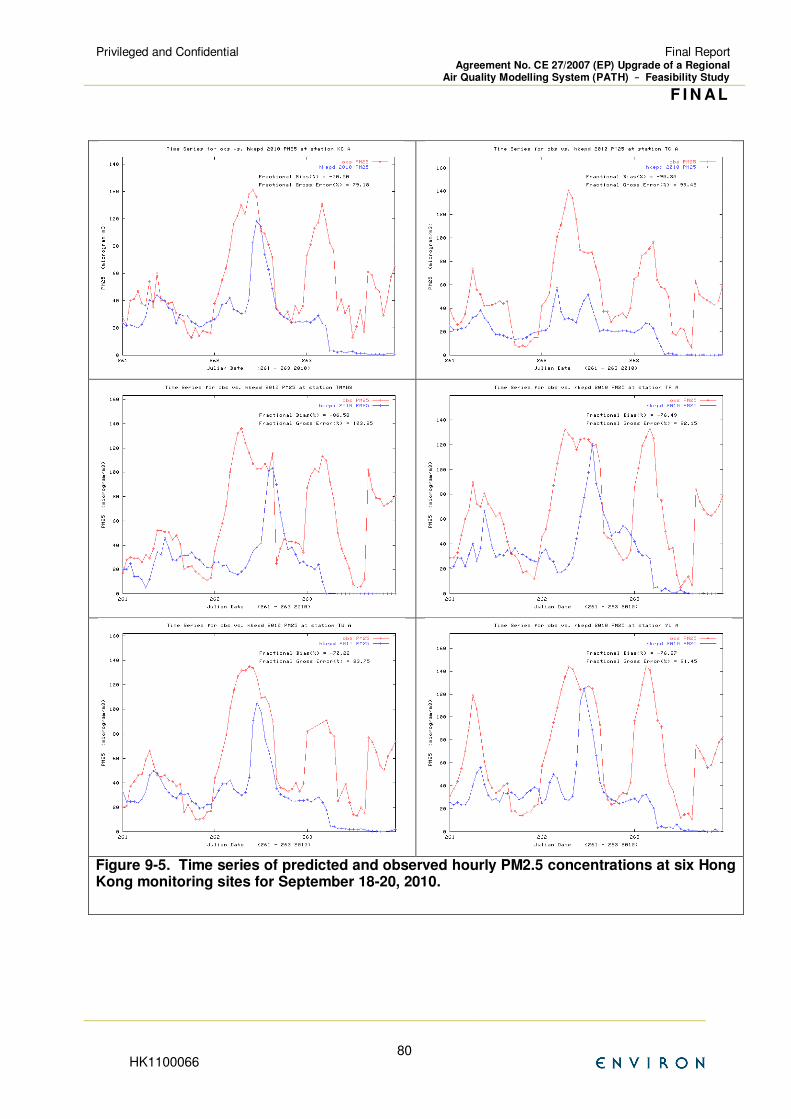
Privileged and Confidential
Final Report Agreement No. CE 27/2007 (EP) Upgrade of a Regional
Air Quality Modelling System (PATH) –––– Feasibility Study
F I N AL
HK1100066 80
Figure 9-5. Time series of predicted and observed hourly PM2.5 concentrations at six Hong Kong monitoring sites for September 18-20, 2010.
Privileged and Confidential
Final Report Agreement No. CE 27/2007 (EP) Upgrade of a Regional
Air Quality Modelling System (PATH) –––– Feasibility Study
F I N AL
HK1100066 81
9.5.3 August 28-31, 2010
High ozone and PM2.5 concentrations were observed in Hong Kong on August 28-31, 2010 (Julian Days 240-243). The CMAQ forecast demonstration run does a very good job in reproducing the diurnal variations in the observed ozone concentrations during August 28-31, 2010 at almost all the monitoring site in Hong Kong (Figure 9-6). The timing of the rise of the observed ozone concentrations is reproduced by the model very well, unlike the September 8-10, 2010 episode where the model starting rising ~2 hours earlier than observed. However, at some of the sites the model fails to reproduce the very highest observed ozone peaks. For example, at Tung Chung (TC) near the airport in western Hong Kong (Figure 9-6, top right) the modeled ozone rises with the observations and then starts to decline while the observed ozone rises some more. The model has more difficulty in simulating the observed concentrations at the TC site which is likely due to its coastal location and higher influence due to transport of pollutants coming down the PRD.
Figure 9-7 compares the predicted and observed PM2.5 concentrations for the August 28-31, 2010 period. The predicted values estimate a buildup of PM2.5 over the 4-day episode, whereas the observations also have a buildup of PM2.5 but with higher PM2.5 concentrations on the first day. If the model predictions were 10-20 µg/m3 higher they would match the observations very well. Which suggests that background (i.e., transported) PM2.5 concentrations may be too low, which is consistent with the hypothesus given earlier that emissions in the PRD and in the mainland may be understated.
9.5.4 October 23-25, 2010
Elevated ozone was observed in the Hong Kong region during October 23-25, 2010 with Figure 9-8 comparing the CMAQ estimated ozone concentrations with the observations at six sites during this period. The CMAQ ozone model performance is quite good matching the diurnal variation of the observed hourly ozone concentrations at all sites very well. The fractional bias at these six sites ranges from -11% to +11% achieving USEPA’s ≤±15% performance goal. The fractional error ranges from 13% to 28% thereby achieving USEPA’s ≤35% performance goal by a wide margin. The CMAQ ozone model performance at the TW and YL monitoring sites (bottom panels in Figure 9-8) is particularly good with near zero bias (-3% and 2%) and error (19% and 13%). Even the ozone performance at the TC monitoring site, where the CTMs have historically had difficulty in simulating the observations due to the coastal location, the CMAQ ozone performance is quite good during October 23-25, 2010 with bias (-9%) and error (21%) achieving USEPA’s performance goals.
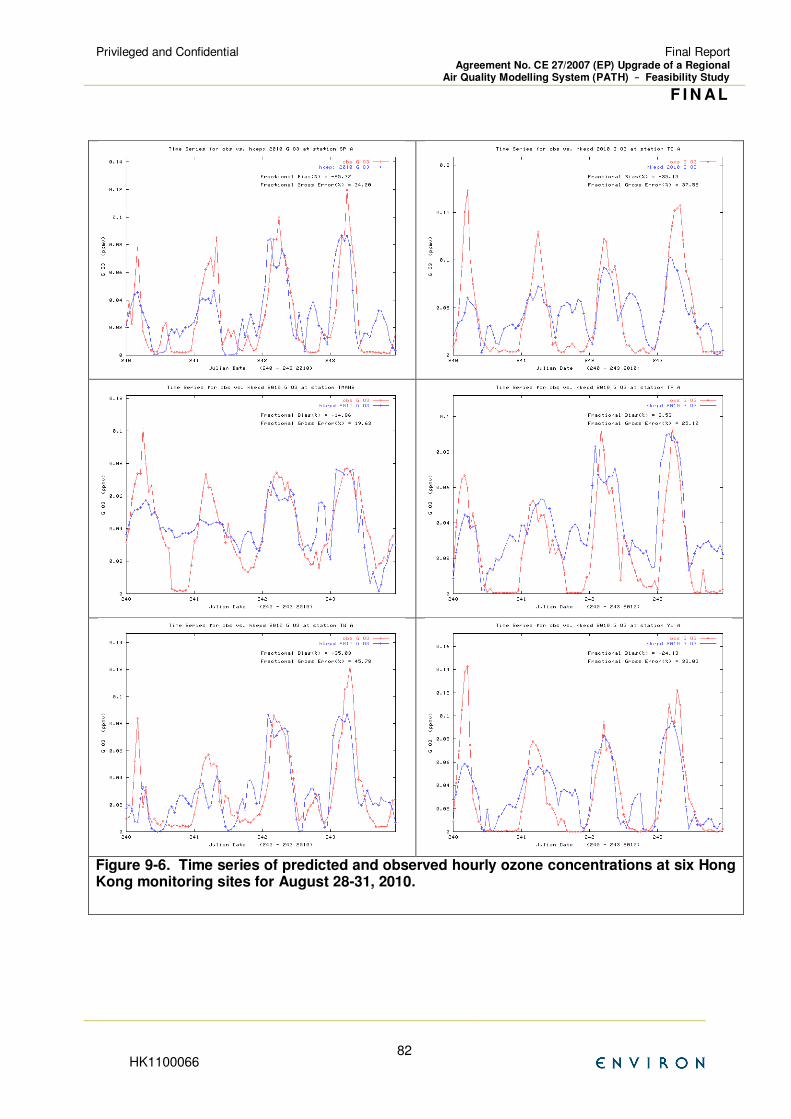
Privileged and Confidential
Final Report Agreement No. CE 27/2007 (EP) Upgrade of a Regional
Air Quality Modelling System (PATH) –––– Feasibility Study
F I N AL
HK1100066 82
Figure 9-6. Time series of predicted and observed hourly ozone concentrations at six Hong Kong monitoring sites for August 28-31, 2010.
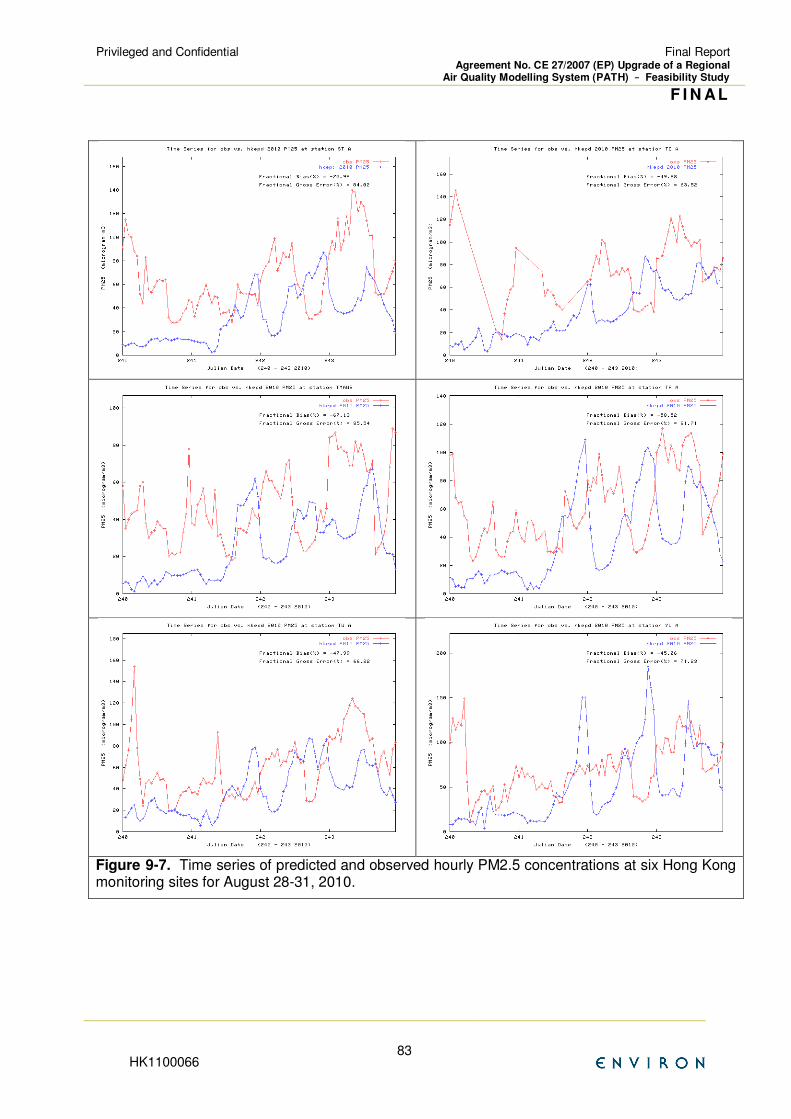
Privileged and Confidential
Final Report Agreement No. CE 27/2007 (EP) Upgrade of a Regional
Air Quality Modelling System (PATH) –––– Feasibility Study
F I N AL
HK1100066 83
Figure 9-7. Time series of predicted and observed hourly PM2.5 concentrations at six Hong Kong monitoring sites for August 28-31, 2010.
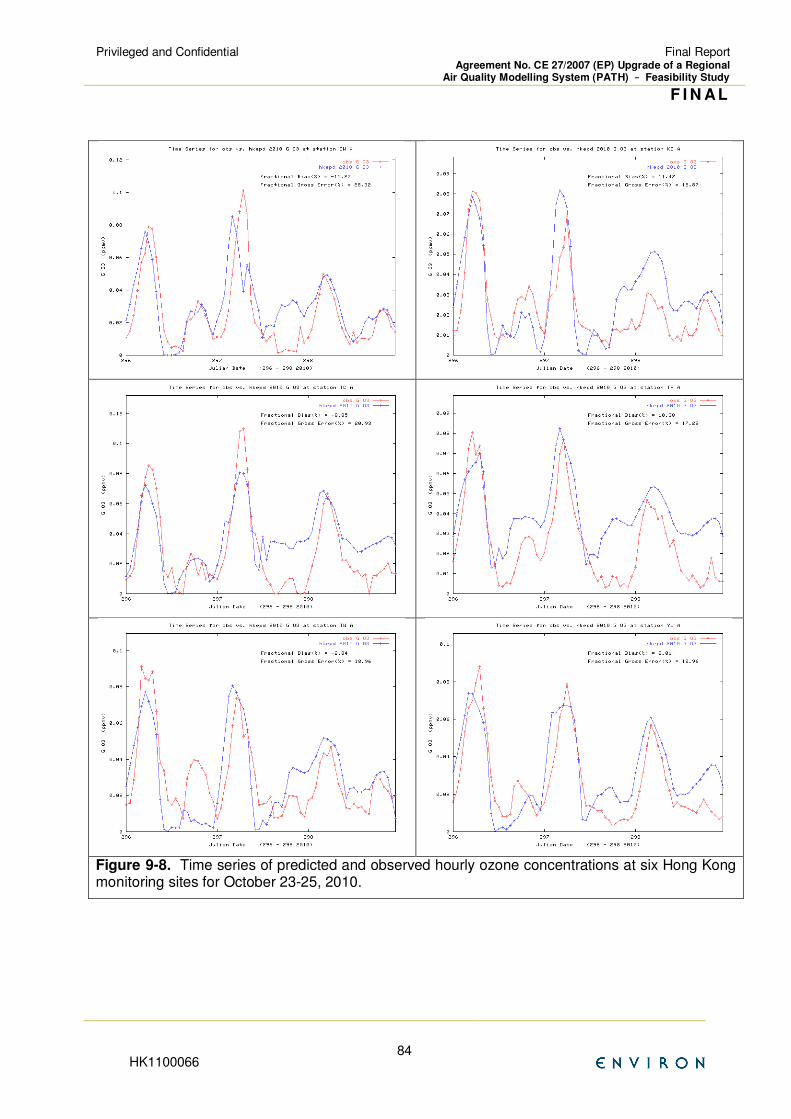
Privileged and Confidential
Final Report Agreement No. CE 27/2007 (EP) Upgrade of a Regional
Air Quality Modelling System (PATH) –––– Feasibility Study
F I N AL
HK1100066 84
Figure 9-8. Time series of predicted and observed hourly ozone concentrations at six Hong Kong monitoring sites for October 23-25, 2010.
Privileged and Confidential
Final Report Agreement No. CE 27/2007 (EP) Upgrade of a Regional
Air Quality Modelling System (PATH) –––– Feasibility Study
F I N AL
HK1100066 85
9.6 POST IMPLEMENTATION REVIEW CONCLUSIONS
The 2010 forecast demonstration run of the PATH MM5/CMAQ modelling system demonstrates that the modeling system is fully functional as a turn-key modelling system on EPD’s computers. What’s more is that the upgraded PATH forecast simulation for 2010 exhibited much better model performance than was seen in the sensitivity modelling using the 2003-2006 historical episodes. The ozone performance.of the 2010 demonstration run was quite good, with the results for the October 23-25, 2010 ozone episode being exceptional (Figure 9-8).
The upgraded PATH air quality modelling system 2010 demonstration run also exhibited much better PM2.5 model performance than the historical episode modelling. With the exception of a failure to capture a few hourly concentrations spikes and the expected underestimation bias at the roadside monitoring sites, the 2010 demonstration run captures the magnitudes and day-to-day variations of the observed NO2 and SO2 concentrations suggesting that the Hong Kong emissions inventory is representatuive of actual emissions.
The PM2.5 underestimation tendency of the model is most pronounced under wind conditions with northwesterly wind components and most pronounced at the Tung Chung (TC) monitoring site on Lantau Island in western Hong Kong. Under these conditions, emissions from metropolitan and industrial areas in the Pearl River Delta (PRD) can be transported southward over water of the PRD. The stable air conditions above the PRD waters will keep pollutants together and allow them to photochemically age producing high secondary as well as primary pollutant impacts in western Hong Kong. The underestimation bias at TC, as well as at the most northerly sites closest to mainland China (e.g., Yuen Long), suggest that the mainland China emissions inventory may be underestimated. This is consistent with recent reports on global chemistry modelling results and evaluation against satellite and other data that suggest the mainland China emissions are underestimated (Zhang et al., 2008; 2009).
Privileged and Confidential
Final Report Agreement No. CE 27/2007 (EP) Upgrade of a Regional
Air Quality Modelling System (PATH) –––– Feasibility Study
F I N AL
HK1100066 86
10. Conclusions
A new meteorological, emissions and air quality modelling system has been developed and setup for the Hong Kong (HK) and Pearl River Delta (PRD) region as an update to the PATH modeling system that the HK Environmental Protection Deaprtment (EPD) has been using for over a decade. The new modelling system was demonstrated using four historical modelling episodes from 2003-2006. The modelling system was delivered to HK EPD and EPD was trained on its use. EPD has applied the modelling system to make meteorological and air quality forecasts for the HK/PRD region and the 2010 calendar year.
During the course of the development of the new air quality modelling system, the study team has strived to continuously update the modelling system so that it is based on the most current modelling components. To this end, the final optimization and demonstration runs used the latest versions of the Community Multiscale Air Quality (CMAQ Version 4.7.1 released June 2010) and Comprehensive Air Quality Model with extensions (CAMx Version 5.3 released December 2010) Chemical Transport Models (CTMs).
The application of the CTMs for the historical episodes from 2003-2006 and for the entire Calebdar year 2010 in a forecast demonstration run shows that the new modelling system is fully operational. The model performance of the modelling system is encouraging with the 2010 modeling prodcing very good ozone and reasonable particulkate matter performance given the uncertainities in the emissions. The upgraded PATH modelling system will be a useful tool for air quality management planning in the HK/PRD region. The modelling system is now fully operational, evaluated and ready for routine application.
Privileged and Confidential
Final Report Agreement No. CE 27/2007 (EP) Upgrade of a Regional
Air Quality Modelling System (PATH) –––– Feasibility Study
F I N AL
HK1100066 87
11. References
Anthes, R.A. 1977. “A Cumulus Parameterization Scheme Utilizing a One-Dimensional Cloud
Model”, Mon. Wea. Rev., Vol. 105, pp. 270-286.
Anthes, R.A. and T.T. Warner. 1978. “The Development of Mesoscale Models Suitable for Air
Pollution and Other Mesometeorological Studies”, Mon. Wea. Rev., Vol. 106, pp, 1045-1078.
Binkowski, F.S. and S.J. Roselle. 2003. Models-3 Community Multiscale Air Quality (CMAQ)
Model Aerosol Component -- 1. Model Description. Journal of Geophysical Research, Vol.
108(D6), 4163, DOI:10.1029/2001JD001409. March.
Byun, D.W., and J.K.S. Ching. 1999. “Science Algorithms of the EPA Models-3 Community
Multiscale Air Quality (CMAQ) Modelling System”, EPA/600/R-99/030.
Carmichael, G. R., T. Sakurai, D. Streets, Y. Hozumi, H. Ueda, S.U. Park, C. Fung, Z. Han, M.
Kajino, M. Engardt, C. Bennet, H. Hayami, K. Sartelet, T. Holloway, Z. Wang, A. Kannari, J.
S. Fu, K. Matsuda, N. Thongboonchoo, M. Amann (2007). MICS-Asia II: The Model
Intercomparison Study for Asia Phase II -- Methodology and Overview of Findings.
Atmospheric Environment. doi:10.1016/j.atmosenv.2007.04.007
Chang, J.S., S. Jin, Y. Li, M. Beauharnois, C.-H. Lu, H.-C. Huang, S. Tanrikulu and J. DaMassa.
1997. The SARMAP Air Quality Model Final Report. California Air Resources Board,
Sacramento, CA, USA. April 3.
(http://gate1.baaqmd.gov/pdf/0113_SARMAP_Air_Quality_Model_Final_Report_1997.pdf)
Chin, M., et al. (2007), Intercontinental transport of pollution and dust aerosols: implications for
regional air quality, Atmos. Chem. Phys., 7, 5501-5517.
China Electricity Statistical Yearbook 2005 (2006), p42 (In Chinese)
Coella, P., and P. L., Woodward. 1984. “The Piecewise Parabolic Method (PPM) for Gas-
Dynamical Simulations”, J. Comp. Physics, Vol. 54, pp. 174-201.
Cope, M.E., M. Burgers and M. Olliff. 2000. Application of the SARMAP Air Quality Model
(SAQM) to the Modelling of Air Pollution in Hong Kong for the PATH Study. 11th Joint Conf.
on the Applications of Air Pollution Meteorology with the A&WMA. Long Beach, CA, USA.
Dudhia, J. 1993. "A Non-hydrostatic Version of the Penn State/NCAR Mesoscale Model:
Validation Tests and Simulation of an Atlantic Cyclone and Cold Front", Mon. Wea. Rev., Vol.
121. pp. 1493-1513.
Emery C., E. Tai and G. Yarwood, 2001: Enhanced Meteorological Modelling and Performance
Evaluation for Two Texas Ozone Episodes, Final report submitted to Texas Natural
Resources Conservation Commission, prepared by ENVIRON International Corporation,
Novato, CA.
ENVIRON. 2008a. Emissions Modelling Software Implementation Work Plan. ENVIRON Hong
Kong Ltd. Project No. HK1100066. Report Reference R0058V2. June.
ENVIRON. 2008b. Transport Data Compilation and Modelling Implementation Work Plan.
ENVIRON Hong Kong Ltd. Prepared for Hong Kong Department of Environmental
Protection. Project Number HK1100066. Report Reference R0058V2. June.
Privileged and Confidential
Final Report Agreement No. CE 27/2007 (EP) Upgrade of a Regional
Air Quality Modelling System (PATH) –––– Feasibility Study
F I N AL
HK1100066 88
ENVIRON. 2008c. Chemical Transport Model Implementation Work Plan. ENVIRON Hong Kong
Ltd. Prepared for Hong Kong Environmental Protection Department. Project No.
HK1100066. Report Reference R0058V2.0. June.
ENVIRON. 2008d. “User’s Guide Comprehensive Air Quality Model With Extensions (CAMx)
Version 4.51.” ENVIRON International Corporation, Novato, CA. www.camx.com. April.
ENVIRON. 2008e. Working Paper No. 1 – Results of Technology Review, Systems Analysis and
Design. ENVIRON Hong Kong Ltd. Prepared for the Hong Kong Environmental Protection
Deaprtment. R0224V1.0. November.
ENVIRON. 2009a. Working Paper on the Results of Meteorological Modelling Software
Implementation. ENVIRON Hong Kong Ltd. Prepared for the Hong Kong Environmental
Protection Department. R0379V1.0. March.
ENVIRON. 2010a. Working Paper 2 – Emissions Modelling Software Implementation. ENVIRON
Hong Kong Ltd. Prepared for Hong Kong Environmental Protection Department. Project No.
HK1100066. Report Reference R0624_V1.0. January 6.
ENVIRON. 2010b. Working Paper 3 – Transportation Data Compilation and Modelling
Implementation. ENVIRON Hong Kong Ltd. Prepared for the Hong Kong Environmental
Protection Department. Project No. HK1100066. Report Reference R0996_V2.0. April.
ENVIRON. 2010c. Working Paper 4 – Chemical Transport Modelling Software Implementation.
ENVIRON Hong Kong Ltd. Prepared for the Hong Kong Environmental Protection
Department. Project No. HK1100066. Report Reference R1154_V2.1. September.
ENVIRON. 2010d. Working Paper 6 – Data Analysis and Visualisation Software Implementation.
ENVIRON Hong Kong Ltd. Prepared for the Hong Kong Environmental Protection
Department. Project No. HK1100066. Report Reference R1218_V1.1. October.
ENVIRON. 2010e. Working Paper on the System Integration, Installation and Testing. ENVIRON
Hong Kong Ltd. Prepared for the Hong Kong Environmental Protection Department. Project
No. HK1100066. Report Reference R1071_V1.2. October.
ENVIRON. 2010f. Working Paper 9 – Post Implementation Review. ENVIRON Hong Kong Ltd.
Prepared for the Hong Kong Environmental Protection Department. Project No. HK1100066.
Report Reference R1804_V1.0. December.
ENVIRON. 2011. Working Paper 8 – System Optimisation and Demonstration Model Run.
ENVIRON Hong Kong Ltd. Prepared for the Hong Kong Environmental Protection
Department. Project No. HK1100066. Report Reference R1809_V2.0. March 15.
EPA. 2007a. Guidance on the Use of Models and Other Analyses for Demonstrating Attainment
of Air Quality Goals for Ozone, PM2.5 and Regional Haze. U.S. Environmental Protection
Agency, Research Triangle Park, NC. EPA-454/B-07-002. April.
EPA. 1991. "Guidance for Regulatory Application of the Urban Airshed Model (UAM), "Office of
Air Quality Planning and Standards, U.S. Environmental Protection Agency, Research
Triangle Park, NC.
Privileged and Confidential
Final Report Agreement No. CE 27/2007 (EP) Upgrade of a Regional
Air Quality Modelling System (PATH) –––– Feasibility Study
F I N AL
HK1100066 89
ESRI (Environmental Systems Research Institute) (1997), Digital Chart of the World (DCW) Data
Description. Available at: http://data.geocomm.com/readme/dcw/dcw.html(Still available on
27 July 2009)
Fu, J. S., C. C. Jang, D. G. Streets, Z. Li, R. Kwok, R. Park, Z. Han (2007). MICS-Asia II:
Evaluating Gaseous Pollutants (Ozone, VOC) in East Asia Using An Advanced Modelling
System: Models-3/CMAQ System. Atmospheric Environment.
Gery, M. W., G.Z. Whitten, J.P. Killus, and M.C. Dodge. 1989. A photochemical mechanism for
urban and regional-scale computer modelling. J. Geophys. Res. 94, 12925-12956.
Grell, G. A., J. Dudhia, and D. R. Stauffer. 1994. "A Description of the Fifth Generation Penn
State/NCAR Mesoscale Model (MM5). NCAR Tech. Note, NCAR TN-398-STR, 138 pp.
Grell G.A., J. Dudhia and D.R. Stauffer, 1994: "A Description of the Fifth Generation Penn
State/NCAR Mesoscale Model (MM5). NCAR Tech. Note, NCAR TN-398-STR, 138 pp.
Guenther, A. and C. Wiedinmyer. 2004. User’s Guide to the Model of Emissions of Gases and
Aerosols from Nature (MEGAN). National Center for Atmospheric Research (NCAR),
Boulder, Colorado (http://acd.ucar.edu/~christin/megan1.0_userguide.pdf).
Heald, C. L., et al. (2003), Asian outflow and trans-Pacific transport of carbon monoxide and ozone
pollution: An integrated satellite, aircraft, and model perspective, J. Geophys. Res.,
108(D24), doi:10.1029/2003JD003507.
HKUST. 2008. Work Plan 3 – Meteorological Models Implementation Work Plan. Hong Kong
University of Science and Technology. Project No. HK1100066. Report Reference
R1022V1.0. July 2008.
Jimenez, M., U. Nopmongcol, and G. Yarwood, 2007, Speciation Tool User’s Guide Version 2.0.
ENVIRON International Corporation. September 2007.
Loveland, T.R., B.C. Reed, J.F. Brown, D.O. Ohlen, J. Zhu, L. Yang and J.W. Merchant (2000),
Development of a Global Land Cover Characteristics Database and IGBP DISCover from 1-
km AVHRR Data, International Journal of Remote Sensing, 21, 6/7, 1303-1330.
Morris R.E., D.E. McNally, T.W. Tesche, G.S. Tonnesen, J.W. Boylan and P. Brewer. 2005.
Preliminary Evaluation of the Community Multiscale Air Quality Model for 2002 over the
Southeastern United States. J. Air and Waste Manage. Assoc. 55:1694-1708. November.
Morris, R.E., B. Koo, A. Guenther, G. Yarwood, D. McNally, T.W. Tesche, G. Tonnesen, J. Boylan
and P. Brewer. 2006a. Model Sensitivity Evaluation for Organic Carbon using Two Multi-
Pollutant Air Quality Models that Simulate Regional Haze in the Southeastern United States.
Atmos. Env. 40 (2006) 4960-4972.
Park. R.J., Jacob, D.J., Field, B.D., Yantosca, R.M., and Chin, M. 2004. Natural and
transboundary pollution influences on sulfate-nitrate-ammonium aerosols in the United
States: Implications for policy. Journal of Geophysical Research, Vol. 109, D15204,
doi:10.1029/2003JD004473.
Park. R.J., Jacob, D.J., Kumar, N., and Yantosca, R.M. 2006. Regional visibility statistics in the
United States: Natural and transboundary pollution influences, and implications for the
Regional Haze Rule. Atmospheric Environment, Vol. 40, pp. 5405-5423.
Privileged and Confidential
Final Report Agreement No. CE 27/2007 (EP) Upgrade of a Regional
Air Quality Modelling System (PATH) –––– Feasibility Study
F I N AL
HK1100066 90
Skamarock W.C., J.B. Klemp, J. Dudhia, D.O. Gill, D.M. Barker, W. Wang, and J.G. Powers, 2008:
A description of the Advanced Research WRF Version 3. NCAR Tech Notes-475+STR.
Streets, et al. (2003). An inventory of gaseous and primary aerosol emissions in Asia in the year
2000, Journal of Geophysical Research 108(D21), 8809, doi:10.1029/2002JD003093
Streets, D. G., J. S. Fu, C. Jang, J. Hao, K. He, X. Tang, Y. Zhang, Z. Li, Q. Zhang, L. Wang, B.
Wang, and C. Yu (2007) Air quality during the 2008 Beijing Olympic games. Atmospheric
Environment: doi:10.1016/j.atmosenv.2006.08.046.
Tesche T.W., D.E. McNally, C.A. Emery, E. Tai, 2001: “Evaluation of the MM5 model over the
Midwestern U.S. for three 8-hr oxidant episodes.” Prepared for the Kansas City Ozone
Technical Workgroup, through the Kansas Department of Health and Environment, Topeka
KS, and the Missouri Department of Natural Resources, Jefferson City, MO. Prepared by
Alpine Geophysics, LLC, Ft. Wright, KY, and ENVIRON International Corporation, Novato,
CA.
Zhang, L., J. R. Brook, and R. Vet, 2003. A revised parameterization for gaseous dry deposition
in air-quality models. Atmos. Chem. Phys., 3, 2067–2082.
Zhang, L., Vet, R., Brook, J.R., Legge, A.H. 2006. Factors affecting stomatal uptake of ozone by
different canopies and a comparison between dose and exposure. Science of the Total
Environment, 370 (1), pp. 117-132.
Zhang L., D.J. Jacob, K.F. Boersma, D.A. Jaffe, J.R. Olson, K.W. Bowman, J.R. Worden, A.M.
Thompson, M.A. Avery, R.C. Cohen, J.E. Dibb, F.M. Flock, H.E. Fuelberg, L.G. Huey, W.W.
McMillan, H.B. Singh and A.J. Weinheimer. 2008. Transpacific Transport of Ozone Pollution
and the Effect of Recent Asian Emissions Increases on Air Quality in North America: An
Integrated Analysis using Satellite, Aircraft, Ozonesonde, and Surface Observations. Atmos.
Chem. Phys., 8, 6117-6136.
Zhang, Q., D. G. Streets, G. R. Carmichael, K. He, H. Huo, A. Kannari, Z. Klimont, I. Park, S.
Reddy, J. S. Fu, D. Chen, L. Duan, Y. Lei, L. Wang, and Z. Yao (2009) Asian emissions in
2006 for the NASA INTEX-B mission, Atmos. Chem. Phys., 9, 5131-5153.