aging in texas: introductiondemographics.texas.gov/.../publications/2016/2016_06_07_aging.pdf2...
TRANSCRIPT

The Texas Demographic Center is responsible for interpreting and communicating information on demographic and socioeconomic issues for the State of Texas to the public and the legislature.
Included in this Brief:
The older population in Texas
grew at a faster rate than in the
nation from 2000 to 2014.
Among all states, Texas has the
third largest elderly population.
While Texas has a large elderly
population and continues to age,
it is still among the youngest
states in the country.
June 2016
Aging in Texas: Introduction
When it comes to demographic shifts, Texas often leads the pack. Texas has led the nation in annual population growth since 2006. Texas is also among states leading in racial/ethnic diversification. However, with population aging trends, Texas seems to be on a unique path. While Texas added the second largest number of elderly to its population between 2000 and 2014, that elderly population is a small share of the Texas total population, when compared to other states. In general, population aging in Texas falls parallel to U.S. aging trends. However, while Texas is growing older, it is relatively younger than most states in the country. In this brief, we explore these seemingly contradictive trends by comparing indicators of aging across states and in the U.S.
Background
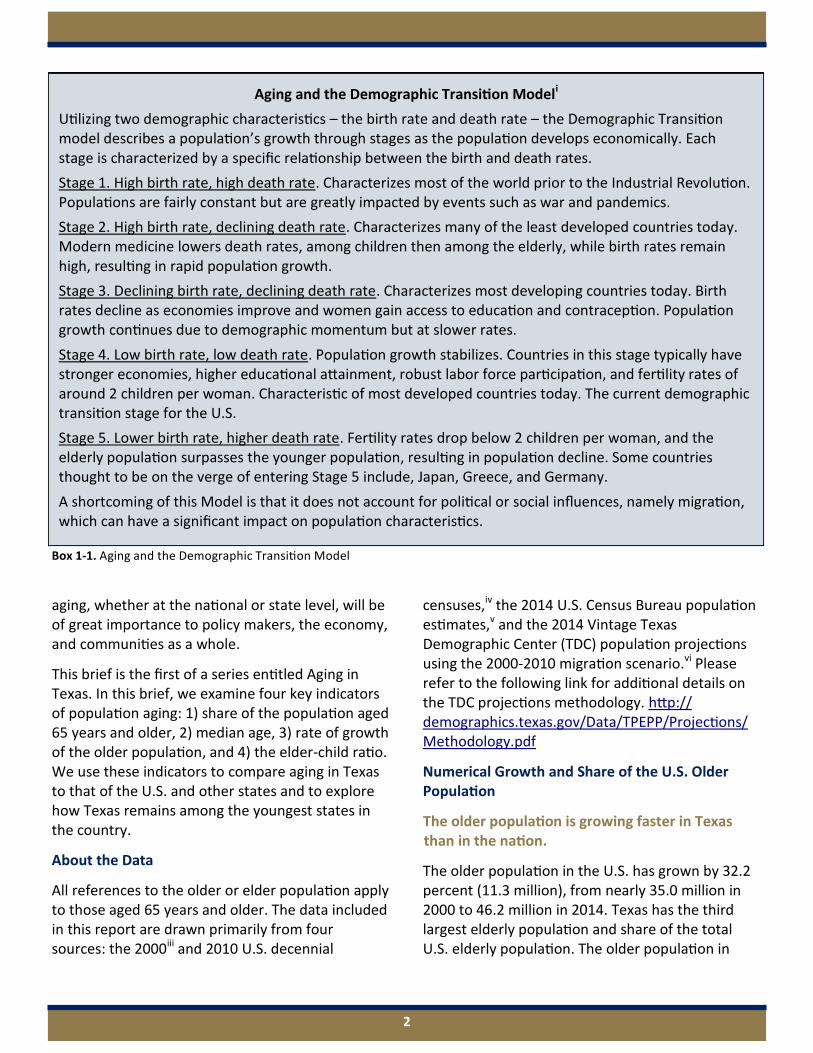
Aging population is driven by a combination of decreasing birth rates and increasing life expectancies; these influences apply globally, nationally, and in Texas. Decreasing the number of children in a population impacts aging by driving up the median age of a population. Similarly, increasing life expectancies drive median ages further up as populations live to older and older ages. This phenomena is well documented in the theory of the demographic transition model. See Box 1-1 for additional information on the demographic transition model.
Demographers began to see indicators of aging in the U.S. population more than 30 years ago. These population aging trends are expected to reach their peak over the next two decades, with the entry of the Baby Boom generation (those born between 1946 and 1964) into the elder years. In 2011, the oldest Baby Boomers turned 65, and by 2030 the entire cohort will be 65 years and older, resulting in an elder population of 74.1 million. At that point, over one in five people in the U.S. will be over 64 years of age.ii
In general, Texas has been experiencing a similar demographic shift. However, in true Texas character, our population aging is somewhat unique. In Texas, the aging of the Baby Boom generation is projected to yield an elder population of 5.9 million, or 19.4 percent of the state’s total population in 2030. At this point, just under one in five people in Texas will be over 64 years of age. Even while adding record numbers of elder population, Texas remains one of the youngest states in the country. Regardless, the social and economic implications of population
2
aging, whether at the national or state level, will be of great importance to policy makers, the economy, and communities as a whole.
This brief is the first of a series entitled Aging in Texas. In this brief, we examine four key indicators of population aging: 1) share of the population aged 65 years and older, 2) median age, 3) rate of growth of the older population, and 4) the elder-child ratio. We use these indicators to compare aging in Texas to that of the U.S. and other states and to explore how Texas remains among the youngest states in the country.
About the Data
All references to the older or elder population apply to those aged 65 years and older. The data included in this report are drawn primarily from four sources: the 2000iii and 2010 U.S. decennial
censuses,iv the 2014 U.S. Census Bureau population estimates,v and the 2014 Vintage Texas Demographic Center (TDC) population projections using the 2000-2010 migration scenario.vi Please refer to the following link for additional details on the TDC projections methodology. http://demographics.texas.gov/Data/TPEPP/Projections/Methodology.pdf
Numerical Growth and Share of the U.S. Older Population
The older population is growing faster in Texas than in the nation.
The older population in the U.S. has grown by 32.2 percent (11.3 million), from nearly 35.0 million in 2000 to 46.2 million in 2014. Texas has the third largest elderly population and share of the total U.S. elderly population. The older population in
Aging and the Demographic Transition Modeli
Utilizing two demographic characteristics – the birth rate and death rate – the Demographic Transition model describes a population’s growth through stages as the population develops economically. Each stage is characterized by a specific relationship between the birth and death rates.
Stage 1. High birth rate, high death rate. Characterizes most of the world prior to the Industrial Revolution. Populations are fairly constant but are greatly impacted by events such as war and pandemics.
Stage 2. High birth rate, declining death rate. Characterizes many of the least developed countries today. Modern medicine lowers death rates, among children then among the elderly, while birth rates remain high, resulting in rapid population growth.
Stage 3. Declining birth rate, declining death rate. Characterizes most developing countries today. Birth rates decline as economies improve and women gain access to education and contraception. Population growth continues due to demographic momentum but at slower rates.
Stage 4. Low birth rate, low death rate. Population growth stabilizes. Countries in this stage typically have stronger economies, higher educational attainment, robust labor force participation, and fertility rates of around 2 children per woman. Characteristic of most developed countries today. The current demographic transition stage for the U.S.
Stage 5. Lower birth rate, higher death rate. Fertility rates drop below 2 children per woman, and the elderly population surpasses the younger population, resulting in population decline. Some countries thought to be on the verge of entering Stage 5 include, Japan, Greece, and Germany.
A shortcoming of this Model is that it does not account for political or social influences, namely migration, which can have a significant impact on population characteristics.
Box 1-1. Aging and the Demographic Transition Model
3
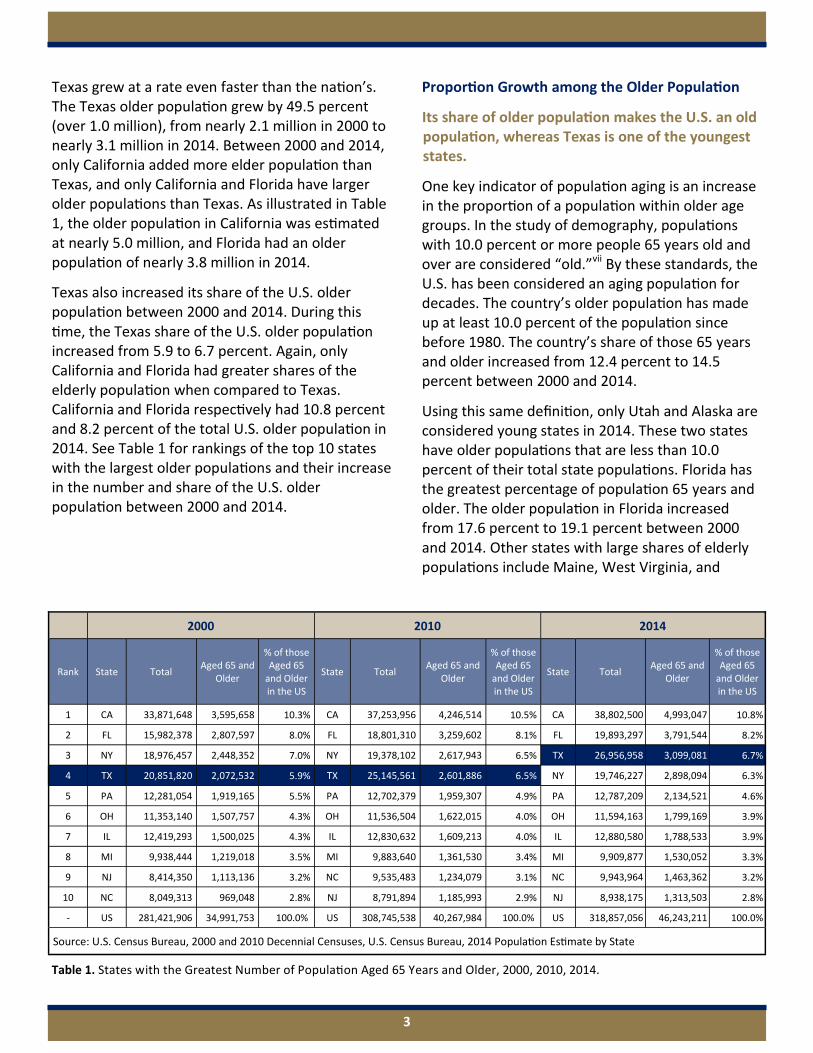
Texas grew at a rate even faster than the nation’s. The Texas older population grew by 49.5 percent (over 1.0 million), from nearly 2.1 million in 2000 to nearly 3.1 million in 2014. Between 2000 and 2014, only California added more elder population than Texas, and only California and Florida have larger older populations than Texas. As illustrated in Table 1, the older population in California was estimated at nearly 5.0 million, and Florida had an older population of nearly 3.8 million in 2014.
Texas also increased its share of the U.S. older population between 2000 and 2014. During this time, the Texas share of the U.S. older population increased from 5.9 to 6.7 percent. Again, only California and Florida had greater shares of the elderly population when compared to Texas. California and Florida respectively had 10.8 percent and 8.2 percent of the total U.S. older population in 2014. See Table 1 for rankings of the top 10 states with the largest older populations and their increase in the number and share of the U.S. older population between 2000 and 2014.
Proportion Growth among the Older Population
Its share of older population makes the U.S. an old population, whereas Texas is one of the youngest states.
One key indicator of population aging is an increase in the proportion of a population within older age groups. In the study of demography, populations with 10.0 percent or more people 65 years old and over are considered “old.”vii By these standards, the U.S. has been considered an aging population for decades. The country’s older population has made up at least 10.0 percent of the population since before 1980. The country’s share of those 65 years and older increased from 12.4 percent to 14.5 percent between 2000 and 2014.
Using this same definition, only Utah and Alaska are considered young states in 2014. These two states have older populations that are less than 10.0 percent of their total state populations. Florida has the greatest percentage of population 65 years and older. The older population in Florida increased from 17.6 percent to 19.1 percent between 2000 and 2014. Other states with large shares of elderly populations include Maine, West Virginia, and
Table 1. States with the Greatest Number of Population Aged 65 Years and Older, 2000, 2010, 2014.
2000 2010 2014
Rank State Total Aged 65 and
Older
% of those Aged 65
and Older in the US
State Total Aged 65 and
Older
% of those Aged 65
and Older in the US
State Total Aged 65 and
Older
% of those Aged 65
and Older in the US
1 CA 33,871,648 3,595,658 10.3% CA 37,253,956 4,246,514 10.5% CA 38,802,500 4,993,047 10.8%
2 FL 15,982,378 2,807,597 8.0% FL 18,801,310 3,259,602 8.1% FL 19,893,297 3,791,544 8.2%
3 NY 18,976,457 2,448,352 7.0% NY 19,378,102 2,617,943 6.5% TX 26,956,958 3,099,081 6.7%
4 TX 20,851,820 2,072,532 5.9% TX 25,145,561 2,601,886 6.5% NY 19,746,227 2,898,094 6.3%
5 PA 12,281,054 1,919,165 5.5% PA 12,702,379 1,959,307 4.9% PA 12,787,209 2,134,521 4.6%
6 OH 11,353,140 1,507,757 4.3% OH 11,536,504 1,622,015 4.0% OH 11,594,163 1,799,169 3.9%
7 IL 12,419,293 1,500,025 4.3% IL 12,830,632 1,609,213 4.0% IL 12,880,580 1,788,533 3.9%
8 MI 9,938,444 1,219,018 3.5% MI 9,883,640 1,361,530 3.4% MI 9,909,877 1,530,052 3.3%
9 NJ 8,414,350 1,113,136 3.2% NC 9,535,483 1,234,079 3.1% NC 9,943,964 1,463,362 3.2%
10 NC 8,049,313 969,048 2.8% NJ 8,791,894 1,185,993 2.9% NJ 8,938,175 1,313,503 2.8%
- US 281,421,906 34,991,753 100.0% US 308,745,538 40,267,984 100.0% US 318,857,056 46,243,211 100.0%
Source: U.S. Census Bureau, 2000 and 2010 Decennial Censuses, U.S. Census Bureau, 2014 Population Estimate by State
4
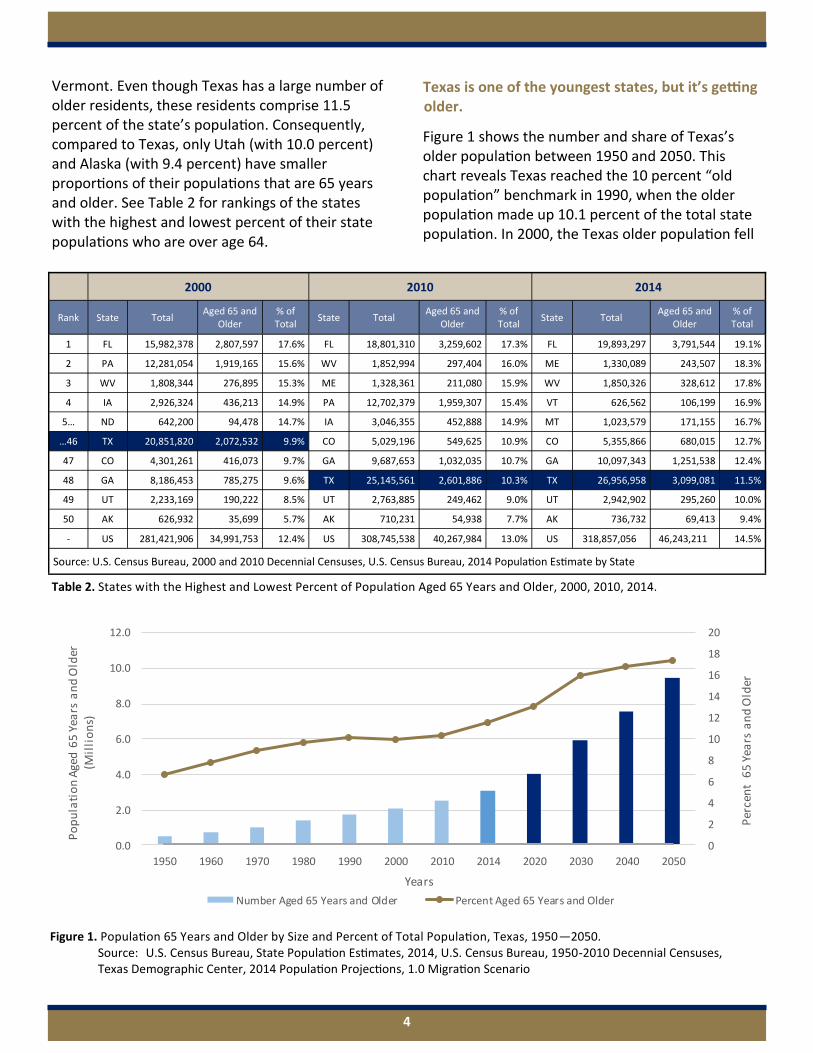
Vermont. Even though Texas has a large number of older residents, these residents comprise 11.5 percent of the state’s population. Consequently, compared to Texas, only Utah (with 10.0 percent) and Alaska (with 9.4 percent) have smaller proportions of their populations that are 65 years and older. See Table 2 for rankings of the states with the highest and lowest percent of their state populations who are over age 64.
Texas is one of the youngest states, but it’s getting older.
Figure 1 shows the number and share of Texas’s older population between 1950 and 2050. This chart reveals Texas reached the 10 percent “old population” benchmark in 1990, when the older population made up 10.1 percent of the total state population. In 2000, the Texas older population fell
2000 2010 2014
Rank State Total Aged 65 and
Older % of Total
State Total Aged 65 and
Older % of Total
State Total Aged 65 and
Older % of Total
1 FL 15,982,378 2,807,597 17.6% FL 18,801,310 3,259,602 17.3% FL 19,893,297 3,791,544 19.1%
2 PA 12,281,054 1,919,165 15.6% WV 1,852,994 297,404 16.0% ME 1,330,089 243,507 18.3%
3 WV 1,808,344 276,895 15.3% ME 1,328,361 211,080 15.9% WV 1,850,326 328,612 17.8%
4 IA 2,926,324 436,213 14.9% PA 12,702,379 1,959,307 15.4% VT 626,562 106,199 16.9%
5… ND 642,200 94,478 14.7% IA 3,046,355 452,888 14.9% MT 1,023,579 171,155 16.7%
…46 TX 20,851,820 2,072,532 9.9% CO 5,029,196 549,625 10.9% CO 5,355,866 680,015 12.7%
47 CO 4,301,261 416,073 9.7% GA 9,687,653 1,032,035 10.7% GA 10,097,343 1,251,538 12.4%
48 GA 8,186,453 785,275 9.6% TX 25,145,561 2,601,886 10.3% TX 26,956,958 3,099,081 11.5%
49 UT 2,233,169 190,222 8.5% UT 2,763,885 249,462 9.0% UT 2,942,902 295,260 10.0%
50 AK 626,932 35,699 5.7% AK 710,231 54,938 7.7% AK 736,732 69,413 9.4%
- US 281,421,906 34,991,753 12.4% US 308,745,538 40,267,984 13.0% US 318,857,056 46,243,211 14.5%
Source: U.S. Census Bureau, 2000 and 2010 Decennial Censuses, U.S. Census Bureau, 2014 Population Estimate by State
Table 2. States with the Highest and Lowest Percent of Population Aged 65 Years and Older, 2000, 2010, 2014.
Figure 1. Population 65 Years and Older by Size and Percent of Total Population, Texas, 1950—2050. Source: U.S. Census Bureau, State Population Estimates, 2014, U.S. Census Bureau, 1950-2010 Decennial Censuses, Texas Demographic Center, 2014 Population Projections, 1.0 Migration Scenario
0
2
4
6
8
10
12
14
16
18
20
0.0
2.0
4.0
6.0
8.0
10.0
12.0
1950 1960 1970 1980 1990 2000 2010 2014 2020 2030 2040 2050
Per
cen
t 6
5 Y
ears
an
d O
lder
Po
pu
lati
on
Age
d 6
5 Y
ears
an
d O
lder
(M
illi
on
s)
Years
Number Aged 65 Years and Older Percent Aged 65 Years and Older

5
slightly below 10.0 percent to 9.9 percent but has steadily increased since then. In 2000, Texans 65 years and older made up 10.3 percent of the state population. By 2014 Texas’s older population increased its share to 11.5 percent of the total state population. Despite this increase, Texas still ranks among the youngest states based on this measure.
The Texas Demographic Center (TDC) projections suggest the older population in Texas will continue to increase its share of the state population. These projections, employing the 1.0 migration scenario, indicate the older population’s share will rise to nearly 16.0 percent in 2030, when the entire Baby Boom generation will have aged to 65 years and over, and further increase to 17.4 percent at the end of the projections horizon in 2050.
Median Age
The U.S. is an old population by median age, but Texas is one of the youngest states.
Populations can also be described as “young” or “old” based on their median age. Median age is the age at which half of the population is older and half is younger. Demographers often classify a population as young if its median age is under 20 years, old if its median age is 30 and over, and
intermediate if it falls between 20 and 30 years. Increases in the median age determine whether or not a population is aging.
The U.S. was determined to be an old population by median age decades ago. The U.S. median age reached 30.2 years in 1950. The high fertility years of the Baby Boom brought the median age back below 30 during the 1960s, but it began rising during the 1970s, reaching 30.0 in 1980. In 2014, the median age in the U.S. was 37.6 years.
Between 2000 and 2014, most states saw an increase of at least 2.5 years in their median age. In terms of median age, Maine is the oldest state in the nation, and it is also aging. Maine experienced the greatest increase in their median age, rising from 38.6 in 2000 to 44.2 years in 2014.
According to median age, Texas once again ranks among the youngest states. In 2000, the median age in Texas was 32.2 years. Only Utah, at 27.1 years, had a lower median age than Texas. By 2014, the median age in Texas had risen to 34.2 years, and two states now have lower median ages than Texas – Alaska at 33.3 years and Utah at 30.5 years. In 2014, all U.S. states now have old populations. See Table 3 for state rankings by median age for 2000, 2010, and 2014.
2000 2010 2014
Rank State Median Age Rank State Median Age Rank State Median Age
1 West Virginia 38.9 1 Maine 42.7 1 Maine 44.2
2 Florida 38.7 2 Vermont 41.5 2 New Hampshire 42.6
3 Maine 38.6 3 West Virginia 41.3 3 Vermont 42.6
4 Pennsylvania 38.0 4 New Hampshire 41.1 4 West Virginia 42.0
5… Vermont 37.7 5 Florida 40.7 5 Florida 41.8
…46 California 33.3 46 California 35.2 46 Idaho 35.7
47 Idaho 33.2 47 Idaho 34.6 47 North Dakota 34.9
48 Alaska 32.4 48 Alaska 33.8 48 Texas 34.2
49 Texas 32.3 49 Texas 33.6 49 Alaska 33.3
50 Utah 27.1 50 Utah 29.2 50 Utah 30.5
- United States 35.3 - United States 37.2 - United States 37.7
Source: U.S. Census Bureau, 2000 and 2010 Decennial Censuses, U.S. Census Bureau, 2014 Population Estimate by State
Table 3. States with the Highest and Lowest Rankings of Median Age, 2000, 2010, 2014
6
Rate of Growth among the Older Population
Another indicator of the aging of a population is the rate of growth of the older population, especially when compared to the younger population. In Texas, the older population is outpacing the growth of the state overall as well as that of younger population segments. Additionally, the oldest of the old are also growing at a faster rate than the youngest of the older population.
Texas’s older population is growing faster than the state as a whole.
The state’s high growth rate is driving the increasing number and share of the older population in Texas. No state added more people than Texas between 2000 and 2014. Additionally, Texas had the fourth fastest growth rate in the nation during this same time. That said, the Texas older population grew at an even faster pace than the state population. Between 2000 and 2014, Texas added over 6.1 million people and grew at a
rate of 29.3 percent. Over 1.0 million of the people added were older Texans, producing a 49.5 percent growth rate for this group. This significant increase in such a short time is largely driven by the aging of the Baby Boom generation. In 2011, the oldest Baby Boomers turned 65; 103,776 seniors were added to the population in that year alone. Another 140,081 were added in 2012, 127,305 in 2013, and 126,033 in 2014. The growth seen in the last year equates to over 345 new seniors added to the older population each day between 2013 and 2014. The state is said to add about 1,000 people a day to the population. By this estimation, 1 in 3 individuals added each day is 65 years and older.
In the U.S. and in Texas, the older population is growing faster than the younger population.
Between 2000 and 2014, the older population grew faster than younger age groups. Since 2000, the older population in the U.S. increased by 11.3 million, or 32.2 percent, while those under 65 increased by 10.6 percent during this same period.
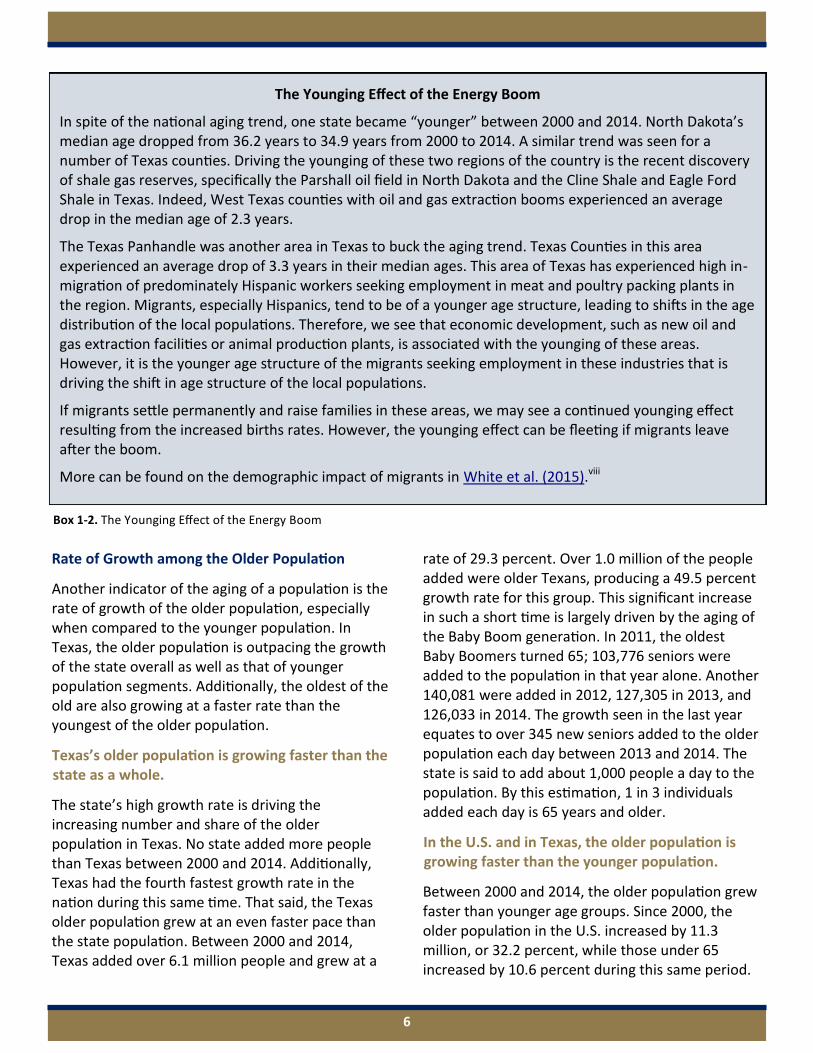
The Younging Effect of the Energy Boom
In spite of the national aging trend, one state became “younger” between 2000 and 2014. North Dakota’s median age dropped from 36.2 years to 34.9 years from 2000 to 2014. A similar trend was seen for a number of Texas counties. Driving the younging of these two regions of the country is the recent discovery of shale gas reserves, specifically the Parshall oil field in North Dakota and the Cline Shale and Eagle Ford Shale in Texas. Indeed, West Texas counties with oil and gas extraction booms experienced an average drop in the median age of 2.3 years.
The Texas Panhandle was another area in Texas to buck the aging trend. Texas Counties in this area experienced an average drop of 3.3 years in their median ages. This area of Texas has experienced high in-migration of predominately Hispanic workers seeking employment in meat and poultry packing plants in the region. Migrants, especially Hispanics, tend to be of a younger age structure, leading to shifts in the age distribution of the local populations. Therefore, we see that economic development, such as new oil and gas extraction facilities or animal production plants, is associated with the younging of these areas. However, it is the younger age structure of the migrants seeking employment in these industries that is driving the shift in age structure of the local populations.
If migrants settle permanently and raise families in these areas, we may see a continued younging effect resulting from the increased births rates. However, the younging effect can be fleeting if migrants leave after the boom.
More can be found on the demographic impact of migrants in White et al. (2015).viii
Box 1-2. The Younging Effect of the Energy Boom
7
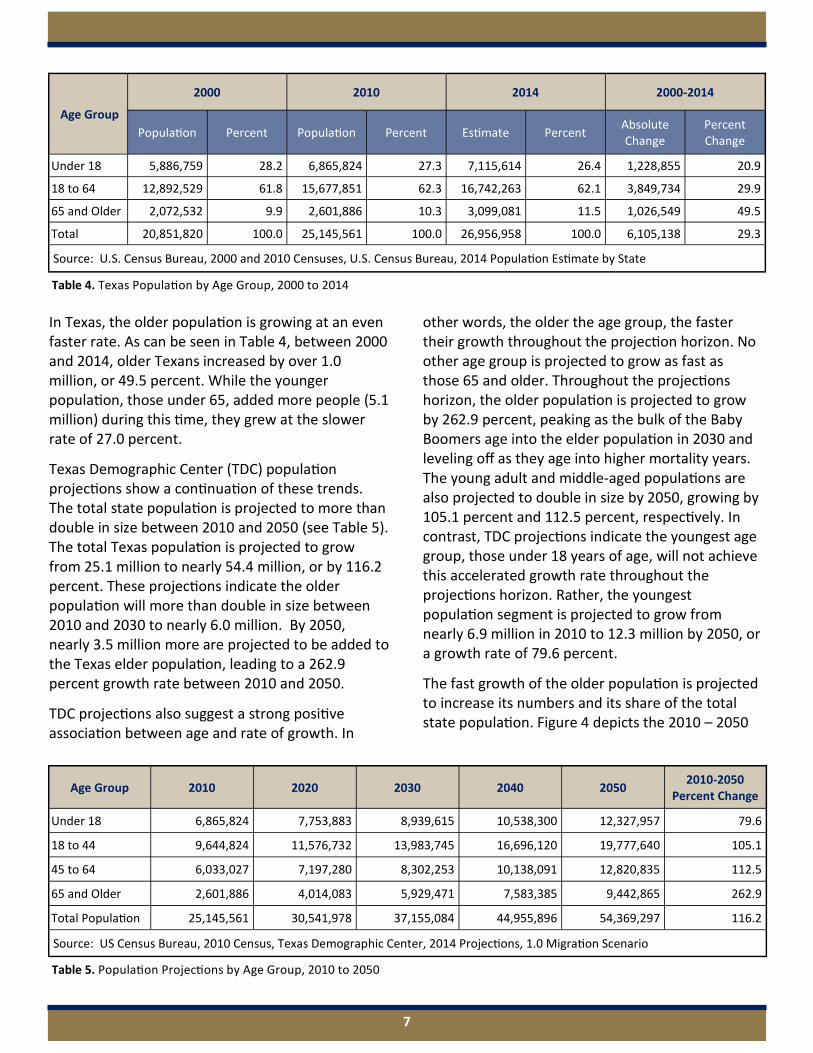
In Texas, the older population is growing at an even faster rate. As can be seen in Table 4, between 2000 and 2014, older Texans increased by over 1.0 million, or 49.5 percent. While the younger population, those under 65, added more people (5.1 million) during this time, they grew at the slower rate of 27.0 percent.
Texas Demographic Center (TDC) population projections show a continuation of these trends. The total state population is projected to more than double in size between 2010 and 2050 (see Table 5). The total Texas population is projected to grow from 25.1 million to nearly 54.4 million, or by 116.2 percent. These projections indicate the older population will more than double in size between 2010 and 2030 to nearly 6.0 million. By 2050, nearly 3.5 million more are projected to be added to the Texas elder population, leading to a 262.9 percent growth rate between 2010 and 2050.
TDC projections also suggest a strong positive association between age and rate of growth. In
other words, the older the age group, the faster their growth throughout the projection horizon. No other age group is projected to grow as fast as those 65 and older. Throughout the projections horizon, the older population is projected to grow by 262.9 percent, peaking as the bulk of the Baby Boomers age into the elder population in 2030 and leveling off as they age into higher mortality years. The young adult and middle-aged populations are also projected to double in size by 2050, growing by 105.1 percent and 112.5 percent, respectively. In contrast, TDC projections indicate the youngest age group, those under 18 years of age, will not achieve this accelerated growth rate throughout the projections horizon. Rather, the youngest population segment is projected to grow from nearly 6.9 million in 2010 to 12.3 million by 2050, or a growth rate of 79.6 percent.
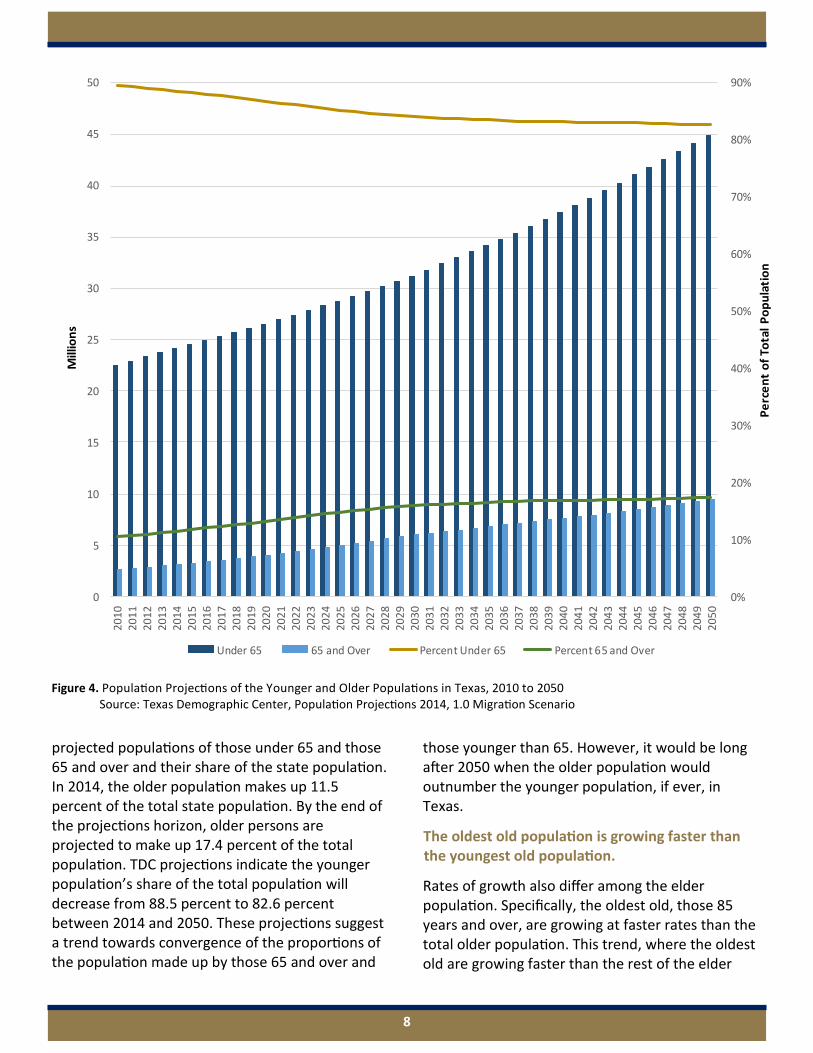
The fast growth of the older population is projected to increase its numbers and its share of the total state population. Figure 4 depicts the 2010 – 2050
Age Group
2000 2010 2014 2000-2014
Population Percent Population Percent Estimate Percent Absolute Change
Percent Change
Under 18 5,886,759 28.2 6,865,824 27.3 7,115,614 26.4 1,228,855 20.9
18 to 64 12,892,529 61.8 15,677,851 62.3 16,742,263 62.1 3,849,734 29.9
65 and Older 2,072,532 9.9 2,601,886 10.3 3,099,081 11.5 1,026,549 49.5
Total 20,851,820 100.0 25,145,561 100.0 26,956,958 100.0 6,105,138 29.3
Source: U.S. Census Bureau, 2000 and 2010 Censuses, U.S. Census Bureau, 2014 Population Estimate by State
Age Group 2010 2020 2030 2040 2050 2010-2050
Percent Change
Under 18 6,865,824 7,753,883 8,939,615 10,538,300 12,327,957 79.6
18 to 44 9,644,824 11,576,732 13,983,745 16,696,120 19,777,640 105.1
45 to 64 6,033,027 7,197,280 8,302,253 10,138,091 12,820,835 112.5
65 and Older 2,601,886 4,014,083 5,929,471 7,583,385 9,442,865 262.9
Total Population 25,145,561 30,541,978 37,155,084 44,955,896 54,369,297 116.2
Source: US Census Bureau, 2010 Census, Texas Demographic Center, 2014 Projections, 1.0 Migration Scenario
Table 4. Texas Population by Age Group, 2000 to 2014
Table 5. Population Projections by Age Group, 2010 to 2050
8
projected populations of those under 65 and those 65 and over and their share of the state population. In 2014, the older population makes up 11.5 percent of the total state population. By the end of the projections horizon, older persons are projected to make up 17.4 percent of the total population. TDC projections indicate the younger population’s share of the total population will decrease from 88.5 percent to 82.6 percent between 2014 and 2050. These projections suggest a trend towards convergence of the proportions of the population made up by those 65 and over and
those younger than 65. However, it would be long after 2050 when the older population would outnumber the younger population, if ever, in Texas.
The oldest old population is growing faster than the youngest old population.
Rates of growth also differ among the elder population. Specifically, the oldest old, those 85 years and over, are growing at faster rates than the total older population. This trend, where the oldest old are growing faster than the rest of the elder
Figure 4. Population Projections of the Younger and Older Populations in Texas, 2010 to 2050 Source: Texas Demographic Center, Population Projections 2014, 1.0 Migration Scenario
0%
10%
20%
30%
40%
50%
60%
70%
80%
90%
0
5
10
15
20
25
30
35
40
45
50
20
10
20
11
20
12
20
13
20
14
20
15
20
16
20
17
20
18
20
19
20
20
20
21
20
22
20
23
20
24
20
25
20
26
20
27
20
28
20
29
20
30
20
31
20
32
20
33
20
34
20
35
20
36
20
37
20
38
20
39
20
40
20
41
20
42
20
43
20
44
20
45
20
46
20
47
20
48
20
49
20
50
Pe
rce
nt
of
Tota
l P
op
ula
tio
n
Mill
ion
s
Under 65 65 and Over Percent Under 65 Percent 65 and Over
9
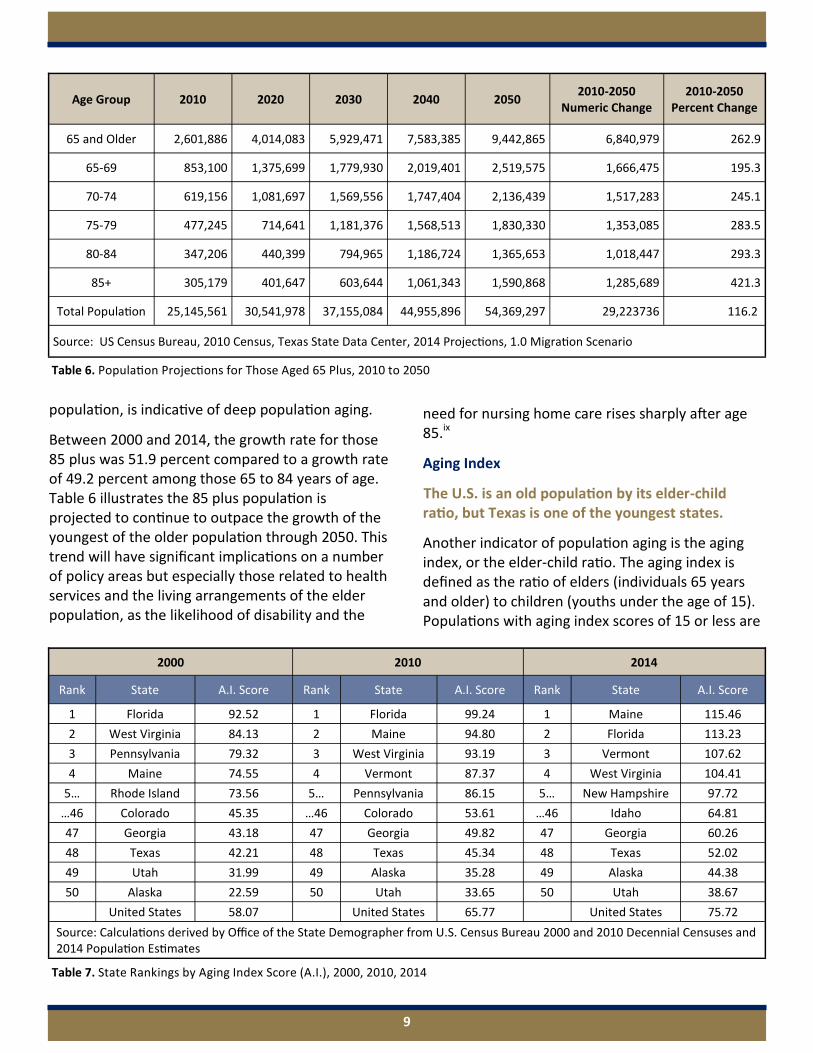
population, is indicative of deep population aging.
Between 2000 and 2014, the growth rate for those 85 plus was 51.9 percent compared to a growth rate of 49.2 percent among those 65 to 84 years of age. Table 6 illustrates the 85 plus population is projected to continue to outpace the growth of the youngest of the older population through 2050. This trend will have significant implications on a number of policy areas but especially those related to health services and the living arrangements of the elder population, as the likelihood of disability and the
need for nursing home care rises sharply after age 85.ix
Aging Index
The U.S. is an old population by its elder-child ratio, but Texas is one of the youngest states.
Another indicator of population aging is the aging index, or the elder-child ratio. The aging index is defined as the ratio of elders (individuals 65 years and older) to children (youths under the age of 15). Populations with aging index scores of 15 or less are
Age Group 2010 2020 2030 2040 2050 2010-2050
Numeric Change 2010-2050
Percent Change
65 and Older 2,601,886 4,014,083 5,929,471 7,583,385 9,442,865 6,840,979 262.9
65-69 853,100 1,375,699 1,779,930 2,019,401 2,519,575 1,666,475 195.3
70-74 619,156 1,081,697 1,569,556 1,747,404 2,136,439 1,517,283 245.1
75-79 477,245 714,641 1,181,376 1,568,513 1,830,330 1,353,085 283.5
80-84 347,206 440,399 794,965 1,186,724 1,365,653 1,018,447 293.3
85+ 305,179 401,647 603,644 1,061,343 1,590,868 1,285,689 421.3
Total Population 25,145,561 30,541,978 37,155,084 44,955,896 54,369,297 29,223736 116.2
Source: US Census Bureau, 2010 Census, Texas State Data Center, 2014 Projections, 1.0 Migration Scenario
Table 6. Population Projections for Those Aged 65 Plus, 2010 to 2050
2000 2010 2014
Rank State A.I. Score Rank State A.I. Score Rank State A.I. Score
1 Florida 92.52 1 Florida 99.24 1 Maine 115.46
2 West Virginia 84.13 2 Maine 94.80 2 Florida 113.23
3 Pennsylvania 79.32 3 West Virginia 93.19 3 Vermont 107.62
4 Maine 74.55 4 Vermont 87.37 4 West Virginia 104.41
5… Rhode Island 73.56 5… Pennsylvania 86.15 5… New Hampshire 97.72
…46 Colorado 45.35 …46 Colorado 53.61 …46 Idaho 64.81
47 Georgia 43.18 47 Georgia 49.82 47 Georgia 60.26
48 Texas 42.21 48 Texas 45.34 48 Texas 52.02
49 Utah 31.99 49 Alaska 35.28 49 Alaska 44.38
50 Alaska 22.59 50 Utah 33.65 50 Utah 38.67
United States 58.07 United States 65.77 United States 75.72
Source: Calculations derived by Office of the State Demographer from U.S. Census Bureau 2000 and 2010 Decennial Censuses and 2014 Population Estimates
Table 7. State Rankings by Aging Index Score (A.I.), 2000, 2010, 2014
10
described as young, whereas populations with aging index scores of 30 or greater are considered old. In 2000, all U.S. states, with the exception of Alaska, were considered old by this measure. By 2014, every state in the U.S. had an old aging index score. In some cases, states had more elders than children, yielding aging index scores exceeding 100. This was the case for Maine, Florida, Vermont, and West Virginia, the top four states with the highest aging index scores in 2014. As seen with other measures of aging, Texas once again ranks among the youngest states. As Table 7 illustrates, since 2000 Texas has been ranked the third youngest state, with aging index scores starting at 42.2 in 2000 and increasing to 52.0 in 2014. In essence, the aging index score for Texas indicates there are approximately two children for every older adult.
Conclusion and Discussion
This brief compared Texas with the U.S. and other states on four key indicators of population aging. In general, Texas is following the population aging trend seen throughout the U.S. and other states. However, despite clear indications of population aging, Texas remains one of the youngest states in the country based on a number of indicators of population aging. Although Texas added the second highest number of elder population between 2000 and 2014, Texas remains one of the youngest states as defined by median age, proportion of older population, and the aging index. The one indicator that clearly shows Texas is aging is the rate of growth of the older population in the state. Texas’s older population is growing at a faster rate than the U.S. older population, and it is growing even faster than the overall state population. Among the elder population, the oldest old are growing at the fastest rate, indicative of deep population aging.
One key factor that is contributing to Texas’s youth is its migrant population and booming economy. We saw a “younging” effect in a number of Texas counties with oil and gas extraction booms and animal processing plants. States with similar economic conditions also experienced this “younging” effect. Our migration series has also
highlighted the impact foreign born immigrants can have on our state’s age composition.
A number of trends indicate Texas is likely to continue to age while at the same time remaining one of the youngest states in the country. Research has shown trends toward increasing numbers of relatively young migrants and their families continuing to move to the state. The migration of large numbers of young people and their children from other states will work to keep our median age lower and increase the proportion of the population under 65 years of age.x The migration of young immigrant families is one tactic that many aging countries around the world are using to curb their population aging while at the same time boosting their economies. Research also indicates increasing birth rates among certain subsets of the population.xi Again, an increasing number of children in the population would work to decrease our elder-child ratio and further reduce our state’s median age. Another demographic trend occurring in Texas that could work to keep our state younger relative to other states is our increasing racial/ethnic diversity.xii The age distribution and fertility of racial/ethnic minorities would have a similar “younging” effect on our state population. One recent trend with otherwise negative implications could also work to keep our state relatively young. That trend is an increase in death rates among middle aged white males.xiii It will be important to evaluate the implication of this trend, especially in the less diverse and more rural areas of the state.
In subsequent reports in this series, we will explore the age-sex and race/ethnicity composition of the older population, its geographic distribution, and the policy areas most likely to be impacted by shifts in the Texas elder population.

11
i Demographic Transition Model, https://www.un.org/esa/population/publications/bulletin42_43/weinbergermirkin.pdf
ii Vincent, G.K. and Velkoff, V.A. 2010. The next four decades, the older population in the United States: 2010 to 2050. Current Population Reports, P25-1138, U.S. Census Bureau, Washington, DC.
iii U.S. Census Bureau, Population Division. 2000. Decennial Census data, U.S. Census Bureau, Washington, DC.
iv U.S. Census Bureau, Population Division. 2010. Decennial Census data, U.S. Census Bureau, Washington, DC.
v U.S. Census Bureau, Population Division. 2015. Annual estimates of the resident population for selected age groups by sex for the United States, States, Counties, and Puerto Rico Commonwealth and Municipios: April 1, 2010 to July 1, 2014, U.S. Census Bureau, Washington, DC.
vi Texas State Data Center. 2014. Projections of the population of Texas and counties in Texas by age, sex, and race/ethnicity for 2010-2050. http://demographics.texas.gov/Data/TPEPP/Projections/Methodology.pdf
vii Siegel, J.S. and Swanson, D.A. 2004. The methods and materials of demography. Second Edition. NY: Elsevier Academic Press.
viii White, S. et al. 2015. Introduction to migration in Texas. UTSA, Texas Demographic Center, San Antonio, TX. http://demographics.texas.gov/Resources/Publications/2015/2015-03-04_Intro_to_Mig.pdf
ix U.S. Census Bureau. 2014. 65+ in the United States: 2010, U.S. Government Printing Office, P23-212, Washington, DC.
x White, S. et al. 2016. Introduction to Texas domestic migration. UTSA, Texas Demographic Center, San Antonio, TX. http://demographics.texas.gov/Resources/Publications/2016/2016_04-13_DomesticMigration.pdf
xi Hamilton, B.E. et al. 2015. Births: Preliminary data for 2014. National vital statistics reports, vol. 64, no. 6. National Center for Health Statistics, Hyattsville, MD.
xii White, S. et al. 2015. The foreign-born population in Texas: Sources of growth. UTSA, Texas Demographic Center, San Antonio, TX. http://demographics.texas.gov/Resources/Publications/2015/2015_10_07_ForeignBorn.pdf
xiii Case, A. and Deaton, A. 2015. Rising morbidity and mortality in midlife among white non-Hispanic Americans in the 21st century. PNAS, 112(49), 15078-15083.
Austin Office P.O. Box 13455
Austin, TX 78711 Ph: 512-463-8390
Fax: 512-463-7632
San Antonio Office The University of Texas at San Antonio 501 West Cesar E. Chavez Blvd. San Antonio, TX 78207-4415 Ph: 210-458-6543 Fax: 210-458-6541
@TexasDemography http://demographics.texas.gov [email protected]
You can find more Texas Demographic Center products
on our website:
demographics.texas.gov
Including our
annual population estimates,
biennial population projections, and
reports on migration, aging, and other topics.