agilent masshunter workstation software...agilent masshunter workstation software - qualitative...
TRANSCRIPT
Agilent MassHunter Workstation Software
Qualitative Analysis
Familiarization Guide for GC/MS
Agilent MassHunter Workstation Software - Qualitative Analysis Familiarization Guide for GC/MS
Notices© Agilent Technologies, Inc. 2012
No part of this manual may be reproduced in any form or by any means (including elec-tronic storage and retrieval or translation into a foreign language) without prior agree-ment and written consent from Agilent Technologies, Inc. as governed by United States and international copyright laws.
Manual Part NumberG3335-90147
EditionRevision A, November 2012
Printed in USA
Agilent Technologies, Inc.5301 Stevens Creek Blvd. Santa Clara, CA 95051 USA
WarrantyThe material contained in this docu-ment is provided “as is,” and is sub-ject to being changed, without notice, in future editions. Further, to the max-imum extent permitted by applicable law, Agilent disclaims all warranties, either express or implied, with regard to this manual and any information contained herein, including but not limited to the implied warranties of merchantability and fitness for a par-ticular purpose. Agilent shall not be liable for errors or for incidental or consequential damages in connec-tion with the furnishing, use, or per-formance of this document or of any information contained herein. Should Agilent and the user have a separate written agreement with warranty terms covering the material in this document that conflict with these terms, the warranty terms in the sep-arate agreement shall control.
Technology Licenses The hardware and/or software described in this document are furnished under a license and may be used or copied only in accor-dance with the terms of such license.
Restricted Rights LegendU.S. Government Restricted Rights. Soft-ware and technical data rights granted to the federal government include only those rights customarily provided to end user cus-tomers. Agilent provides this customary commercial license in Software and techni-cal data pursuant to FAR 12.211 (Technical Data) and 12.212 (Computer Software) and, for the Department of Defense, DFARS 252.227-7015 (Technical Data - Commercial Items) and DFARS 227.7202-3 (Rights in Commercial Computer Software or Com-puter Software Documentation).
Safety Notices
CAUTION
A CAUTION notice denotes a haz-ard. It calls attention to an operat-ing procedure, practice, or the like that, if not correctly performed or adhered to, could result in damage to the product or loss of important data. Do not proceed beyond a CAUTION notice until the indicated conditions are fully understood and met.
WARNING
A WARNING notice denotes a hazard. It calls attention to an operating procedure, practice, or the like that, if not correctly per-formed or adhered to, could result in personal injury or death. Do not proceed beyond a WARNING notice until the indicated condi-tions are fully understood and met.
Microsoft ®, Windows 7®, and Excel® are U.S. registered trademark of Microsoft Cor-poration in the US and/or other countries.
Software RevisionThis guide is valid for B.06.00 and later revi-sions of the Agilent MassHunter Worksta-tion Software - Qualitative Analysis program, until superseded.
In This Guide…This guide contains information to learn to use your Agilent MassHunter Workstation Software - Qualitative Analysis with GC/MS data.
Before you begin the exercises, please read the instructions in “Before you begin these exercises..." on page 5.
Exercise 1 Learn basics of qualitative analysis
In this exercise, you explore some of the many powerful capabilities of the Qualitative Analysis program. These tasks are important no matter what data type you are using.
Exercise 2 Find and identify
In the first two sets of tasks, you find and identify low-concentration sulfa drugs within a complex matrix and generate their formulas for both TOF and Q-TOF data. You also do a molecular feature extraction on a protein digest with both TOF and Q-TOF data. These tasks can also be performed on Triple Quad data.
Exercise 3 Use workflows, export and print
In these tasks, you learn to set up and run any qualitative analysis method. You also learn to edit a method to automate the analysis and/or compound identification. Then you run the actions within the automated method when you open a data file. You also learn to create a method to perform automated actions with a worklist. Each of these tasks is done using a different workflow.
Reference
In this chapter, you learn some basics about the Qualitative Analysis program.
Agilent MassHunter Workstation Software - Qualitative Analysis Familiarization Guide for GC/MS 3
What’s New
in B.06.00
• You can review compounds in the Compound Details View. Four additional windows are available in the Compound Details View.
• For the Compound Details View, you can define different line definitions for different types of chromatograms and spectra.
• The Find Compounds by Integration algorithm is available.
• You can search multiple libraries for the unit mass library search algorithm.
• In the Generate Formulas algorithm, you can select whether to annotate fragment spectrum peaks with formulas. Fragment annotation selects spectra to annotate based on compound mining algorithm.
• The Generate Formulas algorithm can be executed on compounds that you found by the Find by Chromatogram Deconvolution algorithm.
• The Generate Formula algorithm has been modified to allow you to enter a maximum number of hits for each charge carrier.
• In the Generate Formulas algorithm, you can group hits with the same formula but different charge carriers.
• Compounds can be created from any user spectrum. The compound mining algorithm for these compounds is “Spectrum Extraction”.
• When you are saving results with a data file, you can select whether to save all compound results with a data file or a smaller set of results for each compound. All user chromatograms and user spectra are always saved.
• The format of the CEF file has been modified so that more information is included.
• The m/z and the ion species information is available in the first level of the Spectrum Identification Results table.
• The Spectrum Identification table has been modified. You can add a filter to a column, and you can delete a row.
• You can now label a peak with Formula & Ion Species.
• Changing the spectrum that is labeled Best in the Spectrum Identification Results window when you have a large number of entries is now significantly faster.
4 Agilent MassHunter Workstation Software - Qualitative Analysis Familiarization Guide for GC/MS
• You can specify to overlay compound chromatograms in the Compound Report.
• The default Formula Confirmation report template has been modified to include the Flags (Tgt) colored column and the Fragment Table with the colored Flags (FIs) column.
Before you begin these exercises...• Install the software. See the Installation Guide for instructions.
• Copy the folder named Data from your installation disk in uncompressed format to any location on your hard disk.
This folder contains all the data files needed for these exercises. You may need to first extract the data files from their .zip format.
NOTE Do not reuse the example data files already on your system unless you know that you copied them from the originals on the disk and you are the only one using them. If the example data files already on the system do not match the original ones on the disk exactly, then the results obtained during these exercises will not match those shown in the guide.
Agilent MassHunter Workstation Software - Qualitative Analysis Familiarization Guide for GC/MS 5

6 Agilent MassHunter Workstation Software - Qualitative Analysis Familiarization Guide for GC/MS
Content
Exercise 1 Learn basics of qualitative analysis 9
Task 1. Open the Qualitative Analysis program 10Task 2. Configure User Interface for GC/MS data 12Task 3. Zoom in and out of the chromatogram 15Task 4. Anchor a chromatogram 16Task 5. Change window layouts 17Task 6. Extract chromatograms 19Task 7. Interactively integrate a GC/MS chromatogram 21Task 8. Calculate System Suitability values 25Task 9. Extract spectra from a chromatogram 28Task 10. Add annotations 37Task 11. Add a mass caliper 41
Exercise 2 Find and identify 43
Task 12. Find compounds by chromatogram deconvolution 44Task 13. Identify compounds using the Search Library algorithm 48Task 14. Find compounds by MRM (MRM only) 51Task 15. Find compounds by Integration 54Task 16. Generate formulas and search library for peak spectra 57Task 17. Save results 62
Exercise 3 Use workflows, export and print 65
Task 18. Set up and run a qualitative analysis method using the general workflow 66
Task 19. Set up and run a method using the GC/Q-TOF Compound Screening workflow 71
Task 20. Export a CEF file 74Task 21. Print an analysis report 75Task 22. Print a compound report 78
Agilent MassHunter Workstation Software - Qualitative Analysis Familiarization Guide for LC/MS 7
Contents
Reference 81
Work with windows 82Work with result data in Data Navigator 84Perform operations on the chromatogram 85Perform operations on an MS or MS/MS spectrum 86Work with chromatographic visual data 87Work with spectral visual data 88Workflows 89Customize a report template 93
8 Agilent MassHunter Workstation Software - Qualitative Analysis Familiarization Guide for LC/MS
Agilent MassHunter Workstation Software Qualitative AnalysisFamiliarization Guide
1Learn basics of qualitative analysis
Task 1. Open the Qualitative Analysis program 10
Task 2. Configure User Interface for GC/MS data 12
Task 3. Zoom in and out of the chromatogram 15
Task 4. Anchor a chromatogram 16
Task 5. Change window layouts 17
Task 6. Extract chromatograms 19
Task 7. Interactively integrate a GC/MS chromatogram 21
Task 8. Calculate System Suitability values 25
Task 9. Extract spectra from a chromatogram 28
Task 10. Add annotations 37
Task 11. Add a mass caliper 41
In this exercise, you explore some of the many powerful capabilities of the Qualitative Analysis program for working with GC/Q-TOF and GC/QQQ data.
Each exercise is presented in a table with three columns:
• Steps – Use these general instructions to proceed on your own to explore the program.
• Detailed Instructions – Use these if you need help or prefer to use a step-by-step learning process.
• Comments – Read these to learn tips and additional information about each step in the exercise.
9
1 Learn basics of qualitative analysisTask 1. Open the Qualitative Analysis program
Task 1. Open the Qualitative Analysis program
In this task you open multiple data files using the current method.
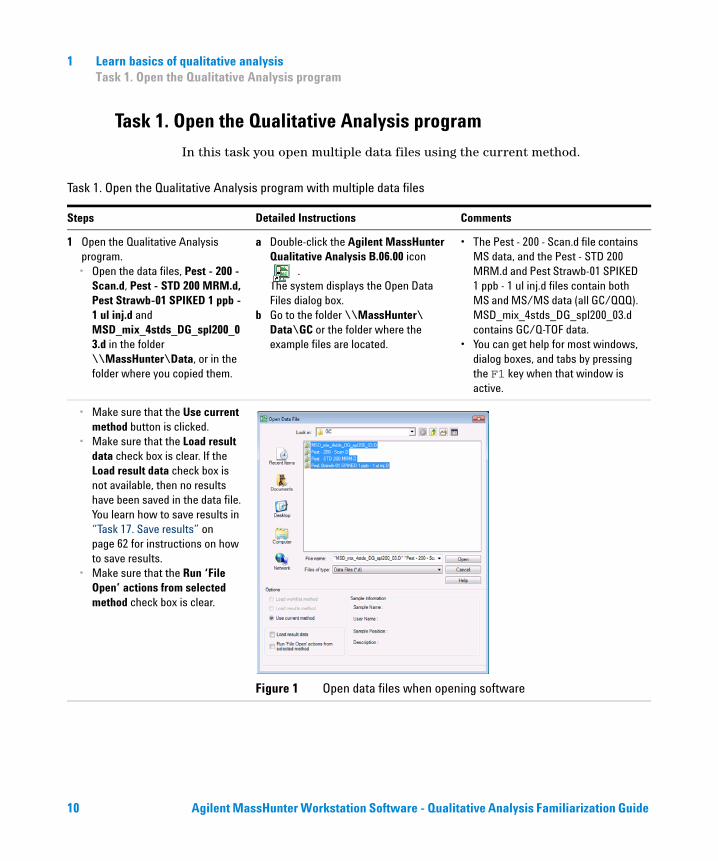
Task 1. Open the Qualitative Analysis program with multiple data files
Steps Detailed Instructions Comments
1 Open the Qualitative Analysis program. • Open the data files, Pest - 200 -
Scan.d, Pest - STD 200 MRM.d, Pest Strawb-01 SPIKED 1 ppb - 1 ul inj.d and MSD_mix_4stds_DG_spl200_03.d in the folder \\MassHunter\Data, or in the folder where you copied them.
a Double-click the Agilent MassHunter Qualitative Analysis B.06.00 icon
. The system displays the Open Data Files dialog box.
b Go to the folder \\MassHunter\Data\GC or the folder where the example files are located.
• The Pest - 200 - Scan.d file contains MS data, and the Pest - STD 200 MRM.d and Pest Strawb-01 SPIKED 1 ppb - 1 ul inj.d files contain both MS and MS/MS data (all GC/QQQ). MSD_mix_4stds_DG_spl200_03.d contains GC/Q-TOF data.
• You can get help for most windows, dialog boxes, and tabs by pressing the F1 key when that window is active.
• Make sure that the Use current method button is clicked.
• Make sure that the Load result data check box is clear. If the Load result data check box is not available, then no results have been saved in the data file. You learn how to save results in “Task 17. Save results” on page 62 for instructions on how to save results.
• Make sure that the Run ‘File Open’ actions from selected method check box is clear.
Figure 1 Open data files when opening software
10 Agilent MassHunter Workstation Software - Qualitative Analysis Familiarization Guide
Learn basics of qualitative analysis 1Task 1. Open the Qualitative Analysis program
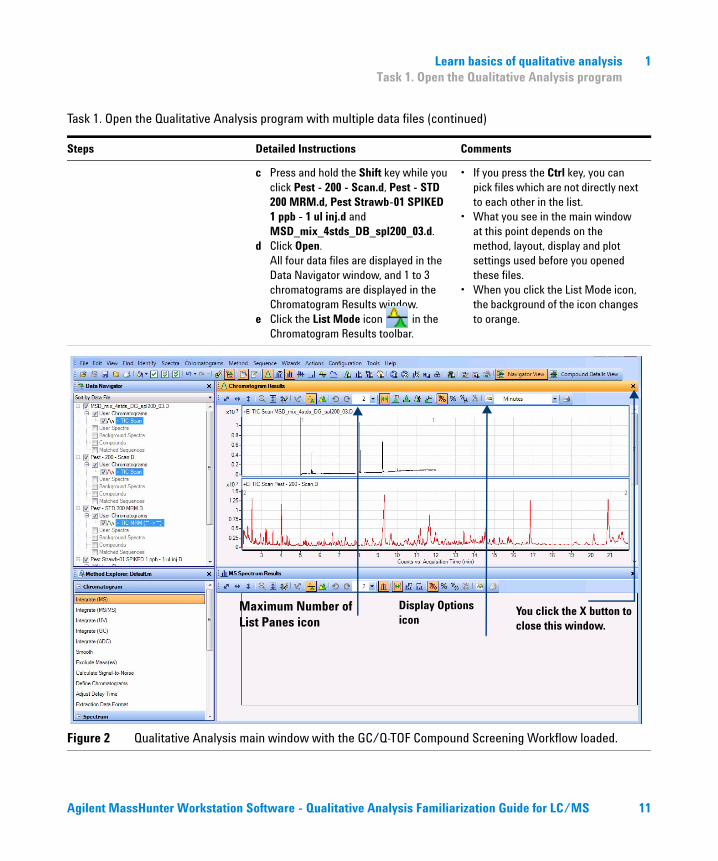
c Press and hold the Shift key while you click Pest - 200 - Scan.d, Pest - STD 200 MRM.d, Pest Strawb-01 SPIKED 1 ppb - 1 ul inj.d and MSD_mix_4stds_DB_spl200_03.d.
d Click Open.All four data files are displayed in the Data Navigator window, and 1 to 3 chromatograms are displayed in the Chromatogram Results window.
e Click the List Mode icon in the Chromatogram Results toolbar.
• If you press the Ctrl key, you can pick files which are not directly next to each other in the list.
• What you see in the main window at this point depends on the method, layout, display and plot settings used before you opened these files.
• When you click the List Mode icon, the background of the icon changes to orange.
Figure 2 Qualitative Analysis main window with the GC/Q-TOF Compound Screening Workflow loaded.
Task 1. Open the Qualitative Analysis program with multiple data files (continued)
Steps Detailed Instructions Comments
Maximum Number of List Panes icon
Display Options icon
You click the X button to close this window.
Agilent MassHunter Workstation Software - Qualitative Analysis Familiarization Guide for LC/MS 11
1 Learn basics of qualitative analysisTask 2. Configure User Interface for GC/MS data
Task 2. Configure User Interface for GC/MS data
In this task, you switch to either the General workflow (for GC/QQQ customers) or the GC/Q-TOF Compound Screening workflow (for GC/Q-TOF customers). These two workflows are the only workflows that support analyzing GC/MS data. Then, you open the User Interface Configuration dialog box and mark the appropriate check boxes for a GC/QQQ system or a GC/Q-TOF system.
Task 2. Configure User Interface for GC
Steps Detailed Instructions Comments
1 If necessary, open the Qualitative Analysis program.
a Double-click the Agilent MassHunter Qualitative Analysis icon . The system displays the Open Data Files dialog box.
b Click Cancel in the Open Data Files dialog box.
• You can get help for any window, dialog box, or tab by pressing the F1 key when that window is active.
2 Switch to either the General Workflow or the GC/Q-TOF Compound Screening Workflow.
a If you have a GC/QQQ instrument, click the Configuration > Configure for Workflow > General command. If you have a GC/Q-TOF instrument, click the Configuration > Configure for Workflow > GC/Q-TOF Compound Screening command.
b Click the Load workflow’s default method button and the Load workflow’s default layout button.
c Click OK.d Click the List Mode icon in the
Chromatogram Results toolbar.
• If the Data Acquisition program for GC/QQQ or GC/Q-TOF is installed on the same computer, the software configures the User Interface automatically. The GC/Q-TOF Compound Screening section may already be available in the Method Explorer window.
• By default, chromatograms are overlaid. For these examples, the chromatograms are shown in List Mode.
12 Agilent MassHunter Workstation Software - Qualitative Analysis Familiarization Guide
Learn basics of qualitative analysis 1Task 2. Configure User Interface for GC/MS data
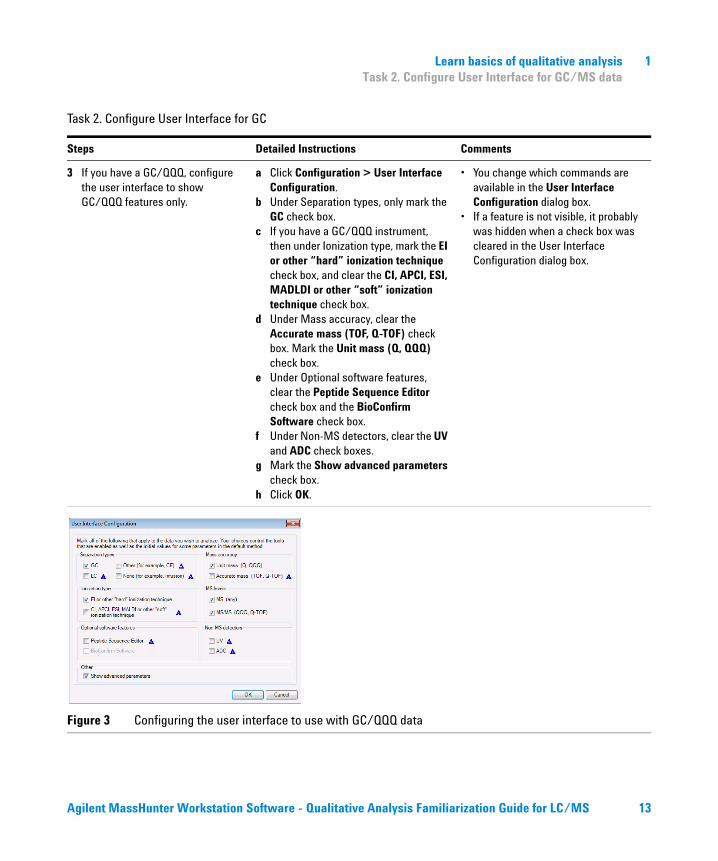
3 If you have a GC/QQQ, configure the user interface to show GC/QQQ features only.
a Click Configuration > User Interface Configuration.
b Under Separation types, only mark the GC check box.
c If you have a GC/QQQ instrument, then under Ionization type, mark the EI or other “hard” ionization technique check box, and clear the CI, APCI, ESI, MADLDI or other “soft” ionization technique check box.
d Under Mass accuracy, clear the Accurate mass (TOF, Q-TOF) check box. Mark the Unit mass (Q, QQQ) check box.
e Under Optional software features, clear the Peptide Sequence Editor check box and the BioConfirm Software check box.
f Under Non-MS detectors, clear the UV and ADC check boxes.
g Mark the Show advanced parameters check box.
h Click OK.
• You change which commands are available in the User Interface Configuration dialog box.
• If a feature is not visible, it probably was hidden when a check box was cleared in the User Interface Configuration dialog box.
Figure 3 Configuring the user interface to use with GC/QQQ data
Task 2. Configure User Interface for GC
Steps Detailed Instructions Comments
Agilent MassHunter Workstation Software - Qualitative Analysis Familiarization Guide for LC/MS 13
1 Learn basics of qualitative analysisTask 2. Configure User Interface for GC/MS data
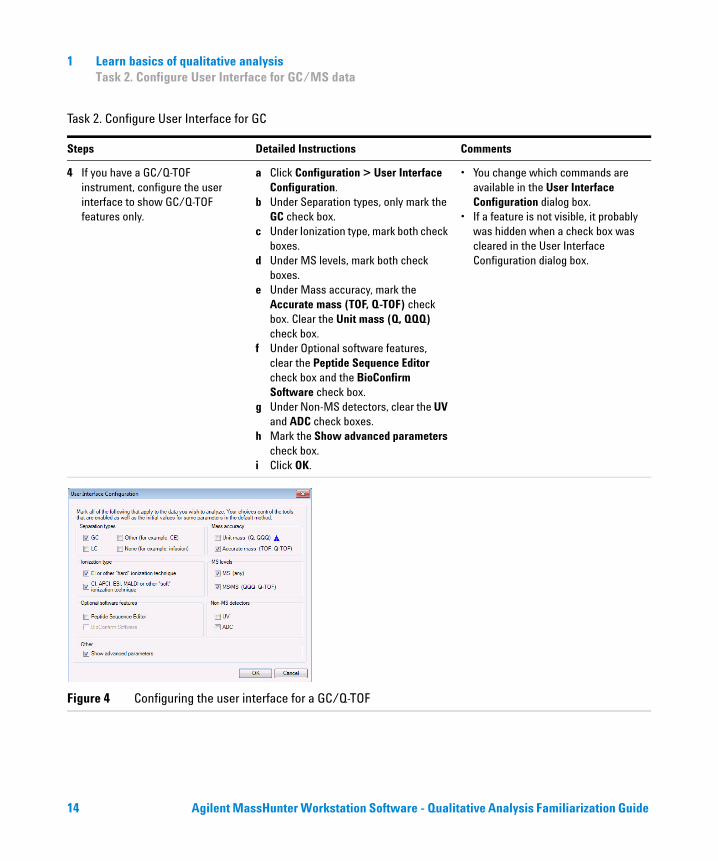
4 If you have a GC/Q-TOF instrument, configure the user interface to show GC/Q-TOF features only.
a Click Configuration > User Interface Configuration.
b Under Separation types, only mark the GC check box.
c Under Ionization type, mark both check boxes.
d Under MS levels, mark both check boxes.
e Under Mass accuracy, mark the Accurate mass (TOF, Q-TOF) check box. Clear the Unit mass (Q, QQQ) check box.
f Under Optional software features, clear the Peptide Sequence Editor check box and the BioConfirm Software check box.
g Under Non-MS detectors, clear the UV and ADC check boxes.
h Mark the Show advanced parameters check box.
i Click OK.
• You change which commands are available in the User Interface Configuration dialog box.
• If a feature is not visible, it probably was hidden when a check box was cleared in the User Interface Configuration dialog box.
Figure 4 Configuring the user interface for a GC/Q-TOF
Task 2. Configure User Interface for GC
Steps Detailed Instructions Comments
14 Agilent MassHunter Workstation Software - Qualitative Analysis Familiarization Guide
Learn basics of qualitative analysis 1Task 3. Zoom in and out of the chromatogram
Task 3. Zoom in and out of the chromatogram
In this task, you become familiar with the zoom in and zoom out features of the Qualitative Analysis program.
Agilent MassHunter Workstation Software - Qualitative Analysis Familiarization Guide for LC/MS 15
1 Learn basics of qualitative analysisTask 4. Anchor a chromatogram
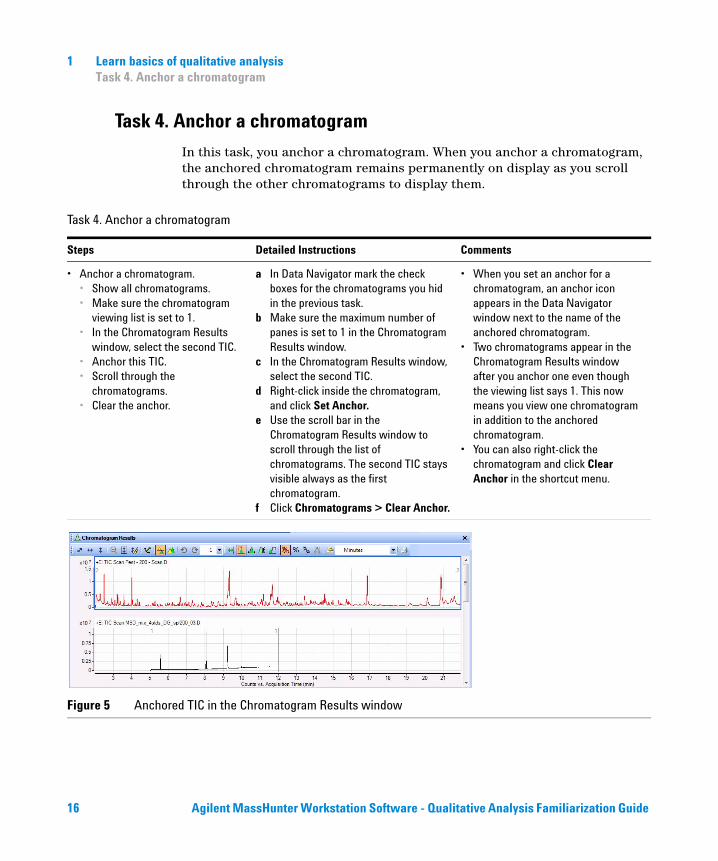
Task 4. Anchor a chromatogram
In this task, you anchor a chromatogram. When you anchor a chromatogram, the anchored chromatogram remains permanently on display as you scroll through the other chromatograms to display them.
Task 4. Anchor a chromatogram
Steps Detailed Instructions Comments
• Anchor a chromatogram.• Show all chromatograms.• Make sure the chromatogram
viewing list is set to 1.• In the Chromatogram Results
window, select the second TIC.• Anchor this TIC.• Scroll through the
chromatograms.• Clear the anchor.
a In Data Navigator mark the check boxes for the chromatograms you hid in the previous task.
b Make sure the maximum number of panes is set to 1 in the Chromatogram Results window.
c In the Chromatogram Results window, select the second TIC.
d Right-click inside the chromatogram, and click Set Anchor.
e Use the scroll bar in the Chromatogram Results window to scroll through the list of chromatograms. The second TIC stays visible always as the first chromatogram.
f Click Chromatograms > Clear Anchor.
• When you set an anchor for a chromatogram, an anchor icon appears in the Data Navigator window next to the name of the anchored chromatogram.
• Two chromatograms appear in the Chromatogram Results window after you anchor one even though the viewing list says 1. This now means you view one chromatogram in addition to the anchored chromatogram.
• You can also right-click the chromatogram and click Clear Anchor in the shortcut menu.
Figure 5 Anchored TIC in the Chromatogram Results window
16 Agilent MassHunter Workstation Software - Qualitative Analysis Familiarization Guide
Learn basics of qualitative analysis 1Task 5. Change window layouts
Task 5. Change window layouts
In this task, you move windows within the main view and create various window layouts.
Task 5. Change window layout
Steps Detailed Instructions Comments
1 Change the window layout:• Change the window size.• Save a window layout.• Unlock the layout.• Change the Chromatogram
Results window to be floating.• Move the Chromatogram Results
window.• Display the tools for
repositioning the windows.
• To change the size of a window, drag the boundary between the windows.
• To save a window layout, click Configuration > Window Layouts > Save Layout.
• To unlock a layout, click Configuration > Window Layouts > Lock Layout.
• To make a window float, right-click the title bar of the window, and click Floating from the shortcut menu.
• To move a window, click the title bar of the window and drag the window to the desired location.
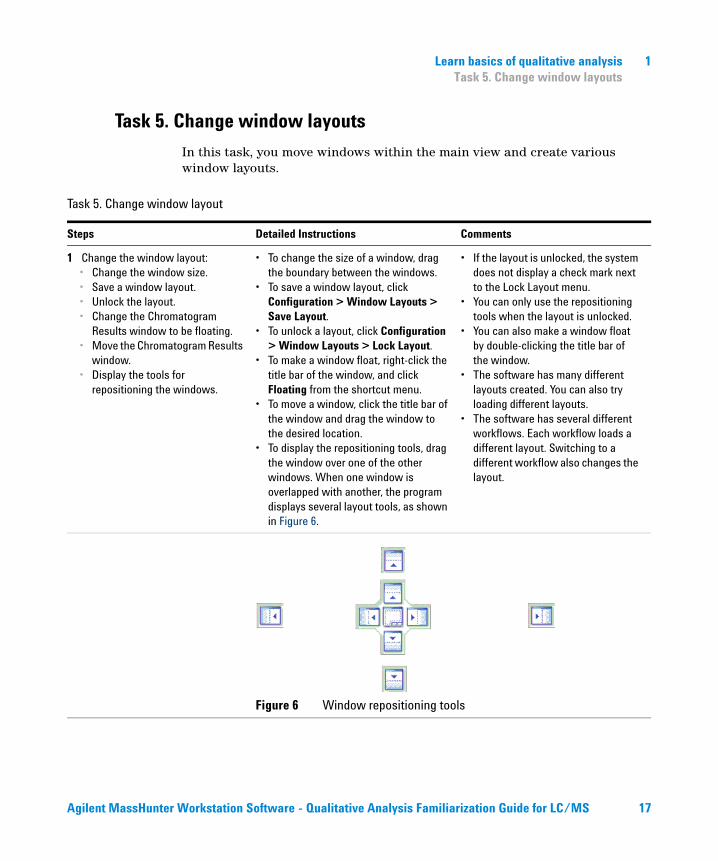
• To display the repositioning tools, drag the window over one of the other windows. When one window is overlapped with another, the program displays several layout tools, as shown in Figure 6.
• If the layout is unlocked, the system does not display a check mark next to the Lock Layout menu.
• You can only use the repositioning tools when the layout is unlocked.
• You can also make a window float by double-clicking the title bar of the window.
• The software has many different layouts created. You can also try loading different layouts.
• The software has several different workflows. Each workflow loads a different layout. Switching to a different workflow also changes the layout.
Figure 6 Window repositioning tools
Agilent MassHunter Workstation Software - Qualitative Analysis Familiarization Guide for LC/MS 17
1 Learn basics of qualitative analysisTask 5. Change window layouts
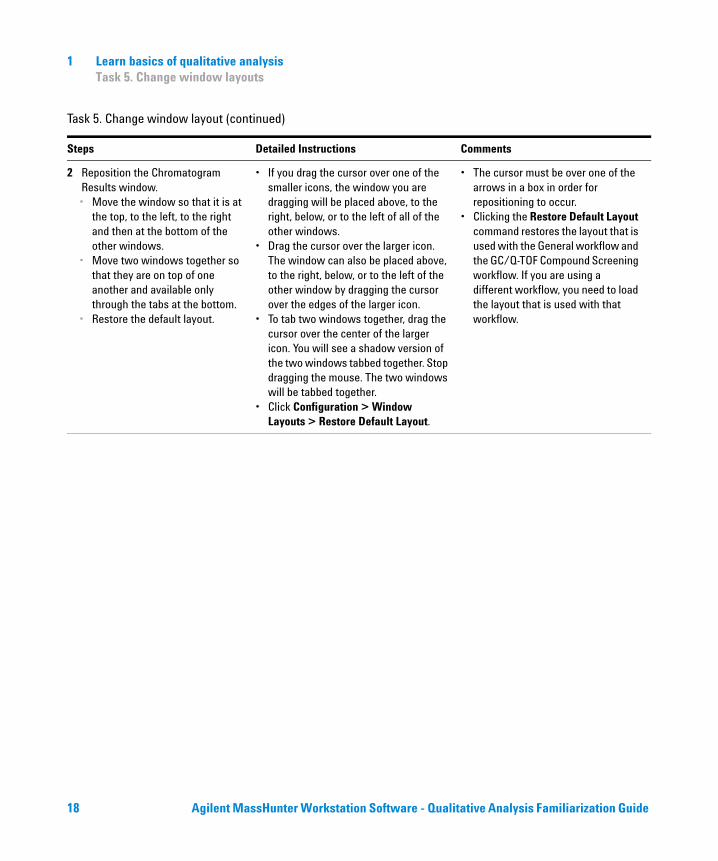
2 Reposition the Chromatogram Results window.• Move the window so that it is at
the top, to the left, to the right and then at the bottom of the other windows.
• Move two windows together so that they are on top of one another and available only through the tabs at the bottom.
• Restore the default layout.
• If you drag the cursor over one of the smaller icons, the window you are dragging will be placed above, to the right, below, or to the left of all of the other windows.
• Drag the cursor over the larger icon. The window can also be placed above, to the right, below, or to the left of the other window by dragging the cursor over the edges of the larger icon.
• To tab two windows together, drag the cursor over the center of the larger icon. You will see a shadow version of the two windows tabbed together. Stop dragging the mouse. The two windows will be tabbed together.
• Click Configuration > Window Layouts > Restore Default Layout.
• The cursor must be over one of the arrows in a box in order for repositioning to occur.
• Clicking the Restore Default Layout command restores the layout that is used with the General workflow and the GC/Q-TOF Compound Screening workflow. If you are using a different workflow, you need to load the layout that is used with that workflow.
Task 5. Change window layout (continued)
Steps Detailed Instructions Comments
18 Agilent MassHunter Workstation Software - Qualitative Analysis Familiarization Guide
Learn basics of qualitative analysis 1Task 6. Extract chromatograms
Task 6. Extract chromatograms
In this task, you extract and merge chromatograms from the original TIC.
Task 6. Extract chromatograms
Steps Detailed Instructions Comments
1 Extract and merge extracted ion chromatograms (EICs) from two masses in the Pest - 200 Scan.d data file.• The m/z values are 129.0 and
414.2.• Do not merge the peaks from the
individual masses into one chromatogram.
a In the Data Navigator window, clear the check boxes for the data files except for Pest - 200 Scan.d.
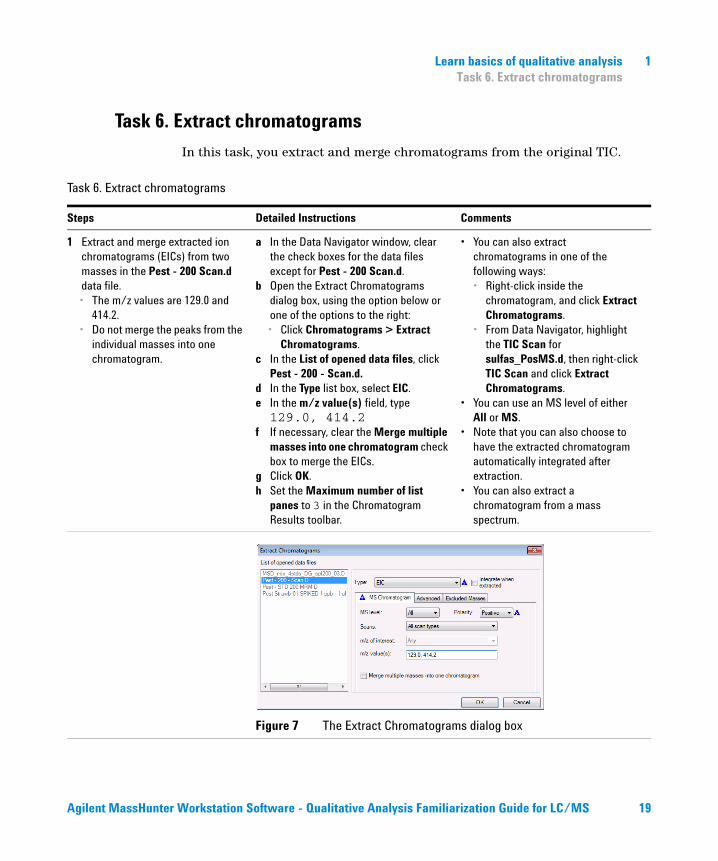
b Open the Extract Chromatograms dialog box, using the option below or one of the options to the right: • Click Chromatograms > Extract
Chromatograms.c In the List of opened data files, click
Pest - 200 - Scan.d.d In the Type list box, select EIC.e In the m/z value(s) field, type 129.0, 414.2
f If necessary, clear the Merge multiple masses into one chromatogram check box to merge the EICs.
g Click OK.h Set the Maximum number of list
panes to 3 in the Chromatogram Results toolbar.
• You can also extract chromatograms in one of the following ways:• Right-click inside the
chromatogram, and click Extract Chromatograms.
• From Data Navigator, highlight the TIC Scan for sulfas_PosMS.d, then right-click TIC Scan and click Extract Chromatograms.
• You can use an MS level of either All or MS.
• Note that you can also choose to have the extracted chromatogram automatically integrated after extraction.
• You can also extract a chromatogram from a mass spectrum.
Figure 7 The Extract Chromatograms dialog box
Agilent MassHunter Workstation Software - Qualitative Analysis Familiarization Guide for LC/MS 19
1 Learn basics of qualitative analysisTask 6. Extract chromatograms
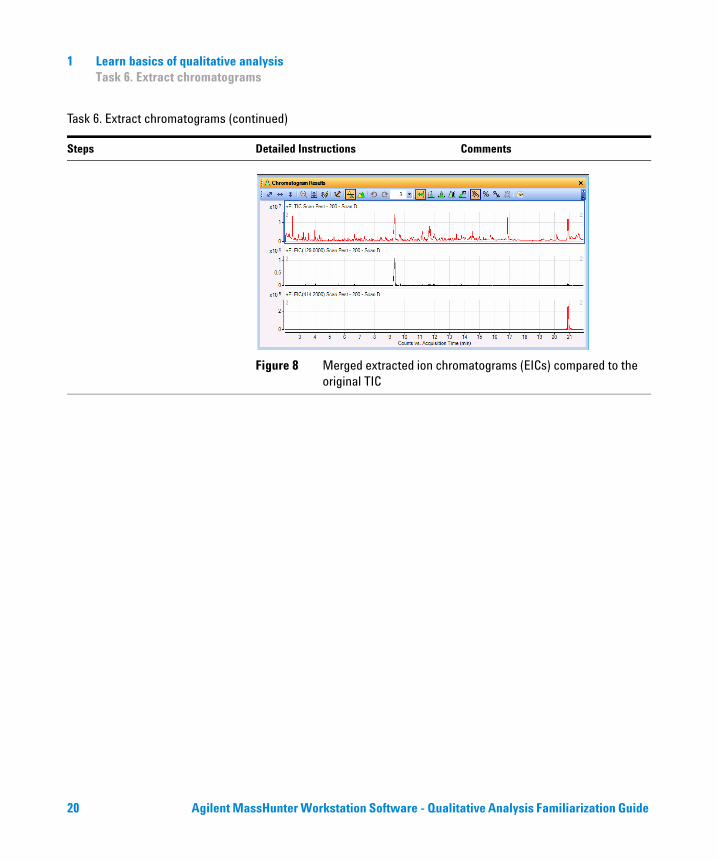
Figure 8 Merged extracted ion chromatograms (EICs) compared to the original TIC
Task 6. Extract chromatograms (continued)
Steps Detailed Instructions Comments
20 Agilent MassHunter Workstation Software - Qualitative Analysis Familiarization Guide
Learn basics of qualitative analysis 1Task 7. Interactively integrate a GC/MS chromatogram
Task 7. Interactively integrate a GC/MS chromatogram
In this task, you learn different ways to integrate a chromatogram, change integration parameters to modify the results and calculate the Signal-to-Noise for the integrated peaks for MS/MS data.
Task 7. Interactively integrate a chromatogram (GC/MS)
Steps Detailed Instructions Comments
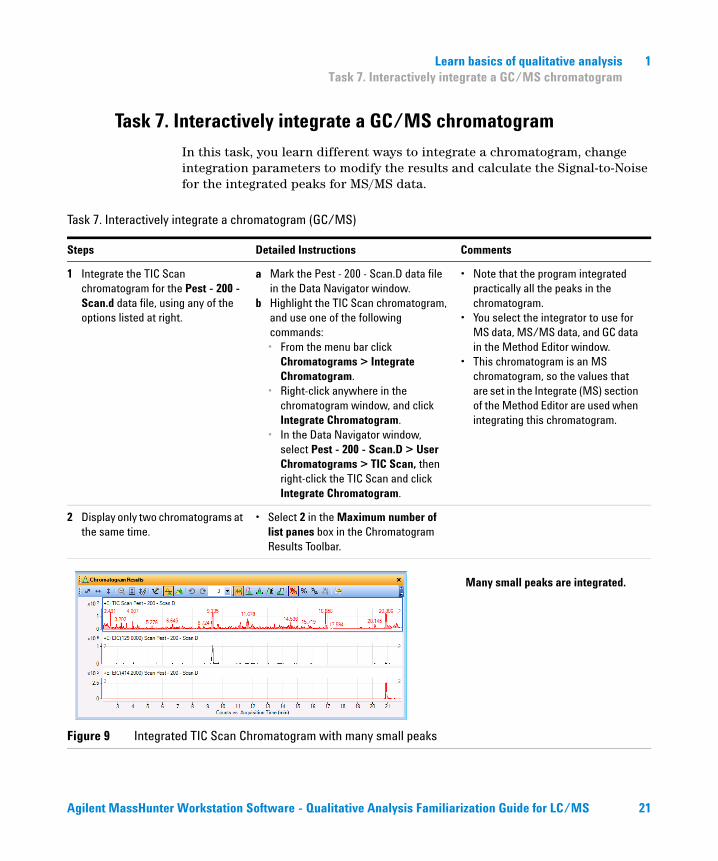
1 Integrate the TIC Scan chromatogram for the Pest - 200 - Scan.d data file, using any of the options listed at right.
a Mark the Pest - 200 - Scan.D data file in the Data Navigator window.
b Highlight the TIC Scan chromatogram, and use one of the following commands:• From the menu bar click
Chromatograms > Integrate Chromatogram.
• Right-click anywhere in the chromatogram window, and click Integrate Chromatogram.
• In the Data Navigator window, select Pest - 200 - Scan.D > User Chromatograms > TIC Scan, then right-click the TIC Scan and click Integrate Chromatogram.
• Note that the program integrated practically all the peaks in the chromatogram.
• You select the integrator to use for MS data, MS/MS data, and GC data in the Method Editor window.
• This chromatogram is an MS chromatogram, so the values that are set in the Integrate (MS) section of the Method Editor are used when integrating this chromatogram.
2 Display only two chromatograms at the same time.
• Select 2 in the Maximum number of list panes box in the Chromatogram Results Toolbar.
Figure 9 Integrated TIC Scan Chromatogram with many small peaks
Many small peaks are integrated.
Agilent MassHunter Workstation Software - Qualitative Analysis Familiarization Guide for LC/MS 21
1 Learn basics of qualitative analysisTask 7. Interactively integrate a GC/MS chromatogram
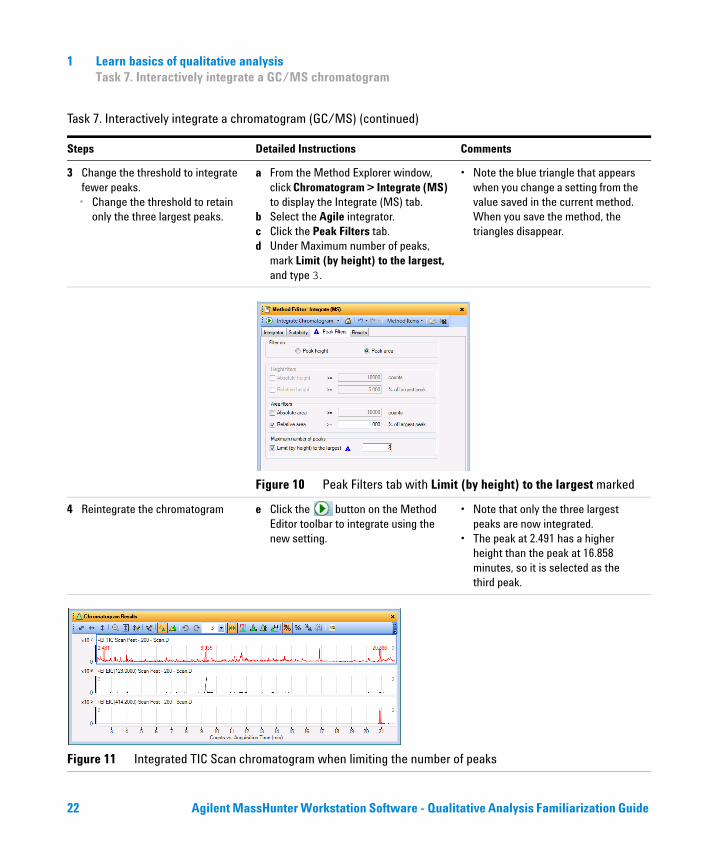
3 Change the threshold to integrate fewer peaks.• Change the threshold to retain
only the three largest peaks.
a From the Method Explorer window, click Chromatogram > Integrate (MS) to display the Integrate (MS) tab.
b Select the Agile integrator.c Click the Peak Filters tab.d Under Maximum number of peaks,
mark Limit (by height) to the largest, and type 3.
• Note the blue triangle that appears when you change a setting from the value saved in the current method. When you save the method, the triangles disappear.
Figure 10 Peak Filters tab with Limit (by height) to the largest marked
4 Reintegrate the chromatogram e Click the button on the Method Editor toolbar to integrate using the new setting.
• Note that only the three largest peaks are now integrated.
• The peak at 2.491 has a higher height than the peak at 16.858 minutes, so it is selected as the third peak.
Figure 11 Integrated TIC Scan chromatogram when limiting the number of peaks
Task 7. Interactively integrate a chromatogram (GC/MS) (continued)
Steps Detailed Instructions Comments
22 Agilent MassHunter Workstation Software - Qualitative Analysis Familiarization Guide
Learn basics of qualitative analysis 1Task 7. Interactively integrate a GC/MS chromatogram
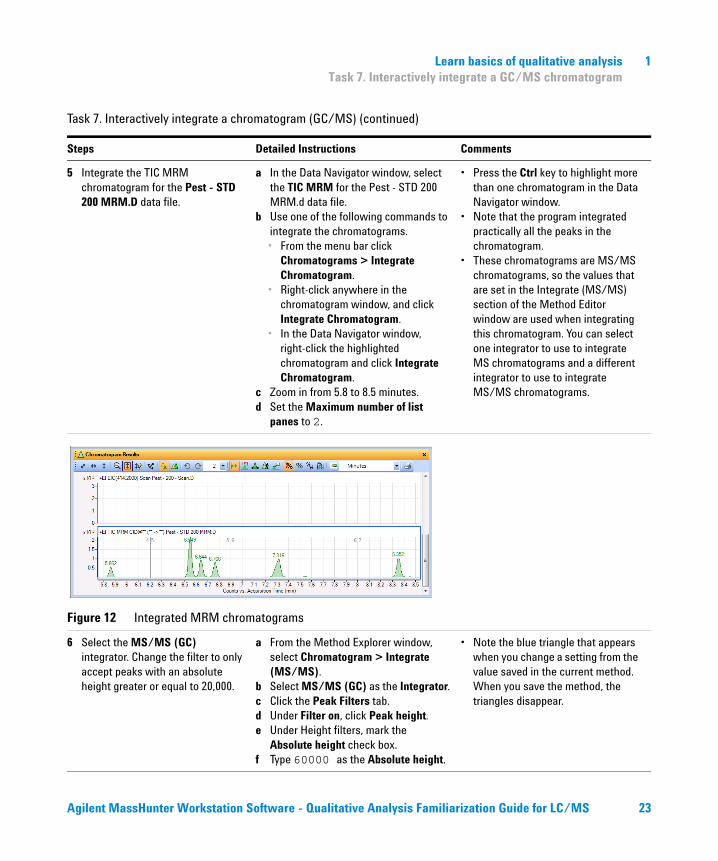
5 Integrate the TIC MRM chromatogram for the Pest - STD 200 MRM.D data file.
a In the Data Navigator window, select the TIC MRM for the Pest - STD 200 MRM.d data file.
b Use one of the following commands to integrate the chromatograms.• From the menu bar click
Chromatograms > Integrate Chromatogram.
• Right-click anywhere in the chromatogram window, and click Integrate Chromatogram.
• In the Data Navigator window, right-click the highlighted chromatogram and click Integrate Chromatogram.
c Zoom in from 5.8 to 8.5 minutes.d Set the Maximum number of list
panes to 2.
• Press the Ctrl key to highlight more than one chromatogram in the Data Navigator window.
• Note that the program integrated practically all the peaks in the chromatogram.
• These chromatograms are MS/MS chromatograms, so the values that are set in the Integrate (MS/MS) section of the Method Editor window are used when integrating this chromatogram. You can select one integrator to use to integrate MS chromatograms and a different integrator to use to integrate MS/MS chromatograms.
Figure 12 Integrated MRM chromatograms
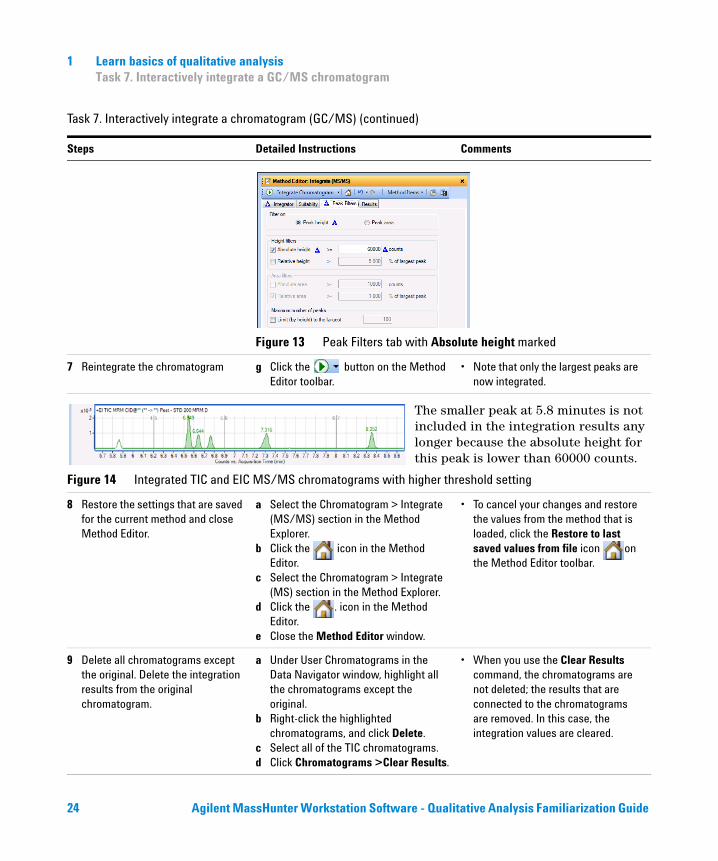
6 Select the MS/MS (GC) integrator. Change the filter to only accept peaks with an absolute height greater or equal to 20,000.
a From the Method Explorer window, select Chromatogram > Integrate (MS/MS).
b Select MS/MS (GC) as the Integrator.c Click the Peak Filters tab.d Under Filter on, click Peak height.e Under Height filters, mark the
Absolute height check box.f Type 60000 as the Absolute height.
• Note the blue triangle that appears when you change a setting from the value saved in the current method. When you save the method, the triangles disappear.
Task 7. Interactively integrate a chromatogram (GC/MS) (continued)
Steps Detailed Instructions Comments
Agilent MassHunter Workstation Software - Qualitative Analysis Familiarization Guide for LC/MS 23
1 Learn basics of qualitative analysisTask 7. Interactively integrate a GC/MS chromatogram
Figure 13 Peak Filters tab with Absolute height marked
7 Reintegrate the chromatogram g Click the button on the Method Editor toolbar.
• Note that only the largest peaks are now integrated.
Figure 14 Integrated TIC and EIC MS/MS chromatograms with higher threshold setting
8 Restore the settings that are saved for the current method and close Method Editor.
a Select the Chromatogram > Integrate (MS/MS) section in the Method Explorer.
b Click the icon in the Method Editor.
c Select the Chromatogram > Integrate (MS) section in the Method Explorer.
d Click the . icon in the Method Editor.
e Close the Method Editor window.
• To cancel your changes and restore the values from the method that is loaded, click the Restore to last saved values from file icon on the Method Editor toolbar.
9 Delete all chromatograms except the original. Delete the integration results from the original chromatogram.
a Under User Chromatograms in the Data Navigator window, highlight all the chromatograms except the original.
b Right-click the highlighted chromatograms, and click Delete.
c Select all of the TIC chromatograms.d Click Chromatograms >Clear Results.
• When you use the Clear Results command, the chromatograms are not deleted; the results that are connected to the chromatograms are removed. In this case, the integration values are cleared.
Task 7. Interactively integrate a chromatogram (GC/MS) (continued)
Steps Detailed Instructions Comments
The smaller peak at 5.8 minutes is not included in the integration results any longer because the absolute height for this peak is lower than 60000 counts.
24 Agilent MassHunter Workstation Software - Qualitative Analysis Familiarization Guide
Learn basics of qualitative analysis 1Task 8. Calculate System Suitability values
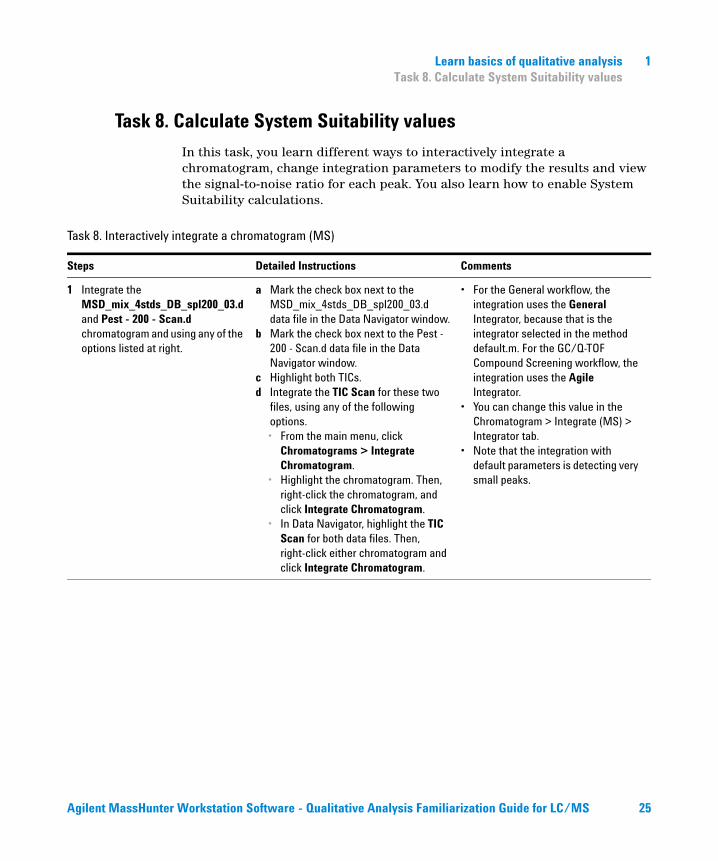
Task 8. Calculate System Suitability values
In this task, you learn different ways to interactively integrate a chromatogram, change integration parameters to modify the results and view the signal-to-noise ratio for each peak. You also learn how to enable System Suitability calculations.
Task 8. Interactively integrate a chromatogram (MS)
Steps Detailed Instructions Comments
1 Integrate the MSD_mix_4stds_DB_spl200_03.d and Pest - 200 - Scan.d chromatogram and using any of the options listed at right.
a Mark the check box next to the MSD_mix_4stds_DB_spl200_03.d data file in the Data Navigator window.
b Mark the check box next to the Pest - 200 - Scan.d data file in the Data Navigator window.
c Highlight both TICs.d Integrate the TIC Scan for these two
files, using any of the following options.• From the main menu, click
Chromatograms > Integrate Chromatogram.
• Highlight the chromatogram. Then, right-click the chromatogram, and click Integrate Chromatogram.
• In Data Navigator, highlight the TIC Scan for both data files. Then, right-click either chromatogram and click Integrate Chromatogram.
• For the General workflow, the integration uses the General Integrator, because that is the integrator selected in the method default.m. For the GC/Q-TOF Compound Screening workflow, the integration uses the Agile Integrator.
• You can change this value in the Chromatogram > Integrate (MS) > Integrator tab.
• Note that the integration with default parameters is detecting very small peaks.
Agilent MassHunter Workstation Software - Qualitative Analysis Familiarization Guide for LC/MS 25
1 Learn basics of qualitative analysisTask 8. Calculate System Suitability values
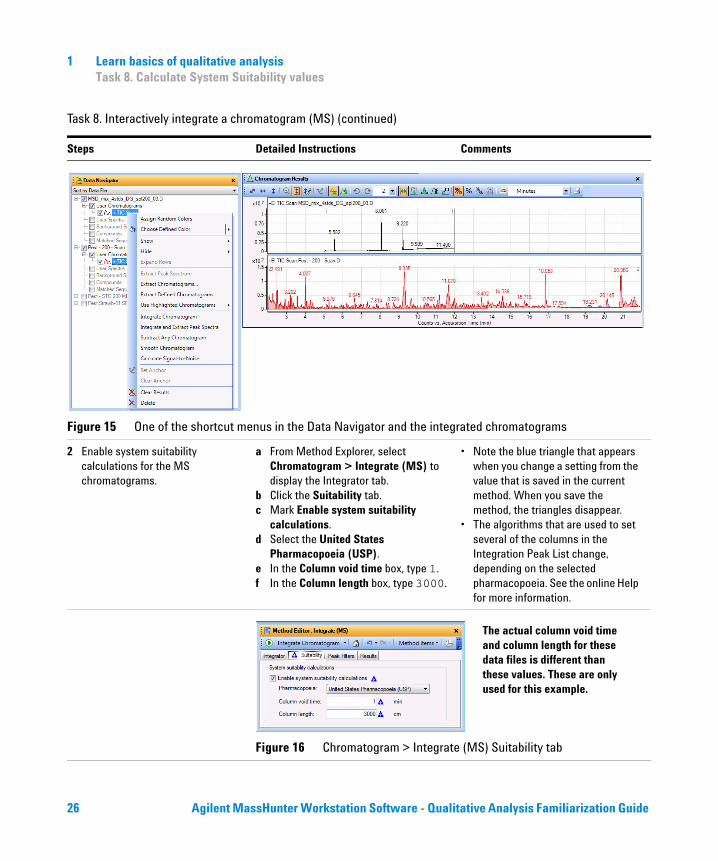
Figure 15 One of the shortcut menus in the Data Navigator and the integrated chromatograms
2 Enable system suitability calculations for the MS chromatograms.
a From Method Explorer, select Chromatogram > Integrate (MS) to display the Integrator tab.
b Click the Suitability tab.c Mark Enable system suitability
calculations.d Select the United States
Pharmacopoeia (USP).e In the Column void time box, type 1.f In the Column length box, type 3000.
• Note the blue triangle that appears when you change a setting from the value that is saved in the current method. When you save the method, the triangles disappear.
• The algorithms that are used to set several of the columns in the Integration Peak List change, depending on the selected pharmacopoeia. See the online Help for more information.
Figure 16 Chromatogram > Integrate (MS) Suitability tab
Task 8. Interactively integrate a chromatogram (MS) (continued)
Steps Detailed Instructions Comments
The actual column void time and column length for these data files is different than these values. These are only used for this example.
26 Agilent MassHunter Workstation Software - Qualitative Analysis Familiarization Guide
Learn basics of qualitative analysis 1Task 8. Calculate System Suitability values
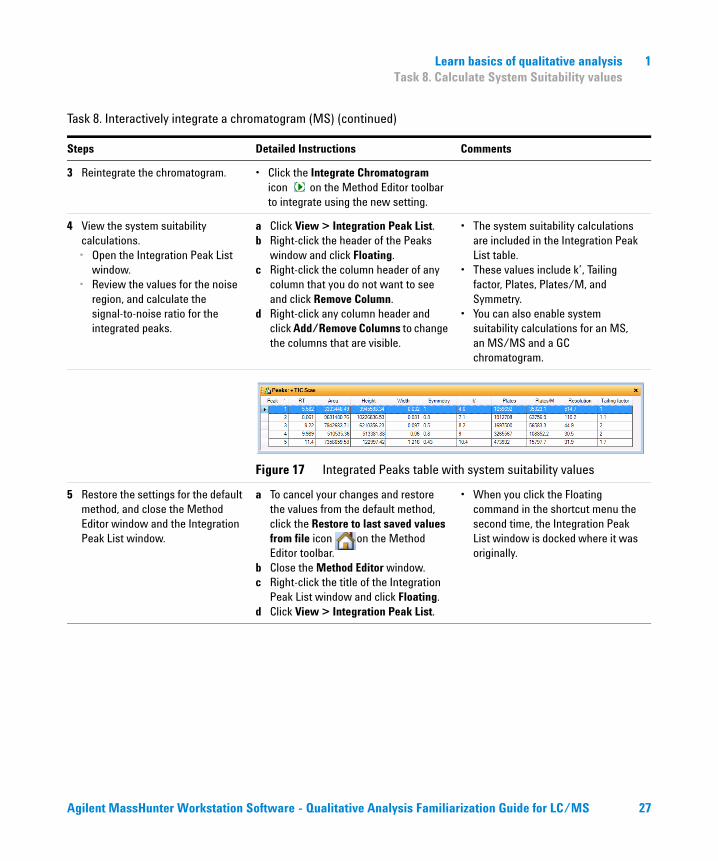
3 Reintegrate the chromatogram. • Click the Integrate Chromatogram icon on the Method Editor toolbar to integrate using the new setting.
4 View the system suitability calculations.• Open the Integration Peak List
window.• Review the values for the noise
region, and calculate the signal-to-noise ratio for the integrated peaks.
a Click View > Integration Peak List.b Right-click the header of the Peaks
window and click Floating.c Right-click the column header of any
column that you do not want to see and click Remove Column.
d Right-click any column header and click Add/Remove Columns to change the columns that are visible.
• The system suitability calculations are included in the Integration Peak List table.
• These values include k’, Tailing factor, Plates, Plates/M, and Symmetry.
• You can also enable system suitability calculations for an MS, an MS/MS and a GC chromatogram.
Figure 17 Integrated Peaks table with system suitability values
5 Restore the settings for the default method, and close the Method Editor window and the Integration Peak List window.
a To cancel your changes and restore the values from the default method, click the Restore to last saved values from file icon on the Method Editor toolbar.
b Close the Method Editor window.c Right-click the title of the Integration
Peak List window and click Floating.d Click View > Integration Peak List.
• When you click the Floating command in the shortcut menu the second time, the Integration Peak List window is docked where it was originally.
Task 8. Interactively integrate a chromatogram (MS) (continued)
Steps Detailed Instructions Comments
Agilent MassHunter Workstation Software - Qualitative Analysis Familiarization Guide for LC/MS 27
1 Learn basics of qualitative analysisTask 9. Extract spectra from a chromatogram
Task 9. Extract spectra from a chromatogram
In this task, you extract a spectrum from exactly where you specify in the chromatogram. The Qualitative Analysis program extracts a spectrum from a specific data point or extract an average spectrum from an average of multiple data points or ranges.
Task 9. Extract spectra from a chromatogram
Steps Detailed Instructions Comments
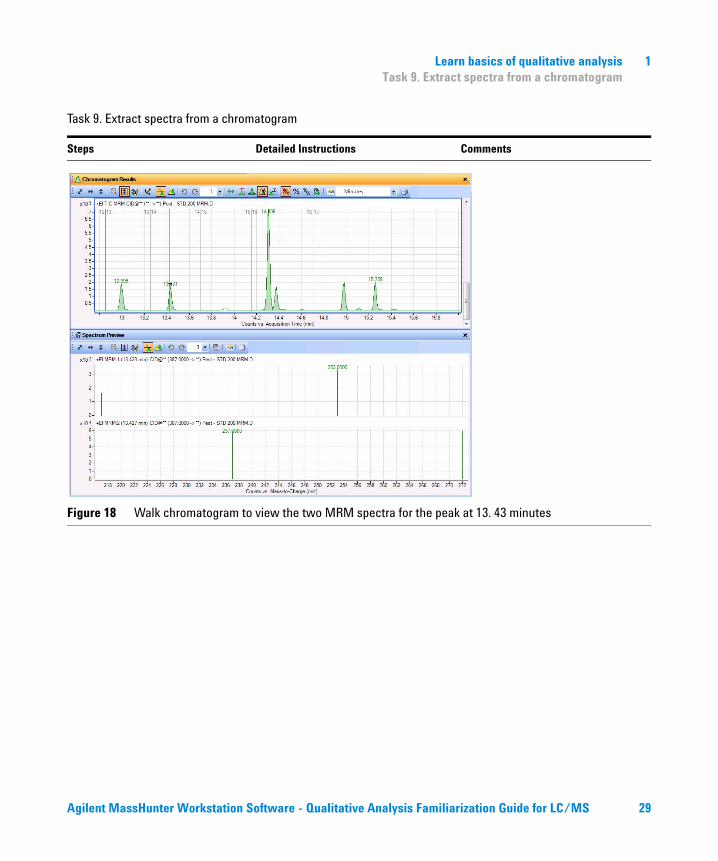
1 Walk a chromatogram to view the precursor ion and product ion for the last few peaks of Pest - STD 200 MRM.d.• Zoom in on the region between
13 and 16 minutes.• Use the Walk Chromatogram
icon.• Review the spectra starting at
about 13 minutes, and move the arrow to the right.
a Mark the Pest - 200 - MRM.D line in the Data Navigator window.
b Close the Method Editor window.c Close the MS Spectrum Results
window.d Click the TIC MRM chromatogram in
the Data Navigator window.e Click the Autoscale Y-axis during
Zoom icon in the Chromatogram Results toolbar.
f Select 1 for the Maximum number of list panes.
g To zoom in on a few peaks, right-click the mouse above the peak at 13 minutes and drag it to 16 minutes, and then release.
h Click the Walk Chromatogram icon in the Chromatogram Results
toolbar.i Move the Walk Chromatogram cursor
to above the X axis at about 13 minutes, and click.
j To navigate from spectrum to spectrum, use the right and left arrow keys on your keyboard.
• The Walk Chromatogram tool is particularly useful on MS/MS data for identifying precursor and product ions.
• The spectrum for each point you click in the Chromatogram Results window is automatically displayed in the Spectrum Preview window, which is opened automatically.
• Sometimes, two spectra are displayed in the Spectrum Preview window. For example, two spectra are shown in the Spectrum Preview window for each point you click near the peak at 13.431 minutes.
28 Agilent MassHunter Workstation Software - Qualitative Analysis Familiarization Guide
Learn basics of qualitative analysis 1Task 9. Extract spectra from a chromatogram
Figure 18 Walk chromatogram to view the two MRM spectra for the peak at 13. 43 minutes
Task 9. Extract spectra from a chromatogram
Steps Detailed Instructions Comments
Agilent MassHunter Workstation Software - Qualitative Analysis Familiarization Guide for LC/MS 29
1 Learn basics of qualitative analysisTask 9. Extract spectra from a chromatogram
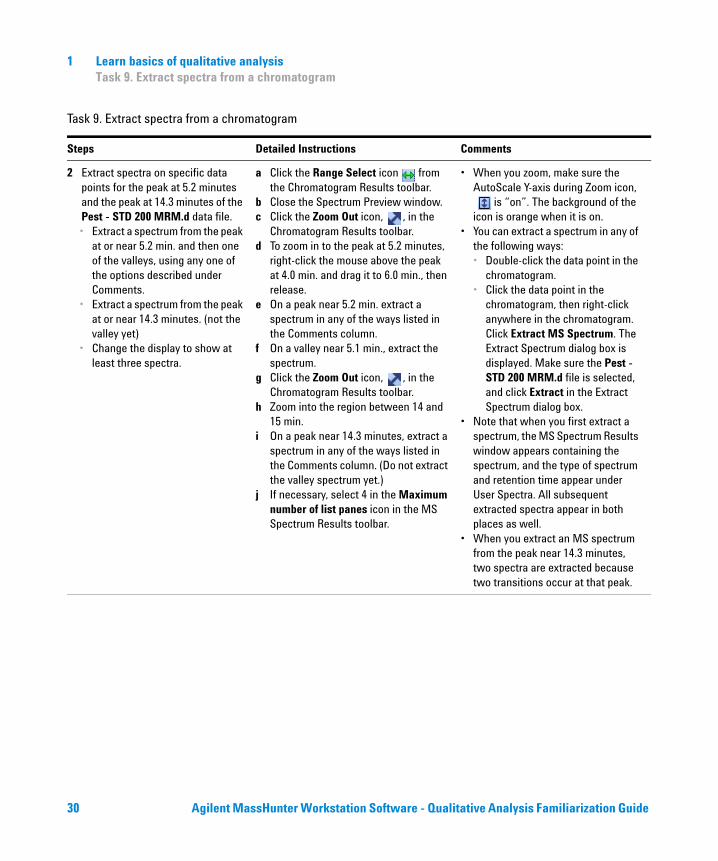
2 Extract spectra on specific data points for the peak at 5.2 minutes and the peak at 14.3 minutes of the Pest - STD 200 MRM.d data file.• Extract a spectrum from the peak
at or near 5.2 min. and then one of the valleys, using any one of the options described under Comments.
• Extract a spectrum from the peak at or near 14.3 minutes. (not the valley yet)
• Change the display to show at least three spectra.
a Click the Range Select icon from the Chromatogram Results toolbar.
b Close the Spectrum Preview window.c Click the Zoom Out icon, , in the
Chromatogram Results toolbar.d To zoom in to the peak at 5.2 minutes,
right-click the mouse above the peak at 4.0 min. and drag it to 6.0 min., then release.
e On a peak near 5.2 min. extract a spectrum in any of the ways listed in the Comments column.
f On a valley near 5.1 min., extract the spectrum.
g Click the Zoom Out icon, , in the Chromatogram Results toolbar.
h Zoom into the region between 14 and 15 min.
i On a peak near 14.3 minutes, extract a spectrum in any of the ways listed in the Comments column. (Do not extract the valley spectrum yet.)
j If necessary, select 4 in the Maximum number of list panes icon in the MS Spectrum Results toolbar.
• When you zoom, make sure the AutoScale Y-axis during Zoom icon,
is “on”. The background of the icon is orange when it is on.
• You can extract a spectrum in any of the following ways:• Double-click the data point in the
chromatogram. • Click the data point in the
chromatogram, then right-click anywhere in the chromatogram. Click Extract MS Spectrum. The Extract Spectrum dialog box is displayed. Make sure the Pest - STD 200 MRM.d file is selected, and click Extract in the Extract Spectrum dialog box.
• Note that when you first extract a spectrum, the MS Spectrum Results window appears containing the spectrum, and the type of spectrum and retention time appear under User Spectra. All subsequent extracted spectra appear in both places as well.
• When you extract an MS spectrum from the peak near 14.3 minutes, two spectra are extracted because two transitions occur at that peak.
Task 9. Extract spectra from a chromatogram
Steps Detailed Instructions Comments
30 Agilent MassHunter Workstation Software - Qualitative Analysis Familiarization Guide
Learn basics of qualitative analysis 1Task 9. Extract spectra from a chromatogram
Figure 19 Main window with two MRM spectra from the peak at 5.2 minutes and two MRM spectra from the peak at 14.3 minutes
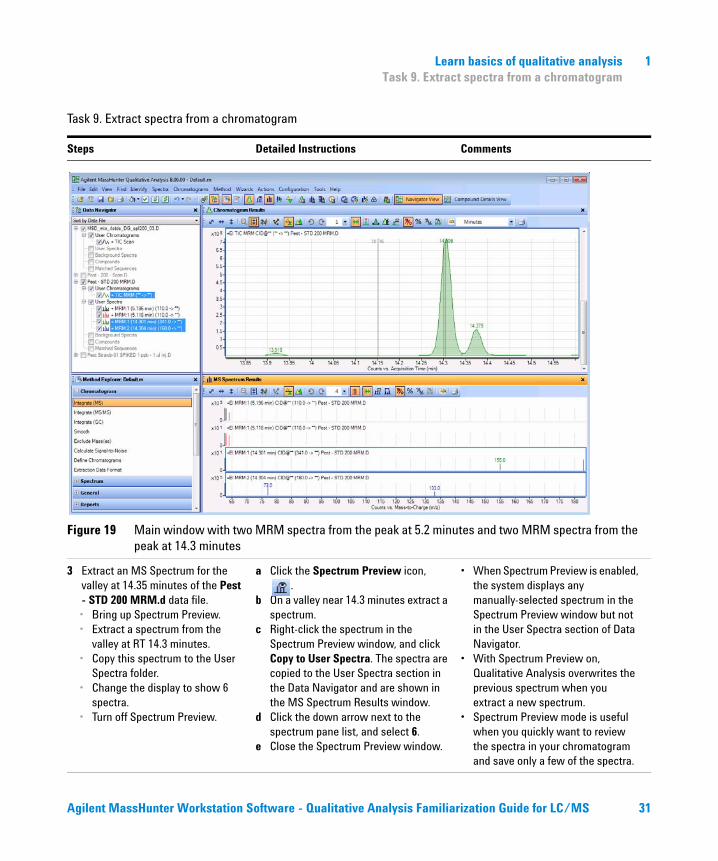
3 Extract an MS Spectrum for the valley at 14.35 minutes of the Pest - STD 200 MRM.d data file. • Bring up Spectrum Preview.• Extract a spectrum from the
valley at RT 14.3 minutes.• Copy this spectrum to the User
Spectra folder.• Change the display to show 6
spectra.• Turn off Spectrum Preview.
a Click the Spectrum Preview icon, .
b On a valley near 14.3 minutes extract a spectrum.
c Right-click the spectrum in the Spectrum Preview window, and click Copy to User Spectra. The spectra are copied to the User Spectra section in the Data Navigator and are shown in the MS Spectrum Results window.
d Click the down arrow next to the spectrum pane list, and select 6.
e Close the Spectrum Preview window.
• When Spectrum Preview is enabled, the system displays any manually-selected spectrum in the Spectrum Preview window but not in the User Spectra section of Data Navigator.
• With Spectrum Preview on, Qualitative Analysis overwrites the previous spectrum when you extract a new spectrum.
• Spectrum Preview mode is useful when you quickly want to review the spectra in your chromatogram and save only a few of the spectra.
Task 9. Extract spectra from a chromatogram
Steps Detailed Instructions Comments
Agilent MassHunter Workstation Software - Qualitative Analysis Familiarization Guide for LC/MS 31
1 Learn basics of qualitative analysisTask 9. Extract spectra from a chromatogram
Figure 20 Chromatogram Results and MS Spectrum Results windows
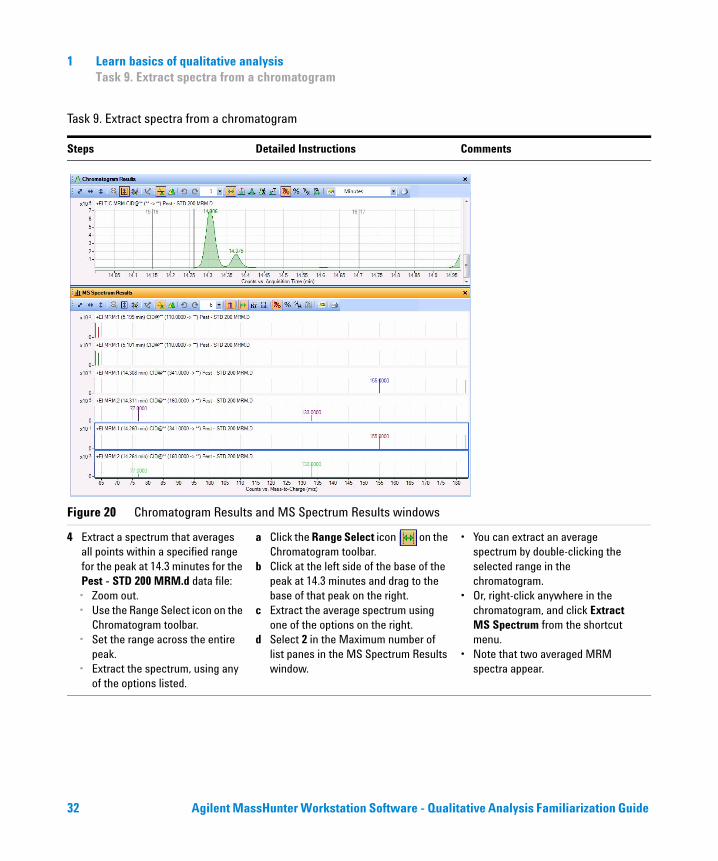
4 Extract a spectrum that averages all points within a specified range for the peak at 14.3 minutes for the Pest - STD 200 MRM.d data file:• Zoom out.• Use the Range Select icon on the
Chromatogram toolbar.• Set the range across the entire
peak. • Extract the spectrum, using any
of the options listed.
a Click the Range Select icon on the Chromatogram toolbar.
b Click at the left side of the base of the peak at 14.3 minutes and drag to the base of that peak on the right.
c Extract the average spectrum using one of the options on the right.
d Select 2 in the Maximum number of list panes in the MS Spectrum Results window.
• You can extract an average spectrum by double-clicking the selected range in the chromatogram.
• Or, right-click anywhere in the chromatogram, and click Extract MS Spectrum from the shortcut menu.
• Note that two averaged MRM spectra appear.
Task 9. Extract spectra from a chromatogram
Steps Detailed Instructions Comments
32 Agilent MassHunter Workstation Software - Qualitative Analysis Familiarization Guide
Learn basics of qualitative analysis 1Task 9. Extract spectra from a chromatogram
Figure 21 Chromatogram Results and MS Spectrum Results showing two averaged spectra
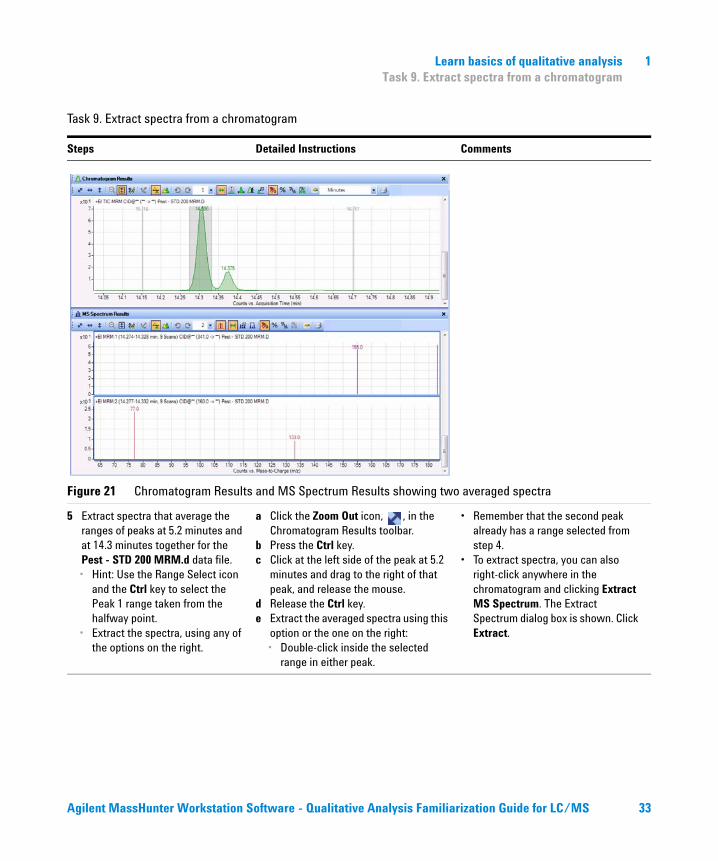
5 Extract spectra that average the ranges of peaks at 5.2 minutes and at 14.3 minutes together for the Pest - STD 200 MRM.d data file.• Hint: Use the Range Select icon
and the Ctrl key to select the Peak 1 range taken from the halfway point.
• Extract the spectra, using any of the options on the right.
a Click the Zoom Out icon, , in the Chromatogram Results toolbar.
b Press the Ctrl key.c Click at the left side of the peak at 5.2
minutes and drag to the right of that peak, and release the mouse.
d Release the Ctrl key.e Extract the averaged spectra using this
option or the one on the right:• Double-click inside the selected
range in either peak.
• Remember that the second peak already has a range selected from step 4.
• To extract spectra, you can also right-click anywhere in the chromatogram and clicking Extract MS Spectrum. The Extract Spectrum dialog box is shown. Click Extract.
Task 9. Extract spectra from a chromatogram
Steps Detailed Instructions Comments
Agilent MassHunter Workstation Software - Qualitative Analysis Familiarization Guide for LC/MS 33
1 Learn basics of qualitative analysisTask 9. Extract spectra from a chromatogram
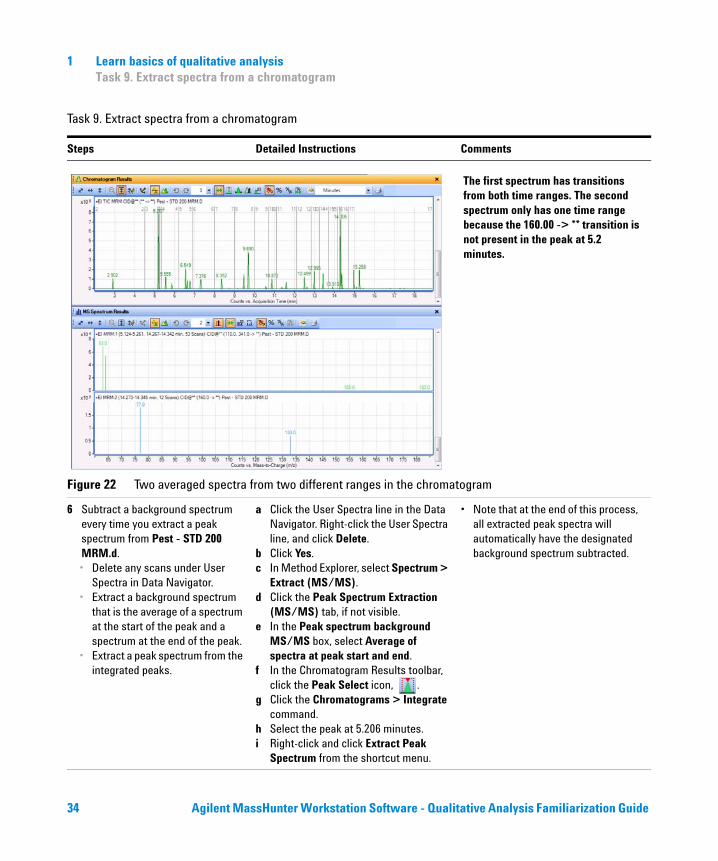
Figure 22 Two averaged spectra from two different ranges in the chromatogram
6 Subtract a background spectrum every time you extract a peak spectrum from Pest - STD 200 MRM.d.• Delete any scans under User
Spectra in Data Navigator.• Extract a background spectrum
that is the average of a spectrum at the start of the peak and a spectrum at the end of the peak.
• Extract a peak spectrum from the integrated peaks.
a Click the User Spectra line in the Data Navigator. Right-click the User Spectra line, and click Delete.
b Click Yes.c In Method Explorer, select Spectrum >
Extract (MS/MS). d Click the Peak Spectrum Extraction
(MS/MS) tab, if not visible.e In the Peak spectrum background
MS/MS box, select Average of spectra at peak start and end.
f In the Chromatogram Results toolbar, click the Peak Select icon, .
g Click the Chromatograms > Integrate command.
h Select the peak at 5.206 minutes.i Right-click and click Extract Peak
Spectrum from the shortcut menu.
• Note that at the end of this process, all extracted peak spectra will automatically have the designated background spectrum subtracted.
Task 9. Extract spectra from a chromatogram
Steps Detailed Instructions Comments
The first spectrum has transitions from both time ranges. The second spectrum only has one time range because the 160.00 -> ** transition is not present in the peak at 5.2 minutes.
34 Agilent MassHunter Workstation Software - Qualitative Analysis Familiarization Guide
Learn basics of qualitative analysis 1Task 9. Extract spectra from a chromatogram
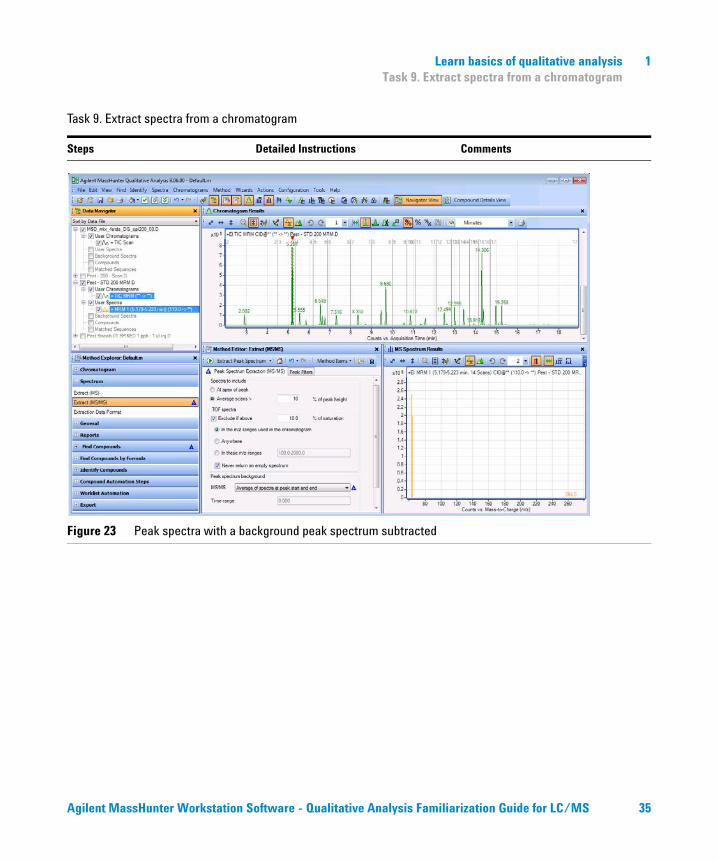
Figure 23 Peak spectra with a background peak spectrum subtracted
Task 9. Extract spectra from a chromatogram
Steps Detailed Instructions Comments
Agilent MassHunter Workstation Software - Qualitative Analysis Familiarization Guide for LC/MS 35
1 Learn basics of qualitative analysisTask 9. Extract spectra from a chromatogram
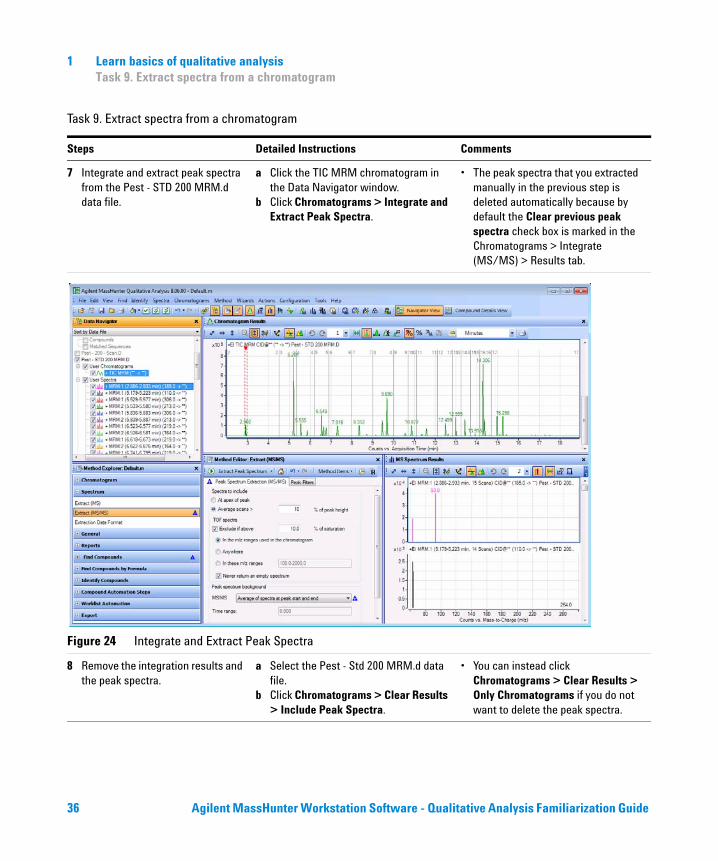
7 Integrate and extract peak spectra from the Pest - STD 200 MRM.d data file.
a Click the TIC MRM chromatogram in the Data Navigator window.
b Click Chromatograms > Integrate and Extract Peak Spectra.
• The peak spectra that you extracted manually in the previous step is deleted automatically because by default the Clear previous peak spectra check box is marked in the Chromatograms > Integrate (MS/MS) > Results tab.
Figure 24 Integrate and Extract Peak Spectra
8 Remove the integration results and the peak spectra.
a Select the Pest - Std 200 MRM.d data file.
b Click Chromatograms > Clear Results > Include Peak Spectra.
• You can instead click Chromatograms > Clear Results > Only Chromatograms if you do not want to delete the peak spectra.
Task 9. Extract spectra from a chromatogram
Steps Detailed Instructions Comments
36 Agilent MassHunter Workstation Software - Qualitative Analysis Familiarization Guide
Learn basics of qualitative analysis 1Task 10. Add annotations
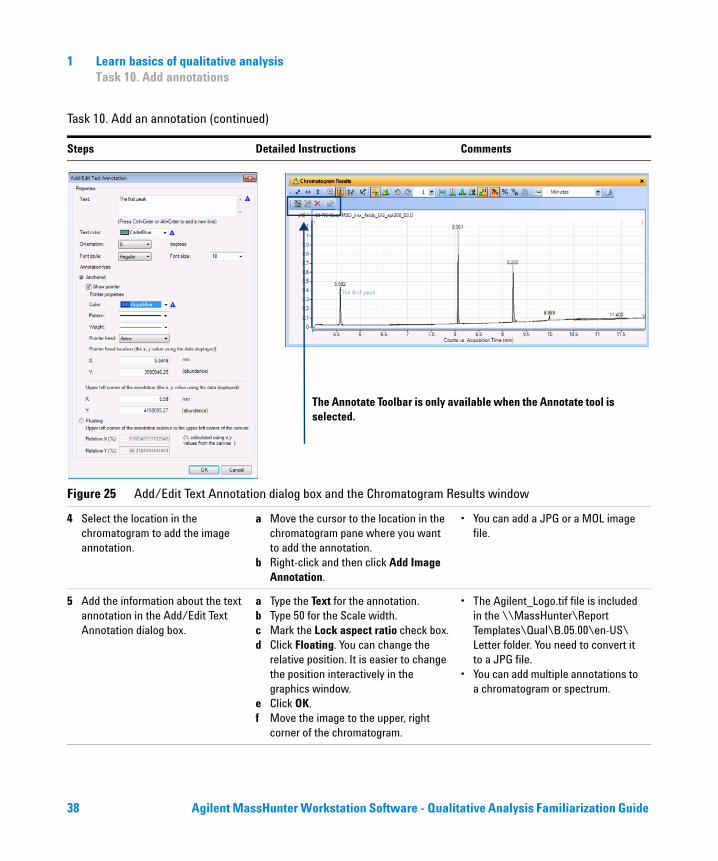
Task 10. Add annotations
You can add an image annotation or a text annotation to the following graphics windows:
• Chromatogram Results window
• MS Spectrum Results window
If you save the results for the data file, annotations are also saved.
Task 10. Add an annotation
Steps Detailed Instructions Comments
1 Select the MSD_mix_4stds_DG_spl200_03.d data file. Hide the other chromatograms.
a Mark the check box next to MSD_mix_4stds_DG_spl200_03.D in the Data Navigator window.
b Click Edit > Show > Only Highlighted.
• The chromatograms for the other data files are automatically hidden.
2 Select the location in the chromatogram to add a text annotation.
a In the Chromatogram Results window, click the Annotation tool ( )in the toolbar.
b Move the cursor to the location in the chromatogram pane where you want to add the annotation.
c Right-click and then click Add Text Annotation.
• The cursor changes to a cross-hair. You use this cursor to select the exact location to add the annotation.
• The Annotate toolbar is available in the Chromatogram Results window.
• You can also add annotations to the MS Spectrum Results window.
3 Add the information about the text annotation in the Add/Edit Text Annotation dialog box.
a Type the Text for the annotation.b Select the Text color.c Select the Orientation.d Select the Font style and Font size.e Click either Anchored or Floating. If
you click Anchored, select the options for the pointer to the text annotation. If you click Floating, you can change the relative position. It is easier to change the position interactively in the graphics window.
f Click OK.
• You can add multiple annotations to a chromatogram or spectrum.
• You can use the icons in the Annotate toolbar to select all of the annotations, delete annotations and edit annotations.
Agilent MassHunter Workstation Software - Qualitative Analysis Familiarization Guide for LC/MS 37
1 Learn basics of qualitative analysisTask 10. Add annotations
Figure 25 Add/Edit Text Annotation dialog box and the Chromatogram Results window
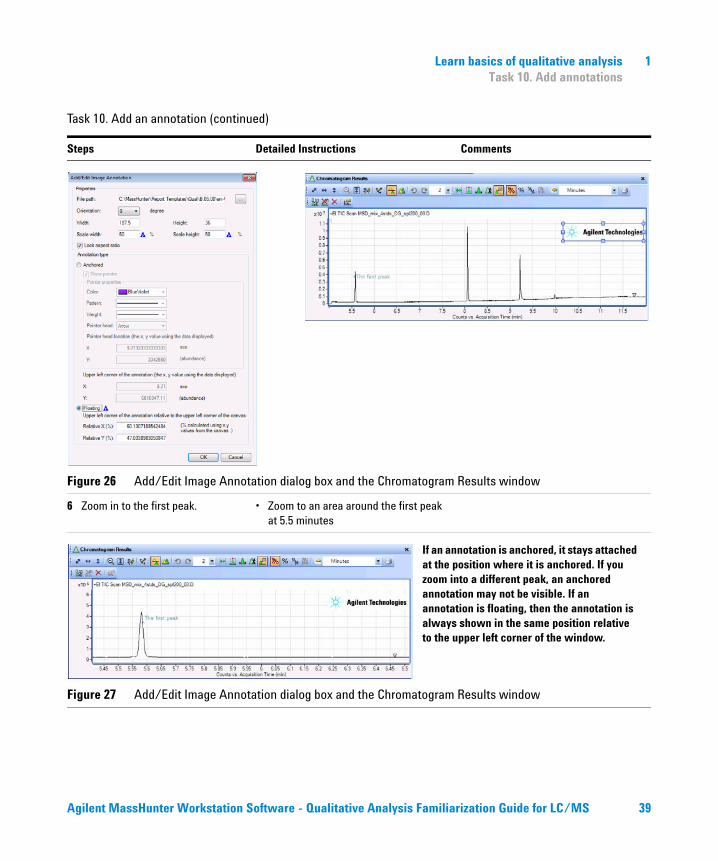
4 Select the location in the chromatogram to add the image annotation.
a Move the cursor to the location in the chromatogram pane where you want to add the annotation.
b Right-click and then click Add Image Annotation.
• You can add a JPG or a MOL image file.
5 Add the information about the text annotation in the Add/Edit Text Annotation dialog box.
a Type the Text for the annotation.b Type 50 for the Scale width.c Mark the Lock aspect ratio check box.d Click Floating. You can change the
relative position. It is easier to change the position interactively in the graphics window.
e Click OK.f Move the image to the upper, right
corner of the chromatogram.
• The Agilent_Logo.tif file is included in the \\MassHunter\Report Templates\Qual\B.05.00\en-US\Letter folder. You need to convert it to a JPG file.
• You can add multiple annotations to a chromatogram or spectrum.
Task 10. Add an annotation (continued)
Steps Detailed Instructions Comments
The Annotate Toolbar is only available when the Annotate tool is selected.
38 Agilent MassHunter Workstation Software - Qualitative Analysis Familiarization Guide
Learn basics of qualitative analysis 1Task 10. Add annotations
Figure 26 Add/Edit Image Annotation dialog box and the Chromatogram Results window
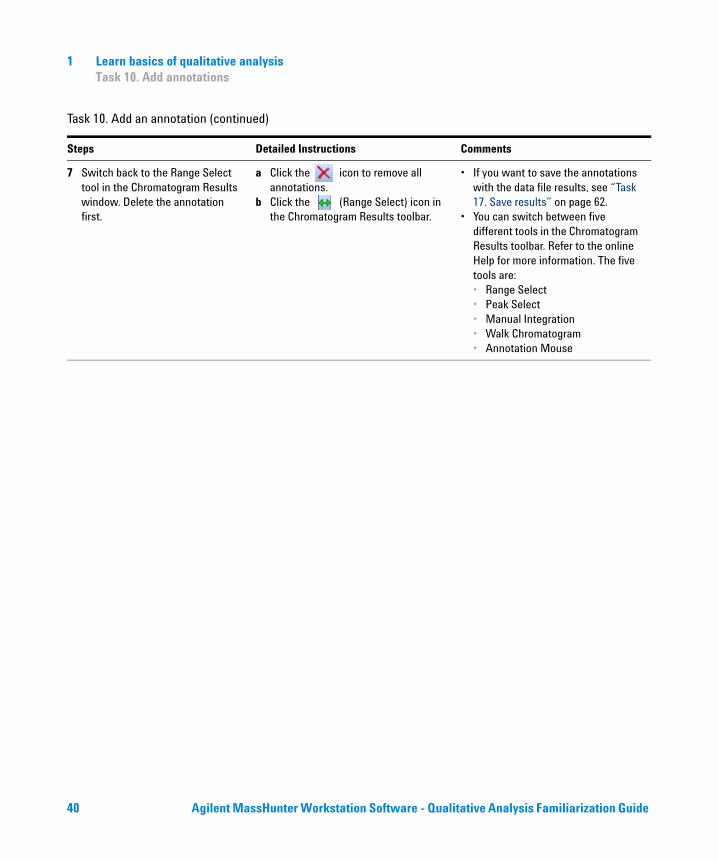
6 Zoom in to the first peak. • Zoom to an area around the first peak at 5.5 minutes
Figure 27 Add/Edit Image Annotation dialog box and the Chromatogram Results window
Task 10. Add an annotation (continued)
Steps Detailed Instructions Comments
If an annotation is anchored, it stays attached at the position where it is anchored. If you zoom into a different peak, an anchored annotation may not be visible. If an annotation is floating, then the annotation is always shown in the same position relative to the upper left corner of the window.
Agilent MassHunter Workstation Software - Qualitative Analysis Familiarization Guide for LC/MS 39
1 Learn basics of qualitative analysisTask 10. Add annotations
7 Switch back to the Range Select tool in the Chromatogram Results window. Delete the annotation first.
a Click the icon to remove all annotations.
b Click the (Range Select) icon in the Chromatogram Results toolbar.
• If you want to save the annotations with the data file results, see “Task 17. Save results” on page 62.
• You can switch between five different tools in the Chromatogram Results toolbar. Refer to the online Help for more information. The five tools are:• Range Select• Peak Select• Manual Integration• Walk Chromatogram• Annotation Mouse
Task 10. Add an annotation (continued)
Steps Detailed Instructions Comments
40 Agilent MassHunter Workstation Software - Qualitative Analysis Familiarization Guide
Learn basics of qualitative analysis 1Task 11. Add a mass caliper
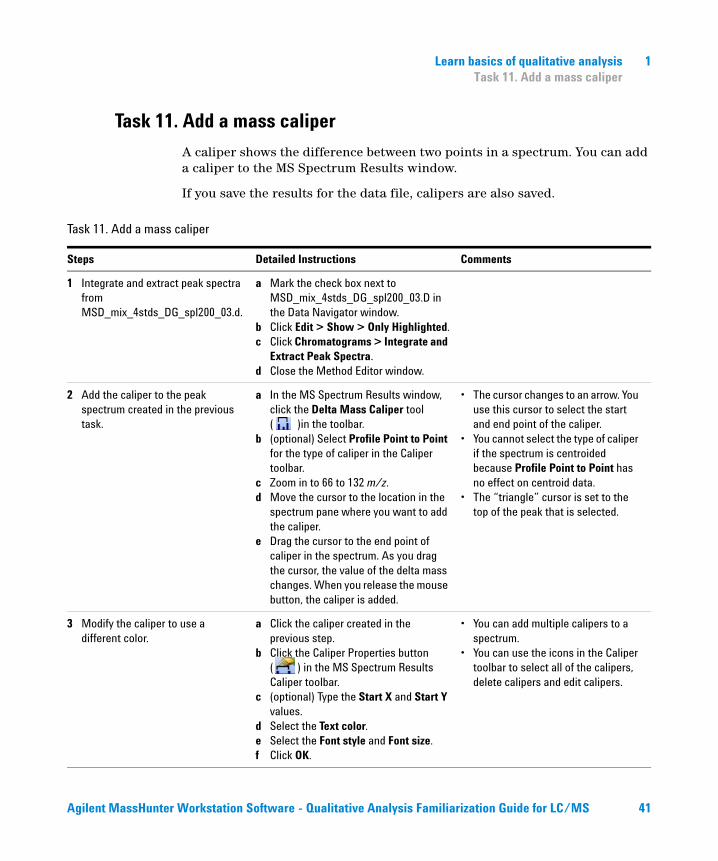
Task 11. Add a mass caliper
A caliper shows the difference between two points in a spectrum. You can add a caliper to the MS Spectrum Results window.
If you save the results for the data file, calipers are also saved.
Task 11. Add a mass caliper
Steps Detailed Instructions Comments
1 Integrate and extract peak spectra from MSD_mix_4stds_DG_spl200_03.d.
a Mark the check box next to MSD_mix_4stds_DG_spl200_03.D in the Data Navigator window.
b Click Edit > Show > Only Highlighted.c Click Chromatograms > Integrate and
Extract Peak Spectra.d Close the Method Editor window.
2 Add the caliper to the peak spectrum created in the previous task.
a In the MS Spectrum Results window, click the Delta Mass Caliper tool ( )in the toolbar.
b (optional) Select Profile Point to Point for the type of caliper in the Caliper toolbar.
c Zoom in to 66 to 132 m/z.d Move the cursor to the location in the
spectrum pane where you want to add the caliper.
e Drag the cursor to the end point of caliper in the spectrum. As you drag the cursor, the value of the delta mass changes. When you release the mouse button, the caliper is added.
• The cursor changes to an arrow. You use this cursor to select the start and end point of the caliper.
• You cannot select the type of caliper if the spectrum is centroided because Profile Point to Point has no effect on centroid data.
• The “triangle” cursor is set to the top of the peak that is selected.
3 Modify the caliper to use a different color.
a Click the caliper created in the previous step.
b Click the Caliper Properties button ( ) in the MS Spectrum Results Caliper toolbar.
c (optional) Type the Start X and Start Y values.
d Select the Text color.e Select the Font style and Font size.f Click OK.
• You can add multiple calipers to a spectrum.
• You can use the icons in the Caliper toolbar to select all of the calipers, delete calipers and edit calipers.
Agilent MassHunter Workstation Software - Qualitative Analysis Familiarization Guide for LC/MS 41
1 Learn basics of qualitative analysisTask 11. Add a mass caliper
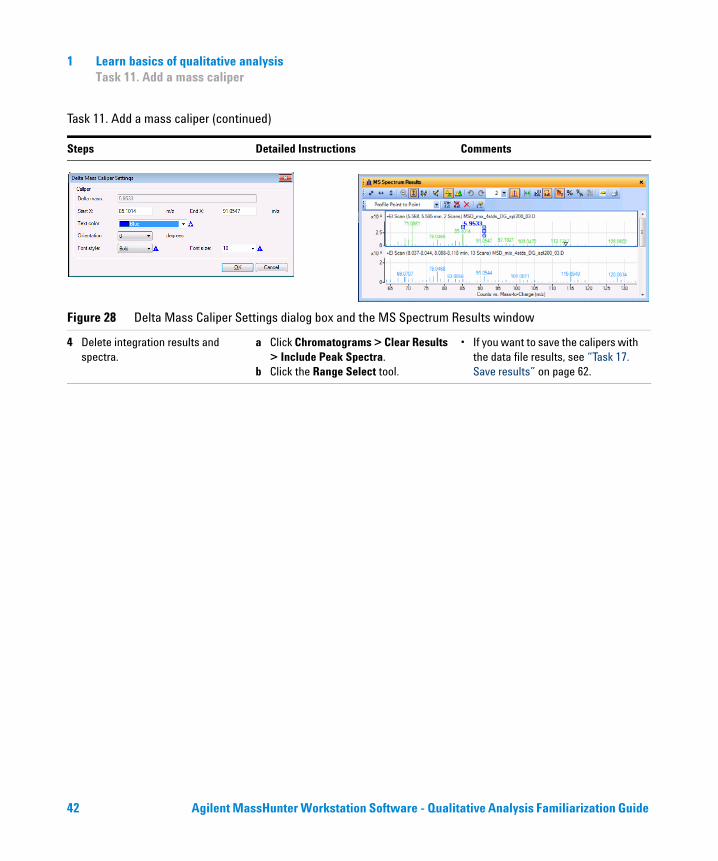
Figure 28 Delta Mass Caliper Settings dialog box and the MS Spectrum Results window
4 Delete integration results and spectra.
a Click Chromatograms > Clear Results > Include Peak Spectra.
b Click the Range Select tool.
• If you want to save the calipers with the data file results, see “Task 17. Save results” on page 62.
Task 11. Add a mass caliper (continued)
Steps Detailed Instructions Comments
42 Agilent MassHunter Workstation Software - Qualitative Analysis Familiarization Guide
Agilent MassHunter Workstation Software Qualitative AnalysisFamiliarization Guide
2Find and identify
Task 12. Find compounds by chromatogram deconvolution 44
Task 13. Identify compounds using the Search Library algorithm 48
Task 14. Find compounds by MRM (MRM only) 51
Task 15. Find compounds by Integration 54
Task 16. Generate formulas and search library for peak spectra 57
Task 17. Save results 62
In these tasks, you find and identify compounds in GC/MS data files.
Each exercise is presented in a table with three columns:
• Steps – Use these general instructions to proceed on your own to explore the program.
• Detailed Instructions – Use these if you need help or prefer to use a step-by-step learning process.
• Comments – Read these to learn tips and additional information about each step in the exercise.
43
2 Find and identifyTask 12. Find compounds by chromatogram deconvolution
Task 12. Find compounds by chromatogram deconvolution
This FindCompounds algorithm identifies compounds in GC/MS data and creates a cleaned MS spectrum for each compound. This functionality is an easy way to “mine” information from complex data. You can only use the Find Compounds by Chromatogram Deconvolution algorithm on GC/MS sample data acquired in Scan, Product Ion scan or Neutral Loss scan mode.
This task shows finding compounds by chromatogram deconvolution with accurate mass data. You can also find compounds by chromatogram deconvolution with unit mass data after you first change the extraction window.
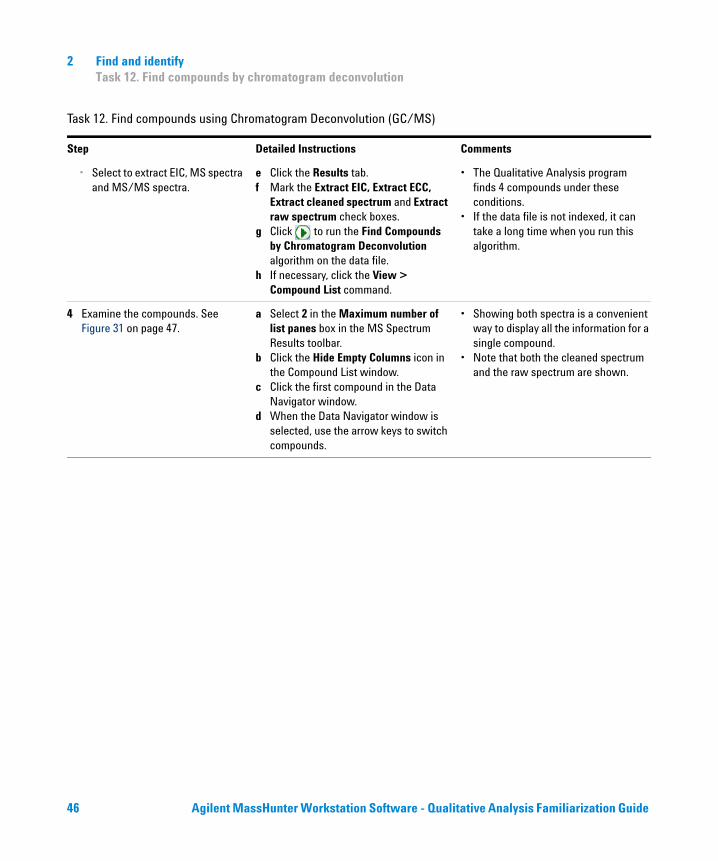
Task 12. Find compounds using Chromatogram Deconvolution (GC/MS)
Step Detailed Instructions Comments
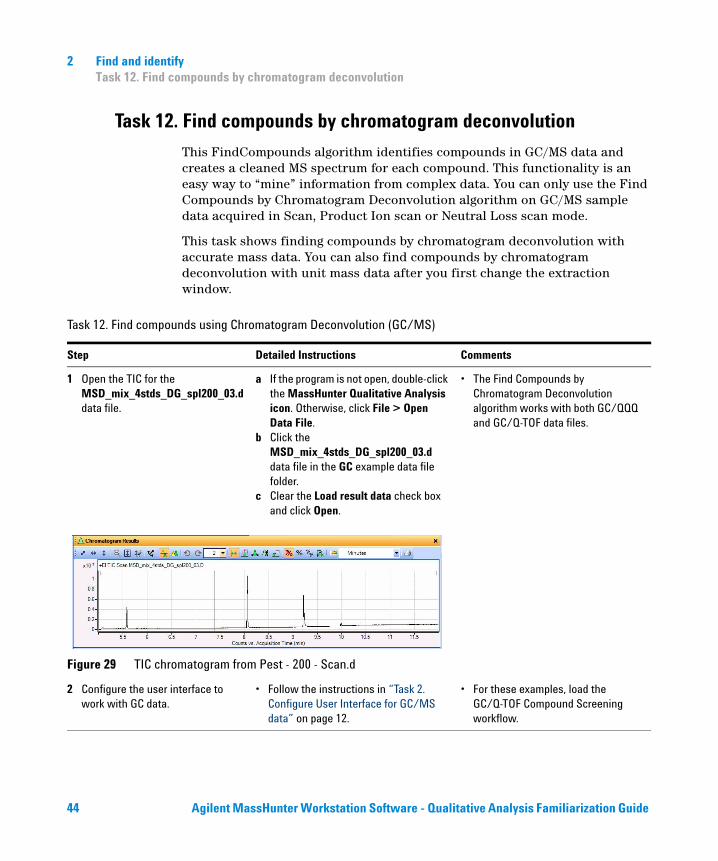
1 Open the TIC for the MSD_mix_4stds_DG_spl200_03.d data file.
a If the program is not open, double-click the MassHunter Qualitative Analysis icon. Otherwise, click File > Open Data File.
b Click the MSD_mix_4stds_DG_spl200_03.d data file in the GC example data file folder.
c Clear the Load result data check box and click Open.
• The Find Compounds by Chromatogram Deconvolution algorithm works with both GC/QQQ and GC/Q-TOF data files.
Figure 29 TIC chromatogram from Pest - 200 - Scan.d
2 Configure the user interface to work with GC data.
• Follow the instructions in “Task 2. Configure User Interface for GC/MS data” on page 12.
• For these examples, load the GC/Q-TOF Compound Screening workflow.
44 Agilent MassHunter Workstation Software - Qualitative Analysis Familiarization Guide
Find and identify 2Task 12. Find compounds by chromatogram deconvolution
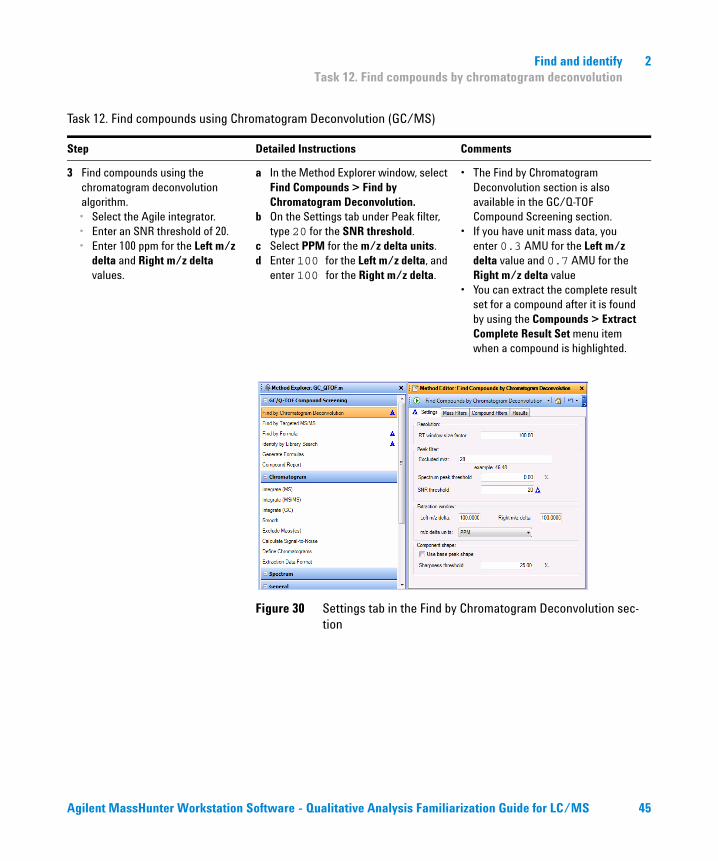
3 Find compounds using the chromatogram deconvolution algorithm.• Select the Agile integrator.• Enter an SNR threshold of 20.• Enter 100 ppm for the Left m/z
delta and Right m/z delta values.
a In the Method Explorer window, select Find Compounds > Find by Chromatogram Deconvolution.
b On the Settings tab under Peak filter, type 20 for the SNR threshold.
c Select PPM for the m/z delta units.d Enter 100 for the Left m/z delta, and
enter 100 for the Right m/z delta.
• The Find by Chromatogram Deconvolution section is also available in the GC/Q-TOF Compound Screening section.
• If you have unit mass data, you enter 0.3 AMU for the Left m/z delta value and 0.7 AMU for the Right m/z delta value
• You can extract the complete result set for a compound after it is found by using the Compounds > Extract Complete Result Set menu item when a compound is highlighted.
Figure 30 Settings tab in the Find by Chromatogram Deconvolution sec-tion
Task 12. Find compounds using Chromatogram Deconvolution (GC/MS)
Step Detailed Instructions Comments
Agilent MassHunter Workstation Software - Qualitative Analysis Familiarization Guide for LC/MS 45
2 Find and identifyTask 12. Find compounds by chromatogram deconvolution
• Select to extract EIC, MS spectra and MS/MS spectra.
e Click the Results tab.f Mark the Extract EIC, Extract ECC,
Extract cleaned spectrum and Extract raw spectrum check boxes.
g Click to run the Find Compounds by Chromatogram Deconvolution algorithm on the data file.
h If necessary, click the View > Compound List command.
• The Qualitative Analysis program finds 4 compounds under these conditions.
• If the data file is not indexed, it can take a long time when you run this algorithm.
4 Examine the compounds. See Figure 31 on page 47.
a Select 2 in the Maximum number of list panes box in the MS Spectrum Results toolbar.
b Click the Hide Empty Columns icon in the Compound List window.
c Click the first compound in the Data Navigator window.
d When the Data Navigator window is selected, use the arrow keys to switch compounds.
• Showing both spectra is a convenient way to display all the information for a single compound.
• Note that both the cleaned spectrum and the raw spectrum are shown.
Task 12. Find compounds using Chromatogram Deconvolution (GC/MS)
Step Detailed Instructions Comments
46 Agilent MassHunter Workstation Software - Qualitative Analysis Familiarization Guide
Find and identify 2Task 12. Find compounds by chromatogram deconvolution
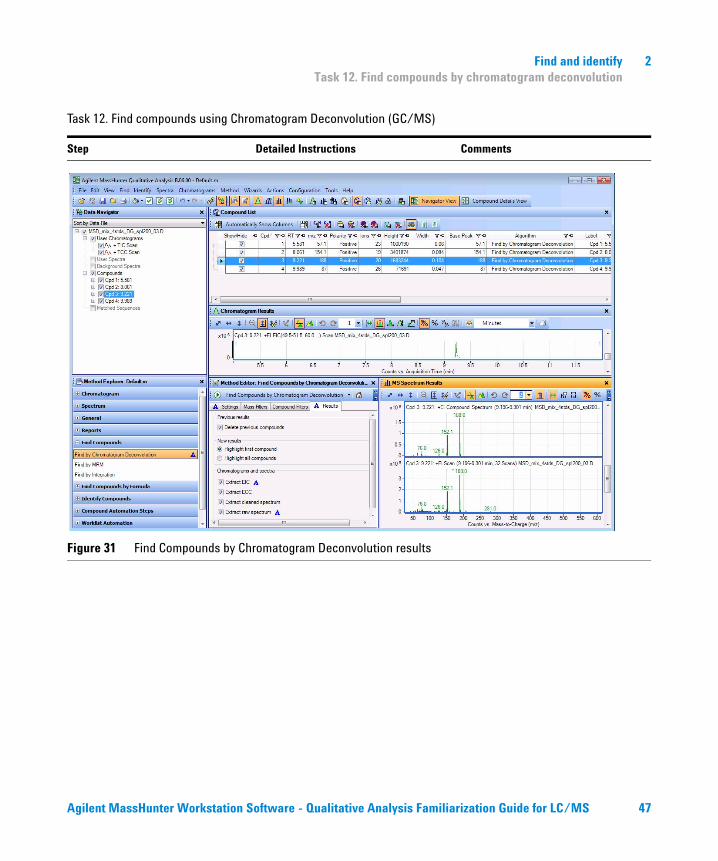
Figure 31 Find Compounds by Chromatogram Deconvolution results
Task 12. Find compounds using Chromatogram Deconvolution (GC/MS)
Step Detailed Instructions Comments
Agilent MassHunter Workstation Software - Qualitative Analysis Familiarization Guide for LC/MS 47
2 Find and identifyTask 13. Identify compounds using the Search Library algorithm
Task 13. Identify compounds using the Search Library algorithm
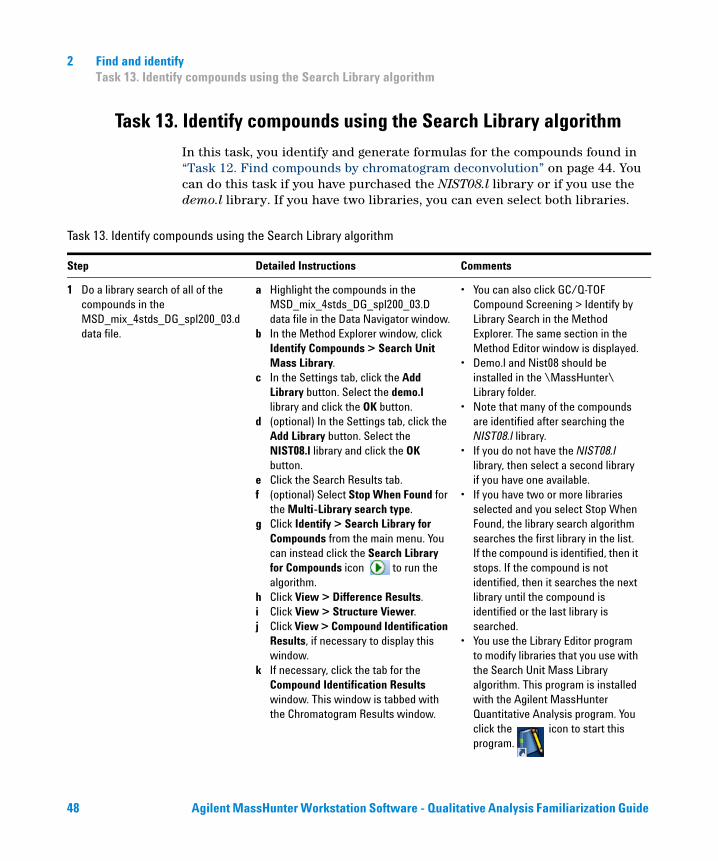
In this task, you identify and generate formulas for the compounds found in “Task 12. Find compounds by chromatogram deconvolution” on page 44. You can do this task if you have purchased the NIST08.l library or if you use the demo.l library. If you have two libraries, you can even select both libraries.
Task 13. Identify compounds using the Search Library algorithm
Step Detailed Instructions Comments
1 Do a library search of all of the compounds in the MSD_mix_4stds_DG_spl200_03.d data file.
a Highlight the compounds in the MSD_mix_4stds_DG_spl200_03.D data file in the Data Navigator window.
b In the Method Explorer window, click Identify Compounds > Search Unit Mass Library.
c In the Settings tab, click the Add Library button. Select the demo.l library and click the OK button.
d (optional) In the Settings tab, click the Add Library button. Select the NIST08.l library and click the OK button.
e Click the Search Results tab.f (optional) Select Stop When Found for
the Multi-Library search type.g Click Identify > Search Library for
Compounds from the main menu. You can instead click the Search Library for Compounds icon to run the algorithm.
h Click View > Difference Results.i Click View > Structure Viewer.j Click View > Compound Identification
Results, if necessary to display this window.
k If necessary, click the tab for the Compound Identification Results window. This window is tabbed with the Chromatogram Results window.
• You can also click GC/Q-TOF Compound Screening > Identify by Library Search in the Method Explorer. The same section in the Method Editor window is displayed.
• Demo.l and Nist08 should be installed in the \MassHunter\Library folder.
• Note that many of the compounds are identified after searching the NIST08.l library.
• If you do not have the NIST08.l library, then select a second library if you have one available.
• If you have two or more libraries selected and you select Stop When Found, the library search algorithm searches the first library in the list. If the compound is identified, then it stops. If the compound is not identified, then it searches the next library until the compound is identified or the last library is searched.
• You use the Library Editor program to modify libraries that you use with the Search Unit Mass Library algorithm. This program is installed with the Agilent MassHunter Quantitative Analysis program. You click the icon to start this program.
48 Agilent MassHunter Workstation Software - Qualitative Analysis Familiarization Guide
Find and identify 2Task 13. Identify compounds using the Search Library algorithm
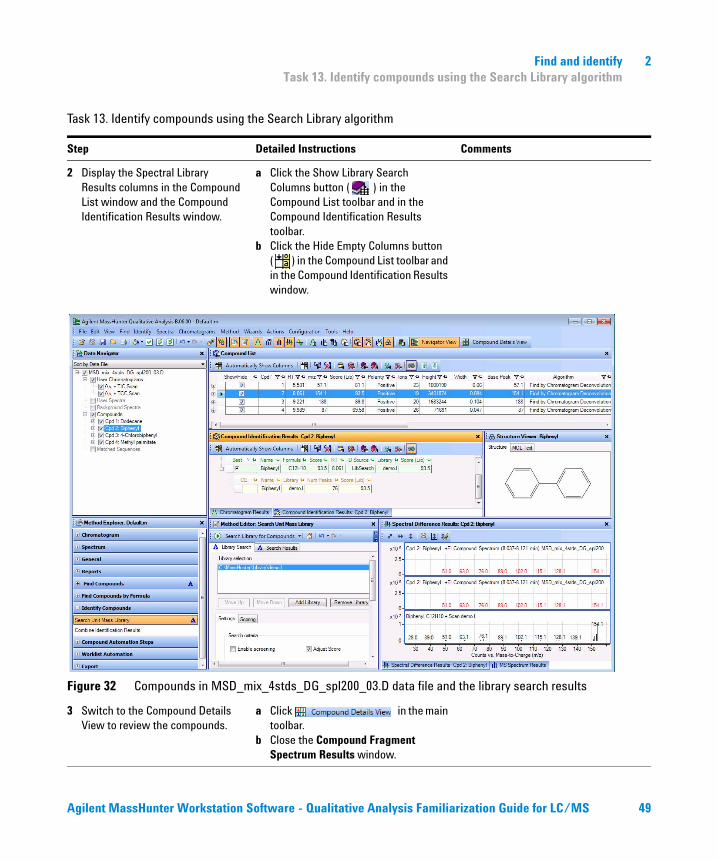
2 Display the Spectral Library Results columns in the Compound List window and the Compound Identification Results window.
a Click the Show Library Search Columns button ( ) in the Compound List toolbar and in the Compound Identification Results toolbar.
b Click the Hide Empty Columns button ( ) in the Compound List toolbar and in the Compound Identification Results window.
Figure 32 Compounds in MSD_mix_4stds_DG_spl200_03.D data file and the library search results
3 Switch to the Compound Details View to review the compounds.
a Click in the main toolbar.
b Close the Compound Fragment Spectrum Results window.
Task 13. Identify compounds using the Search Library algorithm
Step Detailed Instructions Comments
Agilent MassHunter Workstation Software - Qualitative Analysis Familiarization Guide for LC/MS 49
2 Find and identifyTask 13. Identify compounds using the Search Library algorithm
4 Review the results in the Compound Details View.
a Click the Overlaid icon in the Compound Chromatogram Results window.
b Expand the results in the Compound Identification Results window.
• You can find out more about the Compound Details View in the online Help. The Compound Details View is very useful when looking at the results of the Find by Formula algorithm with a data file acquired in All Ions mode.
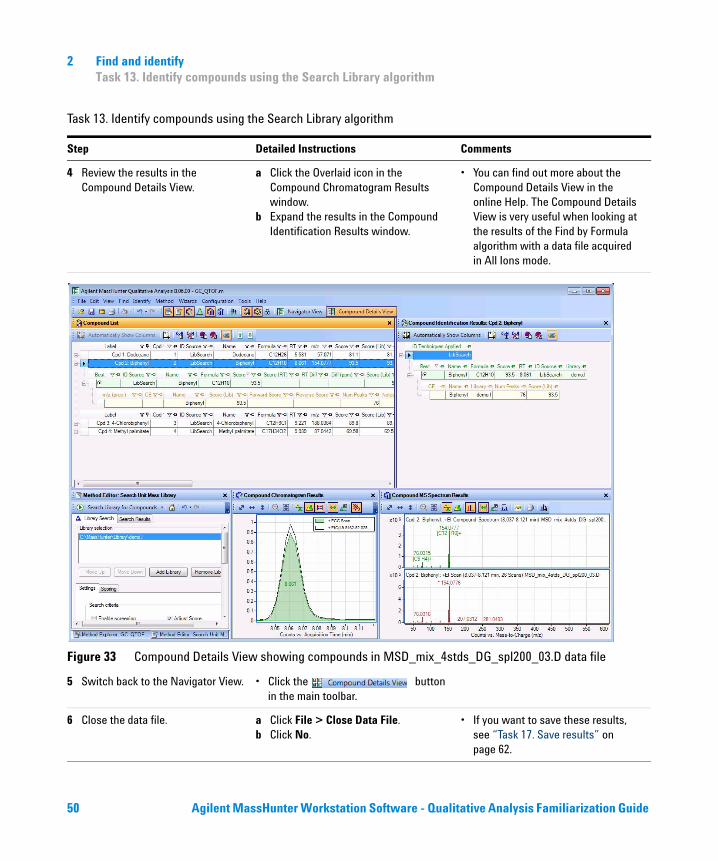
Figure 33 Compound Details View showing compounds in MSD_mix_4stds_DG_spl200_03.D data file
5 Switch back to the Navigator View. • Click the button in the main toolbar.
6 Close the data file. a Click File > Close Data File.b Click No.
• If you want to save these results, see “Task 17. Save results” on page 62.
Task 13. Identify compounds using the Search Library algorithm
Step Detailed Instructions Comments
50 Agilent MassHunter Workstation Software - Qualitative Analysis Familiarization Guide
Find and identify 2Task 14. Find compounds by MRM (MRM only)
Task 14. Find compounds by MRM (MRM only)
The Find Compounds by MRM algorithm identifies compounds in MRM data from a Triple Quadrupole. The algorithm searches for compounds using the MRM transitions. All of the compounds in the acquisition method are extracted and shown in the Compound List. Compounds are not eliminated based on chromatogram integration results. You can only use the Find Compounds by MRM algorithm on data that was acquired using MRM transitions. The MRM algorithm uses information that is found in the data file if the data file is an MRM data file.
Task 14. Find compounds using MRM (MRM only)
Step Detailed Instructions Comments
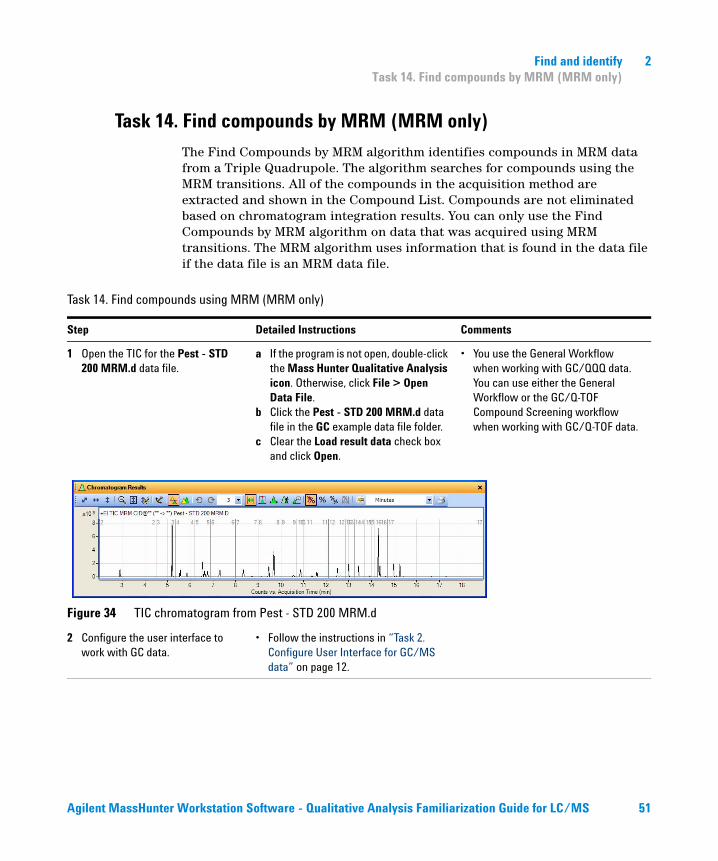
1 Open the TIC for the Pest - STD 200 MRM.d data file.
a If the program is not open, double-click the Mass Hunter Qualitative Analysis icon. Otherwise, click File > Open Data File.
b Click the Pest - STD 200 MRM.d data file in the GC example data file folder.
c Clear the Load result data check box and click Open.
• You use the General Workflow when working with GC/QQQ data. You can use either the General Workflow or the GC/Q-TOF Compound Screening workflow when working with GC/Q-TOF data.
Figure 34 TIC chromatogram from Pest - STD 200 MRM.d
2 Configure the user interface to work with GC data.
• Follow the instructions in “Task 2. Configure User Interface for GC/MS data” on page 12.
Agilent MassHunter Workstation Software - Qualitative Analysis Familiarization Guide for LC/MS 51
2 Find and identifyTask 14. Find compounds by MRM (MRM only)
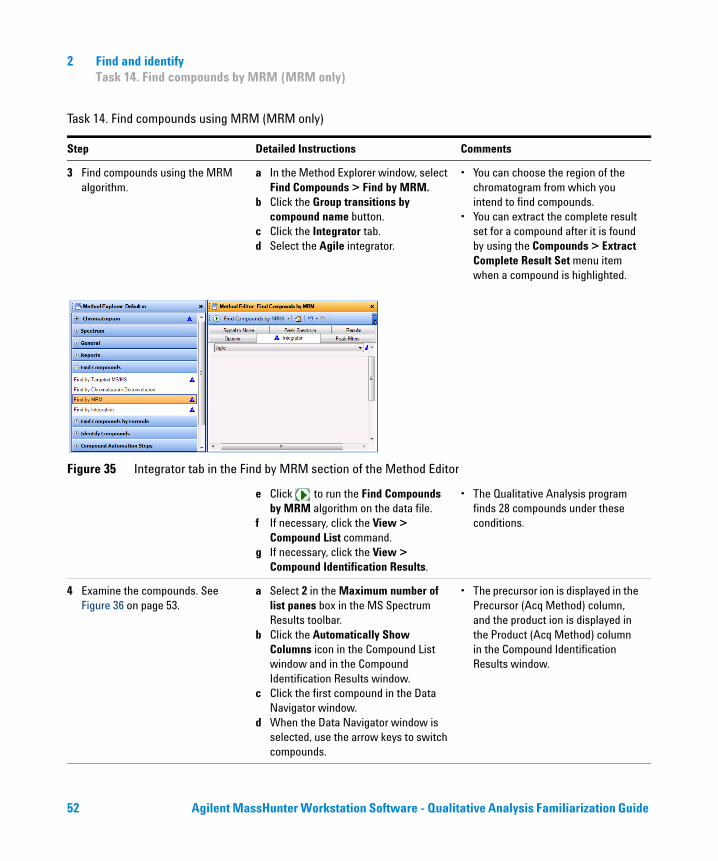
3 Find compounds using the MRM algorithm.
a In the Method Explorer window, select Find Compounds > Find by MRM.
b Click the Group transitions by compound name button.
c Click the Integrator tab.d Select the Agile integrator.
• You can choose the region of the chromatogram from which you intend to find compounds.
• You can extract the complete result set for a compound after it is found by using the Compounds > Extract Complete Result Set menu item when a compound is highlighted.
Figure 35 Integrator tab in the Find by MRM section of the Method Editor
e Click to run the Find Compounds by MRM algorithm on the data file.
f If necessary, click the View > Compound List command.
g If necessary, click the View > Compound Identification Results.
• The Qualitative Analysis program finds 28 compounds under these conditions.
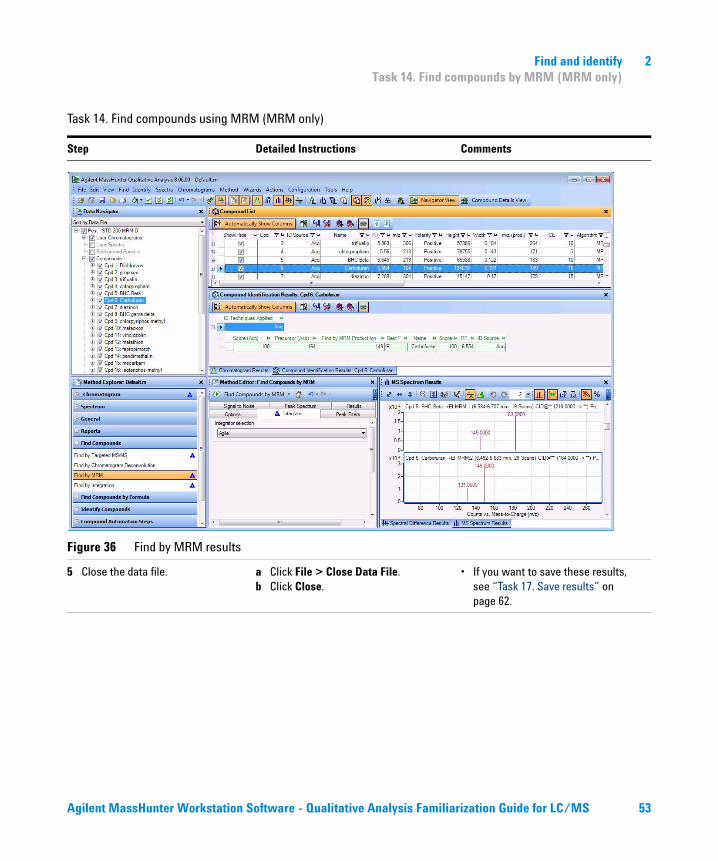
4 Examine the compounds. See Figure 36 on page 53.
a Select 2 in the Maximum number of list panes box in the MS Spectrum Results toolbar.
b Click the Automatically Show Columns icon in the Compound List window and in the Compound Identification Results window.
c Click the first compound in the Data Navigator window.
d When the Data Navigator window is selected, use the arrow keys to switch compounds.
• The precursor ion is displayed in the Precursor (Acq Method) column, and the product ion is displayed in the Product (Acq Method) column in the Compound Identification Results window.
Task 14. Find compounds using MRM (MRM only)
Step Detailed Instructions Comments
52 Agilent MassHunter Workstation Software - Qualitative Analysis Familiarization Guide
Find and identify 2Task 14. Find compounds by MRM (MRM only)
Figure 36 Find by MRM results
5 Close the data file. a Click File > Close Data File.b Click Close.
• If you want to save these results, see “Task 17. Save results” on page 62.
Task 14. Find compounds using MRM (MRM only)
Step Detailed Instructions Comments
Agilent MassHunter Workstation Software - Qualitative Analysis Familiarization Guide for LC/MS 53
2 Find and identifyTask 15. Find compounds by Integration
Task 15. Find compounds by Integration
The Find Compounds by Integration algorithm identifies compounds based on the integration results. A compound is created for each peak that is identified by the integrator.
Task 15. Find compounds using Integration
Step Detailed Instructions Comments
1 Open the TIC for the MSD_mix_4stds_DG_spl200_03.D data file.
a If the program is not open, double-click the Mass Hunter Qualitative Analysis icon. Otherwise, click File > Open Data File.
b Click the Pest - STD 200 MRM.d data file in the GC example data file folder.
c Clear the Load result data check box and click Open.
• You use the General Workflow when working with GC/QQQ data. You can use either the General Workflow or the GC/Q-TOF Compound Screening workflow when working with GC/Q-TOF data.
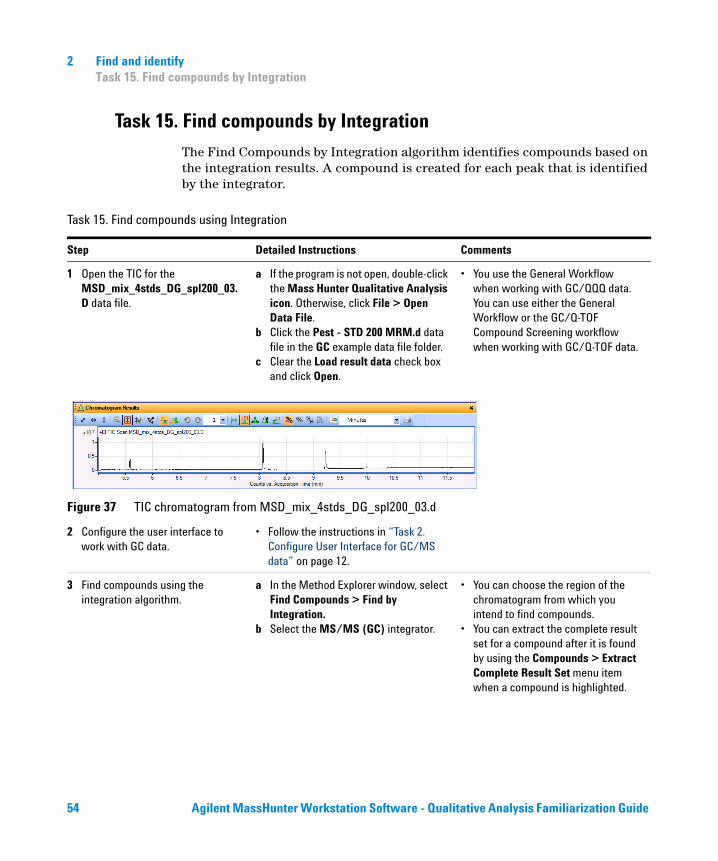
Figure 37 TIC chromatogram from MSD_mix_4stds_DG_spl200_03.d
2 Configure the user interface to work with GC data.
• Follow the instructions in “Task 2. Configure User Interface for GC/MS data” on page 12.
3 Find compounds using the integration algorithm.
a In the Method Explorer window, select Find Compounds > Find by Integration.
b Select the MS/MS (GC) integrator.
• You can choose the region of the chromatogram from which you intend to find compounds.
• You can extract the complete result set for a compound after it is found by using the Compounds > Extract Complete Result Set menu item when a compound is highlighted.
54 Agilent MassHunter Workstation Software - Qualitative Analysis Familiarization Guide
Find and identify 2Task 15. Find compounds by Integration
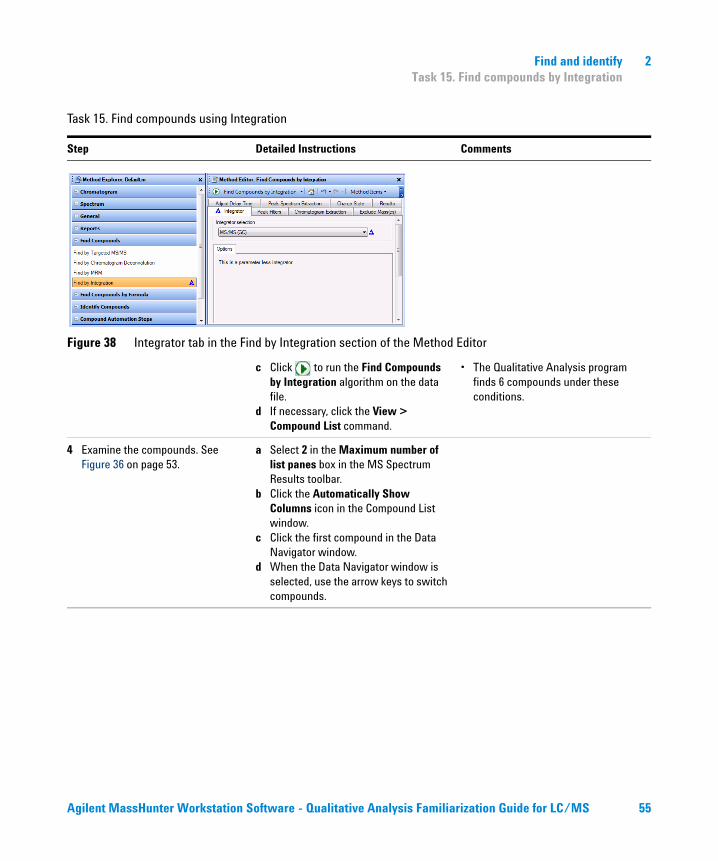
Figure 38 Integrator tab in the Find by Integration section of the Method Editor
c Click to run the Find Compounds by Integration algorithm on the data file.
d If necessary, click the View > Compound List command.
• The Qualitative Analysis program finds 6 compounds under these conditions.
4 Examine the compounds. See Figure 36 on page 53.
a Select 2 in the Maximum number of list panes box in the MS Spectrum Results toolbar.
b Click the Automatically Show Columns icon in the Compound List window.
c Click the first compound in the Data Navigator window.
d When the Data Navigator window is selected, use the arrow keys to switch compounds.
Task 15. Find compounds using Integration
Step Detailed Instructions Comments
Agilent MassHunter Workstation Software - Qualitative Analysis Familiarization Guide for LC/MS 55
2 Find and identifyTask 15. Find compounds by Integration
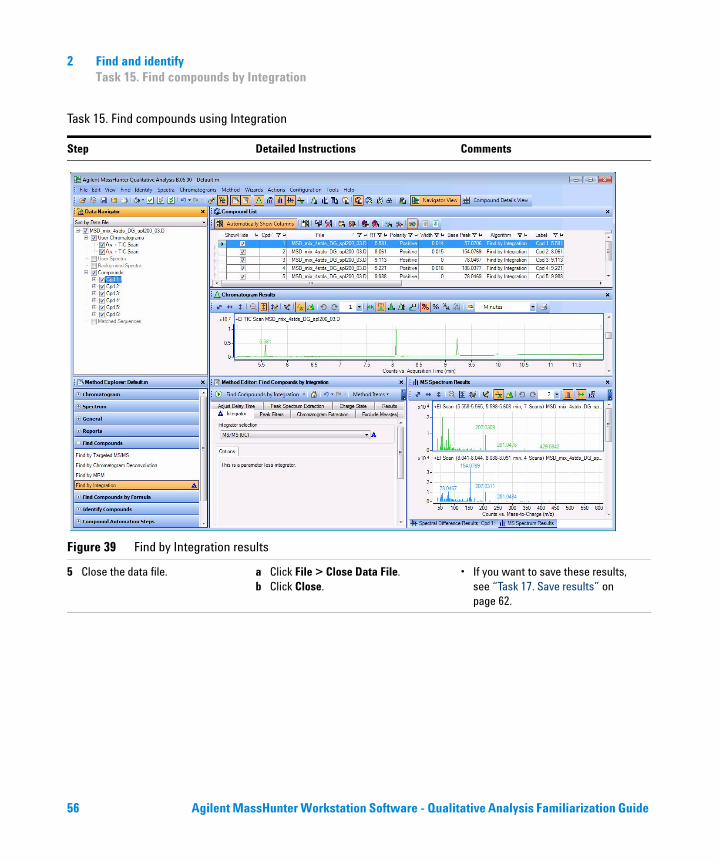
Figure 39 Find by Integration results
5 Close the data file. a Click File > Close Data File.b Click Close.
• If you want to save these results, see “Task 17. Save results” on page 62.
Task 15. Find compounds using Integration
Step Detailed Instructions Comments
56 Agilent MassHunter Workstation Software - Qualitative Analysis Familiarization Guide
Find and identify 2Task 16. Generate formulas and search library for peak spectra
Task 16. Generate formulas and search library for peak spectra
In this task, you first integrate and extract peak spectra from a GC/Q-TOF data file. Then, you generate possible formulas for each of the peak spectra.
Task 16. Generate formulas and search library for peak spectra
Step Detailed Instructions Comments
1 Open the TIC for the MSD_mix_4stds_DB_spl200_03.d data file.
a If the program is not open, double-click the Mass Hunter Qualitative Analysis icon. Otherwise, click File > Open Data File.
b Click the MSD_mix_4stds_DB_spl200_03.d data file in the GC example data file folder.
c Clear the Load result data check box and click Open.
• If the Load result data check box is not available, then no results have been saved in the data file. See “Task 17. Save results” on page 62 for instructions on how to save results.
2 Integrate and extract peak spectra. a Click the Chromatograms > Integrate (MS) section in the Method Explorer window.
b Click the Peak Filters tab.c Click the Peak height button.d Mark the Relative height check box.e Mark the Limit (by height) to the
largest check box and type 4.f Click Chromatograms > Integrate and
Extract Peak Spectra.
Agilent MassHunter Workstation Software - Qualitative Analysis Familiarization Guide for LC/MS 57
2 Find and identifyTask 16. Generate formulas and search library for peak spectra
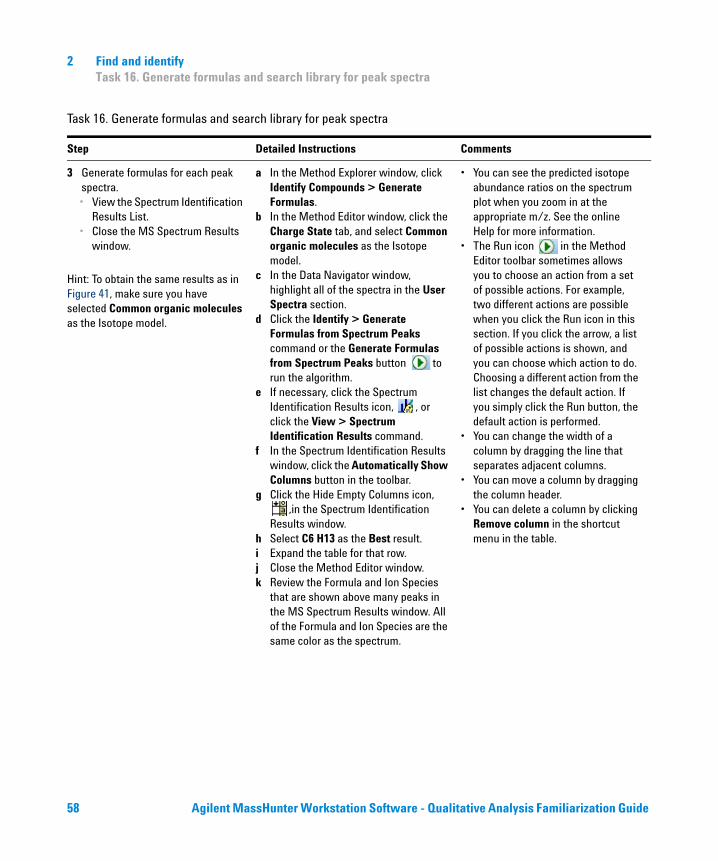
3 Generate formulas for each peak spectra.• View the Spectrum Identification
Results List.• Close the MS Spectrum Results
window.
Hint: To obtain the same results as in Figure 41, make sure you have selected Common organic molecules as the Isotope model.
a In the Method Explorer window, click Identify Compounds > Generate Formulas.
b In the Method Editor window, click the Charge State tab, and select Common organic molecules as the Isotope model.
c In the Data Navigator window, highlight all of the spectra in the User Spectra section.
d Click the Identify > Generate Formulas from Spectrum Peaks command or the Generate Formulas from Spectrum Peaks button to run the algorithm.
e If necessary, click the Spectrum Identification Results icon, , or click the View > Spectrum Identification Results command.
f In the Spectrum Identification Results window, click the Automatically Show Columns button in the toolbar.
g Click the Hide Empty Columns icon, ,in the Spectrum Identification
Results window.h Select C6 H13 as the Best result.i Expand the table for that row.j Close the Method Editor window.k Review the Formula and Ion Species
that are shown above many peaks in the MS Spectrum Results window. All of the Formula and Ion Species are the same color as the spectrum.
• You can see the predicted isotope abundance ratios on the spectrum plot when you zoom in at the appropriate m/z. See the online Help for more information.
• The Run icon in the Method Editor toolbar sometimes allows you to choose an action from a set of possible actions. For example, two different actions are possible when you click the Run icon in this section. If you click the arrow, a list of possible actions is shown, and you can choose which action to do. Choosing a different action from the list changes the default action. If you simply click the Run button, the default action is performed.
• You can change the width of a column by dragging the line that separates adjacent columns.
• You can move a column by dragging the column header.
• You can delete a column by clicking Remove column in the shortcut menu in the table.
Task 16. Generate formulas and search library for peak spectra
Step Detailed Instructions Comments
58 Agilent MassHunter Workstation Software - Qualitative Analysis Familiarization Guide
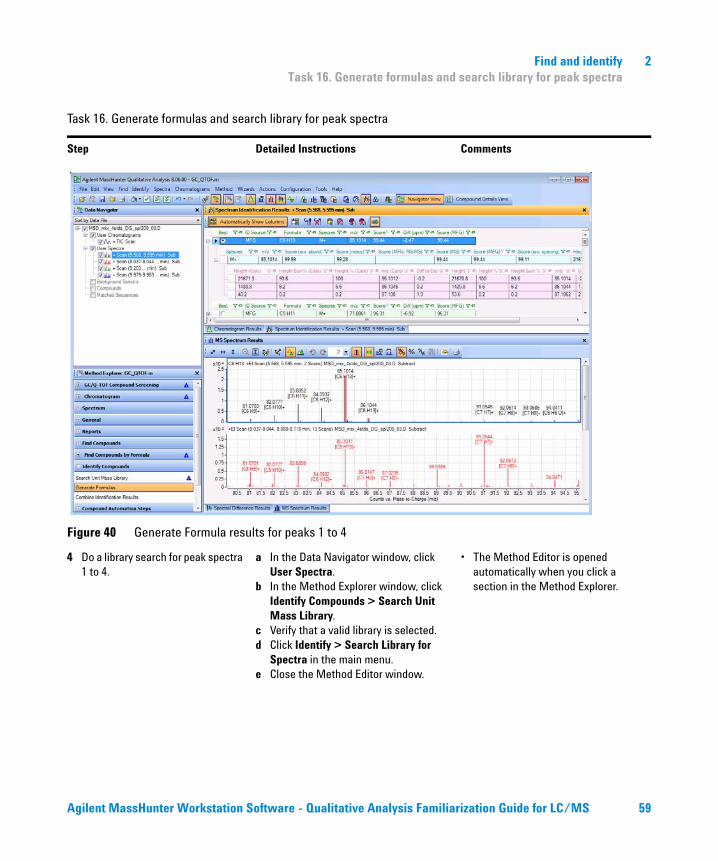
Find and identify 2Task 16. Generate formulas and search library for peak spectra
Figure 40 Generate Formula results for peaks 1 to 4
4 Do a library search for peak spectra 1 to 4.
a In the Data Navigator window, click User Spectra.
b In the Method Explorer window, click Identify Compounds > Search Unit Mass Library.
c Verify that a valid library is selected.d Click Identify > Search Library for
Spectra in the main menu.e Close the Method Editor window.
• The Method Editor is opened automatically when you click a section in the Method Explorer.
Task 16. Generate formulas and search library for peak spectra
Step Detailed Instructions Comments
Agilent MassHunter Workstation Software - Qualitative Analysis Familiarization Guide for LC/MS 59
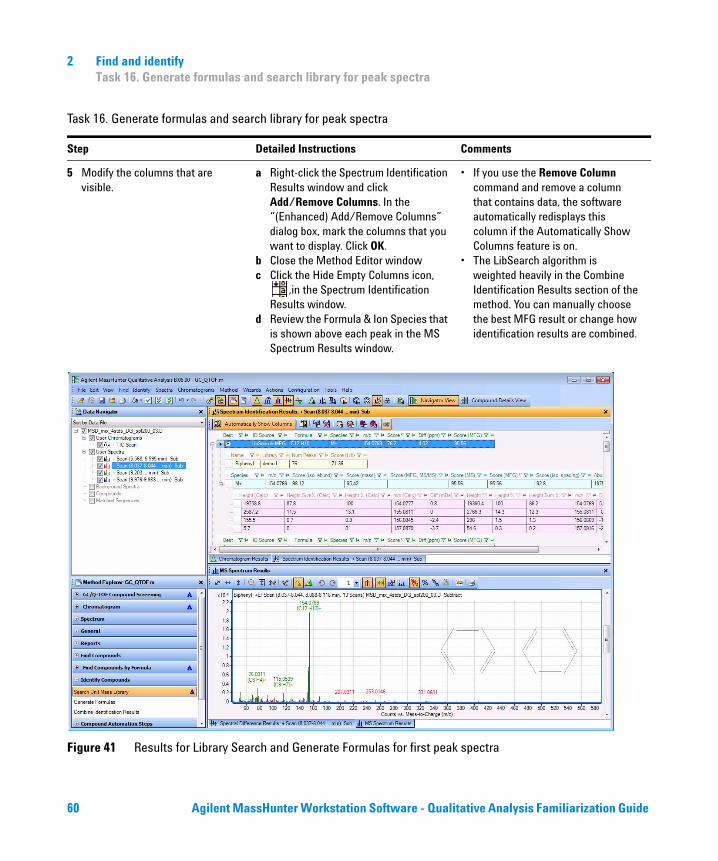
2 Find and identifyTask 16. Generate formulas and search library for peak spectra
5 Modify the columns that are visible.
a Right-click the Spectrum Identification Results window and click Add/Remove Columns. In the “(Enhanced) Add/Remove Columns” dialog box, mark the columns that you want to display. Click OK.
b Close the Method Editor windowc Click the Hide Empty Columns icon,
,in the Spectrum Identification Results window.
d Review the Formula & Ion Species that is shown above each peak in the MS Spectrum Results window.
• If you use the Remove Column command and remove a column that contains data, the software automatically redisplays this column if the Automatically Show Columns feature is on.
• The LibSearch algorithm is weighted heavily in the Combine Identification Results section of the method. You can manually choose the best MFG result or change how identification results are combined.
Figure 41 Results for Library Search and Generate Formulas for first peak spectra
Task 16. Generate formulas and search library for peak spectra
Step Detailed Instructions Comments
60 Agilent MassHunter Workstation Software - Qualitative Analysis Familiarization Guide
Find and identify 2Task 16. Generate formulas and search library for peak spectra
6 Review results for each spectrum in the MS Peaks One window.
a Click View >MS Spectrum Peak List 1.
b Right-click and click Add/Remove Columns.
c Verify that the columns shown in Figure 42 are in the Show these columns list.
d Sort by the Ion Type column.e If the Ion Type is Fragment Ion, then
the Formula & Ion Species is shown in green on each peak in the MS Spectrum Results window.
• The fragment ions are displayed in green in the MS Spectrum Results window.
• The Ion Type can be Molecular Ion, Fragment Ion or blank. If it is a Fragment Ion, then the Loss Formula and Loss Mass column shows the Formula and Mass that accounts for getting to that ion from the Molecular Ion. The Formula & Ion Species shows the formula and ion species for that ion.
Figure 42 MS Peaks One table with Ion Type, Loss Formula, Loss Mass, and Formula & Ion Species columns
7 (optional) Close the data file.• You can proceed to the next task
to learn how to save results.
a Click File > Close Data File.b Click Close.
• If you want to save these results, see “Task 17. Save results” on page 62.
Task 16. Generate formulas and search library for peak spectra
Step Detailed Instructions Comments
Agilent MassHunter Workstation Software - Qualitative Analysis Familiarization Guide for LC/MS 61
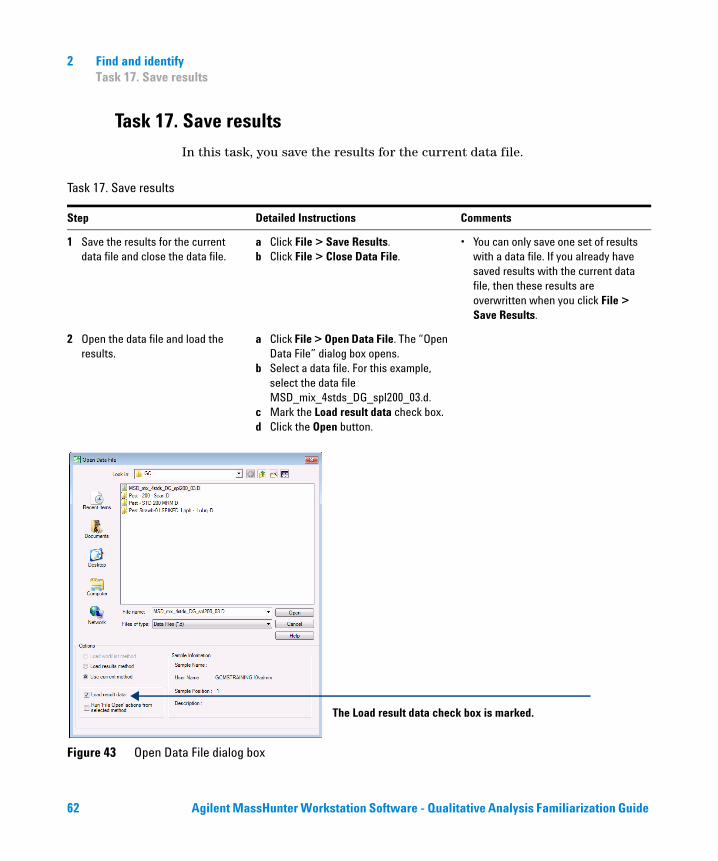
2 Find and identifyTask 17. Save results
Task 17. Save results
In this task, you save the results for the current data file.
Task 17. Save results
Step Detailed Instructions Comments
1 Save the results for the current data file and close the data file.
a Click File > Save Results.b Click File > Close Data File.
• You can only save one set of results with a data file. If you already have saved results with the current data file, then these results are overwritten when you click File > Save Results.
2 Open the data file and load the results.
a Click File > Open Data File. The “Open Data File” dialog box opens.
b Select a data file. For this example, select the data file MSD_mix_4stds_DG_spl200_03.d.
c Mark the Load result data check box.d Click the Open button.
Figure 43 Open Data File dialog box
The Load result data check box is marked.
62 Agilent MassHunter Workstation Software - Qualitative Analysis Familiarization Guide
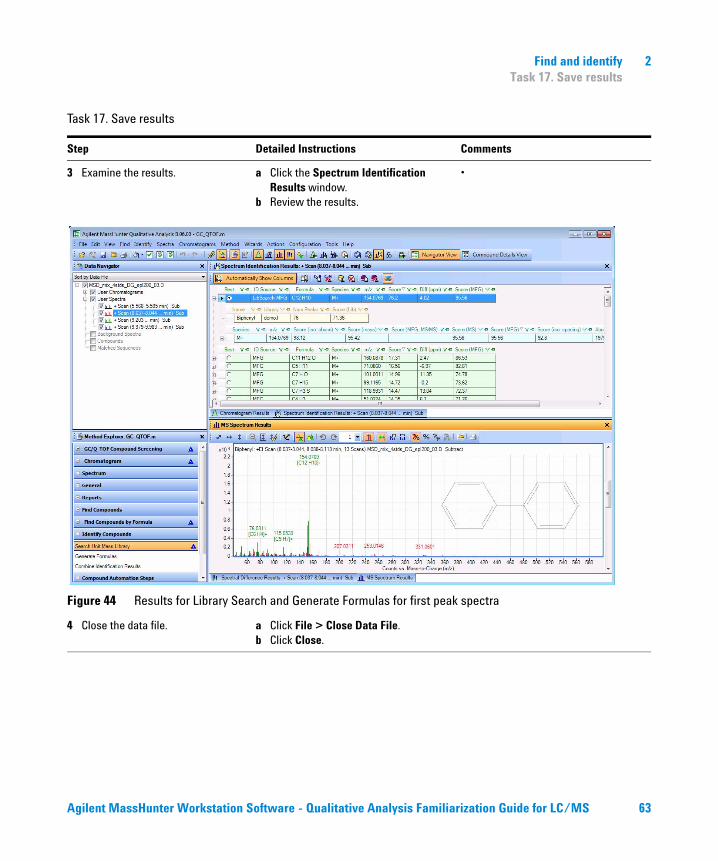
Find and identify 2Task 17. Save results
3 Examine the results. a Click the Spectrum Identification Results window.
b Review the results.
•
Figure 44 Results for Library Search and Generate Formulas for first peak spectra
4 Close the data file. a Click File > Close Data File.b Click Close.
Task 17. Save results
Step Detailed Instructions Comments
Agilent MassHunter Workstation Software - Qualitative Analysis Familiarization Guide for LC/MS 63
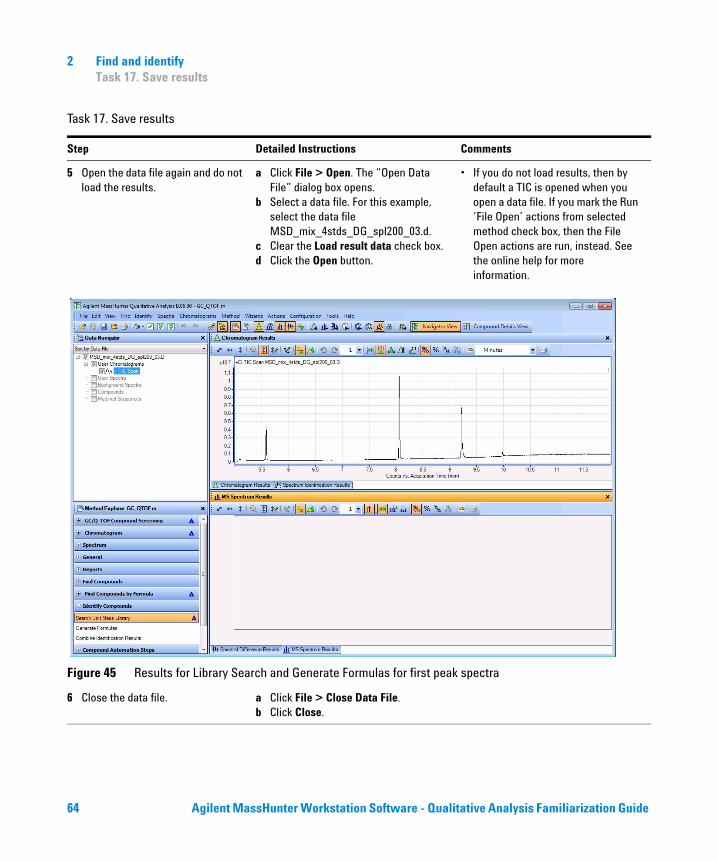
2 Find and identifyTask 17. Save results
5 Open the data file again and do not load the results.
a Click File > Open. The “Open Data File” dialog box opens.
b Select a data file. For this example, select the data file MSD_mix_4stds_DG_spl200_03.d.
c Clear the Load result data check box.d Click the Open button.
• If you do not load results, then by default a TIC is opened when you open a data file. If you mark the Run ‘File Open’ actions from selected method check box, then the File Open actions are run, instead. See the online help for more information.
Figure 45 Results for Library Search and Generate Formulas for first peak spectra
6 Close the data file. a Click File > Close Data File.b Click Close.
Task 17. Save results
Step Detailed Instructions Comments
64 Agilent MassHunter Workstation Software - Qualitative Analysis Familiarization Guide
Agilent MassHunter Workstation Software Qualitative AnalysisFamiliarization Guide
3Use workflows, export and print
Task 18. Set up and run a qualitative analysis method using the general workflow 66
Task 19. Set up and run a method using the GC/Q-TOF Compound Screening workflow 71
Task 20. Export a CEF file 74
Task 21. Print an analysis report 75
Task 22. Print a compound report 78
In these tasks, you learn to set up and run a qualitative analysis method. Then you run the actions within the automated method when you open a data file.
Two different workflows are used for these examples. See “Workflows” on page 89 for more information.
The General workflow supports GC/QQQ, GC/Q-TOF and LC/MS data. The GC/Q-TOF Compound Screening workflow supports GC/Q-TOF data.
Each exercise is presented in a table with three columns:
• Steps – Use these general instructions to proceed on your own to explore the program.
• Detailed Instructions – Use these if you need help or prefer to use a step-by-step learning process.
• Comments – Read these to learn tips and additional information about each step in the exercise.
65
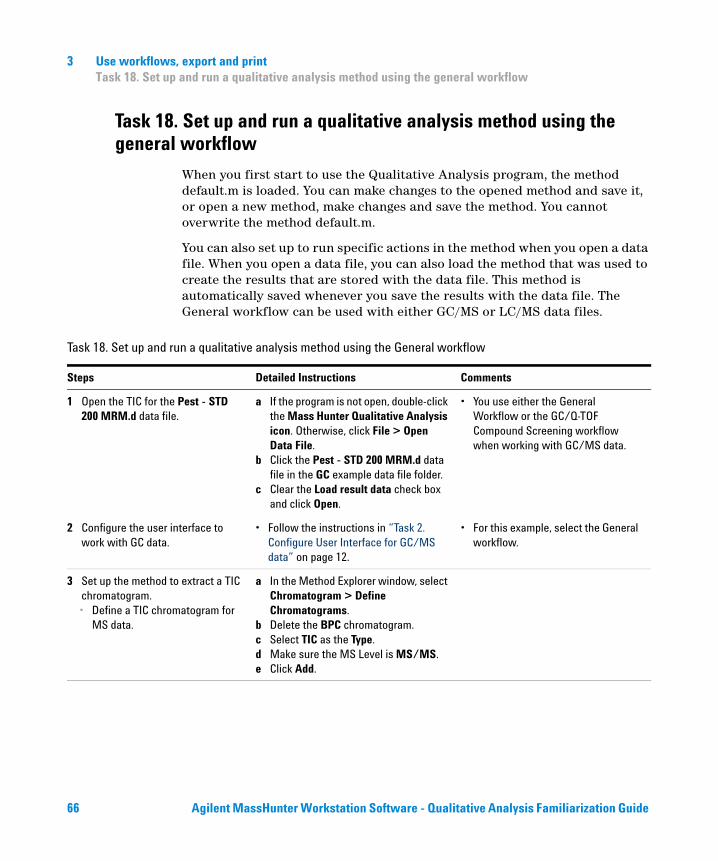
3 Use workflows, export and printTask 18. Set up and run a qualitative analysis method using the general workflow
Task 18. Set up and run a qualitative analysis method using the general workflow
When you first start to use the Qualitative Analysis program, the method default.m is loaded. You can make changes to the opened method and save it, or open a new method, make changes and save the method. You cannot overwrite the method default.m.
You can also set up to run specific actions in the method when you open a data file. When you open a data file, you can also load the method that was used to create the results that are stored with the data file. This method is automatically saved whenever you save the results with the data file. The General workflow can be used with either GC/MS or LC/MS data files.
Task 18. Set up and run a qualitative analysis method using the General workflow
Steps Detailed Instructions Comments
1 Open the TIC for the Pest - STD 200 MRM.d data file.
a If the program is not open, double-click the Mass Hunter Qualitative Analysis icon. Otherwise, click File > Open Data File.
b Click the Pest - STD 200 MRM.d data file in the GC example data file folder.
c Clear the Load result data check box and click Open.
• You use either the General Workflow or the GC/Q-TOF Compound Screening workflow when working with GC/MS data.
2 Configure the user interface to work with GC data.
• Follow the instructions in “Task 2. Configure User Interface for GC/MS data” on page 12.
• For this example, select the General workflow.
3 Set up the method to extract a TIC chromatogram. • Define a TIC chromatogram for
MS data.
a In the Method Explorer window, select Chromatogram > Define Chromatograms.
b Delete the BPC chromatogram.c Select TIC as the Type.d Make sure the MS Level is MS/MS.e Click Add.
66 Agilent MassHunter Workstation Software - Qualitative Analysis Familiarization Guide
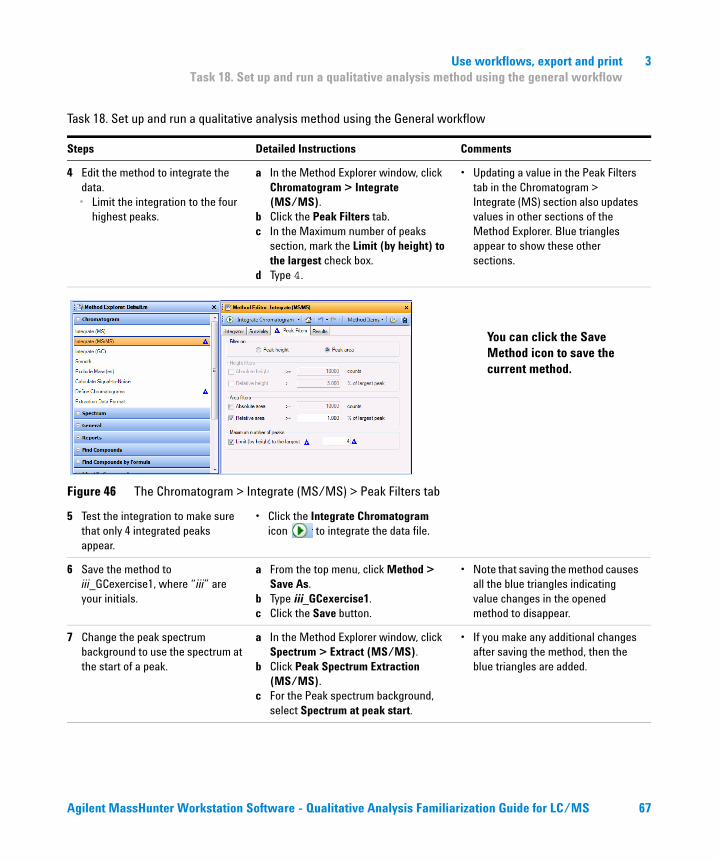
Use workflows, export and print 3Task 18. Set up and run a qualitative analysis method using the general workflow
4 Edit the method to integrate the data.• Limit the integration to the four
highest peaks.
a In the Method Explorer window, click Chromatogram > Integrate (MS/MS).
b Click the Peak Filters tab.c In the Maximum number of peaks
section, mark the Limit (by height) to the largest check box.
d Type 4.
• Updating a value in the Peak Filters tab in the Chromatogram > Integrate (MS) section also updates values in other sections of the Method Explorer. Blue triangles appear to show these other sections.
Figure 46 The Chromatogram > Integrate (MS/MS) > Peak Filters tab
5 Test the integration to make sure that only 4 integrated peaks appear.
• Click the Integrate Chromatogram icon to integrate the data file.
6 Save the method to iii_GCexercise1, where “iii” are your initials.
a From the top menu, click Method > Save As.
b Type iii_GCexercise1.c Click the Save button.
• Note that saving the method causes all the blue triangles indicating value changes in the opened method to disappear.
7 Change the peak spectrum background to use the spectrum at the start of a peak.
a In the Method Explorer window, click Spectrum > Extract (MS/MS).
b Click Peak Spectrum Extraction (MS/MS).
c For the Peak spectrum background, select Spectrum at peak start.
• If you make any additional changes after saving the method, then the blue triangles are added.
Task 18. Set up and run a qualitative analysis method using the General workflow
Steps Detailed Instructions Comments
You can click the Save Method icon to save the current method.
Agilent MassHunter Workstation Software - Qualitative Analysis Familiarization Guide for LC/MS 67
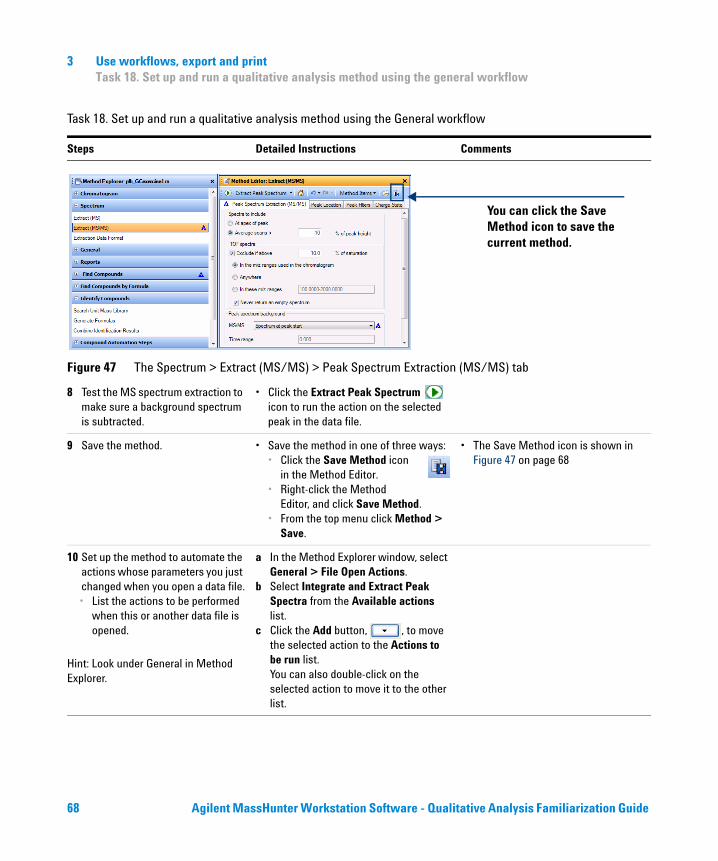
3 Use workflows, export and printTask 18. Set up and run a qualitative analysis method using the general workflow
Figure 47 The Spectrum > Extract (MS/MS) > Peak Spectrum Extraction (MS/MS) tab
8 Test the MS spectrum extraction to make sure a background spectrum is subtracted.
• Click the Extract Peak Spectrum icon to run the action on the selected peak in the data file.
9 Save the method. • Save the method in one of three ways:• Click the Save Method icon
in the Method Editor.• Right-click the Method
Editor, and click Save Method.• From the top menu click Method >
Save.
• The Save Method icon is shown in Figure 47 on page 68
10 Set up the method to automate the actions whose parameters you just changed when you open a data file.• List the actions to be performed
when this or another data file is opened.
Hint: Look under General in Method Explorer.
a In the Method Explorer window, select General > File Open Actions.
b Select Integrate and Extract Peak Spectra from the Available actions list.
c Click the Add button, , to move the selected action to the Actions to be run list. You can also double-click on the selected action to move it to the other list.
Task 18. Set up and run a qualitative analysis method using the General workflow
Steps Detailed Instructions Comments
You can click the Save Method icon to save the current method.
68 Agilent MassHunter Workstation Software - Qualitative Analysis Familiarization Guide
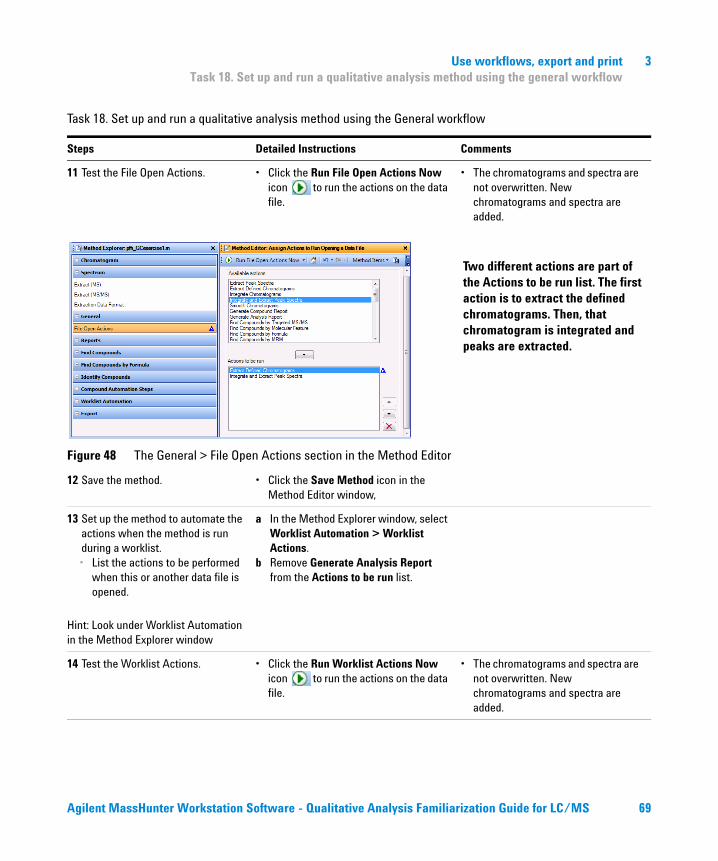
Use workflows, export and print 3Task 18. Set up and run a qualitative analysis method using the general workflow
11 Test the File Open Actions. • Click the Run File Open Actions Now icon to run the actions on the data file.
• The chromatograms and spectra are not overwritten. New chromatograms and spectra are added.
Figure 48 The General > File Open Actions section in the Method Editor
12 Save the method. • Click the Save Method icon in the Method Editor window,
13 Set up the method to automate the actions when the method is run during a worklist.• List the actions to be performed
when this or another data file is opened.
Hint: Look under Worklist Automation in the Method Explorer window
a In the Method Explorer window, select Worklist Automation > Worklist Actions.
b Remove Generate Analysis Report from the Actions to be run list.
14 Test the Worklist Actions. • Click the Run Worklist Actions Now icon to run the actions on the data file.
• The chromatograms and spectra are not overwritten. New chromatograms and spectra are added.
Task 18. Set up and run a qualitative analysis method using the General workflow
Steps Detailed Instructions Comments
Two different actions are part of the Actions to be run list. The first action is to extract the defined chromatograms. Then, that chromatogram is integrated and peaks are extracted.
Agilent MassHunter Workstation Software - Qualitative Analysis Familiarization Guide for LC/MS 69
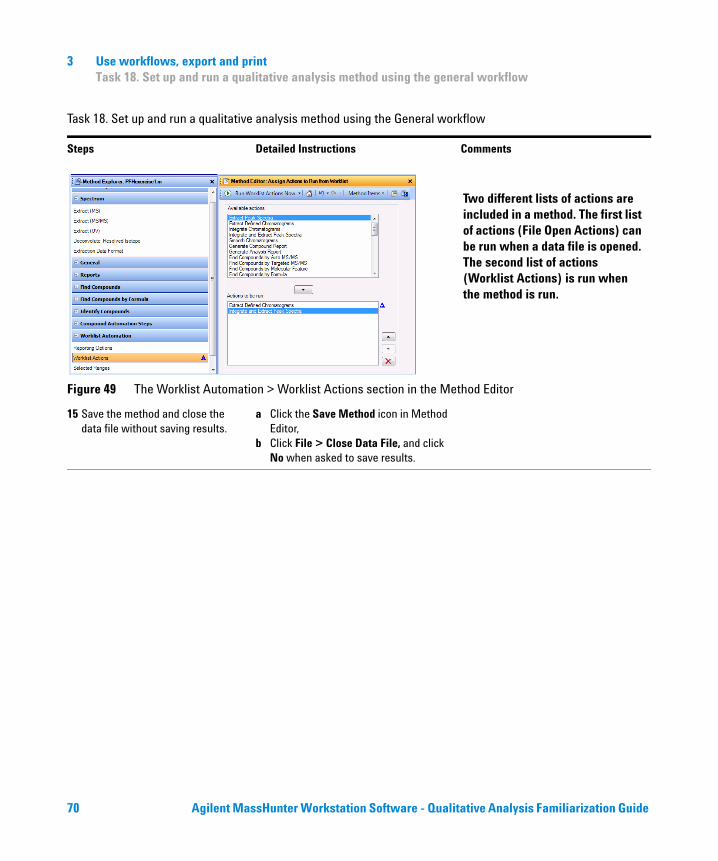
3 Use workflows, export and printTask 18. Set up and run a qualitative analysis method using the general workflow
Figure 49 The Worklist Automation > Worklist Actions section in the Method Editor
15 Save the method and close the data file without saving results.
a Click the Save Method icon in Method Editor,
b Click File > Close Data File, and click No when asked to save results.
Task 18. Set up and run a qualitative analysis method using the General workflow
Steps Detailed Instructions Comments
Two different lists of actions are included in a method. The first list of actions (File Open Actions) can be run when a data file is opened. The second list of actions (Worklist Actions) is run when the method is run.
70 Agilent MassHunter Workstation Software - Qualitative Analysis Familiarization Guide
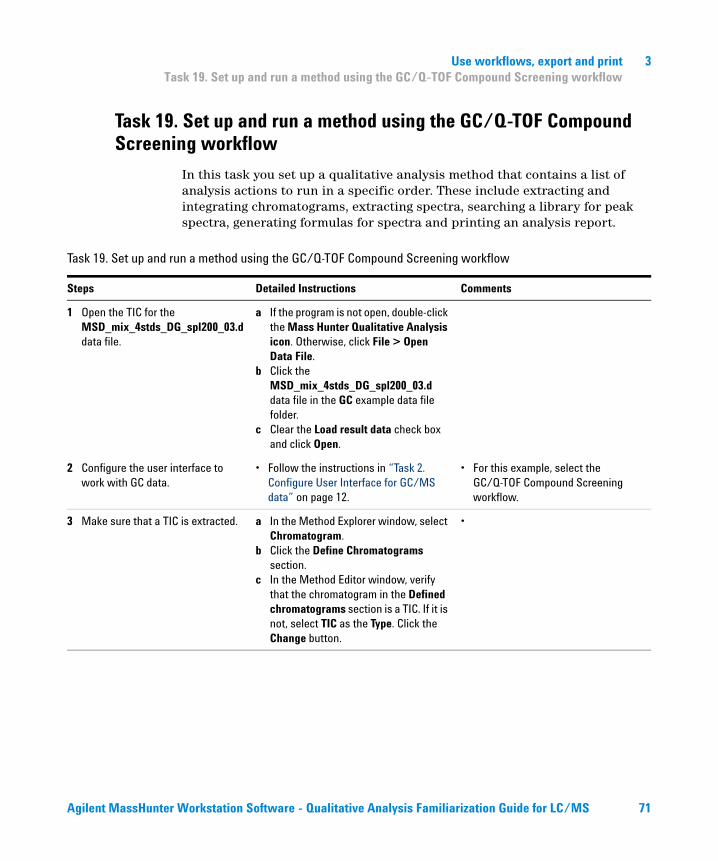
Use workflows, export and print 3Task 19. Set up and run a method using the GC/Q-TOF Compound Screening workflow
Task 19. Set up and run a method using the GC/Q-TOF Compound Screening workflow
In this task you set up a qualitative analysis method that contains a list of analysis actions to run in a specific order. These include extracting and integrating chromatograms, extracting spectra, searching a library for peak spectra, generating formulas for spectra and printing an analysis report.
Task 19. Set up and run a method using the GC/Q-TOF Compound Screening workflow
Steps Detailed Instructions Comments
1 Open the TIC for the MSD_mix_4stds_DG_spl200_03.d data file.
a If the program is not open, double-click the Mass Hunter Qualitative Analysis icon. Otherwise, click File > Open Data File.
b Click the MSD_mix_4stds_DG_spl200_03.d data file in the GC example data file folder.
c Clear the Load result data check box and click Open.
2 Configure the user interface to work with GC data.
• Follow the instructions in “Task 2. Configure User Interface for GC/MS data” on page 12.
• For this example, select the GC/Q-TOF Compound Screening workflow.
3 Make sure that a TIC is extracted. a In the Method Explorer window, select Chromatogram.
b Click the Define Chromatograms section.
c In the Method Editor window, verify that the chromatogram in the Defined chromatograms section is a TIC. If it is not, select TIC as the Type. Click the Change button.
•
Agilent MassHunter Workstation Software - Qualitative Analysis Familiarization Guide for LC/MS 71
3 Use workflows, export and printTask 19. Set up and run a method using the GC/Q-TOF Compound Screening workflow
4 Review parameters for the Find by Chromatogram Deconvolution algorithm.
a Click the GC/Q-TOF Compound Screening > Find by Chromatogram Deconvolution section in the Method Explorer window.
b Click the Mass Filter tab.c Set the Absolute height value to 13000.
d Click the Results tab.e Click the Highlight all compounds
button.f Review the results on each tab.
• Look at the sections for the GC/Q-TOF Compound Screening workflow.
• Note the six sections in this workflow. All of these sections are duplicates of sections that are already part of the method explorer.
• Note that blue triangles appear in other sections of Method Explorer. These indicate that the same parameter values have been changed elsewhere as well.
5 Review parameters for the Identify by Library Search algorithm.
a Click the GC/Q-TOF Compound Screening > Identify by library search section in the Method Explorer window.
b Click the Add Library button. Select a library and click Open.
c (optional) Click the Remove Library button to remove a library if you do not want to use it.
d Review the parameters on each tab.
• Either the demo.l library or the NIST08.l (or other version of the NIST library) is installed in the \MassHunter\Library folder.
6 Save the method to iii_GCexercise2, where “iii” are your initials.
a From the top menu, click Method > Save As.
b Type iii_GCexercise2.c Click the Save button.
7 Set up the method to automate the actions when a data file is opened.• List the actions to be performed
when this or another data file is opened.
Hint: Look under General in the Method Explorer window
a In the Method Explorer window, select General > File Open Actions.
b Remove Generate Analysis Report from the Actions to be run list.
c Remove Integrate and Extract Peak Spectra.
d Remove any other actions in the list.e Add Extract Defined Chromatograms.f Add Find Compounds by
Chromatographic Deconvolution.g Add Search Spectral Library for
Compound.
Task 19. Set up and run a method using the GC/Q-TOF Compound Screening workflow
Steps Detailed Instructions Comments
72 Agilent MassHunter Workstation Software - Qualitative Analysis Familiarization Guide
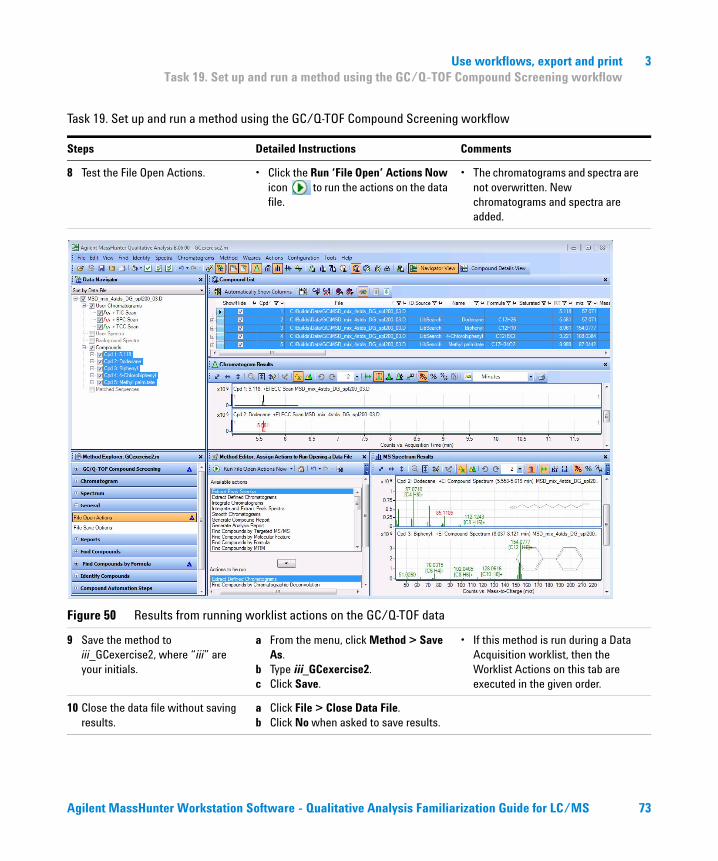
Use workflows, export and print 3Task 19. Set up and run a method using the GC/Q-TOF Compound Screening workflow
8 Test the File Open Actions. • Click the Run ‘File Open’ Actions Now icon to run the actions on the data file.
• The chromatograms and spectra are not overwritten. New chromatograms and spectra are added.
Figure 50 Results from running worklist actions on the GC/Q-TOF data
9 Save the method to iii_GCexercise2, where “iii” are your initials.
a From the menu, click Method > Save As.
b Type iii_GCexercise2.c Click Save.
• If this method is run during a Data Acquisition worklist, then the Worklist Actions on this tab are executed in the given order.
10 Close the data file without saving results.
a Click File > Close Data File.b Click No when asked to save results.
Task 19. Set up and run a method using the GC/Q-TOF Compound Screening workflow
Steps Detailed Instructions Comments
Agilent MassHunter Workstation Software - Qualitative Analysis Familiarization Guide for LC/MS 73
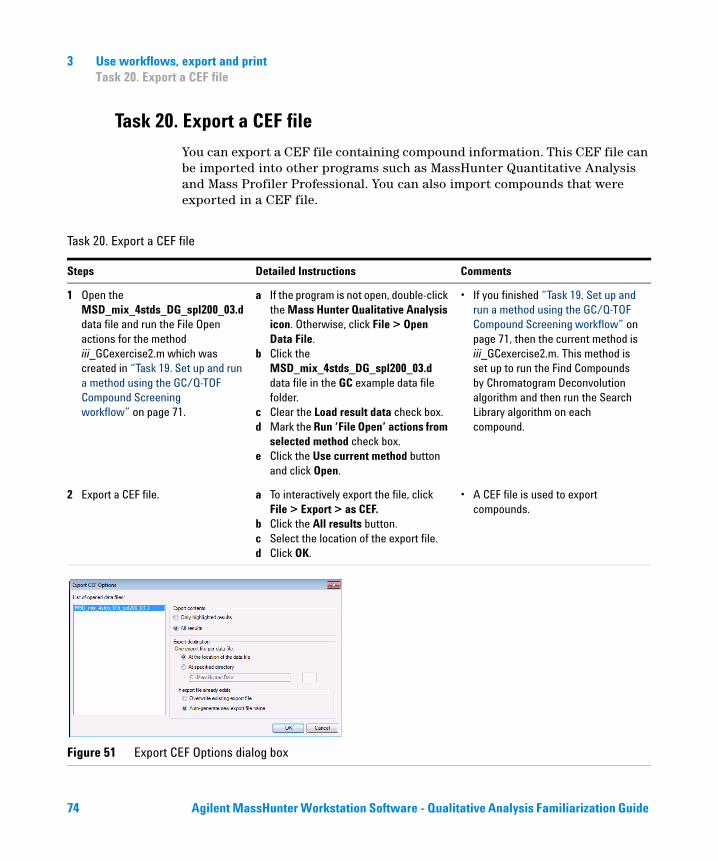
3 Use workflows, export and printTask 20. Export a CEF file
Task 20. Export a CEF file
You can export a CEF file containing compound information. This CEF file can be imported into other programs such as MassHunter Quantitative Analysis and Mass Profiler Professional. You can also import compounds that were exported in a CEF file.
Task 20. Export a CEF file
Steps Detailed Instructions Comments
1 Open the MSD_mix_4stds_DG_spl200_03.d data file and run the File Open actions for the method iii_GCexercise2.m which was created in “Task 19. Set up and run a method using the GC/Q-TOF Compound Screening workflow” on page 71.
a If the program is not open, double-click the Mass Hunter Qualitative Analysis icon. Otherwise, click File > Open Data File.
b Click the MSD_mix_4stds_DG_spl200_03.d data file in the GC example data file folder.
c Clear the Load result data check box.d Mark the Run ‘File Open’ actions from
selected method check box.e Click the Use current method button
and click Open.
• If you finished “Task 19. Set up and run a method using the GC/Q-TOF Compound Screening workflow” on page 71, then the current method is iii_GCexercise2.m. This method is set up to run the Find Compounds by Chromatogram Deconvolution algorithm and then run the Search Library algorithm on each compound.
2 Export a CEF file. a To interactively export the file, click File > Export > as CEF.
b Click the All results button.c Select the location of the export file.d Click OK.
• A CEF file is used to export compounds.
Figure 51 Export CEF Options dialog box
74 Agilent MassHunter Workstation Software - Qualitative Analysis Familiarization Guide
Use workflows, export and print 3Task 21. Print an analysis report
Task 21. Print an analysis report
Whenever you want to print an analysis report after performing any of the tasks in this exercise or the next one, use these instructions.
An analysis report can contain the results from extracting and integrating chromatograms, extracting spectra, finding compounds, searching the database for peak spectra or generating formulas from peak spectra.
Task 21. Print an analysis report
Steps Detailed Instructions Comments
1 If the MSD_mix_4stds_DG_spl200_03.d data file is not loaded, then open this data file and run the File Open actions for the method iii_GCexercise2.m which was created in “Task 19. Set up and run a method using the GC/Q-TOF Compound Screening workflow” on page 71.
a If the program is not open, double-click the Mass Hunter Qualitative Analysis icon. Otherwise, click File > Open Data File.
b Click the MSD_mix_4stds_DG_spl200_03.d data file in the GC example data file folder.
c Clear the Load result data check box.d Mark the Run ‘File Open’ actions from
selected method check box.e Click the Use current method button
and click Open.
• If you finished “Task 19. Set up and run a method using the GC/Q-TOF Compound Screening workflow” on page 71, then the current method is iii_GCexercise2.m. This method is set up to run the Find Compounds by Chromatogram Deconvolution algorithm and then run the Search Library algorithm on each compound.
2 Change the analysis report selections in the method:• Mark the check boxes for the
chromatograms, spectra or tables you want to print.
• Clear the check boxes for the chromatograms, spectra or tables you do not want to print.
a In the Method Explorer window, click Reports > Analysis Report.
b Mark the check boxes for any additional selections you want to print.
c Clear any chromatogram and spectra choices you do not want to print.
• The Analysis report only contains the information that you mark in this section.
• If some results are not available, then those results are not included, even if those results are marked in this section. For example, if you have not integrated the chromatogram, then the peak table is not included.
Agilent MassHunter Workstation Software - Qualitative Analysis Familiarization Guide for LC/MS 75
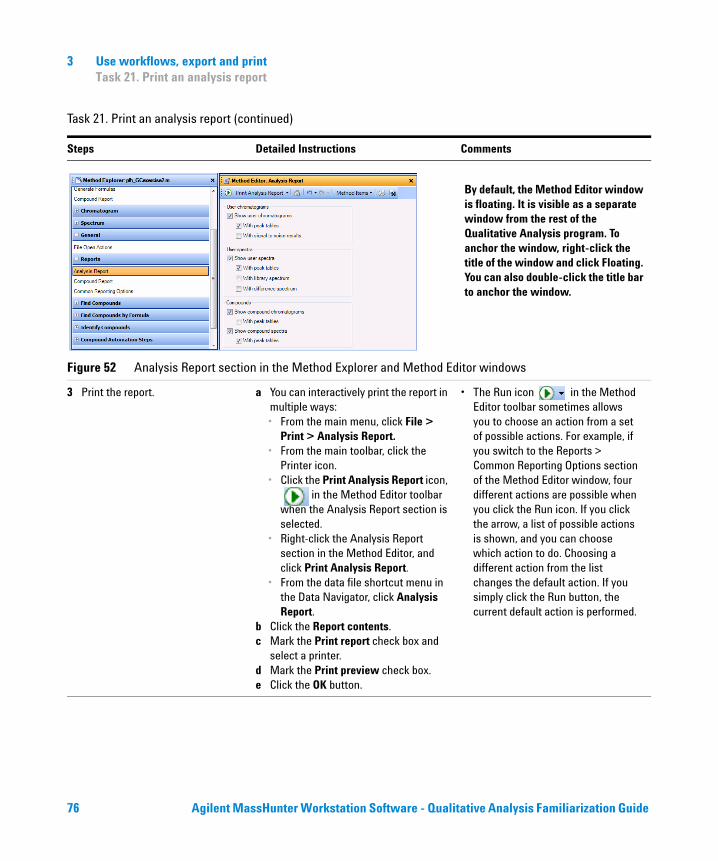
3 Use workflows, export and printTask 21. Print an analysis report
Figure 52 Analysis Report section in the Method Explorer and Method Editor windows
3 Print the report. a You can interactively print the report in multiple ways:• From the main menu, click File >
Print > Analysis Report.• From the main toolbar, click the
Printer icon.• Click the Print Analysis Report icon,
in the Method Editor toolbar when the Analysis Report section is selected.
• Right-click the Analysis Report section in the Method Editor, and click Print Analysis Report.
• From the data file shortcut menu in the Data Navigator, click Analysis Report.
b Click the Report contents.c Mark the Print report check box and
select a printer.d Mark the Print preview check box.e Click the OK button.
• The Run icon in the Method Editor toolbar sometimes allows you to choose an action from a set of possible actions. For example, if you switch to the Reports > Common Reporting Options section of the Method Editor window, four different actions are possible when you click the Run icon. If you click the arrow, a list of possible actions is shown, and you can choose which action to do. Choosing a different action from the list changes the default action. If you simply click the Run button, the current default action is performed.
Task 21. Print an analysis report (continued)
Steps Detailed Instructions Comments
By default, the Method Editor window is floating. It is visible as a separate window from the rest of the Qualitative Analysis program. To anchor the window, right-click the title of the window and click Floating. You can also double-click the title bar to anchor the window.
76 Agilent MassHunter Workstation Software - Qualitative Analysis Familiarization Guide
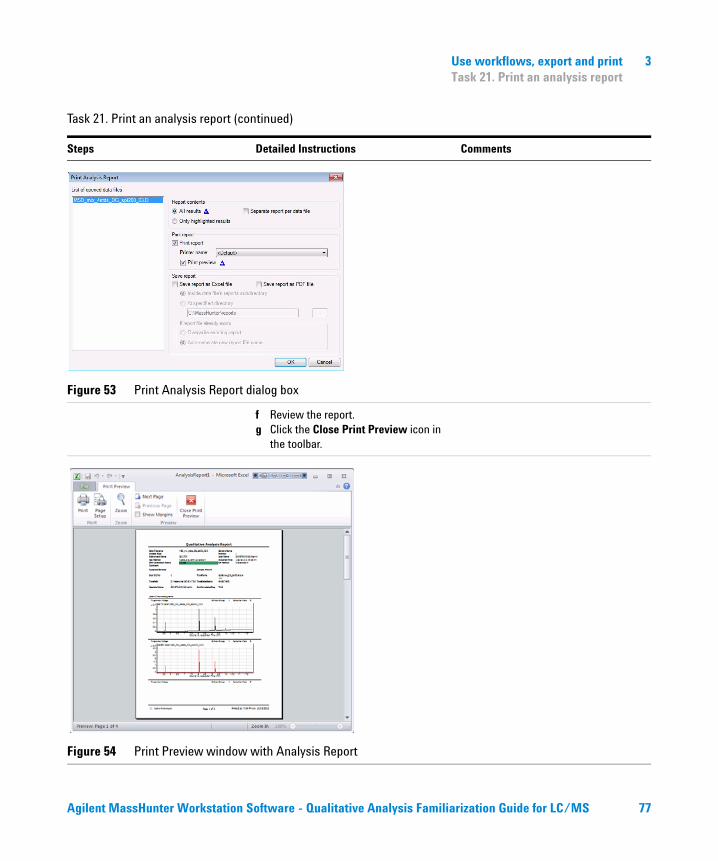
Use workflows, export and print 3Task 21. Print an analysis report
Figure 53 Print Analysis Report dialog box
f Review the report.g Click the Close Print Preview icon in
the toolbar.
Figure 54 Print Preview window with Analysis Report
Task 21. Print an analysis report (continued)
Steps Detailed Instructions Comments
Agilent MassHunter Workstation Software - Qualitative Analysis Familiarization Guide for LC/MS 77
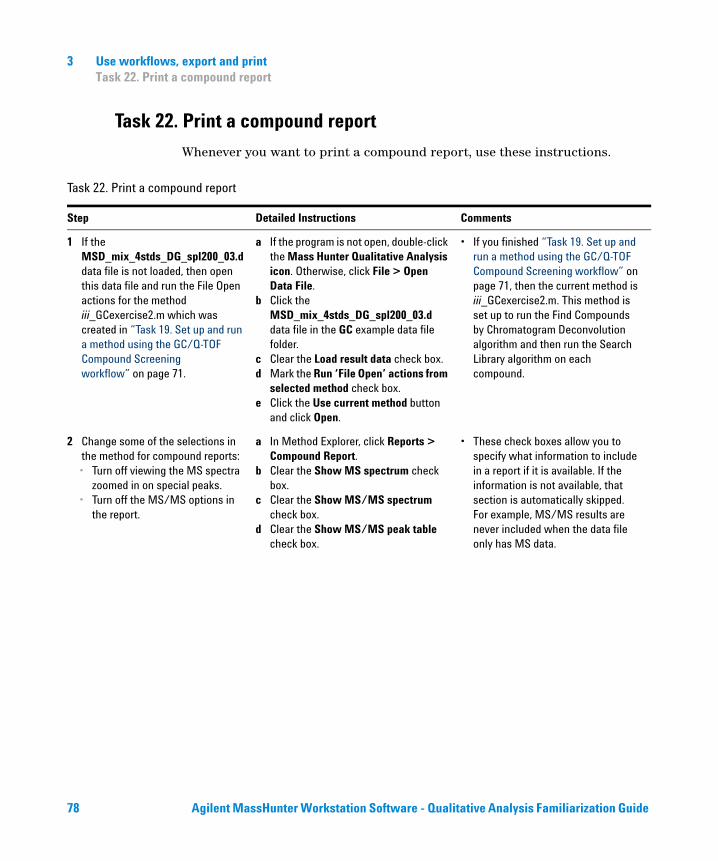
3 Use workflows, export and printTask 22. Print a compound report
Task 22. Print a compound report
Whenever you want to print a compound report, use these instructions.
Task 22. Print a compound report
Step Detailed Instructions Comments
1 If the MSD_mix_4stds_DG_spl200_03.d data file is not loaded, then open this data file and run the File Open actions for the method iii_GCexercise2.m which was created in “Task 19. Set up and run a method using the GC/Q-TOF Compound Screening workflow” on page 71.
a If the program is not open, double-click the Mass Hunter Qualitative Analysis icon. Otherwise, click File > Open Data File.
b Click the MSD_mix_4stds_DG_spl200_03.d data file in the GC example data file folder.
c Clear the Load result data check box.d Mark the Run ‘File Open’ actions from
selected method check box.e Click the Use current method button
and click Open.
• If you finished “Task 19. Set up and run a method using the GC/Q-TOF Compound Screening workflow” on page 71, then the current method is iii_GCexercise2.m. This method is set up to run the Find Compounds by Chromatogram Deconvolution algorithm and then run the Search Library algorithm on each compound.
2 Change some of the selections in the method for compound reports:• Turn off viewing the MS spectra
zoomed in on special peaks.• Turn off the MS/MS options in
the report.
a In Method Explorer, click Reports > Compound Report.
b Clear the Show MS spectrum check box.
c Clear the Show MS/MS spectrum check box.
d Clear the Show MS/MS peak table check box.
• These check boxes allow you to specify what information to include in a report if it is available. If the information is not available, that section is automatically skipped. For example, MS/MS results are never included when the data file only has MS data.
78 Agilent MassHunter Workstation Software - Qualitative Analysis Familiarization Guide
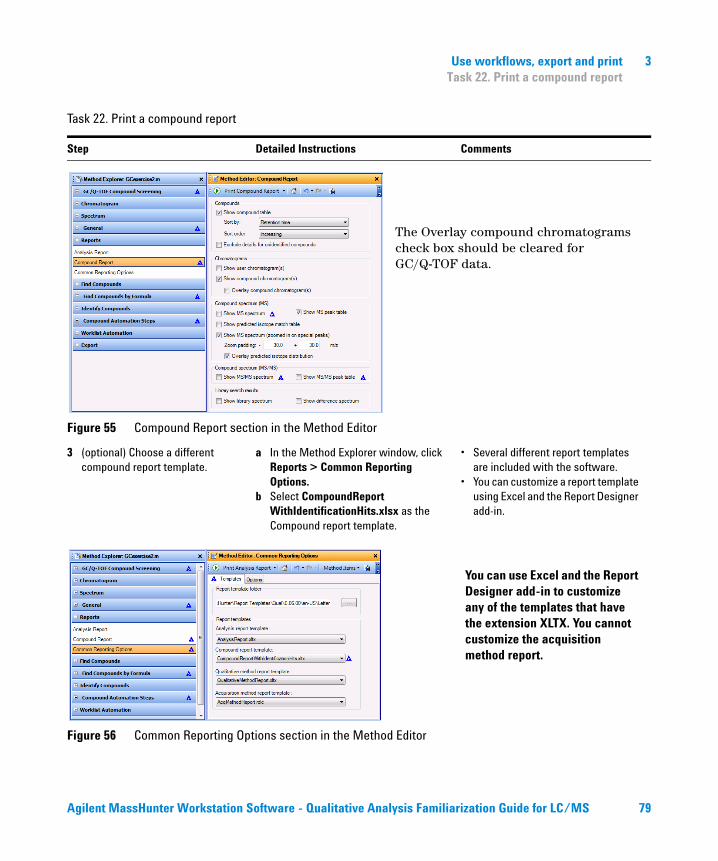
Use workflows, export and print 3Task 22. Print a compound report
Figure 55 Compound Report section in the Method Editor
3 (optional) Choose a different compound report template.
a In the Method Explorer window, click Reports > Common Reporting Options.
b Select CompoundReportWithIdentificationHits.xlsx as the Compound report template.
• Several different report templates are included with the software.
• You can customize a report template using Excel and the Report Designer add-in.
Figure 56 Common Reporting Options section in the Method Editor
Task 22. Print a compound report
Step Detailed Instructions Comments
The Overlay compound chromatograms check box should be cleared for GC/Q-TOF data.
You can use Excel and the Report Designer add-in to customize any of the templates that have the extension XLTX. You cannot customize the acquisition method report.
Agilent MassHunter Workstation Software - Qualitative Analysis Familiarization Guide for LC/MS 79
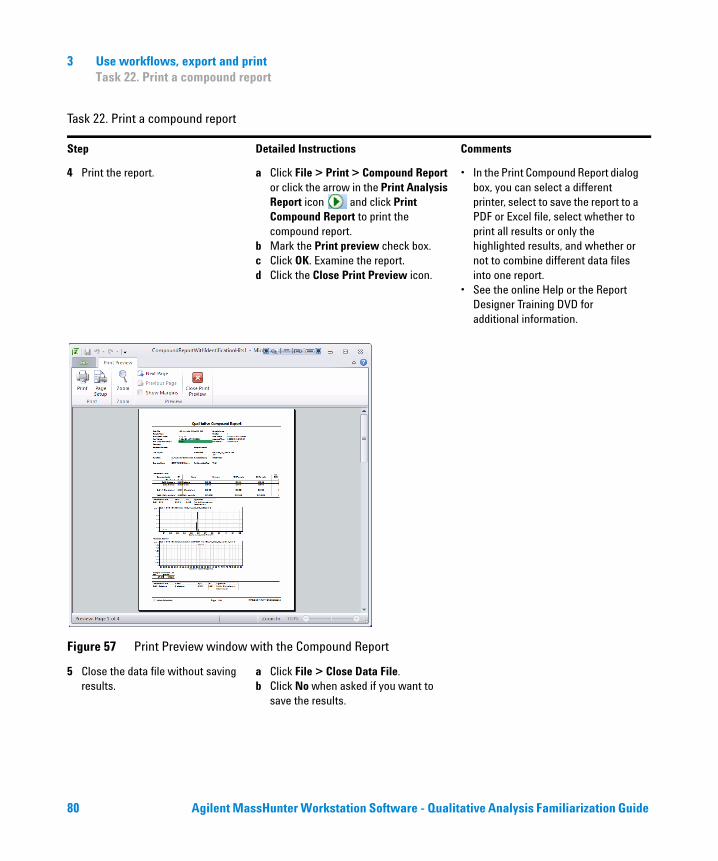
3 Use workflows, export and printTask 22. Print a compound report
4 Print the report. a Click File > Print > Compound Report or click the arrow in the Print Analysis Report icon and click Print Compound Report to print the compound report.
b Mark the Print preview check box.c Click OK. Examine the report.d Click the Close Print Preview icon.
• In the Print Compound Report dialog box, you can select a different printer, select to save the report to a PDF or Excel file, select whether to print all results or only the highlighted results, and whether or not to combine different data files into one report.
• See the online Help or the Report Designer Training DVD for additional information.
Figure 57 Print Preview window with the Compound Report
5 Close the data file without saving results.
a Click File > Close Data File.b Click No when asked if you want to
save the results.
Task 22. Print a compound report
Step Detailed Instructions Comments
80 Agilent MassHunter Workstation Software - Qualitative Analysis Familiarization Guide
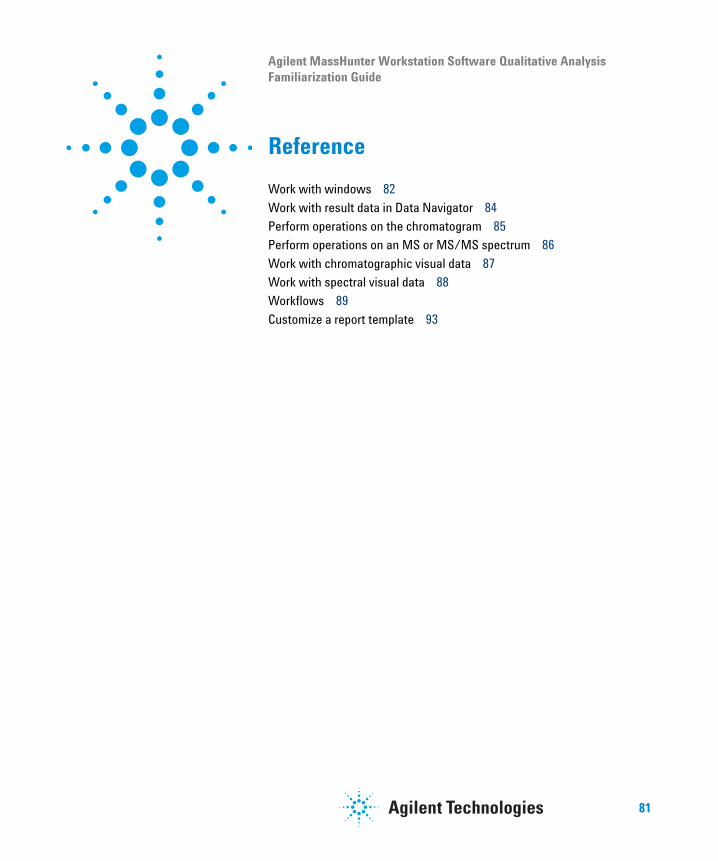
Agilent MassHunter Workstation Software Qualitative AnalysisFamiliarization Guide
Reference
Work with windows 82
Work with result data in Data Navigator 84
Perform operations on the chromatogram 85
Perform operations on an MS or MS/MS spectrum 86
Work with chromatographic visual data 87
Work with spectral visual data 88
Workflows 89
Customize a report template 93
81
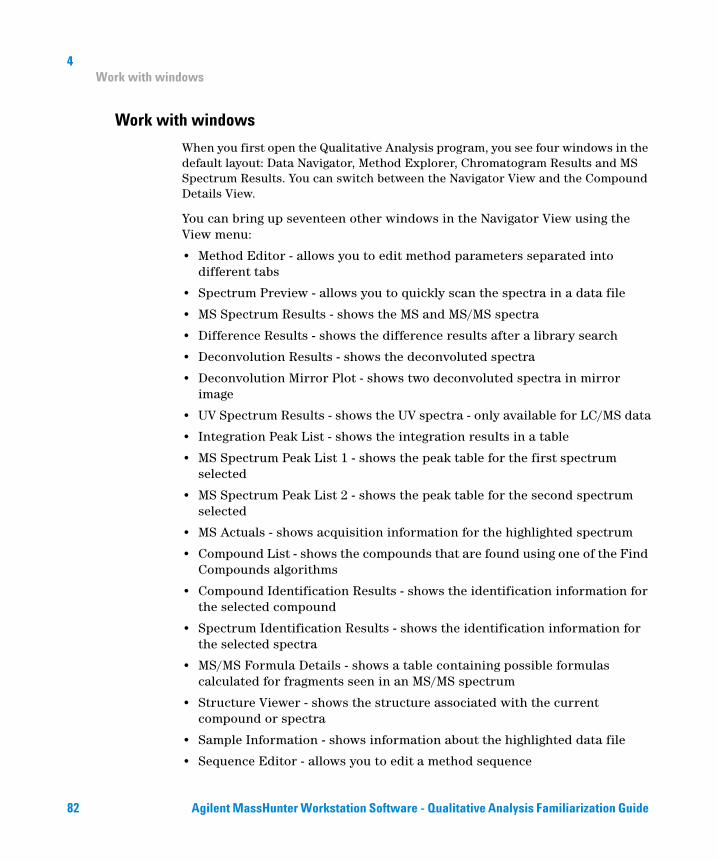
4Work with windows
Work with windows
When you first open the Qualitative Analysis program, you see four windows in the default layout: Data Navigator, Method Explorer, Chromatogram Results and MS Spectrum Results. You can switch between the Navigator View and the Compound Details View.
You can bring up seventeen other windows in the Navigator View using the View menu:
• Method Editor - allows you to edit method parameters separated into different tabs
• Spectrum Preview - allows you to quickly scan the spectra in a data file
• MS Spectrum Results - shows the MS and MS/MS spectra
• Difference Results - shows the difference results after a library search
• Deconvolution Results - shows the deconvoluted spectra
• Deconvolution Mirror Plot - shows two deconvoluted spectra in mirror image
• UV Spectrum Results - shows the UV spectra - only available for LC/MS data
• Integration Peak List - shows the integration results in a table
• MS Spectrum Peak List 1 - shows the peak table for the first spectrum selected
• MS Spectrum Peak List 2 - shows the peak table for the second spectrum selected
• MS Actuals - shows acquisition information for the highlighted spectrum
• Compound List - shows the compounds that are found using one of the Find Compounds algorithms
• Compound Identification Results - shows the identification information for the selected compound
• Spectrum Identification Results - shows the identification information for the selected spectra
• MS/MS Formula Details - shows a table containing possible formulas calculated for fragments seen in an MS/MS spectrum
• Structure Viewer - shows the structure associated with the current compound or spectra
• Sample Information - shows information about the highlighted data file
• Sequence Editor - allows you to edit a method sequence
82 Agilent MassHunter Workstation Software - Qualitative Analysis Familiarization Guide
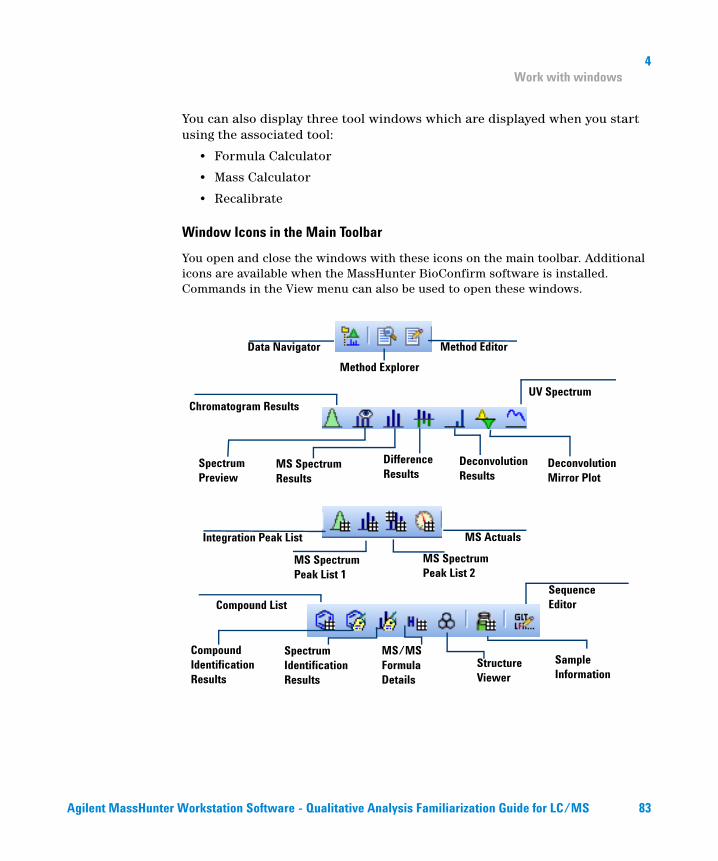
4Work with windows
You can also display three tool windows which are displayed when you start using the associated tool:
• Formula Calculator
• Mass Calculator
• Recalibrate
Window Icons in the Main Toolbar
You open and close the windows with these icons on the main toolbar. Additional icons are available when the MassHunter BioConfirm software is installed. Commands in the View menu can also be used to open these windows.
MS SpectrumResults
Data Navigator
Spectrum Preview
Chromatogram Results
Method Editor
Method Explorer
Integration Peak List
Spectrum Identification Results
MS Spectrum Peak List 1
Compound List
MS Spectrum Peak List 2
MS Actuals
Compound Identification Results
Sequence Editor
DeconvolutionResults
UV Spectrum
MS/MS Formula Details
Difference Results
Structure Viewer
Sample Information
DeconvolutionMirror Plot
Agilent MassHunter Workstation Software - Qualitative Analysis Familiarization Guide for LC/MS 83
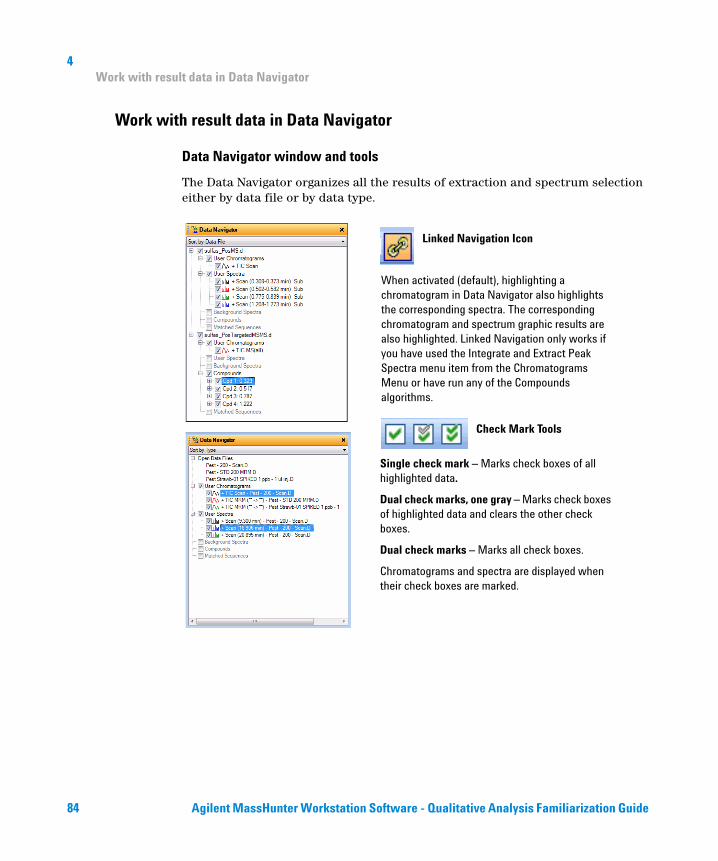
4Work with result data in Data Navigator
Work with result data in Data Navigator
Data Navigator window and tools
The Data Navigator organizes all the results of extraction and spectrum selection either by data file or by data type.
When activated (default), highlighting a chromatogram in Data Navigator also highlights the corresponding spectra. The corresponding chromatogram and spectrum graphic results are also highlighted. Linked Navigation only works if you have used the Integrate and Extract Peak Spectra menu item from the Chromatograms Menu or have run any of the Compounds algorithms.
Single check mark – Marks check boxes of all highlighted data.
Dual check marks, one gray – Marks check boxes of highlighted data and clears the other check boxes.
Dual check marks – Marks all check boxes.
Chromatograms and spectra are displayed when their check boxes are marked.
Check Mark Tools
Linked Navigation Icon
84 Agilent MassHunter Workstation Software - Qualitative Analysis Familiarization Guide
4Perform operations on the chromatogram
Perform operations on the chromatogram
You can perform the following operations on the whole chromatogram or on a selected region of the chromatogram by using the menu items:
Action Menu Item
Change peak labels in chromatogram Configuration > Chromatogram Display Options
Extract a chromatogram Chromatograms > Extract Chromatograms
Extract defined chromatograms Chromatograms > Extract Defined Chromatograms
Integrate the chromatogram Chromatograms > Integrate Chromatogram
Integrate and extract peak spectra Chromatograms > Integrate and Extract Peak Spectra
Integrate and Deconvolute Peak Spectra Chromatograms > Integrate and Deconvolute Peak Spectra
Smooth the chromatogram Chromatograms > Smooth Chromatogram
Subtract any chromatogram Chromatograms > Subtract Any Chromatogram
Calculate Signal-to-Noise Chromatograms > Calculate Signal-to-Noise
Find compounds from auto MS/MS data Find > Find Compounds by Auto MS/MS
Find compounds from targeted MS/MS data
Find > Find Compounds by Targeted MS/MS
Find compounds for MS(1) data Find > Find Compounds by Molecular Feature
Find compounds for GC/MS data Find > Find Compounds by Chromatogram Deconvolution
Find compounds for MRM data Find > Find Compounds by MRM
Find compounds by integration results Find > Find Compounds by Integration
Find compounds that match specific formulas
Find > Find Compounds by Formula
Agilent MassHunter Workstation Software - Qualitative Analysis Familiarization Guide for LC/MS 85
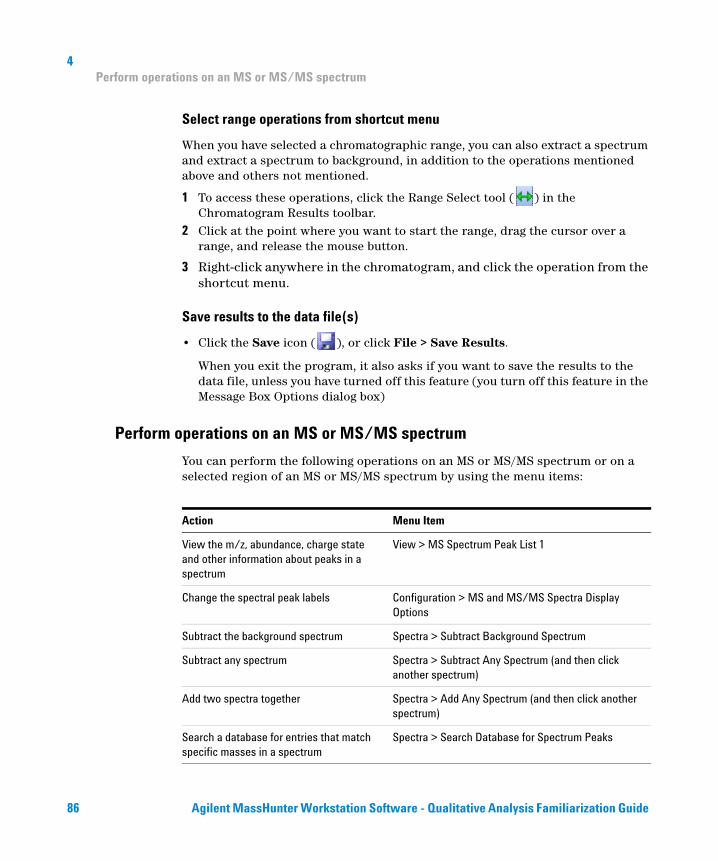
4Perform operations on an MS or MS/MS spectrum
Select range operations from shortcut menu
When you have selected a chromatographic range, you can also extract a spectrum and extract a spectrum to background, in addition to the operations mentioned above and others not mentioned.
1 To access these operations, click the Range Select tool ( ) in the Chromatogram Results toolbar.
2 Click at the point where you want to start the range, drag the cursor over a range, and release the mouse button.
3 Right-click anywhere in the chromatogram, and click the operation from the shortcut menu.
Save results to the data file(s)
• Click the Save icon ( ), or click File > Save Results.
When you exit the program, it also asks if you want to save the results to the data file, unless you have turned off this feature (you turn off this feature in the Message Box Options dialog box)
Perform operations on an MS or MS/MS spectrum
You can perform the following operations on an MS or MS/MS spectrum or on a selected region of an MS or MS/MS spectrum by using the menu items:
Action Menu Item
View the m/z, abundance, charge state and other information about peaks in a spectrum
View > MS Spectrum Peak List 1
Change the spectral peak labels Configuration > MS and MS/MS Spectra Display Options
Subtract the background spectrum Spectra > Subtract Background Spectrum
Subtract any spectrum Spectra > Subtract Any Spectrum (and then click another spectrum)
Add two spectra together Spectra > Add Any Spectrum (and then click another spectrum)
Search a database for entries that match specific masses in a spectrum
Spectra > Search Database for Spectrum Peaks
86 Agilent MassHunter Workstation Software - Qualitative Analysis Familiarization Guide
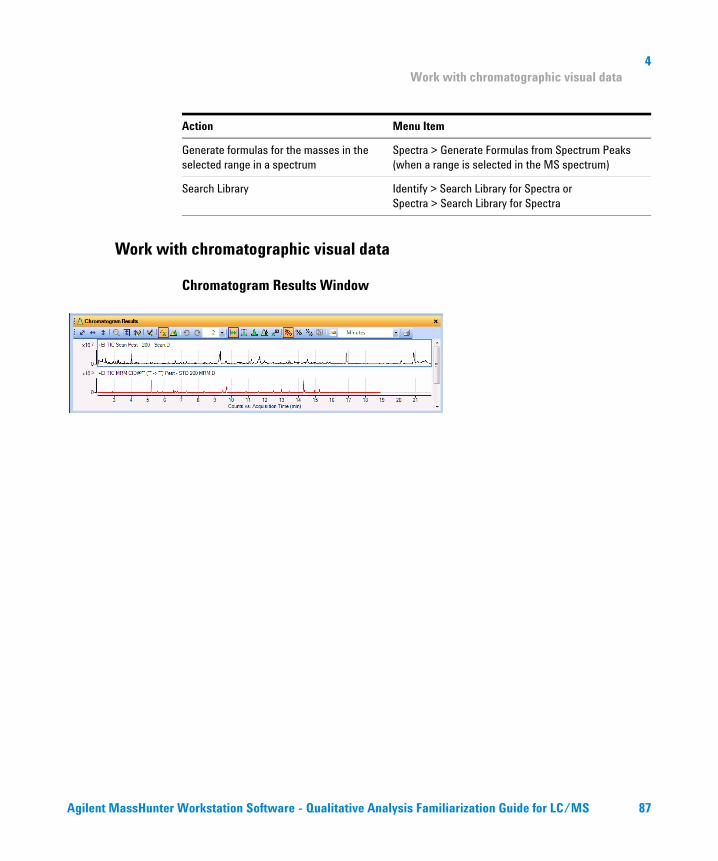
4Work with chromatographic visual data
Work with chromatographic visual data
Chromatogram Results Window
Generate formulas for the masses in the selected range in a spectrum
Spectra > Generate Formulas from Spectrum Peaks (when a range is selected in the MS spectrum)
Search Library Identify > Search Library for Spectra orSpectra > Search Library for Spectra
Action Menu Item
Agilent MassHunter Workstation Software - Qualitative Analysis Familiarization Guide for LC/MS 87
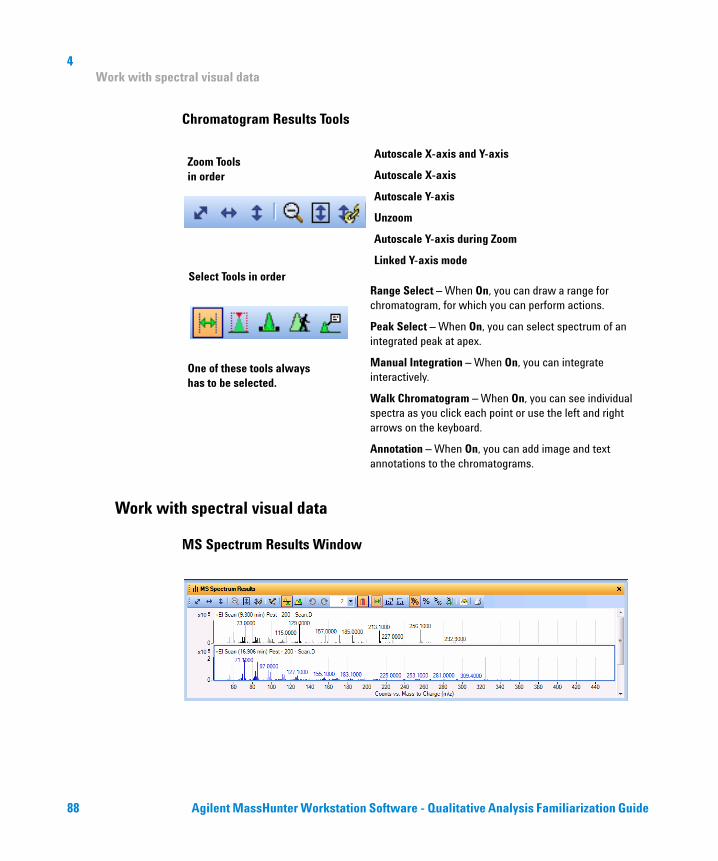
4Work with spectral visual data
Chromatogram Results Tools
Work with spectral visual data
MS Spectrum Results Window
Zoom Tools in order
Select Tools in orderRange Select – When On, you can draw a range for chromatogram, for which you can perform actions.
Peak Select – When On, you can select spectrum of an integrated peak at apex.
Manual Integration – When On, you can integrate interactively.
Walk Chromatogram – When On, you can see individual spectra as you click each point or use the left and right arrows on the keyboard.
Annotation – When On, you can add image and text annotations to the chromatograms.
Autoscale X-axis and Y-axis
Autoscale X-axis
Autoscale Y-axis
Unzoom
Autoscale Y-axis during Zoom
Linked Y-axis mode
One of these tools always has to be selected.
88 Agilent MassHunter Workstation Software - Qualitative Analysis Familiarization Guide
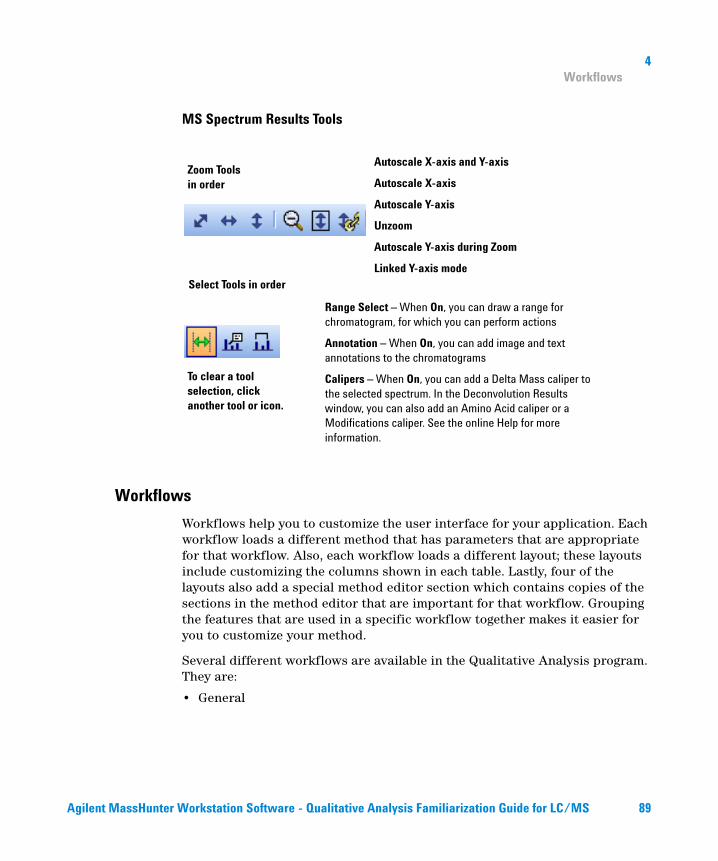
4Workflows
MS Spectrum Results Tools
Workflows
Workflows help you to customize the user interface for your application. Each workflow loads a different method that has parameters that are appropriate for that workflow. Also, each workflow loads a different layout; these layouts include customizing the columns shown in each table. Lastly, four of the layouts also add a special method editor section which contains copies of the sections in the method editor that are important for that workflow. Grouping the features that are used in a specific workflow together makes it easier for you to customize your method.
Several different workflows are available in the Qualitative Analysis program. They are:
• General
Zoom Tools in order
Select Tools in order
Range Select – When On, you can draw a range for chromatogram, for which you can perform actions
Annotation – When On, you can add image and text annotations to the chromatograms
Calipers – When On, you can add a Delta Mass caliper to the selected spectrum. In the Deconvolution Results window, you can also add an Amino Acid caliper or a Modifications caliper. See the online Help for more information.
Autoscale X-axis and Y-axis
Autoscale X-axis
Autoscale Y-axis
Unzoom
Autoscale Y-axis during Zoom
Linked Y-axis mode
To clear a tool selection, click another tool or icon.
Agilent MassHunter Workstation Software - Qualitative Analysis Familiarization Guide for LC/MS 89
4Workflows
• BioConfirm - These workflows are only available if the BioConfirm software is installed and marked in the User Interface Configuration dialog box. BioConfirm has several possible workflows, depending on the type of analysis that you want to do. BioConfirm is used with LC/MS data files.
• Chromatogram Peak Survey
• Formula Confirmation and Sample Purity
• MS Target Compound Screening
• GC/Q-TOF Compound Screening
If you are working with GC/MS data, you can select the General workflow or the GC/Q-TOF Compound Screening workflow. If you are working with LC/MS data, you can select any of the workflows except for GC Q-TOF Compound Screening.
Specific Method
Each workflow loads a specific default method with appropriate settings for that workflow. For example, if you switch to one of the BioConfirm workflows, the Target data type for the Find Compounds by Molecular Feature algorithm is set to Large molecules (proteins, oligos). This setting is appropriate for the BioConfirm workflow but not, by default, for the other workflows.
90 Agilent MassHunter Workstation Software - Qualitative Analysis Familiarization Guide
4Workflows
Specific Layout
In addition, each workflow loads a specific layout. A layout consists of the following:
• Each window’s position and size
• Which windows are tabbed
• Which windows are floating
• Which tabbed window is on top
• Which windows are visible by default
• Whether the status bar is visible
For each plot window (the Chromatogram Results window, the Spectrum Preview window, the MS Spectrum Results window, the Deconvolution window and the UV Results window), the following are saved:
• Whether or not the graphics are overlaid
• Whether or not the Autoscale Y-Axis during Zoom mode is on
• Whether or not the Linked Y-Axis mode is on
For each table window, the following are saved
• Which columns are visible
• The order of the columns
• The width of each column
• Any filter that has been added to the table (only available for the Compound List table, the Compound Identification Results table, and the Spectrum Identification Results window).
Specific section in the Method Explorer and Method Editor
Using the Method Editor with the General workflow, you can change almost all of the parameters in the Method.
Each of the four other workflows changes the sections available in the Method Explorer. Each new section contains only the Method Editor tabs and sections that are useful in that workflow. Changing a parameter in the workflow section also changes the parameter in the corresponding section in the general Method Editor sections.
Agilent MassHunter Workstation Software - Qualitative Analysis Familiarization Guide for LC/MS 91
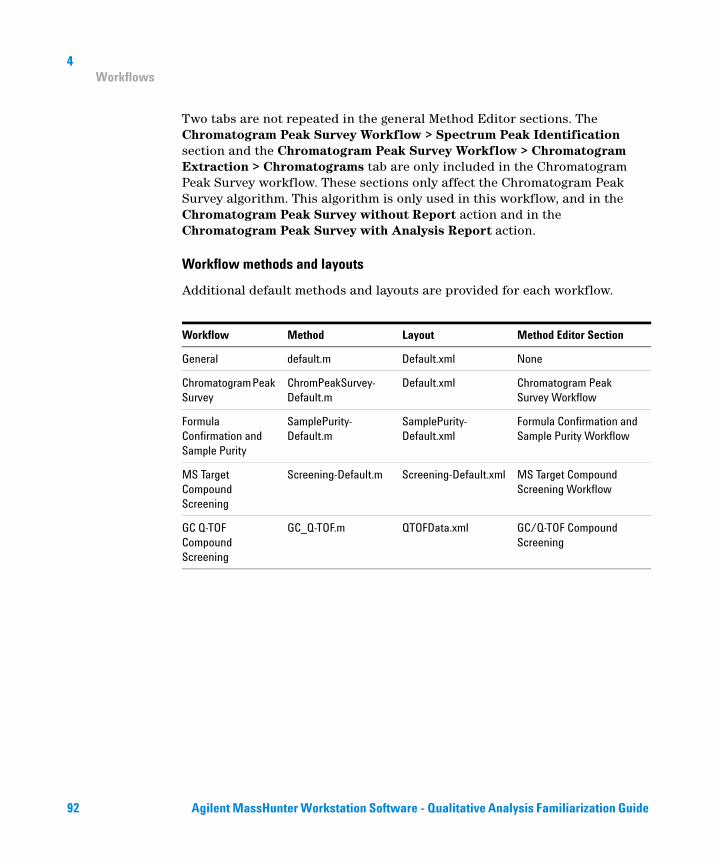
4Workflows
Two tabs are not repeated in the general Method Editor sections. The Chromatogram Peak Survey Workflow > Spectrum Peak Identification section and the Chromatogram Peak Survey Workflow > Chromatogram Extraction > Chromatograms tab are only included in the Chromatogram Peak Survey workflow. These sections only affect the Chromatogram Peak Survey algorithm. This algorithm is only used in this workflow, and in the Chromatogram Peak Survey without Report action and in the Chromatogram Peak Survey with Analysis Report action.
Workflow methods and layouts
Additional default methods and layouts are provided for each workflow.
Workflow Method Layout Method Editor Section
General default.m Default.xml None
Chromatogram Peak Survey
ChromPeakSurvey-Default.m
Default.xml Chromatogram Peak Survey Workflow
Formula Confirmation and Sample Purity
SamplePurity-Default.m
SamplePurity-Default.xml
Formula Confirmation and Sample Purity Workflow
MS Target Compound Screening
Screening-Default.m Screening-Default.xml MS Target Compound Screening Workflow
GC Q-TOF Compound Screening
GC_Q-TOF.m QTOFData.xml GC/Q-TOF Compound Screening
92 Agilent MassHunter Workstation Software - Qualitative Analysis Familiarization Guide
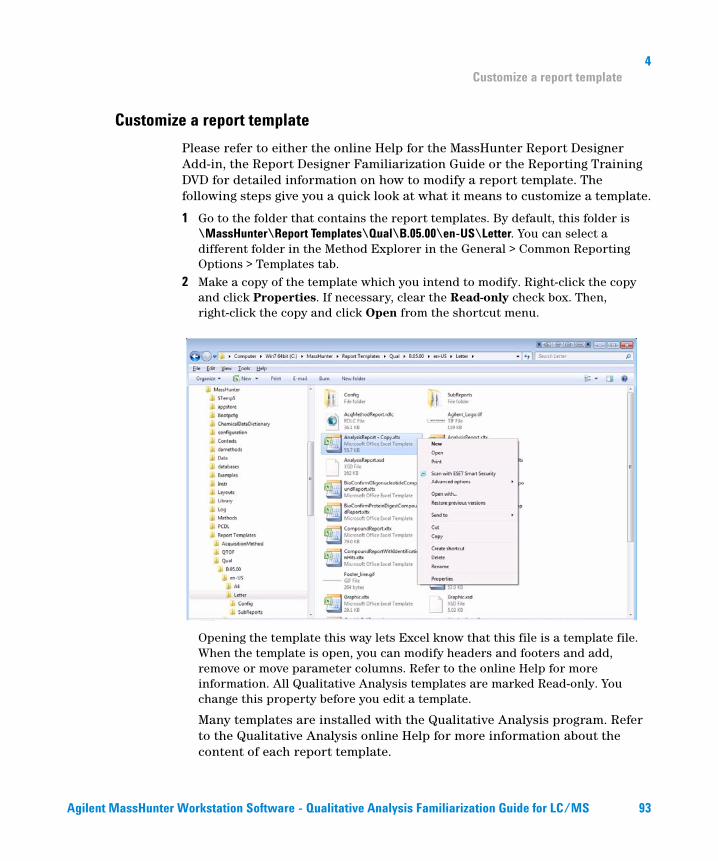
4Customize a report template
Customize a report template
Please refer to either the online Help for the MassHunter Report Designer Add-in, the Report Designer Familiarization Guide or the Reporting Training DVD for detailed information on how to modify a report template. The following steps give you a quick look at what it means to customize a template.
1 Go to the folder that contains the report templates. By default, this folder is \MassHunter\Report Templates\Qual\B.05.00\en-US\Letter. You can select a different folder in the Method Explorer in the General > Common Reporting Options > Templates tab.
2 Make a copy of the template which you intend to modify. Right-click the copy and click Properties. If necessary, clear the Read-only check box. Then, right-click the copy and click Open from the shortcut menu.
Opening the template this way lets Excel know that this file is a template file. When the template is open, you can modify headers and footers and add, remove or move parameter columns. Refer to the online Help for more information. All Qualitative Analysis templates are marked Read-only. You change this property before you edit a template.
Many templates are installed with the Qualitative Analysis program. Refer to the Qualitative Analysis online Help for more information about the content of each report template.
Agilent MassHunter Workstation Software - Qualitative Analysis Familiarization Guide for LC/MS 93
4Customize a report template
3 Make the changes you want to make.
For more information on how to modify a template, see either the online Help for the MassHunter Report Designer add-in, or the Agilent MassHunter Reporting - Training DVD.
4 To save the new template, either click Save or click Save As > Other Formats from the Microsoft Office button.
5 Type an identifying name, and click Save.
94 Agilent MassHunter Workstation Software - Qualitative Analysis Familiarization Guide

© Agilent Technologies, Inc. 2012
Revision A, November 2012
*G3335-90146*
G3335-90146
www.agilent.com
In This Book
This guide contains information to learn to use your Agilent MassHunter Workstation Software - Qualitative Analysis with GC/MS data.