agilent assaymap bravo technology enables reproducible ... · agilent assaymap bravo technology...
TRANSCRIPT

AuthorsJason D. Russell and Steve Murphy Agilent Technologies, Inc. Madison, WI, USA
Agilent AssayMAP Bravo Technology Enables Reproducible Automated Phosphopeptide Enrichment from Complex Mixtures Using High‑Capacity Fe(III)‑NTA Cartridges
Application NoteAutomated Peptide Sample Preparation for LC/MS
AbstractImmobilized metal affinity chromatography (IMAC) using a nitrilotriacetic acid (NTA) chelating ligand functionalized with Fe(III) is regarded as one of the most selective phosphopeptide enrichment techniques for LC/MS applications. However, the use of IMAC for phosphopeptide enrichment often results in unacceptably high sample‑to‑sample variability. Phosphopeptide enrichment is reliant on manual sample preparation methods resulting in workflows lacking robustness except in the hands of highly trained scientists. Recently, several protein and peptide sample preparation workflows were automated using the Agilent AssayMAP Bravo platform, which reduced sample preparation variability, provided a clear path for sample processing scalability, and enabled customized workflow development without the need for in‑house automation expertise. We now report on the use of high‑capacity Agilent AssayMAP Fe(III)‑NTA cartridges for automated phosphopeptide enrichment featuring the AssayMAP Bravo. We describe the capacity of AssayMAP Fe(III)‑NTA cartridges, explain chemistry considerations for successful phosphopeptide enrichment by IMAC, and demonstrate that thousands of phosphopeptides can be reproducibly purified from yeast tryptic digests with high specificity in an automated fashion facilitated by high‑resolution LC/MS.

2
using high‑capacity AssayMAP Fe(III)‑NTA cartridges. Each AssayMAP Fe(III)‑NTA cartridge contains a 5‑μL packed resin bed containing NTA resin precharged with more than 100 nmol of Fe(III) per cartridge. When used in tandem with the AssayMAP Phosphopeptide Enrichment v2.0 App, thousands of phosphopeptides can be reproducibly enriched from complex protein digests. Here, we detail the capacity of AssayMAP Fe(III)‑NTA cartridges, systematically evaluate the chemistry considerations for successful phosphopeptide enrichment by IMAC, and demonstrate that thousands of phosphopeptides can be reproducibly purified from complex mixtures with high specificity in an automated fashion enabled by the AssayMAP Bravo and high‑resolution LC/MS.
ExperimentalBulk in-solution digestion and peptide cleanupBovine a‑casein (Sigma‑Aldrich) was diluted to 30 μg/μL in water. A denaturation solution containing 9 M urea, 125 mM Tris (pH 8.0), and 12.5 mM TCEP was added at four times the sample volume. Samples were denatured, and reduced at 55 °C for 1 hour with frequent mixing. Iodoacetamide was added to a final concentration of 20 mM, and was incubated at room temperature in the dark for 40 minutes. Samples were diluted with 50 mM Tris (pH 8.0) to reduce the concentration of urea to 1.25 M. Trypsin was added to yield an enzyme:protein ratio of 1:30. Samples were incubated at 37 °C for 2–4 hours, after which an additional dose of trypsin was added to yield a final ratio of 1:20. Samples were incubated overnight at 37 °C.
Yeast (Saccharomyces cerevisiae) protein extracts from whole‑cell lysates were provided by Blue Sky BioServices (Worchester, MA). Lysates were prepared using denaturing lysis conditions adapted from Swaney et al. and contained both protease and phosphatase inhibitor cocktails31. Clarified samples (5 mg/mL) were denatured and reduced by adding
governing success for phosphopeptide enrichment using IMAC. Samples for phosphopeptide enrichment using the Fe(III)‑NTA IMAC strategy almost always require a cleanup (desalting) step to remove sample components that may interfere with enrichment. Desalted samples are typically dissolved in a phosphate‑free, TFA‑containing, low‑pH solution (~ pH 2.4 to 2.8) with a large percentage of organic solvent. Low‑pH conditions reduce nonspecific binding by facilitating protonation of acidic side‑chains and C‑termini of unmodified peptides, whereas the phosphoryl groups of phosphopeptides remain negatively charged to promote binding to immobilized Fe(III) through a combination of electrostatic interactions and metal coordination25,26. The presence of organic solvent in the sample and wash solutions is also essential to minimize nonspecific binding. Organic solvent modulates the degree of ionization of acids and bases and the magnitude of the change in the degree of ionization can vary dramatically depending on the chemical species20, 27‑30. Achieving high phosphopeptide selectivity requires determining conditions that maximize the difference in the ionization states of phosphoryl and carboxyl groups such that under a given set of solvent conditions, phosphoryl groups are negatively charged, while carboxyl groups are neutral to promote selective binding of phosphopeptides to immobilized metal cations16, 20. Once enrichment conditions have been optimized, the task of scaling sample preparation and transferring methodology to achieve sample‑to‑sample and site‑to‑site reproducibility is daunting considering the manual nature of many phosphopeptide enrichment workflows.
Several core yeast protein sample preparation tasks have been automated using the Agilent AssayMAP Bravo sample preparation platform (for example, immunopurification, protein digestion, peptide cleanup, and so forth) through the use of microchromatography cartridges and flexible and task‑centric automation protocols. With the same automation platform, we now demonstrate reproducible and selective phosphopeptide enrichment by IMAC
IntroductionReversible protein phosphorylation is the primary regulator of intracellular signaling. Understanding signal transduction with protein‑level resolution is critical for characterizing abnormalities in signal transduction pathways regulated by protein phosphorylation. The study of global protein phosphorylation has been revolutionized by the use of liquid chromatography and high‑resolution mass spectrometry (LC/MS) whereby phosphopeptides generated by enzymatic proteolysis of phosphoproteins are used for both characterization and quantification of phosphoproteins and phosphorylation dynamics. Phosphopeptide enrichment is required to achieve the most sensitive analysis of the phosphoproteome by LC/MS and one leading approach for phosphopeptide enrichment is based upon the use of immobilized metal affinity chromatography (IMAC). IMAC can be used to selectively bind phosphopeptides from complex protein digests, particularly when Fe(III) is immobilized onto resin functionalized with the tetradentate metal‑chelating ligand nitrilotriacetic acid (NTA). Despite the widespread use of IMAC for phosphopeptide enrichment, there is no clear literature consensus on sample and reagent chemistries that reproducibly yield high phosphopeptide recovery and selectivity1‑24.
Global phosphopeptide enrichment for LC/MS is one of the more challenging sample preparation workflows to perform reproducibly. Perhaps, the greatest obstacle to reproducible phosphopeptide enrichment by IMAC is optimization of the chemistry conditions such that they are sufficiently stringent to allow selective binding of phosphopeptides without compromising enrichment reproducibility or phosphopeptide yield. Less than optimal conditions may promote low phosphopeptide selectivity through copurification of acidic, unmodified (not phosphorylated) peptides. In contrast, conditions can be overly stringent, leading to poor or inconsistent recovery of phosphopeptides. Solution chemistry is a critical factor
3
microparticulates. The samples were manually transferred from tubes into polypropylene 96‑well plates (either PCR or V‑bottom plates). A solution of 50 % ACN/0.1 % TFA was used as the priming buffer, 80 % ACN/0.1 % TFA was used as the equilibration and internal cartridge wash buffer, and 1 % aqueous ammonia (commonly referred to as ammonium hydroxide, pH ~11) was used as the elution buffer. Default protocol values, with the exception of the number of columns of cartridges and sample volume, were used for phosphopeptide enrichment of a‑casein unless otherwise indicated. Refer to Figure 1 for the representative protocol settings and labware selections used for phosphopeptide enrichment from yeast. Samples were directly eluted from AssayMAP Fe(III)‑NTA cartridges into a PCR plate containing 2.5 μL neat formic acid for immediate sample acidification. The concentrations of sample eluates were adjusted with 0.1% formic acid, and sample plates were sealed with an Agilent PlateLoc Thermal Microplate Sealer using pierceable film, and stored in an autosampler at 4 °C.
Phosphopeptide enrichment using Agilent AssayMAP Fe(III)-NTA cartridgesThe Agilent AssayMAP Phosphopeptide Enrichment v2.0 App, included with the Agilent AssayMAP Bravo Protein Sample Prep Workbench v2.0 software suite, was used for automated phosphopeptide enrichment experiments with AssayMAP Fe(III)‑NTA cartridges. Chemistry conditions were systematically evaluated, and the effects of these conditions on phosphopeptide enrichment are explained in the Results and Discussion section. See Table 1 for representative on‑deck samples and reagents used for phosphopeptide enrichment. Tryptically digested, desalted, and lyophilized samples in 2‑mL tubes were diluted to 0.5–5.0 μg/μL with 80 % acetonitrile (ACN)/0.1 % TFA. The aqueous component of this solution was first added to the samples, samples were vortexed, and then ACN was added. The samples were further vortexed until visible particulates were dissolved. The samples were centrifuged at 6,000 × g for 5 minutes to pellet any remaining
an equal volume of a denaturation mixture containing 8 M urea, 100 mM Tris (pH 8.0), and 10 mM TCEP, followed by incubation at 55 °C for 1 hour with frequent mixing. Iodoacetamide was added to a final concentration of 15 mM, and samples were incubated at room temperature in the dark for 40 minutes. Samples were diluted with 50 mM Tris (pH 8.0) to reduce the urea concentration to < 1.25 M, and trypsin was added at an enzyme:protein ratio of 1:40. Samples were incubated at 37 °C for 2 hours, after which an additional dose of trypsin was added to yield a final ratio of 1:20. Samples were incubated overnight at 37 °C.
Digestion was quenched by addition of TFA to a final concentration of 1 % to reduce the pH to ~2.5. Samples were desalted using Agilent Bond Elut C18 cartridges with a bed mass at least 30x larger than the sample mass. Desalted digests were aliquoted as 5 mg (a‑casein) or 1.5 mg (yeast) quantities, lyophilized, and stored at –80 °C.
Representative on‑deck samples and reagentsAgilent AssayMAP Bravo App ‑ Phosphopeptide Enrichment v2.0Sample: digested, desalted, and lyophilized S. cerevisiae protein lysate or bovine a‑casein diluted to
0.5–5.0 µg/µL in 80 % ACN/0.1 % TFAPriming buffer 50 % ACN/0.1 % TFAEquilibration and internal cartridge wash buffer 80 % ACN/0.1 % TFAElution buffer 1 % Aqueous ammonia (ammonium hydroxide), pH ~11Wash station Dieonized waterNote: All buffers were made as v/v mixtures
Table 1. Representative samples and reagents used for phosphopeptide enrichment with the Agilent AssayMAP Phosphopeptide Enrichment v2.0 App.

4
Carbamidomethylation was searched as a fixed modification while oxidized methionine and phosphorylated serine, threonine, and tyrosine were searched as variable modifications. Peptide‑spectrum matches were filtered to ~1.2 % false discovery rate using the default auto threshold values.
spectra were searched against a custom database containing protein sequences for bovine a‑s1 and a‑s2 or a protein database constructed from the UniProt reference proteome for Saccharomyces cerevisiae (strain ATCC 204508/S288C). Trypsin specificity was selected, and up to three missed cleavages were allowed.
LC/MS and data analysisLC/MS analyses were conducted on an Agilent 6550 iFunnel Q‑TOF LC/MS system equipped with a Dual Agilent Jet Stream ESI source (Table 2). The mass spectrometer was coupled to an Agilent 1290 Infinity Binary LC system housing an AdvanceBio Peptide Mapping C18 column (2.1 × 150 or 250 mm, 2.7 µm, 120 Å pore size) maintained at 55 °C. Mobile phase A was 0.1 % formic acid in water, and mobile phase B was 99.9 % ACN with 0.1 % formic acid. A flow rate of 400 µL/min was used for gradient elution. The autosampler was configured for 96‑well PCR plates, and injection volumes were varied based upon the particular experiment. Auto MS/MS mode was performed and the 10–15 most abundant precursors were selected for MS/MS per cycle using narrow isolation and an active exclusion time of 1 minute. The acquisition scan rate was set at 8 Hz for MS and 3.5 Hz for MS/MS. Peak area analyses were performed using the MS1 Full‑Scan Filtering option in Skyline (64‑bit, version 3.1), and Spectrum Mill (Rev B.04.01) was used for peptide identification. MS/MS
Agilent AssayMAP Bravo Cartridges, analytical instrumentation, and softwareAutomationCore automation platform Agilent AssayMAP Bravo (G5542BA)Agilent AssayMAP cartridges (96 cartridges/rack)
96 Fe(III)‑NTA cartridge rack (G5496‑60085) 96 Resin‑free cartridge rack (G5496‑60009)
Additional accessories Agilent PlateLoc Thermal Microplate Sealer (G5402A)LC/MSMass spectrometer Agilent 6550 iFunnel Q‑TOF LC/MS
Dual Agilent Jet Stream ESILC systems and columns Agilent 1290 Infinity LC System
Agilent AdvanceBio Peptide Mapping Column (C18): Anayltical: 2.1 × 250 mm, 2.7 µm (651750‑902) 2.1 × 150 mm, 2.7 µm (653750‑902) Guard: 2.1 mm Fast Guard (851725‑911)
SoftwareAgilent AssayMAP Protein Sample Prep Workbench v2.0 Agilent MassHunter Acquisition for TOF/Q‑TOF, Rev. B.06.01 Spectrum Mill MS Proteomics Workbench, Rev. B.04.01 Skyline (64‑bit), version 3.1
Table 2. Instrumentation and consumables.
Figure 1. Agilent AssayMAP Phosphopeptide Enrichment v2.0 App. Representative applications settings and labware selections for phosphopeptide enrichment from yeast digests. Settings and labware were adjusted based upon the needs of the particular experiment.
5
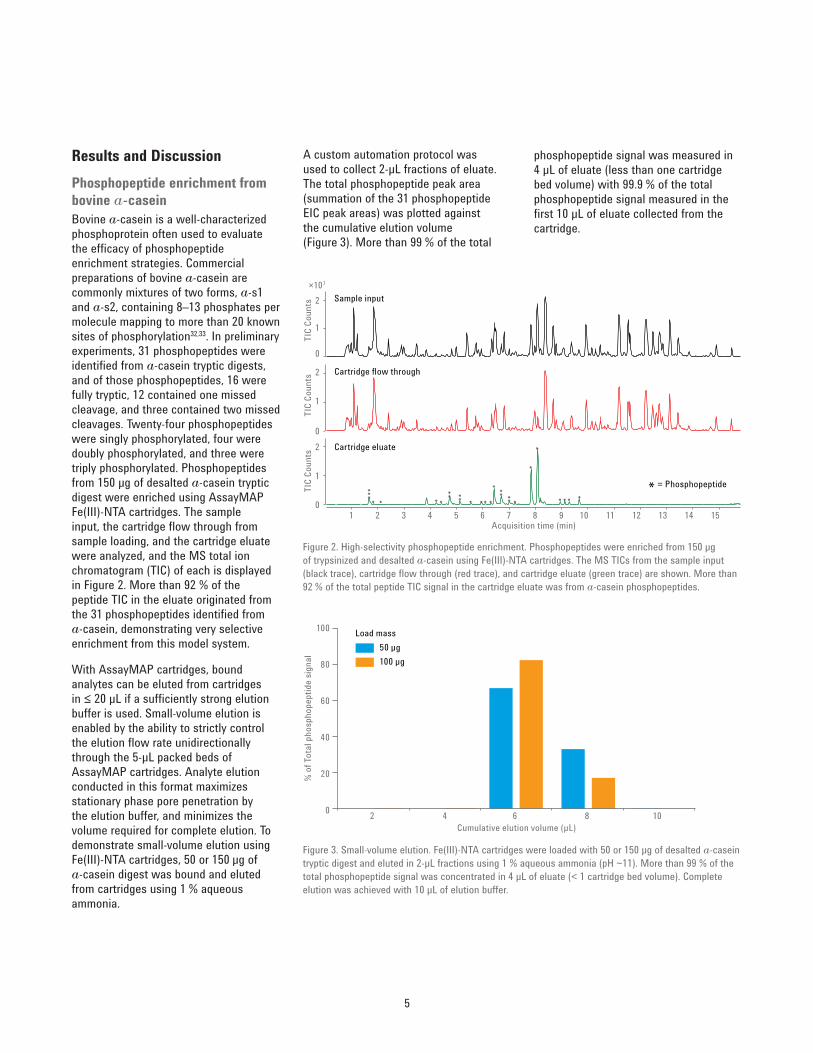
A custom automation protocol was used to collect 2‑μL fractions of eluate. The total phosphopeptide peak area (summation of the 31 phosphopeptide EIC peak areas) was plotted against the cumulative elution volume (Figure 3). More than 99 % of the total
Results and DiscussionPhosphopeptide enrichment from bovine a-caseinBovine a‑casein is a well‑characterized phosphoprotein often used to evaluate the efficacy of phosphopeptide enrichment strategies. Commercial preparations of bovine a‑casein are commonly mixtures of two forms, a‑s1 and a‑s2, containing 8–13 phosphates per molecule mapping to more than 20 known sites of phosphorylation32,33. In preliminary experiments, 31 phosphopeptides were identified from a‑casein tryptic digests, and of those phosphopeptides, 16 were fully tryptic, 12 contained one missed cleavage, and three contained two missed cleavages. Twenty‑four phosphopeptides were singly phosphorylated, four were doubly phosphorylated, and three were triply phosphorylated. Phosphopeptides from 150 μg of desalted a‑casein tryptic digest were enriched using AssayMAP Fe(III)‑NTA cartridges. The sample input, the cartridge flow through from sample loading, and the cartridge eluate were analyzed, and the MS total ion chromatogram (TIC) of each is displayed in Figure 2. More than 92 % of the peptide TIC in the eluate originated from the 31 phosphopeptides identified from a‑casein, demonstrating very selective enrichment from this model system.
With AssayMAP cartridges, bound analytes can be eluted from cartridges in ≤ 20 μL if a sufficiently strong elution buffer is used. Small‑volume elution is enabled by the ability to strictly control the elution flow rate unidirectionally through the 5‑μL packed beds of AssayMAP cartridges. Analyte elution conducted in this format maximizes stationary phase pore penetration by the elution buffer, and minimizes the volume required for complete elution. To demonstrate small‑volume elution using Fe(III)‑NTA cartridges, 50 or 150 μg of a‑casein digest was bound and eluted from cartridges using 1 % aqueous ammonia.
0
1
2 Sample input
1
2 Cartridge flow through
0
0
1
2
TIC
Coun
tsTI
C Co
unts
TIC
Coun
ts
×107
Acquisition time (min)1 2 3 4 5 6 7 8 9 10 11 12 13 14 15
Cartridge eluate
**
**
** *
*
*
* ** **** ** * * ****** *
= Phosphopeptide
Figure 2. High‑selectivity phosphopeptide enrichment. Phosphopeptides were enriched from 150 μg of trypsinized and desalted a‑casein using Fe(III)‑NTA cartridges. The MS TICs from the sample input (black trace), cartridge flow through (red trace), and cartridge eluate (green trace) are shown. More than 92 % of the total peptide TIC signal in the cartridge eluate was from a‑casein phosphopeptides.
0
20
40
60
80
100
2 4 6 8 10Cumulative elution volume (µL)
% o
f Tot
al p
hosp
hope
ptid
e si
gnal
50 µg100 µg
Load mass
Figure 3. Small‑volume elution. Fe(III)‑NTA cartridges were loaded with 50 or 150 μg of desalted a‑casein tryptic digest and eluted in 2‑μL fractions using 1 % aqueous ammonia (pH ~11). More than 99 % of the total phosphopeptide signal was concentrated in 4 μL of eluate (< 1 cartridge bed volume). Complete elution was achieved with 10 μL of elution buffer.
phosphopeptide signal was measured in 4 μL of eluate (less than one cartridge bed volume) with 99.9 % of the total phosphopeptide signal measured in the first 10 μL of eluate collected from the cartridge.

6
of 31 phosphopeptides were summed, and the average total phosphopeptide signal from the replicates was plotted against the mass of sample loaded onto cartridges (Figure 4). As an additional point of reference, the phosphate content of the input sample was estimated using reported literature values for bovine a‑casein and plotted against the mass of sample loaded32,33. The total phosphopeptide signal was constant up to 150 μg (~60 nmol of phosphate), after which the signal began to decrease as the cartridge became saturated with phosphopeptides and global binding capacity was exceeded.
in the cartridge flow through suggested that the global phosphopeptide binding capacity of the Fe(III)‑NTA cartridges had been exceeded. To confirm this, a capacity study was performed in which 25–400 μg of a‑casein digest was loaded onto Fe(III)‑NTA cartridges (n = 4) yielding 40 parallel phosphopeptide enrichments. Cartridge eluates were diluted to 1 μg/μL based upon the mass of sample loaded onto cartridges with equal volumes injected for each sample. If enrichment was 100 % efficient at each load mass, the total phosphopeptide signal should remain constant across the tested range. The EIC peak areas
In the experiments where 150 μg of a‑casein digest was loaded onto Fe(III)‑NTA cartridges, there was a small, but measureable, phosphopeptide signal in the cartridge flow through. By comparison, there was no phosphopeptide signal in the flow through from the 50 μg cartridge load. The overwhelming majority of the phosphopeptide signal in the flow through from 150 μg sample loads was from highly basic phosphopeptides, typically those phosphopeptides with one or two missed cleavages. After ruling out the sample‑loading flow rate as the root cause, the presence of phosphopeptides
0
40
80
100
120
0
0.5
1.0
1.5
2.0
25 50 75 100 150 200 250 300 350 400
Tota
l pho
spho
pept
ide
EIC
peak
are
a
Mass of a-casein tryptic digest (µg)
MS Signal (n = 4)Estimated phosphate content in sample load
Estim
ated
pho
spha
te c
onte
nt (n
mol
)×108
Figure 4. Global phosphopeptide cartridge capacity with an a‑casein model system. Digested and desalted a‑casein was loaded onto Fe(III)‑NTA cartridges in amounts spanning 25 to 400 μg. The total peak area signal generated from EICs of all identified phosphopeptides was plotted against the mass of digest loaded onto cartridges. The estimated phosphate content of the sample was derived from the known phosphate content of bovine a‑casein. Above 150 μg of sample (~60 nmol of phosphate), the cartridge capacity was exceeded for global quantitative phosphopeptide binding.
7
displace basic phosphopeptides from the cartridge resin bed during the sample loading process. The fact that phosphoryl moieties bind to immobilized Fe(III) through a combination of electrostatic interactions and metal coordination means that to minimize bias one must work within the global phosphopeptide binding capacity25. Because automated phosphopeptide enrichment is reproducible with the AssayMAP Bravo, any phosphopeptide‑specific biases can be accurately measured and addressed through similar cartridge capacity studies, as is later demonstrated with yeast lysates.
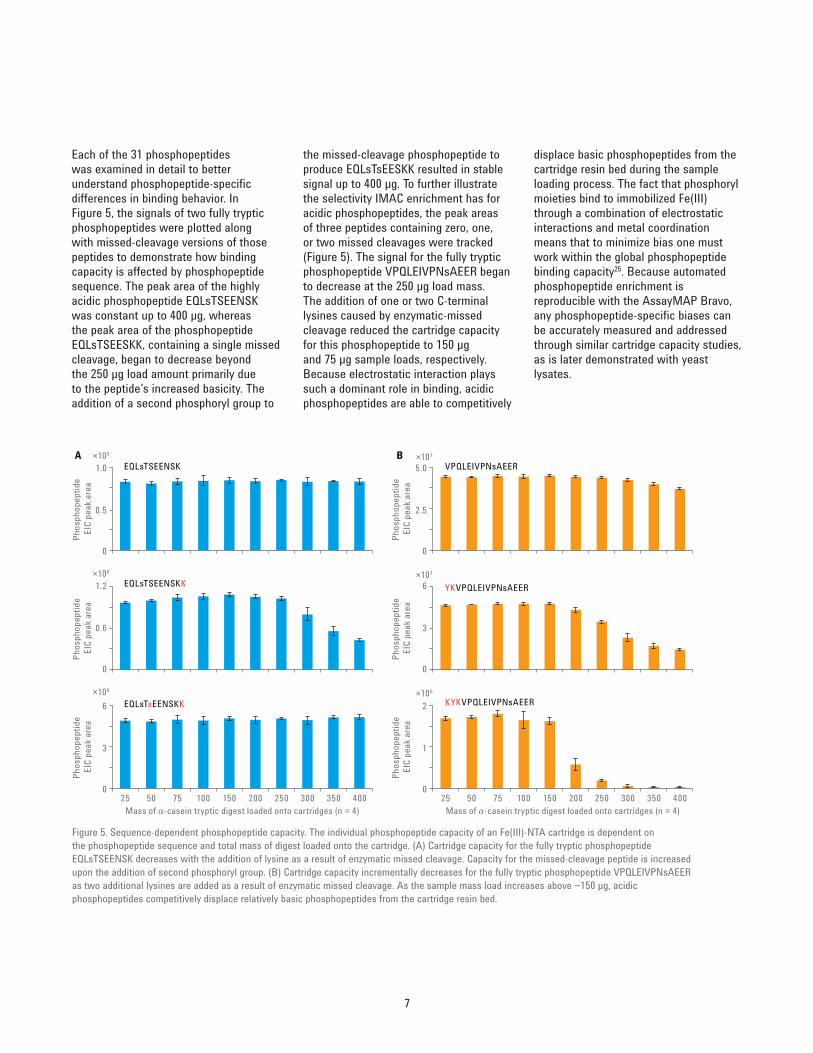
the missed‑cleavage phosphopeptide to produce EQLsTsEESKK resulted in stable signal up to 400 μg. To further illustrate the selectivity IMAC enrichment has for acidic phosphopeptides, the peak areas of three peptides containing zero, one, or two missed cleavages were tracked (Figure 5). The signal for the fully tryptic phosphopeptide VPQLEIVPNsAEER began to decrease at the 250 μg load mass. The addition of one or two C‑terminal lysines caused by enzymatic‑missed cleavage reduced the cartridge capacity for this phosphopeptide to 150 μg and 75 μg sample loads, respectively. Because electrostatic interaction plays such a dominant role in binding, acidic phosphopeptides are able to competitively
Each of the 31 phosphopeptides was examined in detail to better understand phosphopeptide‑specific differences in binding behavior. In Figure 5, the signals of two fully tryptic phosphopeptides were plotted along with missed‑cleavage versions of those peptides to demonstrate how binding capacity is affected by phosphopeptide sequence. The peak area of the highly acidic phosphopeptide EQLsTSEENSK was constant up to 400 μg, whereas the peak area of the phosphopeptide EQLsTSEESKK, containing a single missed cleavage, began to decrease beyond the 250 μg load amount primarily due to the peptide’s increased basicity. The addition of a second phosphoryl group to
25 50 75 100 150 200 250 300 350 400 25 50 75 100 150 200 250 300 350 400
0
0.5
1.0
0
0.6
1.2
0
3
6
0
2.5
5.0
0
3
6
0
1
2
EQLsTSEENSKA B
EQLsTSEENSKK
EQLsTsEENSKK
VPQLEIVPNsAEER
YKVPQLEIVPNsAEER
KYKVPQLEIVPNsAEER
Mass of a-casein tryptic digest loaded onto cartridges (n = 4) Mass of a-casein tryptic digest loaded onto cartridges (n = 4)
Phos
phop
eptid
e EI
C pe
ak a
rea
Phos
phop
eptid
e EI
C pe
ak a
rea
Phos
phop
eptid
e EI
C pe
ak a
rea
Phos
phop
eptid
e EI
C pe
ak a
rea
Phos
phop
eptid
e EI
C pe
ak a
rea
Phos
phop
eptid
e EI
C pe
ak a
rea
×105
×106
×106
×107
×107
×106
Figure 5. Sequence‑dependent phosphopeptide capacity. The individual phosphopeptide capacity of an Fe(III)‑NTA cartridge is dependent on the phosphopeptide sequence and total mass of digest loaded onto the cartridge. (A) Cartridge capacity for the fully tryptic phosphopeptide EQLsTSEENSK decreases with the addition of lysine as a result of enzymatic missed cleavage. Capacity for the missed‑cleavage peptide is increased upon the addition of second phosphoryl group. (B) Cartridge capacity incrementally decreases for the fully tryptic phosphopeptide VPQLEIVPNsAEER as two additional lysines are added as a result of enzymatic missed cleavage. As the sample mass load increases above ~150 μg, acidic phosphopeptides competitively displace relatively basic phosphopeptides from the cartridge resin bed.

8
aspartic acid, or phosphoric acid, the degree of ionization decreases for glutamic and aspartic acid while the degree of ionization of phosphoric acid is relatively constant.20 This suggests that as the % ACN increases in a sample containing an acid modifier (such as TFA or acetic acid), carboxyl groups of peptides become protonated (neutral) while the phosphoryl groups of phosphopeptides remain negatively charged. This permits selective binding of the negatively charged phosphoryl group of phosphopeptides to the positively charged iron immobilized on the NTA resin.
Control of sample and wash solution pH is imperative to achieving efficient and reproducible phosphopeptide enrichment. One of the keys to selectively enriching phosphopeptides is exploiting the differences in ionizability of the phosphoryl group of phosphopeptides and carboxyl groups of unmodified peptides (while also considering the ionizability of the acid modifier). At a fixed concentration of acid modifier, the ionizability of acidic and basic analytes can be effectively tuned by the addition of organic solvent28‑30. It has been shown that as acetonitrile is titrated into solutions containing glutamic acid,
Phosphopeptide enrichment from yeast whole-cell lysateWe next evaluated the chemistry and protocol factors affecting phosphopeptide enrichment from yeast, a widely used model system in the study of signal transduction pathways controlled by phosphorylation. Complex peptide mixtures were generated by bulk tryptic digestion and reversed‑phase desalting of protein extracts from yeast whole cell lysate. Sample solutions and wash buffers comprising 0.01, 0.1, or 1.0 % TFA, or acetic acid in 80 % ACN were used to enrich phosphopeptides from 500 μg of yeast digest. Samples were loaded onto cartridges (n = 3) and washed with a buffer containing the same acid type and concentration as the samples. As shown in Figure 6, at 0.01 % and 0.1 % both TFA and acetic acid generated very similar numbers of distinct phosphopeptide identifications (~2,300). However, at 0.1 % the average phosphopeptide selectivity increased from 80 % to 96 % for TFA, and from 82 % to 91 % for acetic acid. As the acid percentage was increased to 1.0 %, the number of phosphopeptide identifications dramatically decreased with TFA from 2,375 to 550, accompanied by a decrease in selectivity to 87 %. With 1.0 % acetic acid, a more moderate decrease in phosphopeptide identifications occurred (2,266 to 1,783), but phosphopeptide selectivity improved to 97 %. Overall, the use of 0.1 % TFA produced greatest number of identifications while maintaining high selectivity, although the use of 0.1 % acetic acid produced comparable results.
0
20
40
60
80
100
0
500
1,000
1,500
2,000
2,500
3,000
Acetic acid TFA
0.01 %
0.10 %
1.00 %
%
Phos
phop
eptid
e sel
ectiv
ity
Dist
inct
pho
spho
pept
ides
Phosphopeptide identificationsPhosphopeptide selectivity
Figure 6. Effect of acid type and concentration on phosphopeptide enrichment. Digested and desalted yeast digests (500 μg) were loaded onto Fe(III)‑NTA cartridges with varying amounts of acetic acid or TFA in the presence of 80 % ACN (n = 3). An acid concentration of 0.1 % yields the best balance of distinct phosphopeptide identifications and phosphopeptide selectivity for both acids.
9
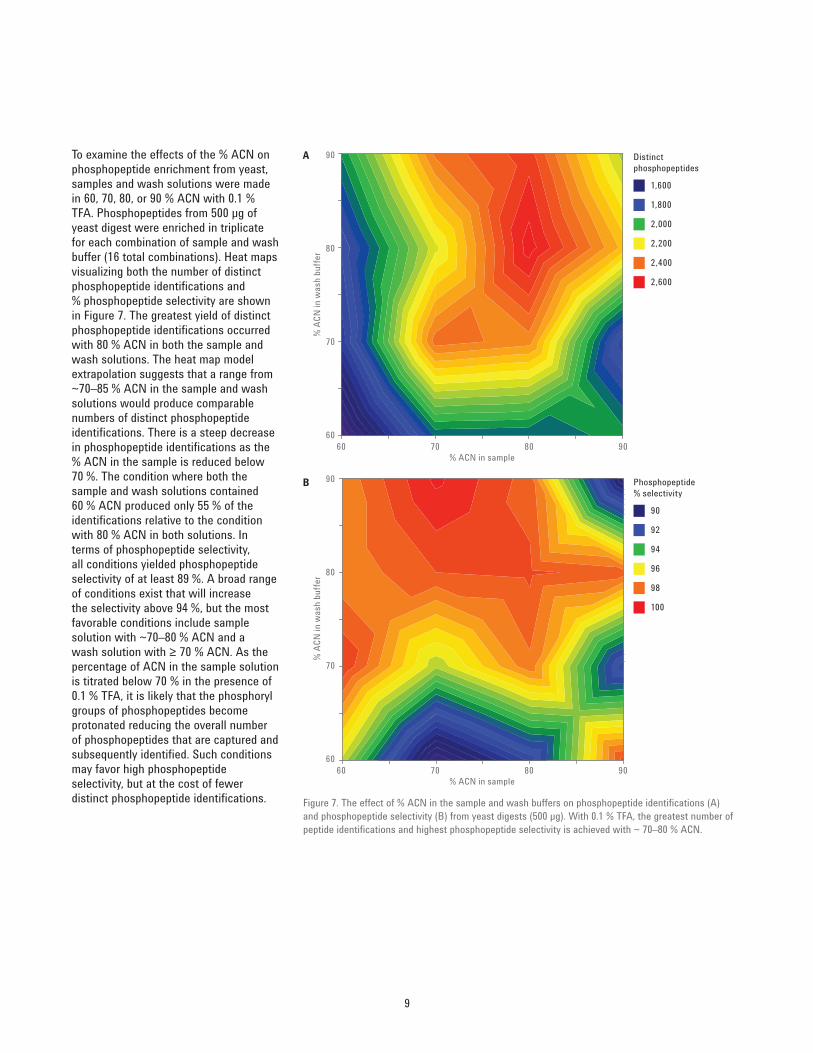
To examine the effects of the % ACN on phosphopeptide enrichment from yeast, samples and wash solutions were made in 60, 70, 80, or 90 % ACN with 0.1 % TFA. Phosphopeptides from 500 μg of yeast digest were enriched in triplicate for each combination of sample and wash buffer (16 total combinations). Heat maps visualizing both the number of distinct phosphopeptide identifications and % phosphopeptide selectivity are shown in Figure 7. The greatest yield of distinct phosphopeptide identifications occurred with 80 % ACN in both the sample and wash solutions. The heat map model extrapolation suggests that a range from ~70–85 % ACN in the sample and wash solutions would produce comparable numbers of distinct phosphopeptide identifications. There is a steep decrease in phosphopeptide identifications as the % ACN in the sample is reduced below 70 %. The condition where both the sample and wash solutions contained 60 % ACN produced only 55 % of the identifications relative to the condition with 80 % ACN in both solutions. In terms of phosphopeptide selectivity, all conditions yielded phosphopeptide selectivity of at least 89 %. A broad range of conditions exist that will increase the selectivity above 94 %, but the most favorable conditions include sample solution with ~70–80 % ACN and a wash solution with ≥ 70 % ACN. As the percentage of ACN in the sample solution is titrated below 70 % in the presence of 0.1 % TFA, it is likely that the phosphoryl groups of phosphopeptides become protonated reducing the overall number of phosphopeptides that are captured and subsequently identified. Such conditions may favor high phosphopeptide selectivity, but at the cost of fewer distinct phosphopeptide identifications.
% A
CN in
was
h bu
ffer
% ACN in sample
6060 70 80 90
70
80
90
% A
CN in
was
h bu
ffer
% ACN in sample
6060 70 80 90
70
80
90
Distinctphosphopeptides
1,600
1,800
2,000
2,200
2,400
2,600
Phosphopeptide% selectivity
90
92
94
96
98
100
A
B
Figure 7. The effect of % ACN in the sample and wash buffers on phosphopeptide identifications (A) and phosphopeptide selectivity (B) from yeast digests (500 μg). With 0.1 % TFA, the greatest number of peptide identifications and highest phosphopeptide selectivity is achieved with ~ 70–80 % ACN.
10
distinct phosphopeptides identifications was less affected by the presence of microparticulates because the vast majority of the sample was solubilized in each condition. Phosphopeptide binding capacity is not altered by the presence of microparticulates, and the level of contamination from unmodified peptides was not high enough to severely restrict phosphopeptide sampling during Auto MS/MS. However, a reduction in both phosphopeptide selectivity and number of identifications will be exacerbated with increased levels of microparticulates. For best enrichment performance, only particulate‑free samples should be used.
A critical parameter for all sample preparation protocols using AssayMAP cartridges is the flow rate at which samples are loaded onto cartridges. A key to successful analyte binding, assuming the chemistry conditions have been optimized, is providing analytes sufficient time to penetrate the pores of resin and interact with the stationary phase. Yeast digest (500 μg) was loaded onto Fe(III)‑NTA cartridges in four separate experiments using a sample‑loading flow rate of 2.0, 3.5, 5.0, or 6.5 μL/min (n = 3) and the distinct number of phosphopeptides and phosphopeptide selectivity were assessed (Figure 9). The 2.0 and 3.5 μL/min sample‑loading flow rates produced nearly identical results. As the sample‑loading flow rate was increased beyond 3.5 μL/min, both the number of distinct phosphopeptide identifications and phosphopeptide selectivity declined. Relative to 6.5 μL/min, the 3.5 μL/min flow rate produced 9.4 % more distinct phosphopeptide identifications, but required nearly twice as much time to load the sample. The decrease in selectivity with increasing flow rate was a direct result of capturing fewer phosphopeptides as the number of unmodified peptides identified at each flow rate was relatively constant. Ideally, the sample‑loading flow rate should be optimized for each set of sample conditions; however, using Phosphopeptide Enrichment v2.0 App’s default sample loading flow rate of 5 μL/min will likely be very close to the optimum flow rate for many experimental conditions.
be aspirated into the syringes from sample wells. Particulate‑laden sample is then dispensed through an Fe(III)‑NTA cartridge where microparticulates accumulate at the top of the resin bed. Performing an internal cartridge wash with high‑organic, acidic solutions is inadequate to solubilize these microparticulates, but such wash solution compositions are essential for reducing nonspecific binding and retaining phosphopeptides. Phosphopeptide elution employs aqueous solutions at basic pH levels which solubilize the peptide microparticulates at the top the resin bed. The newly solubilized unmodified peptides coelute with bound phosphopeptides. The net result is that phosphopeptide binding is largely not affected by the presence of microparticulates, but selectivity decreases due to an increase in unmodified peptides in the eluate originating from microparticulates.
To further illustrate this point, three different strategies for sample solubilization and particulate removal were used prior to enriching phosphopeptides from 500 μg of yeast digest:
1. The aqueous component of 80 % ACN/0.1 % TFA was added to samples followed by the addition of the organic component. The samples were vortexed, and suspended microparticulates were pelleted by centrifugation.
2. A solution of 80 % ACN/0.1 % TFA was added to samples. The samples were vortexed, and suspended microparticles were pelleted by centrifugation.
3. A solution of 80 % ACN/0.1 % TFA was added to samples. The samples were vortexed, and no attempt was made to remove suspended microparticles.
As shown in Figure 8 (bottom), phosphopeptide selectivity decreased from 96 % to 78 % correlating with the tendency to form and retain suspended sample microparticulates due to the sample handling strategy. The number of
Because phosphopeptide enrichment performance using AssayMAP Fe(III)‑NTA cartridges is dependent on the % ACN in the sample and wash solutions, evaporation from labware on the deck of the AssayMAP Bravo should be closely monitored during the method development process to evaluate if evaporation is affecting phosphopeptide enrichment. If it is determined that evaporation is negatively affecting enrichment, several steps can be taken to mitigate evaporation:
• Adjust the sample volume and flow rate to reduce the total protocol time (sample loading is the typically the lengthiest process).
• Adjust the sample and wash buffer formulations to account for evaporation.
• Use labware that minimizes evaporation (avoid using open reservoirs).
• Use a larger volume labware overage (see the Phosphopeptide Enrichment v2.0 User Guide).
• Run the protocol in a step‑wise manner such that labware is placed on deck only when needed.
A contributor to poor phosphopeptide selectivity using Fe(III)‑NTA AssayMAP cartridges is incomplete sample solubilization. Often, samples for phosphopeptides enrichment have first been desalted and lyophilized leaving a dry or semidry solid. When an acidic solution containing a high percentage of ACN is added to dried samples, it can be challenging to completely solubilize samples such that no peptide microparticulates are present. Microparticulates, to a large degree, are representative of the peptide profile of the entire sample and contain mostly unmodified peptides. Microparticulates can reduce phosphopeptide selectivity using AssayMAP Fe(III)‑NTA cartridges as illustrated in Figure 8 (top). Sample microparticulates, which may only represent a small fraction of sample relative to the solubilized sample, can

11
A B C D
500 0
20
40
60
80
100
1,000
1,500
2,000
2,500
3,000
3,500
1 2 3Solubilization technique
4,000
Phosphopeptide identificationsPhosphopeptide selectivity
% P
hosp
hope
ptid
e se
lect
ivity
Dist
inct
pho
spho
pept
ides
Figure 8. The effect of sample particulates on phosphopeptide enrichment from yeast. (Top) Sample particulates containing mostly unmodified peptides can cause poor phosphopeptide selectivity with Fe(III)‑NTA cartridges. Sample containing particulates can be aspirated from sample wells (A); as the sample is dispensed through cartridges, particulates will accumulate at the top of the cartridge resin bed (B); particulates can remain at the top of the resin bed after internal cartridge washing (C); particulates can solubilize in elution buffer resulting in a large number of unmodified peptides coeluting with phosphopeptides bound to the cartridge (D). (Bottom) How samples are solubilized can dramatically alter phosphopeptide selectivity. Good sample solubilization techniques (1) results in high phosphopeptide selectivity, whereas poor solubilization techniques (3) result in reduced selectivity. See text for details.
2.0 3.5 5.0 6.5Sample loading flow rate (µL/min)
500
0 0
20
40
60
80
100
1,000
1,500
2,000
2,500
3,000
% P
hosp
hope
ptid
e se
lect
ivity
Dist
inct
pho
spho
pept
ides
Phosphopeptide identificationsPhosphopeptide selectivity
Figure 9. Effect of sample‑loading flow rate on phosphopeptide enrichment. Yeast digests (500 μg) were loaded onto Fe(III)‑NTA cartridges at four different sample‑loading flow rates to determine the effect of flow rate on phosphopeptide identifications and selectivity (n = 3). With a sample‑loading flow rate above 3.5 μL/min, both the number of phosphopeptide identifications and phosphopeptide selectivity decrease indicating insufficient residence time for phosphopeptide binding.
12
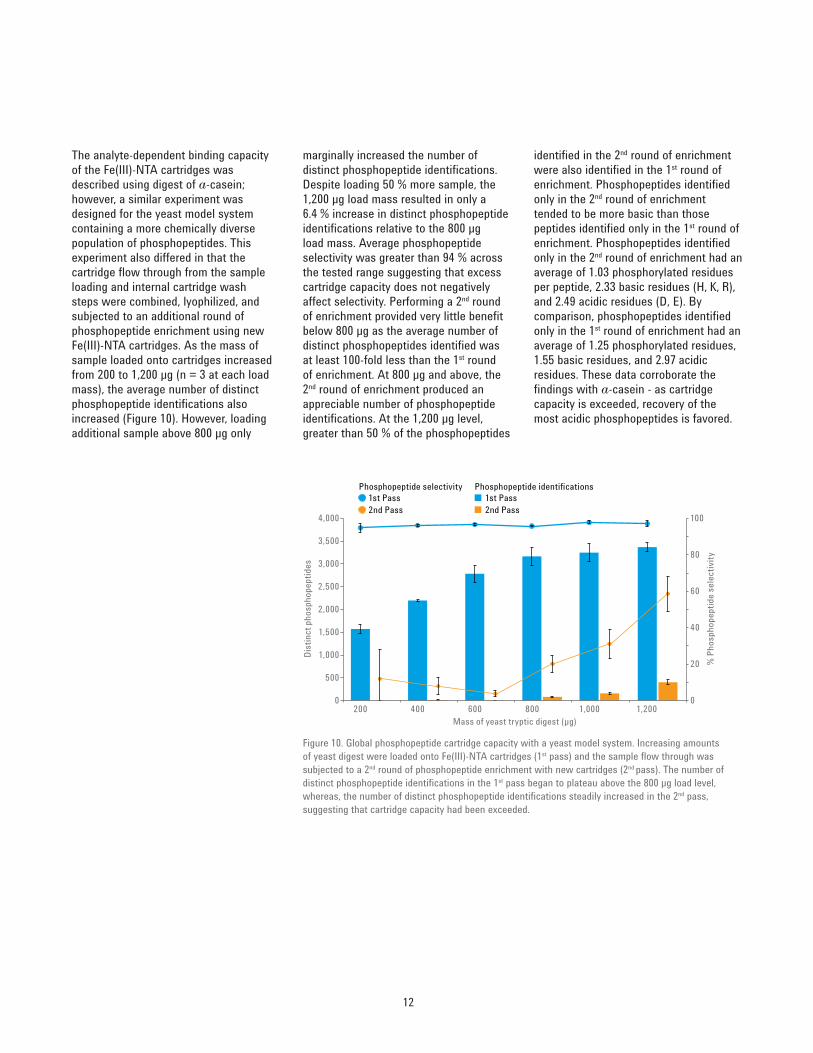
identified in the 2nd round of enrichment were also identified in the 1st round of enrichment. Phosphopeptides identified only in the 2nd round of enrichment tended to be more basic than those peptides identified only in the 1st round of enrichment. Phosphopeptides identified only in the 2nd round of enrichment had an average of 1.03 phosphorylated residues per peptide, 2.33 basic residues (H, K, R), and 2.49 acidic residues (D, E). By comparison, phosphopeptides identified only in the 1st round of enrichment had an average of 1.25 phosphorylated residues, 1.55 basic residues, and 2.97 acidic residues. These data corroborate the findings with a‑casein ‑ as cartridge capacity is exceeded, recovery of the most acidic phosphopeptides is favored.
marginally increased the number of distinct phosphopeptide identifications. Despite loading 50 % more sample, the 1,200 μg load mass resulted in only a 6.4 % increase in distinct phosphopeptide identifications relative to the 800 μg load mass. Average phosphopeptide selectivity was greater than 94 % across the tested range suggesting that excess cartridge capacity does not negatively affect selectivity. Performing a 2nd round of enrichment provided very little benefit below 800 μg as the average number of distinct phosphopeptides identified was at least 100‑fold less than the 1st round of enrichment. At 800 μg and above, the 2nd round of enrichment produced an appreciable number of phosphopeptide identifications. At the 1,200 μg level, greater than 50 % of the phosphopeptides
The analyte‑dependent binding capacity of the Fe(III)‑NTA cartridges was described using digest of a‑casein; however, a similar experiment was designed for the yeast model system containing a more chemically diverse population of phosphopeptides. This experiment also differed in that the cartridge flow through from the sample loading and internal cartridge wash steps were combined, lyophilized, and subjected to an additional round of phosphopeptide enrichment using new Fe(III)‑NTA cartridges. As the mass of sample loaded onto cartridges increased from 200 to 1,200 μg (n = 3 at each load mass), the average number of distinct phosphopeptide identifications also increased (Figure 10). However, loading additional sample above 800 μg only
0
20
40
60
80
100
0
500
1,000
1,500
2,000
2,500
3,000
3,500
4,000
200 400 600 800 1,000 1,200Mass of yeast tryptic digest (µg)
Phosphopeptide identificationsPhosphopeptide selectivity1st Pass2nd Pass
1st Pass2nd Pass
% P
hosp
hope
ptid
e se
lect
ivity
Dist
inct
pho
spho
pept
ides
Figure 10. Global phosphopeptide cartridge capacity with a yeast model system. Increasing amounts of yeast digest were loaded onto Fe(III)‑NTA cartridges (1st pass) and the sample flow through was subjected to a 2nd round of phosphopeptide enrichment with new cartridges (2nd pass). The number of distinct phosphopeptide identifications in the 1st pass began to plateau above the 800 μg load level, whereas, the number of distinct phosphopeptide identifications steadily increased in the 2nd pass, suggesting that cartridge capacity had been exceeded.
13
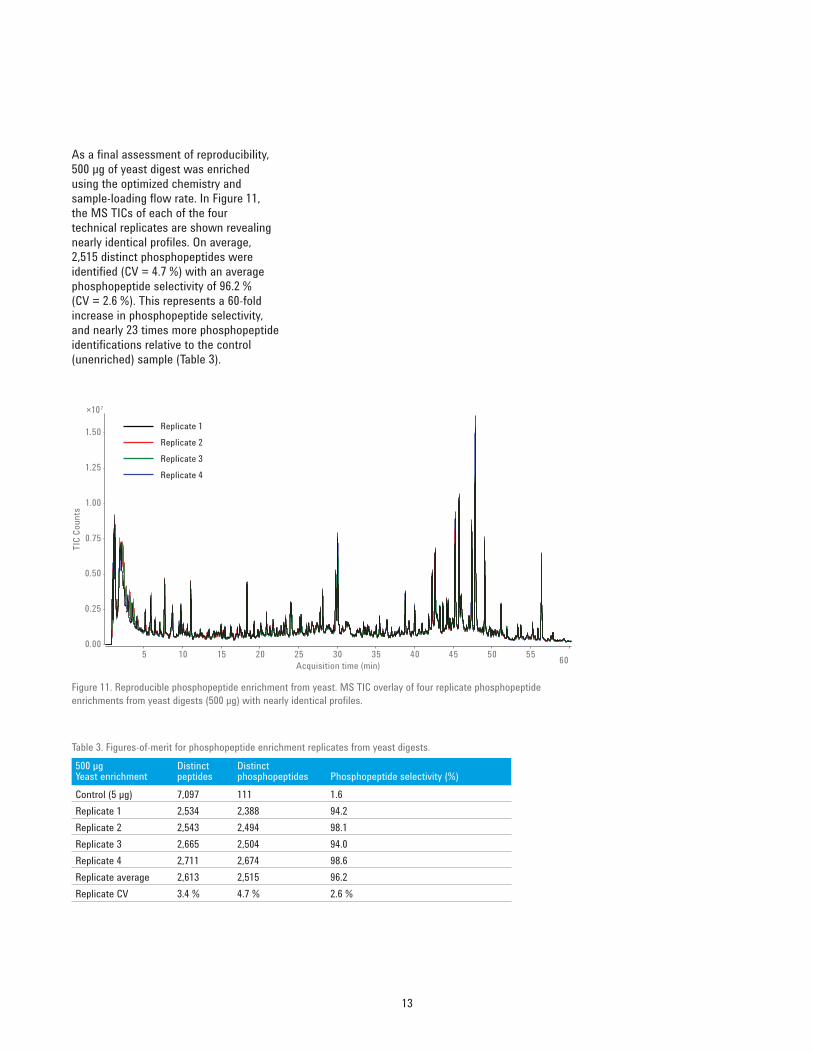
As a final assessment of reproducibility, 500 μg of yeast digest was enriched using the optimized chemistry and sample‑loading flow rate. In Figure 11, the MS TICs of each of the four technical replicates are shown revealing nearly identical profiles. On average, 2,515 distinct phosphopeptides were identified (CV = 4.7 %) with an average phosphopeptide selectivity of 96.2 % (CV = 2.6 %). This represents a 60‑fold increase in phosphopeptide selectivity, and nearly 23 times more phosphopeptide identifications relative to the control (unenriched) sample (Table 3).
0.00
0.25
0.50
0.75
1.00
1.25
1.50
5 10 15 20 25 30 35 40 45 50 55 60
TIC
Coun
ts
Acquisition time (min)
Replicate 1Replicate 2Replicate 3Replicate 4
×107
Figure 11. Reproducible phosphopeptide enrichment from yeast. MS TIC overlay of four replicate phosphopeptide enrichments from yeast digests (500 μg) with nearly identical profiles.
Table 3. Figures‑of‑merit for phosphopeptide enrichment replicates from yeast digests.500 µg Yeast enrichment
Distinct peptides
Distinct phosphopeptides Phosphopeptide selectivity (%)
Control (5 µg) 7,097 111 1.6Replicate 1 2,534 2,388 94.2Replicate 2 2,543 2,494 98.1Replicate 3 2,665 2,504 94.0Replicate 4 2,711 2,674 98.6Replicate average 2,613 2,515 96.2Replicate CV 3.4 % 4.7 % 2.6 %
14
9. Ndassa, Y.M., Orsi, C., Marto, J.A., Chen, S. & Ross, M.M. Improved immobilized metal affinity chromatography for large‑scale phosphoproteomics applications. J. Proteome. Res., 2006, 5:2789‑2799.
10. Feng, S. et al. Immobilized zirconium ion affinity chromatography for specific enrichment of phosphopeptides in phosphoproteome analysis. Mol. Cell. Proteomics, 2007, 6:1656‑1665.
11. Imanishi, S.Y., Kochin, V. & Eriksson, J.E. Optimization of phosphopeptide elution conditions in immobilized Fe(III) affinity chromatography. Proteomics, 2007, 7:174‑176.
12. Jensen, S.S. & Larsen, M.R. Evaluation of the impact of some experimental procedures on different phosphopeptide enrichment techniques. Rapid Commun. Mass Spectrom., 2007, 21:3635‑3645.
13. Steen, H., Stensballe, A. & Jensen, O.N. Phosphopeptide purification by IMAC with Fe(III) and Ga(III). Cold Spring Harbor Protocols, 2007, 2007:pdb.prot4607.
14. Feng, S. et al. Fe3+ immobilized metal affinity chromatography with silica monolithic capillary column for phosphoproteome analysis. Proteomics, 2007, 7:351‑360.
15. Thingholm, T.E., Jensen, O.N., Robinson, P.J. & Larsen, M.R. SIMAC (Sequential Elution from IMAC), a phosphoproteomics strategy for the rapid separation of monophosphorylated from multiply phosphorylated peptides. Mol. Cell. Proteomics, 2008, 7:661‑671.
16. Tsai, C.‑F. et al. Immobilized metal affinity chromatography revisited: pH/Acid control toward high selectivity in phosphoproteomics. J. Proteome. Res., 2008, 7:4058‑4069.
17. Villen, J. & Gygi, S.P. The SCX/IMAC enrichment approach for global phosphorylation analysis by mass spectrometry. Nature Protocols, 2008, 3:1630‑1638.
References1. Li, S. & Dass, C. Iron(III)‑immobilized
metal ion affinity chromatography and mass spectrometry for the purification and characterization of synthetic phosphopeptides. Anal. Biochem., 1999, 270:9‑14.
2. Posewitz, M.C. & Tempst, P. Immobilized gallium(III) affinity chromatography of phosphopeptides. Anal. Chem., 1999, 71:2883‑2892.
3. Hart, S.R., Waterfield, M.D., Burlingame, A.L. & Cramer, R. Factors governing the solubilization of phosphopeptides retained on ferric NTA IMAC beads and their analysis by MALDI TOFMS. J. Am. Soc. Mass Spectrom., 2002, 13:1042‑1051.
4. Ficarro, S. et al. Phosphoproteome analysis by mass spectrometry and its application to Saccharomyces cerevisiae. Nat. Biotechnol., 2002, 20:301 ‑ 305.
5. Stensballe, A. & Jensen, O.N. Phosphoric acid enhances the performance of Fe(III) affinity chromatography and matrix‑assisted laser desorption/ionization tandem mass spectrometry for recovery, detection and sequencing of phosphopeptides. Rapid Commun. Mass Spectrom., 2004, 18:1721‑1730.
6. Barnouin, K.N. et al. Enhanced phosphopeptide isolation by Fe(III)‑IMAC using 1,1,1,3,3,3‑hexafluoroisopropanol. Proteomics, 2005, 5:4376‑4388.
7. Kange, R. et al. Comparison of different IMAC techniques used for enrichment of phosphorylated peptides. Journal of Biomolecular Techniques, 2005, 16:91‑103.
8. Seeley, E.H., Riggs, L.D. & Regnier, F.E. Reduction of non‑specific binding in Ga(III) immobilized metal affinity chromatography for phosphopeptides by using endoproteinase glu‑C as the digestive enzyme. J. Chromatogr. B, 2005, 817:81‑88.
ConclusionsPhosphopeptide enrichment from complex mixtures is one of the most challenging sample preparation tasks to perform reproducibly for LC/MS. The dependence on manual phosphopeptide enrichment strategies makes protocol reproducibility and scalability a significant challenge. The Agilent AssayMAP Bravo addresses these challenges by providing an automation platform upon which phosphopeptide enrichment can be performed reproducibly using high‑capacity AssayMAP Fe(III)‑NTA cartridges. Sample processing can be scaled to perform 1‑to‑96 enrichments in parallel, enabled by a dedicated phosphopeptide enrichment protocol included in the Agilent AssayMAP Protein Sample Prep Workbench v2.0 software suite.
We have characterized the capacity of AssayMAP Fe(III)‑NTA cartridges, and described the effects of solution chemistry on phosphopeptide selectivity and distinct phosphopeptide identifications. Using sample and wash solutions comprising 80 % ACN/0.1 % TFA, up to 800 μg of yeast digest can be loaded onto Fe(III)‑NTA cartridges before cartridge capacity is exceeded. Phosphopeptide selectivity is routinely above 90 % and thousands of phosphopeptides can be enriched and identified from yeast tryptic digests with % CVs < 10 % for aggregate distinct phosphopeptide identifications. These data demonstrate that thousands of phosphopeptides can be enriched and identified from complex samples in a reproducible fashion using an automated approach facilitated by Agilent AssayMAP Fe(III)‑NTA cartridges, the Agilent AssayMAP Phosphopeptide Enrichment v2.0 automation App, and the Agilent 6550 iFunnel Q‑TOF LC/MS system.
15
27. Subirats, X., Rosés, M. & Bosch, E. On the effect of organic solvent composition on the pH of buffered HPLC mobile phases and the pKa of analytes ‑ A review. Separation & Purification Reviews, 2007, 36:231‑255.
28. Bosch, E., Espinosa, S. & Rosés, M. Retention of ionizable compounds on high‑performance liquid chromatography: III. Variation of pK values of acids and pH values of buffers in acetonitrile–water mobile phases. J. Chromatogr., 1998, 824:137‑146.
29. Espinosa, S., Bosch, E. & Rosés, M. Retention of ionizable compounds on HPLC. 5. pH scales and the retention of acids and bases with acetonitrile−water mobile phases. Anal. Chem., 2000, 72:5193‑5200.
30. Espinosa, S., Bosch, E. & Rosés, M. Retention of ionizable compounds in high‑performance liquid chromatography: 14. Acid–base pK values in acetonitrile–water mobile phases. J. Chromatogr., 2002, 964:55‑66.
31. Swaney, D.L., McAlister, G.C. & Coon, J.J. Decision tree‑driven tandem mass spectrometry for shotgun proteomics. Nat. Methods, 2008, 5:959‑964.
32. Modler, H.W. Functional properties of nonfat dairy ingredients ‑ a review. Modification of products containing casein1,2. J. Dairy Sci., 1985, 68:2195‑2205.
33. Farrell, H.M., Jr. et al. Nomenclature of the proteins of cows’ milk ‑ sixth revision. J. Dairy Sci., 2004, 87:1641‑1674.
18. Ficarro, S.B. et al. Magnetic bead processor for rapid evaluation and optimization of parameters for phosphopeptide enrichment. Anal. Chem., 2009, 81:4566‑4575.
19. Swaney, D.L., Wenger, C.D., Thomson, J.A. & Coon, J.J. Human embryonic stem cell phosphoproteome revealed by electron transfer dissociation tandem mass spectrometry. Proc. Natl. Acad. Sci. U. S. A., 2009, 106:995‑1000.
20. Ye, J. et al. Optimized IMAC−IMAC protocol for phosphopeptide recovery from complex biological samples. J. Proteome. Res., 2010, 9:3561‑3573.
21. Dephoure, N. & Gygi, S.P. A solid phase extraction‑based platform for rapid phosphoproteomic analysis. Methods, 2011, 54:379‑386.
22. Mertins, P. et al. Integrated proteomic analysis of post‑translational modifications by serial enrichment. Nat Meth, 2013, 10:634‑637.
23. Zhu, L., Zhang, J. & Guo, Y. Enhanced detection and desalting free protocol for phosphopeptides eluted from immobilized Fe (III) affinity chromatography in direct MALDI TOF analysis. Journal of Proteomics, 2014, 96:360‑365.
24. Ruprecht, B. et al. Comprehensive and reproducible phosphopeptide enrichment using Fe‑IMAC columns. Mol. Cell. Proteomics, 2014.
25. Holmes, L.D. & Schiller, M.R. Immobilized Iron(III) metal affinity chromatography for the separation of phosphorylated macromolecules: Ligands and applications. J. Liq. Chromatogr. Rel. Technol., 1997, 20:123‑142.
26. Larsen, M.R., Thingholm, T.E., Jensen, O.N., Roepstorff, P. & Jørgensen, T.J.D. Highly selective enrichment of phosphorylated peptides from peptide mixtures using titanium dioxide microcolumns. Mol. Cell. Proteomics, 2005, 4:873‑886.
www.agilent.com/chem For Research Use Only. Not for use in diagnostic procedures.
This information is subject to change without notice.
© Agilent Technologies, Inc., 2015, 2016 Published in the USA, March 16, 2016 5991‑6073EN