agiledc 2014: achieving enduring agile successin large organizations
TRANSCRIPT

Achieving Enduring Agile Success
in Large Organizations
AgileDCOctober 21, 2014

2
Scott Richardson
• Background• 13 years at Capital One, most recently as VP of
Retail & Direct Technology for Consumer & Small Business Bank segments
• Founder/owner of 2 technology consulting companies
• Price Waterhouse – financial systems consultant
• Agile Credentials• Practitioner for 10 years• Certified Agile Scrum Master• Scaled Agile Framework (SAFe) Certified Program
Consultant• Sponsor/Champion for Agile adoption in 5
corporate organizations

3
Overview• Compare and contrast enterprise Agile adoptions: 2004-
2005 vs. 2012-2013• Focus on executive/leadership perspective• Results: What worked and what did not• Overarching keys to success• Deeper dive on metrics
Objectives• Understand approaches and techniques for enterprise-wide
Agile adoption• Identify senior leadership actions to ensure Agile permanence• Appreciate how executive engagement is a key ingredient of
enduring Agile success
4
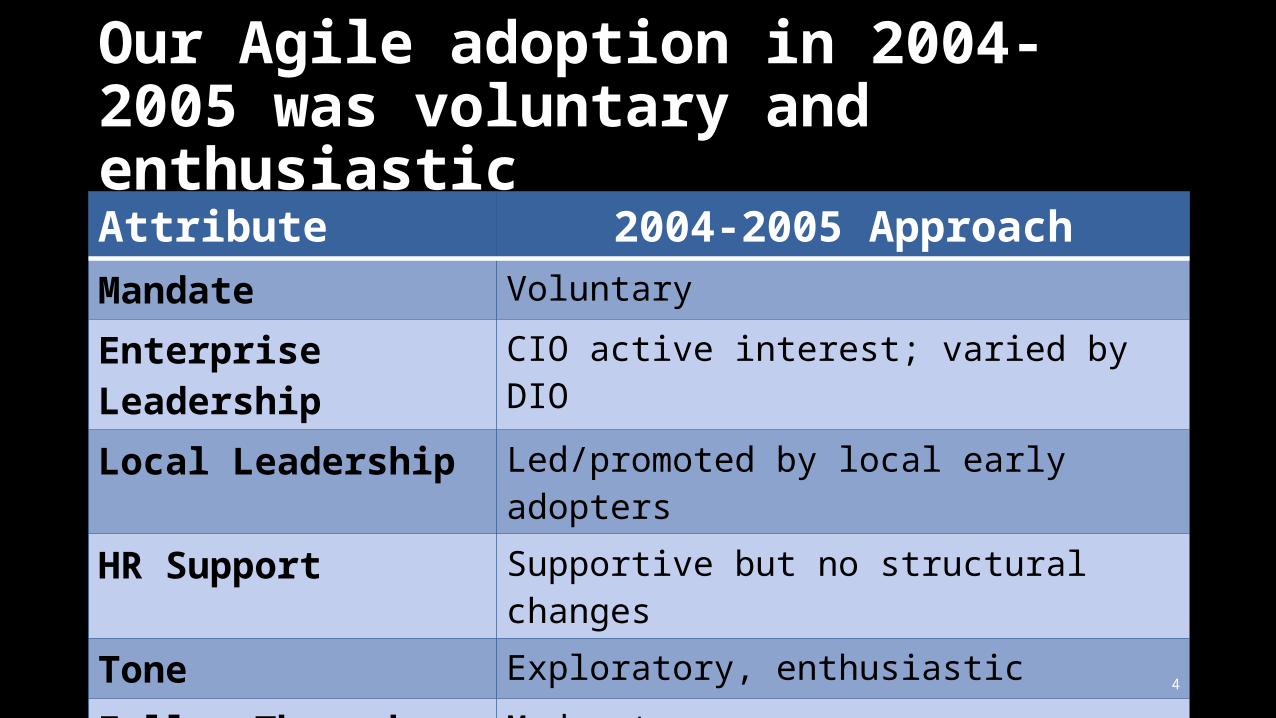
Our Agile adoption in 2004-2005 was voluntary and enthusiasticAttribute 2004-2005 ApproachMandate Voluntary
Enterprise Leadership
CIO active interest; varied by DIO
Local Leadership Led/promoted by local early adopters
HR Support Supportive but no structural changes
Tone Exploratory, enthusiastic
Follow-Through Moderate
Business Engagement
Incidental; primarily an IT activity

5
2004-2005 Agile results were quite favorable
• Initial rapid spread of Agile• Achieved 30%-60% increase in team output • Significantly higher team morale and
business satisfaction with IT• But … Adoption plateaued within ~2 years• … Arbitrary methodology variations emerged• … Agile discipline diminished over time• … Struggled with Agile-Waterfall interactions
and portfolio-level delivery reporting

6
Our Agile adoption approach in 2012-2013 was different in important waysAttribute 2012-2013 ApproachMandate Mandatory
Enterprise Leadership
CIO-driven, DIOs accountable; enterprise support
Local Leadership DIO-led; local sponsors, local champions
HR Support Job families/positions modified; local adaptations
Tone Critical urgency
Follow-Through High; metrics-driven; ongoing enterprise support
Business Engagement
Fast-follower to IT; significant participation
7
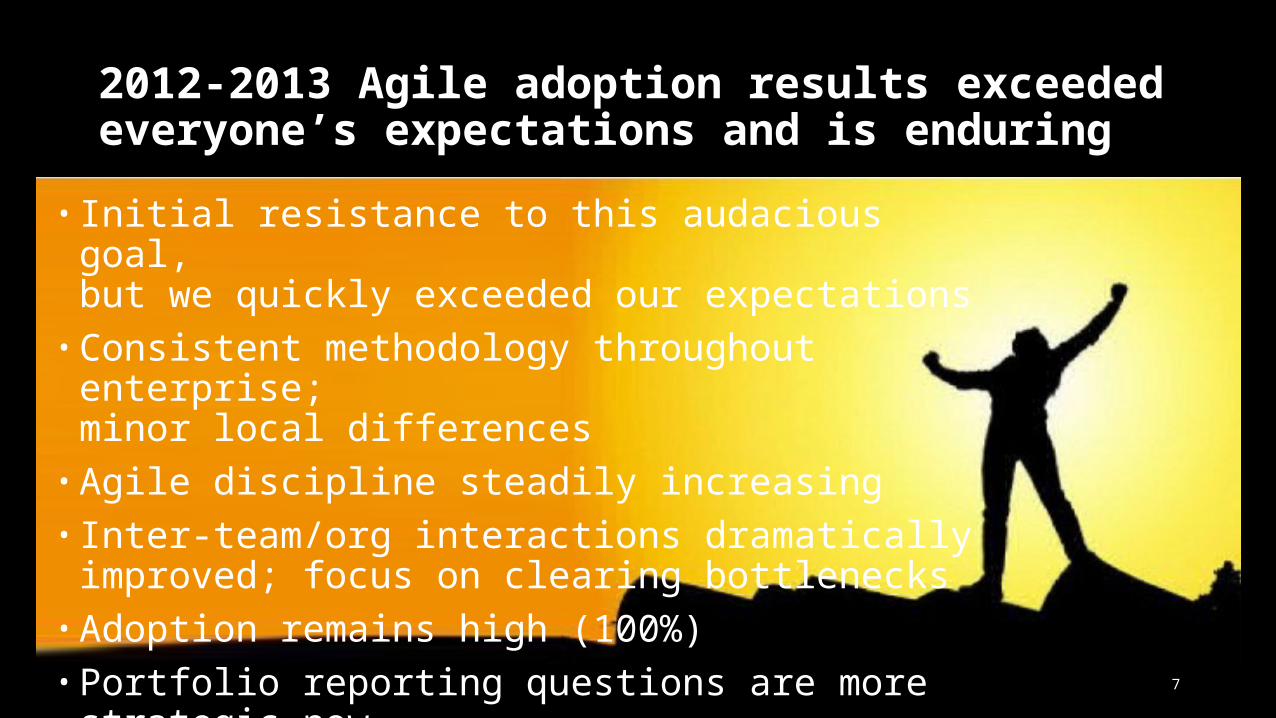
2012-2013 Agile adoption results exceeded everyone’s expectations and is enduring
• Initial resistance to this audacious goal, but we quickly exceeded our expectations
• Consistent methodology throughout enterprise; minor local differences
• Agile discipline steadily increasing• Inter-team/org interactions dramatically
improved; focus on clearing bottlenecks• Adoption remains high (100%)• Portfolio reporting questions are more strategic
now• Most importantly: Agile success is owned/driven
locally

8
1. CIO mandate (+ meaningful support)• CIO-driven metrics/monthly review• Enterprise support: Steering Committee,
standards, training, external coaches, metrics/monthly reviews
2. Local/DIO Ownership• Cannot overstate the power/value of local
accountability
3. Burning Platform • Very helpful to have meaningful urgency for
change
4. Actively Engage Middle Management• Co-opting this potential source of resistance is
critical to success
5. Business Transformation• Roles/responsibilities must truly change (in
Business and IT) to change the organization to Agile
• Aim for more than just participation
Overarching Keys to Success
9
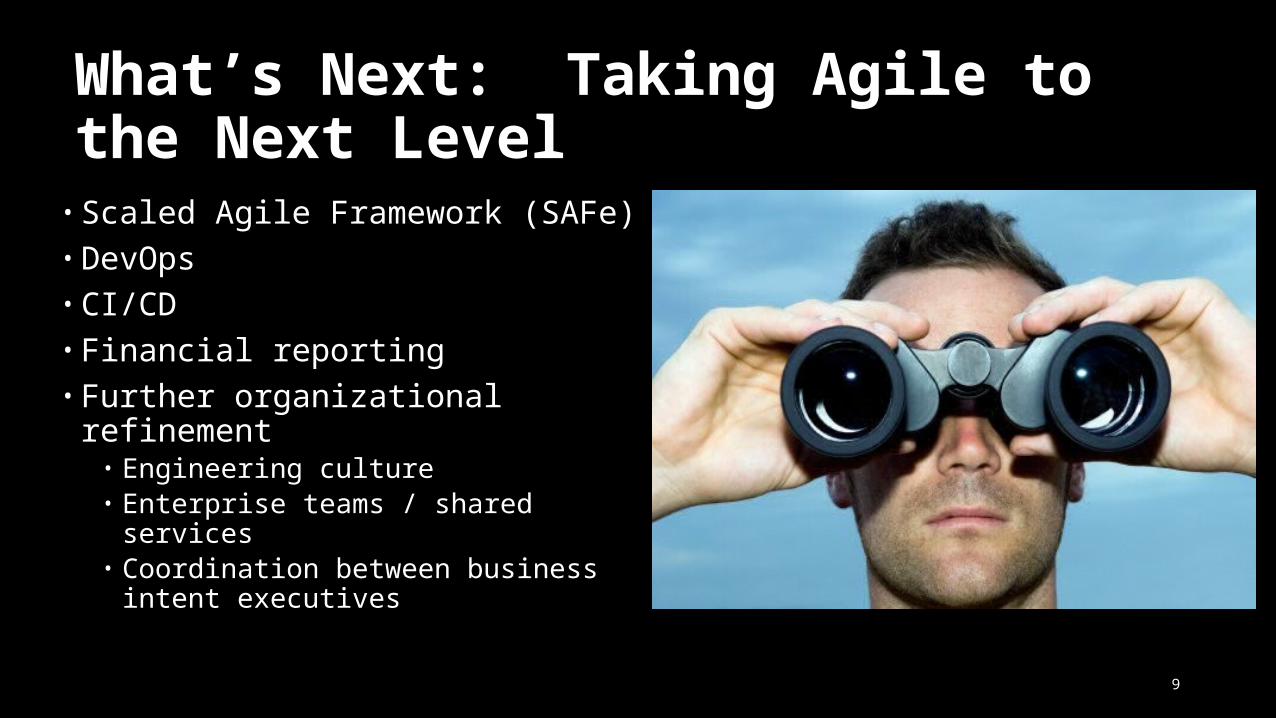
What’s Next: Taking Agile to the Next Level• Scaled Agile Framework (SAFe)• DevOps• CI/CD• Financial reporting• Further organizational
refinement• Engineering culture• Enterprise teams / shared
services• Coordination between business
intent executives

Metrics Examples

11
Agile metrics address a range of needs across the company
• How is each LOB doing in terms of adoption, delivery, and maturity?
• Normalized data (reflecting team differences)
• How is my team doing?• How has the team
improved over the last few sprints?
• Time series view of select KPIs (by team)
• What teams do I have?• Who is the product
owner?• How are my teams
doing?• Mix of “reference”
data and performance data by team
Increasing levels of detailAgile
Effectiveness Index
DIO Team Inventory
OneScrumReport
Team Performance
History
• How is my team (or teams) doing across KPIs?
• Interactive Tableau report
• CIO• DIOs• Transformation Lead
• DIOs• Portfolio leads• Agile coaches
• Transformation Lead• Agile Coaches• Scrum Masters
Au
die
nce
Focu
s
• Portfolio leads• Agile coaches• Scrum Masters
Team Name LOB Value StreamFeature/
ComponentPrimary
Technology Team LeadProduct Owner
Scrum Master Current Epic
Velocity Variance
Commitment Variance
Backlog Health
Team 1 Division A Product X Feature Core Product System Rob N. Marissa T. Grant G. Account Summary 10% 82% 2.6
Team 2 Division A Customer Servicing Component Web Portal Jim L. Miles W. Martin F. Phone Servicintg Enhancements 20% 90% 2.1
Team 3 Division B Customer Servicing Feature Back End Servicing Mary S. Kate R. Subir S. Customer Complaints 5% 75% 1.5
Team 4 Division B Product Y Feature Core Product System Steven S. Lauren R. Subir S. FNP Phase 1 0% 100% 2.3
Team 5 Division C Product Z Feature Core Product System Yvonne Z. Frank F. Kim H. Lending Redesign 15% 90% 3.2
Reference Data Performance Data

12
Enterprise Agile Adoption Dashboard
<80%
Dimension Metric Enterprise Division A Division B Division C
Adoption Nbr Agile Teams vs. Target 96% 100% 87% 100%
Agile Software Investment 73% 58% 90% 72%
Delivery
Velocity Variance 26% 37% 25% 15%
Commitment Variance 77% 79% 84% 67%
Backlog Health 44% 30% 59% 43%
Delivery Quality 100% 100% 100% 100%
Maturity
Team Makeup 72% 80% 73% 63%
Product Owner 86% 85% 93% 80%
Agile Mechanics 78% 61% 97% 76%
Tool Usage 87% 79% 100% 83%
Agile Effectiveness Index 7.4 7.0 8.2 7.0
Enterprise
13
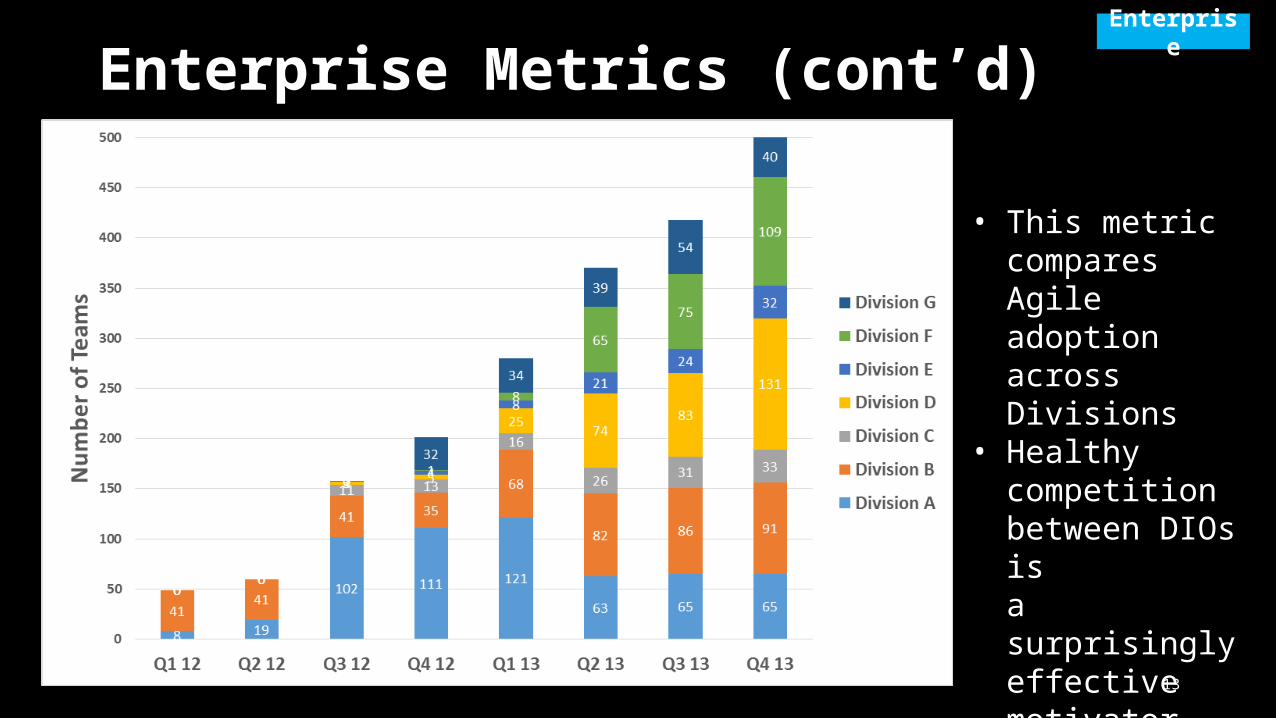
Enterprise Metrics (cont’d)Enterpris
e
• This metric compares Agile adoption across Divisions
• Healthy competition between DIOs is a surprisingly effective motivator

14
Local Metrics: “5 S” for Agile Team Readiness
• Used by local division to track when new Agile teams have all necessary ingredients for successful launch
• Leadership solves non-green conditions
• Not allowed to start Sprinting until all are green
• If any of these 5 are missing, teams will falter
TEAM ScopeScrumMaster Staff Space Skills
Team A
Team B
Team C
Team D
Team E
Team F
Team G
Team H
Team I
Team J
Team K
Team L
Team M
Team N
Ready and available now
Identified and committed at future date
Not yet identified or committed
Local

Q & A
