agile software development in practice - nc state · pdf fileagile software development in...
TRANSCRIPT

Agile Software Development in Practice
Maureen Doyle1, Laurie Williams2, Mike Cohn3, Kenneth S. Rubin4
1Computer Science, Northern Kentucky University, Highland Heights, Kentucky 41011 USA,
[email protected] 2Computer Science, North Carolina State University, Raleigh, North Carolina 27695 USA,
[email protected] 3Mountain Goat Software, Lafayette, Colorado 80026 USA, [email protected]
4Innolution, Niwot, Colorado 80544 USA. [email protected]
Abstract. Agile software development methods have been around since the mid 1990s. Over these years, teams have evolved the specific software development practices used. Aims: The goal of this paper is to provide a view of the agile practices used by new teams, and the relationship between the practices used, project outcomes, and the agile principles. Method: This paper provides a summary and analysis of 2,229 Comparative AgilityTM (CA) assessment surveys completed between March 2011 and October 2012 by agile developers who knew about the survey. The CA tool assesses a team’s agility and project outcomes using a 65-statement Likert survey. Results: The agile principle of respect for individuals occurs the most frequently, while simplicity occurs least. Progress/Planning is correlated strongly to nine principles. Conclusion: Subject to sampling issues, successful teams report more positive results for agile practices with the most important practice being teams knowing their velocity. Keywords: agile software development; comparative agility assessment; agile practices
1 Introduction
Agile software development is no longer considered a new idea, however showing the savings obtained from implementing an agile process is still largely through anecdote or case studies [1]. The agile manifesto defined principles, and since the inception of agile software development in the mid 1990s, teams have evolved the specific practices used [2].
The goal of this paper is to provide a view of the agile practices used by new teams, and the relationship between the practices used, success Outcomes, and the Agile Principles. We present a view into the state of the practice in agile software development based on extensive analysis of 2,229 completed Comparative Agility (CA) surveys.
This paper contributes the following: • Identification of the most and least popular agile practices.

• Identification of the agile principles that most influence other principles and successful project outcomes.
• Identification of individual survey statements that occur more frequently among successful teams than unsuccessful teams.
2 Comparative Agility
CA is a survey-based assessment tool, developed by three of the four authors, used by individuals and organizations to compare their own agility implementations to others. Any practitioner can visit the CA website1 and, in exchange for investing his or her time to complete the survey, receive a free report that compares his or her survey results to the complete industry dataset. Alternatively, teams can request2 to have a customized collector. These team members then individually take the survey using a team-specific survey URL.
At the highest level, the CA approach assesses agility across eight dimensions: Teamwork; Requirements; Planning; Technical Practices; Quality; Culture; Knowledge Creating; and Outcomes. The survey respondent is presented with 65 statements. Each statement is an agile practice for which the respondent indicates the truth of the statement relative to their team or organization. For example:
• Upfront planning is helpful without being excessive. • Team members leave planning meetings knowing what needs to be done
and have confidence they can meet their commitments. • Teams communicate the need to change release date or scope as soon as
they are discovered. • Effort spent on planning is spread approximately evenly throughout the
project. Throughout this paper, we refer to the statements as “practices” interchangeably.
The survey statements are considered practices because each statement indicates a practice the team would decide to include in their agile development process. CA respondents choose the appropriate response to the statement using a 6 point Likert scale: not applicable, false, more false than true, neither false nor true, more true than false and true. Individual survey responses were excluded from analysis when ‘Not Applicable’ was chosen. The remaining responses are assigned ranks of 1, 2, 3, 4, and 5 respectively for all analyses.
CA was designed to lead to actionable results. Sample comparison output is shown in Fig. 1 and the individual respondent or team receives information on the number of standard deviations of their response(s) versus the dataset mean. When an organization can see how it compares with other organizations, improvement efforts can be focused.
Initially, the CA consisted of 125 statements. The CA was shortened in 2010 through a systematic elimination of highly correlated and repetitive questions. Seven questions on project outcomes were added to the new CA to enable analysis of the
1 http://www.comparativeagility.com/ 2 Those wishing to obtain a customized collector should contact the third author of this paper.
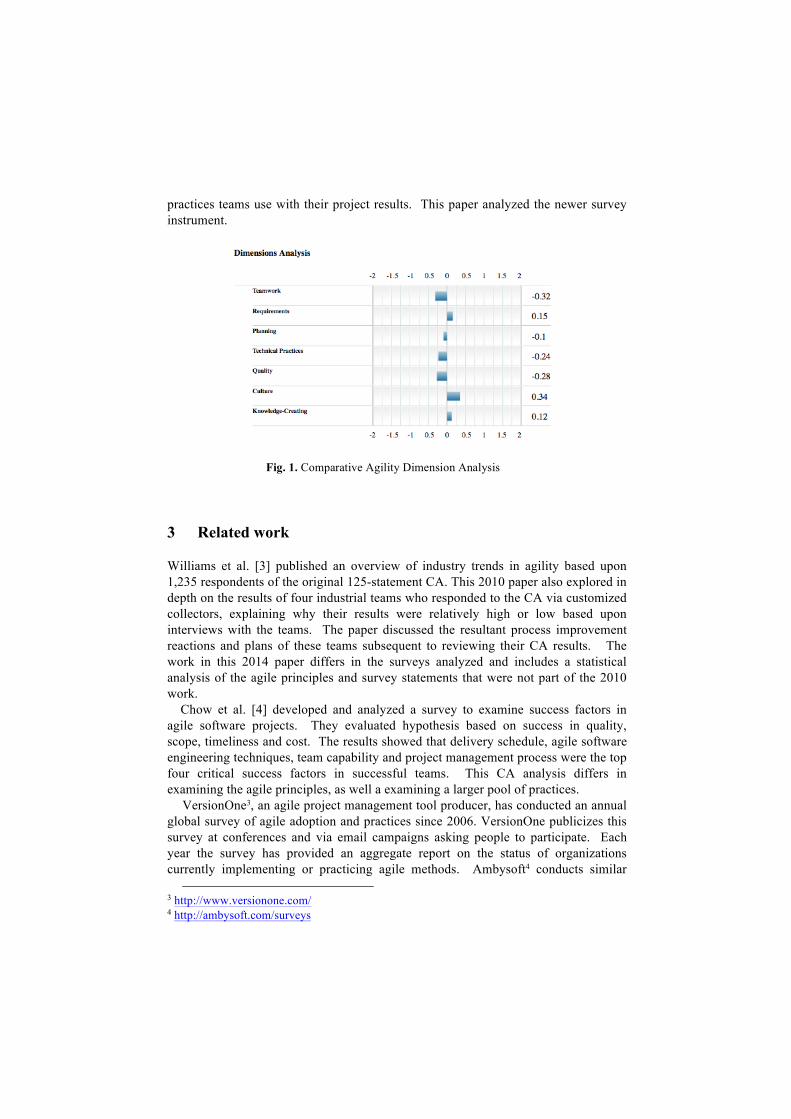
practices teams use with their project results. This paper analyzed the newer survey instrument.
3 Related work
Williams et al. [3] published an overview of industry trends in agility based upon 1,235 respondents of the original 125-statement CA. This 2010 paper also explored in depth on the results of four industrial teams who responded to the CA via customized collectors, explaining why their results were relatively high or low based upon interviews with the teams. The paper discussed the resultant process improvement reactions and plans of these teams subsequent to reviewing their CA results. The work in this 2014 paper differs in the surveys analyzed and includes a statistical analysis of the agile principles and survey statements that were not part of the 2010 work. Chow et al. [4] developed and analyzed a survey to examine success factors in agile software projects. They evaluated hypothesis based on success in quality, scope, timeliness and cost. The results showed that delivery schedule, agile software engineering techniques, team capability and project management process were the top four critical success factors in successful teams. This CA analysis differs in examining the agile principles, as well a examining a larger pool of practices.
VersionOne3, an agile project management tool producer, has conducted an annual global survey of agile adoption and practices since 2006. VersionOne publicizes this survey at conferences and via email campaigns asking people to participate. Each year the survey has provided an aggregate report on the status of organizations currently implementing or practicing agile methods. Ambysoft4 conducts similar
3 http://www.versionone.com/ 4 http://ambysoft.com/surveys
Fig. 1. Comparative Agility Dimension Analysis

surveys. This paper also reports on the status and demographics of survey-responders, but also provides statistical analyses of the survey results.
Two other assessment frameworks have been used to evaluate agile software development teams with published results. One is the Extreme Programming Evaluation Framework (XP-EF) [5]. The purpose of the XP-EF is to provide a structure for a case study such that the results of multiple, independent case studies can be combined and compared to create a family of related studies. For example, the results of case studies of industrial Extreme Programming (XP) teams at IBM and others were structured via the XP-EF [6].
The other assessment framework is the Shodan survey [5]. Similar in intent to CA, the purpose of the Shodan survey is to assess the extent to which a team adopts the practices of Extreme Programming. The published works detail specific case studies only. Additional published case studies (e.g. [7, 8]) examine agile development, which provide in-depth analysis of a single company.
ThoughtWorks Agile Assessments5 and Dr. Agile Assessment6 provide surveys similar to CA for the purpose of providing individuals and organizations information on their agile adoption and practices. These organizations have not published aggregate data, so we cannot compare to their results.
4 Data Collection and demographics The industry-wide data reported in this paper is based upon 2,229 completed CA surveys taken between March 26, 2011 and October 12, 2012. The survey database indicates that 3,339 surveys were attempted or taken during this timeframe, but 1,110 of these surveys were eliminated because not all of the 65 Likert statements had a response. In other words, a survey was deemed incomplete and omitted from the analysis if even one statement was skipped since the option ‘Not Applicable’ was available for all statements. Individual survey statements with the ‘Not Applicable’ response were not analyzed. Surveys were not eliminated when demographic questions were skipped. In this section, we report the overall demographics for all valid surveys and present the reported industry, team size, team experience, project types, and other general demographic information.
There were a large number of demographics collected and a subset of these are now discussed. A majority (78%, N=1,735) of the responses came from teams who asked for their data to be analyzed via a customized collector. Generally, teams that request a customized collector are being coached by one of the authors so that their data can be analyzed as a separate group. In other cases (22%, N=494), individuals found the CA survey site, such as after seeing articles written about the survey [5]. Based upon these circumstances, the respondents are considered to be part of agile teams or teams beginning an agile transition.
A broad range of industries participated in the CA assessment. Thirty-one (31) different industries were identified by respondents, including bio-technology, tourism, and game development. Table 1 lists the top five reported industries.
5 http://agileassessments.com/ 6 http://www.dragile.com/

Table 1. Top five industries
Industry Count % of Responses
Web/Software Development 968 29.0% Manufacturing 159 4.8% Finance/Banking/Accounting 132 4.0% Telecommunications/Networks 108 3.2% Non-Profit/Trade Association 95 2.8%
Ninety-five percent (2,127) of the surveys had a response to the question “Which best characterizes this project?” Table 2 lists the most popular project types.
Table 2. Project Type
Project Type % of Responses
Software, application or solution that will be used internally within my organization 37.9% Web Development 33.8% Embedded software/systems/devices 13.3% Other 7.9% A project being developed by one company for another company 7.1%
Ninety-seven percent of the survey respondents provided the number of people working on their project team including managers, developers, testers, and designers. Many teams had fewer than 10 (33.6%) people while 7% of the teams had more than 50 people. Table 3 summarizes the agile team sizes.
Table 3. Team size as percentage of all respondents
Team Size % Total 1-10 33.6% 11-25 23.5% 26-50 10.0% 51-100 3.8%
More than 100 3.7%
Another demographic question was answered by 95% of respondents and queried: “How long has this group been doing agile development prior to starting this project?“ Over 59% (1308/2229) of the respondents indicated the group had been doing agile for a year or less which is likely a manifestation of the survey being taken by new teams being coached by the authors. Table 4 summarizes the results of this question.
Table 4. Team's Experience
Team’s Agile Experience % Total
0-6 months 38.5% 7-12 months 21.8%
Longer than 1 year, less than 2 21.2% Longer than 2 years, less than 3 10.6%
Longer than 3 years 7.9% Left Blank 2.9%

In summary, the demographics presented here show that the analysis results discussed in this paper apply to a variety of agile projects and primarily to new teams.
5 State of the practice The state of the practice reports the project outcomes experienced by teams, the agile practices, as measured by the survey statements, in practice and presents and discusses the most popular and unpopular reported statements. Understanding the state of agile software development with respect to the twelve agile principles provides us with a quasi-metric of how current agile development compares to the vision stated in the twelve principles.
5.1 Project Outcomes
Seven CA statements assess the outcomes of an agile project are listed, along with a keyword in Table 5.
Table 5. CA Statements evaluating project outcomes
CA Statement Keyword The team has produced higher quality products since we started using an agile approach.
Higher quality
The team has been more productive since we started using an agile approach.
More productive
Our customers have been more satisfied with the functionality of our products since started using an agile approach.
Customer functionality
Our customers have been more satisfied with the usability of our products since we started using an agile approach.
Customer Usability
The team has had higher morale since we started using an agile approach.
Higher Morale
Our business has recognized greater economic value since we started using an agile approach.
Greater Economic Value
We have delivered functionality to users more quickly and/or more often since we started using an agile approach.
Delivered Functionality Quicker
The percentage of response type is plotted in Fig. 2 to provide a snapshot of the project outcomes when embracing agile development when compared to previous approaches.
The outcomes “more productive” and “delivered functionality to users more quickly” occurs the most frequently and have more positive than negative responses. The least occurring outcomes relate to customer satisfaction, both with functionality and usability. Of the 2,229 surveys analyzed, 1,593 (71%) reported at least one positive outcome, 636 (29%) of the surveys had only negative outcomes, and 516 (23%) reported all positive outcomes, as defined by responses of “true” or “more true than false.”

5.2 Agile Principles
The CA statements were mapped to one of the twelve agile principles defined in the Agile Manifesto [9]. Although statements may address more than one principle, each was assigned to the one principle that the statement most influenced. Table 6 presents the number of CA survey statements per principle and a keyword. The keyword is used in subsequent discussions.
Fig. 2. Reported project outcomes, Count percentage Count Percentage
Customer Usability
Customer Functionality
Greater Economic Value
Higher Morale
Higher quality
Delivered Functionality Quicker
More productive
0.4 0.2 0 0.2 0.4 0.6
FalseMore False than True
Neither True nor FalseMore True than False
True

Table 6. CA Survey statements per principle
Principle Keyword Num of statements
Our highest priority is to satisfy the customer through early and continuous delivery of valuable software.
Outcomes 7
Welcome changing requirements, even late in development. Agile processes harness change for the customer’s competitive advantage.
Change 4
Deliver working software frequently, from a couple of weeks to a couple of months, with a preference to the shorter timescale.
Frequently 1
Business people and developers must work together daily throughout the project.
Business 5
Build projects around motivated individuals. Give them the environment and support they need, and trust them to get the job done.
Individuals 12
The most efficient and effective method of conveying information to and within a development team is face-to-face conversation.
Face-to-face 5
Working software is the primary measure of progress. Progress 8
Agile processes promote sustainable development. The sponsors, developers, and users should be able to maintain a constant pace indefinitely.
Sustainable 7
Continuous attention to technical excellence and good design enhances agility.
Excellence 11
Simplicity—the art of maximizing the amount of work not done—is essential.
Simplicity 1
The best architectures, requirements, and designs emerge from self-organizing teams.
Emergence 2
At regular intervals, the team reflects on how to become more effective, then tunes and adjusts its behavior accordingly.
Retrospective 2
The survey statements were grouped and the percentage of Likert-Scale responses are shown in Fig. 3. It is worth nothing that there are five principles, highlighted in Table 6, that have similar response percentages with a large number of positive responses. All but three principles (emergence, excellence, and simplicity) report at least 50% of teams are practicing the agile principle. The agile principles with the largest positive results are Individuals, Business, and Face-to-face. The CA statements for Individuals address team autonomy, support, and respect. The two statements with the most positive responses for Individuals are: “Estimates are created collaboratively by the people who will do the work.” and “Team members are kept together as long as possible.” Business statements evaluate how much the customer is involved in the development process. “The product owner is available to discuss upcoming features and work-in-progress” and “One or more of scope, schedule, or resources is allowed
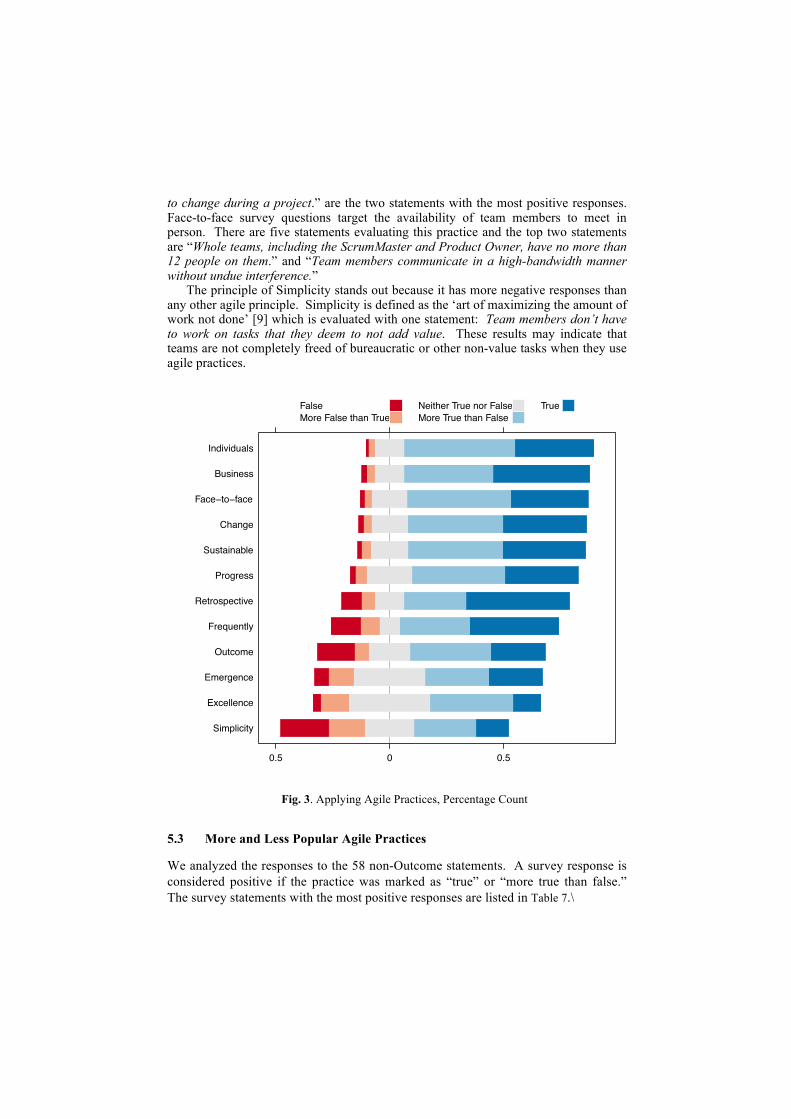
to change during a project.” are the two statements with the most positive responses. Face-to-face survey questions target the availability of team members to meet in person. There are five statements evaluating this practice and the top two statements are “Whole teams, including the ScrumMaster and Product Owner, have no more than 12 people on them.” and “Team members communicate in a high-bandwidth manner without undue interference.”
The principle of Simplicity stands out because it has more negative responses than any other agile principle. Simplicity is defined as the ‘art of maximizing the amount of work not done’ [9] which is evaluated with one statement: Team members don’t have to work on tasks that they deem to not add value. These results may indicate that teams are not completely freed of bureaucratic or other non-value tasks when they use agile practices.
Fig. 3. Applying Agile Practices, Percentage Count
5.3 More and Less Popular Agile Practices
We analyzed the responses to the 58 non-Outcome statements. A survey response is considered positive if the practice was marked as “true” or “more true than false.” The survey statements with the most positive responses are listed in Table 7.\
Count Percentage
Simplicity
Excellence
Emergence
Outcome
Frequently
Retrospective
Progress
Sustainable
Change
Face−to−face
Business
Individuals
0.5 0 0.5
FalseMore False than True
Neither True nor FalseMore True than False
True

Table 7. Most popular practices
CA Statement % Positive 95% lower limit
Agile Principle
Estimates are created collaboratively by the people who will do the work.
85% 84% Individuals
All work is done in iterations of no more than 30 days.
84% 83% Progress
Whole teams, including the ScrumMaster and Product Owner, have no more than 12 people on them.
83% 81% Face-To-Face
Team members communicate in a high-bandwidth manner without undue interference.
80% 79% Face-to-Face
Team members are kept together as long as possible.
80% 78% Individuals
Table 7 includes the 95% lower-limit of positive responses to the questions for
generalization to the population of teams converting over to agile development. In other words, given assumptions of normality and random sampling, we are 95% sure that 84% of new agile teams are collaboratively developing estimates.
The practices embodied in the least positive statements are listed in Table 8. Similar to the previous analysis, we are 95% sure that no more than 25% of development teams have implemented pair programming. This is in agreement with previous studies. The next lowest, at no more than 27%, is that agile teams have no manual testing at the end of each iteration. This may be due to the large number of web applications requiring multiple browser version testing.
Table 8. Least popular practices
CA Statement % Positive 95% upper limit
Agile Principle
Code is written using pair-programming. 23% 25% Excellence
At the end of each iteration there is little or no manual testing required.
25% 27% Excellence
Most code is written using unit test-driven development.
38% 40% Excellence
Bonuses, annual reviews, and compensation promote team behavior.
40% 42% Individuals
Team members don't have to work on tasks that they deem to not add value.
43% 45% Simplicity
The agile principles associated with these statements reveal that while “Individuals” has the most positive responses of all the principles, there is room for improvement since at most 42% of the agile teams provide compensation to promote team behavior. Three of the five statements address the agile principle of excellence, and excellence is the second least popular agile principle for all of the survey

questions. The practice of agile excellence, as measured by pair-programming, unit-testing, and automated testing are not practiced by most new agile teams.
6 Analysis Of Principles and Outcomes
All statistical analysis and tests used are designed for ordinal data. A Spearman rank, r, correlation analysis was performed for all correlation computations. The Spearman rank correlation coefficient was selected because Likert-scale data is measured at the ordinal level. Data of this form violates a necessary assumption for the use of the parametric Pearson correlation coefficient, so a nonparametric correlation is used for analysis. A correlation, r, between two dimensions indicates that r2 of the variability in one is attributed to variability in the other. Since multiple comparisons were performed, the Bonferroni correction was applied to control the false discovery rate. All correlations are deemed significant only when p<=0.0002 for the sample sizes analyzed in 6.1 and 6.2.
6.1 Outcome Correlations
The most strongly correlated statements among all 65 statements in the CA survey occur between the Outcome statements. A large number of surveys had no positive outcomes and, therefore, provide no information regarding the relationships between project outcomes. As a result, correlations between outcomes were computed only using surveys that had at least one successful outcome (1,714 surveys).
The correlation matrix for Outcomes is shown in Fig. 4. The correlation results are displayed as is a lower-triangular matrix with correlation values, r, represented by the size of the square. The larger the square, the more strongly correlated the pair of outcomes. The diagonal is an example of r=1. There were no negative correlations in this analysis. A correlation between two items is considered strong when its value is at least 0.5. All correlations are significant to p<0.0002.
The strongest correlation between two outcomes is for customer more satisfied with usability and customer more satisfied with functionality (r=0.78). Teams report delivering customer satisfaction with functionality and usability together or they are delivering neither. The smallest correlation is between higher morale and delivered functionality to users more quickly (r=0.46), meaning team members report higher morale delivering more frequently. The only other weak correlation is between delivering functionality to users more quickly and delivering higher quality. This is still a positive correlation, however it may reflect the tradeoff that often exists between quality and speed.

6.2 Principle Correlations
Correlations for the twelve agile principles were computed for the 2,229 surveys and are shown in Fig. 5. All correlations are significant with p<=0.0002.
All correlations are positive. The six agile principles of Progress, Sustainable, Individuals, Business, Change and Excellence are strongly correlated with each other. Face-To-Face is also a part of this group although its correlation to Excellence is weaker at r=0.45. This result means that teams embracing any one of these agile principles are embracing all of the others.
Progress is correlated strongly to the most dimensions and also to Outcomes (r=0.53). Progress may well be a bellwether of project success indicating projects who are tracking progress are seeing more positive outcomes, while projects not tracking progress are not seeing positive outcomes. In addition, teams that are monitoring progress are also committed to the other principles of agile development.
Fig. 4. Outcome Correlations
0.3 0.53 0.77 1
Hig
her q
ualit
y
Mor
e pr
oduc
tive
Cus
tom
er F
unct
iona
lity
Cus
tom
er U
sabi
lity
Hig
her M
oral
e
Econ
omic
Val
ue
Del
ivere
d Fu
nctio
nalit
y
Higher quality
More productive
Customer Functionality
Customer Usability
Higher Morale
Economic Value
Delivered Functionality

The principles of Frequently and Retrospective are not as strongly correlated, although interestingly they are highly correlated with each other. Retrospectives are occurring when there are more frequent releases perhaps indicating a fuller commitment to the team process changes necessary for agile development.
The two practices with the weakest correlations are Simplicity and Emergence indicating that changes in these practices do not explain changes in the other practices or outcomes. This result may be due not to the practice itself, but because these are both harder principles to measure. In addition, there are just three questions (1 for Simplicity and 2 for Emergence) in the survey measuring these practices.
6.3 Statement Analysis
Analysis was done to determine differences between successful and unsuccessful teams. A confidence interval was computed for the differences between answers for each statement between teams that had positive outcomes to teams that did not. All results are significant with p < 0.001.
Fig. 5. Agile Principle Correlations
0 0.25 0.5 0.75 1
Progress
Sustainable
Individ
uals
Busin
ess
Change
Excellence
Face−To−Face
Retrospective
Outcome
Frequently
Simplicity
Emergence
Progress
Sustainable
Individuals
Business
Change
Excellence
Face−To−Face
Retrospective
Outcome
Frequently
Simplicity
Emergence

Table 9 contains a list of the practices showing the largest differences between successful and unsuccessful teams. The table contains the 95% confidence interval (lower limit, upper limit) for the reported differences and its agile principle. This first row of this table states that successful teams responded with a 4 or a 5 to the statement ‘Teams know their velocity’ at least 33% more often than unsuccessful agile teams.
Table 9. Practices of successful teams
Practice ll ul principle Teams know their velocity. 33 45 Sustainable Standup meetings are effective at synchronizing work. 29 40 Face-To-Face Team members choose which tasks to work on. 29 40 Individuals The team maintains a steady rate of productivity without being overworked.
29 40 Individuals
At the start of each iteration, the team performs sufficient just-in-time planning to be confident of what it can complete in the iteration.
28 39 Sustainable
The results of this analysis support that appropriate planning and team involvement results in project success. These results are consistent with Chow [4] who found that the top critical success fact is delivery strategy and three of the five successful practices above (Teams know their velocity, The Team maintains a steady rate of productivity without being overworked, and At the start of each iteration, the team performs sufficient just-in-time planning to be confident of what it can complete in the iteration.) are part of a delivery strategy. Teams converting to agile who have implemented these practices are seeing more successful results than teams who do not.
7 Limitations
The main external threat to validity is this is not a random sample of agile development teams. Teams participating in the CA survey may not be representative of the general agile community since they are typically investing time for survey completion, are likely being coached, and are therefore interested in improving their agile processes.
The primary internal threat to validity is that many results are self-reported and dependent on the veracity of the individual(s) completing the survey. The number of questions attributed to each category influences the correlations and analysis of the CA dimensions and agile principles to outcomes. The addition or elimination of survey questions for each principle may alter the results. The CA assessment analysis treated all surveys independently. Teams from the same companies or surveys completed by multiple members of the same team can skew the results.
Another threat to validity is that surveys were taken by different employees on the same agile team and/or employed by the same company. Chi-square results shows

that the company has some impact on results although no there were no obvious patterns.
There may be a “cap effect” with regard to the two-sample confidence intervals. For example since at least 83.7% of respondents answer one statement with a 4 or 5, it is that much more difficult to have a larger difference between the success/no success groups. Conversely with statement having fewer positive results, looking at all of them it is 59-63% it is easier to have a bigger difference there between the two groups.
The CA assessment does not differentiate between the methodology used to implement agile software development and this may also impact the results.
Acknowledgments. Thank you to the many reviewers and editors of earlier versions of this paper including Dr. Jane Huffman Hayes, Dr. Laurie Williams’ research team, John Slankas, Barbara Doyle, Dr. Brooke Buckley, Dr. Janet Burge, and Sue Noble. The Burkhardt Consulting Center provided a thorough review of the data analysis. Brittany Campbell provided technical support in meeting LNCS style guidelines. Northern Kentucky University provided financial support to the first author for travel. The Scrum Alliance provided financial support for the second author.
References
1. Taft, D.K., Agile Software Development Hits Stride After Years of Evangelism, in eWeek. 2013.
2. Williams, L., What Agile Teams Think of Agile Principles. Communications of the ACM, 2012. 55(4): p. 71-76.
3. Laurie Williams, K.R., Mike Cohn, Driving Process Improvement via Comparative Agility Assessment, in AGILE 2010. 2010: Orlando, FL. p. 3-10.
4. Chow, T. and D.-B. Cao, A survey study of critical success factors in agile software projects. Journal of Systems and Software, 2008. 81(6): p. 961-971.
5. Williams, L., L. Laymen, and W. Krebs, Extreme Programming evaluation Framework for Object-Oriented Languages -- Version 1.4, in TR-2004-18, N.C. Science, Editor. 2004, North Carolina State University: http://www.csc.ncsu.edu/research/tech/reports.php.
6. Krebs, W. Turning the Knobs: A Coaching Pattern for XP Through Agile Metrics. in Extreme Programming/Agile Universe. 2002. Chicago, IL: Springer.
7. Pikkarainen, M. and U. Passoja, An approach for assessing suitability of agile solutions: A case study. Extreme Programming and Agile Processes in Software Engineering, 2005: p. 1202-1206.
8. Theunissen, W.H.M., A case-study based assessment of Agile software development. 2003, University of Pretoria.
9. Beck, K., et al. Principles behind the Agile Manifesto. 2001 [cited 2013.]