agile metrics - what you need to,want to, and can measure
TRANSCRIPT

Agile Metrics - What You Need to,
Want to, and Can Measure
June 9, 2014

Copyright © Cognizant Technologies Solution U.S. Corporation 2014 1
Agile Metrics Outline
• What do you care about?
• Why measure?
• Metrics to introduce earlier
• Metrics to introduce later
• How to prepare
• Adoption metrics
• Examples
• Challenges to agile metrics
• Best practices for agile metrics
• What the future holds for agile metrics

Copyright © Cognizant Technologies Solution U.S. Corporation 2014 2
Agile Metrics – What Do YOU Care About?
• Exercise … let’s take 5 minutes now
• About You:
• Your role relative to agile delivery
• Your home organization (down to department)
• Your years of IT experience
• Your years of agile practitioner experience
• Metrics Perspective
• What performance metrics do you care about the most (up to 3)
• For each, why (as specific an answer as possible, please)
• Are you a metrics data producer, consumer, neither, or both?
• Thank you!
Copyright © Cognizant Technologies Solution U.S. Corporation 2014
Are you delivering value for
me?
3
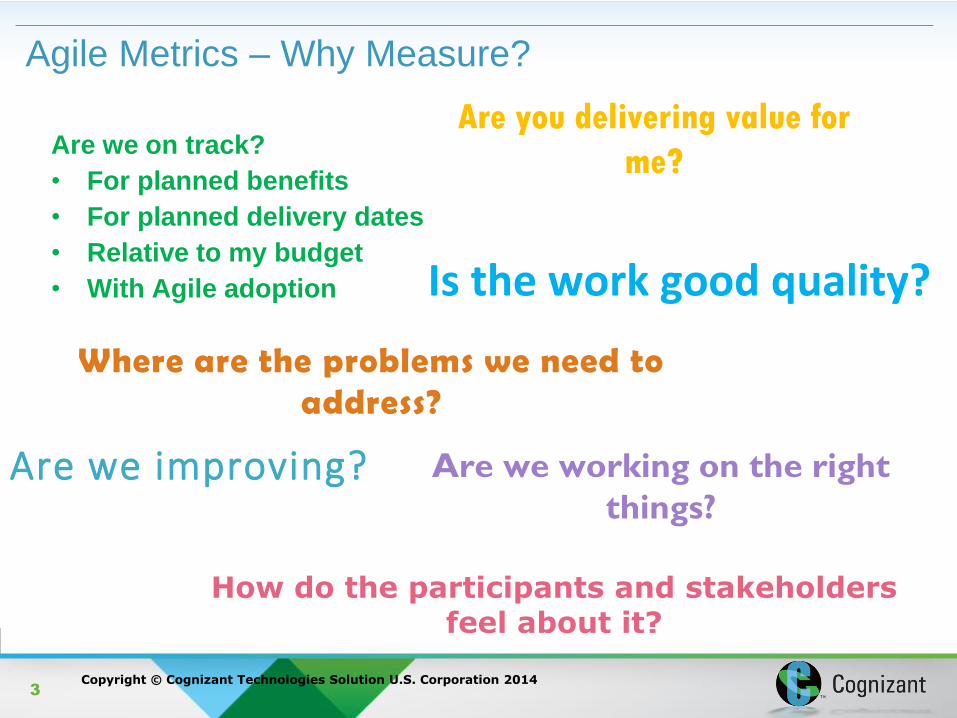
Agile Metrics – Why Measure?
Are we on track?
• For planned benefits
• For planned delivery dates
• Relative to my budget
• With Agile adoption Is the work good quality?
Are we working on the right
things?
Where are the problems we need to address?
Are we improving?
How do the participants and stakeholders feel about it?

Copyright © Cognizant Technologies Solution U.S. Corporation 2014 4
Agile Metrics - Who Cares?
Leaders (Business and Technology)
Support Organizations
Program Sponsors
Product Owners
Coaches
Scrum Masters and Team Leads
Team Members

Copyright © Cognizant Technologies Solution U.S. Corporation 2014 5
Agile Metrics - Bottom Line Why Measure and Report?
Provide
transparency Answer
stakeholder
questions
Manage the
work

Copyright © Cognizant Technologies Solution U.S. Corporation 2014 6
Agile Metrics – Start Sprint 1
Quality
• Story documentation quality
• Number of times stories are rejected by delivery team
• Number of RCAs traced to story quality
• Defect density (defects delivered per story point)
Cost and Speed
• Stories ready for consumption
• Team velocity or productivity (stories delivered per sprint)
• Work in process (number of items being worked on simultaneously)
Remember, your teams are on a learning curve!
Copyright © Cognizant Technologies Solution U.S. Corporation 2014 7
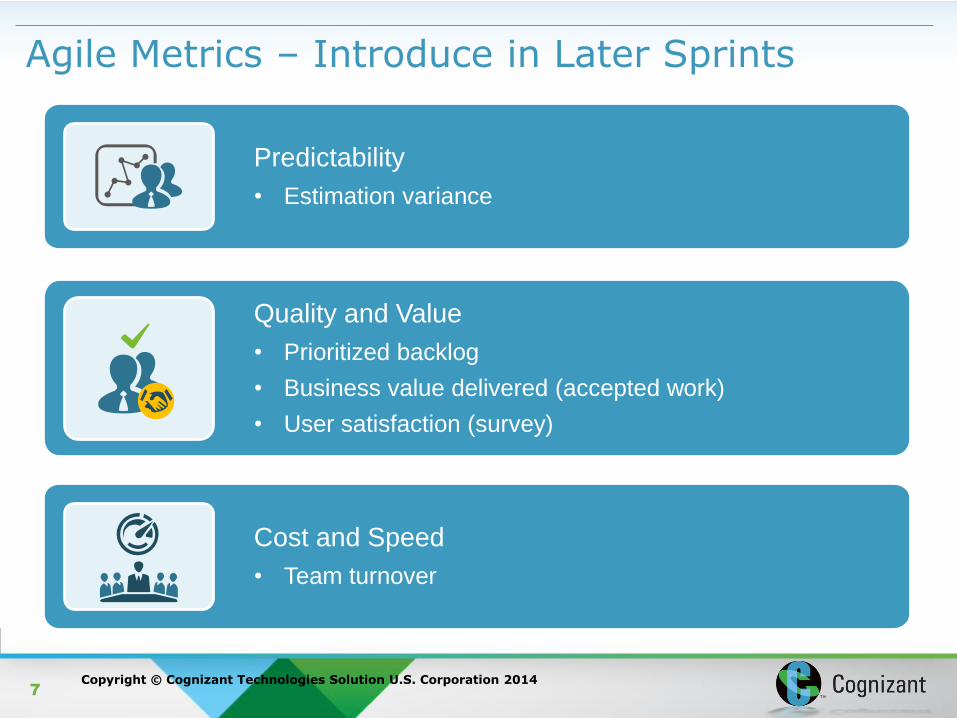
Agile Metrics – Introduce in Later Sprints
Predictability
• Estimation variance
Quality and Value
• Prioritized backlog
• Business value delivered (accepted work)
• User satisfaction (survey)
Cost and Speed
• Team turnover

Copyright © Cognizant Technologies Solution U.S. Corporation 2014 8
Agile Metrics
It doesn’t happen
by itself!!!

Copyright © Cognizant Technologies Solution U.S. Corporation 2014 9
Agile Metrics - Structure Before Teams Start
• Sprint frequency
• Release cadence (and process)
• Planning cycle cadence (and process)
• Epic and story documentation templates and guidance (tool and
process)
• Initial backlog (tool)
• Documented high-level architecture choices for high-risk
technologies
• Stakeholder management plan, including status reporting,
planned metrics, and data capture plan
• Baseline measures for planned metrics, if possible

Copyright © Cognizant Technologies Solution U.S. Corporation 2014 10
Agile Metrics – Consider How Your Engagement will
Handle this during Planning?
0
20
40
60
80
100
120
1 3 5 7 9 11 13 15 17 19
Capacity
Stories
Defect Fixes
ProductionSupport

Copyright © Cognizant Technologies Solution U.S. Corporation 2014 11
Agile Metrics
What is the most-reported
Agile metric?

Copyright © Cognizant Technologies Solution U.S. Corporation 2014 12
Daily Team Burn Down Example
• Day 1 spike
• Still a problem by Day 3
• What’s going on?
Actual
remaining
work
Planned
remaining
work
• Defects fed to team?
• New technology?
• Story changes?
• Vacations?
• New team members?

Copyright © Cognizant Technologies Solution U.S. Corporation 2014 13
Rolled Up Burn Down, Backlog, Velocity Example
Team Y added XX scope
and re-baselined
work projections based
on Velocity to date

Copyright © Cognizant Technologies Solution U.S. Corporation 2014 14
• As of MM/DD/YYYY, program-level Story Point Variance (including Estimate Variance,
Scope Additions / Reductions, UI Rework) stands at 4%.
Planning for next
sprint team capacity,
where are the
stories?
Story Readiness and Estimation Variance Example
• Major features
contributing to this
are:
• Feature 1
• Feature 2
• Etc.

Copyright © Cognizant Technologies Solution U.S. Corporation 2014 15
Agile Contracts – scruminc Webinar 19 December, 2013
Groomed Backlog and Business Value Delivered
Example
Copyright © Cognizant Technologies Solution U.S. Corporation 2014 16
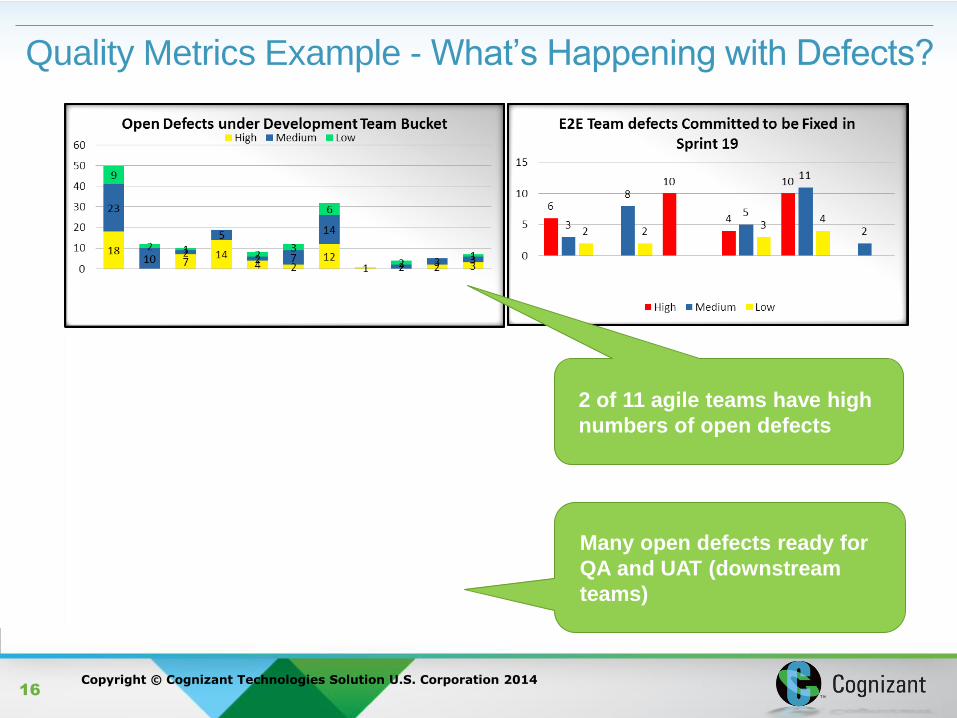
Quality Metrics Example - What’s Happening with Defects?
2 of 11 agile teams have high
numbers of open defects
Many open defects ready for
QA and UAT (downstream
teams)
Copyright © Cognizant Technologies Solution U.S. Corporation 2014 17
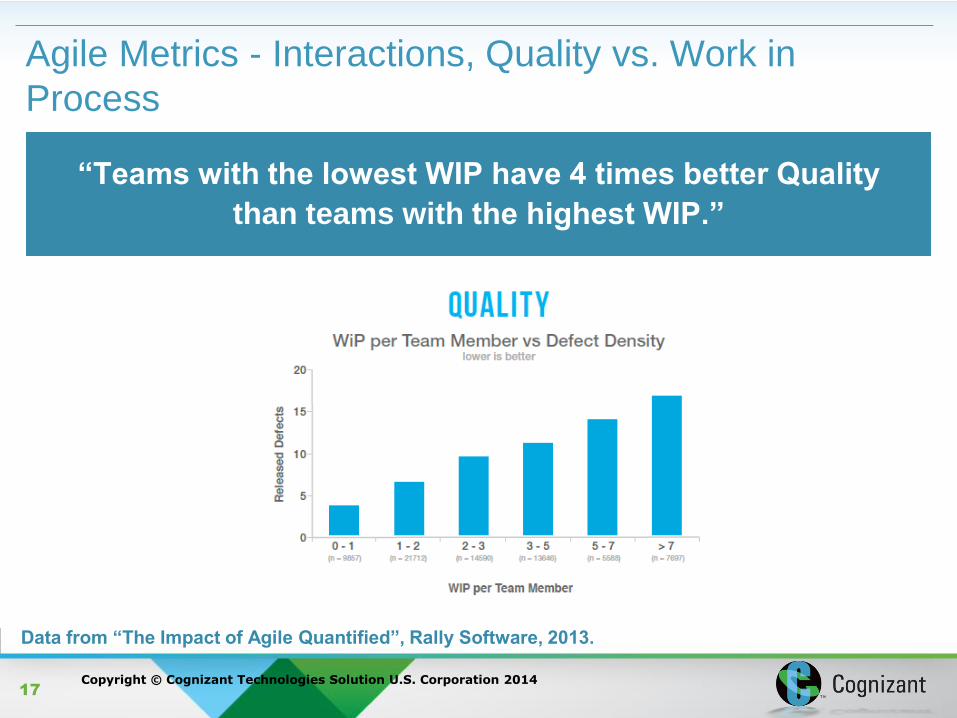
Agile Metrics - Interactions, Quality vs. Work in
Process
Data from “The Impact of Agile Quantified”, Rally Software, 2013.
“Teams with the lowest WIP have 4 times better Quality
than teams with the highest WIP.”

Copyright © Cognizant Technologies Solution U.S. Corporation 2014 18
Agile Metrics - What to do with Work in Process
findings? “It depends!”
Do you care more about productivity or time to market?
Data from “The Impact of Agile Quantified”, Rally Software, 2013.
If time to market is your most important driver, push Work in
Process as low as possible.
If productivity is your most important driver (number of
stories and defects completed per time period), don’t focus
solely on Work in Process.

Copyright © Cognizant Technologies Solution U.S. Corporation 2014 19
Agile Metrics - What to do with Team Turnover
findings? Fix it if you can!
Data from “The Impact of Agile Quantified”, Rally Software, 2013.
Teams with low turnover are more stable.
Stable teams are more productive and more predictable (lower
variance sprint-over-sprint).

Copyright © Cognizant Technologies Solution U.S. Corporation 2014
Agile Metrics – Adoption Team-Level Assessment
20
Nascent
Teams
FOLLOW the
Rules
Proficient
Teams
BREAK the
Rules
Hyper
Performing
Teams
BE the Rule
-Shu (Stage 1)
-Ha (Stage 2)
-Ri (Stage 3)

Copyright © Cognizant Technologies Solution U.S. Corporation 2014
Qualitative Quantitative
21
12 Agile Adoption Quantitative and Qualitative Metrics
Velocity
Story Creation
Quality
Accuracy of Commitment
Accuracy of Estimates
Overtime
Sprint Planning
Daily Scrum
Release Planning
Story Estimation
Release Frequency
Retrospectives
Copyright © Cognizant Technologies Solution U.S. Corporation 2014 22
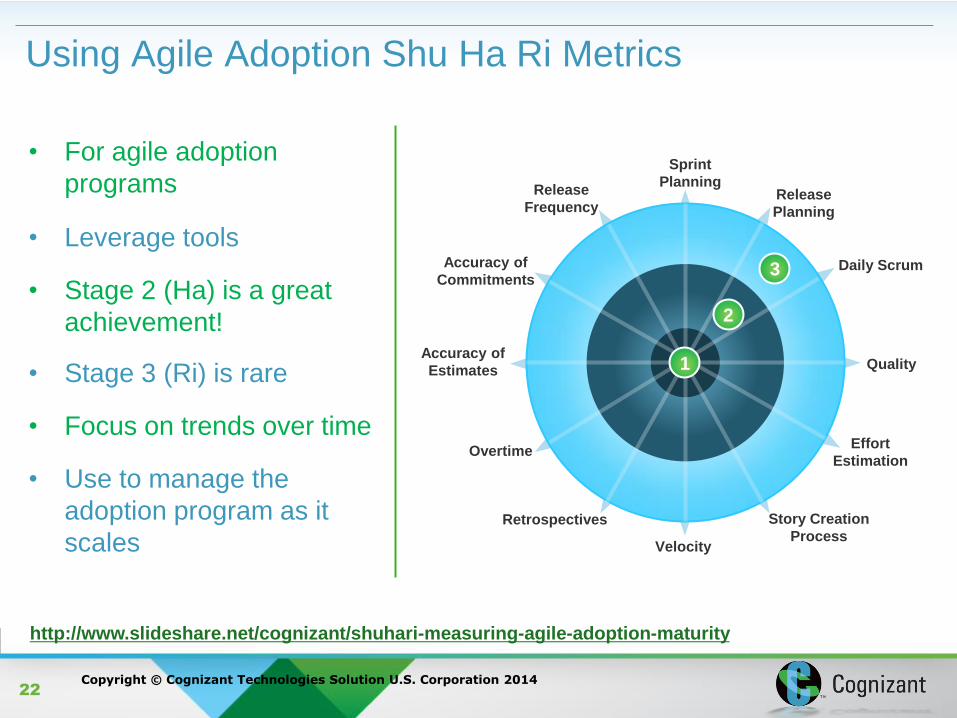
Using Agile Adoption Shu Ha Ri Metrics
http://www.slideshare.net/cognizant/shuhari-measuring-agile-adoption-maturity
Sprint
Planning Release
Planning
Daily Scrum
Quality
Release
Frequency
Accuracy of
Commitments
Accuracy of
Estimates
Overtime
Retrospectives
Velocity
Story Creation
Process
Effort
Estimation
1
2
3
• For agile adoption
programs
• Leverage tools
• Stage 2 (Ha) is a great
achievement!
• Stage 3 (Ri) is rare
• Focus on trends over time
• Use to manage the
adoption program as it
scales

Copyright © Cognizant Technologies Solution U.S. Corporation 2014 23
Agile Metrics - Must-Haves for Scrum Masters and
Agile Program Managers
• Burn-down charts by team, release, program
• Defect density
• Velocity
• Sprint over sprint improvement in velocity
• Team stability
• Speed of grooming backlog
• Stability of backlog growth and inflation (scope and effort)

Copyright © Cognizant Technologies Solution U.S. Corporation 2014 24
Agile Metrics – What Not to Measure
• People push back on per
individual metrics (only down
to team)
• Hard to collect, low utility
metrics

Copyright © Cognizant Technologies Solution U.S. Corporation 2014
Agile Metrics – Challenges
• No tool support
• No summary
• Audience education missing
• Demand for traditional metrics reporting – accept it!
• RAG indicators for schedule, cost, quality

Copyright © Cognizant Technologies Solution U.S. Corporation 2014 26
Agile Metrics – Best Practices
Cognizant’s Provably Better Programs
Cognizant’s Shu-Ha-Ri Adoption Measurement Approach
Keep it Simple
Meaningful Metrics
Planning for Metrics • How will they be used?
• How will they be collected and reported?
• Are baselines in place?

Copyright © Cognizant Technologies Solution U.S. Corporation 2014 27
Agile Metrics – Looking Forward
• Agile community: fewer metrics
• Rest of world: more metrics
• Mobile
• Self-serve
• Business-outcome focused

Copyright © Cognizant Technologies Solution U.S. Corporation 2014 28
Agile Metrics – Acknowledgements
Thanks to Dan Fuller for his work on Shu Ha Ri Agile
Adoption Metrics.
Thanks to our partner Rally Software for permission to
use their metrics findings based on over 9600 teams
using their ALM to deliver agile software.
Agile Metrics - What You Need to, Want to,
and Can Measure
June 9, 2014