agile adoption: measuring its worth - sas technical...
TRANSCRIPT

Copyright © 2013, SAS Institute, Inc. All Rights Reserved
Agile Adoption: Measuring its Worth
Tim Arthur Prepared for Stanford University Strategic Execution Conference San Francisco, California - April 2013
Agile Adoption: Measuring its worth
Page 2 Copyright © 2013, SAS Institute, Inc. All Rights Reserved
Executive Summary
SAS (www.sas.com) is the largest privately held software company in the world and a long-time leader in
analytical software and business intelligence. SAS employs over 13,000 staff in 55 countries, serving
customers in 135 countries with an enviable level of customer loyalty. SAS has been awarded the number one
place to work by Fortune®1, earning a spot in the Top 10 for the past 16 years. Internationally, SAS frequently
is cited among the very best of places to work, including the No. 1 ranking for the 2012 Great Places to Work
from among the World’s Best Multinational Workplaces2.
The company’s corporate values are straight-forward. All are equally important, and each one in its own way
contributes to the SAS R&D agile transformation.
Approachable
Customer-Driven
Swift and Agile
Innovative
Trustworthy
In 2007, the SAS Research and Development (R&D) organization launched a series of pilots to gauge if Agile
Scrum could contribute to our ongoing success. Now with nearly 2,000 in global R&D formally equipped with
training, tooling, and support, SAS has learned that Scrum works and works well. SAS R&D is adapting to
achieve greater benefits for the company and its customers. Implementing Agile Scrum has allowed SAS to
make systemic changes to core development processes. Agile Scrum has increased the amount of time that can
be dedicated to development; it ensures development is working on the right things.
Because of the unique cultural values at SAS, R&D teams were empowered to adapt Agile Scrum practices to
suit their needs and preferences. While anecdotal evidence suggested that Agile Scrum was achieving desired
results, its sponsors within R&D wanted to verify the relationships between project results and agile practices.
The research documented in this paper consists of questions pertaining to team size, amount of experience,
education, and other demographics. The research then isolated specific results one would expect to find in the
delivery of any change-process such as morale and productivity. In the last section of this research, internally
documented agile best practices were used to identify 38 specific practices to gauge adoption and maturity.
Even critics of agile would agree: The way SAS is implementing Agile Scrum makes sense and is contributing
to their ongoing success. This paper shares their story, in this sequence.
1. Context setting: The culture and work environment of SAS (pages 3-4)
2. Agile Scrum: What agile means to us, our early steps, and consistency in adoption (pages 5-8)
3. Survey findings: An outline of our results and practices (pages 9-12)
4. The SAS Agile Framework: A system that guides ongoing choices with agile adoption (pages 13-15)
5. Examples: Brief accounts profiling five different types of teams (pages 15-18)
6. Your turn: Recommendations for other firms, built from our experience at SAS (page 18)
7. Survey template: The appendix provides a tool that could be used by others to conduct a similar
assessment. (pages 21-27)
This paper and presentation is available online, at http://support.sas.com/rnd/papers/2013/AgileAdoption.zip.
1 http://money.cnn.com/magazines/fortune/best-companies/2013/list/ 2 http://www.greatplacetowork.com/best-companies/worlds-best-multinationals/the-list

Agile Adoption: Measuring its worth
Page 3 Copyright © 2013, SAS Institute, Inc. All Rights Reserved
A Winning Recipe
SAS started in 1976 serving the agricultural market. Statistical techniques developed by North Carolina State University
professor Jim Goodnight3, led to overwhelming success and eventually the co-founding of SAS with partner John Sall
4.
Since then, that same innovation built on award-winning analytics and business intelligence has spanned to numerous
industries internationally such as financial services, healthcare, government, and retail, and others (Fig 1.). SAS has
grown in each of its 38 years, with revenues approaching $3 billion and with growth recorded5 every single year in
company history (Fig. 2). SAS has been weathered the national economic cycles exceptionally well in large part to their
loyal customers and workforce, along with an annual R&D reinvestment of 25%.
The spirit within SAS is equally entrepreneurial and eager. Staff members are excited about products they’re working on
and interested to hear customer reports and new engagements. The culture at SAS is family-oriented, social, and inspires
staff to bring their best. At their world-class headquarters in Cary, North Carolina, one will find gyms and sports fields,
daycares, five-star cafes, and health-care, pharmacy, and wellness facilities. SAS’s campus carries along a high
reputation as well, complete with manicured grounds that has inspired several articles from the national and international
press. Everything about SAS speaks of quality, service, and teamwork.
Figure 1. Charts of SAS revenue by geography and industry
3 http://en.wikipedia.org/wiki/James_Goodnight 4 http://en.wikipedia.org/wiki/John_Sall 5 http://www.sas.com/news/preleases/2012financials.html

Agile Adoption: Measuring its worth
Page 4 Copyright © 2013, SAS Institute, Inc. All Rights Reserved
Figure 2. Chart of SAS Annual Revenue 1976-2012
Why change?
Since its founding, customers looked to SAS because of the robust SAS Platform. SAS’s own proprietary programming
language (SAS) has been employed by customers looking to take advantage of powerful algorithms, rendering reports and
dashboards custom to their unique business needs. In the 1990's, Dr. Jim Goodnight launched an effort involving the
development of unique offerings tailored for specific markets. Although SAS solutions have become more visible to
customers, significant expansion continues to occur within the Platform.
Staff members that were familiar with the methodology successfully used for Platform releases adopted that same method
for solution development. The culture with SAS played to their success since each team was free to use only those
segments of the process that pertained to its particular solution. This software development methodology used by the
Platform development teams is closely related to the waterfall development process6, and scaled-back versions of it were
used by new solutions teams. In the mid-2000s, the volume of new solutions reached a tipping point. Although successful
for longer-term Platform releases, solutions customers were beginning to request features and releases at a faster pace.
SAS needed to adapt.
Limited success was observed with a couple of forays spawned from the Agile Manifesto7, via Extreme programming and
RUP (Rational Unified Process8). Internally, SAS created iterative development techniques but it wasn’t until January of
2007 where the Agile Scrum model was regarded as more complete approach to software development.
Coincidentally around that time, two different parts of the company were coming to the same conclusion. Bruce Kitto9,
R&D Division Head for the Customer Intelligence product line, and Tim Arthur (author), R&D Director Project
Management. Bruce began working with an North Carolina State University professor, Dr. Laurie Williams10
for onsite
agile consulting. Tim’s early research led to a series of pilots, based on the pioneering work of Schwaber11
and Beedle’s12
6 http://en.wikipedia.org/wiki/Waterfall_model 7 http://agilemanifesto.org/ 8 http://en.wikipedia.org/wiki/IBM_Rational_Unified_Process 9 http://www.linkedin.com/pub/bruce-kitto/1/381/900 10 http://www.linkedin.com/in/laurieawilliams 11 http://en.wikipedia.org/wiki/Ken_Schwaber 12 http://agilemanifesto.org/authors.html

Agile Adoption: Measuring its worth
Page 5 Copyright © 2013, SAS Institute, Inc. All Rights Reserved
Agile Software Development with Scrum. These two paths merged to provide executive oversight and operational
championing.
Early in 2008, SAS contracted with Williams to conduct a three-day class on Agile Software Development. It was met
with success from the onset, training over 2,000 staff since. Her three-day class has been formatted to two-day version and
delivered at our regional offices in Beijing, China, and Pune, India. Amidst this viral adoption of agile, teams responded
differently to the training. This is as expected since SAS encourages team efficiencies based on each team’s needs.
SAS implementation of Agile Scrum
Agile Scrum can be configured different ways. SAS’s general implementation is pictured in Figure 3.
Figure 3. Diagram of Agile Scrum work process flow
In this method, all ideas to be considered for a product are entered into the product backlog as they are identified. Items in
the product backlog are ranked and scheduled into the next release via a release plan. Once assigned to the release, items
are then broken down to a lower level of granularity and assigned to a sprint, also known as an iteration. Typically, teams
decide on sprints that are two to four weeks in duration and maintain this cadence for the entire release.
During each sprint, owners of items assigned to the sprint verbally share updates with the project team at 15-minute daily
checkpoints called Scrums. At the end of each sprint, a demo is given to the stakeholders to demonstrate progress and
allow for feedback. Any feedback provided by stakeholders is added to the backlog for a future iteration. Ideally, the
software should be in working condition and potentially shippable at the end of each sprint.
SAS encourages teams to tailor their approach based on the product, team, and market they serve. In this light, it was
important to validate agile practices with existent teams. Teams engaged in small pilot projects sought to validate their
understanding of the new-fangled agile ideas. All pilots were successful and this quickly scaled to involve other eager
teams. As the enterprise adoption of agile took deeper root, the question of consistency across teams became more
relevant.
Internally, SAS uses social media to communicate among its workforce. Information radiators similar to Wikipedia13
and
Facebook14
help staff connect. These are called, respectively, saspedia and The Hub. In 2010, an Agile User Group
discussion site was formed on The Hub and has grown in size to become among the top three percent of all sites in terms
of number of members. Moreover, it is the most prominent group with the purpose of discussing process improvements.
Dozens of internal wiki (saspedia) pages have been authored to promote interest in consistency and best practices. Yet, as
with any social media, usage is not required.
13 http://en.wikipedia.org/ 14 https://www.facebook.com/
Agile Adoption: Measuring its worth
Page 6 Copyright © 2013, SAS Institute, Inc. All Rights Reserved
Examples of topics discussed by the Agile User Group include:
Training courses
Testing patterns and experiences
Scaling agile
Tooling
Experiences shared by different divisions
Methods for prioritizing stories
Kanban
Story writing
Informal Agile User Group meetings are attended by a small part of the population that represent those among the more
curious or the more enthusiastic. The group does not have any formal powers, but its members help gather and disperse
information cross-divisionally.
This group observed different work practices among the divisions; they also observed different types of results. With that
in mind, the team decided to form the Agile Software Development Best Practices initiative. Represented in only nine
pages, the Agile Software Development Best Practices document covers how agile is interpreted by SAS, definitions, and
best practices, measurements, and roles including suggestions for meeting a ‘basic expectation’ and one of ‘excellence’.
Why develop a survey?
With Agile now entrenched and customized by solutions development teams, the champion of this effort questioned
which variant of any one Agile Scrum practice was most effective, and if Scrum was in fact contributing to our success.
We observed that SAS staff universally agreed that agile is working. Its use had brought about a shift in mindset more
appropriate for current marketplace demands. Development teams and customers showed signs that we were on the right
path, even if we were applying the agile practices differently on each team.
Two separate events convinced agile sponsors within SAS R&D to conduct research on which practices were most
effective: an outsider’s observation and an R&D Innovation Day suggestion.
During an Agile Coaching training session, seasoned consultant Ben Carey15
observed that SAS was unlike others he had
visited in how we operate. Ben acknowledged what we had learned from each other, and he encouraged us to explore that
trend even further. Are there results one group is seeing that may be representative problems of others? Are there results
that are positive that can be modeled? Since the Agile mindset and flow is dynamic and changing, how are teams adapting
and creatively applying the Manifesto?
Executive leadership at SAS encourages R&D staff to periodically set aside an entire workday to give their employees
time for experimenting with their new ideas. An event like this in 2012 gave genesis to the draft of R&D wide agile
survey by the R&D agile champion. In short, SAS wanted verification that there is a relationship between teams that
effectively practice agile, with teams that have a higher level of results.
The Survey
Others became involved in the process that followed: Williams and seasoned Certified Scrum-master, Lynneth Lohse
16.
Together, they sought to evaluate the development results teams were seeing as a result of implementing agile practices.
Precedent resources were referred to such as the Agile Software Development Best Practices, as well as a similar survey
facilitated by Williams and Mike Kohn17
: Comparative Agility18
.
15 http://www.linkedin.com/in/benjamincarey 16 http://www.linkedin.com/pub/lynneth-lohse/1/3a4/b82 17 http://www.linkedin.com/in/mikewcohn 18 http://comparativeagility.com/

Agile Adoption: Measuring its worth
Page 7 Copyright © 2013, SAS Institute, Inc. All Rights Reserved
Purpose
Simply put, SAS needed verification data points. Specifically, the organization needed assurance or deeper insights as to
whether or not our ongoing success was attributed to agile, and if so, what kinds of practices being used in which way had
the biggest result?
Our interests in running the survey were to:
Determine level of agile adoption and consistency across R&D
Gauge the level of results from agile practices
Measure how practices and results correlate
Create a starting point and process by which to measure progress on a recurring basis
Provide retrospectives input to help teams self-assess and integrate improvements
Methods
Since SAS staff relies on conversation and similar protocols, widespread surveys are conducted infrequently. With this
given, survey questions were first piloted and the planned workflow was proposed to the sponsor, Kitto. Everyone
involved agreed that it made sense to ask for volunteer feedback. Compared to other surveys, this one was long. It
involved 6 initial questions on demographics, 10 questions on results, 38 questions on practices, and 2 questions
pertaining to future training needs. Respondents would need to be cautioned to carve aside 20-30 minutes to complete all
56 multiple-choice questions – each one having an optional field for text-based comments. SAS promoted the survey for a
period of one month and administered it via an internally built web-based tool on their intranet.
SAS opened the survey to any and every staff member in R&D, regardless of their personal opinion or experience level of
agile. It was not sent to a select set of teams or individuals. Appeals were made using a variety of communication
mediums.
Survey write-in comments provided a safe-guard by allowing feedback of any type. Although all comments were worded
in a helpful and professional manner, a larger percentage of the write-in feedback was constructive in nature– versus
comments emphasizing only supportive affirmation.
Response
A total of 178 people from all R&D divisions participated, representing a 10% sample rate. This cross-section provided an
adequate pool to draw from and explore. Beyond each question response, the comment field allowed the respondent to
provide information relevant to the analysis. This qualitative feedback proved to be valuable in validating the quantitative
questions data. In total, hundreds of comments were provided.
All possible survey responses were multiple-choice, including demographic data. All feedback was anonymous, unless the
surveyor chose to provide their name or the name of their team.
Demographic data included:
Amount of experience
Amount of education
Team size
Iteration frequency
Results data was scored on a 5-point scale:
5: Strongly agree
4: Agree
3: Neutral
2: Disagree
1: Strongly disagree

Agile Adoption: Measuring its worth
Page 8 Copyright © 2013, SAS Institute, Inc. All Rights Reserved
Practices data was scored on a 3-point scale:
3: Positive, or favorable
2: Neutral
1: Negative, or unfavorable
Survey responses for agile practices questions ranged in number and did not necessarily align to only three choices. The
survey administrators pre-determined which of the responses were considered favorable, neutral, or less favorable from an
agile adoption point of view. Those taking the survey were not aware of this alignment so that their responses would not
be biased toward favorable selections.
Analysis and Reporting
Survey administrators used SAS statistical software for this original research. SAS software is recommended but is not
required for any other company to apply this framework as-is or tailored.
Responses from individual survey-takers were summarized as a part of a high-performing set of responses or a low-
performing set. Those respondents with a results averaging equal to or greater than 4.0 (on a 5-point scale) were
aggregated into a high-performing set. Those with a results averaging equal to or less than 2.0 (on a 5-point scale) were
placed in a low-performing set.
Multiple types of charts were used to present the findings:
Matrixes and bar-charts were used to show averages as computed for all data, higher-results teams, and lower-
results teams.
A scatterplot was used to show the relationship of each surveyor in terms of their self-admitted results-score
average with their practices-score average.
A Spearman correlation19
diagram helped visualize which practices had the most influence on particular results.
Survey administrators determined correlated pairs based on p-value significance using the standard criteria of
less than 0.05 meaning we are 95% confident in the correlation of two variables.
Because the responses involved a mixture of answers on a 3-point scale for practices with answers on a 5-point scale for
results, it was decided that the correlations ought to be computed on ranks using the Spearman correlation rather than the
usual Pearson20
correlation statistic on the raw data. This choice allowed a greater weight to be assigned to those pairs of
responses that differed more than would have otherwise been used by the usual Pearson Correlation statistic. Moreover,
survey administrators subscribed to the commonly accepted level of correlational strength with:
Strength between 0 and 0.3 as a “weak correlation”
Strength greater than 0.3 and up to 0.7 as a “moderate correlation”
Strength greater than 0.7 as a “strong correlation”
Regarding write-in comments, administrators carefully reviewed each comment that was provided. It’s important to
underscore the importance of providing these comments. First, it demonstrates the openness and vulnerability of each
participant. Second, it provided information in completing the assessment from a very different perspective than pre-
packaged questions. Most importantly, the write-ins gave a sense of balance in the feedback, promoting the idea that
participants were not necessarily biased toward favoring agile.
The survey administrators felt that the neutral design of the survey questions and the write-in comments asserted a non-
biased elicitation of feedback. Analysis using the demographic data affirmed this assertion. In fact, when reviewing an
encompassing result of “Would recommend agile to another team”, administrators observed that this question was rated
consistently high regardless of amount of work, division, amount of experience, amount of agile education, number of
concurrent projects, or project size.
After the analysis was complete, the survey team created a formal presentation for the R&D leadership team. The
presentation outlined summaries and details of all results and practices. Recommendations were endorsed.
19 http://support.sas.com/documentation/cdl/en/procstat/63104/HTML/default/viewer.htm#procstat_corr_sect014.htm 20 http://support.sas.com/documentation/cdl/en/procstat/63963/HTML/default/viewer.htm#procstat_corr_sect013.htm

Agile Adoption: Measuring its worth
Page 9 Copyright © 2013, SAS Institute, Inc. All Rights Reserved
Findings for Expected Results from Agile Adoption
The survey looked at ten areas of results SAS teams expected to glean from their adoption of Agile Scrum. Administrators
found that all results fared favorably, grouped for summary here into a natural curve by level of agreement.
Highest agreement
o I would recommend agile techniques to another team.
o The team has a higher sense of engagement in both planning and executing with agile practices.
o Team members talk amongst themselves more often since adopting agile practices.
o The team has been more productive with agile practices.
Higher agreement
o The team has produced higher quality products since we started adopting agile practices.
o The team has had higher morale with agile practices.
o The team has delivered functionality to users more quickly and/or more often since we started adopting
agile practices.
Mixed agreement
o The team has a higher amount of freedom for innovation and continuous improvement with agile
practices.
After further analysis, we believe this question was worded improperly because the term
“freedom” is too subjective. Teams did confirm a higher level of engagement. However, the
diverse feedback reflected confusing interpretations in which it was answered.
o Results 9 & 10: Our customer rep(s) have been more satisfied with the functionality of our products
since we started adopting agile practices; our customer rep(s) have been more satisfied with the usability
of our products since we started adopting agile practices.
These two questions also elicited a wide range of responses, explainable later in discovery that
fewer team members have access to customer rep(s) and so the predominant vote on these
questions were neutral.
Findings for Agile Practices
The aforementioned Agile Software Development Best Practices was used to itemize 38 questions related to agile
practices, grouped into the following categories. Appendix B provides a mapping of each practice question to category.
Setup
Scrums
Iterations
Story management
Retrospectives
Teamwork
Technical practices
Product quality
As expected, SAS observed different levels of agreement for each practice. Any analysis follows a distribution, including
this survey analysis as summarized next, including a sample of the types of practices questions for each level of
agreement.
Examples where SAS saw the highest agreement
o Iteration planning meetings occur.
o The team responds to change in a swift, non-bureaucratic way.
o Blocks or holdups are resolved quickly.
o Architectural design for the product(s) is understood by the team.
o Everyone that's needed for this project is assigned, engaged, or available as needed.
o An appropriate level of action is taken based on retrospective feedback.
Examples where SAS saw strong agreement
o Stories are estimated in points.
o Team members work on finishing each iteration as a team, helping each other along the way as needed.
o Management sets goals and gives the team freedom to deliver successfully.

Agile Adoption: Measuring its worth
Page 10 Copyright © 2013, SAS Institute, Inc. All Rights Reserved
o Iterations are loaded to the right capacity.
o Developers and testers work together in story implementation and acceptance criteria.
Examples where SAS saw lower agreement
o Coaching is utilized to help adopt agile practices.
o Each team member creates a record of their tasks to help break down their assignments.
o Team members pair-program at appropriate times.
o Product is potentially shippable at the end of each iteration.
o Retrospectives occur periodically.
Note that one unique practice question did not have a set of responses that were favorable nor unfavorable. In this
question, survey administrators sought to learn which tools or applications were being used as the primary vehicle to help
teams manage dependencies.
The Relationship of Agile Practices to Project Results
The relationship of agile practices to the desired R&D development results were graphed with three different techniques.
Scatterplot
When the data were graphed as a scatterplot with practices on the X axis and results on the Y axis (Fig. 4), the resulting
diagram tells us that the number of respondents that indicated a higher level of results was greater than those reporting a
lower level. Second, there is a clustering trend from at upper right, affirming that teams with a higher level of agile
adoption experience a higher level of results.
Figure 4. Scatterplot showing results and practices
Contrasting those reporting higher results with those
reporting lower results on average, survey
administrators observed a gap for each group’s
response to Results questions. The three having the
largest gaps are:
Recommend Agile Techniques
Higher Sense of Engagement
More Productive
That is, higher performing teams stated that they
would recommend agile, felt a higher sense of
engagement than before and were more
productive. These findings alone fuel SAS’
ongoing adoption, in addition to the
improvements observed in every single measured
Result.
Likewise, administrators assessed the gap of
Practices as compared to higher and lower
performing teams and gleaned several insights. We observed that teamwork was significantly more relevant on higher
performing teams, followed by practices related to effective Scrums and story management, in order.
Teamwork
Scrums
Story management
As one might reason, those teams that reported lower results as a result of agile adoption scored higher on Retrospectives
since this activity largely describes a reactive practice, versus the others that are more proactive in nature.
Agile Adoption: Measuring its worth
Page 11 Copyright © 2013, SAS Institute, Inc. All Rights Reserved
Spearman correlational analysis
As mentioned previously, this statistical technique helped draw out how each practice influenced each result. In so doing,
survey administrators looked at both the number of direct correlations and the strength of correlation.
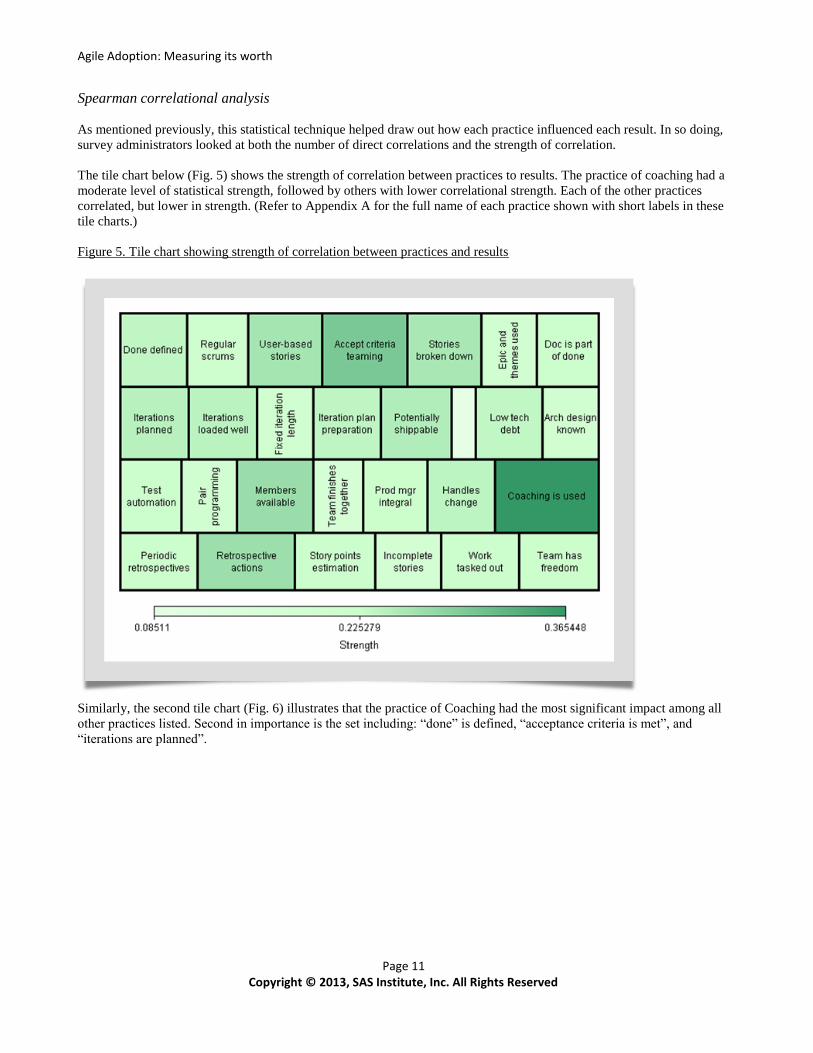
The tile chart below (Fig. 5) shows the strength of correlation between practices to results. The practice of coaching had a
moderate level of statistical strength, followed by others with lower correlational strength. Each of the other practices
correlated, but lower in strength. (Refer to Appendix A for the full name of each practice shown with short labels in these
tile charts.)
Figure 5. Tile chart showing strength of correlation between practices and results
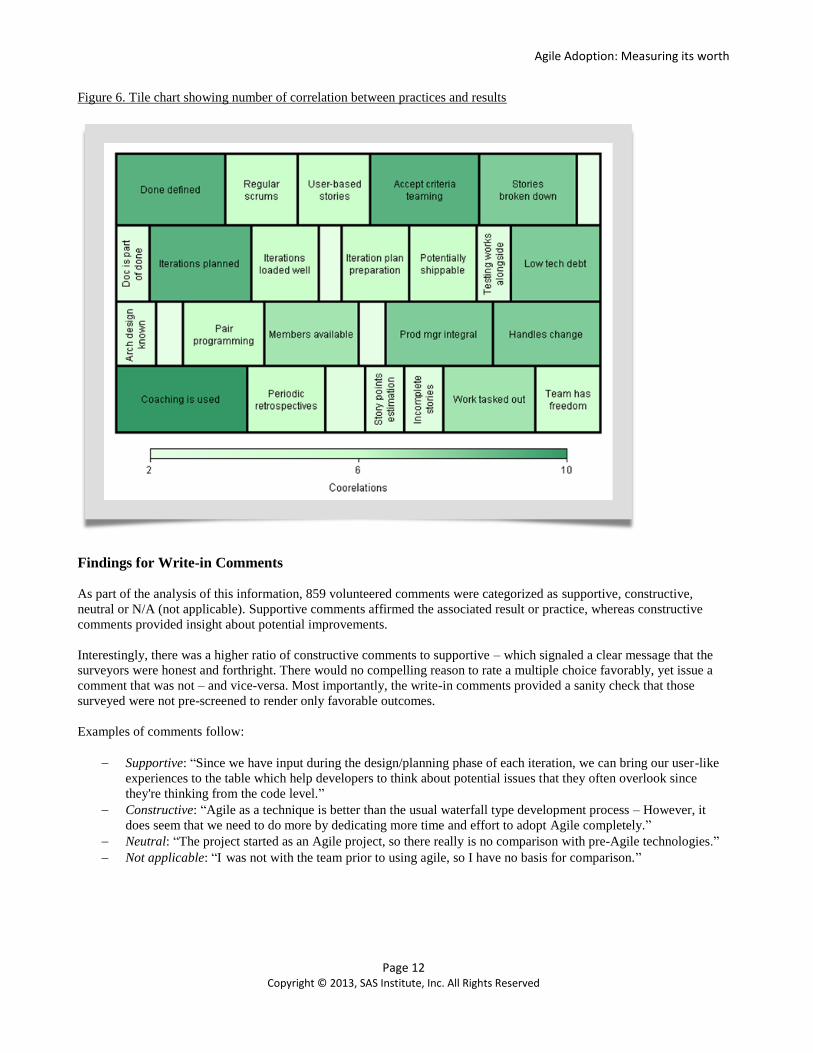
Similarly, the second tile chart (Fig. 6) illustrates that the practice of Coaching had the most significant impact among all
other practices listed. Second in importance is the set including: “done” is defined, “acceptance criteria is met”, and
“iterations are planned”.
Agile Adoption: Measuring its worth
Page 12 Copyright © 2013, SAS Institute, Inc. All Rights Reserved
Figure 6. Tile chart showing number of correlation between practices and results
Findings for Write-in Comments
As part of the analysis of this information, 859 volunteered comments were categorized as supportive, constructive,
neutral or N/A (not applicable). Supportive comments affirmed the associated result or practice, whereas constructive
comments provided insight about potential improvements.
Interestingly, there was a higher ratio of constructive comments to supportive – which signaled a clear message that the
surveyors were honest and forthright. There would no compelling reason to rate a multiple choice favorably, yet issue a
comment that was not – and vice-versa. Most importantly, the write-in comments provided a sanity check that those
surveyed were not pre-screened to render only favorable outcomes.
Examples of comments follow:
Supportive: “Since we have input during the design/planning phase of each iteration, we can bring our user-like
experiences to the table which help developers to think about potential issues that they often overlook since
they're thinking from the code level.”
Constructive: “Agile as a technique is better than the usual waterfall type development process – However, it
does seem that we need to do more by dedicating more time and effort to adopt Agile completely.”
Neutral: “The project started as an Agile project, so there really is no comparison with pre-Agile technologies.”
Not applicable: “I was not with the team prior to using agile, so I have no basis for comparison.”

Agile Adoption: Measuring its worth
Page 13 Copyright © 2013, SAS Institute, Inc. All Rights Reserved
The SAS Agile Framework
Given the survey findings and ongoing success stories, SAS is confident that agile has worth and merits ongoing
investment. A series of actions has helped promote an understanding of agile best practices, and these actions represent
what SAS terms as The SAS Agile Framework. The framework helps assure that new actions align to this overall model
for continuous improvement. This chapter provides information about the SAS Agile Framework.
Driving factors and components
Throughout our journey, key elements of a framework naturally evolved based on emerging critical success factors. Since
each component was built upon the SAS work culture, it was not necessary to promote the SAS Agile Framework as a
separate initiative. It developed over a series of years.
While not explicitly stated in the SAS Agile Framework (Fig. 7), each item largely relies on one very important element:
grass-roots buy-in. SAS has enjoyed a viral-like adoption of agile at all levels without need of any special directives.
Figure 7. SAS Agile Framework components
Each SAS Agile Framework component
includes:
Leadership
Engaged leadership support is a
critical success factor
Agile business sponsor (Executive
level providing information and
influence to leadership team)
Agile champion (Program
management level providing
operational guidance,
recommendations, and follow-
through)
Training
Education and common language is
a critical success factor
Agile Software Development (2-day
“boot camp” class for teams to
attend)
Agile for certain roles (1 day classes to help staff transition their roles to the agile mindset)
Agile Modules (short 3-hour segments drilling into certain areas)
Coaching Agile Teams (2-day sessions to promote consistency and rigor for agile coaches)
Coaching
Continuous learning is a critical success factor
Coaching Agile Teams course, in tandem with small teams of three to help nurture and challenge growth toward
more effective coaching
Organized emphasis from coaches and other leaders (“20xx is the year of Agile!” initiatives by certain teams as
appropriate.)
Socialization
Building community and consensus is a critical success factor
Ongoing promotion of open-transparency via informal exchanges such as the Agile Users Group, the HUB,
internal blogs, emails, and sharing of external WWW materials to internal teams
Survey (As outlined in this paper conducted on a recurring basis.)

Agile Adoption: Measuring its worth
Page 14 Copyright © 2013, SAS Institute, Inc. All Rights Reserved
Adapting to change through lessons-learned sharing (Project teams sharing retrospective feedback with others
beyond their own team and division)
Each SAS Agile Framework component provides feedback helping us adapt and improve, particularly
“socialization”.
Best practices
Consistency in adoption is a critical success factor
Central to the SAS Agile Framework model are a statement and continued pursuit of best practices.
Comprehensive nine-page document that provides internal agile term definitions and best practices guidance.
Agile User Group artifacts (Organized series of discussions and findings pertaining to topics of interest to cross-
divisional team members)
The SAS Agile Framework and Innovation
The Project Management Institute (PMI) triple-constraint tells us that only one among resources, function, or time can
dictate a project’s plan. Even though software development is as much art as it is science, SAS is a for-profit business that
strives to meet and exceed customer expectations. Using their waterfall-based software development model, product
teams were required to negotiate technical and market requirements before proceeding. Prototyping often helped convey
conceptual requirements, but prototypes sometimes were purposefully temporary. In like manner, testing teams were
typically engaged after all program coding had been completed. This practice created problems if the nature of test results
exposed defects developed many months prior.
The agile methodology has given SAS a reliable foundation for continuous innovation. It has fueled a spirit of critical
thinking and fostered an environment that helps to promote discussions that were previously difficult to confront. This
“agile mindset” has had and is having impacts on areas systemic to how SAS R&D operates such as schedule
management, process management, and workload management. SAS experienced benefits with agile that are summarized
below:
Iterative development of user requirement (Are we working on the right thing?)
Effective story-writing is fundamentally important, as is maintaining records of requested and approved stories
and project plans. (Agile terms requirements: “stories”.) SAS contracts with Rally Software21
to provide tooling
for projects. Some teams use locally-developed tools, yet Rally® is the primary vehicle for maintaining a
backlog of requests and allocating those over a series of iterations. In this manner, there is a higher degree of
certainty that the selected features matter the most, because of the close relationship product development teams
have with customer reps, also known as Product Managers.
Software Development Process (Are we working the right way?)
Written prior to the adoption of agile, the SAS Product Development Process (SPDP) follows a phased gate
model. It is process agnostic in that it can be used for teams using waterfall, Agile, or a hybrid. The SPDP lists
different milestones to be help teams plan and measure progress. Milestones specific to the actual programming
and validation are planned to occur some period of time before the product is actually released to the field. This
gap is necessary because of the checks-and-balances needed in the serial workflow. However, based on the
results SAS has observed from a significant volume of product teams with agile, the point in the life-cycle for
these particular milestones has been extended to a point much closer to the date the product is released to the
field – and with higher quality. This return on investment has been substantial for projects irrespective of size,
spanning anywhere from three to eighteen months. The benefit of having additional months to develop has
allowed more features to be included.
Further, the SPDP was originally published in 2004. In 2013, the decision checkpoints were reduced by half, due
in large part to the positive influence from our experiences. Despite this process reduction, R&D maintains a
healthy rigor, including ongoing executive oversight at key checkpoints for every project.
21 http://www.rallydev.com

Agile Adoption: Measuring its worth
Page 15 Copyright © 2013, SAS Institute, Inc. All Rights Reserved
Figure 8. Workload distribution with defect counts as a measure
Development and testing collaboration (Are we working together the best way?)
It takes a village to create award-winning software. Constituents other than development and testing include
publications, software internationalization, marketing, education, and technical support, among others. However,
development and testing take a lead role in determining software design and quality. The traditional software
model staggered how these teams partner, but with agile SAS R&D has seen a much tighter relationship even to
the point of test cases being written as part of the system requirements. End-of-iteration demos are used to
validate a wider acceptance from other stakeholders, while simultaneously building rapport and a motivating
sense of accomplishment from all team members.
Modes of development and testing interaction vary between products. In some cases, all development and testing
for any one given story is completed in the same iteration. This mode is ideal for some teams. Other teams
complete development of a story in one iteration, with testing then following in the subsequent sprint. Typically,
final defect resolution and integration testing of all modules within the product architecture occurs toward the
end of product development, and in this case, development and testing work together via Stabilization Iterations.
Workload distribution (Are we helping maintain a healthy work-life balance?)
Mentioned earlier, the Waterfall Development model suited both the Platform Development team projects and
the necessarily longer lead times associated with larger undertakings. However, this development model wasn’t
ideal when applied to smaller products having a greater degree of variability and dynamics from their customers.
When smaller teams employed Waterfall, they experienced a tendency to take longer than planned on
requirements, run later than expected on development, leaving less time than planned for testing and release.
SAS staff completed the work, but it required extra effort at certain points in order to do so.
SAS found that the agile model gave management a tool that allows them to decompose the product
requirements into smaller pieces. This switch in thinking fostered a different mindset. Teams could swiftly
design, code, and test individual features because of the project decomposition resulting from release and
iteration planning. During a project life-cycle, priority features are worked on first, yet teams entertain new
priorities if they emerge later in the life-cycle. Behavior changes like this contribute to teams being able to
smooth out workload peaks and valleys. Our results have shown that teams more mature with agile have been
able to smooth this variability significantly. These benefits help teams plan their work, ship on time, and
accurately predict change requests.
The line graph below (Fig. 8) depict two eras of information for the same project area, showing both the “before agile”,
and “with agile” view of how workload balancing has been impacted, measured by the rate and resolution of software
defects. At left, the “before agile” shows an upward trend followed by a late-cycle sharp curve downward. Agile allows
less technical debt (fewer defect backlogs) to
occur and a smoother workload
balance across the life of the project.
Note that time scales and volume
level are absent from this illustration.
Projects “before agile” were
scheduled on average over
two- to three-year period compared to
“with agile” ranging on average
from six to twelve months. Quicker
release cycles are yet another benefit
derived from agile.
SAS Agile Framework and Team
Dynamics
There are many examples of changes
on projects and programs of varying
sizes. This section outlines one per
project type.

Agile Adoption: Measuring its worth
Page 16 Copyright © 2013, SAS Institute, Inc. All Rights Reserved
Team 1 – Small team
This is a small development team of 4 to 5 responsible for all internal tooling that R&D uses. They support hundreds of
programmers and testers, and many times they receive urgent requests to help solve new business problems. Solving these
may consist of a new database, report, or application. This team can plan but is equally interrupt driven. Because of that
fact, Agile Scrum was not ideal. Instead, they adopted Agile Kanban. Kanban is Japanese for “sign-board” and was first
implemented on automobile manufacturing lines to create smooth workflow. This helped the team broker their backlog,
draw visibility to work-in-process levels, and improve workload distribution. At first, this team was reluctant to change
strategies but quickly became supporters.
This team started their effort using yellow stickies and a whiteboard. Since then, they have extended a tool they were
using to help manage this more efficiently online. The overall benefit has been solid. It helps the team manager see
pending requests, bottle-necks, and output. The manager of this group has a better handle of the team’s throughput rate
since it’s now quantifiable. This change has improved the team’s ability to predict when new features will be available,
which in turn has improved customer satisfaction and team assignments.
SAS has numerous small teams using Agile Scrum as well.
Team 2- Medium to large team
This category comprises several teams, all looking after various components of a product suite. The teams started looking
at agile development around 2008. They have since adopted a flavor of agile which could be described as being close to
Scrum.
They have adopted the following practices:
Short iterations focused on implementing specific areas of functionality.
Design meetings at the start of an iteration where the entire team gets together to break the user stories associated
with an iteration down into tasks. These tasks are then estimated as a team.
Regular Scrum meetings to keep each other up to date with progress and to discuss any impediments.
Retrospective meetings to regularly review all aspects of development to ensure they are continuously evolving
their processes.
The adoption of agile has allowed the team to get their software in front of both customers and subject matter experts
earlier in the development lifecycle. This capability allows the teams to get feedback earlier and to ensure that they are
developing software that will meet the needs of the end user.
Team 3- Program of teams of different sizes
A program of products means that they are often sold together in a common market. It’s normal to share team members
across teams for specific blocks of time. One might think with a close-knit team like this, all agile processes among the
subteams would be common, but they are not. There are differences that have emerged over time according to the nature
of the project and the people on it. Some examples of differences are: different ways of tasking out stories in Rally®,
differing story acceptance criteria, and having different processes for planning and writing stories. They are small
differences and team members carry best practices between teams.
Agile has allowed these teams to broker a closer relationship with the customer liaisons and, at the same time, share
progress more visibly. Formerly, it was not uncommon for years to elapse between releases. The product direction would
change, development would follow the new direction, and testing would occur late in the cycle. By prioritizing the
features, breaking the work into manageable segments and completing each feature before moving on to the next, these
same teams working on the same product, are now able to release a new version every six months.
There are qualitative benefits as well. Team ownership of the product and process has improved. In the early phases of
agile adoption, it was also not uncommon for team members to delay engagement until detailed specifications existed.
Naturally, this led to misunderstood requirements and rework in some cases, as the developers would reactively share
their interpretation of the requirements. After the switch to agile, benefits started happening immediately. Team members
collaborate in small groups consisting of designers, developers and testers. Instead of accepting a design as-is and relying
Agile Adoption: Measuring its worth
Page 17 Copyright © 2013, SAS Institute, Inc. All Rights Reserved
on comprehensively documented requirements, the developers and testers provide input and feedback into the design and
discuss options as well as improvements. Defects no longer tend to be queued for resolution later in the cycle because
developers and testers work together to complete features. Defects are addressed as they are found and many are fixed in
real time, avoiding the administrative cost of entering a defect long after coding completed.
The team owns their development processes as well, routinely evaluating and improving their software development
process on an ongoing basis, whereas in the past they would look to management for specific instructions. This higher
level of ownership and engagement has improved team rapport and morale.
Staff at all levels and from teams other than this example routinely remarks that they would never desire to go back to
working the way that they used to.
Team 4- Very large team
This is a team encompassing hundreds of employees from multiple teams within SAS R&D. With such a large project and
support team, good communication is paramount and agile provides that critical aspect. One way to understand this
complex mission is by considering how they determine what to work on, track their commitments, acceptance standards,
and how they continuously adapt and improve.
It starts with determining what to work on and this team subscribes to the language of agile in that requirements are known
as children stories and increasingly larger requirements are known as epics and themes, also known as parent stories.
Program requirements and their relative priorities are defined at the suite level by Product Management in SAS’
requirements planning tool and are fed to Rally® as prioritized epics (numbered 1-N) to be implemented by the R&D
team. Each product team then creates product specific children stories to clearly qualify and quantify what their specific
product must do in support of each suite-level each epic affecting them. Cross-product planning is critical and is addressed
as required to eliminate redundancy and inefficiency. Product team interdependencies are identified and considered as
each product team performs their iteration planning.
This team has a good grasp of how they are doing. Weekly Scrum-of-Scrums (a.k.a. daily 15-minute standup meetings)
are held with the development leaders of each product making up the suite, as well as Deployment, Architecture,
Usability, Test and Project Management representatives. Similar to a product team Scrum, each invested stakeholder (or
“pig”, using Scrum vernacular) briefly covers what their team has done since the last meeting, what they will work on
next, and identifies any obstacles they are facing, or about to create for other teams. To keep the Scrum brief, any topics
raised requiring team assessment, problem solving, and the like are placed on a parking lot list and addressed informally
immediately after the Scrum by interested parties. This weekly Scrum-of-Scrums helps to keep the multiple product
teams work efforts in alignment and minimizes the silo effect normal to large programs as any company might
experience. Rally® provides a running status view for each suite-level epic and all of its supporting children stories such
that working teams and management can monitor progress of the implementation of release content.
This team has techniques to know what they’ve done and how they performed. End of iteration program demos provide a
good summary of the features accomplished over the last iteration. The customer representative for each product
conducts a demonstration of the product’s new capabilities (all stories accepted for the iteration). The demo is given to the
implementing team, functional support teams, the management team, the peer product teams, and all interested parties.
Our natural risk-averse bias as humans is to leave well enough alone once a large team has a process and plan that works.
This line of thinking is anti-agile. Large teams like this example, continually seek ways to get better. At the end of each
iteration, the product teams hold a team retrospective to review their iteration performance (using metrics such as iteration
burn-down, velocity metrics) and assess what went well, what could have gone better, and what process improvements
should be pursued to improve the team. This continuous improvement approach keeps the teams focused on getting better
and better.
This internal release cadence has fostered an unprecedented level of innovation and awareness in this division, with the
successful completion of three major releases recently.

Agile Adoption: Measuring its worth
Page 18 Copyright © 2013, SAS Institute, Inc. All Rights Reserved
Team 5- Operational team
This team does not develop software. Their mission is operational in nature, ensuring that the metadata for all products is
accurately conveyed into systems that are used to release the product and make it available for customer orders. This team
has a high workload due largely to their centralization for all other products under development. They found that shifting to
agile allowed them to forecast with more accuracy in the near-term, while at the same time communicate longer lead time
messages to those in the prioritized backlog. One of the main benefits they have enjoyed is workload awareness and sharing
across the team. A member of the team reports a significant change in throughput due to their use of agile. “Before adopting
the agile methodology, we tended to work independently for assigned projects. Although we talk amongst ourselves daily,
we now have twice weekly team Scrums that allow the exchange of imminent status and roadblocks. We also conduct
Iteration Planning meetings every three weeks. The consequence is that we often get assigned to help with other projects,
dealing with new areas of our company’s products allowing for more freedom to change to different priorities as
needed. This has proved quite effective and gives team members an opportunity to learn about different areas of our
company.”
The SAS Agile Framework and Future Direction
SAS is a technology leader. Daily, the company pushes the envelope of using and deploying new technology to innovate
and solve emerging business problems. Cultivating the agile mindset will continue to be an important factor in ongoing
success.
Agile has touched all facets of R&D, including our flagship product, the SAS Platform. This development team has
engineered change in architecture that allows it to be released in smaller segments thereby easing the way to apply a
larger number of agile practices. New teams in R&D view starting with agile as status quo.
SAS plans to continue investing in the Agile Framework prudently, because it is an enabler to the primary mission: build,
sell, and service world-class software. Initiatives as outlined in this paper will continue to occur. The survey in this paper
was administered in 2012 and others will be administered again. As an example of integrating continuous learning into the
survey instrument itself, the survey sponsors expect to make the following changes in 2013.
Reduce the number of survey questions, while still capturing details on each of the results and practices.
Use a survey-instrument technology that is more visual. This will enable the user to provide a response in less
time. As an example, variable slider-bars may be used for certain questions instead of check-boxes.
Phrase a small sample of questions in a negative way so that it removes any bias that may come from leading the
surveyor through a series of positively-oriented questions. Post-survey data mapping will occur to align the
responses for analysis and reporting consistency.
Your Turn
The ideas shared here are meant to be used by others. SAS considers it valuable to share experiences about this
framework with other companies. One way to partner with others is by sharing our innovative survey so that others can
glean findings to help them continuously improve. Appendix B includes all survey questions and can be used as-is or
customized. SAS recommends the following steps in administering your own survey:
1. Form a very small team of 2-4 people who represent the diversity of the segment of your company you are
investing in with agile. Ensure an executive sponsor is enlisted and active in this effort.
2. Review your present struggles and challenges; create an inventory of the outcomes you would like an agile
framework to help solve. Consider a set of initiatives, such as the types SAS chose.
3. If using a survey, modify the sample version located in the appendix. Pilot the survey on a very small number of
candidates, each representing a diverse opinion of the benefits and worth of agile.
a. Create a roadmap for administering and promoting the survey, how and when it will be analyzed, and
how and when the findings will be shared and acted on.
b. Conduct the survey, assess, report.
4. Analyze the survey findings and identify the top one or two areas to improve. Canvass different teams and repeat
this prioritization exercise annually or twice-yearly.
5. Identify the best way to gather and socialize continuous improvements.

Agile Adoption: Measuring its worth
Page 19 Copyright © 2013, SAS Institute, Inc. All Rights Reserved
In Summary
SAS believes the Agile Manifesto aligns well with its culture and needs. SAS R&D teams have found that Agile Scrum is
the best model to help with current and emerging challenges. Agile training is relatively short and Agile Scrum is easy to
understand, but applying it effectively requires a change in behavior for individuals and for teams. SAS plans to continue
nudging agile forward by measuring the pulse of adoption so that its leadership at all levels can adapt well. This will
contribute to maintaining market leadership and being a great place to work.
Credits
Special thanks to several contributors key in the journey of sharing this story here including Dr. Laurie Williams (North
Carolina State University), Sean Billow (Rally), along with SAS colleagues Lynneth Lohse, Bruce Kitto, Rob Agnelli,
Chistina Harvey, Christy Garrison, Albert Page, Jim McCumesty, Gordon Robinson, Connie Marthinsen, Beth Langston,
Justin Belcher, Eleanor Johnson, Lauren Goodridge, Justin Belcher, and Trish Halley.
About the author
Tim Arthur22
holds his MS from Georgia Institute of Technology in Management of Technology23
. He is an innovator
and agile champion within SAS at Cary, NC. Prior, he worked for IBM24
leading cutting-edge software development
projects for global 24x7 mission-critical manufacturing processes. He and his wife recently celebrated their 30th
wedding
anniversary in Hawaii, and are looking forward to being grandparents in 2013. Away from work you’ll find him kayaking,
biking, enjoying photography, or helping with non-profits.
Online Materials
This paper is available online at: http://support.sas.com/rnd/papers/2013/AgileAdoptionPaper.pdf
This paper and accompany presentation are available at: http://support.sas.com/rnd/papers/2013/AgileAdoption.zip
22 http://www.linkedin.com/in/timearthur 23 http://scheller.gatech.edu/ 24 http://www.ibm.com/

Agile Adoption: Measuring its worth
Page 20 Copyright © 2013, SAS Institute, Inc. All Rights Reserved
Appendix A
Correlation Figures Labels Full Description
A full description of the short-name labels in each tile is provided here in alphabetical order.
Accept criteria teaming: Developers and testers work together in story implementation and acceptance criteria.
Arch design known: Architectural design for the product(s) is understood by the team.
Coaching is used: Coaching is utilized to help adopt agile practices.
Doc is part of done: Technical and user documentation is included in determining if a story is complete.
Done defined: There is a clear definition of done for stories.
Epic and themes used: Epics and theme concepts are used to help organize groups of stories.
Fixed iteration length: Iterations do not change length.
Handles change: The team responds to change in a swift, non-bureaucratic way.
Incomplete stories: Incomplete stories are well-managed.
Iteration plan preparation: Teams are prepared for planning.
Iterations loaded well: Iterations are loaded to the right capacity.
Iterations planned: Iteration planning meetings occur.
Low tech debt: Defect levels are continually monitored (low technical debt).
Members available: Everyone that’s needed for this project is assigned, engaged, or available as needed.
Pair programming: Team members pair-program at appropriate times.
Periodic retrospectives: Retrospectives occur periodically.
Potentially shippable: Product is potentially shippable at the end of each iteration.
Prod mgr integral: Product management or someone in that role is integrally involved.
Regular scrums: Regular Scrums occur.
Retrospective actions: An appropriate level of action is taken based on retrospective feedback.
Stories broken down: Stories are broken down and small enough to be done in one iteration.
Story points estimation: Stories are estimated in points.
Team finishes together: Team members work on finishing each iteration as a team, helping each other along the
way as needed.
Team has freedom: Management sets goals and gives the team freedom to deliver successfully.
Test automation: Automated unit and/or acceptance tests are run as part of each automated build.
Testing works alongside: Testing participates alongside development.
User-based stories: Stories are requirements are written in a way that describes how a feature can be realized by
a user.
Work tasked out: Each team member creates a record of their tasks to help break down their assignments.

Agile Adoption: Measuring its worth
Page 21 Copyright © 2013, SAS Institute, Inc. All Rights Reserved
Appendix B
Survey
This is a comprehensive overview of the types of questions asked and how they are scored. Other than demographics
information, each question is framed to collect a quantitative response as well as optional text comments.
Opening Comments
A message is provided in the beginning of the survey to help set an overall context and purpose. The text that SAS used
follows.
This is an Agile Outcomes and Practices Survey. This research project is being moderated by SAS and Dr.
Laurie Williams of North Carolina State University to help us understand and improve on large scale agile
practices, and to give individual teams a tool to isolate areas of improvement. This survey will take between 10-
30 minutes to complete. If you are working on more than one project, fill this out for only one at a time. At the
end of the survey, we'll prompt you to return and change your answers if you'd like to submit additional surveys.
We have provided several opportunities for you to provide optional comments. Please use these freely so that we
can best understand where we're at in our journey as well as appropriate feedback. For more information on this
effort, please see [our internal Wikipedia] or contact [as named]. Thank you for your time and interest.
Demographics Information
These questions help us determine the context for the responses. They are valuable in subsequent data sub-setting and
analysis.
Name or ID (optional)
Role (multiple choice)
Number of staff on project (sum of developers and testers)
Is this team trained?
o Most are not trained.
o Some have been trained.
o Most or all have been trained.
Does this team have experience?
o Little to none
o 1-6 months usage
o 7-23 months usage
o More than 2 years usage
R&D division (checkbox selection)
SAS geography (checkbox selection)
Results/Outcomes Information
Information collected from this set of questions helps us understand about the actual output as seen by the agile
practitioners. Questions are scored on a five-point scale as follows.
5: Strongly agree
4: Agree
3: Neutral
2: Disagree
1: Strongly disagree
As such, the questions are phrased as statements and follow next. Note that some questions are worded in the negative to
so-as not to nudge the respondent to provide only favorable type of responses. A negatively oriented prompting such as:
‘Agile made the teams less effective’ may very well invoke a different response than ‘Agile made the team more effective’.
Agile Adoption: Measuring its worth
Page 22 Copyright © 2013, SAS Institute, Inc. All Rights Reserved
Post-survey data management will need to take this into account so that results can be compared consistently. Regardless,
the SAS culture encourages employees to speak out.
Each question or statement, for both Results and Practices includes an associated text field for capturing optional
comments.
Since we started adopting agile practices:
The team has produced higher quality products.
The team has not been more productive.25
The team has had higher morale.
The team has not delivered functionality to users more quickly and/or more often.
The team functions as an empowered self-directed work team and holds each other accountable for team success.
The team has not had a higher sense of engagement in both planning and executing.
Team members talk amongst themselves more often.
I would recommend agile techniques to another team.
Please answer if you are a development manager, testing manager, Scrum-master or work with customer rep(s):
Our customer rep(s) have not been as satisfied with the functionality of our products since we started adopting
agile practices.
Our customer rep(s) have been more satisfied with the usability of our products since we started adopting agile
practices.
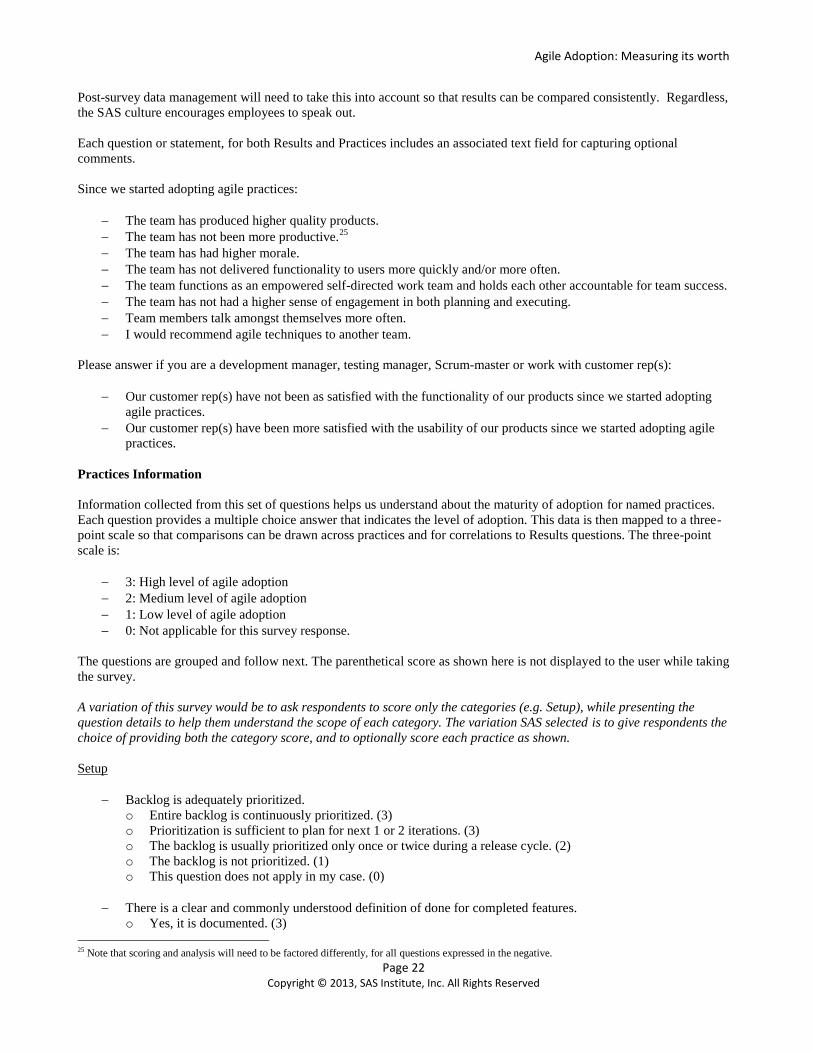
Practices Information
Information collected from this set of questions helps us understand about the maturity of adoption for named practices.
Each question provides a multiple choice answer that indicates the level of adoption. This data is then mapped to a three-
point scale so that comparisons can be drawn across practices and for correlations to Results questions. The three-point
scale is:
3: High level of agile adoption
2: Medium level of agile adoption
1: Low level of agile adoption
0: Not applicable for this survey response.
The questions are grouped and follow next. The parenthetical score as shown here is not displayed to the user while taking
the survey.
A variation of this survey would be to ask respondents to score only the categories (e.g. Setup), while presenting the
question details to help them understand the scope of each category. The variation SAS selected is to give respondents the
choice of providing both the category score, and to optionally score each practice as shown.
Setup
Backlog is adequately prioritized.
o Entire backlog is continuously prioritized. (3)
o Prioritization is sufficient to plan for next 1 or 2 iterations. (3)
o The backlog is usually prioritized only once or twice during a release cycle. (2)
o The backlog is not prioritized. (1)
o This question does not apply in my case. (0)
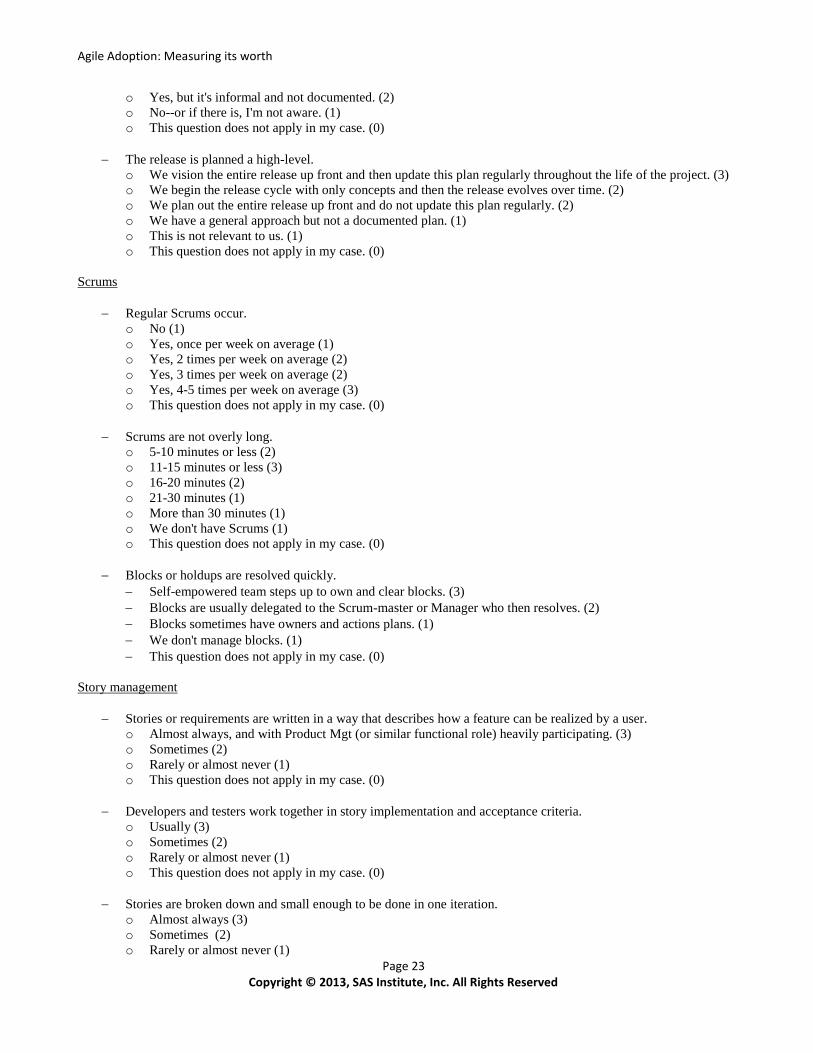
There is a clear and commonly understood definition of done for completed features.
o Yes, it is documented. (3)
25 Note that scoring and analysis will need to be factored differently, for all questions expressed in the negative.
Agile Adoption: Measuring its worth
Page 23 Copyright © 2013, SAS Institute, Inc. All Rights Reserved
o Yes, but it's informal and not documented. (2)
o No--or if there is, I'm not aware. (1)
o This question does not apply in my case. (0)
The release is planned a high-level.
o We vision the entire release up front and then update this plan regularly throughout the life of the project. (3)
o We begin the release cycle with only concepts and then the release evolves over time. (2)
o We plan out the entire release up front and do not update this plan regularly. (2)
o We have a general approach but not a documented plan. (1)
o This is not relevant to us. (1)
o This question does not apply in my case. (0)
Scrums
Regular Scrums occur.
o No (1)
o Yes, once per week on average (1)
o Yes, 2 times per week on average (2)
o Yes, 3 times per week on average (2)
o Yes, 4-5 times per week on average (3)
o This question does not apply in my case. (0)
Scrums are not overly long.
o 5-10 minutes or less (2)
o 11-15 minutes or less (3)
o 16-20 minutes (2)
o 21-30 minutes (1)
o More than 30 minutes (1)
o We don't have Scrums (1)
o This question does not apply in my case. (0)
Blocks or holdups are resolved quickly.
Self-empowered team steps up to own and clear blocks. (3)
Blocks are usually delegated to the Scrum-master or Manager who then resolves. (2)
Blocks sometimes have owners and actions plans. (1)
We don't manage blocks. (1)
This question does not apply in my case. (0)
Story management
Stories or requirements are written in a way that describes how a feature can be realized by a user.
o Almost always, and with Product Mgt (or similar functional role) heavily participating. (3)
o Sometimes (2)
o Rarely or almost never (1)
o This question does not apply in my case. (0)
Developers and testers work together in story implementation and acceptance criteria.
o Usually (3)
o Sometimes (2)
o Rarely or almost never (1)
o This question does not apply in my case. (0)
Stories are broken down and small enough to be done in one iteration.
o Almost always (3)
o Sometimes (2)
o Rarely or almost never (1)
Agile Adoption: Measuring its worth
Page 24 Copyright © 2013, SAS Institute, Inc. All Rights Reserved
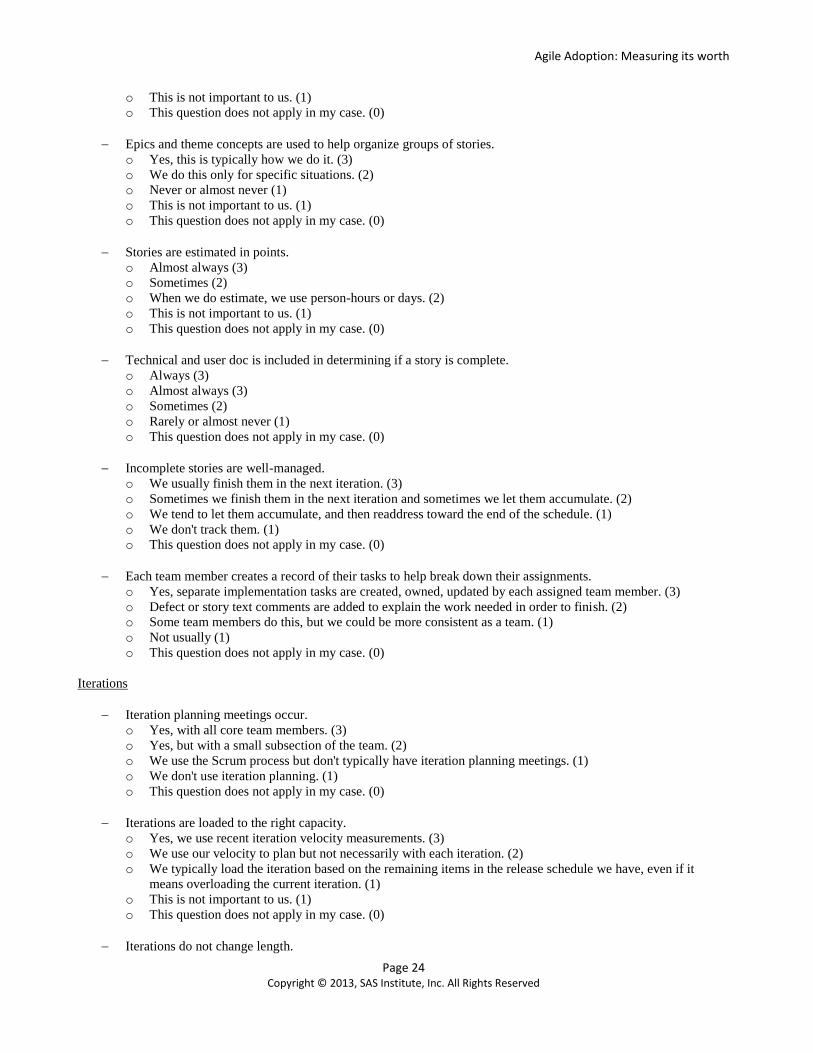
o This is not important to us. (1)
o This question does not apply in my case. (0)
Epics and theme concepts are used to help organize groups of stories.
o Yes, this is typically how we do it. (3)
o We do this only for specific situations. (2)
o Never or almost never (1)
o This is not important to us. (1)
o This question does not apply in my case. (0)
Stories are estimated in points.
o Almost always (3)
o Sometimes (2)
o When we do estimate, we use person-hours or days. (2)
o This is not important to us. (1)
o This question does not apply in my case. (0)
Technical and user doc is included in determining if a story is complete.
o Always (3)
o Almost always (3)
o Sometimes (2)
o Rarely or almost never (1)
o This question does not apply in my case. (0)
Incomplete stories are well-managed.
o We usually finish them in the next iteration. (3)
o Sometimes we finish them in the next iteration and sometimes we let them accumulate. (2)
o We tend to let them accumulate, and then readdress toward the end of the schedule. (1)
o We don't track them. (1)
o This question does not apply in my case. (0)
Each team member creates a record of their tasks to help break down their assignments.
o Yes, separate implementation tasks are created, owned, updated by each assigned team member. (3)
o Defect or story text comments are added to explain the work needed in order to finish. (2)
o Some team members do this, but we could be more consistent as a team. (1)
o Not usually (1)
o This question does not apply in my case. (0)
Iterations
Iteration planning meetings occur.
o Yes, with all core team members. (3)
o Yes, but with a small subsection of the team. (2)
o We use the Scrum process but don't typically have iteration planning meetings. (1)
o We don't use iteration planning. (1)
o This question does not apply in my case. (0)
Iterations are loaded to the right capacity.
o Yes, we use recent iteration velocity measurements. (3)
o We use our velocity to plan but not necessarily with each iteration. (2)
o We typically load the iteration based on the remaining items in the release schedule we have, even if it
means overloading the current iteration. (1)
o This is not important to us. (1)
o This question does not apply in my case. (0)
Iterations do not change length.

Agile Adoption: Measuring its worth
Page 25 Copyright © 2013, SAS Institute, Inc. All Rights Reserved
o We rarely if ever alter the number of weeks in our iteration cadence. (3)
o We have changed our iteration length a few times for this project team. (1)
o We don't use iterations. (1)
o This question does not apply in my case. (0)
Teams come prepare to the iteration planning meetings.
o Always (3)
o Usually (3)
o Sometimes (2)
o Rarely or almost never (1)
o This question does not apply in my case. (0)
If used, hardening (or stabilization) iterations are scheduled in advance.
o Yes, we plan for these in our project plan to bring integration efforts together. (3)
o When we decide we need one of these, we then schedule it. (3)
o We plan upfront to defer bugs and use hardening iterations to catch up. (1)
o This question does not apply in my case. (0)
End-of-iteration demos occur.
o Demos occur for all iterations. (3)
o Demos occur for most iterations. (3)
o Demos occur for some iterations. (2)
o Demos do not occur. (1)
o This question does not apply in my case. (0)
Product is potentially shippable at the end of each iteration.
o Product is "potentially shippable" at the end of every iteration. (3)
o Product is "potentially shippable" at the end of some iterations during the project lifecycle. (2)
o Product was not potentially shippable until the end, where it is available for ship. (1)
o This question does not apply in my case. (0)
Testing participates alongside development.
o Testing is done in the same iteration as development. (3)
o Testing is done in a subsequent iteration. (2)
o Testing is generally done toward the end of the project lifecycle. (1)
o This question does not apply in my case. (0)
Dependencies are well-managed.
o We use tools to help record and remind us of key dependencies. (3)
o We rely on meeting notes to remind us of key dependencies. (2)
o We don’t track our key dependencies. (1)
o This question does not apply in my case. (0)
Product quality
Defect levels are continuously monitored (low technical debt).
o We refer to open defect levels when determining if our work for a story is complete. (3)
o We manage defect levels, but it is effort that is separate from accepting stories. (2)
o We tend to monitor defect levels only towards the end of the project lifecycle (1)
o This question does not apply in my case. (0)
Unit testing occurs.
o Everyone on the team does some unit testing. (3)
o Some members of the team do unit testing. (2)
o Not many or no one on the team does unit testing. (1)
o This question does not apply in my case. (0)

Agile Adoption: Measuring its worth
Page 26 Copyright © 2013, SAS Institute, Inc. All Rights Reserved
Code reviews occur.
o Always or almost always (3)
o Regularly (3)
o Sometimes (2)
o Rarely or almost never (1)
o This question does not apply in my case. (0)
Architectural design for the product(s) is understood by the team.
o We have it documented, our team understands it, and developers design their
components accordingly. (3)
o Yes, it is documented or commonly understood but we don't typically factor it in to day to day development
or code reviews. (2)
o We don't typically need to architect our product. (1)
o This question does not apply in my case. (0)
Technical practices
Automated unit and/or acceptance tests are run as part of each automated build.
o Yes, for most of our code (3)
o Yes, for key portions of the code (3)
o Not very often (2)
o Not at all (1)
o This question does not apply in my case. (0)
Team members pair-program at appropriate times.
o Yes, for most of the code or at least key portions (3)
o Not often enough (2)
o We never pair-program. (1)
o This question does not apply in my case. (0)
Teamwork
Everyone that’s needed for this project is assigned, engaged, or available as needed.
o Yes (3)
o Partially true (2)
o No (1)
o This question does not apply in my case. (0)
Team members work on finishing each iteration as a team, helping each other along the way as needed.
o Most of the time (3)
o Sometimes (2)
o Infrequently (1)
o This question does not apply in my case. (0)
Management sets goals and gives the team freedom to deliver successfully.
o All or most of the time (3)
o Sometimes (2)
o Infrequently (1)
o This question does not apply in my case. (0)
Formal written documents are used to supplement rather than replace faster, more informal communication.
o Most of the time (3)
o Sometimes (2)
o Infrequently (1)
o This question does not apply in my case. (0)

Agile Adoption: Measuring its worth
Page 27 Copyright © 2013, SAS Institute, Inc. All Rights Reserved
Product management or someone in that role is integrally involved.
o Product management or someone in that role is very involved. (3)
o The person assigned has other priorities but helps when possible. (2)
o We don't have an assigned product manager or equivalent. (1)
o This question does not apply in my case. (0)
The team responds to change in a swift, non-bureaucratic way.
o Usually (3)
o Sometimes (2)
o Not usually (1)
o This question does not apply in my case. (0)
Coaching is utilized to help adopt agile practices.
o Yes (3)
o We have tried some coaching, but it was not effective. (2)
o No (1)
o This question does not apply in my case. (0)
Retrospectives
Retrospectives occur periodically.
o Retrospectives occur regularly at the end of each iteration. (3)
o Retrospectives occur sporadically. (2)
o Retrospectives occur rarely. (1)
o This question does not apply in my case. (0)
An appropriate level of action is taken based on retrospective feedback.
o Our team regularly implements suggestions surfaced during the retrospectives. (3)
o Our team sometimes implements suggestions surfaced during retrospectives. (2)
o Our team complains about problems but doesn't effectively implement any suggestions. (1)
o This question does not apply in my case. (0)
Additional Information
Two additional questions are asked to extract as much information as possible from the surveyor investing their time in
this continuous improvement effort. They include:
What area(s) do you feel continually challenged and where coaching or training may help? (checkboxes and
comment fields)
Do you have any additional comments? (comment field)