aggressive estrogen-receptor-positive breast cancer arising in patients with elevated body mass...
TRANSCRIPT

ORIGINAL ARTICLE
Aggressive estrogen-receptor-positive breast cancer arisingin patients with elevated body mass index
Cesar Augusto Santa-Maria • Jingsheng Yan •
Xian-Jin Xie • David Michael Euhus
Received: 19 March 2014 / Accepted: 14 May 2014
� Japan Society of Clinical Oncology 2014
Abstract
Background Obese women with estrogen receptor (ER)-
positive breast cancer may experience worse disease-free
and overall survival. We hypothesize that this observation
is due to intrinsically aggressive disease and that obesity
will be associated with higher histologic grade and Ki67.
Methods A sequential cohort of women with breast can-
cer diagnosed over 2 years was assembled from institu-
tional tumor registries. Patient and tumor characteristics
were abstracted from medical records; those with non-
invasive tumors, or lacking body mass index (BMI), Ki67
or histologic grade data, were excluded. Univariate and
multivariate analysis was performed to investigate the
relationship between markers of aggressive disease (grade
and Ki67) and multiple variables associated with obesity. A
subgroup analysis was performed to investigate further
whether ER and menopausal status influenced associations
between BMI and aggressive phenotypes.
Results Of the 1007 patients initially identified, 668
(68 %) met the eligibility criteria. In univariate analysis,
histologic grade and Ki67 were strongly associated with
increased BMI, younger age, and African-American race,
but less so with diabetes, hypertension, and hyperlipidemia.
Multivariate analysis confirmed that higher histologic
grade was associated with increased BMI (p = 0.02), and
that increased Ki67 was associated with younger age
(p = 0.0003) and African-American race (p = 0.002).
Additional analysis found that the association between
increased BMI and higher-grade tumors was particularly
significant in premenopausal women with ER-positive
disease.
Conclusion This study concludes that increased BMI is
associated with aggressive-phenotype breast cancer and
may be particularly relevant to ER-positive breast cancer
developing in premenopausal African-American women.
Keywords Breast cancer � Obesity � Aggressive
phenotype � Histologic grade � Ki67
Introduction
Epidemiologic studies strongly suggest that obesity is a
risk factor for many cancers, especially breast cancer [1, 2].
In breast cancer patients, obesity is associated with an
increased risk of breast cancer-related death [hazard ratio
(HR) 1.33; 95 % confidence interval (CI): 1.19, 1.50], and
overall mortality (HR 1.33; 95 % CI: 1.21, 1.47), particu-
larly in estrogen receptor (ER)-positive subtypes [2–4]. It is
unknown whether this clinical observation is secondary to
undertreatment or the intrinsic biology of breast tumors
C. A. Santa-Maria (&)
Department of Medical Oncology, Sidney Kimmel
Comprehensive Cancer Center, Bunting-Blaustein Cancer
Research Bldg, Johns Hopkins University, 1650 Orleans St.,
Rm. 144, Baltimore, MD 21287-0013, USA
e-mail: [email protected]
J. Yan � X.-J. Xie
Department of Clinical Sciences, Simmons Comprehensive
Cancer Center, University of Texas Southwestern Medical
Center, 5323 Harry Hines Blvd, Dallas, TX 75390-8551, USA
e-mail: [email protected]
X.-J. Xie
e-mail: [email protected]
D. M. Euhus
Department of Surgery, Sidney Kimmel Comprehensive Cancer
Center, Johns Hopkins University, 600 N. Wolfe Street,
Baltimore, MD 21287, USA
e-mail: [email protected]
123
Int J Clin Oncol
DOI 10.1007/s10147-014-0712-4
arising in obese women. Overweight and obese patients
undergoing adjuvant chemotherapy are more likely to have
intentional first-cycle dose reductions then their leaner
counterparts, despite studies suggesting that obese patients
tolerate chemotherapy as well as or better than lean
patients [5–7]. Furthermore, obese patients treated with
aromatase inhibitors may have higher circulating levels of
plasma estradiol and estrone sulfate, which may suggest
decreased drug efficacy [8]. While obesity has been linked
to several biologic mechanisms associated with breast
oncogenesis, including insulin resistance, inflammation,
adipokine imbalance, and hyperestrogenemia, it is not well
understood whether these mechanisms predict aggressive-
phenotype disease [9, 10]. Recent data from a Japanese
cohort suggested that in premenopausal women, increased
body mass index (BMI) was associated with larger, lymph
node-positive, high-grade tumors; however, this has not
been confirmed in United States (US) cohorts [11]. The
prevalence of obesity, a reversible disease, is increasing in
the US and may be associated with inferior breast cancer
outcomes; therefore, understanding the unique biology of
breast cancers that develop in obese patients may help
identify those most likely to benefit from weight loss
interventions [12, 13].
Patients and methods
This research was reviewed and approved by the University
of Texas Southwestern Medical Center Institutional
Review Board. A cohort of 1,007 ethnically diverse women
diagnosed with primary breast cancer in 2008 or 2009 was
sequentially identified from the University of Texas
Southwestern Medical Center Simmons Comprehensive
Cancer Center and Parkland Memorial Hospital tumor
registries. Clinical and pathologic information was
obtained by chart review. Scoring of histologic grade and
Ki67 was assessed by standard institutional protocols,
using Elston scoring for the former. High tumor grade and
increased proliferation (Ki67) were selected as the primary
adverse pathologic features to assess. ER positivity was
defined as C1 % of cells staining positive for ER by
immunohistochemistry. Human epidermal growth factor 2
(HER2) positivity was defined as an immunohistochemical
score greater than 2, or, if equal to 2, a fluorescent in situ
hybridization (FISH) ratio greater than 2.2. BMI was
treated both as a continuous variable and categorically
according to World Health Organization (WHO) classifi-
cations. Univariate analysis was performed to investigate
the relationship between adverse pathologic features
(defined by histologic grade and Ki67) and parameters of
excess energy states (including BMI, diabetes, hyperten-
sion, and hyperlipidemia) and other demographic variables
Table 1 Cohort characteristics
Characteristic Number (%)
Total cohort 668
Age, years (mean, range) 55.3 (25–93)
Body mass index
\25 kg/m2 192 (29)
25–29.9 kg/m2 191 (29)
[30 kg/m2 285 (43)
Menopausal status
Premenopausal 197 (29)
Postmenopausal 452 (68)
Unknown 19 (3)
Race
Caucasian 347 (52)
African-American 232 (35)
Other 89 (13)
Ethnicity
Non-hispanic 605 (91)
Hispanic 58 (9)
Unknown 5 (\1)
Hypertension
Yes 293 (44)
No 351 (52)
Unknown 24 (4)
Diabetes
Yes 110 (16)
No 533 (80)
Unknown 25 (4)
Hyperlipidemia
Yes 137 (20)
No 506 (76)
Unknown 25 (4)
Grade
1 129 (19)
2 299 (45)
3 240 (36)
Ki67 (mean, standard deviation) 33.9 (29.8)
ER
Positive 510 (76)
Negative 155 (23)
Unknown 3 (\1)
HER2
Positive 123 (18)
Negative 538 (81)
Unknown 7 (1)
Stage
1 142 (21)
2 341 (51)
3 135 (20)
4 30 (5)
Int J Clin Oncol
123

using chi-squared, Student’s t test, ANOVA, or linear
regressions as appropriate [14, 15]. Multivariate regression
analysis, using a backward model selection method, was
then performed to identify variables independently pre-
dicting increasing histologic grade or Ki67. The entering
criterion for the multivariate model was a p value less than
0.15 by univariate analysis; however, the final model only
kept those variables with a two-sided p value less than
0.05. Given the small number of covariates, multiple
comparisons were not adjusted for. Data were collected and
verified using Microsoft Excel and all statistical analyses
were performed using SAS 9.2 for Windows (SAS Institute
Inc., Cary, NC, USA). An exploratory subgroup analysis
was performed to investigate the relationship of BMI with
histologic grade and Ki67 in ER-positive versus ER-neg-
ative tumors, further subdivided by menopausal status,
using chi-squared, Student’s t test, ANOVA, or linear
regressions as appropriate.
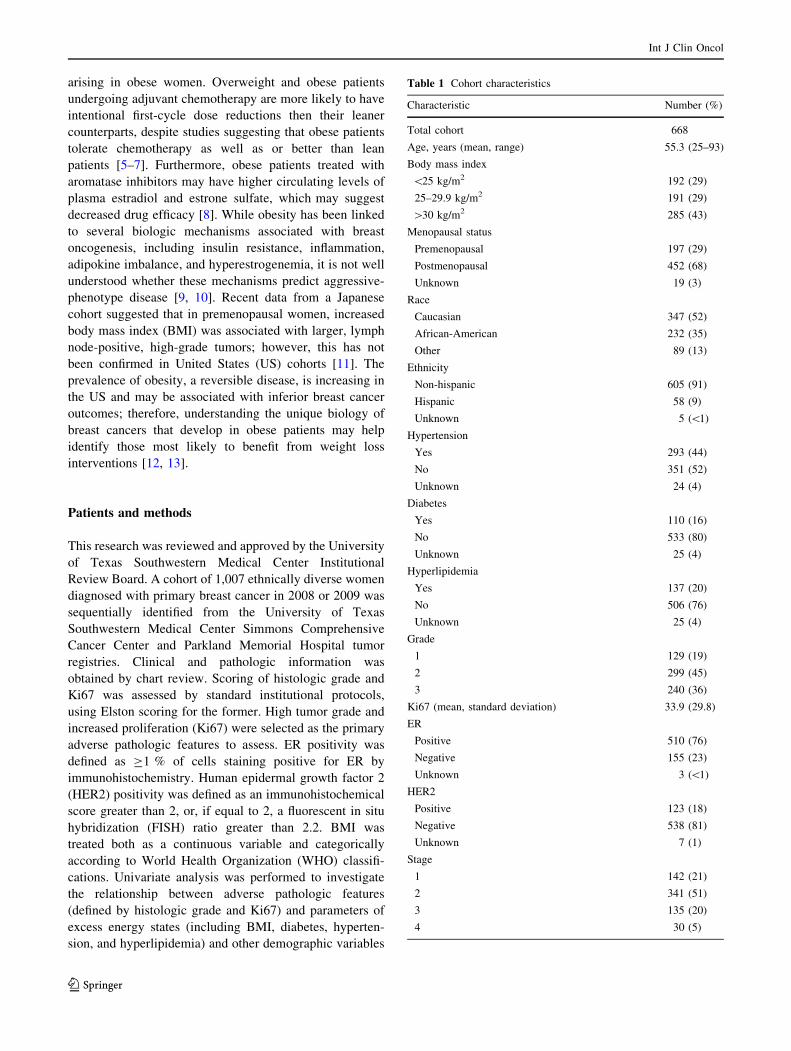
Results
From the initial cohort of 1,007 patients, BMI, histologic
grade, and Ki67 were available for 668 (66 %) with inva-
sive breast cancer, which defined the study popula-
tion. The characteristics of the study population are shown
in Table 1. The mean age of diagnosis was 55.3 years,
68 % were postmenopausal, 72 % were overweight or
obese, and 92 % had stage I–III breast cancer, which is
similar to previous cohorts and the nationwide prevalence
[16, 17]. Tumors in our cohort tended to have high histo-
logic grade (81 % had grade 2 or 3), the median Ki67 was
Table 1 continued
Characteristic Number (%)
Unknown 20 (3)
Histology
Invasive ductal 491 (74)
Invasive lobular 65 (10)
Mixed histology 36 (5)
Other 76 (11)
Table 2 Univariate analysis identifying additional covariates predicting tumor grade and Ki67
Characteristic Histologic grade Ki67
1 2 3 p value Mean Ki67 ± standard deviation p value
Age, years (mean ± standard deviation) 59.3 ± 11.9 56.4 ± 13.3 51.9 ± 12.4 \0.0001 -0.559 ± 0.086a \0.0001
BMI, kg/m2 (mean ± standard deviation) 27.3 ± 5.5 29.7 ± 7.23 30.9 ± 8.0 \0.0001 0.632 ± 0.156 \0.0001
Menopausal status, n (%)
Pre 26 (4) 82 (13) 89 (14) 0.002 40.8 ± 31.4 \0.0001
Post 102 (16) 205 (31) 145 (22) 30.7 ± 28.7
Race, n (%)
White 84 (13) 157 (24) 106 (16) \0.0001 28.4 ± 27.0 \0.0001
African-American 28 (4) 95 (14) 109 (16) 43.2 ± 32.0
Other 17 (3) 47 (7) 25 (4) 31.1 ± 28.3
Diabetes, n (%)
Yes 17 (3) 60 (9) 33 (5) 0.077 32.8 ± 29.6 0.645
No 108 (16) 228 (34) 197 (29) 34.3 ± 30.1
Hypertension, n (%)
Yes 63 (9) 122 (18) 108 (16) 0.293 34.1 ± 30.2 0.966
No 62 (9) 166 (25) 124 (19) 34.0 ± 29.7
Hyperlipidemia, n (%)
Yes 31 (5) 67 (10) 39 (6) 0.118 28.5 ± 27.4 0.016
No 94 (14) 221 (33) 192 (29) 35.5 ± 30.5
ER, n (%)
Positive 125 (19) 262 (39) 123 (19) \0.0001 25.2 ± 24.0 \0.0001
Negative 4 (1) 35 (5) 116 (17) 62.7 ± 28.9
HER2, n (%)
Positive 10 (2) 46 (7) 67 (10) \0.0001 43.7 ± 25.9 \0.0001
Negative 115 (17) 250 (38) 173 (26) 32.0 ± 30.3
a Slope (per year) ± standard error
Int J Clin Oncol
123

33.9, 76 % of tumors were ER-positive, 18 % were HER2-
positive, and the most common histology seen was invasive
ductal carcinoma (74 %). Compared to national averages,
our cohort had a higher prevalence of diabetes (DM; 16 %
compared to 8.3 %) and hypertension (HTN; 44 % com-
pared to 21 %), but a lower prevalence of hyperlipidemia
(HLD; 21 % compared to 33.5 %) [18–20]. Only 46 % of
the cohort was free of any of the aforementioned metabolic
diseases.
Univariate analysis established that increasing BMI,
treated as a continuous variable, was strongly associated
with higher histologic grade (p \ 0.0001) and increasing
Ki67 (p \ 0.0001). This association was also observed
when analyzing BMI by WHO category. ER-negative and
HER2-positive tumors, younger age, premenopausal status,
and African-American race were also found to be associ-
ated with higher histologic grade and Ki67. Of the meta-
bolic diseases, only hyperlipidemia was associated with
increased Ki67 (Table 2). As expected, Ki67 and histologic
grade were closely associated with each other
(p \ 0.0001). Additional analysis of the entire cohort
evaluating BMI with stage, ER and HER2 status did not
reveal any significant associations.
Multivariate analysis was then performed to verify
whether these variables independently were associated
with higher histologic grade or increased Ki67. Increased
BMI was found to predict breast cancers of higher histo-
logic grade, but not increased Ki67. Conversely, younger
age and African-American race were associated with high
Ki67, but not histologic grade. ER-negative tumors were
more likely to have higher grade and Ki67, and HER2-
positive tumors were more likely to be higher grade.
Metabolic diseases including DM, HTN, or HLD were not
associated with either histologic grade or Ki67 (Table 3).
As an internal validation of our data quality we checked
to see whether BMI also correlated with metabolic condi-
tions such as DM, HTN, and HLD. The associations were
significant, as would be predicted for DM, HTN
(p \ 0.0001), and HLD (p = 0.018).
An exploratory subgroup analysis was performed to
determine whether the association between BMI and
aggressive phenotypes varied by ER status. BMI was most
strongly associated with increased Ki67 and higher grade
for ER-positive tumors. When the data was further subdi-
vided by menopausal status, increased BMI was associated
with higher-grade ER-positive tumors in premenopausal
women. Additionally, BMI was associated with postmen-
opausal women with ER-negative tumors (Table 4).
Discussion
These data suggest that increased BMI is associated with
aggressive breast cancer phenotypes, particularly tumors of
higher histologic grade. This may be especially true in
premenopausal women with ER-positive tumors, and
Table 3 Multivariate analysis of variables predicting histologic grade and Ki67
Characteristic Histologic grade Ki67
OR (95 % CI) p value Overall p value Correlation coefficient (95 % CI) p value Overall p value
BMI (per unit) 1.039 (1.014–1.066) 0.0024 0.0024 0.149 (-0.114 to 0.411) 0.2675 0.2675
Age (per year) 0.991 (0.976–1.005) 0.2004 0.2004 -0.288 (-0.439 to 0.137) 0.0002 0.0002
Race
White Reference 0.5664 Reference 0.006
Black 1.207 (0.805–1.808) 0.3625 6.379 (2.391–10.368) 0.0018
Other 0.928 (0.556–1.547) 0.7735 0.675 (-4.610 to 5.961) 0.8020
ER
Positive Reference \0.0001 Reference \0.0001
Negative 3.779 (2.284–6.252) \0.0001 23.062 (18.466–27.657) \0.0001
HER2
Positive 1.555 (0.996–2.429) 0.0521 -0.0521 -3.106 (-7.766 to 1.555) 0.1912 0.1912
Negative Reference Reference
Diabetes 1.031 (0.637–1.668) 0.9014 0.9014 1.196 (-3.822 to 6.214) 0.6399 0.6399
Hypertension 0.791 (0.541–1.156) 0.2260 0.2260 0.104 (-3.823 to 4.031) 0.9587 0.9587
Hyperlipidemia 1.070 (0.695–1.649) 0.7577 0.7577 -0.317 (-4.917 to 4.283) 0.8924 0.8924
Variables included in the model investigating histologic grade were: BMI, age, menopausal status, race, Ki67, and ER and HER2 status; since
menopausal status was not significant, it was removed in the final model shown below. Variables included in the model investigating Ki67 were:
BMI, age, menopausal status, race, histologic grade, and ER and HER2 status
BMI body mass index, OR odds ratio, CI confidence interval
Int J Clin Oncol
123

postmenopausal women with ER-negative tumors. Youn-
ger age and African-American race were additionally
found to be associated with increased Ki67, consistent with
other studies [21, 22].
Though grade and proliferation are highly correlated
with one another, multivariate analysis demonstrated that
higher BMI was associated with higher histologic grade,
but not Ki67. Conversely, while younger age and African-
American race was associated with increased Ki67, it was
not associated with histologic grade. A similar discordance
between histologic grade and Ki67 had previously been
observed in a Japanese cohort investigating tumor features
and elevated BMI [11]. Though related, Ki67 and histo-
logic grade may be surrogates for different biologies. Ki67
is strictly a marker of proliferation, whereas histologic
grade considers not only proliferation, through pathologic
mitotic count, but also nuclear pleomorphism and tubule
formation [23]. While Ki67 and histologic grade reflect
different biologies, they tend to trend together, as they did
in our study (p \ 0.0001). It is unclear whether the small
sample size contributed to these discordant findings or if
obesity truly affects these markers differently.
There are important strengths and limitations to consider
when interpreting these results. These data were obtained
by retrospective chart review, and interpretation is limited
by this design. Investigating biomarkers of aggressive
disease as part of prospective studies could validate these
findings. BMI may not be the most accurate surrogate of
energy excess states, particularly in African-American
patients [24]. Waist circumference is thought to be a more
accurate surrogate, especially among different ethnic
groups, although abnormal BMI and waist circumference
tend to trend together [25]. Following National Institute of
Health recommendations, waist circumference should be
included in future studies in addition to BMI when evalu-
ating energy excess states [26]. Another consideration is
that histologic grade and Ki67 have limited inter-laboratory
reproducibility [27, 28]. All pathologic analysis in our
study, however, was reviewed by pathologists within the
same institution, and intra-laboratory correlation has pre-
viously been shown to be good for these markers, partic-
ularly Ki67 [inter-class correlation coefficient
(ICC) = 0.94; 95 % CI = 0.93–0.97] [27]. Another
strength of this study is that the cohort is ethnically diverse,
Table 4 Association of BMI with histologic grade and Ki67 by estrogen receptor and menopausal status using chi-squared analysis
Estrogen receptor negative (n = 155) Estrogen receptor positive (n = 510)
BMI
\25 kg/m2BMI 25–29.9
kg/m2BMI
[30 kg/m2p value BMI
\25 kg/m2BMI 25–29.9
kg/m2BMI
[30 kg/m2p value
All 41 48 66 150 142 218
Grade
1 1 3 0 0.264 48 35 42 0.042
2 10 12 13 70 78 114
3 30 33 53 32 29 62
Ki67
% 61.1 ± 30.9 55.4 ± 29.2 68.9 ± 26.5 0.043 21.0 ± 22.5 24.9 ± 22.4 28.2 ± 25.7 0.019
Premenopausal (ER–, n = 52;
ER?, n = 145)
12 20 20 45 36 64
Grade
1 0 0 0 0.701 14 8 4 0.005
2 2 5 3 17 21 34
3 10 15 17 14 7 26
Ki67
% 62.6 ± 30.2 63.0 ± 29.9 70.0 ± 31.5 0.714 26.8 ± 27.3 32.5 ± 24.7 35.0 ± 27.2 0.280
Postmenopausal (ER–, n = 99;
ER?, n = 351)
27 27 45 98 103 150
Grade
1 1 3 0 0.197 33 27 38 0.583
2 8 6 10 48 55 77
3 18 18 35 17 21 35
Ki67
% 58.6 ± 31.9 49.6 ± 28.4 68.6 ± 24.7 0.021 19.0 ± 20.3 21.8 ± 21.2 24.7 ± 24.5 0.143
Int J Clin Oncol
123

and the relationships demonstrated may be applicable to
both Caucasians and African-Americans.
While our results confirmed that increased BMI is
associated with metabolic diseases such as DM, HTN, and
HLD, these metabolic diseases were not associated with
either high histologic grade or Ki67. Although numerous
clinical and preclinical studies have found that insulin
resistance is associated with important pro-neoplastic
pathways, we found that DM and other metabolic diseases
commonly associated with insulin resistance were not
associated with aggressive-phenotype breast cancer, sug-
gesting that other mechanisms may be involved. Inflam-
matory pathways have been shown to mediate various
oncogenic pathways and are frequently upregulated in
energy excess states [29]. This relationship supports our
findings that increased BMI was associated with post-
menopausal women with ER-negative tumors. Obesity is
also associated with hyperestrogenemia, which is a known
risk factor for ER-positive breast cancers, and may explain
our findings in premenopausal women with ER-positive
tumors [30]. Inflammatory cytokines may also contribute to
hyperestrogenemia, as they have also been found to
upregulate aromatase expression in breast tissue, which
may contribute to the relationship between obesity and ER-
positive tumors [31]. Furthermore, adipokines, such as
leptin, have been shown to promote oncogenesis, and have
been linked to inferior breast cancer outcomes in ER-
positive tumors [13, 32]. Understanding the biologic
pathways influenced by excess energy states relevant to
specific breast cancers subtypes may inform the develop-
ment of future pharmacologic targeting of these pathways.
In summary, these results confirm that in an ethnically
diverse US cohort, similar to previous data from Japanese
cohorts, BMI is associated with aggressive-phenotype
breast cancers [11]. These data may in part explain the
worse clinical prognosis experienced by women with ER-
positive breast cancer who have an increased BMI, adding
additional evidence that these tumors are particularly
sensitive to the biologic effects of obesity. Identifying
tumor and patient characteristics relevant to breast cancers
arising in excess energy states may inform future studies
targeting excess energy pathways including weight loss
interventions.
Conflict of interest The authors declare that they have no conflict
of interest.
References
1. Food, nutrition, physical activity and the prevention of cancer: a
global perspective (2007). World Cancer Research Fund/Ameri-
can Institute for Cancer Research, Washington, DC
2. Protani M, Coory M, Martin JH (2010) Effect of obesity on
survival of women with breast cancer: systematic review and
meta-analysis. Breast Cancer Res Treat 123(3):627–635
3. Ryu SYKC, Nam CM, Park JK et al (2001) Is body mass index
the prognostic factor in breast cancer?: a meta-analysis. J Korean
Med Sci 16(5):610–614
4. Sparano JA, Wang M, Zhao F et al (2012) Obesity at diagnosis is
associated with inferior outcomes in hormone receptor-positive
operable breast cancer. Cancer 118(23):5937–5946
5. Griggs JJ, Sorbero ME, Lyman GH (2005) Undertreatment of
obese women receiving breast cancer chemotherapy. Arch Intern
Med 165(11):1267–1273. doi:10.1001/archinte.165.11.1267
6. Carroll J, Protani M, Walpole E et al (2012) Effect of obesity on
toxicity in women treated with adjuvant chemotherapy for early-
stage breast cancer: a systematic review. Breast Cancer Res Treat
136(2):323–330. doi:10.1007/s10549-012-2213-3
7. Griggs JJ, Mangu PB, Anderson H et al (2012) Appropriate
chemotherapy dosing for obese adult patients with cancer:
American Society of Clinical Oncology clinical practice guide-
line. J Clin Oncol 30(13):1553–1561. doi:10.1200/JCO.2011.39.
9436
8. Folkerd EJ, Dixon JM, Renshaw L et al (2012) Suppression of
plasma estrogen levels by letrozole and anastrozole is related to
body mass index in patients with breast cancer. J Clin Oncol
30(24):2977–2980. doi:10.1200/JCO.2012.42.0273JCO.2012.42.
0273
9. Chlebowski R, McTiernan A, Wactawski-Wende J et al (2012)
Diabetes, metformin, and breast cancer in postmenopausal
women. J Clin Oncol 30(23):2844–2852
10. Khan S, Shukla S, Sinha S et al (2013) Role of adipokines and
cytokines in obesity-associated breast cancer: therapeutic targets.
Cytokine Growth Factor Rev 24(6):503–513
11. Yanai A, Miyagawa Y, Murase K et al (2013) Influence of body
mass index on clinicopathological factors including estrogen
receptor, progesterone receptor, and Ki67 expression levels in
breast cancers. Int J Clin Oncol [Epub ahead of print]
12. Obesity: preventing and managing the global epidemic. Report of
a WHO consultation (2000) vol 894
13. IOM (Institute of Medicine): the role of obesity in cancer survival
and recurrence: workshop summary. (2012) Washington, DC
14. Flegal KM, Carroll MD, Kit BK et al (2012) Prevalence of
obesity and trends in the distribution of body mass index among
US adults, 1999–2010. JAMA 307(5):491–497
15. Wing RR, Matthews KA, Kuller LH et al (1991) Weight gain at
the time of menopause. Arch Intern Med 151(1):97–102
16. Dawood S, Lei X, Litton JK et al (2012) Impact of body mass
index on survival outcome among women with early stage triple-
negative breast cancer. Clin Breast Cancer 12(5):364–372
17. Ries LAG, Eisner MP, Kosary CL (2001) SEER cancer statistics
review, 1973–1998, National Cancer Institute
18. CDC (2011) Vital signs: prevalence, treatment, and control of
hypertension—United States, 1999–2002 and 2005–2008.
MMWR 60(4):103–108
19. Kuklina EV, Shaw KM, Hong Y (2011) Vital Signs: prevalence,
treatment, and control of high levels of low-density lipoprotein
cholesterol—United States, 1999–2002 and 2005–2008. MMWR
60(04):109–114
20. Centers for Disease Control and Prevention. National diabetes
fact sheet: national estimates and general information on diabetes
and prediabetes in the United States (2011) U.S. Department of
Health and Human Services, Centers for Disease Control and
Prevention, Atlanta, GA
21. Christiansen N, Chen L, Gilmore J et al (2012) Association
between African American race and outcomes in patients with
nonmetastatic triple-negative breast cancer: a retrospective
Int J Clin Oncol
123

analysis by using results from the Georgia Cancer Specialist
Database. Clin Breast Cancer 12(4):270–275
22. Sparano JA, Wang M, Zhao F et al (2012) Race and hormone
receptor-positive breast cancer outcomes in a randomized che-
motherapy trial. J Natl Cancer Inst 104(5):406–414
23. Elston CW, Ellis IO (1991) Pathological prognostic factors in
breast cancer. I. The value of histological grade in breast cancer:
experience from a large study with long-term follow-up. Histo-
pathology 19(5):403–410
24. Deurenberg P, Yap M, van Staveren WA (1998) Body mass index
and percent body fat: a meta analysis among different ethnic
groups. Int J Obes Relat Metab Disord 22(12):1164–1171
25. Abbasi F, Blasey C, Reaven GM (2013) Cardiometabolic risk
factors and obesity: does it matter whether BMI or waist cir-
cumference is the index of obesity? Am J Clin Nutr
98(3):637–640
26. The practical guide: identification, evaluation, and treatment of
overweight and obesity in adults http://www.nhlbi.nih.gov/guide
lines/obesity/prctgd_c.pdf. Accessed 20 Jan 2014
27. Polley MY, Leung SC, McShane LM et al (2013) An interna-
tional Ki67 reproducibility study. J Natl Cancer Inst
105(24):1897–1906
28. Meyer JS, Alvarez C, Milikowski C et al (2005) Breast carcinoma
malignancy grading by Bloom-Richardson system vs prolifera-
tion index: reproducibility of grade and advantages of prolifera-
tion index. Mod Pathol 18(8):1067–1078
29. Moller DE, Flier JS (1991) Insulin resistance—mechanisms,
syndromes, and implications. N Engl J Med 325(13):938–948
30. Cleary MP, Grossmann ME (2009) Minireview: obesity and
breast cancer: the estrogen connection. Endocrinology
150(6):2537–2542. doi:10.1210/en.2009-0070
31. Simpson E, Brown KA (2013) Obesity and breast cancer: role of
inflammation and aromatase. J Mol Endocrinol 51(3):T51–T59.
doi:10.1530/JME-13-0217
32. Cho Y, Sung M, Yeon J et al (2013) Prognostic role of inter-
leukin-6, interleukin-8, and leptin levels according to breast
cancer subtype. Cancer Res Treat 45(3):210–219
Int J Clin Oncol
123