agenda veli-matti mattila, ceo
TRANSCRIPT

Agenda
CEO’s review Veli-Matti Mattila, CEO Financial review Jari Kinnunen, CFO
CEO’s review
• Q2 2013 financial and operational highlights • Segment review • Strategy execution • Outlook for 2013
3
Q2 2013 highlights
• PPO companies consolidated as of 1 May • Intense competition in mobile continued • Macro environment still challenging • Mobile subscription base continued to grow • Smartphone market continued to grow • Elisa Viihde IPTV success continued • Fixed broadband base increased markedly due to PPO
acquisition • Accelerated cost efficiency measures continue
4
Q2 2013 financial highlights
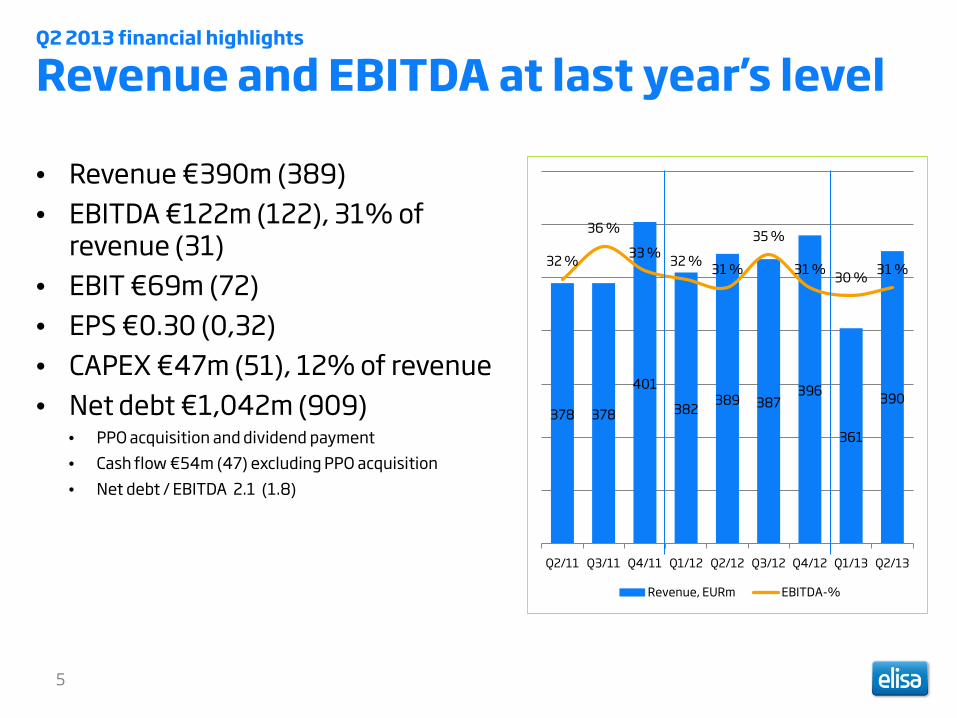
Revenue and EBITDA at last year’s level
• Revenue €390m (389) • EBITDA €122m (122), 31% of
revenue (31) • EBIT €69m (72) • EPS €0.30 (0,32) • CAPEX €47m (51), 12% of revenue • Net debt €1,042m (909)
• PPO acquisition and dividend payment • Cash flow €54m (47) excluding PPO acquisition • Net debt / EBITDA 2.1 (1.8)
5
378 378
401
382 389 387 396
361
390
32 %
36 %
33 % 32 % 31 %
35 %
31 % 30 % 31 %
Q2/11 Q3/11 Q4/11 Q1/12 Q2/12 Q3/12 Q4/12 Q1/13 Q2/13
Revenue, EURm EBITDA-%
Q2 2013 operational highlights
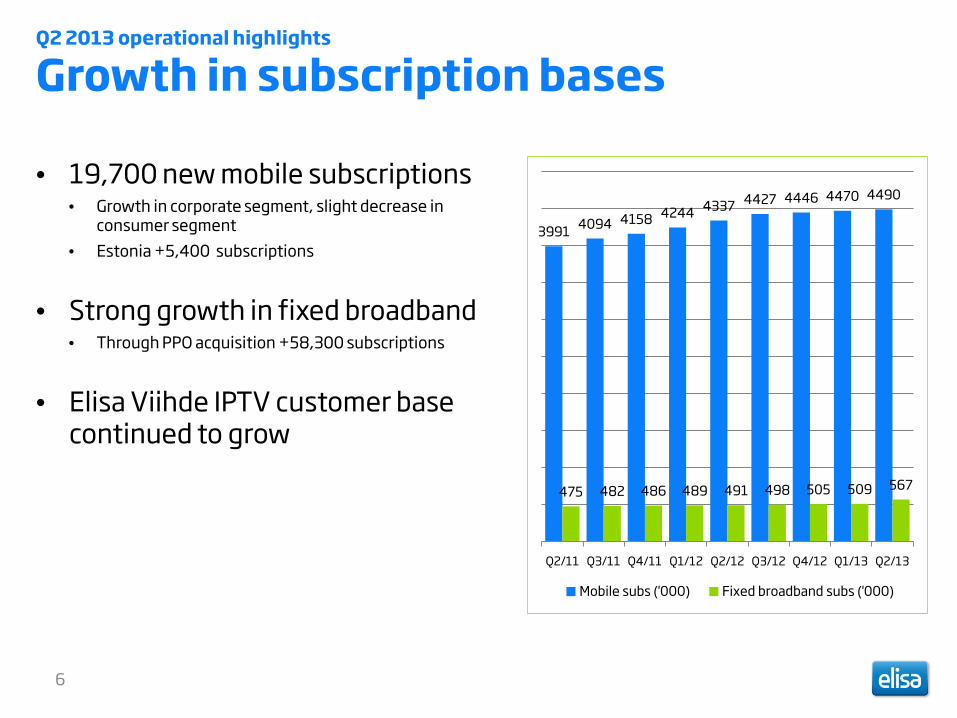
Growth in subscription bases
• 19,700 new mobile subscriptions • Growth in corporate segment, slight decrease in
consumer segment • Estonia +5,400 subscriptions
• Strong growth in fixed broadband • Through PPO acquisition +58,300 subscriptions
• Elisa Viihde IPTV customer base continued to grow
6
3991 4094 4158 4244 4337 4427 4446 4470 4490
475 482 486 489 491 498 505 509 567
Q2/11 Q3/11 Q4/11 Q1/12 Q2/12 Q3/12 Q4/12 Q1/13 Q2/13
Mobile subs ('000) Fixed broadband subs ('000)
Q2 2013 operational highlights
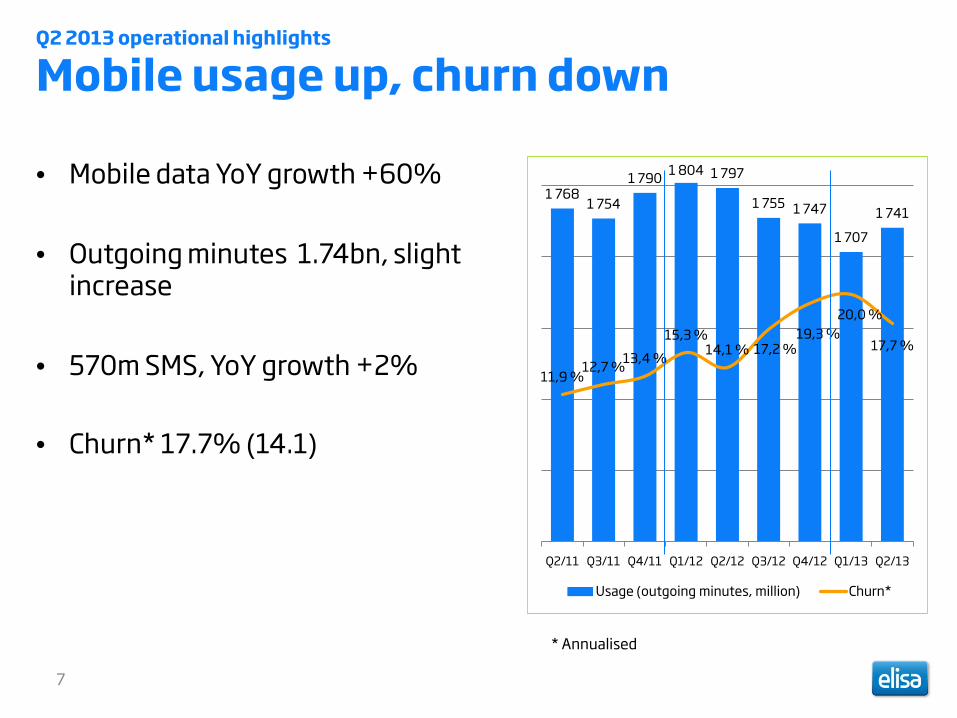
Mobile usage up, churn down
• Mobile data YoY growth +60%
• Outgoing minutes 1.74bn, slight increase
• 570m SMS, YoY growth +2%
• Churn* 17.7% (14.1)
7
1 768 1 754
1 790 1 804 1 797
1 755 1 747
1 707
1 741
11,9 % 12,7 % 13,4 %
15,3 % 14,1 % 17,2 %
19,3 % 20,0 %
17,7 %
Q2/11 Q3/11 Q4/11 Q1/12 Q2/12 Q3/12 Q4/12 Q1/13 Q2/13
Usage (outgoing minutes, million) Churn*
* Annualised

Business Segments
8
Q2 2013 Consumer Customers
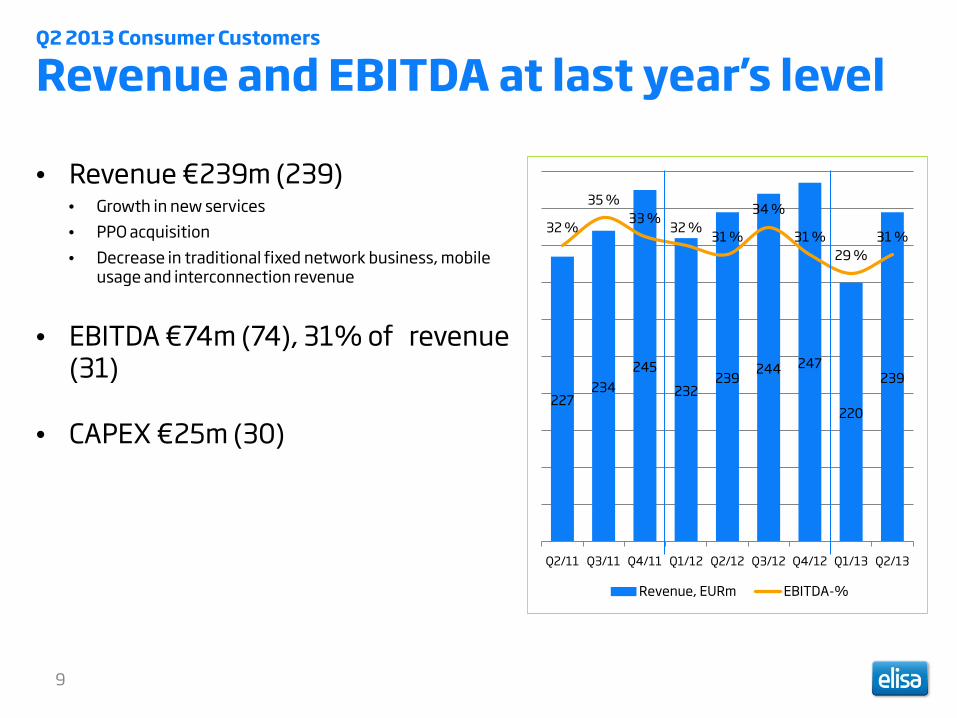
Revenue and EBITDA at last year’s level
• Revenue €239m (239) • Growth in new services • PPO acquisition • Decrease in traditional fixed network business, mobile
usage and interconnection revenue
• EBITDA €74m (74), 31% of revenue (31)
• CAPEX €25m (30)
9
227 234
245
232 239 244 247
220
239
32 %
35 % 33 % 32 % 31 %
34 %
31 % 29 %
31 %
Q2/11 Q3/11 Q4/11 Q1/12 Q2/12 Q3/12 Q4/12 Q1/13 Q2/13
Revenue, EURm EBITDA-%
Q2 2013 Corporate Customers
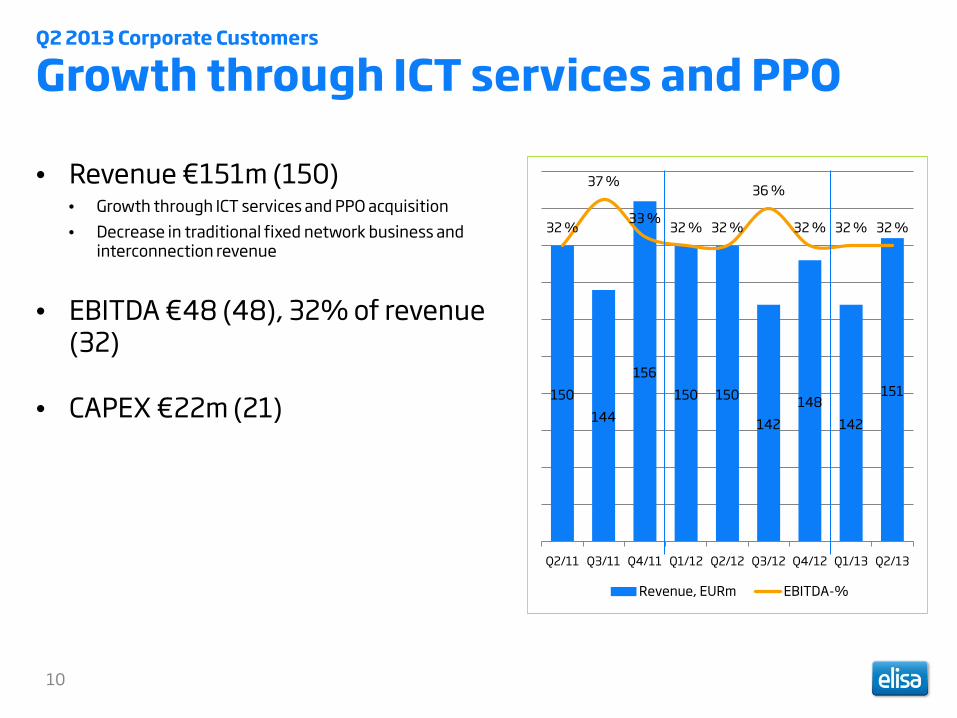
Growth through ICT services and PPO
• Revenue €151m (150) • Growth through ICT services and PPO acquisition • Decrease in traditional fixed network business and
interconnection revenue
• EBITDA €48 (48), 32% of revenue (32)
• CAPEX €22m (21)
10
150 144
156 150 150
142 148
142
151
32 %
37 %
33 % 32 % 32 %
36 %
32 % 32 % 32 %
Q2/11 Q3/11 Q4/11 Q1/12 Q2/12 Q3/12 Q4/12 Q1/13 Q2/13
Revenue, EURm EBITDA-%
11
Strategy execution
Build value on data
Accelerate new services businesses
Improve performance with customer intimacy and operational excellence
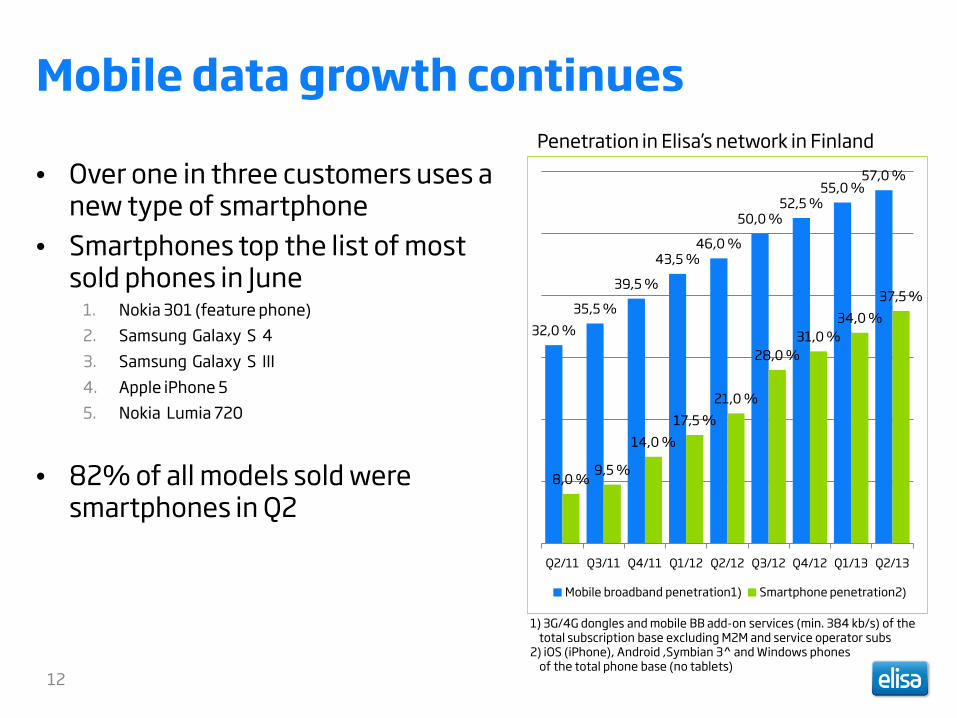
Mobile data growth continues
• Over one in three customers uses a new type of smartphone
• Smartphones top the list of most sold phones in June
1. Nokia 301 (feature phone) 2. Samsung Galaxy S 4 3. Samsung Galaxy S III 4. Apple iPhone 5 5. Nokia Lumia 720
• 82% of all models sold were smartphones in Q2
12
32,0 % 35,5 %
39,5 %
43,5 % 46,0 %
50,0 % 52,5 %
55,0 % 57,0 %
8,0 % 9,5 %
14,0 % 17,5 %
21,0 %
28,0 % 31,0 %
34,0 % 37,5 %
Q2/11 Q3/11 Q4/11 Q1/12 Q2/12 Q3/12 Q4/12 Q1/13 Q2/13
Mobile broadband penetration1) Smartphone penetration2)
Penetration in Elisa’s network in Finland
1) 3G/4G dongles and mobile BB add-on services (min. 384 kb/s) of the total subscription base excluding M2M and service operator subs
2) iOS (iPhone), Android ,Symbian 3^ and Windows phones of the total phone base (no tablets)
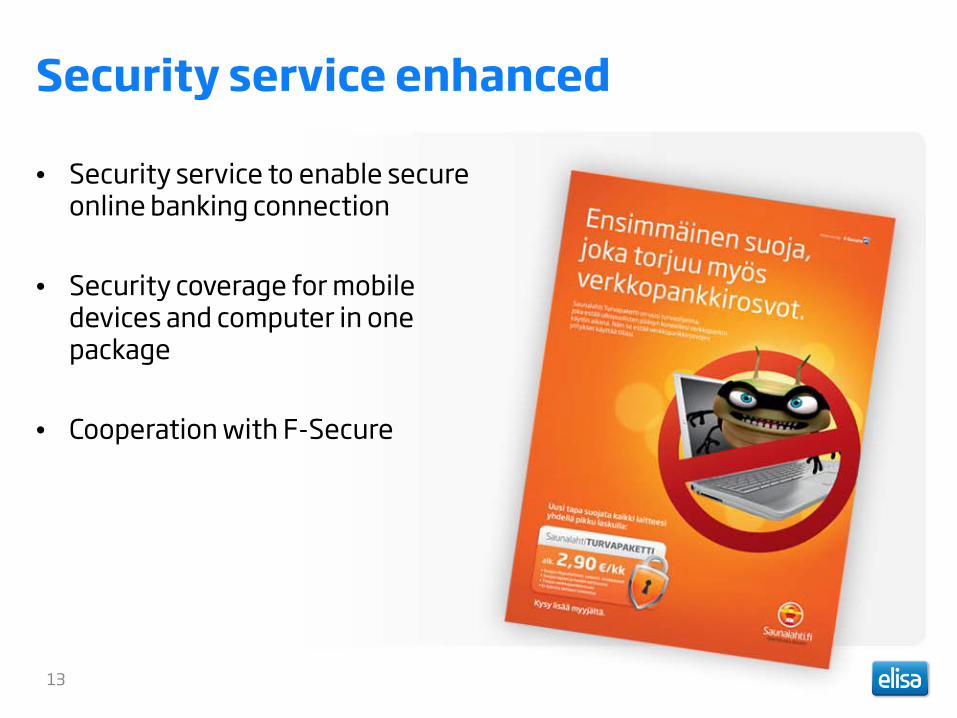
Security service enhanced
• Security service to enable secure online banking connection
• Security coverage for mobile devices and computer in one package
• Cooperation with F-Secure
13

Exclusive rights to sell new smartphone
• Huawei Ascend P6 smartphone presales with exclusive right • Thinnest smartphone at the moment
• Will be launched in six countries in addition to Finland • Long-term cooperation with Huawei guaranteed
exclusive right
14
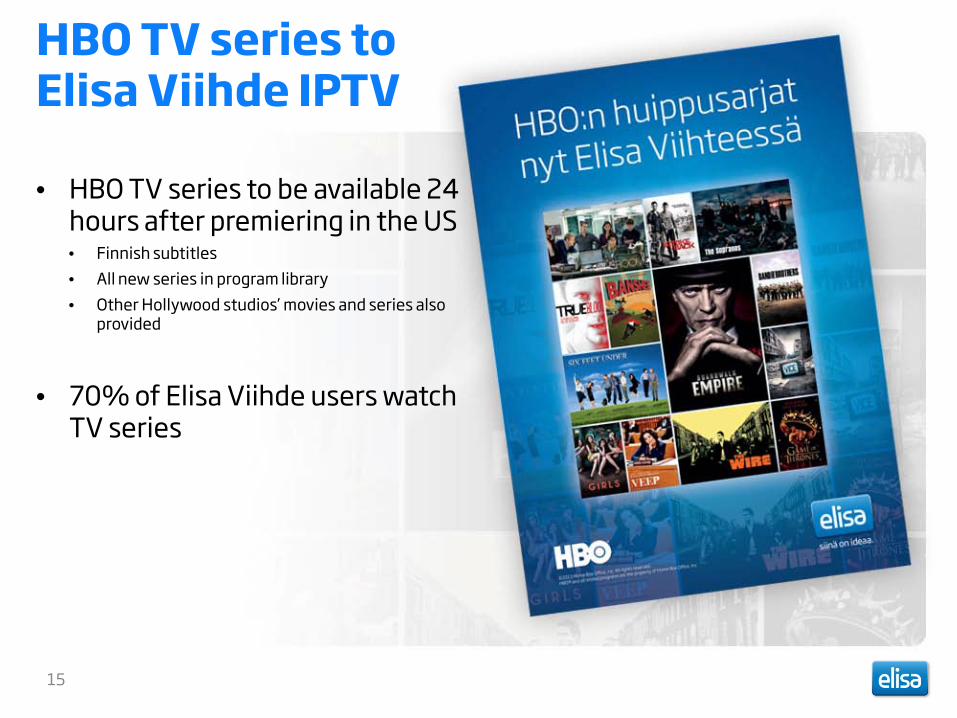
HBO TV series to Elisa Viihde IPTV
• HBO TV series to be available 24 hours after premiering in the US • Finnish subtitles • All new series in program library • Other Hollywood studios’ movies and series also
provided
• 70% of Elisa Viihde users watch
TV series
15
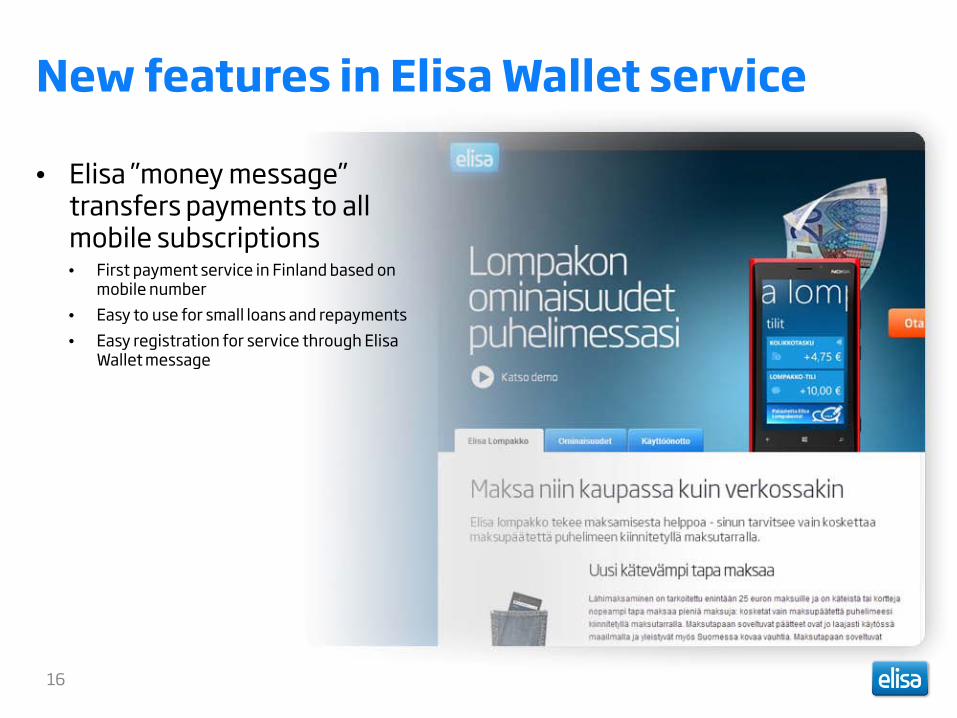
New features in Elisa Wallet service
• Elisa ”money message” transfers payments to all mobile subscriptions • First payment service in Finland based on
mobile number • Easy to use for small loans and repayments • Easy registration for service through Elisa
Wallet message
16
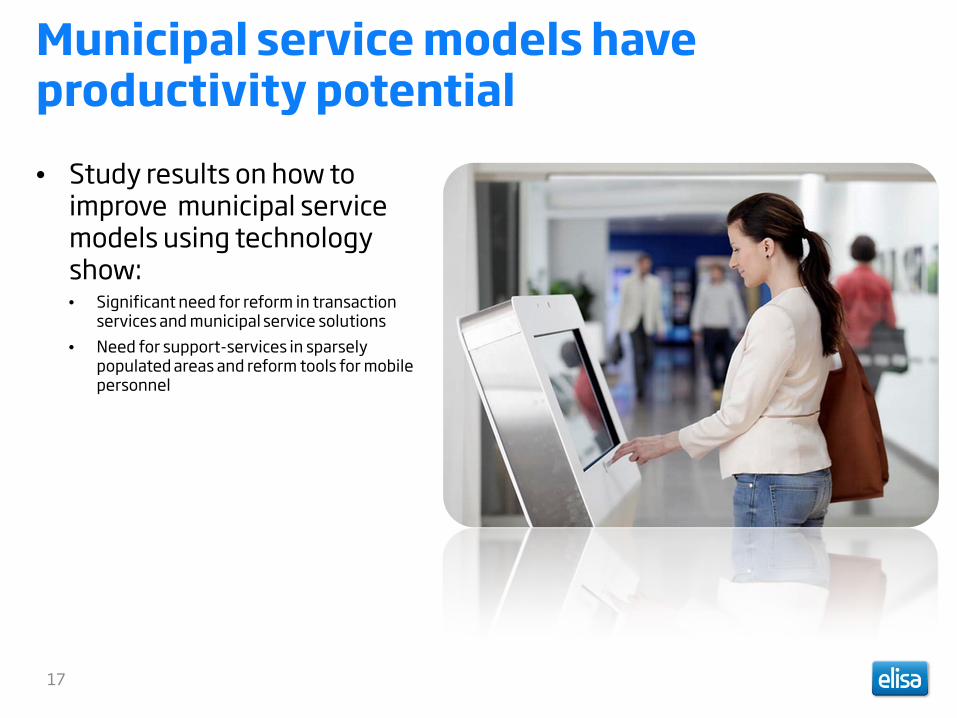
Municipal service models have productivity potential • Study results on how to
improve municipal service models using technology show: • Significant need for reform in transaction
services and municipal service solutions • Need for support-services in sparsely
populated areas and reform tools for mobile personnel
17
Outlook for 2013
• Macroeconomic environment still weak in 2013
• Competition remains challenging
• Revenue at the same level or slightly higher than last year
• EBITDA excluding one-offs at the same level as last year
• CAPEX approximately 13% of revenue • PPO consolidation • Mid term target of maximum 12% still valid
18

Agenda
CEO’s review Veli-Matti Mattila, CEO Financial review Jari Kinnunen, CFO
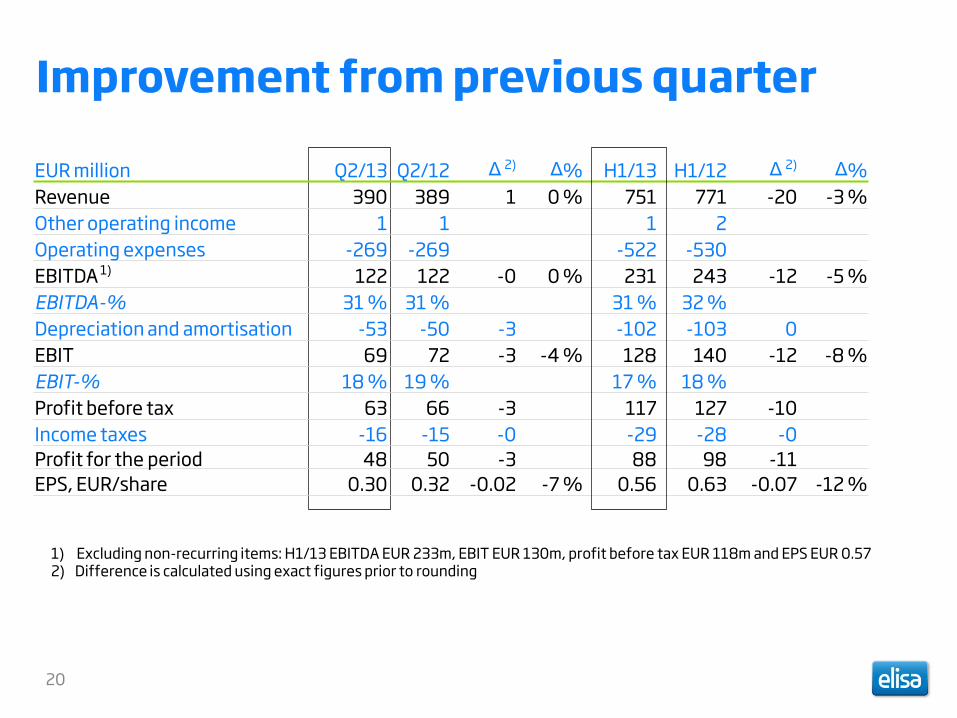
Improvement from previous quarter
1) Excluding non-recurring items: H1/13 EBITDA EUR 233m, EBIT EUR 130m, profit before tax EUR 118m and EPS EUR 0.57 2) Difference is calculated using exact figures prior to rounding
20
EUR million Q2/13 Q2/12 Δ 2) Δ% H1/13 H1/12 Δ 2) Δ% Revenue 390 389 1 0 % 751 771 -20 -3 % Other operating income 1 1 1 2 Operating expenses -269 -269 -522 -530 EBITDA 1) 122 122 -0 0 % 231 243 -12 -5 % EBITDA-% 31 % 31 % 31 % 32 % Depreciation and amortisation -53 -50 -3 -102 -103 0 EBIT 69 72 -3 -4 % 128 140 -12 -8 % EBIT-% 18 % 19 % 17 % 18 % Profit before tax 63 66 -3 117 127 -10 Income taxes -16 -15 -0 -29 -28 -0 Profit for the period 48 50 -3 88 98 -11 EPS, EUR/share 0.30 0.32 -0.02 -7 % 0.56 0.63 -0.07 -12 %
Good progress in efficiency improvements Elisa well on track with accelerated cost efficiency measures in:
• Streamlining product portfolio • Increasing efficiency in customer service • Improving sales efficiency • Simplification of IT • Decreasing costs in general administration
Results in H2/13 and continuing in 2014 • Restructuring charges expected in Q3 and Q4
21
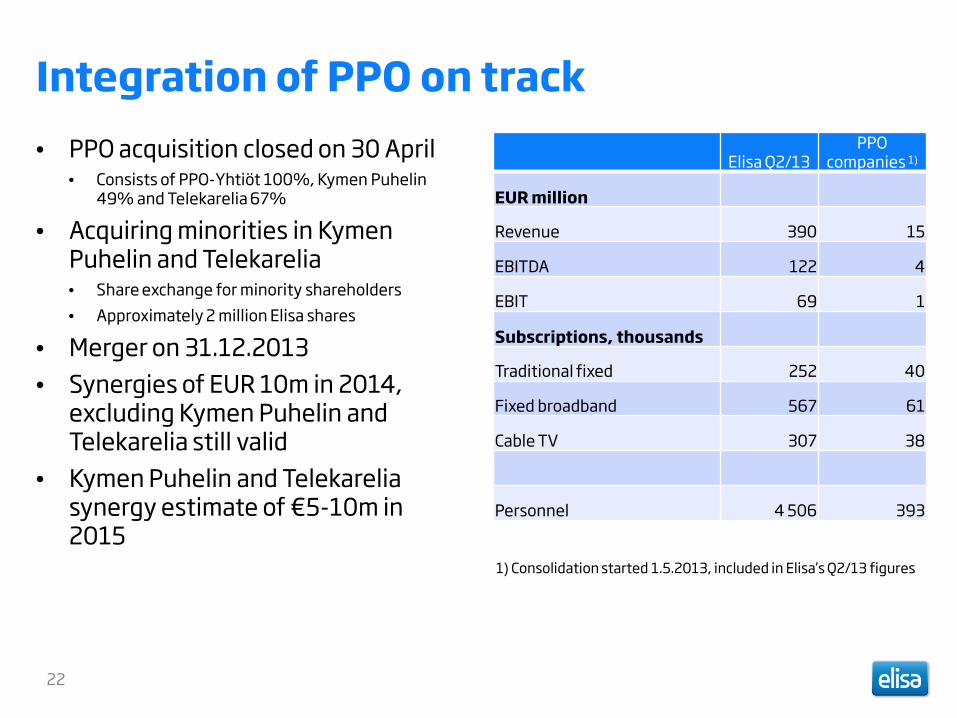
Integration of PPO on track • PPO acquisition closed on 30 April
• Consists of PPO-Yhtiöt 100%, Kymen Puhelin 49% and Telekarelia 67%
• Acquiring minorities in Kymen Puhelin and Telekarelia • Share exchange for minority shareholders • Approximately 2 million Elisa shares
• Merger on 31.12.2013 • Synergies of EUR 10m in 2014,
excluding Kymen Puhelin and Telekarelia still valid
• Kymen Puhelin and Telekarelia synergy estimate of €5-10m in 2015
1) Consolidation started 1.5.2013, included in Elisa’s Q2/13 figures
Elisa Q2/13 PPO
companies 1)
EUR million
Revenue 390 15
EBITDA 122 4
EBIT 69 1
Subscriptions, thousands
Traditional fixed 252 40
Fixed broadband 567 61
Cable TV 307 38
Personnel 4 506 393
22
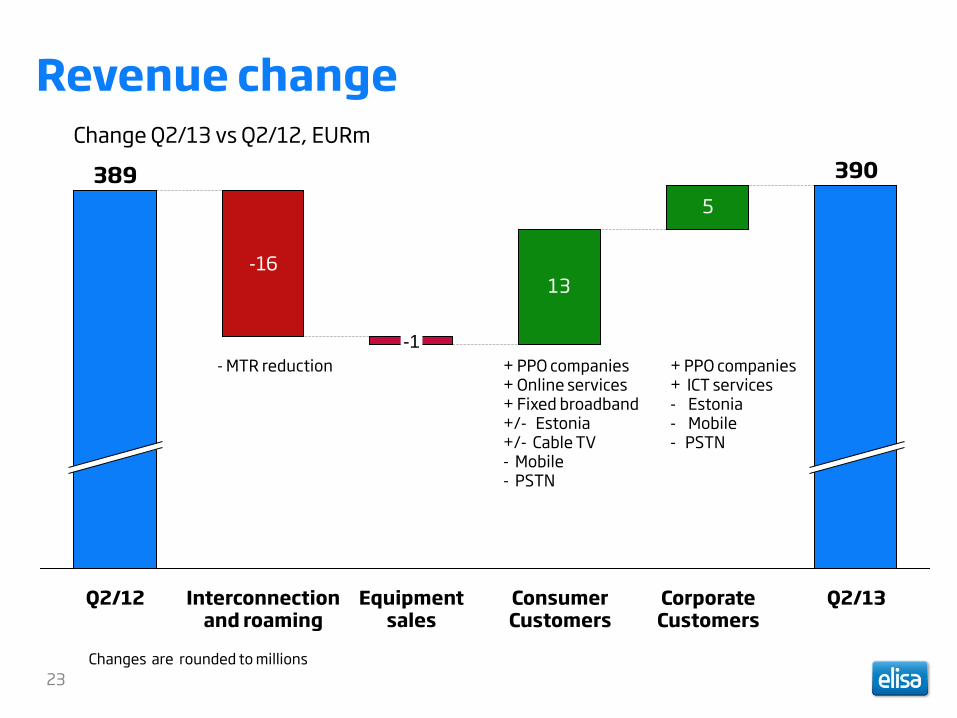
Revenue change
23
Change Q2/13 vs Q2/12, EURm
+ PPO companies + ICT services - Estonia - Mobile - PSTN
+ PPO companies + Online services + Fixed broadband +/- Estonia +/- Cable TV - Mobile - PSTN
- MTR reduction
5
13
Q2/13
390
Corporate Customers
Consumer Customers
Equipment sales
-1
Interconnection and roaming
-16
Q2/12
389
Changes are rounded to millions
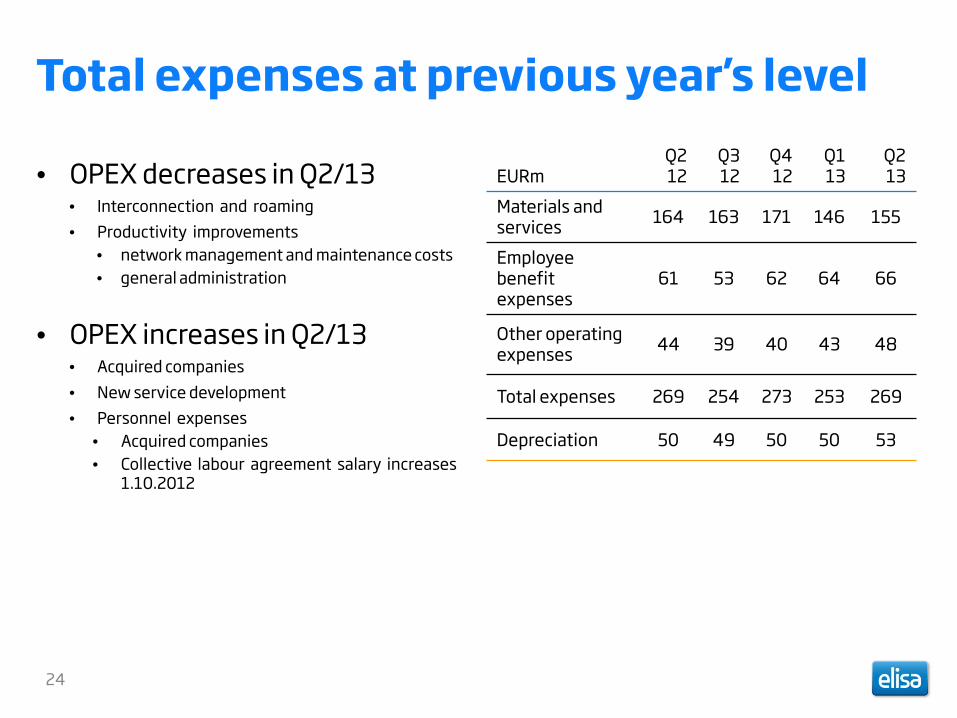
Total expenses at previous year’s level
EURm Q2 12
Q3 12
Q4 12
Q1 13
Q2 13
Materials and services 164 163 171 146 155
Employee benefit expenses
61 53 62 64 66
Other operating expenses 44 39 40 43 48
Total expenses 269 254 273 253 269
Depreciation 50 49 50 50 53
24
• OPEX decreases in Q2/13 • Interconnection and roaming • Productivity improvements
• network management and maintenance costs • general administration
• OPEX increases in Q2/13 • Acquired companies • New service development • Personnel expenses
• Acquired companies • Collective labour agreement salary increases
1.10.2012
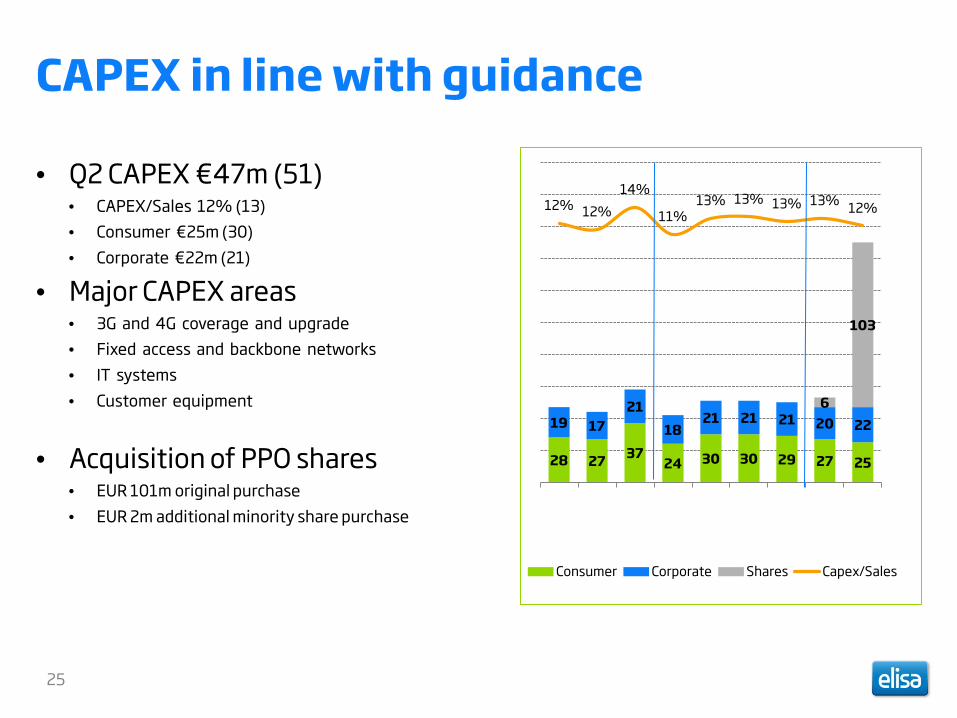
CAPEX in line with guidance
• Q2 CAPEX €47m (51) • CAPEX/Sales 12% (13) • Consumer €25m (30) • Corporate €22m (21)
• Major CAPEX areas • 3G and 4G coverage and upgrade • Fixed access and backbone networks • IT systems • Customer equipment
• Acquisition of PPO shares • EUR 101m original purchase • EUR 2m additional minority share purchase
28 27 37 24 30 30 29 27 25
19 17 21
18 21 21 21 20 22
6
103
12% 12% 14%
11% 13% 13% 13% 13% 12%
-20%
-15%
-10%
-5%
0%
5%
10%
15%
20%
Consumer Corporate Shares Capex/Sales
25
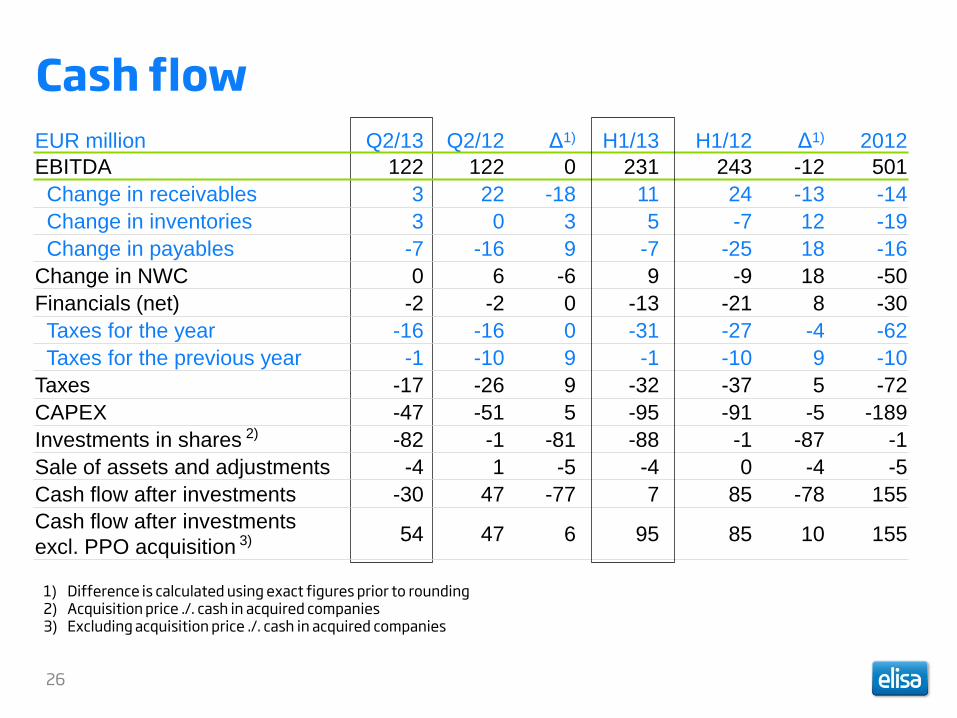
Cash flow
26
EUR million Q2/13 Q2/12 Δ1) H1/13 H1/12 Δ1) 2012 EBITDA 122 122 0 231 243 -12 501 Change in receivables 3 22 -18 11 24 -13 -14 Change in inventories 3 0 3 5 -7 12 -19 Change in payables -7 -16 9 -7 -25 18 -16 Change in NWC 0 6 -6 9 -9 18 -50 Financials (net) -2 -2 0 -13 -21 8 -30 Taxes for the year -16 -16 0 -31 -27 -4 -62 Taxes for the previous year -1 -10 9 -1 -10 9 -10 Taxes -17 -26 9 -32 -37 5 -72 CAPEX -47 -51 5 -95 -91 -5 -189 Investments in shares 2) -82 -1 -81 -88 -1 -87 -1 Sale of assets and adjustments -4 1 -5 -4 0 -4 -5 Cash flow after investments -30 47 -77 7 85 -78 155 Cash flow after investments excl. PPO acquisition 3) 54 47 6 95 85 10 155
1) Difference is calculated using exact figures prior to rounding 2) Acquisition price ./. cash in acquired companies 3) Excluding acquisition price ./. cash in acquired companies
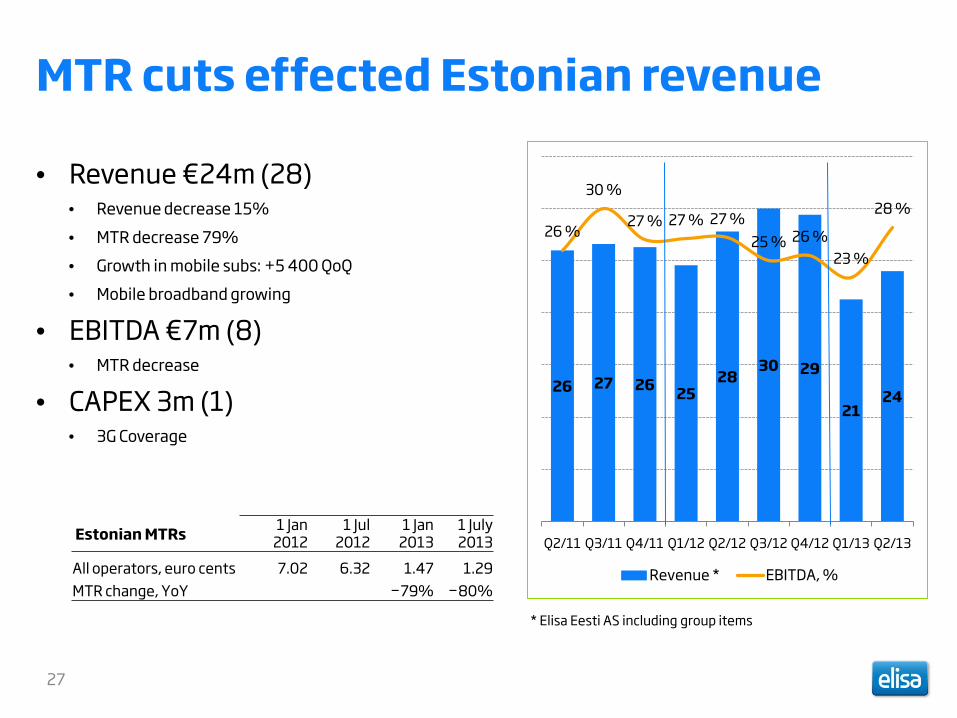
MTR cuts effected Estonian revenue
• Revenue €24m (28) • Revenue decrease 15% • MTR decrease 79% • Growth in mobile subs: +5 400 QoQ • Mobile broadband growing
• EBITDA €7m (8) • MTR decrease
• CAPEX 3m (1) • 3G Coverage
26 27 26 25 28
30 29
21 24
26 %
30 %
27 % 27 % 27 % 25 % 26 %
23 %
28 %
Q2/11 Q3/11 Q4/11 Q1/12 Q2/12 Q3/12 Q4/12 Q1/13 Q2/13
Revenue * EBITDA, %
* Elisa Eesti AS including group items
27
Estonian MTRs 1 Jan 2012
1 Jul 2012
1 Jan 2013
1 July 2013
All operators, euro cents 7.02 6.32 1.47 1.29 MTR change, YoY −79% −80%
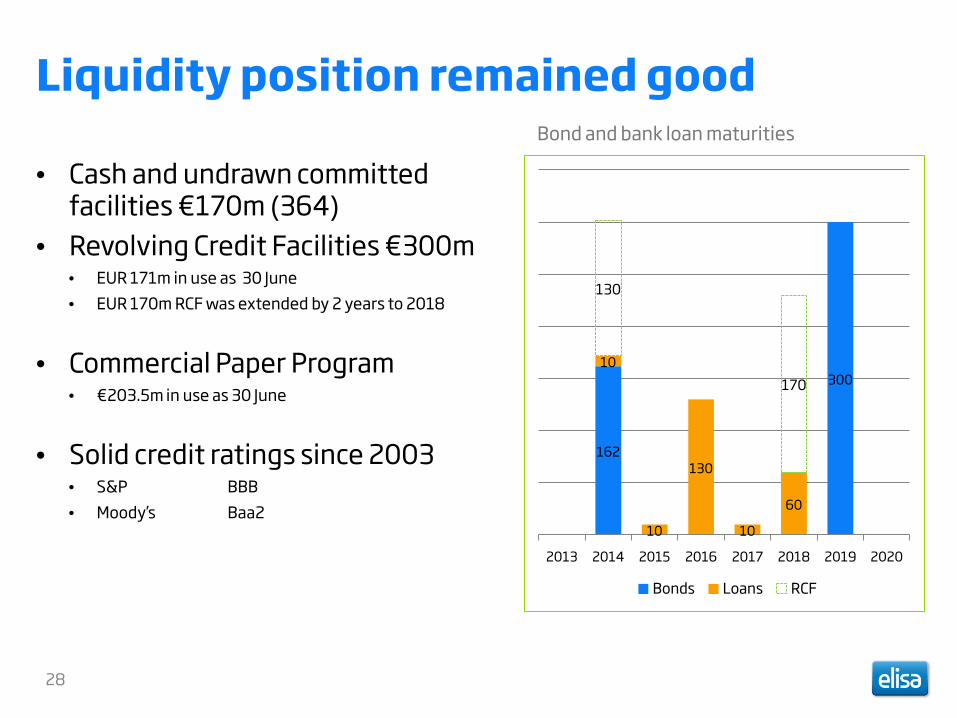
Liquidity position remained good
• Cash and undrawn committed facilities €170m (364)
• Revolving Credit Facilities €300m • EUR 171m in use as 30 June • EUR 170m RCF was extended by 2 years to 2018
• Commercial Paper Program • €203.5m in use as 30 June
• Solid credit ratings since 2003 • S&P BBB • Moody’s Baa2
Bond and bank loan maturities
162
300 10
10
130
10
60
130
170
2013 2014 2015 2016 2017 2018 2019 2020
Bonds Loans RCF
28
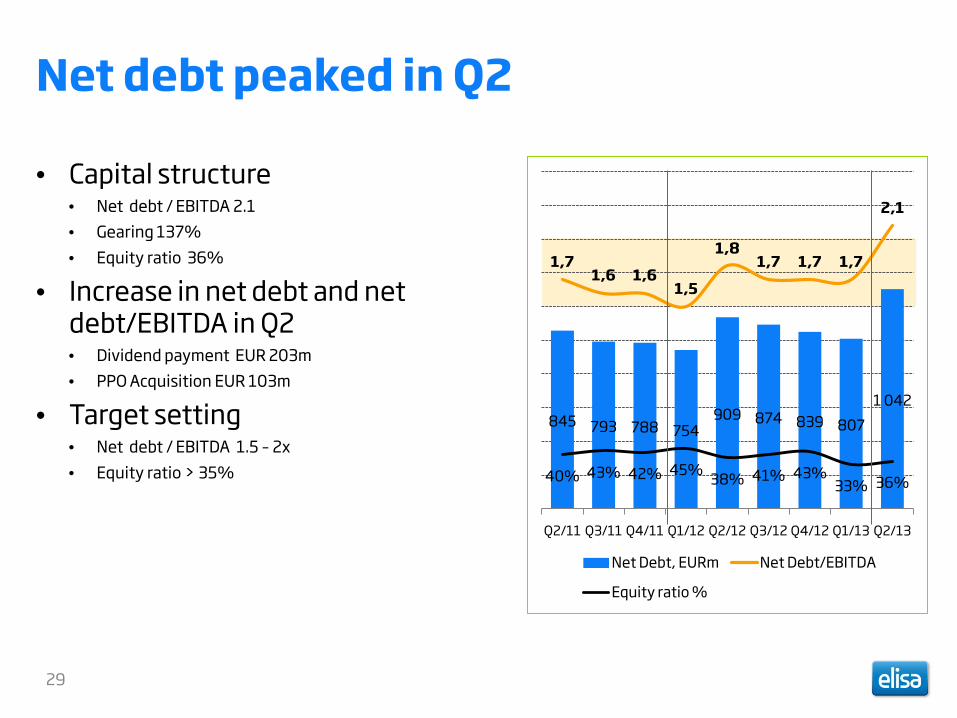
Net debt peaked in Q2
• Capital structure • Net debt / EBITDA 2.1 • Gearing 137% • Equity ratio 36%
• Increase in net debt and net debt/EBITDA in Q2 • Dividend payment EUR 203m • PPO Acquisition EUR 103m
• Target setting • Net debt / EBITDA 1.5 – 2x • Equity ratio > 35%
845 793 788 754 909 874 839 807
1 042
1,7 1,6 1,6
1,5
1,8 1,7 1,7 1,7
2,1
40% 43% 42% 45% 38% 41% 43% 33% 36%
Q2/11 Q3/11 Q4/11 Q1/12 Q2/12 Q3/12 Q4/12 Q1/13 Q2/13
Net Debt, EURm Net Debt/EBITDA
Equity ratio %
29

APPENDIX SLIDE
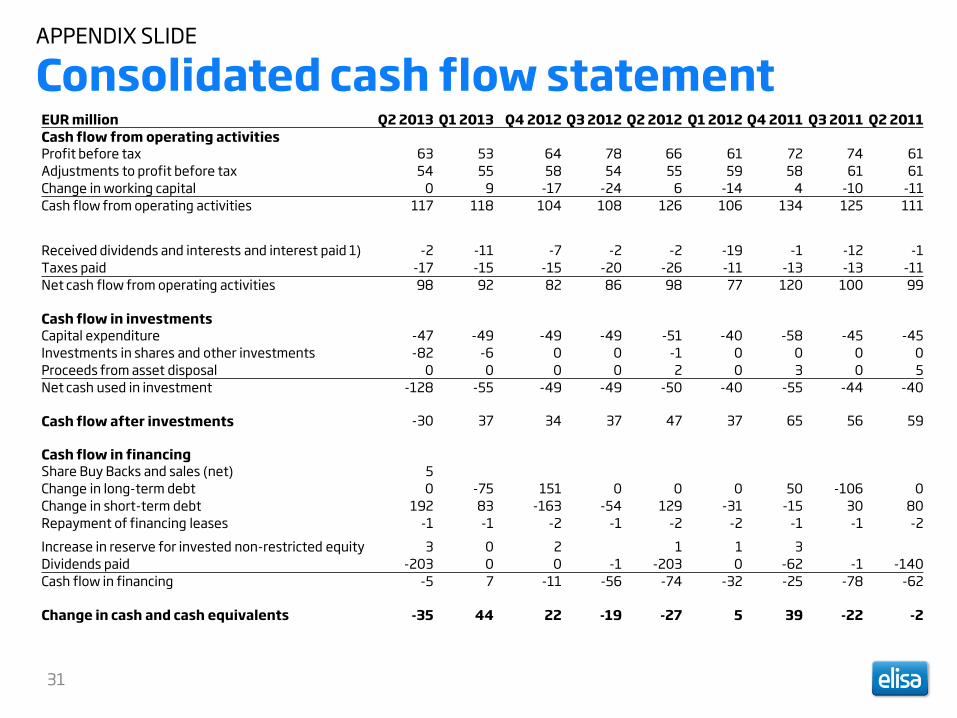
Consolidated cash flow statement
31
EUR million Q2 2013 Q1 2013 Q4 2012 Q3 2012 Q2 2012 Q1 2012 Q4 2011 Q3 2011 Q2 2011 Cash flow from operating activities Profit before tax 63 53 64 78 66 61 72 74 61 Adjustments to profit before tax 54 55 58 54 55 59 58 61 61 Change in working capital 0 9 -17 -24 6 -14 4 -10 -11 Cash flow from operating activities 117 118 104 108 126 106 134 125 111
Received dividends and interests and interest paid 1) -2 -11 -7 -2 -2 -19 -1 -12 -1 Taxes paid -17 -15 -15 -20 -26 -11 -13 -13 -11 Net cash flow from operating activities 98 92 82 86 98 77 120 100 99 Cash flow in investments Capital expenditure -47 -49 -49 -49 -51 -40 -58 -45 -45 Investments in shares and other investments -82 -6 0 0 -1 0 0 0 0 Proceeds from asset disposal 0 0 0 0 2 0 3 0 5 Net cash used in investment -128 -55 -49 -49 -50 -40 -55 -44 -40 Cash flow after investments -30 37 34 37 47 37 65 56 59 Cash flow in financing Share Buy Backs and sales (net) 5 Change in long-term debt 0 -75 151 0 0 0 50 -106 0 Change in short-term debt 192 83 -163 -54 129 -31 -15 30 80 Repayment of financing leases -1 -1 -2 -1 -2 -2 -1 -1 -2 Increase in reserve for invested non-restricted equity 3 0 2 1 1 3 Dividends paid -203 0 0 -1 -203 0 -62 -1 -140 Cash flow in financing -5 7 -11 -56 -74 -32 -25 -78 -62 Change in cash and cash equivalents -35 44 22 -19 -27 5 39 -22 -2
APPENDIX SLIDE
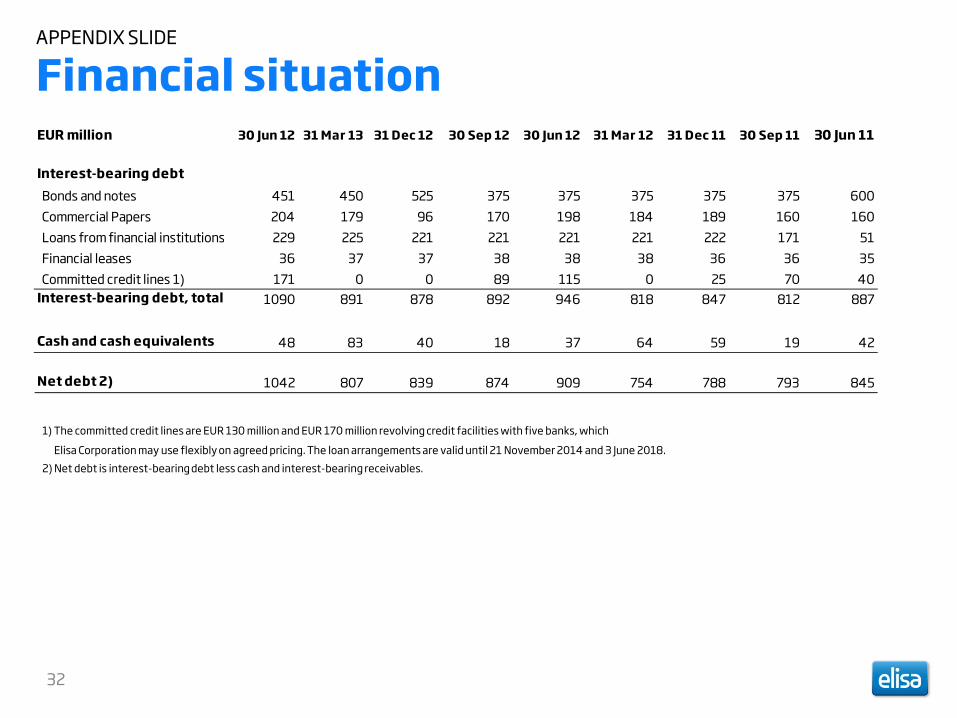
Financial situation
32
EUR million 30 Jun 12 31 Mar 13 31 Dec 12 30 Sep 12 30 Jun 12 31 Mar 12 31 Dec 11 30 Sep 11 30 Jun 11
Interest-bearing debt Bonds and notes 451 450 525 375 375 375 375 375 600 Commercial Papers 204 179 96 170 198 184 189 160 160 Loans from financial institutions 229 225 221 221 221 221 222 171 51 Financial leases 36 37 37 38 38 38 36 36 35 Committed credit lines 1) 171 0 0 89 115 0 25 70 40Interest-bearing debt, total 1090 891 878 892 946 818 847 812 887
Cash and cash equivalents 48 83 40 18 37 64 59 19 42
Net debt 2) 1042 807 839 874 909 754 788 793 845
1) The committed credit lines are EUR 130 million and EUR 170 million revolving credit facilities with five banks, which
Elisa Corporation may use flexibly on agreed pricing. The loan arrangements are valid until 21 November 2014 and 3 June 2018. 2) Net debt is interest-bearing debt less cash and interest-bearing receivables.