agenda - nnuh.nhs.uk
TRANSCRIPT

Distribution: Council of Governors, Board of Directors and Trust website Contact details: Janice Bradfield, Membership Manager, Norfolk and Norwich University Hospitals NHS Foundation Trust, tel 01603 287 634, e-mail [email protected]
Our Values: People-focused Respect Integrity Dedication Excellence
MEETING OF THE COUNCIL OF GOVERNORS IN PUBLIC
THURSDAY 20 APRIL 2017
A meeting of the Council of Governors in public will take place at 10am on 20 April 2017 in the Boardroom at the Norfolk and Norwich University Hospital
AGENDA
Item Lead
Director Purpose Page No
1 Apologies and Declarations of Interest
2
Strategy for becoming a Recognised Centre of Excellence for Stroke (Dr Kneale Metcalf (Consultant
Physician) and Dr Frankie Swords (Chief of Division – Medicine) to attend)
Discussion 2
3 Minutes of the meeting held in public on 31.01.17 Approval 26
4 Matters arising Discussion
5 Chief Executive’s Report CEO Information 36
6 The role of volunteers at NNUH (Sally Dyson (Voluntary Services Manager) to attend)
Information Presentation
7 Focus on staff experience JO Discussion Verbal
8 Integrated Performance Report – March 2017 Execs Information 55
9 Membership Report JB Discussion 120
10 Advance Notice Questions
11 Agenda for next meeting JPG Information 125
12 Any other business
Date and Time of next meeting: The next Council of Governors meeting in public will be at 10am on 26 July 2017 in the Boardroom of the Norfolk and Norwich University Hospital
Our Values: People-focused Respect Integrity Dedication Excellence
REPORT TO THE COUNCIL OF GOVERNORS
Date Thursday 20th April 2017
Title
Becoming a recognised Centre of Excellence for Stroke
Author(s) & Exec Lead Frankie Swords, Chief of Division, Medical Division Simon Hackwell, Director of Strategy
Purpose For Information
1. Background/Context
In our five year strategy the trust outlined its ambition to become a recognised centre of excellence for stroke services. The enclosed strategy describes how the trust will realise this objective by:
redesigning and taking ownership of stroke pathway reconfiguring services to become a neurosciences centre achieving SSNAP aggregate A rating establishing a thrombectomy service redesigning and taking ownership of pan Norfolk pathway.
2. Key issues, risks and actions
Our strategic direction responds to key opportunities and challenges. In particular:
Our stroke service has grown rapidly since established in 2009. From a position of no specialist consultants or beds, we now have 6 stroke consultants as well as 49 specialist beds onsite in the Hyper Acute Stroke Unit and Acute Stroke Unit.
To achieve an aggregate A rating in SSNAP we acknowledge the need to redesign the pathway with NCHC for ESD and rehabilitation on Beech Ward. This should reduce time lost waiting for rehabilitation and in handovers, reduce overall length of stay and improve patient and family experience.
Our current configuration of stroke and neurology services is completely separate. These teams are already working more closely with significant further gains possible.
Further work required on multidisciplinary workforce model.
We have an ambition to establish a thrombectomy service and are actively pursuing options.
The Acute Speciality Sustainability Review identified limited appetite from neighbouring trusts to collaborate further on stroke services.
3. Conclusions/Outcome/Next steps
The strategy includes an implementation plan, which details key activities.
Recommendations: The Council is recommended to note the strategy for becoming a recognised centre of excellence for stroke.

P.R.I.D.E. in Our Values – People-focused. Respect. Integrity. Dedication. Excellence
Recognised Centre of Excellence for Stroke 07 April 2017
Version: Draft 1.11

• In 2014 the estimated incidence of stroke in Norfolk and Waveney was between 1,345 and 1,603 patients per annum.
• Norfolk benchmarks as similar with region and better against England for mortality from stroke in Public Health Outcomes Framework.
• Central Norfolk CCG’s benchmark as similar to peers in NHS Right Care for 90% of inpatient stay spent of stroke unit, Transient
Ischaemic Attack (TIA) cases treated in 24 hours, emergency readmission within 30 days, and returning to place of residence.
• Local strategy has fully implemented the National Stroke Strategy published in 2007. NNUH delivers acute care and contracts with
NCHC for Early Supported Discharge and specialist rehabilitation on the Beech Ward, Community Hospital.
• Functioning Norfolk and Waveney Stroke Network in place following review of stroke services by Norfolk’s Health Overview and
Scrutiny Committee (HOSC).
• In 2012 an External Expert Advisory Group for NHS Midlands and East published a specification for stroke services. It outlines the
criteria that a stroke pathway needs to meet to deliver high quality care.
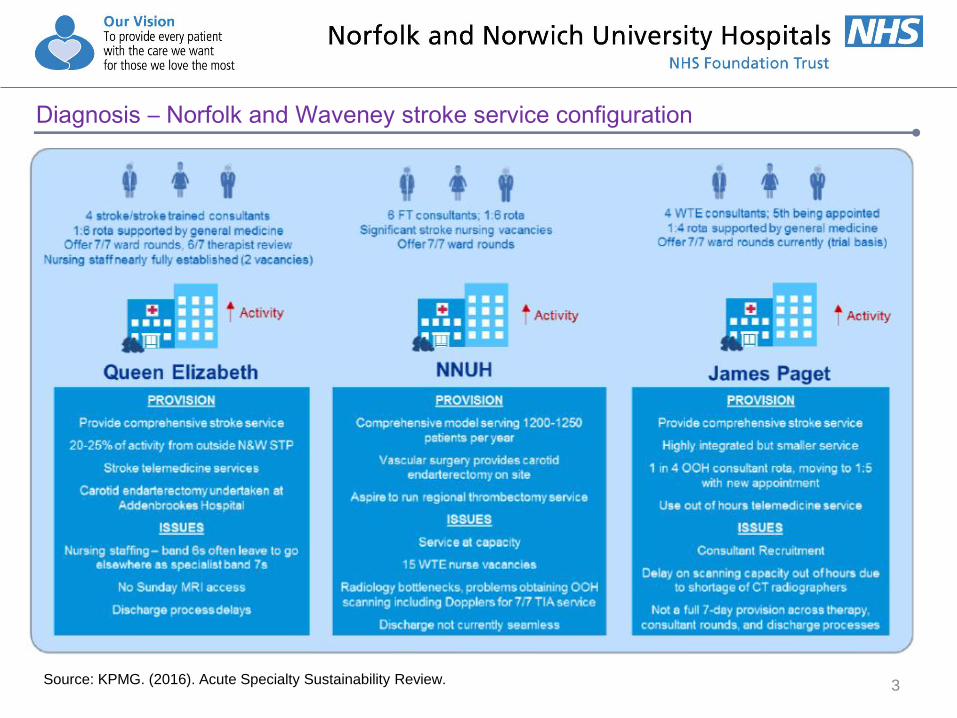
• Inpatient stroke services are provided by JPUH, NNUH and QEH – as illustrated by following slide.
• Inpatient activity has been increasing year on year (1012 in 2013/14, 1040 in 2014/15, 1154 in 2015/16, and 1062 in 2016/17 PYE to
M11) – as illustrated by Chart on following slide.
• Income has increased year on year (£4.7m in 2013/14, £5m in 2014/15, £5.3m in 2015/16, and £4.9m in 2016/17 PYE to M11) – as
illustrated by Chart on following slide.
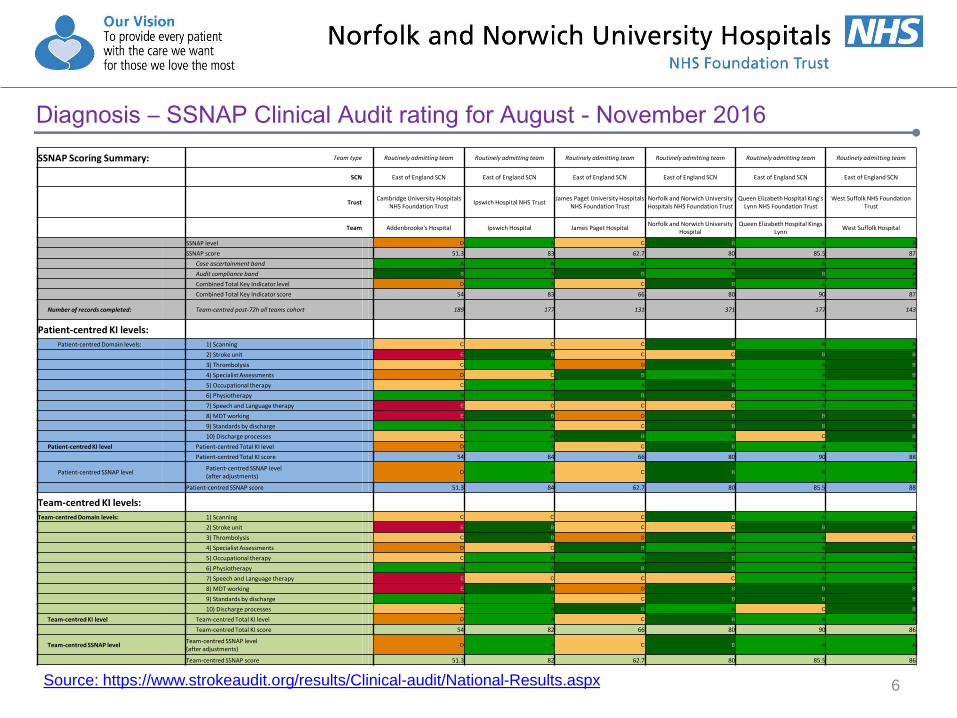
• Sentinel Stroke National Audit Programme (SSNAP) clinical audit rating is B (as at November 2016) and achieving 6 of 10 indicators
for the organisational audit – as illustrated by table on following slide.
• Stroke is an active research department. Dr Kneale Metcalf (Service Director) has a session dedicated to research (via CLRN). It is an
academic department with Professor John Potter as senior lead. We are currently running six studies. Between April to December
2017 we recruited 116 patients into portfolio clinical trials, which is second highest in the region.
• Dr Kneale Metcalf, Consultant Stroke Physician, was awarded the Professional Excellence Award at the East of England Stroke
Association ‘Life After Stroke Awards’.
• We have an innovative new electronic monitoring service to support clinicians to identify patients at risk of second stroke.
• Awarded £55,496 from the Health Foundation for FeSTivAPPS, which is an app that delivers functional strength training to people
after stroke. Collaborative work with UEA and NCHC. 2
Summary of Diagnosis
3
Diagnosis – Norfolk and Waveney stroke service configuration
Source: KPMG. (2016). Acute Specialty Sustainability Review.

4
Diagnosis – Activity
The number of patients admitted for stroke has been increasing year on year: 1012 in 2013/14, 1040 in 2014/15, 1154 in 2015/16,
and 1062 in 2016/17 (PYE to Month 11 – February), as illustrated by the below Chart.
0
20
40
60
80
100
120
April May June July August September October November December January February March
2013/14 2014/15 2015/16 2016/17
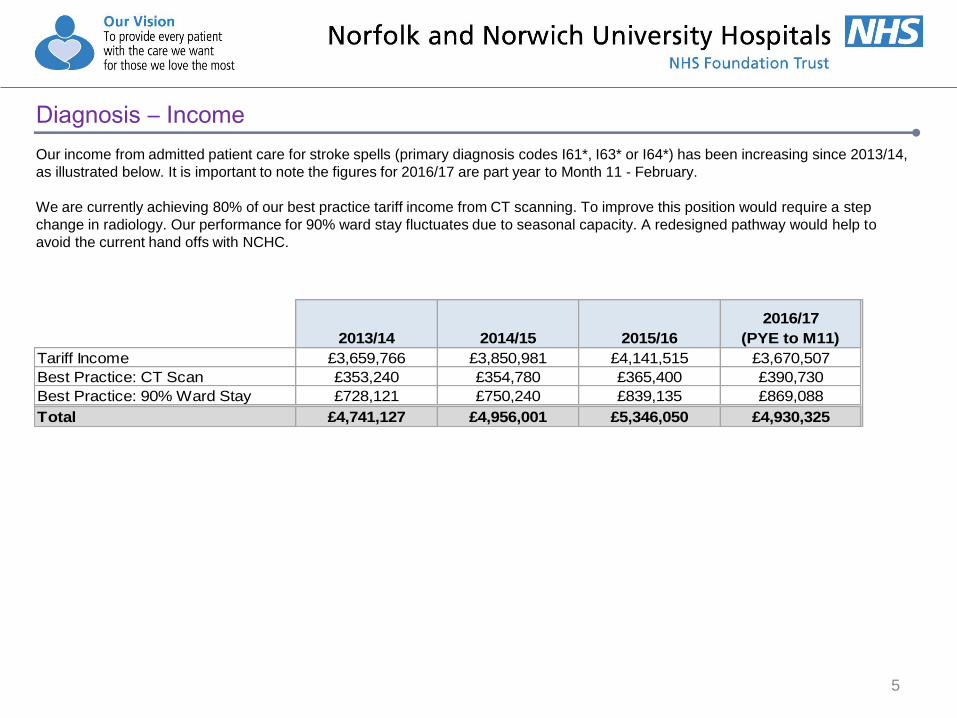
Our income from admitted patient care for stroke spells (primary diagnosis codes I61*, I63* or I64*) has been increasing since 2013/14,
as illustrated below. It is important to note the figures for 2016/17 are part year to Month 11 - February.
We are currently achieving 80% of our best practice tariff income from CT scanning. To improve this position would require a step
change in radiology. Our performance for 90% ward stay fluctuates due to seasonal capacity. A redesigned pathway would help to
avoid the current hand offs with NCHC.
5
Diagnosis – Income
2013/14 2014/15 2015/16
2016/17
(PYE to M11)
Tariff Income £3,659,766 £3,850,981 £4,141,515 £3,670,507
Best Practice: CT Scan £353,240 £354,780 £365,400 £390,730
Best Practice: 90% Ward Stay £728,121 £750,240 £839,135 £869,088
Total £4,741,127 £4,956,001 £5,346,050 £4,930,325
6
Diagnosis – SSNAP Clinical Audit rating for August - November 2016
Source: https://www.strokeaudit.org/results/Clinical-audit/National-Results.aspx
SSNAP Scoring Summary: Team type Routinely admitting team Routinely admitting team Routinely admitting team Routinely admitting team Routinely admitting team Routinely admitting team
SCN East of England SCN East of England SCN East of England SCN East of England SCN East of England SCN East of England SCN
Trust Cambridge University Hospitals
NHS Foundation Trust Ipswich Hospital NHS Trust
James Paget University Hospitals NHS Foundation Trust
Norfolk and Norwich University Hospitals NHS Foundation Trust
Queen Elizabeth Hospital King's Lynn NHS Foundation Trust
West Suffolk NHS Foundation Trust
Team Addenbrooke's Hospital Ipswich Hospital James Paget Hospital Norfolk and Norwich University
Hospital Queen Elizabeth Hospital Kings
Lynn West Suffolk Hospital
SSNAP level D A C B A A
SSNAP score 51.3 83 62.7 80 85.5 87
Case ascertainment band A A A A A A
Audit compliance band B A B A B A
Combined Total Key Indicator level D A C B A A
Combined Total Key Indicator score 54 83 66 80 90 87
Number of records completed: Team-centred post-72h all teams cohort 189 177 131 371 177 143
Patient-centred KI levels:
Patient-centred Domain levels: 1) Scanning C C C B A A
2) Stroke unit E B C C B B
3) Thrombolysis C A D B A B
4) Specialist Assessments D C B A A B
5) Occupational therapy C A A B A A
6) Physiotherapy A A B B A A
7) Speech and Language therapy E C C C A A
8) MDT working E B D B B B
9) Standards by discharge A A C B B B
10) Discharge processes C A B A C B
Patient-centred KI level Patient-centred Total KI level D A C B A A
Patient-centred Total KI score 54 84 66 80 90 88
Patient-centred SSNAP level Patient-centred SSNAP level (after adjustments)
D A C B A A
Patient-centred SSNAP score 51.3 84 62.7 80 85.5 88
Team-centred KI levels:
Team-centred Domain levels: 1) Scanning C C C B A A
2) Stroke unit E B C C B B
3) Thrombolysis C B D B A C
4) Specialist Assessments D C B A A B
5) Occupational therapy C A A B A A
6) Physiotherapy A A B B A A
7) Speech and Language therapy E C C C A A
8) MDT working E B D B B B
9) Standards by discharge A A C B B B
10) Discharge processes C A B A C B
Team-centred KI level Team-centred Total KI level D A C B A A
Team-centred Total KI score 54 82 66 80 90 86
Team-centred SSNAP level Team-centred SSNAP level (after adjustments)
D A C B A A
Team-centred SSNAP score 51.3 82 62.7 80 85.5 86

A) Primary Prevention B) Pre-hospital
C) Acute Phase
D) Community Rehabilitation
E) Long Term Care
F) Secondary Prevention
G) End of Life
• Public Health Norfolk has modelled that by 2025 the prevalence of stroke is expected to rise by 17.5% from 26,753 to 31,374 across
the Norfolk and Waveney STP.
• STP Plan ‘In Good Health’ highlights the risk stroke poses to our population's health. Based on current trends, we estimate that by
2020 obesity will contribute to 2,000 more people suffering from stroke.
• We will continue to do joint research with local and national partners. Grant application with scientists and Allied Health Professionals
from UEA will be a priority.
• Key changes in the National Clinical Guideline for Stroke (published in October 2016) are: (a) mechanical thrombectomy for acute
ischaemic stroke; (b) urgent brain imaging within 1 hour of hospital arrival for suspected acute stroke; (c) acute blood pressure
management in intracerebral haemorrhage; and (d) changes in the practice of early mobilisation after acute stroke.
• SSNAP clinical audit rating is B (as at November 2016) and not achieving 4 of 10 indicators for the organisational audit. We expect
this position to deteriorate to a D rating for the four month period to March 2017 as a result of winter pressures.
• DH and NHS England yet to respond to national bodies' request for renewed national focus, in particular: prevention, new treatments
(e.g. thrombectomy), and post-acute care and rehabilitation. National Stroke Strategy’s ten year period concludes in 2017.
• NHS England developing specification for commissioning of thrombectomy in response to NICE’s guidance.
• Working with existing provider [NCHC] and commissioners to redesign central Norfolk services to meet the gold standards described
in NHS Midlands and East’s pathway, as illustrated below.
7
Summary of Forecast
8
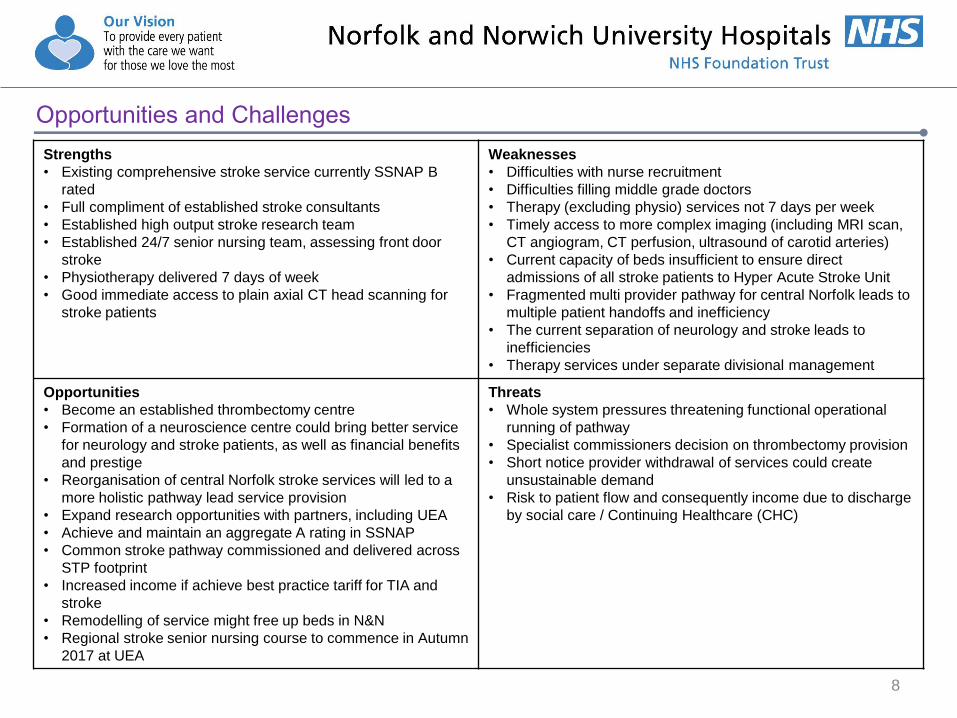
Opportunities and Challenges
Strengths
• Existing comprehensive stroke service currently SSNAP B
rated
• Full compliment of established stroke consultants
• Established high output stroke research team
• Established 24/7 senior nursing team, assessing front door
stroke
• Physiotherapy delivered 7 days of week
• Good immediate access to plain axial CT head scanning for
stroke patients
Weaknesses
• Difficulties with nurse recruitment
• Difficulties filling middle grade doctors
• Therapy (excluding physio) services not 7 days per week
• Timely access to more complex imaging (including MRI scan,
CT angiogram, CT perfusion, ultrasound of carotid arteries)
• Current capacity of beds insufficient to ensure direct
admissions of all stroke patients to Hyper Acute Stroke Unit
• Fragmented multi provider pathway for central Norfolk leads to
multiple patient handoffs and inefficiency
• The current separation of neurology and stroke leads to
inefficiencies
• Therapy services under separate divisional management
Opportunities
• Become an established thrombectomy centre
• Formation of a neuroscience centre could bring better service
for neurology and stroke patients, as well as financial benefits
and prestige
• Reorganisation of central Norfolk stroke services will led to a
more holistic pathway lead service provision
• Expand research opportunities with partners, including UEA
• Achieve and maintain an aggregate A rating in SSNAP
• Common stroke pathway commissioned and delivered across
STP footprint
• Increased income if achieve best practice tariff for TIA and
stroke
• Remodelling of service might free up beds in N&N
• Regional stroke senior nursing course to commence in Autumn
2017 at UEA
Threats
• Whole system pressures threatening functional operational
running of pathway
• Specialist commissioners decision on thrombectomy provision
• Short notice provider withdrawal of services could create
unsustainable demand
• Risk to patient flow and consequently income due to discharge
by social care / Continuing Healthcare (CHC)
9
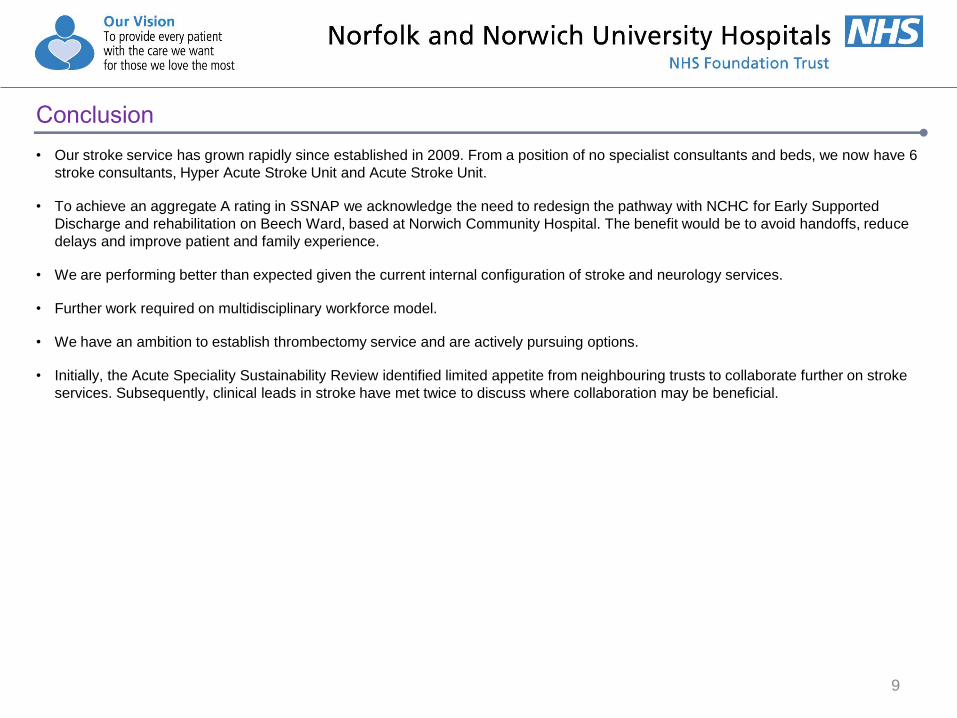
Conclusion
• Our stroke service has grown rapidly since established in 2009. From a position of no specialist consultants and beds, we now have 6
stroke consultants, Hyper Acute Stroke Unit and Acute Stroke Unit.
• To achieve an aggregate A rating in SSNAP we acknowledge the need to redesign the pathway with NCHC for Early Supported
Discharge and rehabilitation on Beech Ward, based at Norwich Community Hospital. The benefit would be to avoid handoffs, reduce
delays and improve patient and family experience.
• We are performing better than expected given the current internal configuration of stroke and neurology services.
• Further work required on multidisciplinary workforce model.
• We have an ambition to establish thrombectomy service and are actively pursuing options.
• Initially, the Acute Speciality Sustainability Review identified limited appetite from neighbouring trusts to collaborate further on stroke
services. Subsequently, clinical leads in stroke have met twice to discuss where collaboration may be beneficial.

10
Options
Objective One To redesign and take ownership of stroke pathway
Rationale (why is this important) The current pathway is fragmented and consequently creates handoffs, increased length of
stay, poor patient experience and inflated costs.
The contract with NCHC has expired.
Strategy (what will we do) In collaboration with NCHC, other providers and commissioners we will:
• Evaluate current stroke pathway
• Redesign stroke pathway
• Implement redesigned stroke pathway
Tactics (how and when) • Complete an options appraisal for pathway by July 2017
• Produce a business case for redesigned pathway by November 2017
• Commence implementation of the redesigned pathway in December 2017
• Redesigned pathway Go-Live in April 2018
• Evaluate the revised pathway in October 2018

11
Options
Objective Two To reconfigure services as neurosciences
Rationale (why is this important) • 10% tariff uplift for some elements of neurosciences
• Will support recruitment of consultant neurologists – national shortage
• Supports thrombectomy service
Strategy (what will we do) • Internal designation of neurosciences
• Neurosciences accreditation
• Explore options for neurosurgery centre
Tactics (how and when) • Reconfigure internally to create functioning neuroscience directorate by March 2018
• Explore with specialised commissioners opportunity of actual / shadow neuroscience by
March 2018
• Assess / develop case for neurosurgery centre by March 2021

12
Options
Objective Three To achieve SSNAP aggregate A rating
Rationale (why is this important) SSNAP is the recognised national benchmark of stroke services
Strategy (what will we do) • Redesign of pathway to avoid hand offs
• Embedding the staff into integrated team
• Maintain A rating
Tactics (how and when) • Continued work to reduce length of stay
• Review staffing, beds and imaging
• Implement TIA seven day service
13
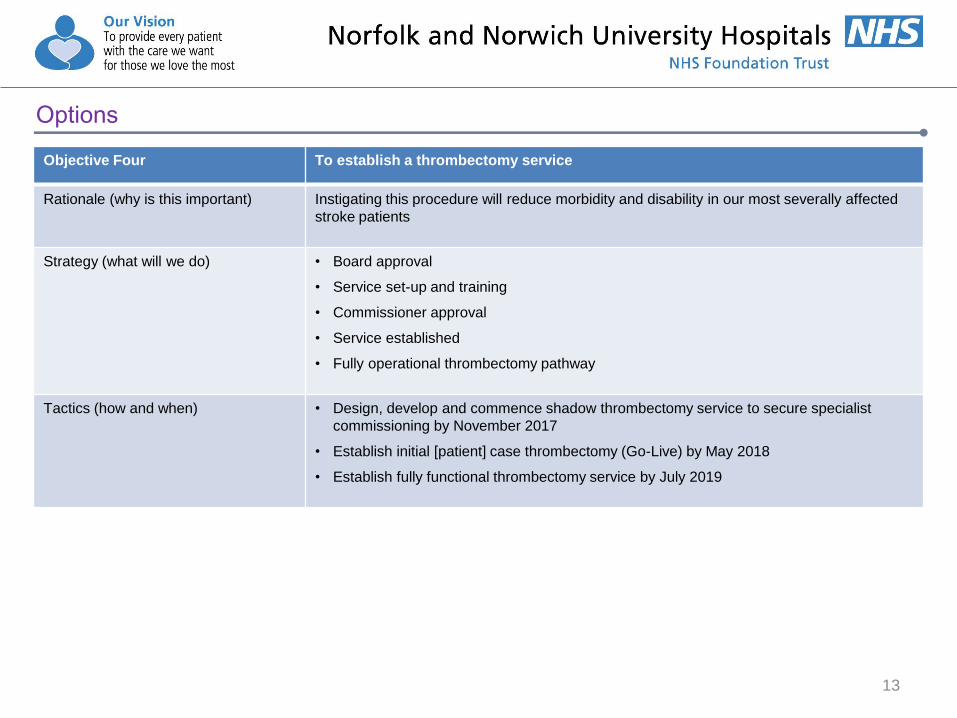
Options
Objective Four To establish a thrombectomy service
Rationale (why is this important) Instigating this procedure will reduce morbidity and disability in our most severally affected
stroke patients
Strategy (what will we do) • Board approval
• Service set-up and training
• Commissioner approval
• Service established
• Fully operational thrombectomy pathway
Tactics (how and when) • Design, develop and commence shadow thrombectomy service to secure specialist
commissioning by November 2017
• Establish initial [patient] case thrombectomy (Go-Live) by May 2018
• Establish fully functional thrombectomy service by July 2019

14
Options
Objective Five To redesign and take ownership of pan Norfolk pathway
Rationale (why is this important) Improved load sharing, efficiency and economies of scale through integrated clinical
pathways between providers (e.g. development of hub and spoke model)
Strategy (what will we do) • Take ownership and redesign NNUH pathway
• Seek accreditation as neurosciences centre
• Create opportunities through STP acute workstream
Tactics (how and when) • Strengthen NNUH position, including recruitment of neurologists and other specialist staff
• Be open to joint working opportunities with JPUH and QEH
• Seek to influence STP
• Consider a model and options for centralised HASU for Norfolk

2017/18 2018/19 2019/20 2020/21 to
2021/22
Objective 1:
To redesign and
take ownership of
stroke pathway
Objective 2:
To reconfigure
services as
neurosciences
Objective 3:
To achieve SSNAP
aggregate A rating
Objective 4:
To establish a
thrombectomy
service
Objective 5:
To redesign and
take ownership of
pan Norfolk pathway
15
Internal designation of neurosciences
Neurosciences accreditation
Assess / develop case
for Neurosurgery centre
Evaluate
Redesign
Implement
Board Approval Service established Fully operational thrombectomy pathway
Rating achieved
Strategic Direction
Service set-up and training
Commissioner approval
Redesign of pathway to avoid hand offs
Embedding the staff into integrated team

16
Resources
Project Management
• Project Manager – AfC Band 8b – 1 FTE.
• Administration support – AfC band 4 (0.5FTE).
• Estimated length of project is two years.
• Costs. £81k per annum. Midpoint of grade and inclusive of 26% on-costs.
Service developments
Hospital Management Board, and where appropriate Trust Board, will receive resource requests for the following service developments:
• Interim options for thrombectomy service
• Redesigned stroke pathway
• Fully functional thrombectomy service.

Hospital Management Board
Divisional Board(s)
Stroke Steering Group
Project Team
Objective 1
To redesign and take ownership of stroke
pathway
Objective 2
To reconfigure services as
neurosciences
Objective 3
To achieve SSNAP aggregate A rating
Objective 4
To establish a thrombectomy
service
Objective 5
To redesign and take ownership of pan Norfolk pathway
Senior Responsible Owner (SRO)
Chris Cobb
17
Governance
Project Manager – vacancy
Admin Officer – vacancy

18
Activities Responsibility Start Date Completed By
• Design, develop and commence shadow thrombectomy
service to secure specialist commissioning
CP 01/03/2017 01/11/2017
• Business case for interim options for thrombectomy CP 01/03/2017 31/04/2017
• Explore with specialised commissioners opportunity of
actual / shadow neuroscience
CC/MM 27/03/2017 31/03/2018
• Internal governance approved to reconfigure as
neurosciences centre
CC 01/04/2017 31/04/2017
• Options appraisal for stroke pathway KM/MM 01/04/2017 31/07/2017
• Reconfigure internally to create functioning neuroscience
directorate
GM/KM 01/04/2017 31/03/2018
• Business case for redesigned stroke pathway KM/MM 01/08/2017 30/11/2017
• Implementation of the redesigned stroke pathway KM/MM 01/12/2017 31/03/2018
Implementation Year 1 (2017/18)
19
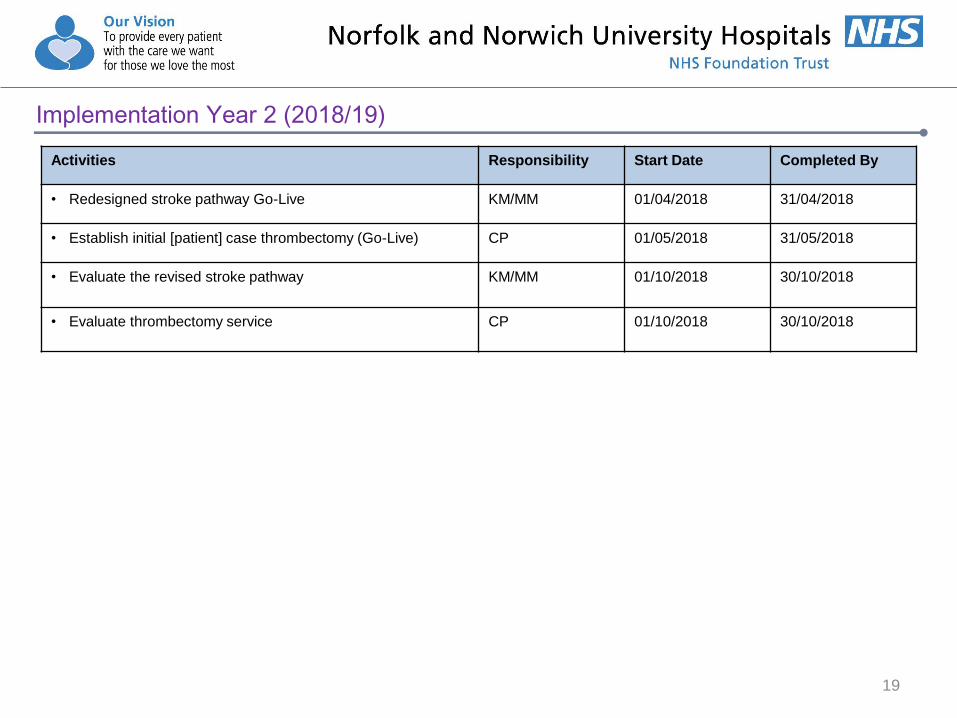
Activities Responsibility Start Date Completed By
• Redesigned stroke pathway Go-Live KM/MM 01/04/2018 31/04/2018
• Establish initial [patient] case thrombectomy (Go-Live) CP 01/05/2018 31/05/2018
• Evaluate the revised stroke pathway KM/MM
01/10/2018 30/10/2018
• Evaluate thrombectomy service
CP 01/10/2018 30/10/2018
Implementation Year 2 (2018/19)

20
Activities Responsibility Start Date Completed By
• Establish fully functional thrombectomy service CP 01/04/2019 30/07/2019
• Consider a model and options for centralised HASU for
Norfolk
CC/MM 01/04/2019 31/03/2020
• Assess / develop case for neurosurgery centre CC/MM 01/04/2020 31/03/2021
Implementation Years 3 to 5 (2019 to 2022)
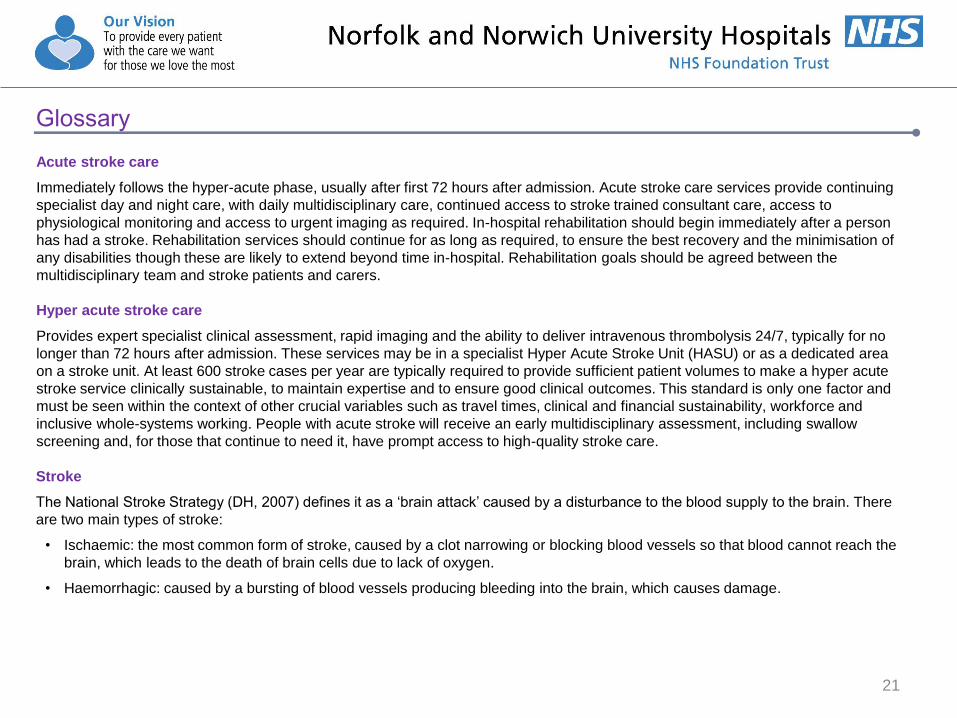
Acute stroke care
Immediately follows the hyper-acute phase, usually after first 72 hours after admission. Acute stroke care services provide continuing
specialist day and night care, with daily multidisciplinary care, continued access to stroke trained consultant care, access to
physiological monitoring and access to urgent imaging as required. In-hospital rehabilitation should begin immediately after a person
has had a stroke. Rehabilitation services should continue for as long as required, to ensure the best recovery and the minimisation of
any disabilities though these are likely to extend beyond time in-hospital. Rehabilitation goals should be agreed between the
multidisciplinary team and stroke patients and carers.
Hyper acute stroke care
Provides expert specialist clinical assessment, rapid imaging and the ability to deliver intravenous thrombolysis 24/7, typically for no
longer than 72 hours after admission. These services may be in a specialist Hyper Acute Stroke Unit (HASU) or as a dedicated area
on a stroke unit. At least 600 stroke cases per year are typically required to provide sufficient patient volumes to make a hyper acute
stroke service clinically sustainable, to maintain expertise and to ensure good clinical outcomes. This standard is only one factor and
must be seen within the context of other crucial variables such as travel times, clinical and financial sustainability, workforce and
inclusive whole-systems working. People with acute stroke will receive an early multidisciplinary assessment, including swallow
screening and, for those that continue to need it, have prompt access to high-quality stroke care.
Stroke
The National Stroke Strategy (DH, 2007) defines it as a ‘brain attack’ caused by a disturbance to the blood supply to the brain. There
are two main types of stroke:
• Ischaemic: the most common form of stroke, caused by a clot narrowing or blocking blood vessels so that blood cannot reach the
brain, which leads to the death of brain cells due to lack of oxygen.
• Haemorrhagic: caused by a bursting of blood vessels producing bleeding into the brain, which causes damage.
21
Glossary

Tertiary care
Specialist neurosurgical and vascular procedures are sometimes necessary to prevent further damage following a stroke, or prevent
stroke altogether. Effective and timely referrals are necessary to ensure that patients suffering a stroke receive the most appropriate
care as quickly as possible to improve their long term outcome.
Thrombectomy
NICE describes thrombectomy as the mechanical clot retrieval for removing blood clots in people who have had an acute ischaemic
stroke. It aims to remove the obstructing blood clot or other material from arteries in the brain. This helps restore blood flow and
minimise and so prevent or limit the damage caused by the stroke.
With the patient under sedation and local anaesthetic, or under general anaesthetic, a catheter is inserted through a large blood
vessel, usually in the groin. The clot is located through a cerebral angiography – where dye and X-rays are used to see how blood
through the arteries in the neck and brain.
The clot retrieval device is then inserted through a catheter, and positioned near the side of the clot. The aim is to remove the clot as
soon as possible, within a few hours of the stroke.
Transient ischaemic attacks (TIA)
TIA’s also known as minor strokes, occur when stroke symptoms resolve themselves within 24 hours.
Transient Ischaemic Attack (TIA) assessment services
Provides rapid diagnostic assessment and access to a specialist within 24 hours for high-risk patients, and within seven days for low-
risk patients.
22
Glossary

________________________________________________________________________________________________ Unconfirmed minutes of the Council of Governors meeting held in public on 31 January 2017 Page 1 of 10
MINUTES OF COUNCIL OF GOVERNORS MEETING
HELD ON TUESDAY 31 JANUARY 2017
Present: Mr J Fry - Chairman Mrs E Betts - Breckland (public) Mr N Brighouse - South Norfolk (public) Ms S Burt - Nursing and Midwifery (staff) Mr B Cushion - Broadland (public) Mr T Davies - Volunteers/Contracted (staff) Prof D DeBell - Norwich (public) Mrs N Duddleston - Breckland (public) Ms C Edwards - North Norfolk (public) Ms S Ellis - Norwich (public) Miss S Ginty - Nursing (staff) Mrs I Grote - Great Yarmouth/Waveney (public) Mrs J King - Broadland (public) Mr J Labouchere - Breckland (public) Mr D McNeil - Broadland (public) Mrs M Pandya - Rest of England (public) Mr P Postle - Norwich (public) Ms J Scarfe - South Norfolk (public) Cllr B Watkins - Norfolk County Council (partner) Mrs V Worman - Admin & Clerical (staff) In attendance: Mrs J Bradfield - Membership Manager Mr M Davies - Chief Executive Mr J P Garside - Board Secretary Mrs E McKay - Director of Nursing Mr J Norman - Chief Finance Officer Mr J Over - Director of Workforce Mr R Parker - Chief Operating Officer Ms V Rant - Assistant to Board Secretary Members of the Public 17/001 APOLOGIES AND DECLARATIONS OF INTEREST
Apologies were received from Mr Aldus, Mr Burgess, Dr Dhesi and Mr Jarvis. No conflicts of Interest were declared in relation to matters scheduled for consideration by the Council.
17/002 MINUTES OF PREVIOUS MEETING HELD ON 25 OCTOBER 2017 The minutes of the meeting held on 25 October 2017 were agreed as a true record and
signed by the Chairman. 17/003 MATTERS ARISING
The Council reviewed the Action Points arising from its last meeting as follows: 16/037 Mrs Bradfield confirmed that a number of governors took part in a visit to the Quadram Institute construction site. Other visits will be arranged in due course, as the construction progresses.
________________________________________________________________________________________________ Unconfirmed minutes of the Council of Governors meeting held in public on 31 January 2017 Page 2 of 10
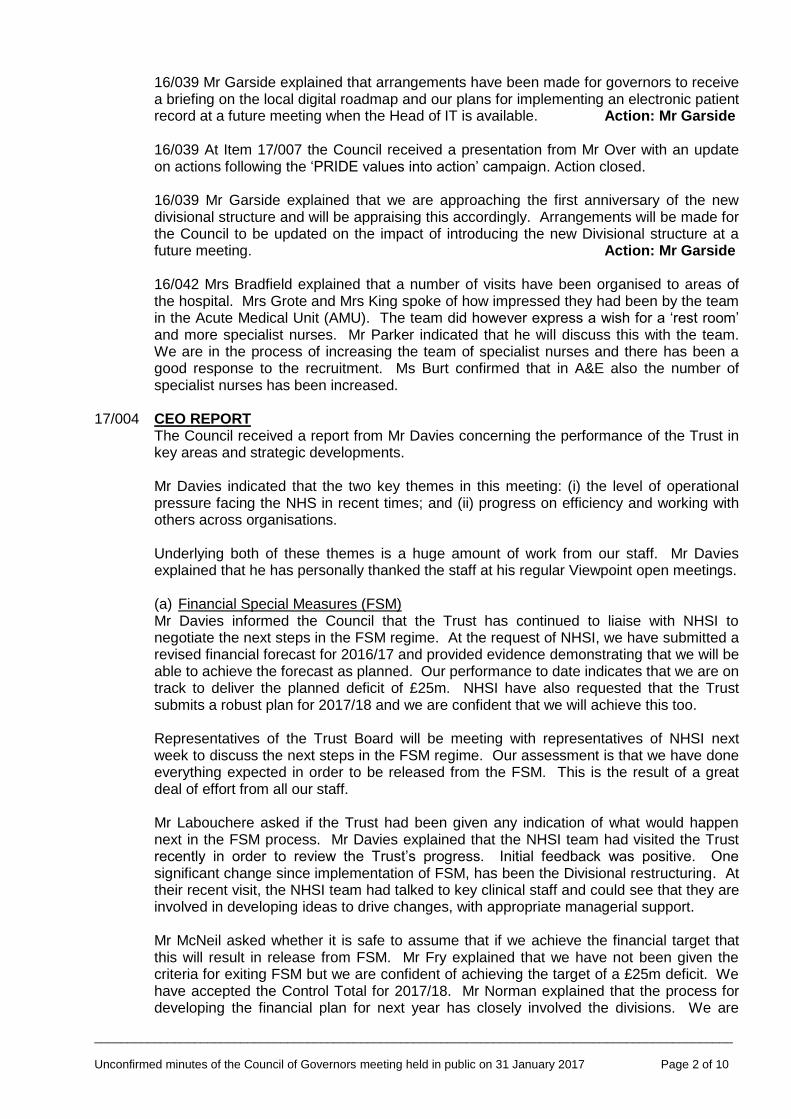
16/039 Mr Garside explained that arrangements have been made for governors to receive a briefing on the local digital roadmap and our plans for implementing an electronic patient record at a future meeting when the Head of IT is available. Action: Mr Garside 16/039 At Item 17/007 the Council received a presentation from Mr Over with an update on actions following the ‘PRIDE values into action’ campaign. Action closed. 16/039 Mr Garside explained that we are approaching the first anniversary of the new divisional structure and will be appraising this accordingly. Arrangements will be made for the Council to be updated on the impact of introducing the new Divisional structure at a future meeting. Action: Mr Garside 16/042 Mrs Bradfield explained that a number of visits have been organised to areas of the hospital. Mrs Grote and Mrs King spoke of how impressed they had been by the team in the Acute Medical Unit (AMU). The team did however express a wish for a ‘rest room’ and more specialist nurses. Mr Parker indicated that he will discuss this with the team. We are in the process of increasing the team of specialist nurses and there has been a good response to the recruitment. Ms Burt confirmed that in A&E also the number of specialist nurses has been increased.
17/004 CEO REPORT The Council received a report from Mr Davies concerning the performance of the Trust in key areas and strategic developments. Mr Davies indicated that the two key themes in this meeting: (i) the level of operational pressure facing the NHS in recent times; and (ii) progress on efficiency and working with others across organisations. Underlying both of these themes is a huge amount of work from our staff. Mr Davies explained that he has personally thanked the staff at his regular Viewpoint open meetings. (a) Financial Special Measures (FSM) Mr Davies informed the Council that the Trust has continued to liaise with NHSI to negotiate the next steps in the FSM regime. At the request of NHSI, we have submitted a revised financial forecast for 2016/17 and provided evidence demonstrating that we will be able to achieve the forecast as planned. Our performance to date indicates that we are on track to deliver the planned deficit of £25m. NHSI have also requested that the Trust submits a robust plan for 2017/18 and we are confident that we will achieve this too. Representatives of the Trust Board will be meeting with representatives of NHSI next week to discuss the next steps in the FSM regime. Our assessment is that we have done everything expected in order to be released from the FSM. This is the result of a great deal of effort from all our staff. Mr Labouchere asked if the Trust had been given any indication of what would happen next in the FSM process. Mr Davies explained that the NHSI team had visited the Trust recently in order to review the Trust’s progress. Initial feedback was positive. One significant change since implementation of FSM, has been the Divisional restructuring. At their recent visit, the NHSI team had talked to key clinical staff and could see that they are involved in developing ideas to drive changes, with appropriate managerial support. Mr McNeil asked whether it is safe to assume that if we achieve the financial target that this will result in release from FSM. Mr Fry explained that we have not been given the criteria for exiting FSM but we are confident of achieving the target of a £25m deficit. We have accepted the Control Total for 2017/18. Mr Norman explained that the process for developing the financial plan for next year has closely involved the divisions. We are
________________________________________________________________________________________________ Unconfirmed minutes of the Council of Governors meeting held in public on 31 January 2017 Page 3 of 10
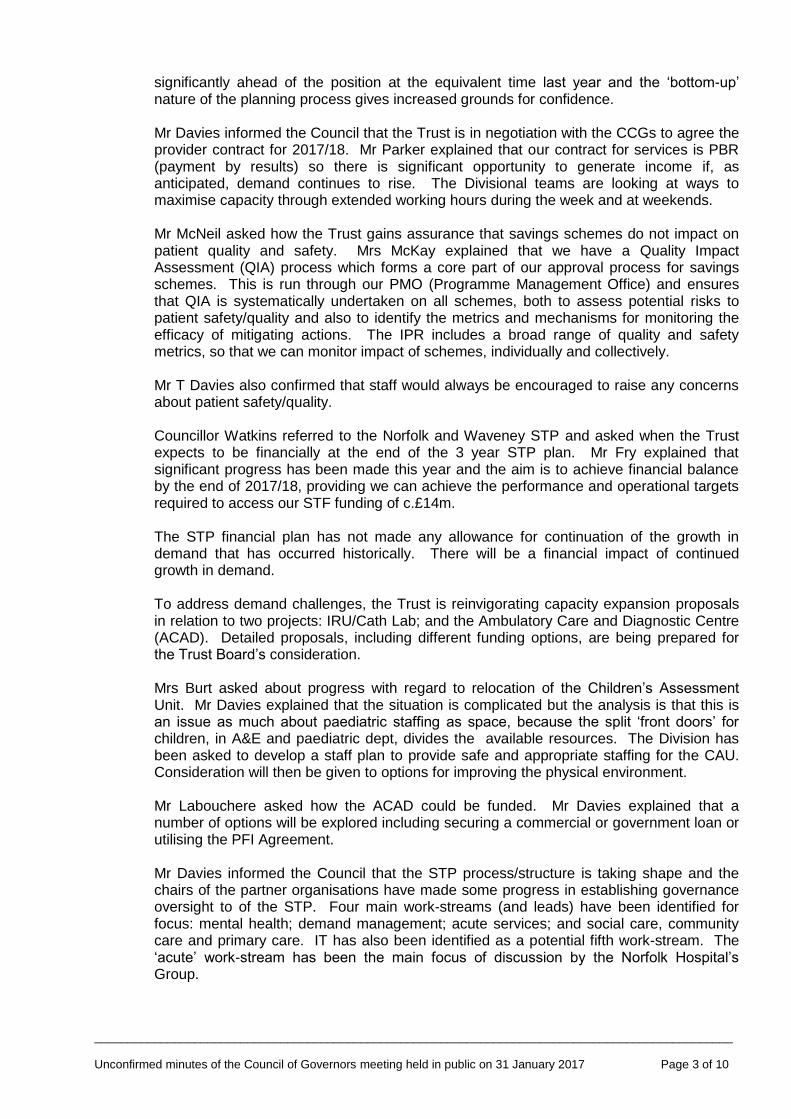
significantly ahead of the position at the equivalent time last year and the ‘bottom-up’ nature of the planning process gives increased grounds for confidence.
Mr Davies informed the Council that the Trust is in negotiation with the CCGs to agree the provider contract for 2017/18. Mr Parker explained that our contract for services is PBR (payment by results) so there is significant opportunity to generate income if, as anticipated, demand continues to rise. The Divisional teams are looking at ways to maximise capacity through extended working hours during the week and at weekends. Mr McNeil asked how the Trust gains assurance that savings schemes do not impact on patient quality and safety. Mrs McKay explained that we have a Quality Impact Assessment (QIA) process which forms a core part of our approval process for savings schemes. This is run through our PMO (Programme Management Office) and ensures that QIA is systematically undertaken on all schemes, both to assess potential risks to patient safety/quality and also to identify the metrics and mechanisms for monitoring the efficacy of mitigating actions. The IPR includes a broad range of quality and safety metrics, so that we can monitor impact of schemes, individually and collectively. Mr T Davies also confirmed that staff would always be encouraged to raise any concerns about patient safety/quality.
Councillor Watkins referred to the Norfolk and Waveney STP and asked when the Trust expects to be financially at the end of the 3 year STP plan. Mr Fry explained that significant progress has been made this year and the aim is to achieve financial balance by the end of 2017/18, providing we can achieve the performance and operational targets required to access our STF funding of c.£14m. The STP financial plan has not made any allowance for continuation of the growth in demand that has occurred historically. There will be a financial impact of continued growth in demand. To address demand challenges, the Trust is reinvigorating capacity expansion proposals in relation to two projects: IRU/Cath Lab; and the Ambulatory Care and Diagnostic Centre (ACAD). Detailed proposals, including different funding options, are being prepared for the Trust Board’s consideration. Mrs Burt asked about progress with regard to relocation of the Children’s Assessment Unit. Mr Davies explained that the situation is complicated but the analysis is that this is an issue as much about paediatric staffing as space, because the split ‘front doors’ for children, in A&E and paediatric dept, divides the available resources. The Division has been asked to develop a staff plan to provide safe and appropriate staffing for the CAU. Consideration will then be given to options for improving the physical environment. Mr Labouchere asked how the ACAD could be funded. Mr Davies explained that a number of options will be explored including securing a commercial or government loan or utilising the PFI Agreement. Mr Davies informed the Council that the STP process/structure is taking shape and the chairs of the partner organisations have made some progress in establishing governance oversight to of the STP. Four main work-streams (and leads) have been identified for focus: mental health; demand management; acute services; and social care, community care and primary care. IT has also been identified as a potential fifth work-stream. The ‘acute’ work-stream has been the main focus of discussion by the Norfolk Hospital’s Group.

________________________________________________________________________________________________ Unconfirmed minutes of the Council of Governors meeting held in public on 31 January 2017 Page 4 of 10
GP practices in Norwich have formed a collaboration called OneNorwich comprising 23 of the 24 GP practices in Norwich. The alliance is linked to the Norfolk and Waveney STP work and will allow NHS organisations to liaise with one body. Mr Davies confirmed that the Trust would welcome the opportunity to work with OneNorwich on projects that will benefit our patients.
Mr Davies informed the Council that there had been positive media coverage of the Trust’s collaborative working with the UEA and RAF Lakenheath. We are working with the UEA to establish a number of joint senior medical appointments which will strengthen our academic workforce and reputation. The Trust has also agreed to host medical staff from RAF Lakenheath, adding to our capacity and enabling their surgeons to maintain their clinical skills.
17/005 INTEGRATED PERFORMANCE REPORT
The Council received for information a copy of the Integrated Performance Report (a) Quality and Safety Mrs McKay informed the Governors that the number of medication incidents over the last 12 months has been on a downward trend. This may be related to the investment in the electronic prescribing system. Six medication incidents were reported in December that related to insulin errors. The Medical Division are working to increase support for diabetic patients identified through the EMPA system. 12 Serious incidents were reported in December 2016. 2 incidents related to ward closures due to Norovirus. The wards have now reopened. The incident at Cromer MIU related to attendance of a child under the age of 12 months who should have been referred to NNUH. The family chose not to attend NNUH and potential safeguarding issues may have been missed. The incident in T&O is being reviewed under the mortality review process. Root Cause Analysis investigations are undertaken for all Serious Incidents to identify learning outcomes. 4 patient falls were reported in December resulting in moderate harm or above. 4 patients developed Grade 3 hospital acquired pressure ulcers in December. It is anticipated that the increase in the number of pressures ulcers and falls is due to the increased numbers of patients but this is being closely monitored to determine if this is an ongoing trend. The Council was informed that the number of C Difficile infections in the year to date is 32 which remains below the ceiling of 49 cases. Each case is reviewed to determine potential learning outcomes. At 1.84%, NNUH was below (better than) the national average (2.19%) in December for the number of ‘new harms’ on the NHS Patient Safety Thermometer.
Ms Burt expressed concern that the service for provision of food to patients does not currently extend to A&E patients who may have been waiting for long periods. Mrs McKay confirmed that this would be looked at to see what provisions could be put in place for these patients. Action: Mrs McKay
A review is undertaken of patients who have been discharged from hospital between 11pm and 6am. These are monitored every month through the Caring and Patient Experience Sub-Board. No cause for concern was found for those patients discharged out of hours in December.
Mrs Scarfe noted the data provided in relation to call bell waits and expressed concern that several of her constituents had told her of lengthy waits to have their call bells
________________________________________________________________________________________________ Unconfirmed minutes of the Council of Governors meeting held in public on 31 January 2017 Page 5 of 10
answered. Mrs McKay explained that the number of fundamental standards audited under the Quality Assurance Audits process increased in 2016. Mrs Duddleston expressed concern that a Friends and Family Test (FFT) questionnaire had been sent to one of her constituents who had died and asked if there was a process in place for checking a patient’s status before they were sent. Mrs McKay explained that this should not happen. The Trust is trying to increase the FFT response rate and a number of new methods are being tried including volunteers, telephone call follow-ups and social media apps.
Mr McNeil asked if the upward trend in the number of Serious Incidents should be a cause for concern. Mrs McKay explained that the number of incidents is closely monitored and all are carefully investigated. Recently, numbers have increased partly due to ward closures resulting from Norovirus, which must be reported as Serious Incidents in the national reporting system. Increased pressure and staff shortages caused by sickness can have an impact but the Root Cause Analysis process is undertaken to identify any themes that may have contributed to incidents. Mrs McKay explained that the number of nursing staff has increased in 2016/17 and the number of newly qualified nursing staff that had been employed has also increased. Staffing allocations are reviewed on a daily basis with staff being deployed accordingly to address any gaps in shifts. We have also promoted our Staff Bank to encourage staff to join and to assist the fill rate for shifts. Ms Ellis asked about the number of pregnant women who are transferred to other hospitals for caesarean section deliveries. Mr Parker explained that this is monitored and reported in the IPR. The number of such cases has fallen this year but it is a product of demand and capacity and it is impossible to predict exactly when mothers will go into labour. Sometimes it is necessary to ask ‘elective’ patients to go to a neighbouring hospital when our Unit is especially busy. (b) Performance Mr Parker informed the Council that a number of actions taken throughout the year had significantly helped to ease pressure over the winter period. Despite increase in the number of patients attending A&E and arriving by ambulance the measures introduced at the ‘front door’ have helped to ease pressure in the hospital by reducing the admission conversion rate from 32% to 25%. The ambulatory care pathway is proving effective in increasing the number of patients who can be treated and sent home rather than admitted to hospital. The number of patients who have been in hospital for more than 14 days is also being closely monitored. The current number of patients in hospital for more than 14 days is 260 but in order to improve flow this needs to be reduced to 200 patients or less. We are working closely with organisations in the community to achieve this. The Council was informed that challenges remain in achievement of some cancer targets. The three most challenged specialties are Urology, Gynae-oncology and Colorectal. Work is ongoing to reduce delays and effectively utilise capacity. We have been releasing elective capacity to make this available to cancer patients. In the longer term we need to increase capacity.
Mr Parker informed the Council that the Trust had been working with the NHSI Elective Intensive Support Team to review the 18 week RTT backlog and to gain assurance that our data is robust and that we have utilised all options to address capacity/demand. The
________________________________________________________________________________________________ Unconfirmed minutes of the Council of Governors meeting held in public on 31 January 2017 Page 6 of 10
review has highlighted that the Trust will be unable to address this alone and that this will require a system-wide solution. Mr Fry explained that despite an increase in the number of elective operations, the backlog of elective patients has continued to increase demonstrating the need for more capacity. Mr Parker explained that in order to prioritise treatment for the urgent/cancer patients, elective capacity is reduced. Robust processes are in place for the review of patients who are waiting so that they do not come to any harm. Mr Davies explained that a system-wide solution will be needed to assist recovery of the 18 week RTT and additional capacity will be needed to address the backlog. The need for additional capacity reinforces the Trust’s intention to build an Ambulatory Care and Diagnostic Care facility to provide the service that our patients need. Mr McNeil asked if we use private sector capacity for elective surgery. Mr Parker confirmed that private sector capacity is utilised where available, although the private sector will only accept certain patients. Ring-fencing of DPU capacity has been the biggest factor in the increase of day case surgery. Mrs Worman informed the Council that many of the specialties had been exploring changes such as procedures that can be undertaken as day cases, or in chairs rather than requiring a bed. This is effective in reducing constraints on treating patients and Mr Fry noted that the Trust has the highest day case rate in the Country.
Mr Labouchere asked if the stroke unit was dedicated for stroke patients and this was confirmed. A stroke strategy is being developed, to enhance our capacity to provide specialist stroke services for patients.
(c) Workforce Mr Over informed the Council that the cost of using for Registered Nursing and Midwifery agency staff has continued to decline – through steps taken to limit price and volume of shifts. A 50% reduction was achieved in December 2016 compared to July 2016.
Mrs Scarfe asked which aspect had been most significant in achieving savings. Mr Over confirmed that the most significant savings had been through reducing the numbers of agency staff and negotiation of reduced rates paid to agencies. Mr Cushion asked if the Trust had increased use of staff on the Staff Bank. Mr Over confirmed that the Trust has been promoting the Staff Bank to attract and increase the number of staff that are employed through the Bank. Wherever possible unfilled shifts will be filled with bank staff before using agency staff.
Mrs Burt highlighted that the A&E Department had been close to full establishment and this had not been the case previously which demonstrates the success of the work to improve recruitment and our Staff Bank. Mrs McKay explained that implementation of the new measures to control agency spend has been challenging for staff but they acknowledge that it is the right thing to do and have been very supportive. Mrs Burt expressed concern that some staff have indicated that they had not been contacted by the Staff Bank when shifts were available. Mr Over explained that bank shifts are available electronically so that bank staff can view gaps and volunteer for shifts directly. Mr Over informed the Council that the flu vaccination rate this year was 80% which is the highest level recorded. It is too early at this stage to determine if this will have a positive effect on reducing the level of staff sickness absence.

________________________________________________________________________________________________ Unconfirmed minutes of the Council of Governors meeting held in public on 31 January 2017 Page 7 of 10
Mr McNeil asked whether there is cause for concern from the number of unfilled shifts and increase in sickness. Mrs McKay explained that at times of increased pressure it is likely that administrative or non-clinical tasks, such as mandatory training, may be put on hold in order prioritise patient care. Where RGNs are not available, additional HCAs are engaged to support patient care. (d) Finance Mr Norman informed the Council that the Trust is on track to achieve the financial plan for 2016/17. Achievement of the 2016/17 plan delivering a £25m deficit and a robust plan for 2017/18 are key aspects in our FSM negotiations with NHSI and NHSE. Closing cash at the end of month 9 was £3.7m which was £5.9m behind the forecast. A number of measures have been taken to closely manage our cash such as reducing the number of pay runs and earlier receipt of clinical income from the CCGs.
CIP savings in December were £2.9m against plan of £3m. In the year to date savings are £15m which is £490k above plan. Planning for 2017/18 is underway and the Divisions are engaged and taking ownership of their targets for the coming year. Mrs Worman asked if the capital plan for 2017/18 would include refurbishment of admin areas which have not been refurbished for quite some time. Mr Parker explained that refurbishment of the hospital building forms part of the PFI Agreement. The ward refurbishment programme is recommencing this year but further discussion needs to be undertaken with Octagon/Serco about incorporating non-clinical areas into this programme. Mr Labouchere asked what wards had been refurbished in the programme so far. Mr Parker confirmed that Mattishall Ward had been refurbished and a further 8 wards will be refurbished over the coming year. Mrs Burt asked when the A&E Department would be refurbished and how this would be achieved. Mr Parker explained that careful planning would be needed for the refurbishment of the A&E Department, in order to minimise disruption to emergency patients. We have however previously refurbished other challenging areas such as the Critical Care Complex and the canteen.
17/006 MEMBERSHIP ANALYSIS AND UPDATE
The Council received for information a report from Mrs Bradfield outlining governor, member and public activities across many areas of the Trust. The report detailed Governors’ briefings and activities since the last meeting. Mrs Worman reported that the Outpatient Forum has held its first meeting and this was very positive – looking at standards in Outpatients and communication with patients. Mrs Bradfield indicated that other governors would be welcome if they wish to volunteer for the Outpatient Forum and were invited to contact Mrs Bradfield.
Action: Governors wishing to volunteer
17/007 PRIDE VALUES INTO ACTION UPDATE The Council received a presentation from Mr Over concerning the PRIDE Values into Action programme. The Council was informed that the PRIDE Values into Action programme has been endorsed by the Trust Board to improve our staff and patient experience and to make the NNUH a better place to work and be cared for.
________________________________________________________________________________________________ Unconfirmed minutes of the Council of Governors meeting held in public on 31 January 2017 Page 8 of 10
Mr Over informed the Council that approximately 2,000 patients and staff had been involved in the PRIDE Values into Action events and surveys. Analysis of the feedback was then used to identify a number of key values and behaviours. Analysis of the feedback from our patients highlighted a number of positive areas that we can build on. A number of negative areas that we can work to improve were also identified.
Staff views on experience of working at the Trust, what makes a ‘good’ day and a ‘bad’ day, were also gathered. Comments about a good day included feeling valued and appreciated and receiving positive feedback. Experiences contributing to a ‘bad’ day included feeling unappreciated and not feeling supported by their managers. Some staff said that they experience poor behaviour from colleagues. This is an opportunity to improve positivity across the organisation and to demonstrate that we are listening to staff and acting on their feedback.
The key aims of our PRIDE values and behaviours programme are:
for everyone to recognise them as fundamental to our future as a place to work and be cared for;
that they are known by and have a positive influence on our staff;
that they are upheld by every leader;
to build on the support for the campaign and continue to involve staff/patients in identifying further improvements.
Further work is being undertaken to develop the action plan to implement the next steps to make positive changes which will be reviewed by the Trust Board in February. The Council will be updated on further progress during the year. Mr Over informed the Governors that the national NHS staff survey results are expected to be published in February. The results of the survey are reviewed to identify any areas with low scores in order to implement actions for improvement.
Mrs Grote noted that the goals identified for the PRIDE values were very general and asked how progress would be monitored in order to identify those departments that require additional support. Mr Over explained that the results of the Staff Survey will give a better understanding of any variations at departmental level and the Divisions will be challenged to address any areas identified as needing improvement. Mr Fry explained that the Staff Survey results will also help to inform development of the detailed action plan for the PRIDE Programme to ensure that the right actions are being taken for positive changes throughout the Trust. This will include supporting a culture in which staff feel able and willing to raise any concerns. Mr Labouchere asked if the Trust was planning to repeat the PRIDE Values into Action Listening Week in the future as it would be useful to know what improvements have been made. Mr Over explained that another event will be held in the future but it does use a significant amount of staff resources and we are therefore exploring other ways to provide gather feedback. Mr Labouchere noted that it is important to feedback to staff on what has changed as a result of this programme and Mr Over emphasised that a key element of future work will be to highlight the actions that have been taken.
17/008 QUALITY PRIORITIES 2017/18 On behalf of Mr Chapman, Mr Garside referred the Council to the Trust’s Quality Priorities, as detailed on Core Slide 3 of the IPR. Based on the regulatory guidance, there is an
________________________________________________________________________________________________ Unconfirmed minutes of the Council of Governors meeting held in public on 31 January 2017 Page 9 of 10
expectation that the majority of priorities should be consistent across years and they should change only with good reason. It will be necessary for us to revise the priorities somewhat, as in some cases the requisite data is not available. Otherwise it is expected to ‘roll over’ the current Priorities into 2017/18. Any comments from governors in relation to the Quality Priorities were invited and should be passed to Mrs Bradfield. Action: All Governors
17/009 HEALTHY FOOD CQUIN The Council received a report from Mr Parker concerning the Commissioning for Quality and Innovation (CQUIN) for Healthy Food for NHS staff, visitors and patients. Part of the Trust’s contractual income is dependent on meeting a number of CQUIN initiatives each year. The Council was informed that one CQUIN for 2016/17 relates to the availability of ‘healthy’ food for staff, visitors and patients. The CQUIN requires the Trust to work with food providers operating on its site to gain agreement to meet certain standards with regard to the food on sale. The Trust has agreed with relevant food vendors that they will implement any required changes by the end of March 2017. This should ensure that the Trust can demonstrate compliance with the CQUIN requirements and secure this funding.
17/010 CAR PARKING CAPACITY WORKING GROUP Mr Garside explained that a working group is being established to explore options to resolve car parking capacity problems. It will be helpful to have staff and public input in the car parking capacity working group and governors interested in contributing were invited to contact Mrs Bradfield. Action: Governors wishing to volunteer
17/011 ADVANCE NOTICE QUESTIONS Mr Labouchere had submitted a question which had been addressed during the course of the meeting.
17/012 AGENDA FOR NEXT MEETING The Council reviewed and agreed the draft outline agenda for its next meeting.
17/013 ANY OTHER BUSINESS Mrs Edwards asked about use of private email accounts concerning matters relating to the Trust. There are occasions when it is necessary to communicate about confidential matters and use of personal email accounts inhibits this. Mrs Bradfield will liaise with IT as to whether nhs.net email accounts can be made available to governors.
Action: Mrs Bradfield 17/014 DATE AND TIME OF NEXT MEETING The next meeting of the Council of Governors will be at 10am on 20 April 2017 in the
Boardroom of the Norfolk and Norwich University Hospital. Signed by the Chairman: ………….….……………………… Date: ……………………………………
________________________________________________________________________________________________ Unconfirmed minutes of the Council of Governors meeting held in public on 31 January 2017 Page 10 of 10
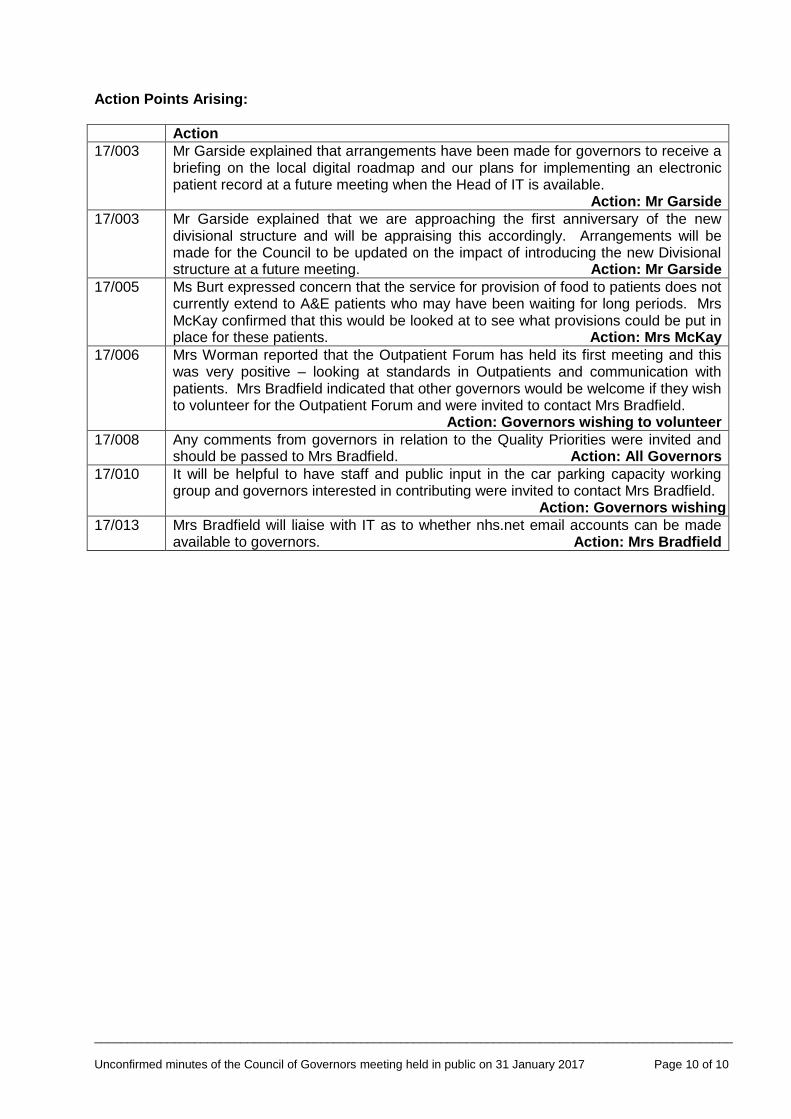
Action Points Arising:
Action
17/003
Mr Garside explained that arrangements have been made for governors to receive a briefing on the local digital roadmap and our plans for implementing an electronic patient record at a future meeting when the Head of IT is available. Action: Mr Garside
17/003
Mr Garside explained that we are approaching the first anniversary of the new divisional structure and will be appraising this accordingly. Arrangements will be made for the Council to be updated on the impact of introducing the new Divisional structure at a future meeting. Action: Mr Garside
17/005
Ms Burt expressed concern that the service for provision of food to patients does not currently extend to A&E patients who may have been waiting for long periods. Mrs McKay confirmed that this would be looked at to see what provisions could be put in place for these patients. Action: Mrs McKay
17/006
Mrs Worman reported that the Outpatient Forum has held its first meeting and this was very positive – looking at standards in Outpatients and communication with patients. Mrs Bradfield indicated that other governors would be welcome if they wish to volunteer for the Outpatient Forum and were invited to contact Mrs Bradfield.
Action: Governors wishing to volunteer
17/008
Any comments from governors in relation to the Quality Priorities were invited and should be passed to Mrs Bradfield. Action: All Governors
17/010
It will be helpful to have staff and public input in the car parking capacity working group and governors interested in contributing were invited to contact Mrs Bradfield. Action: Governors wishing to volunteer
17/013
Mrs Bradfield will liaise with IT as to whether nhs.net email accounts can be made available to governors. Action: Mrs Bradfield
Our Values: People-focused Respect Integrity Dedication Excellence
REPORT TO THE COUNCIL OF GOVERNORS
Date 20 April 2017
Title Chief Executive’s Report
Purpose To update the Council on matters relating to the Trust that are not covered elsewhere in the papers.
Summary Attached is a copy of the Chief Executive’s report provided to the Board of Directors at its meeting on 31 March 2017. Key points are noted regarding: - our release from Financial Special Measures and the financial challenge facing the NHS; - the operational challenge with particular reference to A&E; - developments in the STP and cross-organisational working. Since the Board meeting, we have received a planned visit from the CQC. At the time of writing, the inspection fieldwork is ongoing and the Council will be updated on the latest position at its meeting.
Recommendation: The Council is recommended to note the issues highlighted, for information.
Our Values: People-focused Respect Integrity Dedication Excellence
REPORT TO THE TRUST BOARD
Date 31 March 2017
Title Chief Executive’s Report
Purpose To update the Board on matters relating to the Trust that are not covered elsewhere in the papers.
Summary Key points are noted regarding: 1. Financial challenge:
We are now out of Financial Special Measures due to the commitment and efforts of all our staff. We are now being asked for advice by Trusts across the country.
Reference is made to the NHS Providers report - Mission impossible? The task for NHS providers in 2017/18 (Appendix A)
2. Operational Challenge:
Comment on the NHSI and NHSE joint letter “Action to get A&E performance back on track” and its implications for the Trust and STP (Appendix B)
3. Sustainability & Transformation Planning:
Comment on the STP Emergency and Urgent Care Board (chaired by NNUH CEO) – update to meeting
Report on Corporate Services Costs Benchmarking (Appendix C)
Recommendation: The Board is recommended to note the issues highlighted for information.

Our Values: People-focused Respect Integrity Dedication Excellence
CHIEF EXECUTIVE’S REPORT TO TRUST BOARD – 31 MARCH 2017
This report is intended to update the Board on matters relating to the Trust that are not covered elsewhere in the papers for our meeting.
The issues highlighted below are all interrelated – concerning financial challenge, operational challenge and system change. Unspoken, but as a constant theme throughout, is our commitment and drive to maximizing the quality and safety of care and service that we can offer our patients – as detailed in our Integrated Performance Report.
1 FINANCIAL CHALLENGE & REGULATORY CONTEXT This is the first public Board meeting since we have been released from Financial Special Measures. This is a significant mark of increased confidence in the Trust by the Regulator (NHSI) and reflects the huge efforts made by all our staff to improve the Trust’s position.
It is worth noting a couple of aspects of the message from the Regulator in particular:
“I recognise the significant work that the Trust has undertaken to improve the financial position and I would like to take this opportunity to congratulate you and your team for the progress you have made”.
“I particularly want to mention the successful focus you placed on reducing pay spend particularly around high agency costs and usage. We will be looking to use this as an example of best practice for other Trusts”.
In fact a number of our senior team have been already been asked to present at NHS conferences concerning the approach we have taken to meet the financial challenge. We have also been contacted by a number of other Trusts around the country wanting to learn from our experience of FSM.
We remain on track to deliver our challenging savings target and to achieve our forecast deficit of £25m. With the further challenge we have set ourselves for next year, this marks the next step in addressing a number of longstanding issues and moving the Trust towards financial sustainability.
The title of the report issued by NHS Providers this month suggests however the size of the challenge ahead (Mission impossible? The task for NHS providers in 2017/18). Attached at Appendix A to this report is a copy of the press release issued by NHS Providers to accompany their report. Commenting on their findings, the chief executive of NHS Providers, Chris Hopson, said:
"It is unprecedented for us to warn that the NHS will not be able to deliver on its
commitments before the financial year has even started. But trusts are currently being asked
to absorb a 5% plus cost and demand increase, recover the four A&E wait and 18 week
surgery targets, improve care for cancer and mental health and balance next year’s books
financially. All on a 1.3% NHS England funding increase, down from this year’s 3.6% increase.
Taken together, this is mission impossible. The numbers don’t add up.”
Whilst nothing will be achieved with a negative attitude, there is a need for realistic and accurate planning. In our region one particular aspect in which “the numbers don’t add up” relates to the provision for patients waiting for treatment and the need to ensure that there is adequate capacity to meet demand.
Our Values: People-focused Respect Integrity Dedication Excellence
2 OPERATIONAL CHALLENGE
The size of the operational challenge facing the NHS has been well-publicised. Nationally particular planning is now underway to maximise performance over the forthcoming Easter period. Attached at Appendix B to this report is a letter dated 9 March 2017 from both NHS England and NHS Improvement setting out their approach towards “Action to get A&E performance back on track”. This has three elements:
i) Freeing up hospital capacity ii) Managing A&E Demand iii) Aligned national support and oversight
On (iii), it is explained that receipt of the 30% of STF funding that is performance-related will be linked to effective implementation of the actions at (i) and (ii), as well as achieving 90% A&E 4-hr performance before or in September, sustaining and improving this to 95% by March 2018. Achievement of these requirements will require a system-wide response and increases the importance of the STP actions detailed below. 3 SUSTAINABILITY & TRANSFORMATION PLANNING
3.1 STP Emergency and Urgent Care Board As previously discussed, we continue to work with partners in the STP, encouraging progress towards a system response to the challenges facing the NHS in our region. A potentially significant development is that we have been asked to establish an STP Emergency and Urgent Care Board chaired by NNUH CEO. The Board will be updated at its meeting. 3.2 Corporate Services Costs
As an element of the STP work, NHS organisations have agreed to look at the provision of support
services to establish whether these can work better together – generating efficiencies that can
improve services and concentrate resources on providing patient care. Our Director of Strategy,
Simon Hackwell, is the SRO for this programme of work. It reports to the Norfolk Provider
Partnership (NPP) and in turn feeds into the STP.
We have recently received information on benchmarked costs for support services in the Trust.
These data show that our costs are amongst the lowest in the NHS and this is consistent with the
earlier reports from the national ‘Carter’ work. A summary report from Mr Hackwell is attached at
Appendix C.
4 RECOMMENDATION The Board is asked to note the content of this report for information.
NHS Providers
file:///C|/Users/vr2/Desktop/Press%20Release%20-%20NHS%20Providers.html[24/03/2017 17:11:17]
NHS TRUSTS CAN’T DELIVER IN 2017/18WITHOUT MORE REALISM, FLEXIBILITY ANDSUPPORT
A detailed analysis by NHS Providers shows that what is currently being asked of NHS trusts in the comingfinancial year is well beyond reach. The report sets out how greater realism, flexibility and support areneeded if trusts are to deliver in 2017/18.
The report, Mission impossible? The task for NHS providers in 2017/18, presents a detailed assessment ofthe demands that are being placed on NHS trusts through the NHS planning guidance. These are comparedagainst next year’s significantly lower funding increases, revealing a currently unbridgeable gap.
The report sets out, in detail, the challenges facing the NHS in 2017/18. These include:
Absorb a projected 3.1% increase in overall demand from patients and 2.1% increase in costs includingpay, buildings and laboratories;Recover key performance targets, such as for A & E and routine operations. The estimated extra cost ofdelivering these targets across the year is £2.4–3.1 billion;Deliver new commitments on cancer and mental health with an estimated cost of £150-£200 million;Trusts to collectively balance their books with an estimated financial performance improvement of £800-900 million required; andAll of this is set against sharply reduced NHS England funding, with funding increases dropping from 3.6%this year to 1.3% in 2017/18.
The report sets out three ways on how the 2017/18 NHS trust task could be made more deliverable:
NHS leaders setting more realistic performance trajectories against the key targets, as they have alreadystarted to do;Building on work already started, review whether more of the £5 billion currently spent on commissioningand the Department of Health and its arms length bodies can be redirected to front line care; andProviding more support to NHS trusts to enable them to improve performance and eliminate unwarrantedvariation more rapidly.
The report points out the patient impact in 2017/18 of continuing on the current performance trajectory:
1.8 million people in A & E will fall outside the target to deal with 95% of patients in four hours. That is half
Menu
OverviewNewsBlogsPress office
Home News & blogs> News> NHS trusts can’t deliver in 2017/18 without more realism, flexibility and support>
HomeNews & blogs
TopicsResource libraryCourses & eventsProgrammesMembersAbout us

NHS Providers
file:///C|/Users/vr2/Desktop/Press%20Release%20-%20NHS%20Providers.html[24/03/2017 17:11:17]
It is unprecedented for us to warn the NHSwill not be able to deliver on itscommitments before the financial year haseven started.
Given that demand and cost increases willeasily outstrip funding and efficiencyincreases, just reproducing this year’sfinancial performance is a stretching target.
a million more than this year, and an increase of nearly 40%On average 100,000 more patients than expected will wait longer than 18 weeks for routine surgery,150% more than this year’s figure of 40,000
The report points to the increasing patient safety risk over the winter period with record levels of demandleading to potentially unsafe bed occupancy levels and rising numbers of long ambulance handover timesand 12 hour trolley waits. It also highlights the increasing burden on NHS staff of trying to deliver impossibletargets without adequate funding.
Commenting on the findings, the chief executive of NHS Providers, Chris Hopson, said:
"The NHS is a can-do organisation which achieves extraordinary results for patients every day. NHS trustsare treating more patients than ever before and performance remains good by international standards. Sowhen those trusts say that they can’t deliver what’s currently being asked for next year, it is time to sit upand listen.
"It is unprecedented for us to warn the NHS will not be able to deliver on its commitments before thefinancial year has even started. But trusts are currently being asked to absorb a 5% plus cost and demandincrease, recover the four A&E wait and 18 week surgery targets, improve care for cancer and mental healthand balance next year’s books financially. All on a 1.3% funding NHS England funding increase, down fromthis year’s 3.6% increase. Taken together, this is mission impossible. The numbers don’t add up.
"NHS trusts want to deliver NHS standards, achievefinancial balance and improve performance. Thestandards on A&E and surgery were set for a goodreason – they are a good proxy for the quality andaccess to care the NHS should provide. But trusts canonly deliver if funding keeps pace with rapidly risingdemand. In the absence of those funding increases, we
need greater realism, flexibility and support from those leading the service.
"Trusts won’t be able to recover the A&E and elective surgery targets across the whole year. Just stabilisingthe rapidly increasing performance decline would be an achievement in itself. Given that demand and costincreases will easily outstrip funding and efficiency increases, just reproducing this year’s financialperformance is a stretching target.
"We also need to redirect money to front line care andprovide more support to help providers reduceunwarranted variation and improve performance asquickly as possible.
"There is also a very clear and simple warning in ouranalysis. We have now reached the point where, on theresources available, NHS trusts can no longer deliver
what the NHS constitution requires."
Related articles
� � �

High quality care for all, now and for future generations
Dear colleague, Action to get A&E performance back on track We are writing to thank you and your staff for your work over what has been a highly pressurised winter, and - following the Chancellor’s Budget statement yesterday - to let you know about the action now needed to turnaround A&E performance in 2017. Further detail will be provided in the NHS Delivery Plan being published in three weeks’ time. Throughout this winter, there have been three consistent themes relating to urgent and emergency care: difficulties in discharging inpatients when they are ready to go home; rising demand at A&E departments, with the fragmented nature of out-of-hospital services unable to offer patients adequate alternatives; and complex oversight arrangements between trusts, CCGs and councils. To avoid a repeat next winter of this past winter, we need to make concrete changes on all three fronts. Freeing up hospital bed capacity First, we know that difficulties with discharging emergency inpatients has reduced the effective availability of beds in which to care for both emergency patients presenting in A&E, as well as patients needing planned surgery. It is therefore vital that, together with our partners in local government, we ensure that the extra £1 billion the Chancellor has made available for social care is in part used to free-up in the region of 2000-3000 acute hospital beds. We would ask that you immediately now engage with the senior leadership of your local adult social care departments to discuss how those patients stuck in hospital needing home care or care home places can access those services.
All NHS Provider Trust Chief Executives All CCG Accountable Officers All CCG Clinical Leaders Copy to Local Authority Chief Executives Gateway Reference: 06600
9th March 2017

It is also, however, indisputable that there are places which have still not adopted best practice to enable appropriate flow, including better and more timely hand-offs between A&E clinicians and acute physicians, discharge to assess, ‘trusted assessor’ arrangements, streamlined continuing healthcare processes, and seven day discharge capabilities. You now need to ensure these happen everywhere, and well before October 2017. Managing A&E demand Some estimates suggest that between 1.5 and 3 million people who come to A&E each year could have their needs addressed in other parts of the urgent care system. They turn to A&E because they are unclear about the alternatives or are unable to access them. You therefore now need to:
Ensure every hospital implements a comprehensive front-door streaming model by October 2017, so that A&E departments are free to care for the most urgent patients. Yesterday’s Budget has made available an extra £100 million of capital to be deployed in the next six months to support this. Proposals will need agreement with the Department of Health and we will be letting you know proposed allocations of this within the next six weeks.
Strengthen support to your Care Homes so as to ensure that they have direct access to clinical advice, including where appropriate on-site assessment. We are making available £30 million to support universal roll-out of this model via 111, in order to reduce the risk of care home residents being admitted to hospital.
Implement the recommendations of the Ambulance Response Programme by October 2017, freeing up capacity for the service to increase their use of Hear & Treat and See & Treat, thereby conveying patients to hospital only when this is clinically necessary.
Proceed with the standardisation of Walk-In-Centres, Minor Injury Units and Urgent Care Centres, so that the current confusing array of options is replaced with a single type of centre which offers patients a consistent, high quality service.
Roll out evening and weekend GP appointments, to 50% of the public by March 2018 and 100% by March 2019.
Increase the number of 111 calls receiving clinical assessment by a third by March 2018, so that only patients who genuinely need to attend A&E, or use the ambulance service, are advised to do this.
Aligned national support and oversight Given the national importance of improving NHS urgent and emergency care performance, we intend to simplify the focus of the 30% performance element of the Sustainability and Transformation Fund (STF) for 2017/18, so that it will focus on A&E rather than requiring providers to focus on multiple objectives. For individual trusts it will be linked to effective implementation of the actions set out above as well as achieving performance before or in September that is above 90%, sustaining this, and returning to 95% by March 2018.

In order to ensure complete alignment between NHS England and NHS Improvement in supporting and overseeing urgent implementation of the above actions, we have appointed Pauline Philip as the single national leader accountable to us jointly. Furthermore, from 1st April we are nominating a single, named Regional Director drawn from NHSI and NHSE to support this implementation work and hold accountable both CCGs and trusts through their local STP’s A&E Delivery Boards. Each RD will therefore act with the delegated authority of both NHSI and NHSE in respect of urgent and emergency care. Thank you for your ongoing leadership on this critical part of what the NHS does for the people of this country. Yours sincerely
Simon Stevens Jim Mackey CEO, NHS England CEO, NHS Improvement
CEO Report (31.3.17) - Appendix C
NHS Corporate Services benchmarking
As part of the ongoing Cater work on improving NHS productivity, NHSI have recently conducted an
exercise to benchmark the costs of trusts’ corporate (back office) costs. We have recently received
the benchmarking data. Extracted summary data is attached.
While this is important in terms of understanding the relative position of our services, it is also part
of the requirement that all trusts should be working across their STP to consolidate these services to
achieve efficiency gains.
NNUH position The attached extract summarises the Trust’s results. In relation to the total cost of each corporate
service, in all cases NNUH scored lower than the national lower cost quartile. The cost for the
finance service was the lowest across the NHS per £100m turnover and for the HR service the Trust
has the second lowest cost.
Each corporate service is broken down into a number of components and these form part of the
more detailed report sent through.
NPP & STP perspective The Trust is leading the work across the five providers (3 hospitals plus acute and mental health
trusts) in the STP to examine options for consolidating back office services. There are five
workstreams:
HR (led by Jeremy Over)
IM&T (led by Ben Everitt)
Payroll (led by Queen Elizabeth Hospital)
Procurement (led by NCHC)
Finance (led by NSFT). NNUH is not included in the finance workstream at present.
Simon Hackwell is the SRO for this programme of work. It reports to the Norfolk Provider Partnership
and in turn feeds into the STP.
The Norfolk Provider Partnership’s vision for consolidation of back office services is:
To enable greater system working and support our front line staff in delivering patient care, we will
seek to share back office services wherever possible, providing this results in greater efficiency and
value for money.
There are five key principles underpinning this vision:
1. To develop a programme of work around consolidation of services which seeks to generate
cashable savings of at least 10% from current cost.
2. To prioritise work on those services which will have most impact and are comparatively
more straightforward to consolidate.
3. To remain open-minded about the future operating model for our back office services e.g.
lead provider, outsourced provider.
4. To accept that different providers have different starting positions and as a result some may
gain more from consolidation than others.
5. To ensure that wherever possible we are transparent in communicating with staff. Our
default position will be to share information unless individually or commercially sensitive.
Cases for change are being developed based around five options:
Do nothing
Hosted shared services
Jointly managed service
Joint venture with private sector
Outsourced provider
These should be ready over the next few months and where appropriate the NPP will request
preferred options are developed into formal business cases.
There are two important issues to consider in this work. First, given the relative low cost of NNUH
corporate services the benefits from consolidation may not be significant to NNUH. Indeed in some
areas it could be argued that additional investment is required to meet current and future demands.
Second, and related to this, is the need to consider how any benefits might be distributed among
partners. This will be tested out on a case by case basis.
As the work progresses, the Board will be kept informed.

NHS Corporate Services
FY 15/16 Benchmarking Report
February 2017
Page 1 of 64
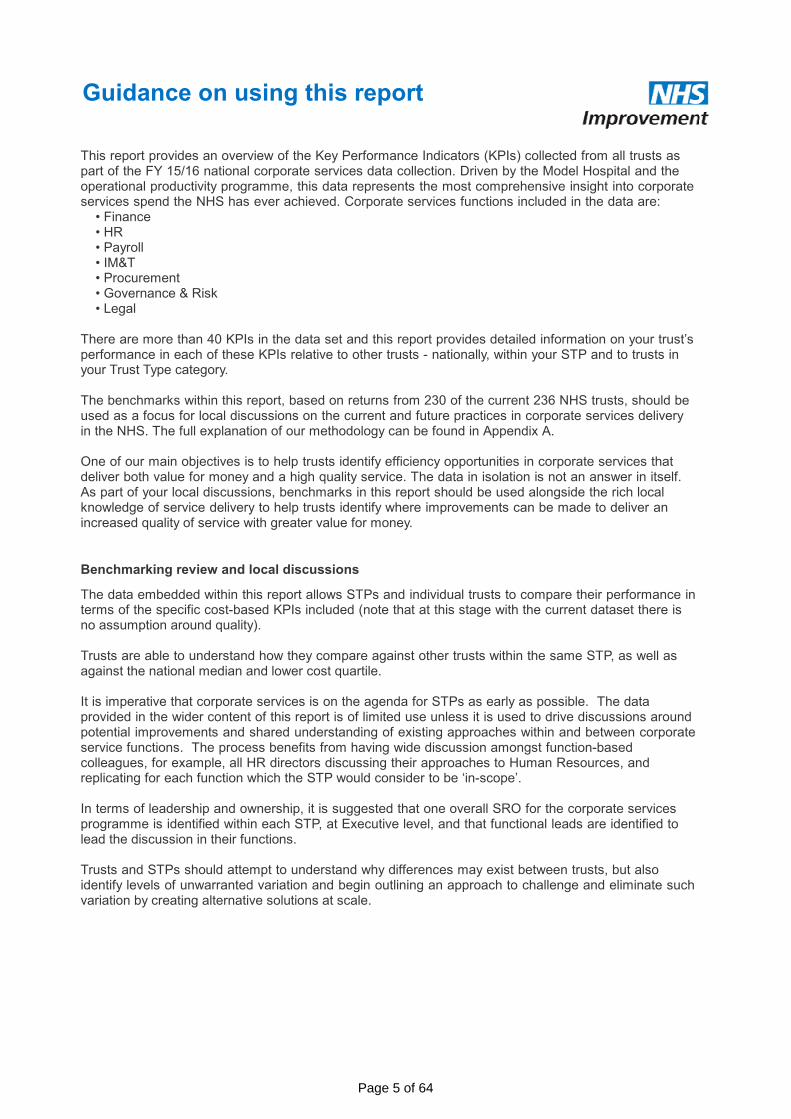
This report provides an overview of the Key Performance Indicators (KPIs) collected from all trusts as part of the FY 15/16 national corporate services data collection. Driven by the Model Hospital and the operational productivity programme, this data represents the most comprehensive insight into corporate services spend the NHS has ever achieved. Corporate services functions included in the data are: • Finance • HR • Payroll • IM&T • Procurement • Governance & Risk • Legal
There are more than 40 KPIs in the data set and this report provides detailed information on your trust’s performance in each of these KPIs relative to other trusts - nationally, within your STP and to trusts in your Trust Type category.
The benchmarks within this report, based on returns from 230 of the current 236 NHS trusts, should be used as a focus for local discussions on the current and future practices in corporate services delivery in the NHS. The full explanation of our methodology can be found in Appendix A.
One of our main objectives is to help trusts identify efficiency opportunities in corporate services that deliver both value for money and a high quality service. The data in isolation is not an answer in itself. As part of your local discussions, benchmarks in this report should be used alongside the rich local knowledge of service delivery to help trusts identify where improvements can be made to deliver an increased quality of service with greater value for money.
Guidance on using this report
Benchmarking review and local discussions
The data embedded within this report allows STPs and individual trusts to compare their performance in terms of the specific cost-based KPIs included (note that at this stage with the current dataset there is no assumption around quality).
Trusts are able to understand how they compare against other trusts within the same STP, as well as against the national median and lower cost quartile.
It is imperative that corporate services is on the agenda for STPs as early as possible. The data provided in the wider content of this report is of limited use unless it is used to drive discussions around potential improvements and shared understanding of existing approaches within and between corporate service functions. The process benefits from having wide discussion amongst function-based colleagues, for example, all HR directors discussing their approaches to Human Resources, and replicating for each function which the STP would consider to be ‘in-scope’.
In terms of leadership and ownership, it is suggested that one overall SRO for the corporate services programme is identified within each STP, at Executive level, and that functional leads are identified to lead the discussion in their functions.
Trusts and STPs should attempt to understand why differences may exist between trusts, but also identify levels of unwarranted variation and begin outlining an approach to challenge and eliminate such variation by creating alternative solutions at scale.
Page 5 of 64

NHS Improvement has nominated four STP leads who will act as Pathfinders for the programme. The Pathfinders will be supported to help design the blueprints for high quality, good value for money corporate services in the NHS. The rationale behind this approach has been that there will be different ways to deliver successful corporate services solutions, however scale is essential and therefore pathfinders are helping to test the hypothesis that STP footprints provide a sensible basis for addressing the challenge.
Learning from our pathfinder approach to date, we envisage it to support other STPs in laying the foundations for their own corporate services programme, recognising the amount of complexity involved and the varying starting points.
The four lead Pathfinders are following a standard method to develop their future solutions, which is being refined through the work they are doing. This will be shared with other STPs, which will significantly reduce the cost and risk involved in future scale replication across the Corporate Services programme.
Pathfinders approach
Understanding the Current Landscape - further discussion within your STP
In order to supplement the benchmarking data, a useful exercise undertaken by Pathfinders has been mapping out the delivery models currently employed at each trust for every function and sub-function. This has helped define locally what corporate service functions are in scope.
This landscape view enables trusts and STPs to understand the experience in the patch for operating in-house, shared services or outsourcing models and discuss shared experience and lessons learned.
Extending this exercise to include current systems and technology in place will allow STPs to take a view on where similar services are provided at varying levels of cost and embark upon their journey to design and implement sustainable solutions, whilst identifying significant savings opportunities.
Following the local discussions, this benchmarking report complemented by local knowledge should significantly strengthen awareness of a geographical approach to your STP’s corporate services, existing strengths and weaknesses and the opportunities for positive, and potentially radical, change.
Page 6 of 64
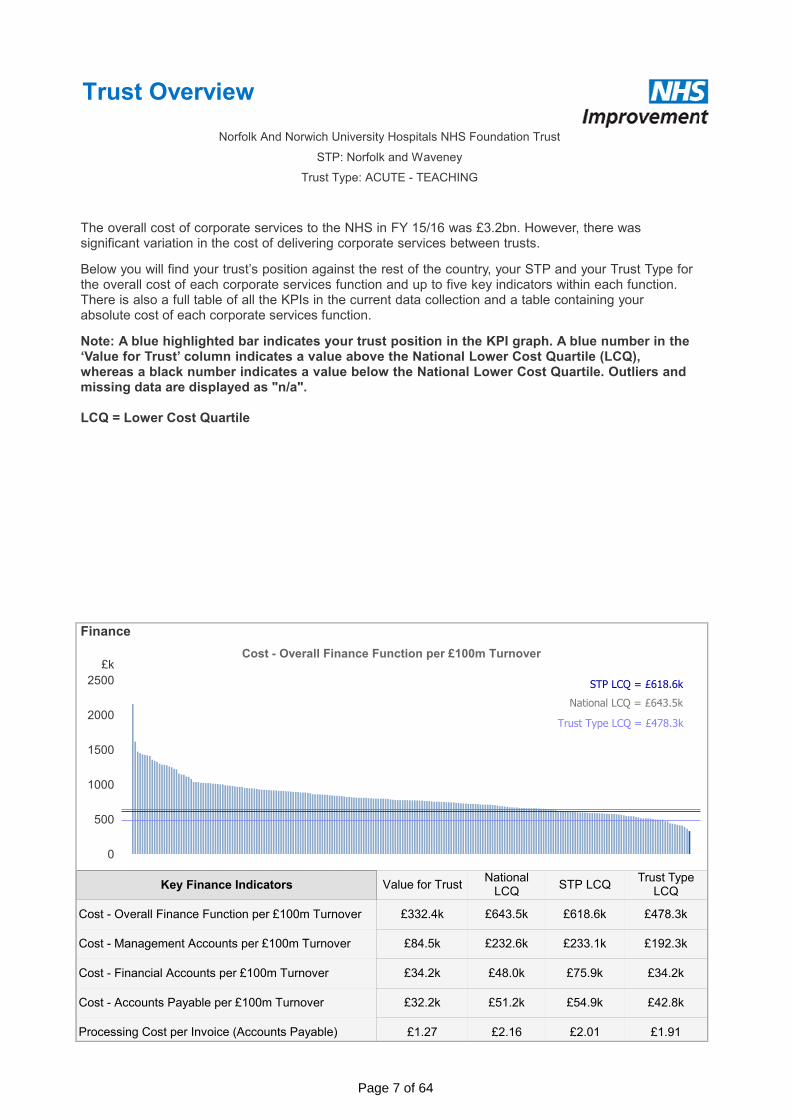
Trust Overview
£k
0
500
1000
1500
2000
2500
Cost - Overall Finance Function per £100m Turnover
National LCQ = £643.5k
STP LCQ = £618.6k
Trust Type LCQ = £478.3k
£332.4k £643.5k £618.6k £478.3k
£84.5k £232.6k £233.1k £192.3k
£34.2k £48.0k £75.9k £34.2k
£32.2k £51.2k £54.9k £42.8k
£1.27 £2.16 £2.01 £1.91
Cost - Overall Finance Function per £100m Turnover
Cost - Management Accounts per £100m Turnover
Cost - Financial Accounts per £100m Turnover
Cost - Accounts Payable per £100m Turnover
Processing Cost per Invoice (Accounts Payable)
Value for TrustNational
LCQSTP LCQ
Trust Type LCQ
Key Finance Indicators
Finance
The overall cost of corporate services to the NHS in FY 15/16 was £3.2bn. However, there was significant variation in the cost of delivering corporate services between trusts.
Below you will find your trust’s position against the rest of the country, your STP and your Trust Type for the overall cost of each corporate services function and up to five key indicators within each function. There is also a full table of all the KPIs in the current data collection and a table containing your absolute cost of each corporate services function.
Norfolk And Norwich University Hospitals NHS Foundation Trust
STP: Norfolk and Waveney
Trust Type: ACUTE - TEACHING
Note: A blue highlighted bar indicates your trust position in the KPI graph. A blue number in the ‘Value for Trust’ column indicates a value above the National Lower Cost Quartile (LCQ), whereas a black number indicates a value below the National Lower Cost Quartile. Outliers and missing data are displayed as "n/a".
LCQ = Lower Cost Quartile
Page 7 of 64
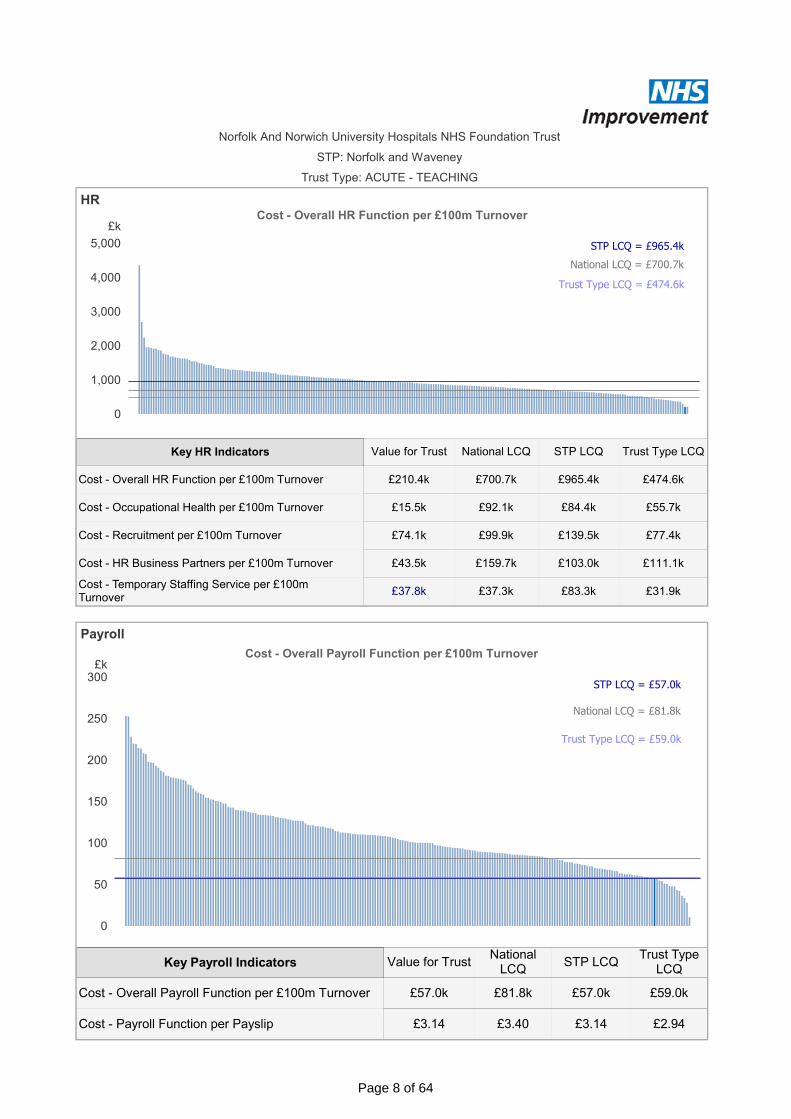
£k
0
50
100
150
200
250
300
Cost - Overall Payroll Function per £100m Turnover
National LCQ = £81.8k
STP LCQ = £57.0k
Trust Type LCQ = £59.0k
£57.0k £81.8k £57.0k £59.0k
£3.14 £3.40 £3.14 £2.94
Cost - Overall Payroll Function per £100m Turnover
Cost - Payroll Function per Payslip
Value for TrustNational
LCQSTP LCQ
Trust Type LCQ
Key Payroll Indicators
Norfolk And Norwich University Hospitals NHS Foundation Trust
STP: Norfolk and Waveney
Trust Type: ACUTE - TEACHING
HR
£k
0
1,000
2,000
3,000
4,000
5,000
Cost - Overall HR Function per £100m Turnover
National LCQ = £700.7k
STP LCQ = £965.4k
Trust Type LCQ = £474.6k
Payroll
£210.4k £700.7k £965.4k £474.6k
£15.5k £92.1k £84.4k £55.7k
£74.1k £99.9k £139.5k £77.4k
£43.5k £159.7k £103.0k £111.1k
£37.8k £37.3k £83.3k £31.9k
Cost - Overall HR Function per £100m Turnover
Cost - Occupational Health per £100m Turnover
Cost - Recruitment per £100m Turnover
Cost - HR Business Partners per £100m Turnover
Cost - Temporary Staffing Service per £100m Turnover
Value for Trust National LCQ STP LCQ Trust Type LCQKey HR Indicators
Page 8 of 64
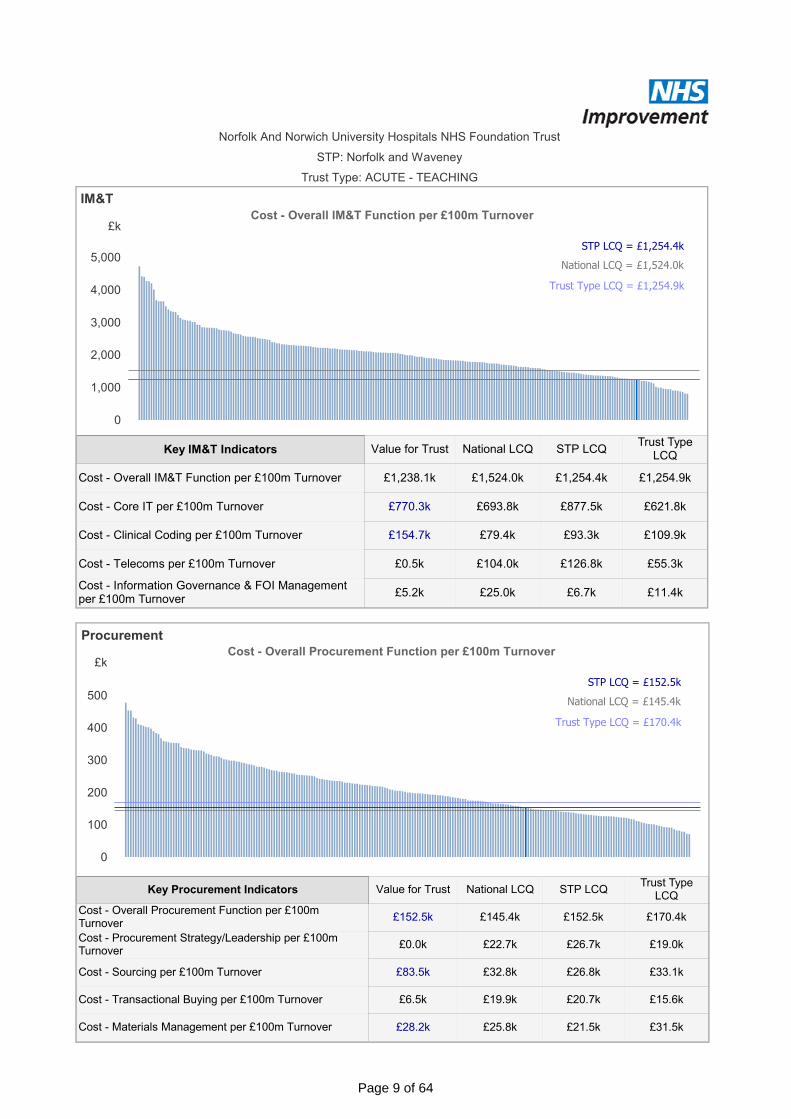
Norfolk And Norwich University Hospitals NHS Foundation Trust
STP: Norfolk and Waveney
Trust Type: ACUTE - TEACHING
£k
0
1,000
2,000
3,000
4,000
5,000
Cost - Overall IM&T Function per £100m Turnover
National LCQ = £1,524.0k
STP LCQ = £1,254.4k
Trust Type LCQ = £1,254.9k
IM&T
£1,238.1k £1,524.0k £1,254.4k £1,254.9k
£770.3k £693.8k £877.5k £621.8k
£154.7k £79.4k £93.3k £109.9k
£0.5k £104.0k £126.8k £55.3k
£5.2k £25.0k £6.7k £11.4k
Cost - Overall IM&T Function per £100m Turnover
Cost - Core IT per £100m Turnover
Cost - Clinical Coding per £100m Turnover
Cost - Telecoms per £100m Turnover
Cost - Information Governance & FOI Management per £100m Turnover
Value for Trust National LCQ STP LCQTrust Type
LCQKey IM&T Indicators
Procurement
£k
0
100
200
300
400
500
Cost - Overall Procurement Function per £100m Turnover
National LCQ = £145.4k
STP LCQ = £152.5k
Trust Type LCQ = £170.4k
£152.5k £145.4k £152.5k £170.4k
£0.0k £22.7k £26.7k £19.0k
£83.5k £32.8k £26.8k £33.1k
£6.5k £19.9k £20.7k £15.6k
£28.2k £25.8k £21.5k £31.5k
Cost - Overall Procurement Function per £100m Turnover
Cost - Procurement Strategy/Leadership per £100m Turnover
Cost - Sourcing per £100m Turnover
Cost - Transactional Buying per £100m Turnover
Cost - Materials Management per £100m Turnover
Value for Trust National LCQ STP LCQTrust Type
LCQKey Procurement Indicators
Page 9 of 64

Norfolk And Norwich University Hospitals NHS Foundation Trust
STP: Norfolk and Waveney
Trust Type: ACUTE - TEACHING
Governance & Risk
£k
0
500
1,000
1,500
Cost - Overall Governance & Risk Function per £100m Turnover
National LCQ = £451.4k
STP LCQ = £571.2k
Trust Type LCQ = £310.5k
£k
0
100
200
300
400
500
Cost - Overall Legal Function per £100m Turnover
National LCQ = £55.4k
STP LCQ = £89.4k
Trust Type LCQ = £37.3k
£349.9k £451.4k £571.2k £310.5k
£241.6k £246.6k £367.2k £150.9k
£45.9k £67.8k £56.1k £45.1k
£33.7k £42.1k £33.7k £25.4k
£28.6k £55.6k £64.5k £31.7k
Cost - Overall Governance & Risk Function per £100m Turnover
Cost - Clinical Governance per £100m Turnover
Cost - Risk Management per £100m Turnover
Cost - Complaints Service per £100m Turnover
Cost - Admin Support to CEO & Directors per £100m Turnover
Value for Trust National LCQ STP LCQ Trust Type LCQKey Governance & Risk Indicators
£37.6k £55.4k £89.4k £37.3kCost - Overall Legal Function per £100m Turnover
Value for Trust National LCQ STP LCQTrust Type
LCQKey Legal Indicators
Legal
Page 10 of 64
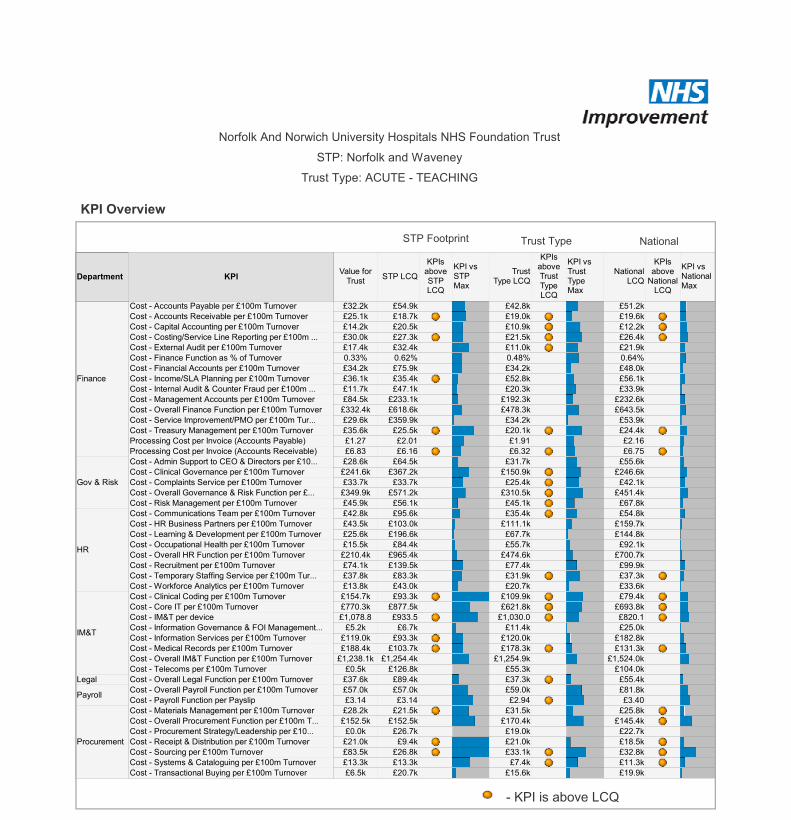
£1,802.4k
£155.0k
£1,310.0k
£183.0k
£249.0k
£1,141.0k
£6,713.1k
£204.0k
£309.0k
£827.0k
Finance
Gov & Risk
HR
IM&T
Legal
Payroll
Procurement
Cost - Overall Finance Function
Cost - Admin Support to CEO & Directors
Cost - Clinical Governance
Cost - Complaints Service
Cost - Risk Management
Cost - Overall HR Function
Cost - Overall IM&T Function
Cost - Overall Legal Function
Cost - Overall Payroll Function
Cost - Overall Procurement Function
Value for TrustDepartment KPI
STP: Norfolk and Waveney
£32.2k £54.9k £42.8k £51.2k
£25.1k £18.7k £19.0k £19.6k
£14.2k £20.5k £10.9k £12.2k
£30.0k £27.3k £21.5k £26.4k
£17.4k £32.4k £11.0k £21.9k
0.33% 0.62% 0.48% 0.64%
£34.2k £75.9k £34.2k £48.0k
£36.1k £35.4k £52.8k £56.1k
£11.7k £47.1k £20.3k £33.9k
£84.5k £233.1k £192.3k £232.6k
£332.4k £618.6k £478.3k £643.5k
£29.6k £359.9k £34.2k £53.9k
£35.6k £25.5k £20.1k £24.4k
£1.27 £2.01 £1.91 £2.16
£6.83 £6.16 £6.32 £6.75
£28.6k £64.5k £31.7k £55.6k
£241.6k £367.2k £150.9k £246.6k
£33.7k £33.7k £25.4k £42.1k
£349.9k £571.2k £310.5k £451.4k
£45.9k £56.1k £45.1k £67.8k
£42.8k £95.6k £35.4k £54.8k
£43.5k £103.0k £111.1k £159.7k
£25.6k £196.6k £67.7k £144.8k
£15.5k £84.4k £55.7k £92.1k
£210.4k £965.4k £474.6k £700.7k
£74.1k £139.5k £77.4k £99.9k
£37.8k £83.3k £31.9k £37.3k
£13.8k £43.0k £20.7k £33.6k
£154.7k £93.3k £109.9k £79.4k
£770.3k £877.5k £621.8k £693.8k
£1,078.8 £933.5 £1,030.0 £820.1
£5.2k £6.7k £11.4k £25.0k
£119.0k £93.3k £120.0k £182.8k
£188.4k £103.7k £178.3k £131.3k
£1,238.1k £1,254.4k £1,254.9k £1,524.0k
£0.5k £126.8k £55.3k £104.0k
£37.6k £89.4k £37.3k £55.4k
£57.0k £57.0k £59.0k £81.8k
£3.14 £3.14 £2.94 £3.40
£28.2k £21.5k £31.5k £25.8k
£152.5k £152.5k £170.4k £145.4k
£0.0k £26.7k £19.0k £22.7k
£21.0k £9.4k £21.0k £18.5k
£83.5k £26.8k £33.1k £32.8k
£13.3k £13.3k £7.4k £11.3k
£6.5k £20.7k £15.6k £19.9k
Finance
Gov & Risk
HR
IM&T
Legal
Payroll
Procurement
Cost - Accounts Payable per £100m Turnover
Cost - Accounts Receivable per £100m Turnover
Cost - Capital Accounting per £100m Turnover
Cost - Costing/Service Line Reporting per £100m ...
Cost - External Audit per £100m Turnover
Cost - Finance Function as % of Turnover
Cost - Financial Accounts per £100m Turnover
Cost - Income/SLA Planning per £100m Turnover
Cost - Internal Audit & Counter Fraud per £100m ...
Cost - Management Accounts per £100m Turnover
Cost - Overall Finance Function per £100m Turnover
Cost - Service Improvement/PMO per £100m Tur...
Cost - Treasury Management per £100m Turnover
Processing Cost per Invoice (Accounts Payable)
Processing Cost per Invoice (Accounts Receivable)
Cost - Admin Support to CEO & Directors per £10...
Cost - Clinical Governance per £100m Turnover
Cost - Complaints Service per £100m Turnover
Cost - Overall Governance & Risk Function per £...
Cost - Risk Management per £100m Turnover
Cost - Communications Team per £100m Turnover
Cost - HR Business Partners per £100m Turnover
Cost - Learning & Development per £100m Turnover
Cost - Occupational Health per £100m Turnover
Cost - Overall HR Function per £100m Turnover
Cost - Recruitment per £100m Turnover
Cost - Temporary Staffing Service per £100m Tur...
Cost - Workforce Analytics per £100m Turnover
Cost - Clinical Coding per £100m Turnover
Cost - Core IT per £100m Turnover
Cost - IM&T per device
Cost - Information Governance & FOI Management...
Cost - Information Services per £100m Turnover
Cost - Medical Records per £100m Turnover
Cost - Overall IM&T Function per £100m Turnover
Cost - Telecoms per £100m Turnover
Cost - Overall Legal Function per £100m Turnover
Cost - Overall Payroll Function per £100m Turnover
Cost - Payroll Function per Payslip
Cost - Materials Management per £100m Turnover
Cost - Overall Procurement Function per £100m T...
Cost - Procurement Strategy/Leadership per £10...
Cost - Receipt & Distribution per £100m Turnover
Cost - Sourcing per £100m Turnover
Cost - Systems & Cataloguing per £100m Turnover
Cost - Transactional Buying per £100m Turnover
Value for Trust
STP LCQ
KPIs above STP LCQ
KPI vs STP Max
Trust Type LCQ
KPIs above Trust Type LCQ
KPI vs Trust Type Max
National LCQ
KPIs above
National LCQ
KPI vs National Max
Department KPI
Norfolk And Norwich University Hospitals NHS Foundation Trust
- KPI is above LCQ
NationalTrust TypeSTP Footprint
KPI Overview
Trust Type: ACUTE - TEACHING
Cost Overview
Page 11 of 64

IntegratedPerformance Report
March 2017 (February data)
Format/Presentational Changes this month: None

Quality and Safety SummaryCore Slide 2
*SHMI data is updated quarterly by NHS Digital
Quality & Safety Outturn 2015/16 Monthly Target Feb‐17 6 month trend YTD 2015/16 YTD 2016/17Mortality Core Slide 42 Deaths / 100 discharges 1.7 n/a 1.33 1.51 1.33
Incidents Core Slide 5‐63 Serious Incidents 154 n/a 6 138 1054 Incident Reporting 15499 n/a 1336 14062 141965 Zero insulin errors causing NPSA category moderate harm or above 3 0 0 3 16 Medication Errors 1431 n/a 75 1301 11587 Patient Falls causing moderate harm or above 42 n/a 2 40 328 Never Events 5 0 0 4 5
Pressure Ulcers Core Slide 79 Grade 2 hospital acquired pressure ulcers 151 n/a 12 136 14410 Grade 3 hospital acquired pressure ulcers 58 n/a 6 51 4611 Grade 4 hospital acquired pressure ulcers 3 0 0 3 3Infection Control Core Slide 812 HAI C. difficile Cases (excluding non‐trajectory and pending cases) 32 n/a 0 25 1913 Zero Hospital Acquired MRSA bacteraemia 2 0 0 0 0Other14 EDL to be completed within 24 hours in 95% of discharges 74.01% 95.00% 71.75% 74.40% 69.85%15 Harm Free Care 91.18% n/a 91.43% 91.35% 92.19%16 Patients 'extremely likely' or 'likely' to recommend our service to friends and family 90.92% 100.00% 96.91% 90.36% 95.98%17 Complaints 933 n/a 55 837 874
Quality & Safety Target Oct 2015 to Sep 2016 2015/16 2016/17Mortality Core Slide 41 SHMI* N/A 1.090 1.056 N/A

Quality Priorities – Patient Safety
Quality Priorities – Clinical Effectiveness
Quality Priorities – Patient Experience
Core Slide 3
Quality Priorities ‐ Patient Experience Measure Lead Outturn 2015/16 Monthly Target Feb‐17 6 month trend YTD 2015/16 YTD 2016/17
1Treat Patients with privacy and dignity
Patients 'extremely likely' or 'likely' to recommend our service to friends and family
Emma McKay 90.92% 100.00% 96.91% 90.36% 95.98%
2Dementia Friendly/Mental Capacity/Learning Disability
2015/16 CQUIN criteria Emma McKay #N/A n/a TBC #N/A #N/A
3
Improved continuity of care and experience through reduced ward moves and reduced numbers of outliers
No more than 20 patients recorded as boarders. Monthly average
Richard Parker 523 20 65 458 500
4 Improved discharge processes EDL to be completed within 24 hours in 95% of discharges Richard Parker 74.01% 95.00% 71.75% 74.40% 69.85%
Quality Priorities ‐ Clinical Effectiveness Measure Lead Outturn 2015/16 Monthly Target Feb‐17 6 month trend YTD 2015/16 YTD 2016/17
1Acute Kidney Injury ‐Communication with GPs
EDL to contain evidence of required communication as judged by CQUIN criteria
Peter Chapman
n/a n/a TBC
2 Keeping patients safe from infectionHAI C. difficile Cases (excluding non‐trajectory and pending cases)
Emma McKay 32 n/a 0 25 19
3 Keeping patients safe from infection Zero Hospital Acquired MRSA bacteraemia Emma McKay 2 0 0 0 0
4Improve quality of care through research
Year on year increase in patients recruited into research studies. Aim to recruit 5000 into research studies in 2016‐17.
Peter Chapman
0 417 62 0 4216
5 Timely medical review of all patients % of Patients with a Senior Review recorded by 12:00 Richard Parker #N/A n/a TBC
6 Timely medical review of all patients Average number of patients with LoS >14 days Richard Parker 0 200 234 0 234
Quality Priorities ‐ Patient Safety Measure Lead Outturn 2015/16 Monthly Target Feb‐17 6 month trend YTD 2015/16 YTD 2016/17
1 Reduction in medication errorsZero insulin errors causing NPSA category moderate harm or above
Peter Chapman 3 0 0 3 1
% of Sepsis patients screened Peter Chapman
64.52% 90.00% TBC 62.69%
% of Sepsis patients treated Peter 49.79% 90.00% TBC 45.66%
3Keeping patients safe from hospital acquired thrombosis
95% compliance with TRA assessment as evidenced on EPMA. (and audit of appropriate actions)
Peter Chapman 91.82% 95.00% 99.55% 91.32% 88.94%
4Incident reporting and management
NNUH duty of candour compliancePeter Chapman 100.00% 100.00% 100.00% 100.00% 100.00%
5Incident reporting and management*
Remain within top quartile of acute trusts for incident reporting on NLRS
Peter Chapman
n/a 34/136 36/136 n/a n/a
2Prompt recognition and treatment of sepsis
*The most recently published incident reporting rate for the Trust is 44.23 incidents per 1,000 bed days (for incidents reported to the NRLS between October 2015 and March 2016). When comparing this figure against 136 other Acute (non‐ specialist) organisations within our cluster, the median reporting rate for the cluster is 39.31 incidents per 1,000 bed days and the NNUH is ranked at 36th out of 136 and is currently sitting one place underneath the highest 25% of reporters.

HSMR
Apr May Jun Jul Aug Sep Oct Nov Dec Jan Feb Mar2015/16 111.80 111.95 112.16 112.75 112.55 112.72 113.51 113.03 109.90 108.45 108.87 111.01
2016/17 113.98 113.72 114.14 114.41 115.15 114.70 112.24 111.57
Target 100 100 100 100 100 100 100 100 100 100 100 100
60
80
100
120
140
2015/16 2016/17 Target
Quality & Safety (Mortality) – Lead Director Peter ChapmanCore Slide 4
1. HSMR is the risk adjusted ratio of observed to expected in-hospital deaths within 56 clinical groups and is presented as the reported HSMR for each year prior to themonth in question. For the year to Nov 2016 this was 112 – reduced for two successive months and than previous year but is still higher than expected.2. SHMI is based upon HSCIC data and is the ratio between the actual number of people who die following hospitalisation at a Trust and the number who would beexpected to die on the basis of England average figures given the characteristics of patients treated there. SHMI is 109 to Nov 2016 and remains within the expected rangethough it continues on an upward trend.3. Crude mortality within 30 days in December 2016 was 2..44%. This is slightly higher than the previous month (2.41%). This lower than Dec 2015 and on a downwardtrend since Jan 16 but with an expected seasonal increase since Aug 16.4. HSMR basket monitoring – one group flagged with outlying mortality rising over last three months (deficiency and other anaemia). Sepsis mortality which triggered inNov 16 now below average for Dec 16.5. Continued marked drop in mortality from lobar pneumonia in Dec 16 following the previous 9 months of below average mortality.6. Fractured neck of femur pathway MDT review group now formed with mortality review underway in this group. Themed learning will be disseminated through clinicalgovernance leads.7. Potentially Preventable Death review process is agreed and implemented and clinician training undertaken. NHS England commissioned RCP standardised mortalityreview agreed as format. Most recent themes – AKI management / EWS response / interface between ED and AMU. CQC report: “Learning, candour and accountability”reviewed and action plan/policy in progress.8. Improving patient flow and >4hr waits in ED by improving processes of care through implementation of SAFER bundle considered to be vital in reducing overall HSMRand SHMI. Red to Green day now implemented on 5 “exemplar” wards.
SHMI
90
94
98
102
106
110
Jan 2011
to Dec 2011
Apr 2
011 to M
ar 2012
Jul 2011 to Ju
n 2012
Oct 201
1 to Sep
2012
Jan 2012
to Dec 2012
Apr 2
012 to M
ar 2013
Jul 2012 to Ju
n 2013
Oct 201
2 to Sep
2013
Jan 2013
to Dec 2013
Apr 2
013 to M
ar 2014
Jul 2013 to Ju
n 2014
Oct 201
3 to Sep
2014
Jan 2014
to Dec 2014
Apr 2
014 to M
ar 2015
Jul 2014 to Ju
n 2015
Oct 201
4 to Sep
2015
Jan 2015
to Dec 2015
Apr 2
015 to M
ar 2016
Jul 2015 to Ju
n 2016
Oct 201
5 to Sep
2016
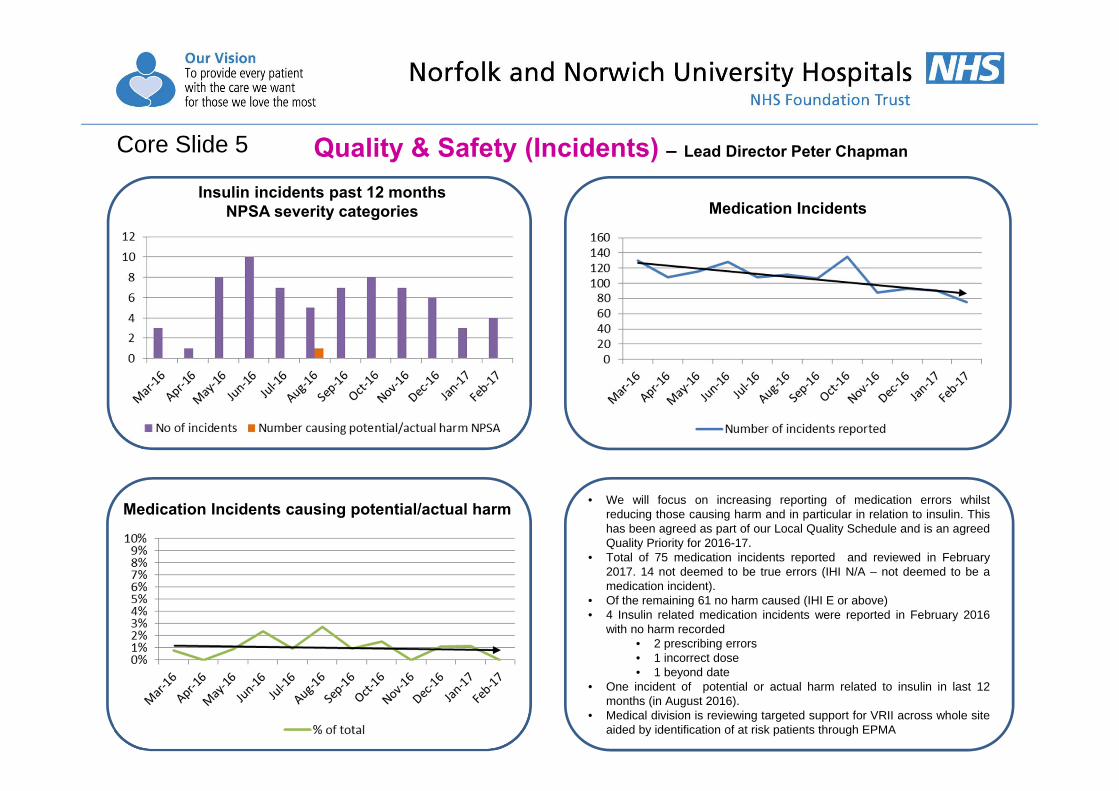
Medication IncidentsInsulin incidents past 12 months
NPSA severity categories
Quality & Safety (Incidents) – Lead Director Peter Chapman
Medication Incidents causing potential/actual harm
Core Slide 5
• We will focus on increasing reporting of medication errors whilstreducing those causing harm and in particular in relation to insulin. Thishas been agreed as part of our Local Quality Schedule and is an agreedQuality Priority for 2016-17.
• Total of 75 medication incidents reported and reviewed in February2017. 14 not deemed to be true errors (IHI N/A – not deemed to be amedication incident).
• Of the remaining 61 no harm caused (IHI E or above)• 4 Insulin related medication incidents were reported in February 2016
with no harm recorded• 2 prescribing errors• 1 incorrect dose• 1 beyond date
• One incident of potential or actual harm related to insulin in last 12months (in August 2016).
• Medical division is reviewing targeted support for VRII across whole siteaided by identification of at risk patients through EPMA
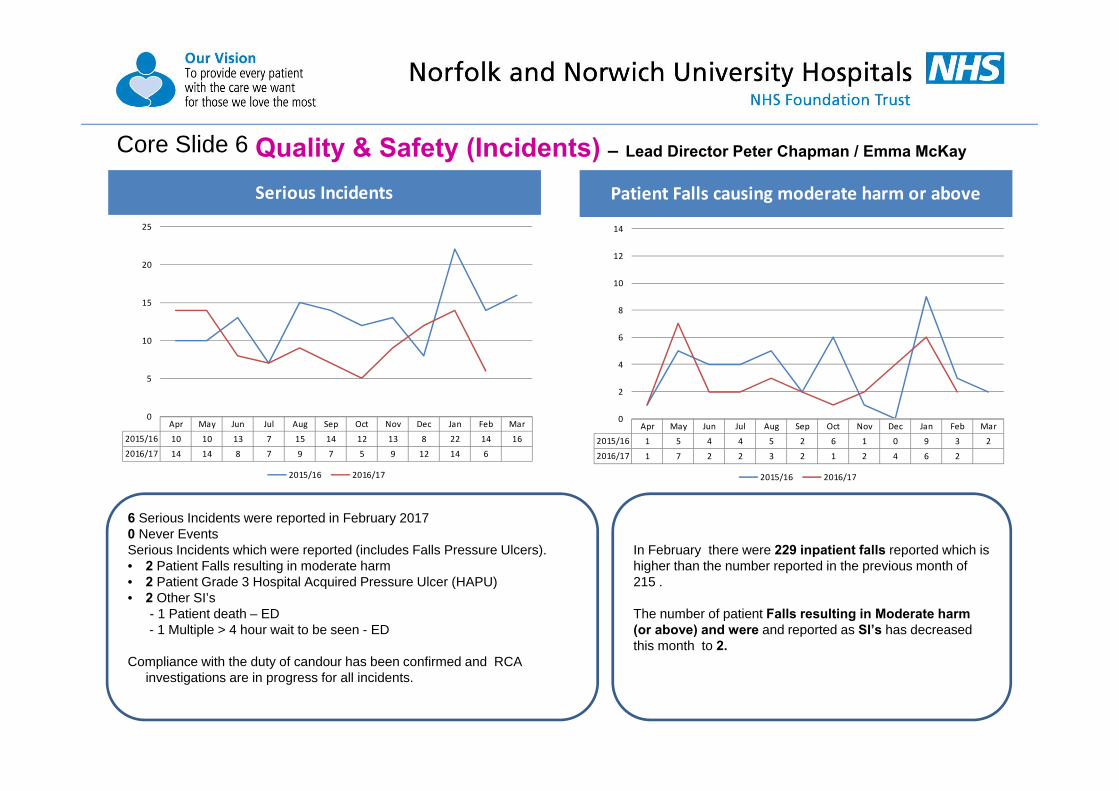
Quality & Safety (Incidents) – Lead Director Peter Chapman / Emma McKayCore Slide 6
Serious Incidents
Apr May Jun Jul Aug Sep Oct Nov Dec Jan Feb Mar
2015/16 10 10 13 7 15 14 12 13 8 22 14 16
2016/17 14 14 8 7 9 7 5 9 12 14 6
0
5
10
15
20
25
2015/16 2016/17
Patient Falls causing moderate harm or above
Apr May Jun Jul Aug Sep Oct Nov Dec Jan Feb Mar
2015/16 1 5 4 4 5 2 6 1 0 9 3 2
2016/17 1 7 2 2 3 2 1 2 4 6 2
0
2
4
6
8
10
12
14
2015/16 2016/17
6 Serious Incidents were reported in February 20170 Never EventsSerious Incidents which were reported (includes Falls Pressure Ulcers).• 2 Patient Falls resulting in moderate harm• 2 Patient Grade 3 Hospital Acquired Pressure Ulcer (HAPU) • 2 Other SI’s
- 1 Patient death – ED- 1 Multiple > 4 hour wait to be seen - ED
Compliance with the duty of candour has been confirmed and RCA investigations are in progress for all incidents.
In February there were 229 inpatient falls reported which is higher than the number reported in the previous month of 215 .
The number of patient Falls resulting in Moderate harm (or above) and were and reported as SI’s has decreased this month to 2.

Quality & Safety (Pressure Ulcers) – Lead Director Emma McKayCore Slide 7
Grade 2 hospital acquired pressure ulcers
Apr May Jun Jul Aug Sep Oct Nov Dec Jan Feb Mar2015/16 17 8 9 25 12 10 8 5 10 10 22 15
2016/17 15 9 11 7 8 12 16 15 19 20 12
0
5
10
15
20
25
30
2015/16 2016/17
Grade 3/4 hospital acquired pressure ulcers
Apr May Jun Jul Aug Sep Oct Nov Dec Jan Feb Mar2015/16 3 5 5 3 7 9 3 4 4 3 5 7
2016/17 9 3 0 5 3 3 4 5 5 3 6
0
5
10
15
20
25
30
2015/16 2016/17
Learning from RCA investigations: the completion of records overall • Escalation to senior staff to ensure accurate grading of PU is identified.• Staff to ensure consistent documentation regarding skin inspections.• Staff to ensure TED stockings are removed daily for skin inspection and that this is recorded.• Information pack has been developed with all relevant information leaflets e.g. pressure ulcer, falls. Staff to provide on admission to the patient
and / or relatives.
The total number of Grade 2 hospital acquired pressure ulcers reported in February was 12 which is significantly less than the previous month (20). RCA investigations were undertaken and peer review found that 6 of these were Avoidable and 6 were Unavoidable.6 patients developed a Grade 3 hospital acquired pressure ulcer in February, RCA investigations found that 4 of these were Avoidable. 2were found to be Unavoidable.

Quality & Safety (Infection Control) – Lead Director Emma McKayCore Slide 8
Following the post infection review [PIR] meeting with Trust and CCG’s representatives each hospital acquired case of C. difficile is:‐ Trajectory deemed to have lapses in care Non‐Trajectory Deemed to have no lapses in care Pending cases are either awaiting the PIR meeting or the CCG’s
have requested further information
HAI C. difficile Cases (excluding non‐trajectory and pending cases)
Apr May Jun Jul Aug Sep Oct Nov Dec Jan Feb Mar
2015/16 3 0 3 3 1 4 1 5 1 3 1 7
2016/17 2 1 1 4 3 2 2 1 1 2 0
0
2
4
6
8
10
12
2015/16 2016/17
Issues Following the monthly post infection review meeting the 4 pending cases of hospital acquired C. difficile from January were reviewed. Two cases were deemed non-trajectory and two cases trajectory.
The 2 cases of C. difficile identified as hospital acquired in February were deemed as non-trajectory .
ActionsTeams are reminded to be vigilant in isolating patients in a side room at onset of symptoms and the importance of documenting rationale if unable to isolate. Teams also reminded of the importance of daily bowel documentation. Compliance with the Hand Hygiene policy & five moments of hand hygiene.

Safety Thermometer Dashboard – Lead Director Emma McKayCore Slide 9
The number of New harms reported at the Trust via the Safety Thermometer in February at 1.18 % is lower than the national figure for All Acute New Harms which is 2.16%.
In the comparison table above which lists the national figure (All Acute) and eight peer organisations the Trust continues to have a low percentage ofreported harms for the following:
• Falls with harm 0.21% (0.41% All acute)• New Pressure Ulcers 0.64% (0.87% All acute)• New VTE’s 0.43% (0.60% All acute)
There were no reported harms associated with Catheters & New UTUI’s at the Trust during February (0.32% All Acute)
The overall harm free care figure for the Trust of 91.43% appears lower than the other peer Trusts this month. This is due to the number of Old pressure ulcer harms which is 7.72%.
Pressure Ulcers ‐ New
Falls with Harm
Catheters & New UTI's
New VTE's
ALL New Harms
UCH Harm Free CarePressure Ulcers ‐ New 773 0.87% 6 0.64% 17 1.05% 3 0.34% 10 0.70% 0 0.00% 2 0.27% 28 1.79% 8 1.01% 6 0.85%Falls with Harm 366 0.41% 2 0.21% 12 0.74% 2 0.23% 1 0.07% 0 0.00% 5 0.68% 5 0.32% 2 0.25% 1 0.14%Catheters & NEW UTI's 281 0.32% 0 0.00% 3 0.19% 13 1.47% 1 0.07% 5 0.75% 5 0.27% 5 0.32% 1 0.13% 0 0.00%New VTE's 532 0.60% 4 0.43% 11 0.68% 2 0.23% 12 0.84% 1 0.15% 14 1.91% 14 0.90% 8 1.01% 7 0.99%New Harms 1915 2.16% 11 1.18% 43 2.65% 20 2.27% 24 1.68% 6 0.90% 51 3.13% 51 3.27% 19 2.39% 14 1.98%No. Pt's in sample
93.23% 93.19% 93.40%
665 734 1,560
91.96% 95.76%
86626 853 1,621 883 1,428 796 707
Royal Free Royal Liver Sheff Teach Univ South Man93.79% 91.43% 93.46% 93.88% 95.38%All Acute NNUH Barts Health Bright&Suss Nott Univ
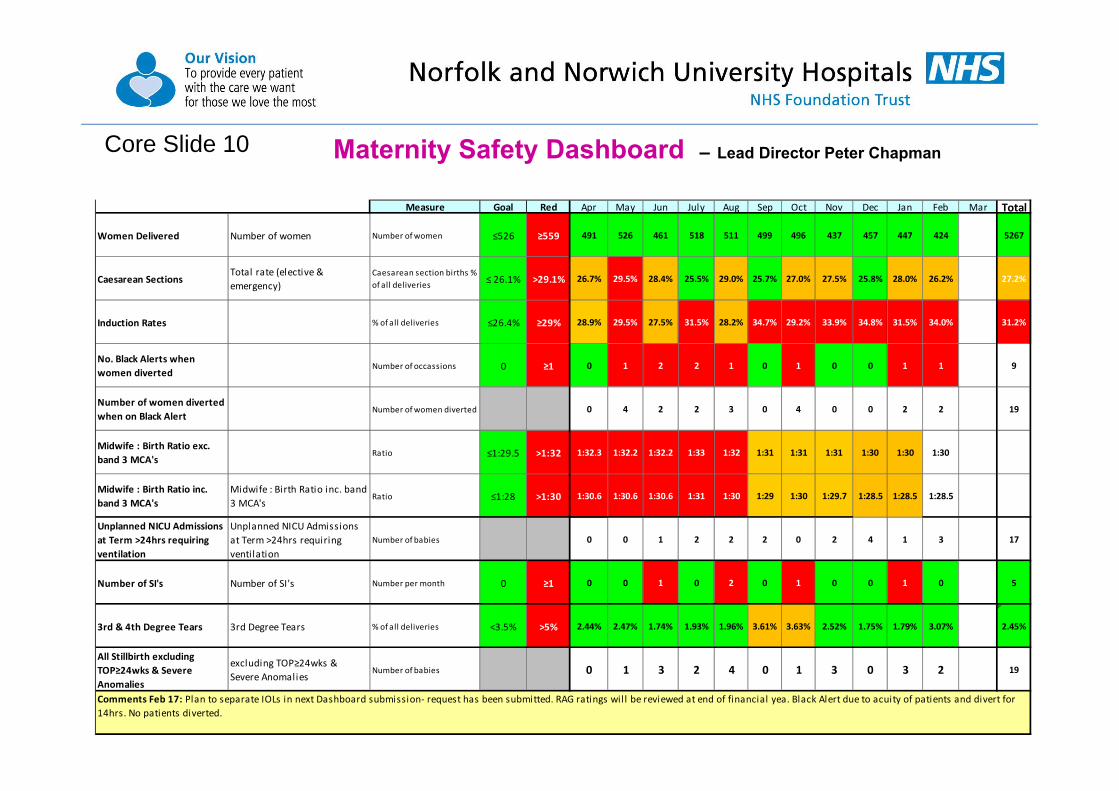
Maternity Safety Dashboard – Lead Director Peter ChapmanCore Slide 10
Measure Goal Red Apr May Jun July Aug Sep Oct Nov Dec Jan Feb Mar Total
Women Delivered Number of women Number of women ≤526 ≥559 491 526 461 518 511 499 496 437 457 447 424 0 5267
Caesarean SectionsTotal rate (elective & emergency)
Caesarean section births % of all deliveries ≤ 26.1% >29.1% 26.7% 29.5% 28.4% 25.5% 29.0% 25.7% 27.0% 27.5% 25.8% 28.0% 26.2% 27.2%
Induction Rates % of all deliveries ≤26.4% ≥29% 28.9% 29.5% 27.5% 31.5% 28.2% 34.7% 29.2% 33.9% 34.8% 31.5% 34.0% 31.2%
No. Black Alerts when women diverted
Number of occassions 0 ≥1 0 1 2 2 1 0 1 0 0 1 1 9
Number of women diverted when on Black Alert
Number of women diverted 0 4 2 2 3 0 4 0 0 2 2 19
Midwife : Birth Ratio exc. band 3 MCA's
Ratio ≤1:29.5 >1:32 1:32.3 1:32.2 1:32.2 1:33 1:32 1:31 1:31 1:31 1:30 1:30 1:30
Midwife : Birth Ratio inc. band 3 MCA's
Midwife : Birth Ratio inc. band 3 MCA's
Ratio ≤1:28 >1:30 1:30.6 1:30.6 1:30.6 1:31 1:30 1:29 1:30 1:29.7 1:28.5 1:28.5 1:28.5
Unplanned NICU Admissions at Term >24hrs requiring ventilation
Unplanned NICU Admissions at Term >24hrs requiring ventilation
Number of babies 0 0 1 2 2 2 0 2 4 1 3 17
Number of SI's Number of SI's Number per month 0 ≥1 0 0 1 0 2 0 1 0 0 1 0 5
3rd & 4th Degree Tears 3rd Degree Tears % of all deliveries <3.5% >5% 2.44% 2.47% 1.74% 1.93% 1.96% 3.61% 3.63% 2.52% 1.75% 1.79% 3.07% 2.45%
All Stillbirth excluding TOP≥24wks & Severe Anomalies
excluding TOP≥24wks & Severe Anomalies
Number of babies 0 1 3 2 4 0 1 3 0 3 2 19
Comments Feb 17: Plan to separate IOLs in next Dashboard submission‐ request has been submitted. RAG ratings will be reviewed at end of financial yea. Black Alert due to acuity of patients and divert for 14hrs. No patients diverted.
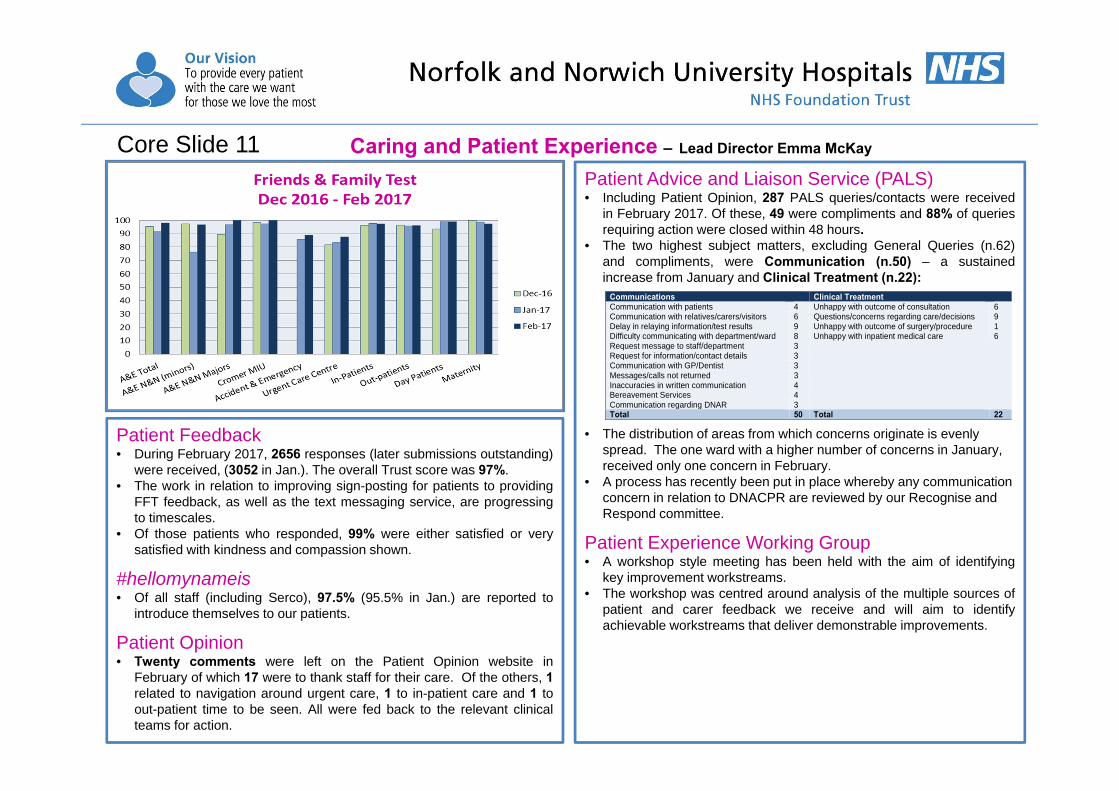
Patient Feedback• During February 2017, 2656 responses (later submissions outstanding)
were received, (3052 in Jan.). The overall Trust score was 97%.• The work in relation to improving sign-posting for patients to providing
FFT feedback, as well as the text messaging service, are progressingto timescales.
• Of those patients who responded, 99% were either satisfied or verysatisfied with kindness and compassion shown.
#hellomynameis• Of all staff (including Serco), 97.5% (95.5% in Jan.) are reported to
introduce themselves to our patients.
Patient Opinion• Twenty comments were left on the Patient Opinion website in
February of which 17 were to thank staff for their care. Of the others, 1related to navigation around urgent care, 1 to in-patient care and 1 toout-patient time to be seen. All were fed back to the relevant clinicalteams for action.
Patient Advice and Liaison Service (PALS)• Including Patient Opinion, 287 PALS queries/contacts were received
in February 2017. Of these, 49 were compliments and 88% of queriesrequiring action were closed within 48 hours.
• The two highest subject matters, excluding General Queries (n.62)and compliments, were Communication (n.50) – a sustainedincrease from January and Clinical Treatment (n.22):
• The distribution of areas from which concerns originate is evenly spread. The one ward with a higher number of concerns in January, received only one concern in February.
• A process has recently been put in place whereby any communication concern in relation to DNACPR are reviewed by our Recognise and Respond committee.
Patient Experience Working Group• A workshop style meeting has been held with the aim of identifying
key improvement workstreams.• The workshop was centred around analysis of the multiple sources of
patient and carer feedback we receive and will aim to identifyachievable workstreams that deliver demonstrable improvements.
Communications Clinical TreatmentCommunication with patients 4 Unhappy with outcome of consultation 6 Communication with relatives/carers/visitors 6 Questions/concerns regarding care/decisions 9 Delay in relaying information/test results 9 Unhappy with outcome of surgery/procedure 1 Difficulty communicating with department/ward 8 Unhappy with inpatient medical care 6 Request message to staff/department 3 Request for information/contact details 3 Communication with GP/Dentist 3 Messages/calls not returned 3 Inaccuracies in written communication 4 Bereavement Services 4 Communication regarding DNAR 3 Total 50 Total 22
Caring and Patient Experience – Lead Director Emma McKayCore Slide 11
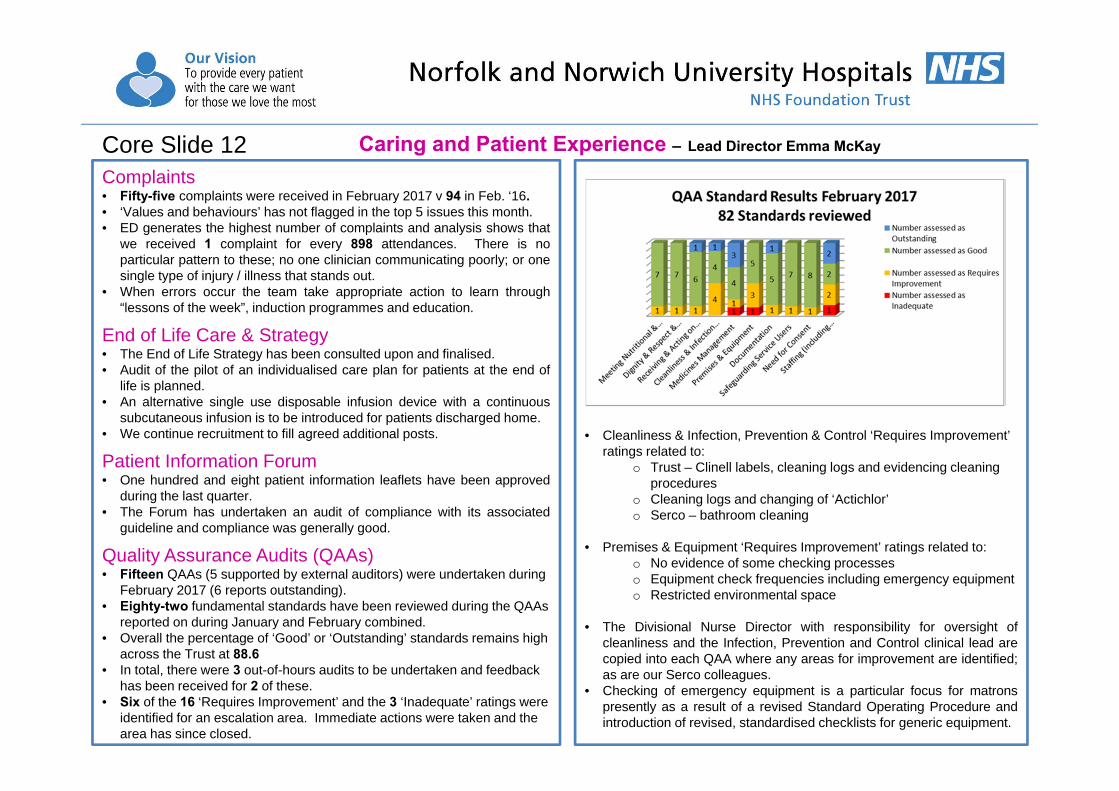
Complaints• Fifty-five complaints were received in February 2017 v 94 in Feb. ‘16.• ‘Values and behaviours’ has not flagged in the top 5 issues this month.• ED generates the highest number of complaints and analysis shows that
we received 1 complaint for every 898 attendances. There is noparticular pattern to these; no one clinician communicating poorly; or onesingle type of injury / illness that stands out.
• When errors occur the team take appropriate action to learn through“lessons of the week”, induction programmes and education.
End of Life Care & Strategy• The End of Life Strategy has been consulted upon and finalised.• Audit of the pilot of an individualised care plan for patients at the end of
life is planned.• An alternative single use disposable infusion device with a continuous
subcutaneous infusion is to be introduced for patients discharged home.• We continue recruitment to fill agreed additional posts.
Patient Information Forum• One hundred and eight patient information leaflets have been approved
during the last quarter.• The Forum has undertaken an audit of compliance with its associated
guideline and compliance was generally good.
Quality Assurance Audits (QAAs)• Fifteen QAAs (5 supported by external auditors) were undertaken during
February 2017 (6 reports outstanding). • Eighty-two fundamental standards have been reviewed during the QAAs
reported on during January and February combined. • Overall the percentage of ‘Good’ or ‘Outstanding’ standards remains high
across the Trust at 88.6• In total, there were 3 out-of-hours audits to be undertaken and feedback
has been received for 2 of these.• Six of the 16 ‘Requires Improvement’ and the 3 ‘Inadequate’ ratings were
identified for an escalation area. Immediate actions were taken and the area has since closed.
• Cleanliness & Infection, Prevention & Control ‘Requires Improvement’ ratings related to:
o Trust – Clinell labels, cleaning logs and evidencing cleaning procedures
o Cleaning logs and changing of ‘Actichlor’o Serco – bathroom cleaning
• Premises & Equipment ‘Requires Improvement’ ratings related to: o No evidence of some checking processeso Equipment check frequencies including emergency equipmento Restricted environmental space
• The Divisional Nurse Director with responsibility for oversight ofcleanliness and the Infection, Prevention and Control clinical lead arecopied into each QAA where any areas for improvement are identified;as are our Serco colleagues.
• Checking of emergency equipment is a particular focus for matronspresently as a result of a revised Standard Operating Procedure andintroduction of revised, standardised checklists for generic equipment.
Caring and Patient Experience – Lead Director Emma McKayCore Slide 12
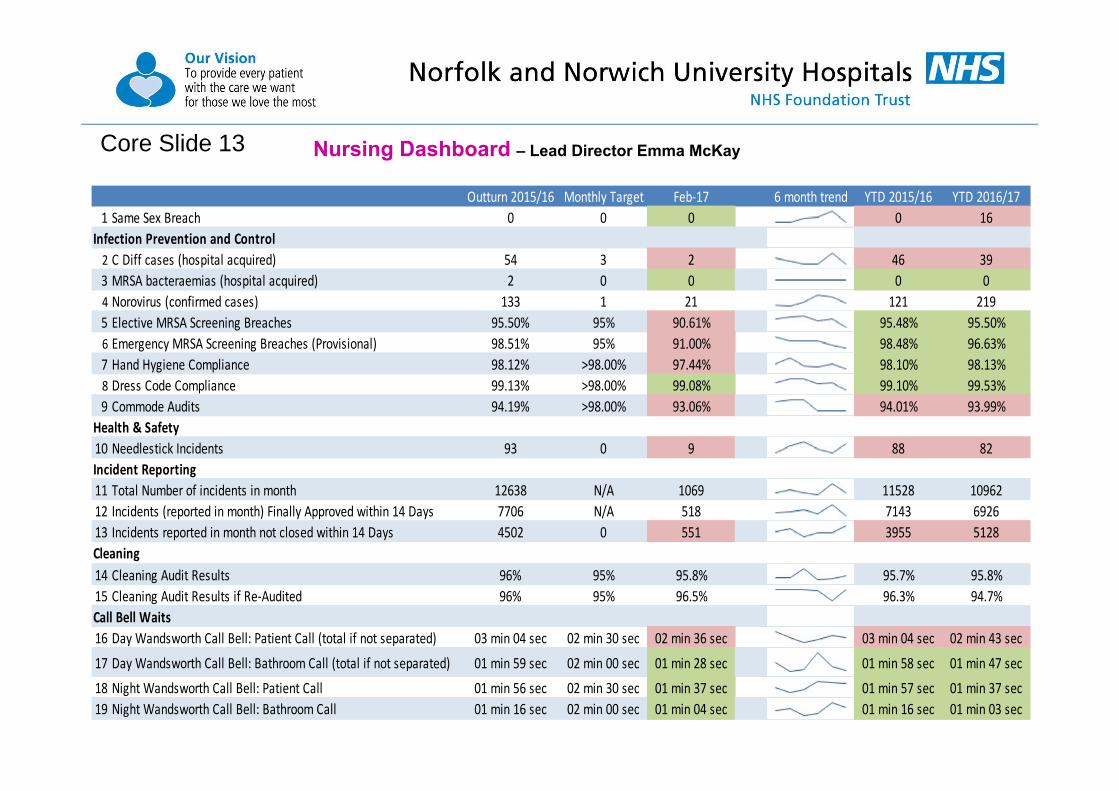
Core Slide 13 Nursing Dashboard – Lead Director Emma McKay
Outturn 2015/16 Monthly Target Feb‐17 6 month trend YTD 2015/16 YTD 2016/171 Same Sex Breach 0 0 0 0 16
Infection Prevention and Control2 C Diff cases (hospital acquired) 54 3 2 46 393 MRSA bacteraemias (hospital acquired) 2 0 0 0 04 Norovirus (confirmed cases) 133 1 21 121 2195 Elective MRSA Screening Breaches 95.50% 95% 90.61% 95.48% 95.50%6 Emergency MRSA Screening Breaches (Provisional) 98.51% 95% 91.00% 98.48% 96.63%7 Hand Hygiene Compliance 98.12% >98.00% 97.44% 98.10% 98.13%8 Dress Code Compliance 99.13% >98.00% 99.08% 99.10% 99.53%9 Commode Audits 94.19% >98.00% 93.06% 94.01% 93.99%
Health & Safety10 Needlestick Incidents 93 0 9 88 82Incident Reporting11 Total Number of incidents in month 12638 N/A 1069 11528 1096212 Incidents (reported in month) Finally Approved within 14 Days 7706 N/A 518 7143 692613 Incidents reported in month not closed within 14 Days 4502 0 551 3955 5128Cleaning14 Cleaning Audit Results 96% 95% 95.8% 95.7% 95.8%15 Cleaning Audit Results if Re‐Audited 96% 95% 96.5% 96.3% 94.7%Call Bell Waits16 Day Wandsworth Call Bell: Patient Call (total if not separated) 03 min 04 sec 02 min 30 sec 02 min 36 sec 03 min 04 sec 02 min 43 sec
17 Day Wandsworth Call Bell: Bathroom Call (total if not separated) 01 min 59 sec 02 min 00 sec 01 min 28 sec 01 min 58 sec 01 min 47 sec18 Night Wandsworth Call Bell: Patient Call 01 min 56 sec 02 min 30 sec 01 min 37 sec 01 min 57 sec 01 min 37 sec19 Night Wandsworth Call Bell: Bathroom Call 01 min 16 sec 02 min 00 sec 01 min 04 sec 01 min 16 sec 01 min 03 sec
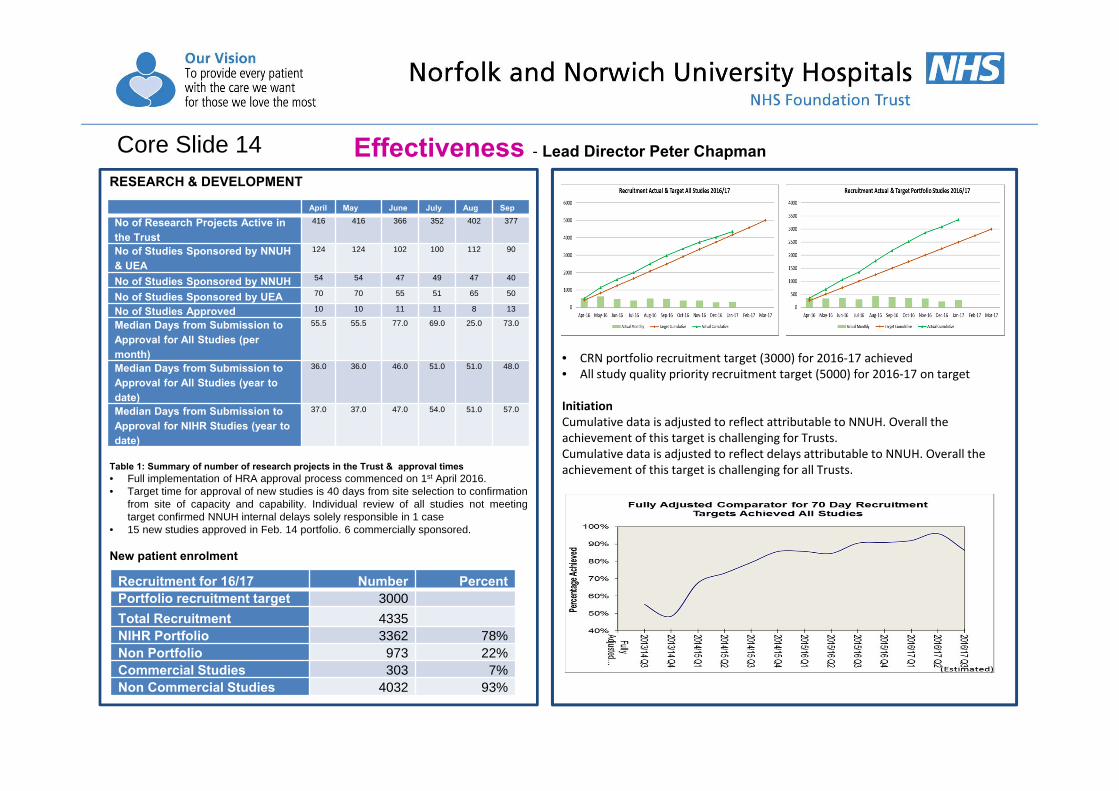
RESEARCH & DEVELOPMENT
Table 1: Summary of number of research projects in the Trust & approval times• Full implementation of HRA approval process commenced on 1st April 2016.• Target time for approval of new studies is 40 days from site selection to confirmation
from site of capacity and capability. Individual review of all studies not meetingtarget confirmed NNUH internal delays solely responsible in 1 case
• 15 new studies approved in Feb. 14 portfolio. 6 commercially sponsored.
New patient enrolment
Effectiveness - Lead Director Peter ChapmanCore Slide 14
• CRN portfolio recruitment target (3000) for 2016‐17 achieved • All study quality priority recruitment target (5000) for 2016‐17 on target
Initiation Cumulative data is adjusted to reflect attributable to NNUH. Overall the achievement of this target is challenging for Trusts. Cumulative data is adjusted to reflect delays attributable to NNUH. Overall the achievement of this target is challenging for all Trusts.
April May June July Aug Sep
No of Research Projects Active in the Trust
416 416 366 352 402 377
No of Studies Sponsored by NNUH & UEA
124 124 102 100 112 90
No of Studies Sponsored by NNUH 54 54 47 49 47 40
No of Studies Sponsored by UEA 70 70 55 51 65 50
No of Studies Approved 10 10 11 11 8 13
Median Days from Submission to Approval for All Studies (per month)
55.5 55.5 77.0 69.0 25.0 73.0
Median Days from Submission to Approval for All Studies (year to date)
36.0 36.0 46.0 51.0 51.0 48.0
Median Days from Submission to Approval for NIHR Studies (year to date)
37.0 37.0 47.0 54.0 51.0 57.0
Recruitment for 16/17 Number PercentPortfolio recruitment target 3000
Total Recruitment 4335NIHR Portfolio 3362 78%Non Portfolio 973 22%Commercial Studies 303 7%Non Commercial Studies 4032 93%
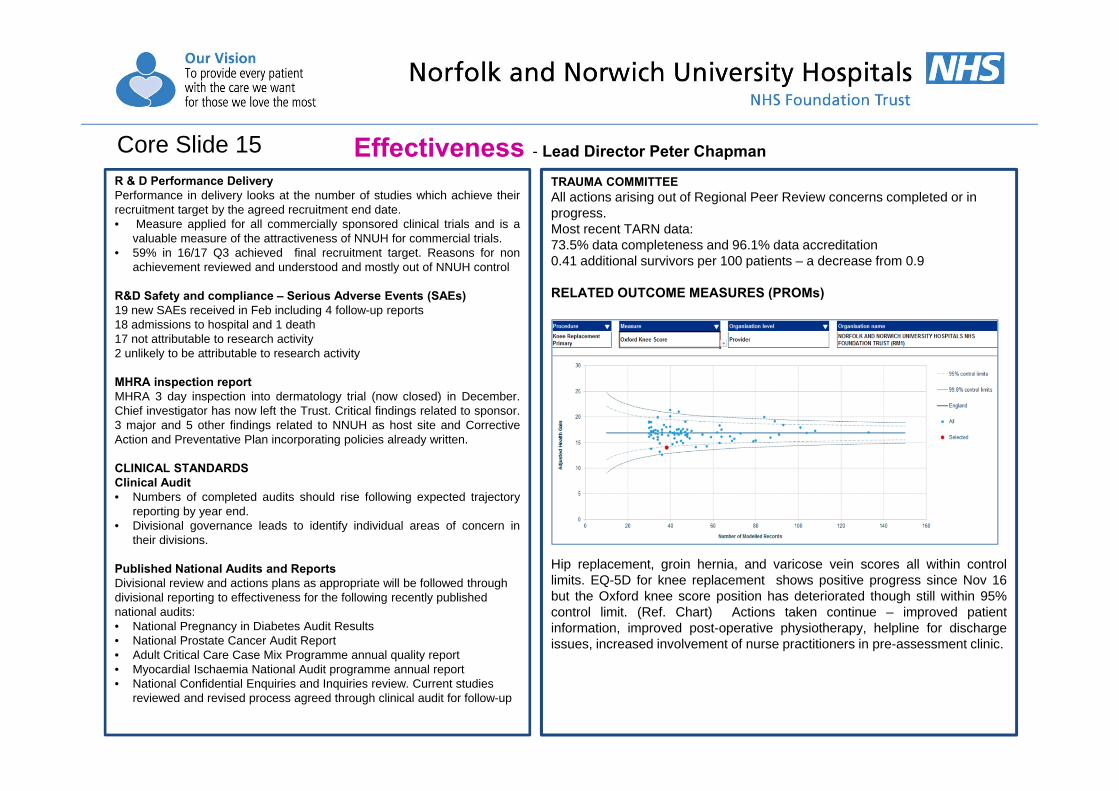
R & D Performance DeliveryPerformance in delivery looks at the number of studies which achieve theirrecruitment target by the agreed recruitment end date.• Measure applied for all commercially sponsored clinical trials and is a
valuable measure of the attractiveness of NNUH for commercial trials.• 59% in 16/17 Q3 achieved final recruitment target. Reasons for non
achievement reviewed and understood and mostly out of NNUH control
R&D Safety and compliance – Serious Adverse Events (SAEs)19 new SAEs received in Feb including 4 follow-up reports18 admissions to hospital and 1 death17 not attributable to research activity2 unlikely to be attributable to research activity
MHRA inspection reportMHRA 3 day inspection into dermatology trial (now closed) in December.Chief investigator has now left the Trust. Critical findings related to sponsor.3 major and 5 other findings related to NNUH as host site and CorrectiveAction and Preventative Plan incorporating policies already written.
CLINICAL STANDARDSClinical Audit• Numbers of completed audits should rise following expected trajectory
reporting by year end.• Divisional governance leads to identify individual areas of concern in
their divisions.
Published National Audits and ReportsDivisional review and actions plans as appropriate will be followed through divisional reporting to effectiveness for the following recently published national audits:• National Pregnancy in Diabetes Audit Results• National Prostate Cancer Audit Report• Adult Critical Care Case Mix Programme annual quality report• Myocardial Ischaemia National Audit programme annual report• National Confidential Enquiries and Inquiries review. Current studies
reviewed and revised process agreed through clinical audit for follow-up
Effectiveness - Lead Director Peter ChapmanCore Slide 15TRAUMA COMMITTEEAll actions arising out of Regional Peer Review concerns completed or in progress.Most recent TARN data:73.5% data completeness and 96.1% data accreditation0.41 additional survivors per 100 patients – a decrease from 0.9
RELATED OUTCOME MEASURES (PROMs)
Hip replacement, groin hernia, and varicose vein scores all within controllimits. EQ-5D for knee replacement shows positive progress since Nov 16but the Oxford knee score position has deteriorated though still within 95%control limit. (Ref. Chart) Actions taken continue – improved patientinformation, improved post-operative physiotherapy, helpline for dischargeissues, increased involvement of nurse practitioners in pre-assessment clinic.

Performance Outturn 2015/16 Monthly Target Feb‐17 6 month trend YTD 2015/16 YTD 2016/17Cancer Core Slide 18‐201 Cancer 62 day target for referral to treatment ‐ GP Referral * 77.07% 85.00% 71.85% 76.65% 78.23%2 Cancer 2 week wait ‐ all cancers * 96.70% 93.00% 95.23% 96.50% 97.32%4 Cancer 31 day target compliance 97.39% 96.00% 96.25% 97.44% 97.01%5 Cancer 31 day target for subsequent treatments ‐ Surgery * 91.58% 94.00% 95.05% 91.75% 92.26%6 Cancer 31 day target for subsequent treatments ‐ Anti Cancer Drugs * 99.26% 98.00% 100.00% 99.19% 99.93%7 Cancer 31 day target for subsequent treatments ‐ Radiotherapy * 97.76% 94.00% 97.62% 97.74% 97.73%
A&E Core Slide 219 A&E 4 hour target compliance 85.33% 95.00% 77.65% 85.88% 85.44%10 Number of 30 minute handover breaches 4959 0 782 4093 596811 Number of 60 minute handover breaches 1606 0 309 1242 213712 Recording of Handover Times 94.72% 95.00% 90.82% 94.88% 92.44%13 Number of patient handover times recorded 48581 n/a 3769 44499 4487914 Arrival to Handover time (>15 minutes) 27.90% n/a 38.99% 26.55% 30.55%RTT Core Slide 2215 18 week RTT target ‐ Patients on an incomplete pathway 87.49% 92.00% 84.20% 87.65% 85.82%16 Admitted Backlog 3039 n/a 3416 2868 341617 Incomplete Non Admitted Backlog 2285 n/a 2705 1887 2705Stroke Core Slide 23‐2418 Percentage of patients with 90% of their length of stay on the stroke unit 80.26% 80.00% 65.69% 80.18% 82.29%19 Patients with primary diagnosis of stroke admitted to a HASU within 4 hrs 74.08% 90.00% 58.00% 74.82% 78.22%20 % of urgent Stroke patients with access to brain scan within 60 mins 86.27% 90.00% 90.24% 85.40% 83.45%21 % Door to needle time of <= 60 minutes for eligible thrombolysis patients 79.22% 90.00% 90.00% 79.60% 82.68%22 % of high risk TIA patients treated within 24 hour of first contact 91.84% 90.00% 80.00% 93.22% 86.12%Patient Flow23 Diagnostics 95.93% 99.00% 99.70% 95.72% 98.31%24 Cancelled Operations 1360 n/a 104 1227 103725 Number of 28 day breaches 267 0 12 199 20326 Average Delayed Transfers of Care 552 n/a 28 497 48327 28 Day Readmission Rates 6% n/a 4.39% 5.68% 5.49%28 Length of Stay (Elective) 3.09 n/a 3.17 3.31 3.1729 Length of Stay (Non‐Elective) 5.08 n/a 4.90 5.23 4.9030 Average number of patients with LoS >14 days 0.00 200 234 0 234*Please note these figures are provisional
Performance – Monitor KPI’s - Lead Director Richard ParkerCore Slide 16
Performance - Lead Director Richard ParkerCore Slide 17
Performance – key issues
1. Cancer - 62-day GP referral performance remains a priority for recovery. Below standard performance in February reflects targeted backlog reduction. Work to set a trajectory for cancer recovery has been undertaken with system partners and the trajectory is for recovery in May 2017
2. A&E - ED transit time performance for February was below trajectory but broadly in line with peers. The revised System Wide plan is in place and continues to focus on performance stabilisation. Key issues were in line with national profile of significantly increased demand, heightened acuity of presentation and an increase in the number of 14-day ‘stranded’ patients
3. RTT – Significant partnership work has been completed to establish a recovery action plan with the CCG. Current recovery trajectories set a return to compliance by October 2018
4. Stroke - Progress had been made to recover key strands of stroke performance, specifically door to needle time and timely access to scanning. Access to dedicated stroke beds remains challenging and reflects the overall emergency care / bed capacity challenge in this early part of Winter. l SNNAP audit data for the period April 14 – November rates our Stroke performance as “recently” – Good, “2.5 year period” – Improving.
.
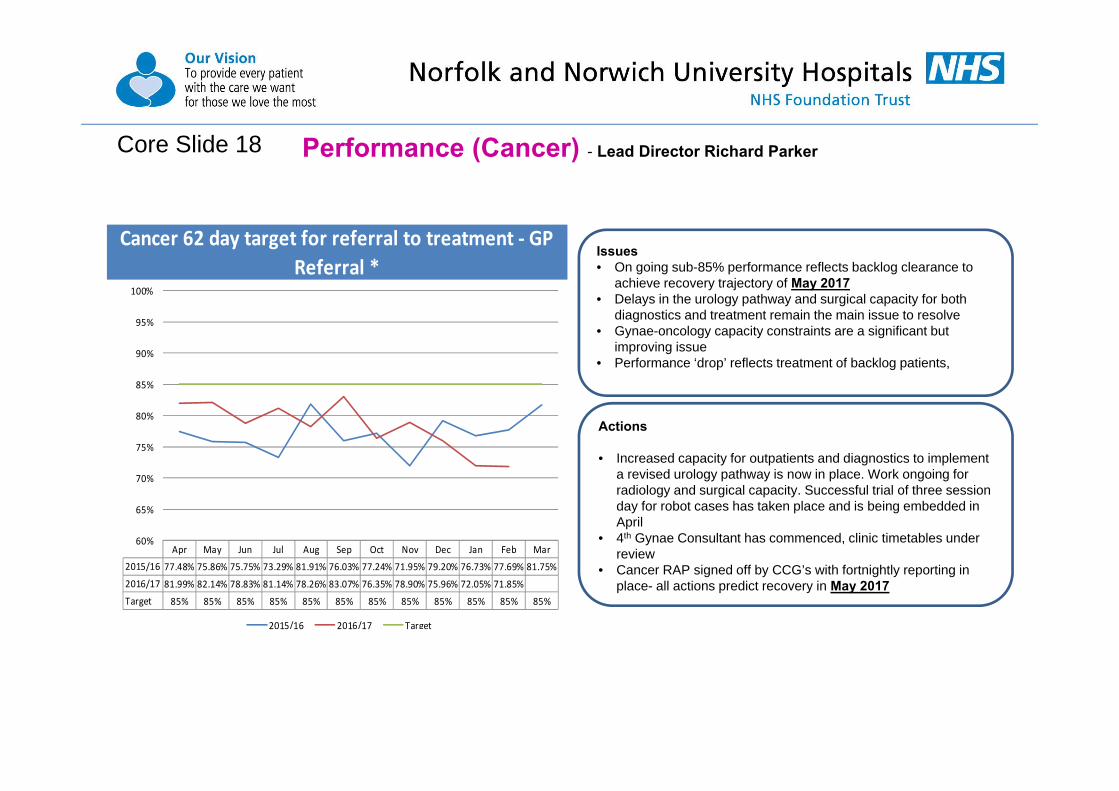
Performance (Cancer) - Lead Director Richard ParkerCore Slide 18
Cancer 62 day target for referral to treatment ‐ GP Referral *
Apr May Jun Jul Aug Sep Oct Nov Dec Jan Feb Mar
2015/16 77.48% 75.86% 75.75% 73.29% 81.91% 76.03% 77.24% 71.95% 79.20% 76.73% 77.69% 81.75%
2016/17 81.99% 82.14% 78.83% 81.14% 78.26% 83.07% 76.35% 78.90% 75.96% 72.05% 71.85%
Target 85% 85% 85% 85% 85% 85% 85% 85% 85% 85% 85% 85%
60%
65%
70%
75%
80%
85%
90%
95%
100%
2015/16 2016/17 Target
Actions
• Increased capacity for outpatients and diagnostics to implement a revised urology pathway is now in place. Work ongoing for radiology and surgical capacity. Successful trial of three session day for robot cases has taken place and is being embedded in April
• 4th Gynae Consultant has commenced, clinic timetables under review
• Cancer RAP signed off by CCG’s with fortnightly reporting in place- all actions predict recovery in May 2017
Issues• On going sub-85% performance reflects backlog clearance to
achieve recovery trajectory of May 2017 • Delays in the urology pathway and surgical capacity for both
diagnostics and treatment remain the main issue to resolve• Gynae-oncology capacity constraints are a significant but
improving issue• Performance ‘drop’ reflects treatment of backlog patients,

Performance (Cancer) - Lead Director Richard ParkerCore Slide 19

Performance (Cancer) – Lead Director Richard ParkerCore Slide 20
Issues
• This target is always challenging due to small number of breaches. Achieved in February as predicted.
• New processes in place in Skin/plastics to ensure early escalation of issues
• Unusual increase in number of complex Urology patients in March places target at risk
Cancer 31 day target for subsequent treatments ‐ Surgery *
Apr May Jun Jul Aug Sep Oct Nov Dec Jan Feb Mar
2015/16 91.58% 87.27% 88.79% 83.65% 93.00% 94.02% 93.46% 94.06% 96.23% 95.19% 91.95% 89.80%
2016/17 89.26% 91.67% 94.62% 95.28% 96.33% 96.08% 85.95% 91.82% 89.25% 89.57% 95.05%
Target 94% 94% 94% 94% 94% 94% 94% 94% 94% 94% 94% 94%
60%
65%
70%
75%
80%
85%
90%
95%
100%
2015/16 2016/17 Target
Actions
• Source additional theatre capacity for urology to manage increased demand
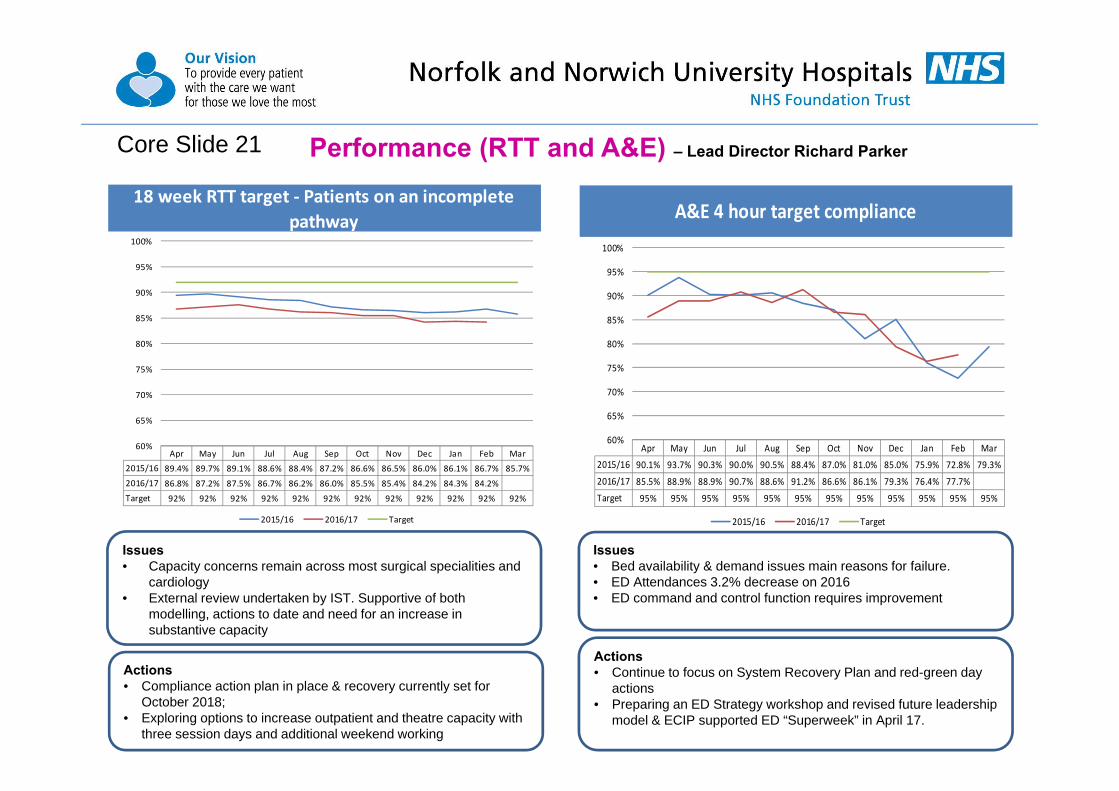
Performance (RTT and A&E) – Lead Director Richard ParkerCore Slide 21
18 week RTT target ‐ Patients on an incomplete pathway
Apr May Jun Jul Aug Sep Oct Nov Dec Jan Feb Mar2015/16 89.4% 89.7% 89.1% 88.6% 88.4% 87.2% 86.6% 86.5% 86.0% 86.1% 86.7% 85.7%
2016/17 86.8% 87.2% 87.5% 86.7% 86.2% 86.0% 85.5% 85.4% 84.2% 84.3% 84.2%
Target 92% 92% 92% 92% 92% 92% 92% 92% 92% 92% 92% 92%
60%
65%
70%
75%
80%
85%
90%
95%
100%
2015/16 2016/17 Target
Actions• Compliance action plan in place & recovery currently set for
October 2018; • Exploring options to increase outpatient and theatre capacity with
three session days and additional weekend working
Issues• Capacity concerns remain across most surgical specialities and
cardiology• External review undertaken by IST. Supportive of both
modelling, actions to date and need for an increase in substantive capacity
A&E 4 hour target compliance
Apr May Jun Jul Aug Sep Oct Nov Dec Jan Feb Mar
2015/16 90.1% 93.7% 90.3% 90.0% 90.5% 88.4% 87.0% 81.0% 85.0% 75.9% 72.8% 79.3%
2016/17 85.5% 88.9% 88.9% 90.7% 88.6% 91.2% 86.6% 86.1% 79.3% 76.4% 77.7%
Target 95% 95% 95% 95% 95% 95% 95% 95% 95% 95% 95% 95%
60%
65%
70%
75%
80%
85%
90%
95%
100%
2015/16 2016/17 Target
Actions• Continue to focus on System Recovery Plan and red-green day
actions• Preparing an ED Strategy workshop and revised future leadership
model & ECIP supported ED “Superweek” in April 17.
Issues• Bed availability & demand issues main reasons for failure.• ED Attendances 3.2% decrease on 2016• ED command and control function requires improvement
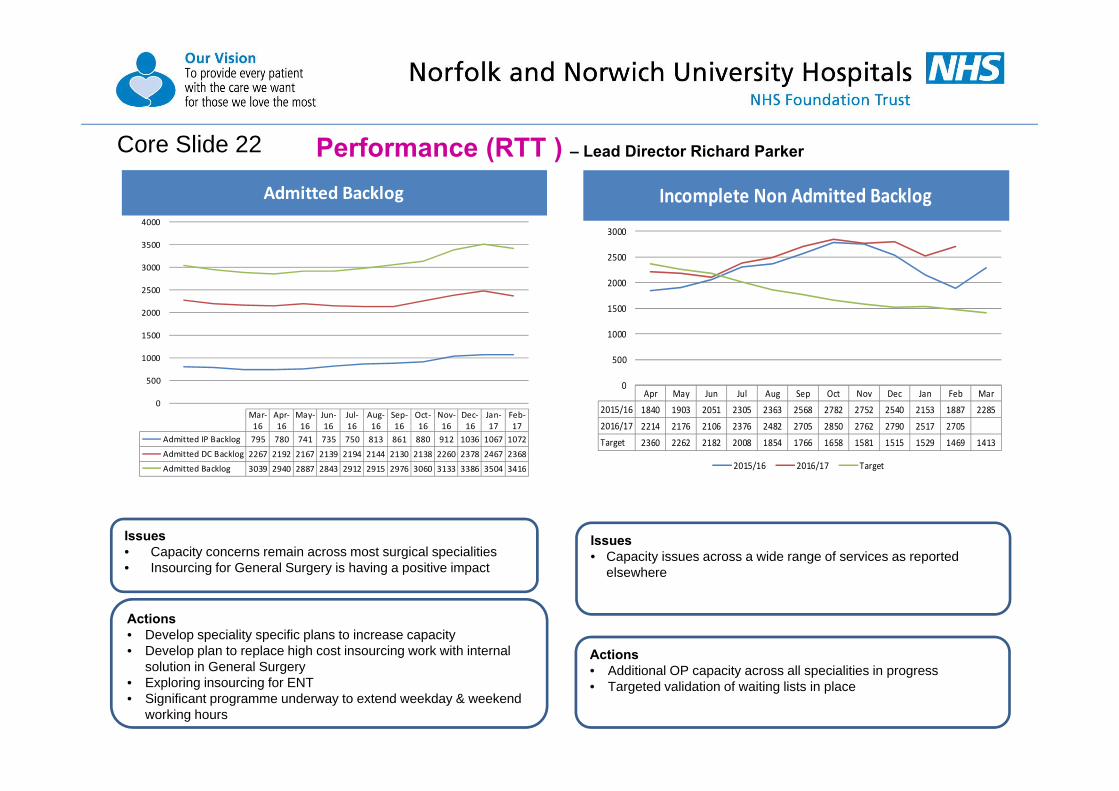
Performance (RTT ) – Lead Director Richard ParkerCore Slide 22
Incomplete Non Admitted Backlog
Apr May Jun Jul Aug Sep Oct Nov Dec Jan Feb Mar2015/16 1840 1903 2051 2305 2363 2568 2782 2752 2540 2153 1887 2285
2016/17 2214 2176 2106 2376 2482 2705 2850 2762 2790 2517 2705
Target 2360 2262 2182 2008 1854 1766 1658 1581 1515 1529 1469 1413
0
500
1000
1500
2000
2500
3000
2015/16 2016/17 Target
Actions• Develop speciality specific plans to increase capacity • Develop plan to replace high cost insourcing work with internal
solution in General Surgery• Exploring insourcing for ENT• Significant programme underway to extend weekday & weekend
working hours
Issues• Capacity concerns remain across most surgical specialities• Insourcing for General Surgery is having a positive impact
Actions• Additional OP capacity across all specialities in progress • Targeted validation of waiting lists in place
Issues• Capacity issues across a wide range of services as reported
elsewhere
Admitted Backlog
0
500
1000
1500
2000
2500
3000
3500
4000
Mar‐16
Apr‐16
May‐16
Jun‐16
Jul‐16
Aug‐16
Sep‐16
Oct‐16
Nov‐16
Dec‐16
Jan‐17
Feb‐17
Admitted IP Backlog 795 780 741 735 750 813 861 880 912 1036 1067 1072
Admitted DC Backlog 2267 2192 2167 2139 2194 2144 2130 2138 2260 2378 2467 2368
Admitted Backlog 3039 2940 2887 2843 2912 2915 2976 3060 3133 3386 3504 3416
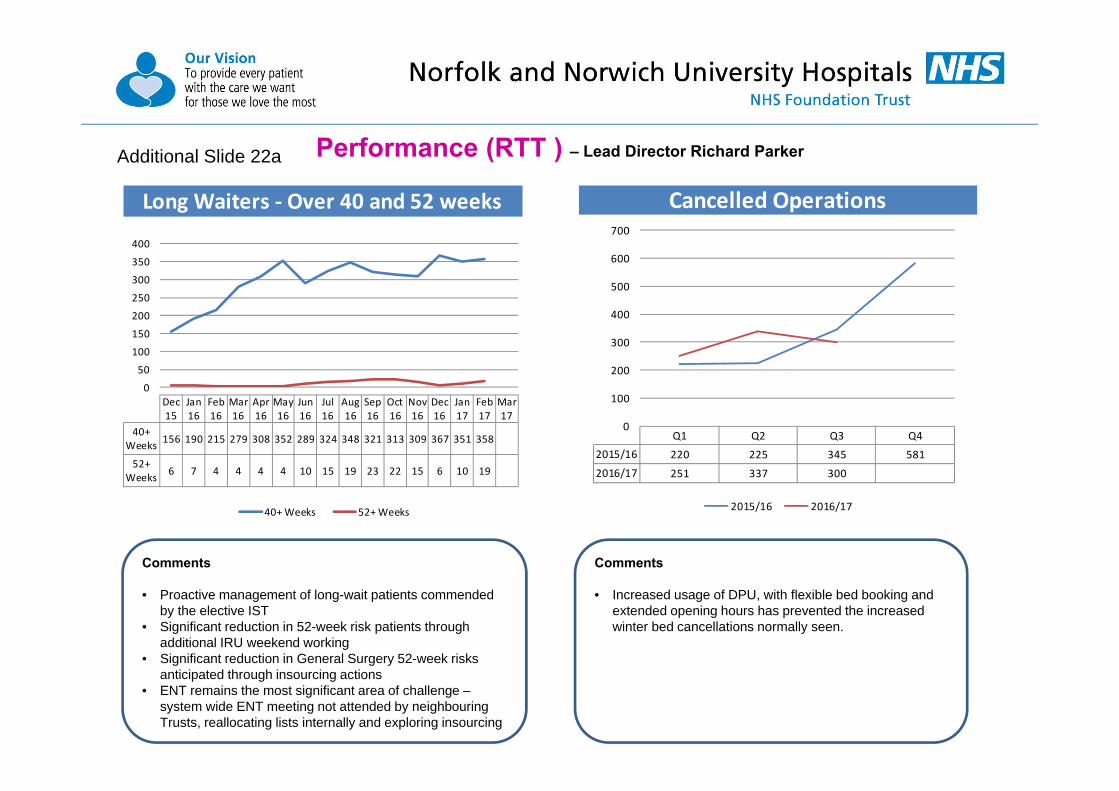
Performance (RTT ) – Lead Director Richard Parker
Comments
• Proactive management of long-wait patients commended by the elective IST
• Significant reduction in 52-week risk patients through additional IRU weekend working
• Significant reduction in General Surgery 52-week risks anticipated through insourcing actions
• ENT remains the most significant area of challenge –system wide ENT meeting not attended by neighbouring Trusts, reallocating lists internally and exploring insourcing
Comments
• Increased usage of DPU, with flexible bed booking and extended opening hours has prevented the increased winter bed cancellations normally seen.
Cancelled Operations
Q1 Q2 Q3 Q42015/16 220 225 345 581
2016/17 251 337 300
0
100
200
300
400
500
600
700
2015/16 2016/17
Additional Slide 22a
Long Waiters ‐ Over 40 and 52 weeks
0
50
100
150
200
250
300
350
400
Dec15
Jan16
Feb16
Mar16
Apr16
May16
Jun16
Jul16
Aug16
Sep16
Oct16
Nov16
Dec16
Jan17
Feb17
Mar17
40+Weeks 156 190 215 279 308 352 289 324 348 321 313 309 367 351 358
52+Weeks 6 7 4 4 4 4 10 15 19 23 22 15 6 10 19
40+ Weeks 52+ Weeks

24
Performance (RTT ) – Lead Director Richard Parker
Reasons for cancellations (01 April 2015 to date)• Lack of Theatre Time – 35.30%• Bed Shortages – 32.95%• Administrative Reasons – 16.59%• Other – 15.15%
CommentsIncreased usage of DPU, with flexible bed booking and extended opening hours has prevented the increased winter bed cancellations normally seen.
Additional Slide 22b

Performance (Stroke) – Lead Director Richard ParkerCore Slide 23
% of high risk TIA patients treated within 24 hour of first contact
Apr May Jun Jul Aug Sep Oct Nov Dec Jan Feb Mar2015/16 100.0% 100.0% 100.0% 100.0% 100.0% 93.3% 85.7% 79.2% 93.8% 85.0% 88.5% 76.7%
2016/17 98.1% 71.1% 93.8% 87.5% 92.0% 80.8% 76.9% 90.6% 85.2% 91.4% 80.0%
Target 90.0% 90.0% 90.0% 90.0% 90.0% 90.0% 90.0% 90.0% 90.0% 90.0% 90.0% 90.0%
60%
65%
70%
75%
80%
85%
90%
95%
100%
2015/16 2016/17 Target
Patients with primary diagnosis of stroke admitted to a HASU within 4 hrs
Apr May Jun Jul Aug Sep Oct Nov Dec Jan Feb Mar2015/16 76.9% 80.9% 71.4% 68.4% 68.3% 77.0% 91.0% 78.8% 73.2% 76.2% 60.9% 65.9%
2016/17 79.0% 84.6% 82.7% 87.5% 86.7% 82.5% 85.7% 84.0% 74.7% 55.1% 58.0%
Target 90% 90% 90% 90% 90% 90% 90% 90% 90% 90% 90% 90%
50%
55%
60%
65%
70%
75%
80%
85%
90%
95%
100%
2015/16 2016/17 Target
Issues
• 5 Breaches –due to lack of Doppler availability
Actions• Ensure ring-fenced Stroke bed is protected to ensure admission
pathway is maintained.• Red-to-Green launched in Stroke to help bed flow / occupancy
Issues30 breaches-• 27 x No beds available on Heydon Ward • 1 x stroke team busy with multiple patients in A&E • 1 x Not diagnosed as stroke by stroke team • 1 x Patient referred to Neurology by AMU, patient never seen by
stroke team
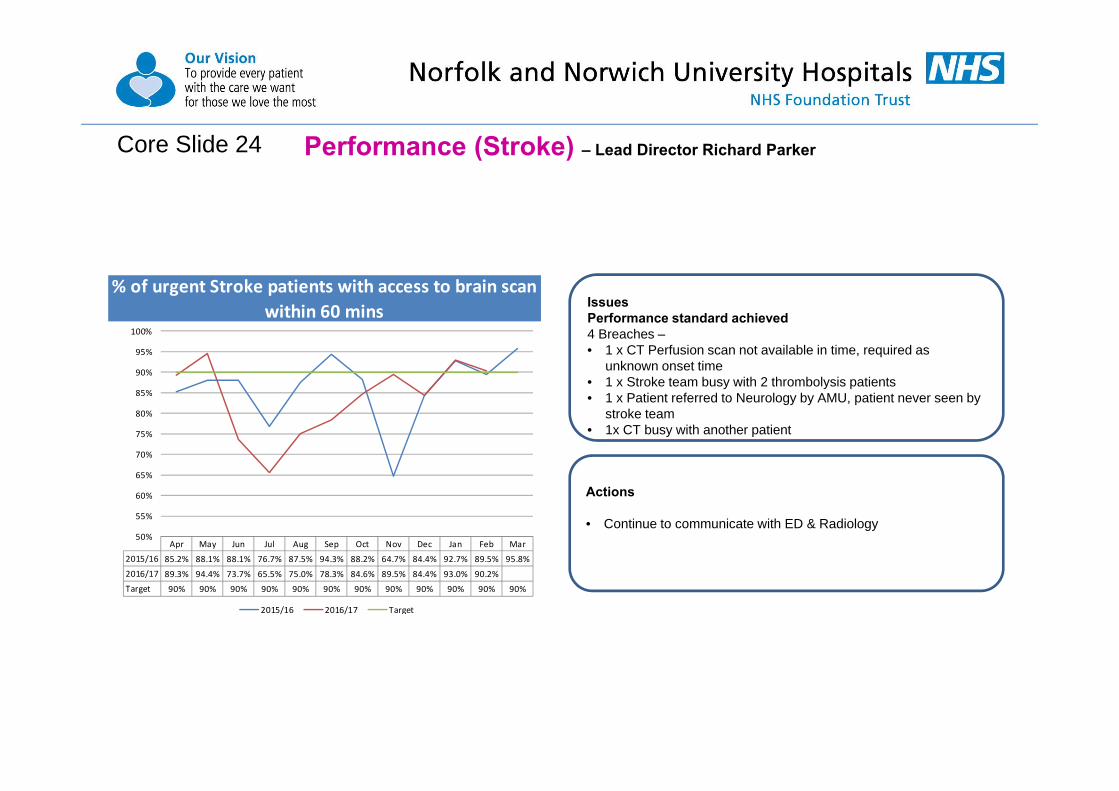
Performance (Stroke) – Lead Director Richard ParkerCore Slide 24
% of urgent Stroke patients with access to brain scan within 60 mins
Apr May Jun Jul Aug Sep Oct Nov Dec Jan Feb Mar
2015/16 85.2% 88.1% 88.1% 76.7% 87.5% 94.3% 88.2% 64.7% 84.4% 92.7% 89.5% 95.8%
2016/17 89.3% 94.4% 73.7% 65.5% 75.0% 78.3% 84.6% 89.5% 84.4% 93.0% 90.2%
Target 90% 90% 90% 90% 90% 90% 90% 90% 90% 90% 90% 90%
50%
55%
60%
65%
70%
75%
80%
85%
90%
95%
100%
2015/16 2016/17 Target
Actions
• Continue to communicate with ED & Radiology
IssuesPerformance standard achieved4 Breaches –• 1 x CT Perfusion scan not available in time, required as
unknown onset time • 1 x Stroke team busy with 2 thrombolysis patients • 1 x Patient referred to Neurology by AMU, patient never seen by
stroke team • 1x CT busy with another patient

Performance (Stroke) – Lead Director Richard Parker
Percentage of patients with 90% of their length of stay on the stroke unit
Apr May Jun Jul Aug Sep Oct Nov Dec Jan Feb Mar2015/16 79.1% 69.8% 75.9% 75.5% 86.3% 87.0% 92.9% 85.2% 80.8% 80.3% 69.4% 81.1%
2016/17 76.7% 91.2% 82.0% 89.1% 86.1% 84.5% 92.9% 87.6% 87.6% 61.6% 65.7%
Target 80% 80% 80% 80% 80% 80% 80% 80% 80% 80% 80% 80%
0%
10%
20%
30%
40%
50%
60%
70%
80%
90%
100%
2015/16 2016/17 Target
% Door to needle time of <= 60 minutes for eligible thrombolysis patients
Apr May Jun Jul Aug Sep Oct Nov Dec Jan Feb Mar
2015/16 77.8% 66.7% 90.9% 55.6% 58.3% 87.5% 81.8% 100.0% 87.5% 90.9% 78.6% 75.0%
2016/17 60.0% 80.0% 100.0% 75.0% 100.0% 90.0% 71.4% 87.5% 55.6% 100.0% 90.0%
Target 90.0% 90.0% 90.0% 90.0% 90.0% 90.0% 90.0% 90.0% 90.0% 90.0% 90.0% 90.0%
0%
10%
20%
30%
40%
50%
60%
70%
80%
90%
100%
2015/16 2016/17 Target
Additional Slide 24a
Actions
• Prioritise direct admission for stroke and no step downs
1 Breach – CT Perfusion scan not available in time, required as unknown onset time
Actions
• Clinical Team to continue to look at breaches to improve performance
30 breaches-• 27 x No beds available on Heydon Ward • 1 x Stroke team busy with multiple patients in A&E • 1 x Not diagnosed as stroke by stroke team • 1 x Patient referred to Neurology by AMU, patient never seen by
stroke team

Performance (Patient Flow) – Lead Director Richard ParkerCore Slide 25
This slide has been left blank
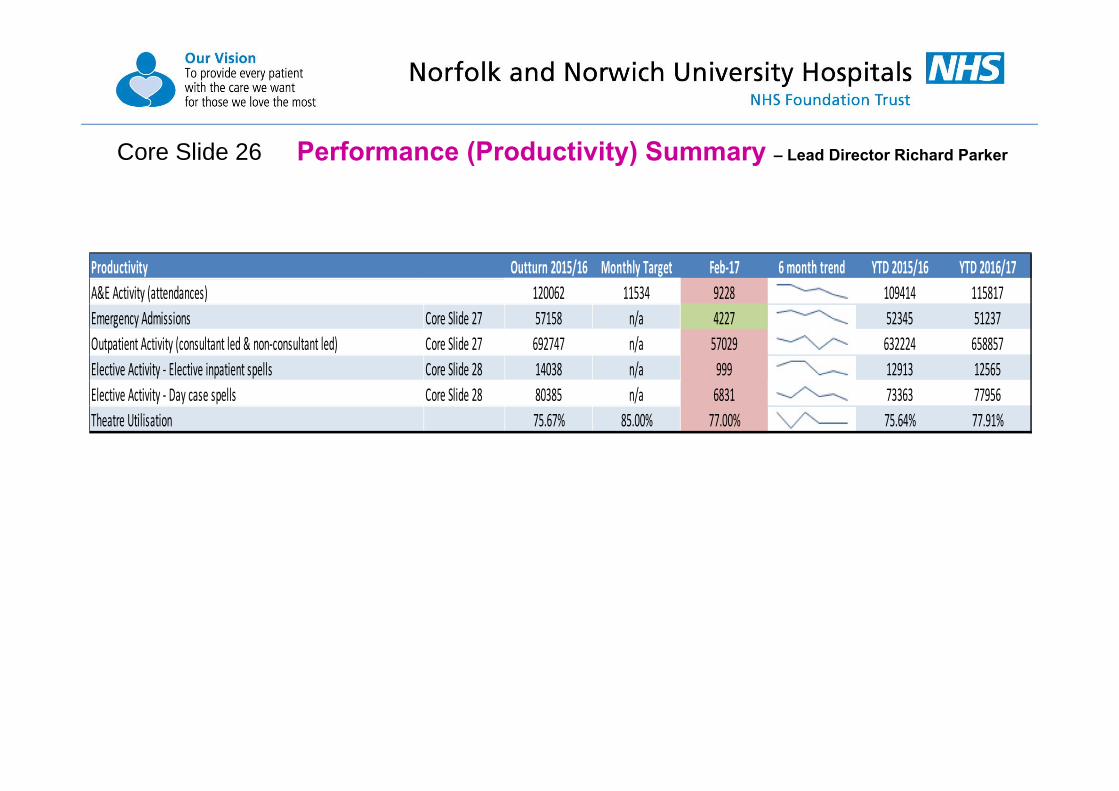
Performance (Productivity) Summary – Lead Director Richard ParkerCore Slide 26
Productivity Outturn 2015/16 Monthly Target Feb‐17 6 month trend YTD 2015/16 YTD 2016/17A&E Activity (attendances) 120062 11534 9228 109414 115817Emergency Admissions Core Slide 27 57158 n/a 4227 52345 51237Outpatient Activity (consultant led & non‐consultant led) Core Slide 27 692747 n/a 57029 632224 658857Elective Activity ‐ Elective inpatient spells Core Slide 28 14038 n/a 999 12913 12565Elective Activity ‐ Day case spells Core Slide 28 80385 n/a 6831 73363 77956Theatre Utilisation 75.67% 85.00% 77.00% 75.64% 77.91%
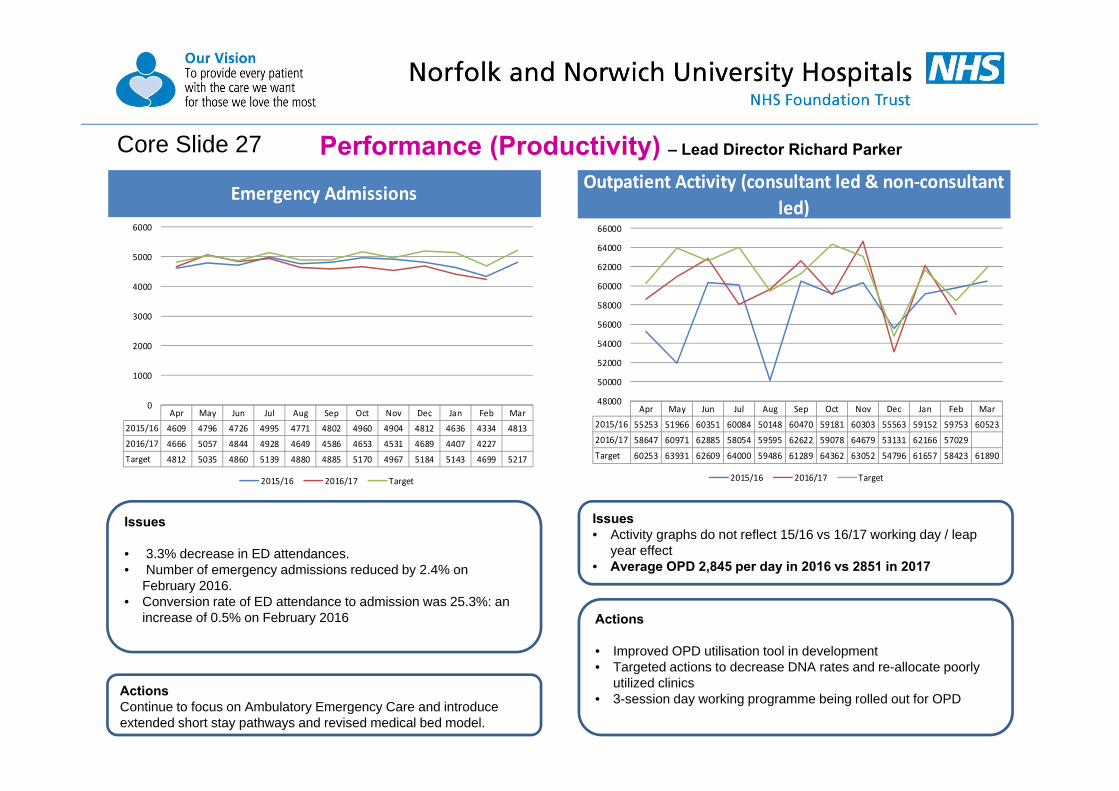
Performance (Productivity) – Lead Director Richard ParkerCore Slide 27
Emergency Admissions
Apr May Jun Jul Aug Sep Oct Nov Dec Jan Feb Mar2015/16 4609 4796 4726 4995 4771 4802 4960 4904 4812 4636 4334 4813
2016/17 4666 5057 4844 4928 4649 4586 4653 4531 4689 4407 4227
Target 4812 5035 4860 5139 4880 4885 5170 4967 5184 5143 4699 5217
0
1000
2000
3000
4000
5000
6000
2015/16 2016/17 Target
Outpatient Activity (consultant led & non‐consultant led)
Apr May Jun Jul Aug Sep Oct Nov Dec Jan Feb Mar
2015/16 55253 51966 60351 60084 50148 60470 59181 60303 55563 59152 59753 60523
2016/17 58647 60971 62885 58054 59595 62622 59078 64679 53131 62166 57029
Target 60253 63931 62609 64000 59486 61289 64362 63052 54796 61657 58423 61890
48000
50000
52000
54000
56000
58000
60000
62000
64000
66000
2015/16 2016/17 Target
Actions
• Improved OPD utilisation tool in development• Targeted actions to decrease DNA rates and re-allocate poorly
utilized clinics• 3-session day working programme being rolled out for OPD
Issues• Activity graphs do not reflect 15/16 vs 16/17 working day / leap
year effect• Average OPD 2,845 per day in 2016 vs 2851 in 2017
ActionsContinue to focus on Ambulatory Emergency Care and introduce extended short stay pathways and revised medical bed model.
Issues
• 3.3% decrease in ED attendances.• Number of emergency admissions reduced by 2.4% on
February 2016.• Conversion rate of ED attendance to admission was 25.3%: an
increase of 0.5% on February 2016

Performance (Productivity) – Lead Director Richard Parker
Issues• Activity graphs do not reflect 15/16 vs 16/17 working day / leap year effect• Average Day-case rate 334 per day in Feb 2016 vs 342 in Feb 2017• Day-case activity slightly behind 16/1q7 plan but 3.8% ahead of 15/16 actual• Continued ring-fencing of DPU for surgical activity is expected to enable plan-or-better performance in March
Core Slide 28Activity2015/16 vs 2016/17 YTDDaycase (excluding Lucentis, including reclassified RDAs from October onwards)
Activity Apr May Jun Jul Aug Sep Oct Nov Dec Jan Feb Mar YTD Full Year2015/16 Actual 6,447 6,183 6,764 6,970 6,338 6,627 6,841 6,862 6,465 6,847 7,019 7,022 73,363 80,3852016/17 Plan 6,917 7,401 7,259 7,461 7,091 7,152 7,435 7,386 6,853 7,192 6,836 7,425 78,983 86,4082016/17 Actual 7,052 6,914 7,169 7,022 7,299 7,154 6,970 7,419 7,013 7,113 6,831 77,956 77,956Variance to 2015/16 605 731 405 52 961 527 129 557 548 266 (188) 4,593 4,593Variance to 2015/16 % 9.4% 11.8% 6.0% 0.7% 15.2% 8.0% 1.9% 8.1% 8.5% 3.9% ‐2.7% 6.26%Variance to Plan 135 (487) (90) (439) 208 2 (465) 33 160 (79) (5) (1,027) (1,027)Variance to Plan % 2.0% ‐6.6% ‐1.2% ‐5.9% 2.9% 0.0% ‐6.3% 0.4% 2.3% ‐1.1% ‐0.1% ‐1.30%
5,600
5,800
6,000
6,200
6,400
6,600
6,800
7,000
7,200
7,400
7,600
Apr May Jun Jul Aug Sep Oct Nov Dec Jan Feb Mar
2015/16 Actual
2016/17 Plan
2016/17 Actual

Performance (Productivity) – Lead Director Richard Parker
Issues• Activity graphs do not reflect 15/16 vs 16/17 working day / leap year effect but still show a decrease on 2016 – predominantly due to 1) a shift to day-
case work / clearance & 2) complexity of case mix (income 4% under plan (£120k) vs 12.8% activity under-performance) • Average electives 55 per day in Feb 2016 vs 50 per day in Feb 2017
Additional Slide 28a
Activity2015/16 vs 2016/17 YTDElective Inpatient
Activity Apr May Jun Jul Aug Sep Oct Nov Dec Jan Feb Mar YTD Full Year2015/16 Actual 1,080 1,157 1,228 1,312 1,146 1,170 1,376 1,246 1,057 977 1,164 1,125 12,913 14,0382016/17 Plan 1,136 1,266 1,282 1,343 1,260 1,241 1,264 1,257 1,110 1,121 1,146 1,241 13,424 14,6662016/17 Actual 1,184 1,134 1,280 1,263 1,177 1,107 1,184 1,171 1,009 1,057 999 12,565 12,565Variance to 2015/16 104 (23) 52 (49) 31 (63) (192) (75) (48) 80 (165) (348) (348)Variance to 2015/16 % 9.6% ‐2.0% 4.2% ‐3.7% 2.7% ‐5.4% ‐14.0% ‐6.0% ‐4.5% 8.2% ‐14.2% ‐2.69%Variance to Plan 48 (132) (2) (80) (83) (134) (80) (86) (101) (64) (147) (859) (859)Variance to Plan % 4.3% ‐10.4% ‐0.1% ‐5.9% ‐6.6% ‐10.8% ‐6.3% ‐6.8% ‐9.1% ‐5.7% ‐12.8% ‐6.66%
600
700
800
900
1,000
1,100
1,200
1,300
1,400
1,500
Apr May Jun Jul Aug Sep Oct Nov Dec Jan Feb Mar
2015/16 Actual
2016/17 Plan
2016/17 Actual
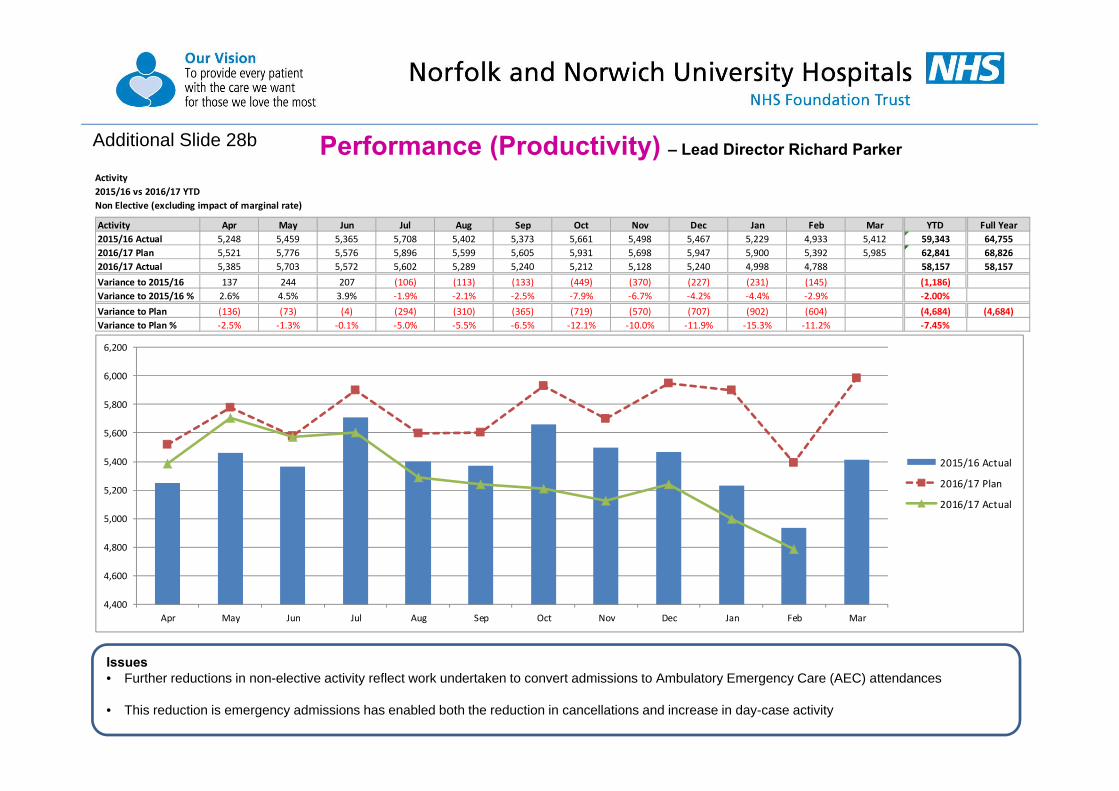
Performance (Productivity) – Lead Director Richard Parker
Issues• Further reductions in non-elective activity reflect work undertaken to convert admissions to Ambulatory Emergency Care (AEC) attendances
• This reduction is emergency admissions has enabled both the reduction in cancellations and increase in day-case activity
Additional Slide 28b
Activity2015/16 vs 2016/17 YTDNon Elective (excluding impact of marginal rate)
Activity Apr May Jun Jul Aug Sep Oct Nov Dec Jan Feb Mar YTD Full Year2015/16 Actual 5,248 5,459 5,365 5,708 5,402 5,373 5,661 5,498 5,467 5,229 4,933 5,412 59,343 64,7552016/17 Plan 5,521 5,776 5,576 5,896 5,599 5,605 5,931 5,698 5,947 5,900 5,392 5,985 62,841 68,8262016/17 Actual 5,385 5,703 5,572 5,602 5,289 5,240 5,212 5,128 5,240 4,998 4,788 58,157 58,157Variance to 2015/16 137 244 207 (106) (113) (133) (449) (370) (227) (231) (145) (1,186)Variance to 2015/16 % 2.6% 4.5% 3.9% ‐1.9% ‐2.1% ‐2.5% ‐7.9% ‐6.7% ‐4.2% ‐4.4% ‐2.9% ‐2.00%Variance to Plan (136) (73) (4) (294) (310) (365) (719) (570) (707) (902) (604) (4,684) (4,684)Variance to Plan % ‐2.5% ‐1.3% ‐0.1% ‐5.0% ‐5.5% ‐6.5% ‐12.1% ‐10.0% ‐11.9% ‐15.3% ‐11.2% ‐7.45%
4,400
4,600
4,800
5,000
5,200
5,400
5,600
5,800
6,000
6,200
Apr May Jun Jul Aug Sep Oct Nov Dec Jan Feb Mar
2015/16 Actual
2016/17 Plan
2016/17 Actual
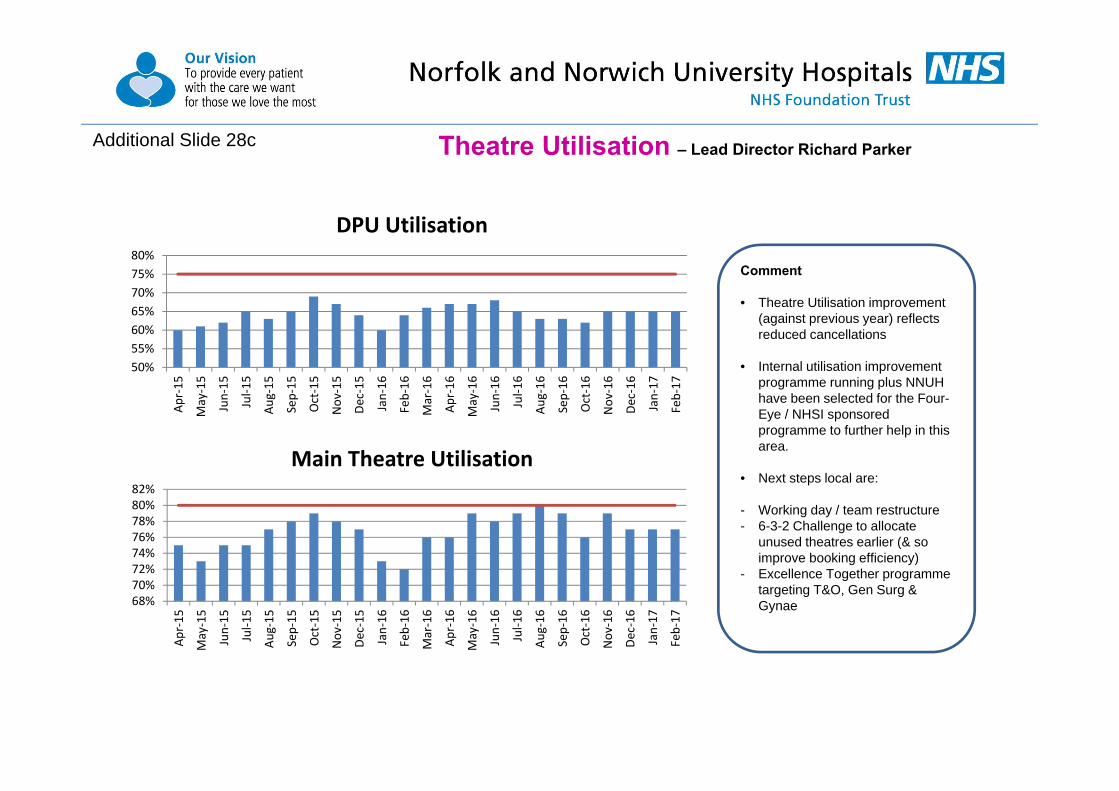
Theatre Utilisation – Lead Director Richard Parker
Comment
• Theatre Utilisation improvement (against previous year) reflects reduced cancellations
• Internal utilisation improvement programme running plus NNUH have been selected for the Four-Eye / NHSI sponsored programme to further help in this area.
• Next steps local are:
- Working day / team restructure- 6-3-2 Challenge to allocate
unused theatres earlier (& so improve booking efficiency)
- Excellence Together programme targeting T&O, Gen Surg & Gynae
Additional Slide 28c
50%55%60%65%70%75%80%
Apr‐15
May‐15
Jun‐15
Jul‐1
5
Aug‐15
Sep‐15
Oct‐15
Nov‐15
Dec‐15
Jan‐16
Feb‐16
Mar‐16
Apr‐16
May‐16
Jun‐16
Jul‐1
6
Aug‐16
Sep‐16
Oct‐16
Nov‐16
Dec‐16
Jan‐17
Feb‐17
DPU Utilisation
68%70%72%74%76%78%80%82%
Apr‐15
May‐15
Jun‐15
Jul‐1
5
Aug‐15
Sep‐15
Oct‐15
Nov‐15
Dec‐15
Jan‐16
Feb‐16
Mar‐16
Apr‐16
May‐16
Jun‐16
Jul‐1
6
Aug‐16
Sep‐16
Oct‐16
Nov‐16
Dec‐16
Jan‐17
Feb‐17
Main Theatre Utilisation
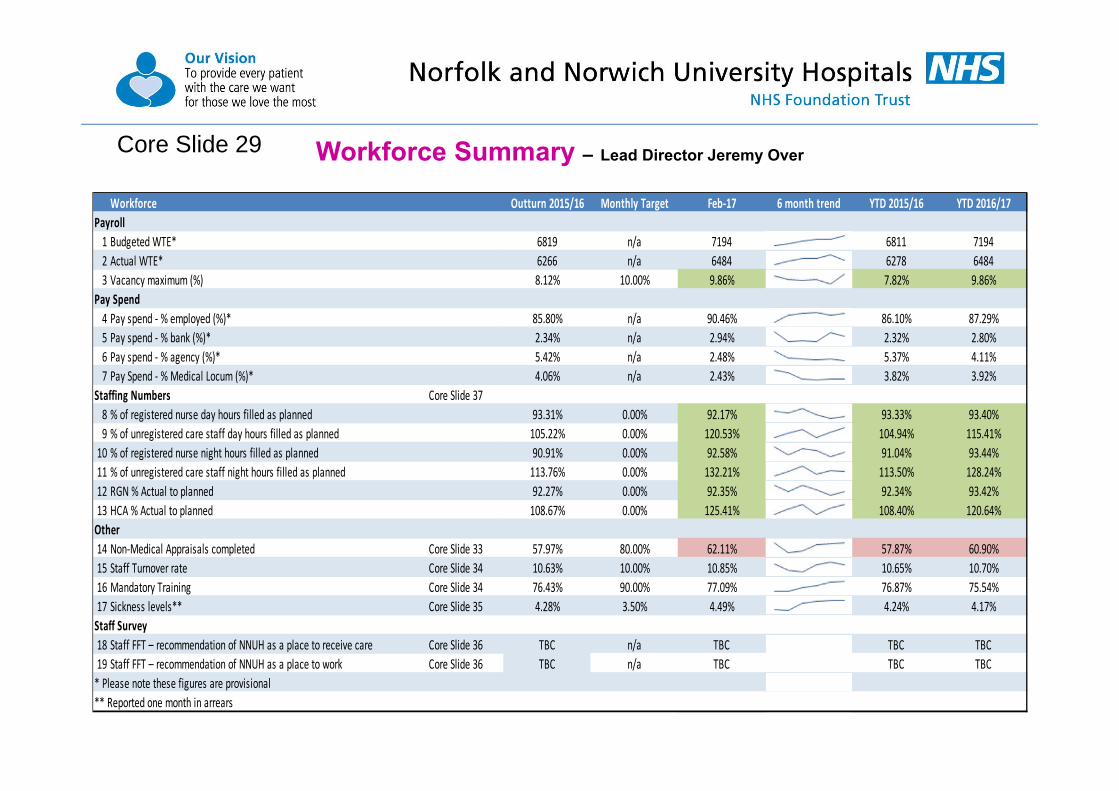
Workforce Summary – Lead Director Jeremy OverCore Slide 29
Workforce Outturn 2015/16 Monthly Target Feb‐17 6 month trend YTD 2015/16 YTD 2016/17Payroll1 Budgeted WTE* 6819 n/a 7194 6811 71942 Actual WTE* 6266 n/a 6484 6278 64843 Vacancy maximum (%) 8.12% 10.00% 9.86% 7.82% 9.86%
Pay Spend4 Pay spend ‐ % employed (%)* 85.80% n/a 90.46% 86.10% 87.29%5 Pay spend ‐ % bank (%)* 2.34% n/a 2.94% 2.32% 2.80%6 Pay spend ‐ % agency (%)* 5.42% n/a 2.48% 5.37% 4.11%7 Pay Spend ‐ % Medical Locum (%)* 4.06% n/a 2.43% 3.82% 3.92%
Staffing Numbers Core Slide 378 % of registered nurse day hours filled as planned 93.31% 0.00% 92.17% 93.33% 93.40%9 % of unregistered care staff day hours filled as planned 105.22% 0.00% 120.53% 104.94% 115.41%10 % of registered nurse night hours filled as planned 90.91% 0.00% 92.58% 91.04% 93.44%11 % of unregistered care staff night hours filled as planned 113.76% 0.00% 132.21% 113.50% 128.24%12 RGN % Actual to planned 92.27% 0.00% 92.35% 92.34% 93.42%13 HCA % Actual to planned 108.67% 0.00% 125.41% 108.40% 120.64%Other14 Non‐Medical Appraisals completed Core Slide 33 57.97% 80.00% 62.11% 57.87% 60.90%15 Staff Turnover rate Core Slide 34 10.63% 10.00% 10.85% 10.65% 10.70%16 Mandatory Training Core Slide 34 76.43% 90.00% 77.09% 76.87% 75.54%17 Sickness levels** Core Slide 35 4.28% 3.50% 4.49% 4.24% 4.17%Staff Survey18 Staff FFT – recommendation of NNUH as a place to receive care Core Slide 36 TBC n/a TBC TBC TBC19 Staff FFT – recommendation of NNUH as a place to work Core Slide 36 TBC n/a TBC TBC TBC* Please note these figures are provisional** Reported one month in arrears
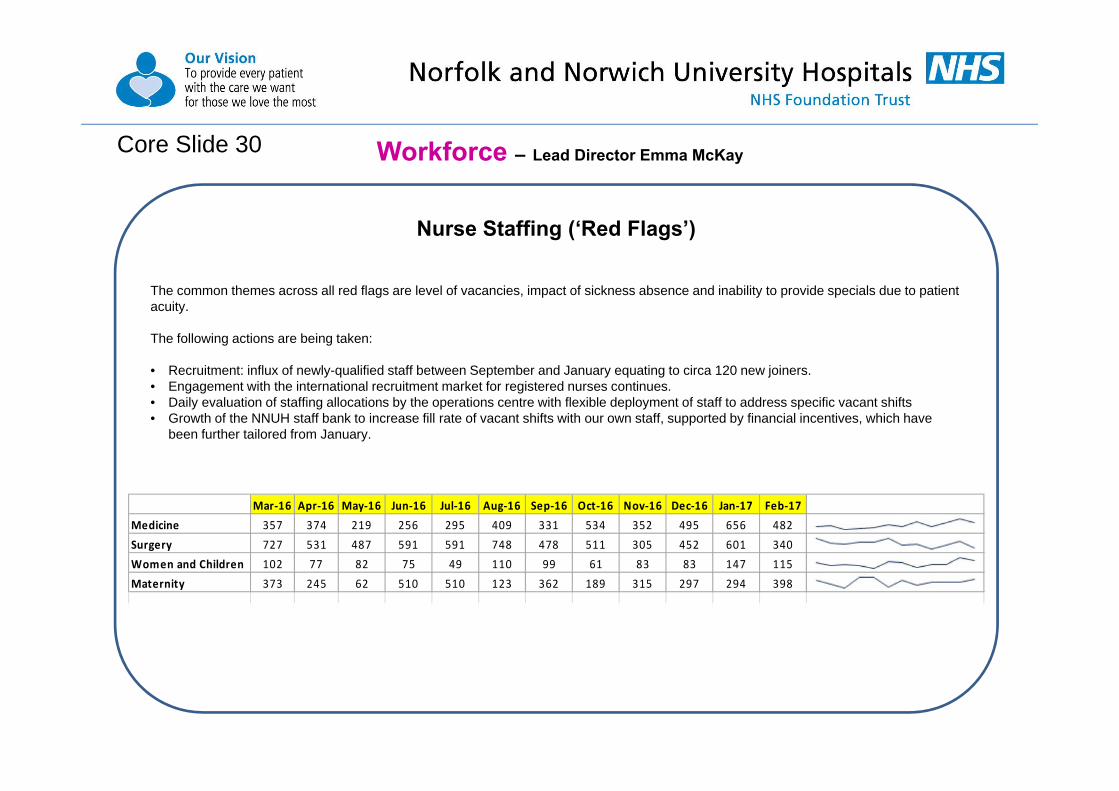
Nurse Staffing (‘Red Flags’)
The common themes across all red flags are level of vacancies, impact of sickness absence and inability to provide specials due to patient acuity.
The following actions are being taken:
• Recruitment: influx of newly-qualified staff between September and January equating to circa 120 new joiners.• Engagement with the international recruitment market for registered nurses continues.• Daily evaluation of staffing allocations by the operations centre with flexible deployment of staff to address specific vacant shifts• Growth of the NNUH staff bank to increase fill rate of vacant shifts with our own staff, supported by financial incentives, which have
been further tailored from January.
Workforce – Lead Director Emma McKayCore Slide 30
Mar‐16 Apr‐16 May‐16 Jun‐16 Jul‐16 Aug‐16 Sep‐16 Oct‐16 Nov‐16 Dec‐16 Jan‐17 Feb‐17Medicine 357 374 219 256 295 409 331 534 352 495 656 482Surgery 727 531 487 591 591 748 478 511 305 452 601 340Women and Children 102 77 82 75 49 110 99 61 83 83 147 115Maternity 373 245 62 510 510 123 362 189 315 297 294 398

Workforce - Lead Director Jeremy OverCore Slide 31
Agency and Locum Shifts Booked
ActionsNNUH has an overarching work programme addressing expenditure on ‘Premium Pay’ activity, with:• Weekly price cap compliance is now at 79% (compared to c.0% in
September• Break glass arrangements only for exceptional safety grounds (with
executive level sign off).• Pre-authorisation checklist and daily scrutiny by Medical Director for all
locum requests has been very effective.• Recruitment Oversight Group is in operation and applies controls and
assists with speedy recruitment. • Bank incentives are embedding.• NHSI and EoE Procurement Hub are encouraging other Trusts to learn
from our approach.
Issues
• Demand for agency staff has remained broadly stable in February.• The reduction in demand and impact of agency price cap compliance since
October has led to significantly reduced agency expenditure.• In turn, this has contributed to the favourable position in terms of total pay
expenditure versus plan (£290k favourable; 1.1% compared to plan).• Overall volumes of booked shifts are around 50% lower than the peak seen in
June 2016.• Controls continue to be effective and responsive to situations where temporary
workers are absolutely required based on clinical need.• The Finance section of the IPR details the expenditure for the month.
0
50
100
150
200
250
300
350
400
450
500
06/06/1613/06/1620/06/1627/06/1604/07/1611/07/1618/07/1625/07/1601/08/1608/08/1615/08/1622/08/1629/08/1605/09/1612/09/1619/09/1626/09/1603/10/1610/10/1617/10/1624/10/1631/10/1607/11/1614/11/1621/11/1628/11/1605/12/1612/12/1619/12/1626/12/1602/01/1709/01/1716/01/1723/01/1730/01/1706/02/1713/02/1720/02/1706/03/17
HCA
RN
Scientific,Therapeuticand TechnicalHealth CareScientists
ODP
Admin &Clerical
Medics
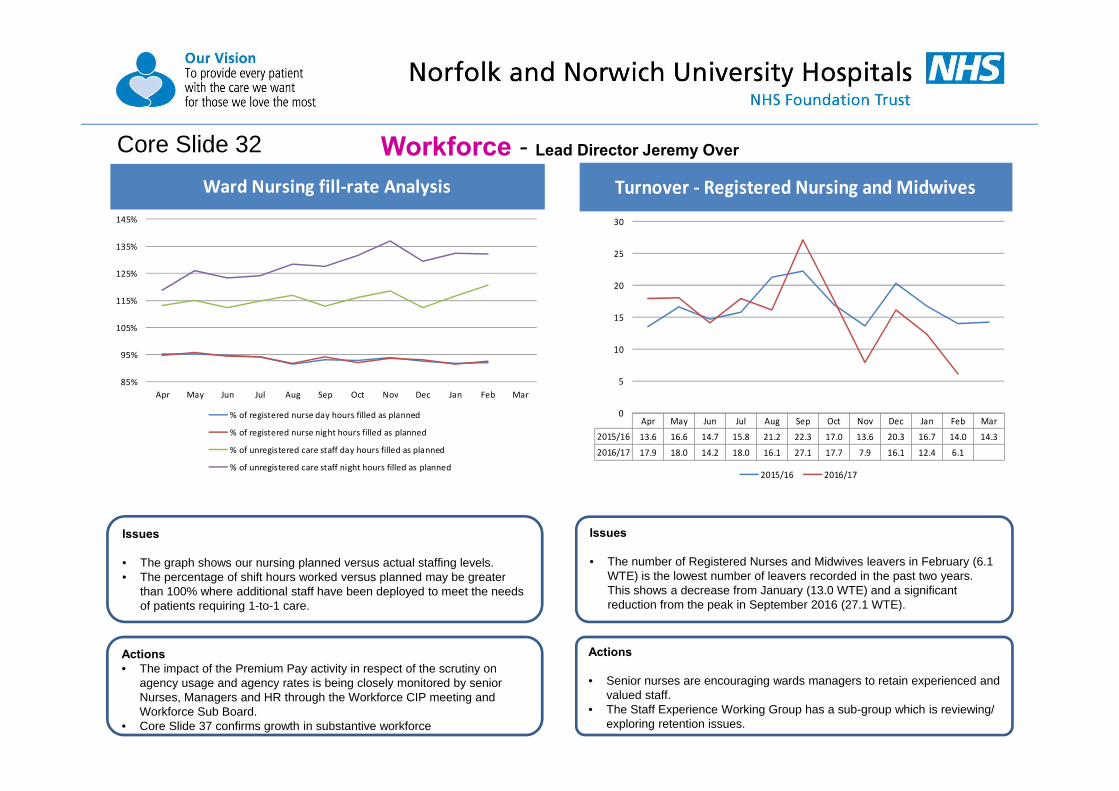
Workforce - Lead Director Jeremy OverCore Slide 32
Turnover ‐ Registered Nursing and Midwives
Apr May Jun Jul Aug Sep Oct Nov Dec Jan Feb Mar
2015/16 13.6 16.6 14.7 15.8 21.2 22.3 17.0 13.6 20.3 16.7 14.0 14.3
2016/17 17.9 18.0 14.2 18.0 16.1 27.1 17.7 7.9 16.1 12.4 6.1
0
5
10
15
20
25
30
2015/16 2016/17
Ward Nursing fill‐rate Analysis
85%
95%
105%
115%
125%
135%
145%
Apr May Jun Jul Aug Sep Oct Nov Dec Jan Feb Mar
% of registered nurse day hours filled as planned
% of registered nurse night hours filled as planned
% of unregistered care staff day hours filled as planned
% of unregistered care staff night hours filled as planned
Actions• The impact of the Premium Pay activity in respect of the scrutiny on
agency usage and agency rates is being closely monitored by senior Nurses, Managers and HR through the Workforce CIP meeting and Workforce Sub Board.
• Core Slide 37 confirms growth in substantive workforce
Issues
• The graph shows our nursing planned versus actual staffing levels. • The percentage of shift hours worked versus planned may be greater
than 100% where additional staff have been deployed to meet the needs of patients requiring 1-to-1 care.
Actions
• Senior nurses are encouraging wards managers to retain experienced and valued staff.
• The Staff Experience Working Group has a sub-group which is reviewing/ exploring retention issues.
Issues
• The number of Registered Nurses and Midwives leavers in February (6.1 WTE) is the lowest number of leavers recorded in the past two years. This shows a decrease from January (13.0 WTE) and a significant reduction from the peak in September 2016 (27.1 WTE).

Workforce - Lead Director Jeremy OverCore Slide 33
Non‐Medical Appraisals completed
Apr May Jun Jul Aug Sep Oct Nov Dec Jan Feb Mar2015/16 71.8% 70.2% 69.0% 66.7% 36.8% 43.8% 50.8% 53.3% 56.8% 58.8% 58.6% 59.1%
2016/17 58.0% 59.3% 61.0% 62.4% 62.8% 62.1% 59.1% 59.6% 61.6% 61.8% 62.1%
Target 80% 80% 80% 80% 80% 80% 80% 80% 80% 80% 80% 80%
0%
10%
20%
30%
40%
50%
60%
70%
80%
90%
100%
2015/16 2016/17 Target
Actions• Appraisal rates are discussed with divisions at monthly performance committee meetings.• The CEO and Executive Directors continue to stress the importance of the appraisal experience.• The importance of appraisal is a feature PRIDE Values in Action plans and our PRIDE values and behaviours are included within appraisal conversations.
Issues• In the last 12 months, 3,472 appraisals have been undertaken within timescales.• This equates to 62.1% of all staff having had an appraisal within the preceding year.• The NHS Staff Survey results for 2016 suggests that 83% of our staff have responded that they have been appraised in the last 12 months (up from 77% in
2015). Also, the survey reports an increase in the quality of appraisals from 2015 to 2016 (the ‘rating’ increasing from 2.84 to 2.91 of a scale of 1-5). These figures will include medical appraisal, compliance with which is at 96%.
Non‐Medical Appraisal Completion
Eligible for Appraisal
Current Appraisal
Completion %
Trust 5590 3472 62.1%by DivisionMedicine 1673 878 52.5%Surgery 1550 1026 66.2%Women & Children 584 437 74.8%Clinical Support Services 1221 825 67.6%Corporate 562 306 54.4% Nursing & Education 143 73 51.0% Research & Development 98 56 57.1% Resources 144 63 43.8% Strategy & Planning 48 36 75.0% Workforce 103 73 70.9%by Staff GroupAdd. Prof. Scientific and Technical 317 210 66.2%Additional Clinical Services 1110 715 64.4%Administrative and Clerical 1414 784 55.4%Allied Health Professionals 411 266 64.7%Estates and Ancillary 144 61 42.4%Healthcare Scientists 214 147 68.7%Nursing and Midwifery Registered 1980 1289 65.1%

Workforce - Lead Director Jeremy OverCore Slide 34
Mandatory Training
Apr May Jun Jul Aug Sep Oct Nov Dec Jan Feb Mar2015/16 72.6% 73.6% 76.0% 76.9% 77.0% 77.2% 79.3% 79.8% 80.4% 79.4% 73.3% 71.7%
2016/17 73.8% 74.8% 75.6% 75.8% 75.4% 75.0% 75.0% 75.7% 76.1% 76.8% 77.1%
Target 90% 90% 90% 90% 90% 90% 90% 90% 90% 90% 90% 90%
60%
65%
70%
75%
80%
85%
90%
95%
100%
2015/16 2016/17 Target
Staff Turnover rate
Apr May Jun Jul Aug Sep Oct Nov Dec Jan Feb Mar2015/16 10.6% 10.8% 10.9% 11.0% 10.7% 10.6% 10.6% 10.4% 10.6% 10.5% 10.3% 10.4%
2016/17 10.3% 10.4% 10.5% 10.7% 10.7% 10.9% 10.7% 10.7% 10.9% 10.9% 10.8%
Target 10% 10% 10% 10% 10% 10% 10% 10% 10% 10% 10% 10%
8.0%
8.5%
9.0%
9.5%
10.0%
10.5%
11.0%
11.5%
12.0%
2015/16 2016/17 Target
Actions• The newly-formed Staff Experience Working Group has established a
working group to focus on turnover.• Retention is a feature in discussions with senior nurses as part of overall
approach to resourcing.• Of the known reasons for leaving, approximately two-thirds continue to
be for retirement or promotion/relocation-related reasons.
Issues• The 12-monthly turnover rate remains consistent at 10.8%.• The actual numbers of leavers in February was 26.8 (WTE) and the
monthly turnover rate 0.5%.• This is the lowest monthly turnover rate in two years.
Actions• Divisional level mandatory training rates are discussed at executive
performance committee. • The Head of OD & Learning is leading on a project to address the
capacity and system constraints that need to be overcome in order to enable greater take-up of mandatory training.
• A review of core mandatory training has been presented to the Workforce Sub Board which provides clarity for essential requirements and new learning requests.
Issues• The overall compliance rate has risen to 77.1%.• This is the highest rate in since January 2016 and is the 5th consecutive
month-on-month increase.
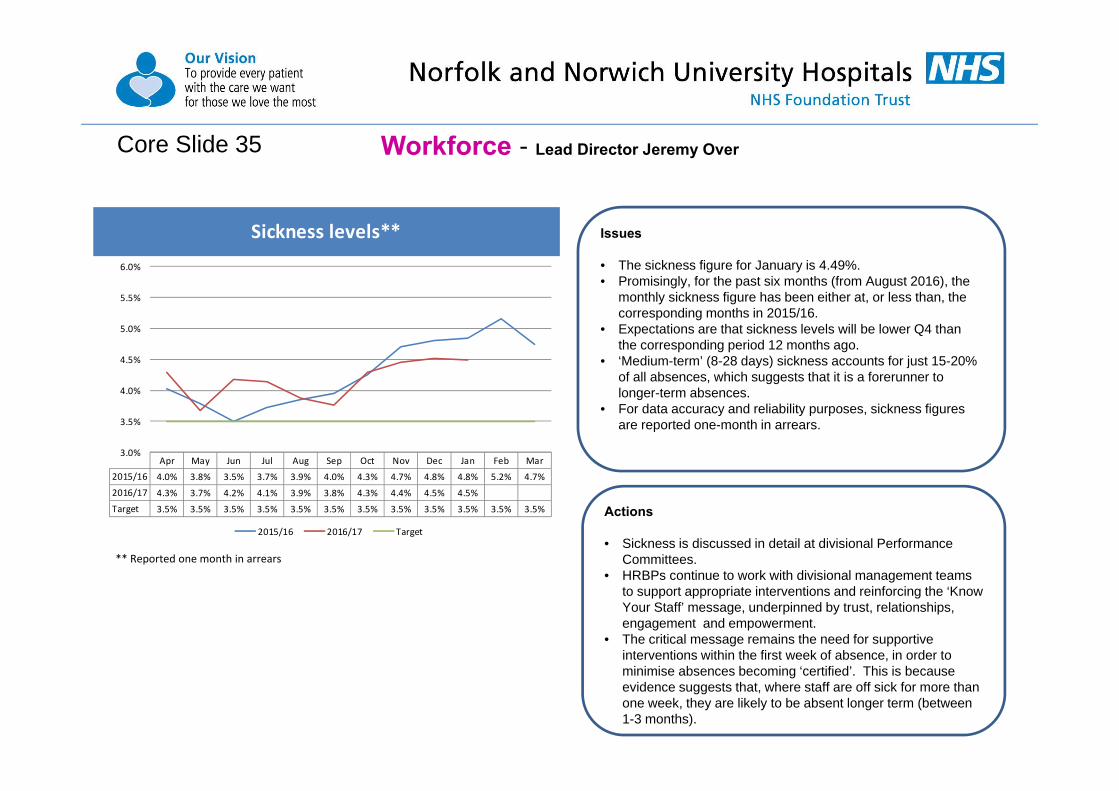
Workforce - Lead Director Jeremy OverCore Slide 35
Sickness levels**
Apr May Jun Jul Aug Sep Oct Nov Dec Jan Feb Mar
2015/16 4.0% 3.8% 3.5% 3.7% 3.9% 4.0% 4.3% 4.7% 4.8% 4.8% 5.2% 4.7%
2016/17 4.3% 3.7% 4.2% 4.1% 3.9% 3.8% 4.3% 4.4% 4.5% 4.5%
Target 3.5% 3.5% 3.5% 3.5% 3.5% 3.5% 3.5% 3.5% 3.5% 3.5% 3.5% 3.5%
3.0%
3.5%
4.0%
4.5%
5.0%
5.5%
6.0%
2015/16 2016/17 Target
Actions
• Sickness is discussed in detail at divisional Performance Committees.
• HRBPs continue to work with divisional management teams to support appropriate interventions and reinforcing the ‘Know Your Staff’ message, underpinned by trust, relationships, engagement and empowerment.
• The critical message remains the need for supportive interventions within the first week of absence, in order to minimise absences becoming ‘certified’. This is because evidence suggests that, where staff are off sick for more than one week, they are likely to be absent longer term (between 1-3 months).
Issues
• The sickness figure for January is 4.49%.• Promisingly, for the past six months (from August 2016), the
monthly sickness figure has been either at, or less than, the corresponding months in 2015/16.
• Expectations are that sickness levels will be lower Q4 than the corresponding period 12 months ago.
• ‘Medium-term’ (8-28 days) sickness accounts for just 15-20% of all absences, which suggests that it is a forerunner to longer-term absences.
• For data accuracy and reliability purposes, sickness figures are reported one-month in arrears.
** Reported one month in arrears
Core Slide 36
Friends and Family Scores
This slide has been left blank
Workforce - Lead Director Jeremy Over

Workforce - Lead Director Jeremy OverCore Slide 37
• This analysis reflects nursing workforce data incorporating equivalent figures for employed, bank, agency, overtime and excess hours. • This data also reflects the impact of the Premium Pay activities in reducing agency volume• The actual numbers of staff in post is at its highest ever level, reflecting growth in the workforce.• Despite vacancies, temporary resources are supplementing the workforce.
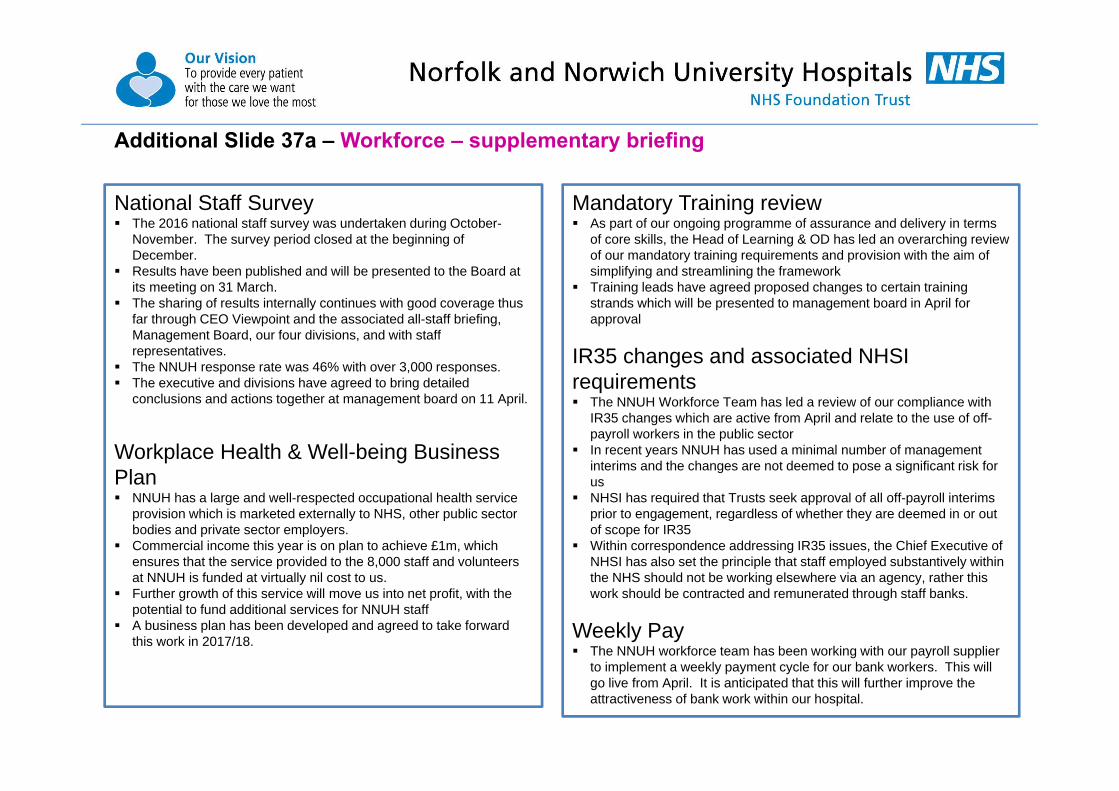
Additional Slide 37a – Workforce – supplementary briefing
National Staff Survey The 2016 national staff survey was undertaken during October-
November. The survey period closed at the beginning of December.
Results have been published and will be presented to the Board at its meeting on 31 March.
The sharing of results internally continues with good coverage thus far through CEO Viewpoint and the associated all-staff briefing, Management Board, our four divisions, and with staff representatives.
The NNUH response rate was 46% with over 3,000 responses. The executive and divisions have agreed to bring detailed
conclusions and actions together at management board on 11 April.
Workplace Health & Well-being Business Plan NNUH has a large and well-respected occupational health service
provision which is marketed externally to NHS, other public sector bodies and private sector employers.
Commercial income this year is on plan to achieve £1m, which ensures that the service provided to the 8,000 staff and volunteers at NNUH is funded at virtually nil cost to us.
Further growth of this service will move us into net profit, with the potential to fund additional services for NNUH staff
A business plan has been developed and agreed to take forward this work in 2017/18.
Mandatory Training review As part of our ongoing programme of assurance and delivery in terms
of core skills, the Head of Learning & OD has led an overarching review of our mandatory training requirements and provision with the aim of simplifying and streamlining the framework
Training leads have agreed proposed changes to certain training strands which will be presented to management board in April for approval
IR35 changes and associated NHSI requirements The NNUH Workforce Team has led a review of our compliance with
IR35 changes which are active from April and relate to the use of off-payroll workers in the public sector
In recent years NNUH has used a minimal number of management interims and the changes are not deemed to pose a significant risk for us
NHSI has required that Trusts seek approval of all off-payroll interims prior to engagement, regardless of whether they are deemed in or out of scope for IR35
Within correspondence addressing IR35 issues, the Chief Executive of NHSI has also set the principle that staff employed substantively within the NHS should not be working elsewhere via an agency, rather this work should be contracted and remunerated through staff banks.
Weekly Pay The NNUH workforce team has been working with our payroll supplier
to implement a weekly payment cycle for our bank workers. This will go live from April. It is anticipated that this will further improve the attractiveness of bank work within our hospital.

Finance Summary – Lead Director - James NormanCORE SLIDE 38
M11 YTD & Discreet • Clinical income is cumulatively £7.1m (1.8%) behind plan, mainly due to non-electives, outpatients and cost & volume activity being lower than plan. • Other income is favourable to plan which in part offsets non recurrent costs over plan, with the remainder being the result of a balance sheet prudence review.• Operating expenditure – Pay costs were underspent in month (£289k) which reflects the continued impact of tightened controls over premium pay. Cumulatively,
Pay is underspent by £1,668k. Clinical Supplies were underspent in month (£183k) & remain underspent in the YTD (£346k). Non-Clinical Supplies were overspent in month (£66k), the YTD overspend is £1,276k.
• The M11 Pay underspend of £289k compares to underspends in the previous three months - M8 (£399k under), M9 (£258k under), M10 (£234k under).• The CIP plan of £21.8m to date has been met with an overachievement overall of £55k.
Risks• CCG challenge risks remain – at @ £0.5m full year. • CQUIN under-delivery is being provided for to cover an updated ‘most likely’ risk of £1.26m full year. This has been provided in full at M11. • Penalties – an update will be provided at the meeting. No provision for any unexpected charges has been made in the I&E nor in the cash flow.
Cash• Cash at end M11 was £2.2m – being better than plan. The original plan assumed receipt of £15m working capital in September which has not been required as a
result of the work performed on cash management. The improvement results from a reduction in supplier payment runs and negotiated improvements on timing of cash inflows from CCGs.
• We have submitted the details required to secure £16m of funds for mid-March 2017. This will crystallise a saving of £1.2m in interest charges as we have now exited FSM
Full Year Feb‐17 YTD YTD Variance fromPlan 16/17 Actual Actual Plan YTD Plan
Tota l income excluding interest £565,288k £45,278k £515,020k £516,527k (£1,507k)Tota l Pay Costs £319,866k £26,007k £291,962k £293,630k £1,668kOther Operating Expenditure (excluding drugs) £155,745k £12,552k £143,877k £143,070k (£807k)EBITDA £18,408k £1,000k £14,139k £14,515k (£376k)CIP Savings Achieved 'Overa l l ' £24,897k £3,475k £21,875k £21,820k £55kPay CIP Savings Achieved £11,957k £1,661k £10,877k £10,519k £358kNon‐Pay CIP Savings Achieved £6,053k £976k £5,124k £5,335k (£211k)Revenue CIP Savings Achieved £4,598k £557k £3,464k £3,825k (£361k)Clos ing Cash balance £1,778k £2,232k £2,232k £994k £1,238kCapita l expenditure £21,517k £23k £11,133k £17,167k (£6,034k)Non‐Elective Activi ty ‐ margina l rate ‐ Financia l Impact £7,756k £645k £7,046k £7,081k £35kEmergency readmiss ions penal ties : Fol lowing Elective & Non Elective £2,125k £87k £1,696k £1,941k £245kUse of Resources Metric (UoR) 4 3 3Defici t for the year (£25,032k) (£2,613k) (£25,220k) (£25,222k) £2kForecast ‐ Ful l Year (£25,032k)

Finance
Rolling week cash flow forecastClosing Cash balance
CORE SLIDE 39
Apr May Jun Jul Aug Sep Oct Nov Dec Jan Feb Mar
2015‐16 75,506 69,552 62,183 58,846 63,594 57,282 52,898 49,995 44,354 40,248 39,311 31,494
2016‐17 28,696 20,752 15,777 15,188 18,114 11,896 11,833 9,472 3,733 4,381 2232
Plan 28,696 20,752 15,777 15,194 18,114 11,892 8,047 1,926 9,619 4,315 994 1,778
Plan ‐ Without Support 28696 20752 15777 15194 18114 11892 8047 1926 ‐5381 ‐10685 ‐14006 ‐13222
‐30,000
‐10,000
10,000
30,000
50,000
70,000
2015‐16 2016‐17 Plan Plan ‐ Without Support
• Closing cash at the end of M11 was £2.2m - better than forecast plan.
• The forecast is updated on a weekly basis. The required working capital draw down has moved out to the week ending 24th March from end February.
• This was again facilitated by earlier receipt of CCG payments for activity, cost controls and close supplier payment management.
• Cash will be required in March 2017 and a draw down of £16m has been requested.
• NHSI have confirmed that the applicable interest rate for us is now 3.5%. Our cash management has successfully avoided incurring rates of 6% on any draw downs.
• The rolling 13 week cash flow forecast is Appendix 4 to the financial appendices.
• Pattern of income and expenditure demonstrates pinch point weeks within a monthly ‘period’.
• We have reduced the number of pay runs to one per weekand agreed earlier receipt date for our clinical income from CCGs.
• A formal agreement for a working capital facility is in place with the DH for a maximum of £21.233m.
• Risks include; (i) timing - clinical income over-performance being withheld by CCGs pending queries, other NHS bodies implementing similar strategies & delaying payment to the NNUH and (ii) amount –penalties, CQUINs and Commissioner QIPPs.
Lead director – James Norman
0
5,000
10,000
15,000
20,000
25,000
30,000
Forecast cash

Apr May Jun Jul Aug Sep Oct Nov Dec Jan Feb Mar2016‐17 ‐461 1,376 888 1,221 ‐1,178 2,289 2,840 2,372 1,244 2,548 1,000
Plan ‐460 1,374 888 1,222 ‐1,177 2,196 2,780 2,484 1,279 2,842 1,088 3,893
‐2000
‐1000
0
1000
2000
3000
4000
5000
2016‐17 Plan
Finance
CIP Performance
• Focus on forward review of planned activity to inform actions to improve clinical income & productivity.
• We are continuing our work with the divisions to create a culture of sustainable cost containment.
• At the end of M11, EBITDA is £376k behind plan. This reflects a net of items, key being Clinical Income at £7.1m less than plan mostly mitigated by Other Income being £6.4m better than plan.
• Clinical income movement in month was £1.35m behind plan.
CIP update
• NHSI have been provided with details of all the CIPs which have been profiled by month into the forecast. These total £24.614m.
• After a review of the CIP plans at the end of Q3, we have a revised plan total of £24.897m for 16/17.
• Savings will be generated in the following areas:
Revenue £4,599kPay £11,957kDrugs £666kClinical supplies £1,413kNon-clinical supplies £3,706kPFI operating expenses £267kOther non-opex £2,289kTotal £24,897k
• A weekly governance process is in place to review and challenge progress.
• The CIPs are assessed monthly on a scheme by scheme basis.• Planned CIP savings for February were £3.386m. Savings reported
for the month totalled £3.475m, a favourable variance of £0.90m.• Planned CIP savings for the YTD were £21.8m. Savings reported
YTD total £21.9m, a favourable variance of £0.055m.• Plan CIP for the remaining month is £3.1m, if this is achieved we will
deliver total savings for the year of £24.9m against a plan of £24.6m.
EBITDACORE SLIDE 40 Lead director – James Norman

24,000
24,500
25,000
25,500
26,000
26,500
27,000
27,500
28,000
Apr May Jun Jul Aug Sep Oct Nov Dec Jan Feb Mar
Spend £k
1617 Actuals
1516 Actuals
Forecast
Pay – Locums & Agency (actual) rolling 12 months
Pay – Plan & Actual
Planned Actions• Workforce team focusing on premium cost reduction in particular controls
over associated spend..• Focus on recruitment to vacant posts to limit reliance on locums, agency &
other premium payroll costs• Active planning for every locum post to displace and focus on reducing
locum agency rates. Nationally the view is there is further to go on Locum costs, with plans to ‘correct’ the market in train.
• Further development of weekly reports showing shifts booked, allowing more real time scrutiny.
• In February, Pay was under-spent by £289k (1.1%).• Cumulative Pay expenditure is £292m against a forecast of £293.6m, a
favorable variance of £1.7m (0.6%).• Pay CIP plan for the month was £1,576k, reported savings were £1,661k.
• New staffing framework is complete with a list of preferred suppliers at price cap levels.
• ‘Break glass’ arrangements are possible in exceptional circumstances.• New RN bank incentives commenced in October.• Work actively in progress on addressing medical locum agency rates.
• Agency spend in M11 was £644k. The average monthly cost of all agency year to date is £1.1m. Thus M11 is £456k better than monthly average for year to date.
• Agency spend average for previous three months is £741k. Thus M11 is better by £97k than the previous three months average.
• Locum spend in M11 was £532k. The average monthly cost of all locums year to date is £947k. Thus M11 is £415k better than monthly average for the year to date.
• Locum spend average for previous three months is £500k. Thus M11 is worse by £32k than the previous three months average.
FinanceCORE SLIDE 41 Lead director – James Norman
0
200
400
600
800
1,000
1,200
1,400
1,600
1,800
Mar-16 Apr-16 May-16 Jun-16 Jul-16 Aug-16 Sep-16 Oct-16 Nov-16 Dec-16 Jan-17 Feb-17
Agency Locum
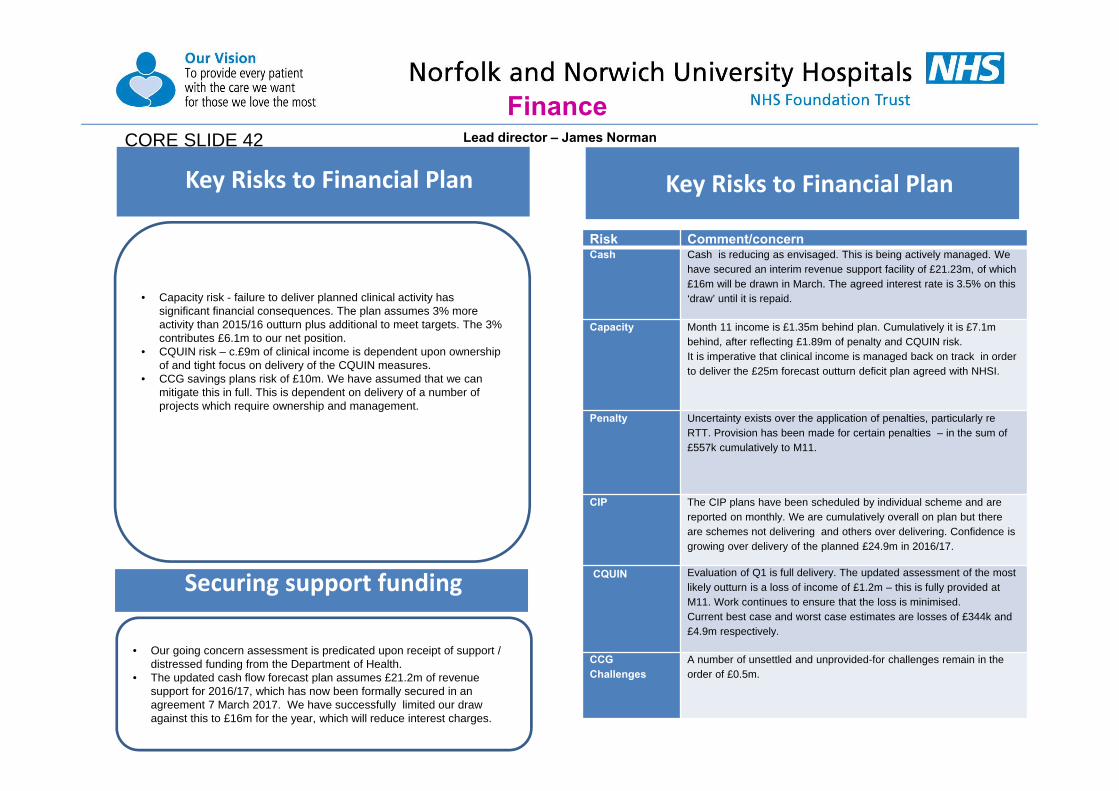
Key Risks to Financial Plan
Cash
• Our going concern assessment is predicated upon receipt of support / distressed funding from the Department of Health.
• The updated cash flow forecast plan assumes £21.2m of revenue support for 2016/17, which has now been formally secured in an agreement 7 March 2017. We have successfully limited our draw against this to £16m for the year, which will reduce interest charges.
Securing support funding
Closing Cash balance
FinanceCORE SLIDE 42
• Capacity risk - failure to deliver planned clinical activity has significant financial consequences. The plan assumes 3% more activity than 2015/16 outturn plus additional to meet targets. The 3% contributes £6.1m to our net position.
• CQUIN risk – c.£9m of clinical income is dependent upon ownership of and tight focus on delivery of the CQUIN measures.
• CCG savings plans risk of £10m. We have assumed that we can mitigate this in full. This is dependent on delivery of a number of projects which require ownership and management.
Key Risks to Financial Plan
Risk Comment/concernCash Cash is reducing as envisaged. This is being actively managed. We
have secured an interim revenue support facility of £21.23m, of which £16m will be drawn in March. The agreed interest rate is 3.5% on this ‘draw’ until it is repaid.
Capacity Month 11 income is £1.35m behind plan. Cumulatively it is £7.1m behind, after reflecting £1.89m of penalty and CQUIN risk. It is imperative that clinical income is managed back on track in order to deliver the £25m forecast outturn deficit plan agreed with NHSI.
Penalty Uncertainty exists over the application of penalties, particularly re RTT. Provision has been made for certain penalties – in the sum of £557k cumulatively to M11.
CIP The CIP plans have been scheduled by individual scheme and are reported on monthly. We are cumulatively overall on plan but there are schemes not delivering and others over delivering. Confidence is growing over delivery of the planned £24.9m in 2016/17.
CQUIN Evaluation of Q1 is full delivery. The updated assessment of the most likely outturn is a loss of income of £1.2m – this is fully provided at M11. Work continues to ensure that the loss is minimised. Current best case and worst case estimates are losses of £344k and £4.9m respectively.
CCG Challenges
A number of unsettled and unprovided-for challenges remain in the order of £0.5m.
Lead director – James Norman
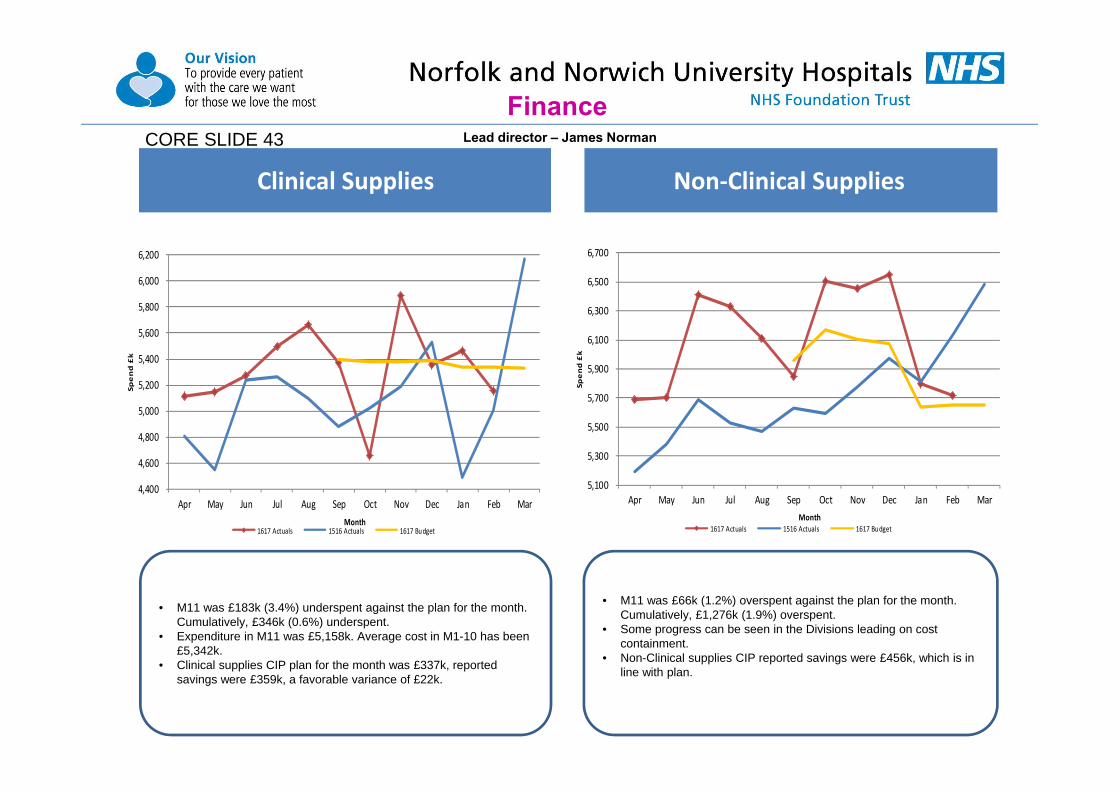
Cost Improvement Plan Clinical Supplies Non‐Clinical Supplies
• M11 was £66k (1.2%) overspent against the plan for the month. Cumulatively, £1,276k (1.9%) overspent.
• Some progress can be seen in the Divisions leading on cost containment.
• Non-Clinical supplies CIP reported savings were £456k, which is in line with plan.
• M11 was £183k (3.4%) underspent against the plan for the month. Cumulatively, £346k (0.6%) underspent.
• Expenditure in M11 was £5,158k. Average cost in M1-10 has been £5,342k.
• Clinical supplies CIP plan for the month was £337k, reported savings were £359k, a favorable variance of £22k.
Finance
4,400
4,600
4,800
5,000
5,200
5,400
5,600
5,800
6,000
6,200
Apr May Jun Jul Aug Sep Oct Nov Dec Jan Feb Mar
Spend £k
Month1617 Actuals 1516 Actuals 1617 Budget
5,100
5,300
5,500
5,700
5,900
6,100
6,300
6,500
6,700
Apr May Jun Jul Aug Sep Oct Nov Dec Jan Feb Mar
Spend £k
Month1617 Actuals 1516 Actuals 1617 Budget
CORE SLIDE 43 Lead director – James Norman

Apr May Jun Jul Aug Sep Oct Nov Dec Jan Feb Mar2015‐16 42280 41768 45757 47133 43880 45914 47519 45726 46854 45569 46502 42831
2016‐17 44671 46655 46870 47494 46047 47712 47294 48771 46244 47984 45278
Plan 44,672 46,655 46,870 47,495 46,048 47,725 48,566 48,065 46,798 47,648 45,984 48,762
4000041000420004300044000450004600047000480004900050000
2015‐16 2016‐17 Plan
• Total income YTD is £515m, £1.5m behind forecast. Excluding non-tariff drugs, which are largely offset by drug costs, it is £0.9m behind plan.
• Clinical income in M11 is £1.349m behind plan.• Penalty costs and CQUIN risks have been reflected as a reduction to
clinical income. Cumulative total at M11 is £1.89m.• The ongoing CQUIN and residual CCG QIPP risk needs to continue to be
actively managed to minimise income loss. • Our ‘most likely’ CQUIN risk is assessed as £1.26m, consistent with our
provision. A significant improvement. Work remains focused on improving the delivery of schemes to minimise this further.
• We need to actively manage these remaining risks to achieve the best outcome and certainty for our financial and cash position.
Finance
Actions• Review readmissions to identify patterns, etc. for remedial action.
• The reduction in income relating to the marginal rate associated with the volume of non-elective admissions is £7,046k to date. This is £36k better than plan.
• The reduction in income relating to readmissions within 30 days is £1,696k to date. This is £245k better than plan.
Total income excluding interestNon‐Elective Activity ‐marginal rate
‐ Financial Impact
Apr May Jun Jul Aug Sep Oct Nov Dec Jan Feb Mar2015‐16 563 564 592 658 323 733 622 634 582 520 809 801
2016‐17 728 755 824 664 546 555 511 685 624 509 645Plan 622 651 628 664 631 632 668 642 670 665 608 675
01002003004005006007008009001000
2015‐16 2016‐17 Plan
CORE SLIDE 44 Lead director – James Norman
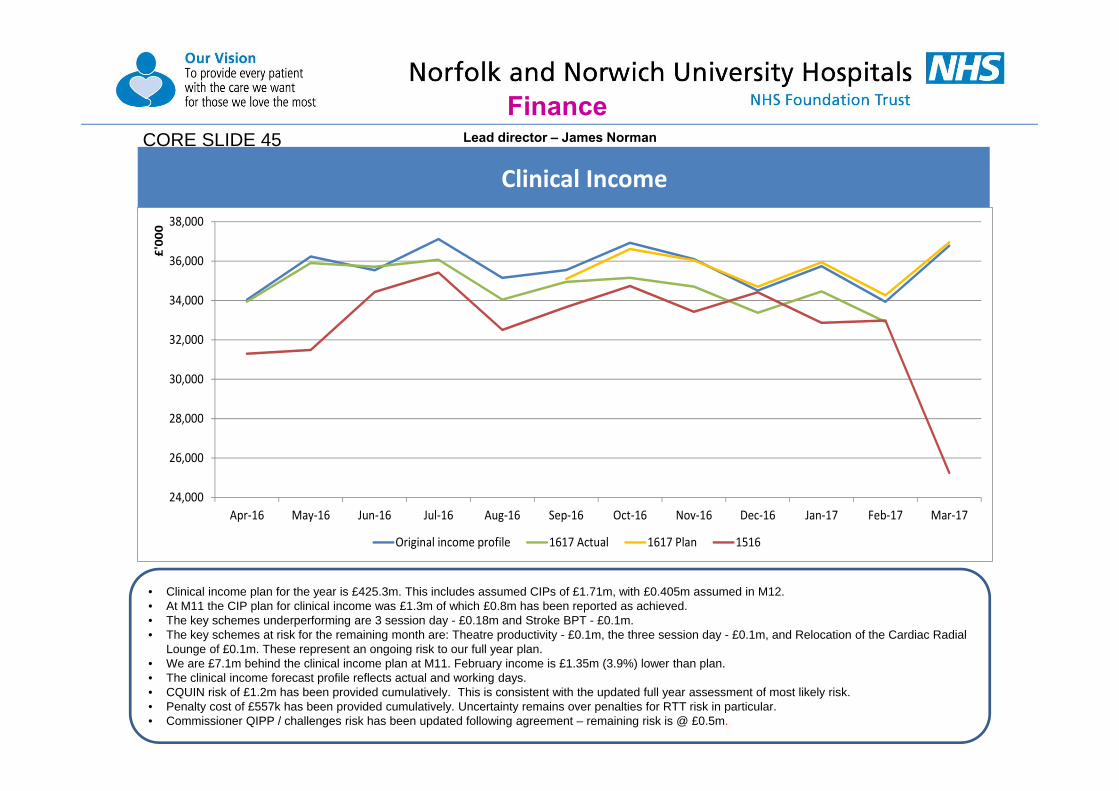
• Clinical income plan for the year is £425.3m. This includes assumed CIPs of £1.71m, with £0.405m assumed in M12.• At M11 the CIP plan for clinical income was £1.3m of which £0.8m has been reported as achieved. • The key schemes underperforming are 3 session day - £0.18m and Stroke BPT - £0.1m. • The key schemes at risk for the remaining month are: Theatre productivity - £0.1m, the three session day - £0.1m, and Relocation of the Cardiac Radial
Lounge of £0.1m. These represent an ongoing risk to our full year plan.• We are £7.1m behind the clinical income plan at M11. February income is £1.35m (3.9%) lower than plan.• The clinical income forecast profile reflects actual and working days. • CQUIN risk of £1.2m has been provided cumulatively. This is consistent with the updated full year assessment of most likely risk. • Penalty cost of £557k has been provided cumulatively. Uncertainty remains over penalties for RTT risk in particular. • Commissioner QIPP / challenges risk has been updated following agreement – remaining risk is @ £0.5m.
Finance
Clinical IncomeCORE SLIDE 45 Lead director – James Norman
24,000
26,000
28,000
30,000
32,000
34,000
36,000
38,000
Apr‐16 May‐16 Jun‐16 Jul‐16 Aug‐16 Sep‐16 Oct‐16 Nov‐16 Dec‐16 Jan‐17 Feb‐17 Mar‐17
£'00
0
Original income profile 1617 Actual 1617 Plan 1516

Norfolk and Norwich University Hospitals NHS Foundation Trust Appendix 1
Income Statement Compared to Forecast Profile
11 month position to 28 February 2017
YT Jan-16Forecast
Plan Actual ActualForecast
Plan Variance Forecast Forecast
Plan Variance£'000 £'000 £'000 £'000 £'000 £'000 £'000 £'000
INCOME NHS clinical income
Clinical Income 425,288 367,242 381,229 388,339 (7,110) 418,178 425,288 (7,110) NT Drugs 60,897 49,756 55,142 55,765 (623) 60,274 60,897 (623)
Total NHS clinical income 486,185 416,998 436,371 444,104 (7,733) 478,452 486,185 (7,733)
Non NHS clinical income Private patients 1,741 1,837 1,536 1,581 (45) 1,696 1,741 (45) Other - RTA 1,239 1,174 926 1,129 (203) 1,036 1,239 (203)
Total Non NHS clinical income 2,980 3,011 2,462 2,710 (248) 2,732 2,980 (248)
Other Income R&D 22,589 20,672 20,397 20,689 (292) 22,297 22,589 (292) Education & Training 20,046 17,900 18,680 18,341 339 20,385 20,046 339 Other non patient care income 33,488 40,321 37,110 30,683 6,427 39,915 33,488 6,427
Total other Income 76,123 78,893 76,187 69,713 6,474 82,597 76,123 6,474
TOTAL OPERATING INCOME 565,288 498,902 515,020 516,527 (1,507) 563,781 565,288 (1,507)
EXPENDITURE Employee benefit expenses (319,866) (277,828) (291,962) (293,630) 1,668 (318,198) (319,866) 1,668 Drugs (71,269) (59,504) (65,042) (65,312) 270 (70,999) (71,269) 270 Clinical supplies (64,252) (55,070) (58,578) (58,924) 346 (63,906) (64,252) 346 Non clinical supplies (71,472) (62,119) (67,101) (65,825) (1,276) (72,748) (71,472) (1,276) PFI operating expenses (20,021) (18,556) (18,198) (18,321) 123 (19,898) (20,021) 123
TOTAL OPERATING EXPENSES (546,880) (473,077) (500,881) (502,012) 1,131 (545,749) (546,880) 1,131
Profit/(loss) from operations 18,408 25,825 14,139 14,515 (376) 18,032 18,408 (376)
Non-operating incomeInterest 58 223 57 55 2 60 58 2Profit/(loss) on asset disposals 86 (2) 45 78 (33) 53 86 (33)
Total non-operating income 144 221 102 133 (31) 113 144 (31)
Non-operating expensesInterest on PFI and Finance leases (17,623) (16,408) (16,159) (16,159) (17,623) (17,623)Interest on Non Commercial Borrowing (300) (217) 217 (83) (300) 217Depreciation (12,378) (12,563) (11,120) (11,342) 222 (12,156) (12,378) 222PDC (2,352) (1,965) (2,155) (2,155) (2,352) (2,352)Other - Contingent Rent (10,931) (9,105) (10,027) (9,997) (30) (10,963) (10,931) (32)
Total non operating expenses (43,584) (40,041) (39,461) (39,870) 409 (43,177) (43,584) 407
(Deficit) after tax from continuing operations (25,032) (13,995) (25,220) (25,222) 2 (25,032) (25,032)
Memo: Donated Asset Additions 35 492 136 32 104 136 35 101
(Deficit) after tax and Donated Asset Additions (24,997) (13,503) (25,084) (25,190) 106 (24,896) (24,997) 101
Year to date Forecast to 31st March 2017
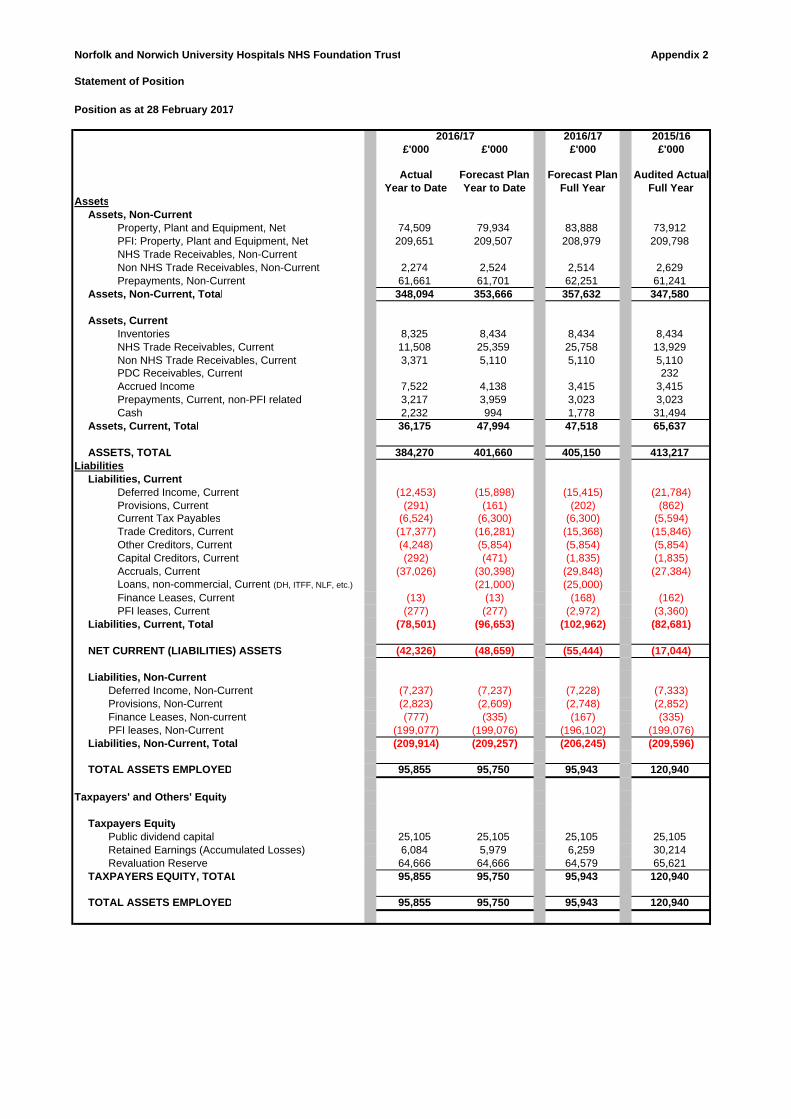
Norfolk and Norwich University Hospitals NHS Foundation Trust Appendix 2
Statement of Position
Position as at 28 February 2017
2016/17 2015/16£'000 £'000 £'000 £'000
Actual Forecast Plan Forecast Plan Audited Actual Year to Date Year to Date Full Year Full Year
AssetsAssets, Non-Current
Property, Plant and Equipment, Net 74,509 79,934 83,888 73,912PFI: Property, Plant and Equipment, Net 209,651 209,507 208,979 209,798NHS Trade Receivables, Non-CurrentNon NHS Trade Receivables, Non-Current 2,274 2,524 2,514 2,629Prepayments, Non-Current 61,661 61,701 62,251 61,241
Assets, Non-Current, Total 348,094 353,666 357,632 347,580
Assets, Current Inventories 8,325 8,434 8,434 8,434NHS Trade Receivables, Current 11,508 25,359 25,758 13,929Non NHS Trade Receivables, Current 3,371 5,110 5,110 5,110PDC Receivables, Current 232Accrued Income 7,522 4,138 3,415 3,415Prepayments, Current, non-PFI related 3,217 3,959 3,023 3,023Cash 2,232 994 1,778 31,494
Assets, Current, Total 36,175 47,994 47,518 65,637
ASSETS, TOTAL 384,270 401,660 405,150 413,217Liabilities
Liabilities, Current Deferred Income, Current (12,453) (15,898) (15,415) (21,784)Provisions, Current (291) (161) (202) (862)Current Tax Payables (6,524) (6,300) (6,300) (5,594)Trade Creditors, Current (17,377) (16,281) (15,368) (15,846)Other Creditors, Current (4,248) (5,854) (5,854) (5,854)Capital Creditors, Current (292) (471) (1,835) (1,835)Accruals, Current (37,026) (30,398) (29,848) (27,384)Loans, non-commercial, Current (DH, ITFF, NLF, etc.) (21,000) (25,000)Finance Leases, Current (13) (13) (168) (162)PFI leases, Current (277) (277) (2,972) (3,360)
Liabilities, Current, Total (78,501) (96,653) (102,962) (82,681)
NET CURRENT (LIABILITIES) ASSETS (42,326) (48,659) (55,444) (17,044)
Liabilities, Non-Current Deferred Income, Non-Current (7,237) (7,237) (7,228) (7,333)Provisions, Non-Current (2,823) (2,609) (2,748) (2,852)Finance Leases, Non-current (777) (335) (167) (335)PFI leases, Non-Current (199,077) (199,076) (196,102) (199,076)
Liabilities, Non-Current, Total (209,914) (209,257) (206,245) (209,596)
TOTAL ASSETS EMPLOYED 95,855 95,750 95,943 120,940
Taxpayers' and Others' Equity
Taxpayers EquityPublic dividend capital 25,105 25,105 25,105 25,105Retained Earnings (Accumulated Losses) 6,084 5,979 6,259 30,214Revaluation Reserve 64,666 64,666 64,579 65,621
TAXPAYERS EQUITY, TOTAL 95,855 95,750 95,943 120,940
TOTAL ASSETS EMPLOYED 95,855 95,750 95,943 120,940
2016/17

Norfolk and Norwich University Hospitals NHS Foundation Trust Appendix 3
Cash Flow Statement
Position as at 28 February 2017
2016/17 2015/16£'000 £'000 £'000 £'000 £'000
Actual Forecast Plan VarianceForecast
PlanAudited Actual
Year to Date Year to Date Year to Date Full Year Full Year
(Deficit) after tax including donated assets (25,084) (25,190) 106 (24,997) (21,930)Non-cash flows in operating surplus
Finance income/charges 26,129 26,099 30 28,796 27,611Depreciation and amortisation, total 11,120 11,342 (222) 12,378 13,843Less: Gain on disposal of property plant and equipment (45) (78) 33 (86) 63PDC dividend expense 2,155 2,155 2,352 1,869
Non-cash flows in operating surplus, Total 39,359 39,518 (159) 43,440 43,386
Operating Cash flows before movements in working capital 14,275 14,328 (53) 18,443 21,456
Increase/(Decrease) in working capitalDecrease in inventories 109 109 (190)Decrease in NHS Trade Receivables 2,421 (11,430) 13,851 (11,829) (6,615)Decrease in Non NHS Trade Receivables 1,739 1,739 (943)(Increase) in accrued income (4,107) (723) (3,384) (471)(Increase) in prepayments (194) (821) 627 (956)
(Increase)/decrease in Other assets (1,149) 1,149 (7)(Decrease) in Deferred Income (excluding Donated Assets) (9,427) (5,982) (3,445) (6,474) (8,217)(Decrease) in provisions (600) (944) 344 (764) (1,141)Increase in tax payable 930 706 224 706 154Increase in Trade Creditors 575 (478) 1,053 (478) (878)(Decrease) in Other Creditors (1,606) (1,606) 1,008Increase in accruals 9,642 3,014 6,628 2,464 933(Decrease) in other Other Financial liabilities (1) (1) (180)(Decrease) in working capital, Total (519) (17,807) 17,288 (16,382) (17,496)
Net cash (outflow)/inflow from operating activities 13,756 (3,479) 17,235 2,061 3,960
Net cash flow from investing activitiesProperty, plant and equipment - non-maintenance expenditure (11,133) (17,167) 6,034 (21,517) (8,710)Proceeds on disposal of property, plant and equipment 53 85 (32) 94 10(Decrease) in Capital Creditors (1,547) (1,547) 976Other cash flows from investing activities (420) (522) 102 (1,010) (6,254)
Net cash (outflow) from investing activities, Total (13,047) (17,604) 4,557 (22,433) (13,978)
Net cash (outflow)/inflow before financing 708 (21,083) 21,791 (20,372) (10,018)
Net cash flow from financing activitiesPDC Dividends paid (966) (966) (2,142) (1,954)Interest element of finance lease rental payments - Other (25) (25) (27) (18)Interest element of finance lease rental payments - On-balance sheet PFI (16,134) (16,133) (1) (17,594) (17,878)Interest element of finance loans (225) 225 (300)Capital element of finance lease rental payments - Other (149) (149) (162) (172)Capital element of finance lease rental payments - On-balance sheet PFI (3,082) (3,083) 1 (3,362) (3,541)Interest received on cash and cash equivalents 57 57 59 231Movement in Other grants/Capital received 15(Increase)/decrease in non-current receivables 355 105 250 115 637Distressed funding required - Revenue cash requirement 15,000 (15,000) 15,000Distressed funding required -Capital cash requirement 6,000 (6,000) 10,000Other cash flows from financing activities (10,027) (9,998) (29) (10,931) (9,946)
Net cash (outflow) from financing activities, Total (29,971) (9,417) (20,554) (9,344) (32,626)
Net (decrease)/increase in cash and cash equivalents (29,262) (30,500) 1,238 (29,716) (42,644)
Opening cash and cash equivalents 31,494 31,494 31,494 74,138
Closing cash and cash equivalents 2,232 994 1,238 1,778 31,494
2016/17

Appendix 4
Norfolk and Norwich University Hospitals NHS Foundation TrustCURRENT WEEK - SUMMARYConsolidated short term cash forecast
£'000 Actual Forecast Forecast Forecast Forecast Forecast Forecast Forecast Forecast Forecast Forecast Forecast Forecast Forecast Forecast Forecast ForecastRAG Week ended 10 Mar 17 Mar 24 Mar 31 Mar 07 Apr 14 Apr 21 Apr 28 Apr 05 May 12 May 19 May 26 May 02 Jun 09 Jun 16 Jun 23 Jun 30 Jun
Balanc Balance B/F 22,416 20,294 31,808 16,216 12,315 25,890 27,149 22,623 1,324 21,125 16,878 20,080 3,319 (6,164) 13,702 25,964 (1,731)
Clinica Clinical Income (inflow)C G Clinical Income 1,634 7,176 22,350 4,173 6,402 22,350 10,575 22,350 10,575D A Drugs (70) 2,874 892 1,325 1,648 2,496 1,325 4,144 1,325 4,144O A Over/Under performance 400 800 950
Other Other income (inflow)E G Health Education 1,616 169 100 1,600 1,700 1,700N A NHS 312 220 1,736 190 280 290 1,514 190 190 190 640 590 190 190 190 950N A NON NHS 502 250 250 275 235 365 235 235 235 235 365 235 235 235 365 235 235R A R&D 1,932 1,690 1,690 250 1,690V G VAT 1,519 1,676 1,676 1,676
4,394 12,621 4,397 275 24,100 6,566 12,713 3,425 24,100 425 19,464 2,551 825 24,100 18,174 2,115 2,861
PayrollPayroll (outflow)PA G Salaries 544 350 14,650 300 350 350 350 14,950 350 350 350 14,950 350 350 350 14,950 350S G Superannuation 4,139 4,250 4,250 4,250IR G Inland Revenue 6,480 6,700 6,835 6,835
Non-paNon-pay (outflow)N R NON NHS 3,369 2,291 2,060 2,259 2,690 1,900 1,900 1,900 2,170 1,900 1,900 1,900 2,170 1,900 1,900 1,900 1,900N A NHS 121 616 740 300 581 600 740 300 300 494 740 300 300 494 300 740P A Pharmacy 2,240 1,400 1,400 1,400 1,400 1,400 1,400 1,400 1,400 1,400 1,400 1,400 1,400 1,400 1,400 1,400 1,400LI G Litigation 861 861 861R A R&D 242 658 977 1,076 572 642 91 242 213 109 732 277ST G Shawbrook 541O G Octagon 5,754 5,700 5,700 5,700
6,516 15,934 19,827 3,959 10,494 5,307 17,174 24,690 4,220 4,592 16,181 19,232 10,133 4,059 5,737 29,635 10,367
Cash frCash from operations (2,122) (3,313) (15,430) (3,684) 13,606 1,259 (4,461) (21,265) 19,880 (4,167) 3,283 (16,681) (9,308) 20,041 12,437 (27,520) (7,506)
Financ Finance and capitalP G PDC 1,152C A Capital programme 20 162 217 32 64 34 80 80 80 80 175 175 175 175 176IN G Interest paid/received
0 1,172 162 217 32 0 64 34 80 80 80 80 175 175 175 175 176
Net InfNet Inflow / (Outflow) (2,122) (4,486) (15,592) (3,901) 13,574 1,259 (4,525) (21,299) 19,800 (4,247) 3,203 (16,761) (9,483) 19,866 12,262 (27,695) (7,682)
ForecaForecast Balance C/F - excluding WCF 20,294 15,808 16,216 12,315 25,890 27,149 22,623 1,324 21,125 16,878 20,080 3,319 (6,164) 13,702 25,964 (1,731) (9,413)
WorkinWorking Capital facility drawdown (inflow) 16,000WorkinWorking Capital facility repayment (outflow)ForecaForecast Balance C/F 20,294 31,808 16,216 12,315 25,890 27,149 22,623 1,324 21,125 16,878 20,080 3,319 (6,164) 13,702 25,964 (1,731) (9,413)
May-17Mar-17 Apr-17 Jun-17
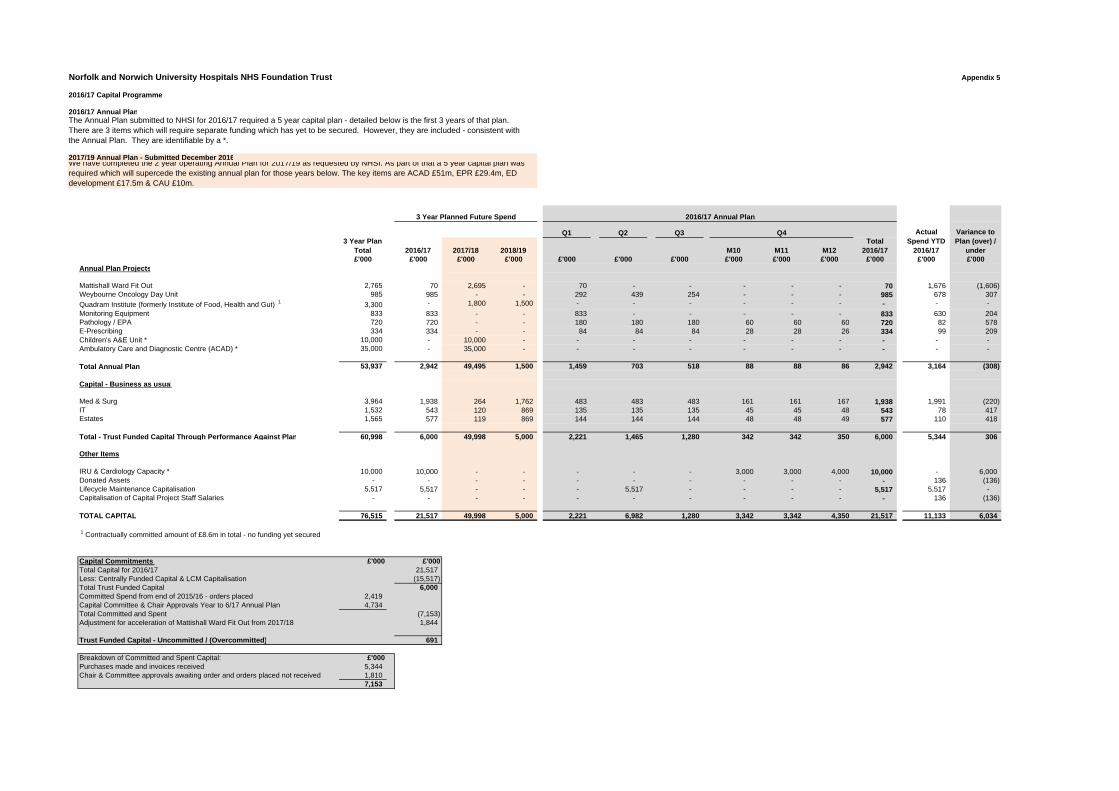
Norfolk and Norwich University Hospitals NHS Foundation Trust Appendix 5
2016/17 Capital Programme
2016/17 Annual Plan
2017/19 Annual Plan - Submitted December 2016
Q1 Q2 Q33 Year Plan
Total 2016/17 2017/18 2018/19 M10 M11 M12Total
2016/17£'000 £'000 £'000 £'000 £'000 £'000 £'000 £'000 £'000 £'000 £'000 £'000 £'000
Annual Plan Projects
Mattishall Ward Fit Out 2,765 70 2,695 - 70 - - - - - 70 1,676 (1,606) Weybourne Oncology Day Unit 985 985 - - 292 439 254 - - - 985 678 307
Quadram Institute (formerly Institute of Food, Health and Gut) 1 3,300 - 1,800 1,500 - - - - - - - - -
Monitoring Equipment 833 833 - - 833 - - - - - 833 630 204 Pathology / EPA 720 720 - - 180 180 180 60 60 60 720 82 578 E-Prescribing 334 334 - - 84 84 84 28 28 26 334 99 209 Children's A&E Unit * 10,000 - 10,000 - - - - - - - - - - Ambulatory Care and Diagnostic Centre (ACAD) * 35,000 - 35,000 - - - - - - - - - -
Total Annual Plan 53,937 2,942 49,495 1,500 1,459 703 518 88 88 86 2,942 3,164 (308)
Capital - Business as usual
Med & Surg 3,964 1,938 264 1,762 483 483 483 161 161 167 1,938 1,991 (220) IT 1,532 543 120 869 135 135 135 45 45 48 543 78 417 Estates 1,565 577 119 869 144 144 144 48 48 49 577 110 418
Total - Trust Funded Capital Through Performance Against Plan 60,998 6,000 49,998 5,000 2,221 1,465 1,280 342 342 350 6,000 5,344 306
Other Items
IRU & Cardiology Capacity * 10,000 10,000 - - - - - 3,000 3,000 4,000 10,000 - 6,000 Donated Assets - - - - - - - - - - - 136 (136) Lifecycle Maintenance Capitalisation 5,517 5,517 - - - 5,517 - - - - 5,517 5,517 - Capitalisation of Capital Project Staff Salaries - - - - - - - - - - - 136 (136)
TOTAL CAPITAL 76,515 21,517 49,998 5,000 2,221 6,982 1,280 3,342 3,342 4,350 21,517 11,133 6,034
1 Contractually committed amount of £8.6m in total - no funding yet secured
Capital Commitments £'000 £'000Total Capital for 2016/17 21,517 Less: Centrally Funded Capital & LCM Capitalisation (15,517) Total Trust Funded Capital 6,000 Committed Spend from end of 2015/16 - orders placed 2,419 Capital Committee & Chair Approvals Year to 6/17 Annual Plan 4,734 Total Committed and Spent (7,153) Adjustment for acceleration of Mattishall Ward Fit Out from 2017/18 1,844
Trust Funded Capital - Uncommitted / (Overcommitted) 691
Breakdown of Committed and Spent Capital: £'000Purchases made and invoices received 5,344 Chair & Committee approvals awaiting order and orders placed not received 1,810
7,153
Variance to Plan (over) /
under
The Annual Plan submitted to NHSI for 2016/17 required a 5 year capital plan - detailed below is the first 3 years of that plan. There are 3 items which will require separate funding which has yet to be secured. However, they are included - consistent with the Annual Plan. They are identifiable by a *.
We have completed the 2 year operating Annual Plan for 2017/19 as requested by NHSI. As part of that a 5 year capital plan was required which will supercede the existing annual plan for those years below. The key items are ACAD £51m, EPR £29.4m, ED development £17.5m & CAU £10m.
Actual Spend YTD
2016/17
3 Year Planned Future Spend 2016/17 Annual Plan
Q4

Norfolk and Norwich University Hospitals NHS Foundation Trust Appendix 6
Application of Single Oversight Framework to current NNUH Performance
Use of Resource (UoR) Metrics - Applicable from 1st October 2016
The five themes of the Single Oversight Framework - Extract from NHSI DocumentIn carrying out their role NHSI will work across five themes:
1
2
3
4
5
This appendix provides the detail for segment 2.
UoR Metrics Overall Single Oversight Framework Scoring Across 5 Themes (including UoR)
Current Performance to 28 February 2017
Capital Service Capacity MetricProfit / Loss from Operations (Appendix 1) 14,139Interest Receivable (Appendix 1) 57Total 14,196Non-Operating Costs (Appendix 1) 39,461Less: Depreciation (Appendix 1) (11,120)Add: Capital Elements of Lease Payments (Appendix 3) 3,231Total 31,572
Liquidity MetricNet Current Assets (Appendix 2) (42,326)Less: Inventories (Appendix 2) (8,325)Total (50,651)
Total Operating Expenses (Appendix 1) 500,881Annualised ( x 12/11) 546,416
I&E Margin MetricSurplus/(Deficit) (Appendix 1) (25,220)Donated Asset Depreciation 627(Gains)/losses on Asset Disposal (Appendix 1) (45)Total (24,638)Operating Income (Appendix 1) 515,156Donated Additions (Appendix 1) (136)Total 515,020
Difference from Financial Plan
Surplus/(Deficit) (Appendix 1) (25,222)Donated Asset Depreciation 840(Gains)/losses on Asset Disposal (Appendix 1) (78)Total (24,460)Operating Income (Appendix 1) 516,559Donated Additions (Appendix 1) (32)Total 516,527
Agency Spend MetricAgency Spend YTD (20,635)
Agency Ceiling YTD (17,991)
Summary - Score is 3 3
Current Capital service capacity of 0.45 gives a score of 4 for this metric.Current Liquidity of -33.4 days gives a score of 4 for this metric.Current I&E Margin of -4.78% gives a score of 4 for this metric.Current Variance in I&E Margin of -0.05% gives a score of 2 for this metric.Agency Spend of 14.69% gives a score of 2 for this metric.
The overall score for UoR is 3, resulting in segment 'Use of Resources' being categorised as:'Provider receiving mandated support for significant concerns'
Actual I&E Margin is -4.78%
Planned I&E Margin is -4.74%
I&E Margin Variance is -0.05%
Agency Spend is 14.69% above ceiling
Quality of care (safe, effective, caring, responsive): we will use CQC’s most recent assessments of whether a provider’s care is safe, effective, caring and responsive, in combination with in-year information where available. We will also include delivery of the four priority standards for 7-day hospital services.
Finance and use of resources: we will oversee a provider’s financial efficiency and progress in meeting its financial control total, reflecting the approach taken in Strengthening financial performance and accountability . We are co-developing this approach with CQC.
Operational performance: we will support providers in improving and sustaining performance against NHS Constitution standards and other, including A&E waiting times, referral to treatment times, cancer treatment times, ambulance response times, and access to mental health services. These NHS Constitution standards may relate to one or more facets of quality (ie safe, effective, caring and/or responsive).
Strategic change: working with system partners we will consider how well providers are delivering the strategic changes set out in the NHS 5 year Forward View , with a particular focus on their contribution to sustainability and transformation plans (STPs), new care models, and, where relevant, implementation of devolution.
Leadership and improvement capability (well-led): building on the joint CQC and NHS Improvement well-led framework, we will develop a shared system view with CQC of what good governance and leadership look like, including organisations’ ability to learn and improve.
-33.4 Days worth of expenses held as cash equivalents
Revenue generated covers commitments 0.45 times

Norfolk and Norwich University Hospitals NHS Foundation Trust Appendix 7
Income Statement Comparison - for the Month of February 2017
ActualForecast Plan
Prior year
£'000 £'000 £'000 £'000 % £'000 %INCOME NHS clinical income
Clinical Income 32,916 34,265 32,984 (1,349) (4%) (68) (0%) February 2 01/02/2017 NT Drugs 4,817 5,131 5,083 (314) (6%) (266) (5%) January January 20 01/01/2016
Total NHS clinical income 37,733 39,396 38,067 (1,663) (4%) (334) (1%) February February 2 01/02/2016March March 201 01/03/2016
Non NHS clinical income April April 2016 01/04/2016 Private patients 131 159 145 (28) (18%) (14) (10%) May May 2016 01/05/2016 Other - RTA 141 111 129 30 27% 12 9% June June 2016 01/06/2016
Total Non NHS clinical income 272 270 274 2 1% (2) (1%) July July 2016 01/07/2016August August 20101/08/2016
Other Income SeptemberSeptember 01/09/2016 R&D 1,780 1,899 1,954 (119) (6%) (174) (9%) October October 20 01/10/2016 Education & Training 1,734 1,706 1,648 28 2% 86 5% November November 01/11/2016 Other non patient care income 3,759 2,713 4,559 1,046 39% (800) (18%) December December 01/12/2016
Total other Income 7,273 6,318 8,161 955 15% (888) (11%) January January 20 01/01/2017February February 2 01/02/2017
TOTAL OPERATING INCOME 45,278 45,984 46,502 (706) (2%) (1,224) (3%) March March 201 01/03/2017
EXPENDITURE Employee benefit expenses (26,007) (26,296) (26,142) 289 1% 135 1% Drugs (5,719) (5,958) (5,893) 239 4% 174 3% Clinical supplies (5,158) (5,341) (5,003) 183 3% (155) (3%) Non clinical supplies (5,714) (5,648) (6,135) (66) (1%) 421 7% PFI operating expenses (1,680) (1,653) (1,709) (27) (2%) 29 2%
TOTAL OPERATING EXPENSES (44,278) (44,896) (44,882) 618 1% 604 1%
Profit/(loss) from operations 1,000 1,088 1,620 (88) (8%) (620) (38%)
Non-operating incomeInterest 3 3 15 0% (12) (80%)Profit/(loss) on asset disposals 8 (7) (8) 100% 7 (100%)
Total non-operating income 3 11 8 (8) (73%) (5) (63%)
Non-operating expensesInterest on PFI and Finance leases (1,464) (1,464) (1,486) 0% 22 (1%)Interest on Non Commercial Borrowing (83) 83 100%Depreciation (1,017) (1,036) (1,149) 19 2% 132 (11%)PDC (197) (196) (135) (1) (1%) (62) 46%Other - Contingent Rent (938) (933) (841) (5) (1%) (97) 12%
Total non operating expenses (3,616) (3,712) (3,611) 96 3% (5) 0%
Surplus (deficit) before tax (2,613) (2,613) (1,983) (0) 0% (630) 32%Profit / (loss) from discontinued operations, net of tax
Surplus (deficit) after tax from continuing operations (2,613) (2,613) (1,983) (0) (0%) (630) (32%)
Memo: Donated Asset Additions 3 11 (3) (100%) (11) (100%)
Surplus (deficit) after tax and Donated Asset Additions (2,613) (2,610) (1,972) (3) (0%) (641) (33%)
Notes:Calendar Days 28 28 29Working Days 20 20 21
For the month Variances Fav / (Adv)
To Forecast Plan To prior year
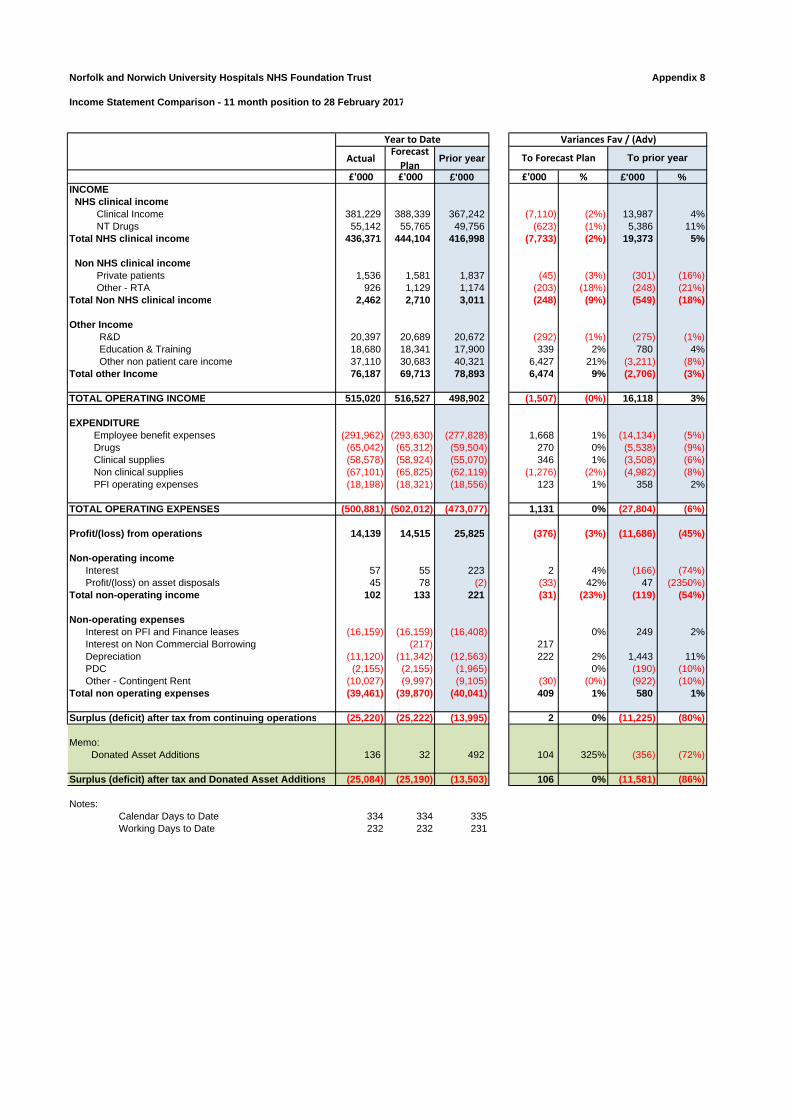
Norfolk and Norwich University Hospitals NHS Foundation Trust Appendix 8
Income Statement Comparison - 11 month position to 28 February 2017
ActualForecast Plan
Prior year
£'000 £'000 £'000 £'000 % £'000 %INCOME NHS clinical income
Clinical Income 381,229 388,339 367,242 (7,110) (2%) 13,987 4% NT Drugs 55,142 55,765 49,756 (623) (1%) 5,386 11%
Total NHS clinical income 436,371 444,104 416,998 (7,733) (2%) 19,373 5%
Non NHS clinical income Private patients 1,536 1,581 1,837 (45) (3%) (301) (16%) Other - RTA 926 1,129 1,174 (203) (18%) (248) (21%)
Total Non NHS clinical income 2,462 2,710 3,011 (248) (9%) (549) (18%)
Other Income R&D 20,397 20,689 20,672 (292) (1%) (275) (1%) Education & Training 18,680 18,341 17,900 339 2% 780 4% Other non patient care income 37,110 30,683 40,321 6,427 21% (3,211) (8%)
Total other Income 76,187 69,713 78,893 6,474 9% (2,706) (3%)
TOTAL OPERATING INCOME 515,020 516,527 498,902 (1,507) (0%) 16,118 3%
EXPENDITURE Employee benefit expenses (291,962) (293,630) (277,828) 1,668 1% (14,134) (5%) Drugs (65,042) (65,312) (59,504) 270 0% (5,538) (9%) Clinical supplies (58,578) (58,924) (55,070) 346 1% (3,508) (6%) Non clinical supplies (67,101) (65,825) (62,119) (1,276) (2%) (4,982) (8%) PFI operating expenses (18,198) (18,321) (18,556) 123 1% 358 2%
TOTAL OPERATING EXPENSES (500,881) (502,012) (473,077) 1,131 0% (27,804) (6%)
Profit/(loss) from operations 14,139 14,515 25,825 (376) (3%) (11,686) (45%)
Non-operating incomeInterest 57 55 223 2 4% (166) (74%)Profit/(loss) on asset disposals 45 78 (2) (33) 42% 47 (2350%)
Total non-operating income 102 133 221 (31) (23%) (119) (54%)
Non-operating expensesInterest on PFI and Finance leases (16,159) (16,159) (16,408) 0% 249 2%Interest on Non Commercial Borrowing (217) 217Depreciation (11,120) (11,342) (12,563) 222 2% 1,443 11%PDC (2,155) (2,155) (1,965) 0% (190) (10%)Other - Contingent Rent (10,027) (9,997) (9,105) (30) (0%) (922) (10%)
Total non operating expenses (39,461) (39,870) (40,041) 409 1% 580 1%
Surplus (deficit) after tax from continuing operations (25,220) (25,222) (13,995) 2 0% (11,225) (80%)
Memo: Donated Asset Additions 136 32 492 104 325% (356) (72%)
Surplus (deficit) after tax and Donated Asset Additions (25,084) (25,190) (13,503) 106 0% (11,581) (86%)
Notes:Calendar Days to Date 334 334 335Working Days to Date 232 232 231
Year to Date Variances Fav / (Adv)
To Forecast Plan To prior year

Penalty Position as at 28 February 2017 Appendix 9
Contract Tracker ‐ Commissioning Information
Operational Standards EstimateApr May Jun Jul Aug Sep Oct Nov Dec Jan Feb Mar YTD
18 Weeks £765,300 £709,320 £645,804 £724,104 £766,092 £782,988 £855,648 £817,092 £970,944 £945,708 £945,708 £8,928,708Diagnostic Waiting Times £10,400 £16,600 £17,000 £31,800 £33,600 £27,600 £18,200 £0 £0 £0 £0 £155,200A&E Waits £113,640 £81,240 £78,120 £60,240 £87,120 £49,200 £110,400 £108,480 £187,200 £175,440 £166,080 £1,217,160Cancer Waits ‐ 2 Week Wait £0 £0 £0 £0Cancer Waits ‐ 31 Days £7,000 £0 £10,000 £17,000Cancer Waits ‐ 62 Days £22,000 £22,000 £36,500 £80,500Mixed Sex Accomodation Breaches £0 £1,000 £0 £0 £0 £0 £0 £750 £1,000 £0 £500 £3,250Cancelled Operations £114,166 £38,370 £33,315 £49,306 £14,992 £32,439 £57,818 £45,529 £43,324 £61,314 £35,209 £525,782Total £1,003,506 £846,530 £803,239 £865,450 £901,804 £914,227 £1,042,066 £971,851 £1,248,968 £1,182,462 £1,147,497 £0 £10,927,600
Quality RequirementsApr May Jun Jul Aug Sep Oct Nov Dec Jan Feb Mar YTD
MRSA £0 £0 £0 £0 £0 £0 £0 £0 £0 £0 £0 £0C Difficile £052 Week Waiters £0 £15,000 £45,000 £70,000 £95,000 £115,000 £80,000 £60,000 £30,000 £50,000 £50,000 £610,000Ambulance Handovers ‐ more than 30 minutes £102,400 £69,400 £69,800 £59,200 £79,800 £85,200 £120,400 £105,000 £183,400 £162,600 £162,600 £1,199,800Ambulance Handovers ‐ more than 60 minutes £188,000 £102,000 £106,000 £66,000 £135,000 £117,000 £219,000 £175,000 £361,000 £359,000 £359,000 £2,187,000A&E Trolley Waits £0 £0 £0 £0 £0 £0 £0 £0 £0 £0 £0 £0Multiple Urgent Cancelled Operations £0 £0 £0 £0 £0 £0 £0 £0 £0 £0 £0 £0Duty of Candour £0NHS Number ‐ OP/APC Datasets (SUS) £0 £0 £0 £0 £0 £0 £0 £0 £0 £0 £0 £0NHS Number ‐ A&E Datasets (SUS) £0 £0 £0 £0 £0 £0 £0 £0 £0 £0 £0 £0Total £290,400 £186,400 £220,800 £195,200 £309,800 £317,200 £419,400 £340,000 £574,400 £571,600 £571,600 £0 £3,996,800
Apr May Jun Jul Aug Sep Oct Nov Dec Jan Feb Mar YTDOther ‐ Never Events £2,807 £1,774 £0 £0 £0 £0 £3,000 £4,000 £0 £0 £0 £11,581Other ‐ GC9 £0
Grand Total £1,296,713 £1,034,704 £1,024,039 £1,060,650 £1,211,604 £1,231,427 £1,464,466 £1,315,851 £1,823,368 £1,754,062 £1,719,097 £0 £14,935,981
Operational StandardsApr May Jun Jul Aug Sep Oct Nov Dec Jan Feb Mar YTD
18 Weeks £0Diagnostic Waiting Times £0A&E Waits £0Cancer Waits ‐ 2 Week Wait £0 £0 £0 £0Cancer Waits ‐ 31 Days £7,000 £0 £10,000 £17,000Cancer Waits ‐ 62 Days £0Mixed Sex Accomodation Breaches £0 £1,000 £0 £0 £0 £0 £0 £750 £1,000 £0 £500 £3,250Cancelled Operations £114,166 £38,370 £33,315 £49,306 £14,992 £32,439 £57,818 £45,529 £43,324 £61,314 £35,209 £525,782Total £114,166 £39,370 £40,315 £49,306 £14,992 £32,439 £57,818 £46,279 £54,324 £61,314 £35,709 £0 £546,032
Quality RequirementsApr May Jun Jul Aug Sep Oct Nov Dec Jan Feb Mar YTD
MRSA £0 £0 £0 £0 £0 £0 £0 £0 £0 £0 £0 £0C Difficile £0 £0 £0 £0 £0 £0 £0 £0 £0 £0 £0 £052 Week Waiters £0Ambulance Handovers ‐ more than 30 minutes £0Ambulance Handovers ‐ more than 60 minutes £0A&E Trolley Waits £0Multiple Urgent Cancelled Operations £0 £0 £0 £0 £0 £0 £0 £0 £0 £0 £0 £0Duty of Candour £0 £0 £0 £0 £0 £0 £0 £0 £0 £0 £0 £0NHS Number ‐ OP/APC Datasets (SUS) £0 £0 £0 £0 £0 £0 £0 £0 £0 £0 £0 £0NHS Number ‐ A&E Datasets (SUS) £0 £0 £0 £0 £0 £0 £0 £0 £0 £0 £0 £0Total £0 £0 £0 £0 £0 £0 £0 £0 £0 £0 £0 £0 £0
Apr May Jun Jul Aug Sep Oct Nov Dec Jan Feb Mar YTDOther ‐ Never Events £2,807 £1,774 £0 £0 £0 £0 £3,000 £4,000 £0 £0 £11,581Other ‐ GC9 £0 £0 £0 £0 £0 £0 £0 £0 £0 £0 £0
Grand Total £116,973 £41,144 £40,315 £49,306 £14,992 £32,439 £60,818 £50,279 £54,324 £61,314 £35,709 £0 £557,613
Covered by Decision TreesProvisional Figures
GROSS TOTAL (BEFORE REINVESTMENT)
NET PENALTY (AFTER REINVESTMENT AGREEMENT)
Source: Commissioning x5865

Norfolk and Norwich University Hospitals NHS Foundation Trust Appendix 10
Pay variance Month 11 2016/17
Staff group Actual-YTD Budget-YTD Variance-YTD
WLI, NAG, locums, bank &
agencyVacancy/
Other Total Budget WTE Actual WTE£ £ £ £ £
Consultant 51,095,641 58,840,572 -7,744,932 0 -7,744,932 -7,744,932 448 407Locum consultant 3,325,948 16,500 3,309,448 3,309,448 0 3,309,448 0 1WLI Consultants 4,789,961 0 4,789,961 4,789,961 0 4,789,961 0 0NAG 1,033,525 0 1,033,525 1,033,525 0 1,033,525
60,245,075 58,857,072 1,388,003 9,132,935 -7,744,932 1,388,003 448 408
Other medical staff 30,745,300 35,641,435 -4,896,135 0 -4,896,135 -4,896,135 623 546Locum other medical staff 7,099,544 15,620 7,083,924 7,083,924 0 7,083,924 0 0WLI other medical staff 1,255,027 0 1,255,027 1,255,027 0 1,255,027 0 0
39,099,871 35,657,055 3,442,816 8,338,951 -4,896,135 3,442,816 623 546
Registered nurses 68,239,968 80,578,665 -12,338,697 0 -12,338,697 -12,338,697 2,105 1,840Nurse bank - Registered 1,666,960 25,758 1,641,202 1,641,202 0 1,641,202Agency nurse 9,184,749 0 9,184,749 9,184,749 0 9,184,749
79,091,677 80,604,423 -1,512,746 10,825,951 -12,338,697 -1,512,746 2,105 1,840
Unqualified nurses 16,190,283 19,098,201 -2,907,918 0 -2,907,918 -2,907,918 853 740Nurse bank - Unregistered 5,071,501 168,392 4,903,109 4,903,109 0 4,903,109
21,261,784 19,266,593 1,995,192 4,903,109 -2,907,918 1,995,192 853 740
Midwives 8,525,004 9,226,625 -701,621 0 -701,621 -701,621 218 218
A&C ** 30,919,966 34,962,929 -4,042,963 0 -4,042,963 -4,042,963 1,396 1,335A&C bank 1,152,377 42,442 1,109,935 1,109,935 0 1,109,935
32,072,342 35,005,370 -2,933,028 1,109,935 -4,042,963 -2,933,028 1,396 1,335
AHP 17,348,280 21,655,981 -4,307,702 0 -4,307,702 -4,307,702 598 526AHP Bank 20,207 0 20,207 20,207 0 20,207AHP Agency 1,813,716 137,500 1,676,216 1,676,216 0 1,676,216
19,182,204 21,793,481 -2,611,278 1,696,424 -4,307,702 -2,611,278 598 526
Other non-medical * 31,646,564 34,733,572 -3,087,008 0 -3,087,008 -3,087,008 953 872Other non-medical Agency 994,700 8,617 986,083 986,083 0 986,083
32,641,264 34,742,189 -2,100,925 986,083 -3,087,008 -2,100,925 953 872
Sub Total 292,119,222 295,152,808 -3,033,587 36,993,388 -40,026,975 -3,033,587 7,194 6,484Reserve Allocation 0 1,210,335 -1,210,335 0 -1,210,335 -1,210,335Slippage QIPP achieved 0 0 0 0 0 0QIPP in Divisions 0 -5,624,450 5,624,450 0 5,624,450 5,624,450
Subtotal 292,119,222 290,722,345 1,396,876 36,993,388 -35,596,511 1,396,876 7,194 6,484
Reserves -157,109 2,907,813 -3,064,922 0 -3,064,922 -3,064,922Non-Recurrent Pay Slippage QIPP less achieved to date
0 0 0 0 0 0
Grand Total 291,962,112 293,630,158 -1,668,046 36,993,388 -38,661,434 -1,668,046 7,194 6,484
Reserves Detail
3% Activity Qipp 64,948 3% Activity QippContingency (450,318) ContingencyMths 1-6 Adjust Plan To Actual 374,182 Adjust 1-12 To PlanCardiology 7 Day Working (66,232) Cardiology 7 Day WorkingAdditional Safer Staffing (82,327) Additional Safer StaffingStaffing Reserve (725,350) Staffing ReserveCquin Delivery (76,072) Cquin DeliveryBusiness Planning Css 16/17 (70,768) Business Planning Css 16/17Ct Business Case (124,855) Ct Business CaseCritical Care (105,775) Critical CareOther (1,802,354) OtherTotal (3,064,922)
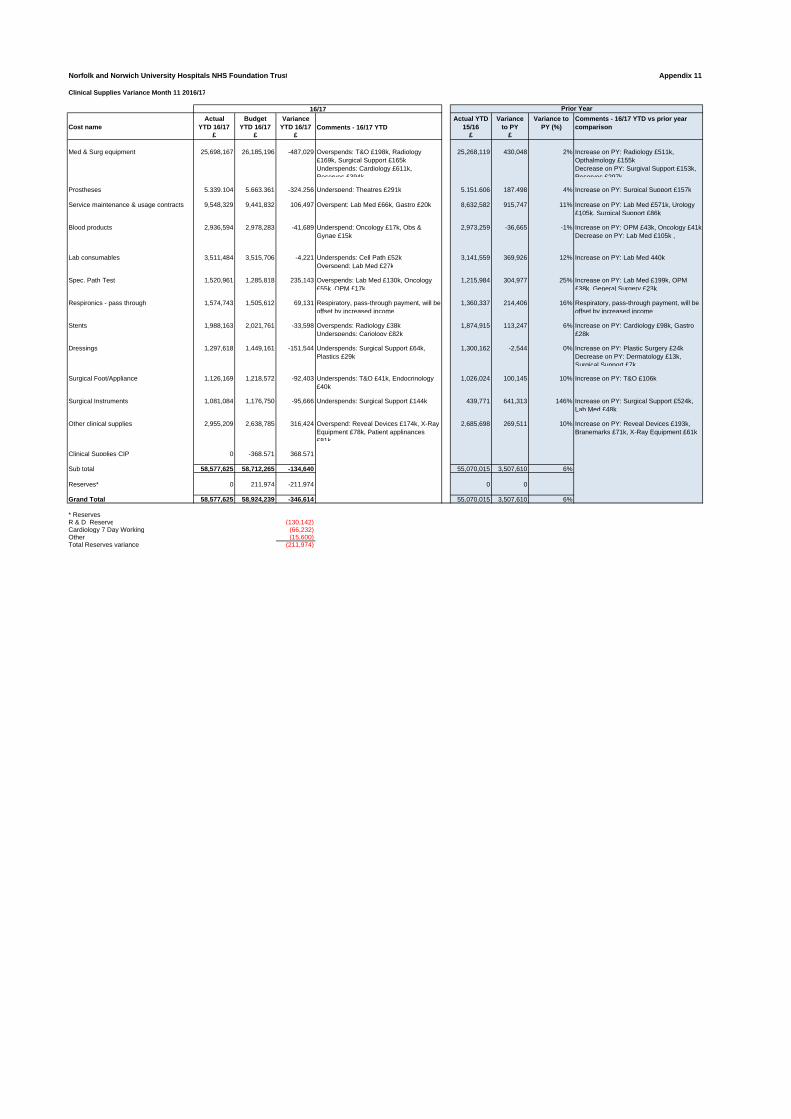
Norfolk and Norwich University Hospitals NHS Foundation Trust Appendix 11
Clinical Supplies Variance Month 11 2016/17
Cost nameActual
YTD 16/17Budget
YTD 16/17Variance
YTD 16/17 Comments - 16/17 YTDActual YTD
15/16Variance
to PYVariance to
PY (%)Comments - 16/17 YTD vs prior year comparison
£ £ £ £ £
Med & Surg equipment 25,698,167 26,185,196 -487,029 Overspends: T&O £198k, Radiology £169k, Surgical Support £165kUnderspends: Cardiology £611k, Reserves £394k
25,268,119 430,048 2% Increase on PY: Radiology £511k, Opthalmology £155kDecrease on PY: Surgival Support £153k, Reserves £297k
Prostheses 5,339,104 5,663,361 -324,256 Underspend: Theatres £291k 5,151,606 187,498 4% Increase on PY: Surgical Support £157k
Service maintenance & usage contracts 9,548,329 9,441,832 106,497 Overspent: Lab Med £66k, Gastro £20k 8,632,582 915,747 11% Increase on PY: Lab Med £571k, Urology £105k, Surgical Support £86k
Blood products 2,936,594 2,978,283 -41,689 Underspend: Oncology £17k, Obs & Gynae £15k
2,973,259 -36,665 -1% Increase on PY: OPM £43k, Oncology £41kDecrease on PY: Lab Med £105k ,
Lab consumables 3,511,484 3,515,706 -4,221 Underspends: Cell Path £52kOverspend: Lab Med £27k
3,141,559 369,926 12% Increase on PY: Lab Med 440k
Spec. Path Test 1,520,961 1,285,818 235,143 Overspends: Lab Med £130k, Oncology £55k, OPM £17k
1,215,984 304,977 25% Increase on PY: Lab Med £199k, OPM £38k, General Surgery £23k
Respironics - pass through 1,574,743 1,505,612 69,131 Respiratory, pass-through payment, will be offset by increased income
1,360,337 214,406 16% Respiratory, pass-through payment, will be offset by increased income
Stents 1,988,163 2,021,761 -33,598 Overspends: Radiology £38kUnderspends: Cariology £82k
1,874,915 113,247 6% Increase on PY: Cardiology £98k, Gastro £28k
Dressings 1,297,618 1,449,161 -151,544 Underspends: Surgical Support £64k, Plastics £29k
1,300,162 -2,544 0% Increase on PY: Plastic Surgery £24kDecrease on PY: Dermatology £13k, Surgical Support £7k
Surgical Foot/Appliance 1,126,169 1,218,572 -92,403 Underspends: T&O £41k, Endocrinology £40k
1,026,024 100,145 10% Increase on PY: T&O £106k
Surgical Instruments 1,081,084 1,176,750 -95,666 Underspends: Surgical Support £144k 439,771 641,313 146% Increase on PY: Surgical Support £524k, Lab Med £48k
Other clinical supplies 2,955,209 2,638,785 316,424 Overspend: Reveal Devices £174k, X-Ray Equipment £78k, Patient applinances £81k
2,685,698 269,511 10% Increase on PY: Reveal Devices £193k, Branemarks £71k, X-Ray Equipment £61k
Clinical Supplies CIP 0 -368,571 368,571
Sub total 58,577,625 58,712,265 -134,640 55,070,015 3,507,610 6%
Reserves* 0 211,974 -211,974 0 0
Grand Total 58,577,625 58,924,239 -346,614 55,070,015 3,507,610 6%
* ReservesR & D Reserve (130,142)Cardiology 7 Day Working (66,232) Other (15,600)Total Reserves variance (211,974)
16/17 Prior Year
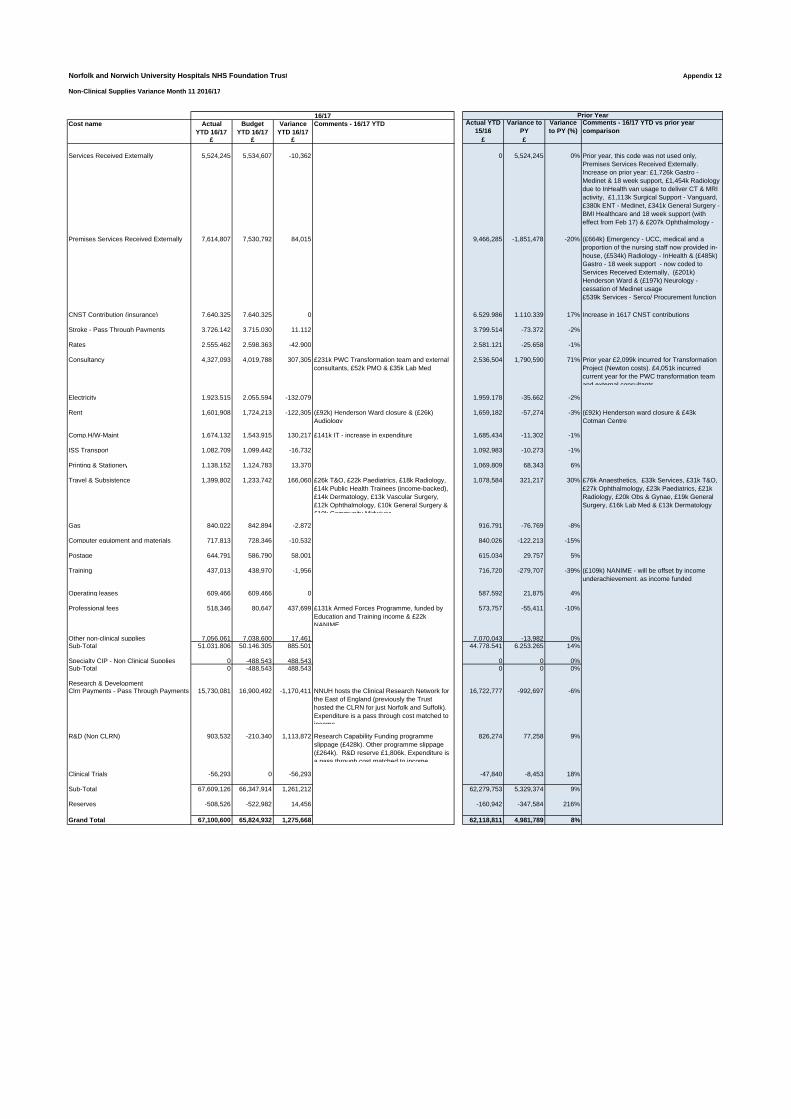
Norfolk and Norwich University Hospitals NHS Foundation Trust Appendix 12
Non-Clinical Supplies Variance Month 11 2016/17
Cost name Actual YTD 16/17
Budget YTD 16/17
Variance YTD 16/17
Comments - 16/17 YTD Actual YTD 15/16
Variance to PY
Variance to PY (%)
Comments - 16/17 YTD vs prior year comparison
£ £ £ £ £
Services Received Externally 5,524,245 5,534,607 -10,362 0 5,524,245 0% Prior year, this code was not used only, Premises Services Received Externally. Increase on prior year: £1,726k Gastro - Medinet & 18 week support, £1,454k Radiology due to InHealth van usage to deliver CT & MRI activity, £1,113k Surgical Support - Vanguard, £380k ENT - Medinet, £341k General Surgery - BMI Healthcare and 18 week support (with effect from Feb 17) & £207k Ophthalmology -
Premises Services Received Externally 7,614,807 7,530,792 84,015 9,466,285 -1,851,478 -20% (£664k) Emergency - UCC, medical and a proportion of the nursing staff now provided in-house, (£534k) Radiology - InHealth & (£485k) Gastro - 18 week support - now coded to Services Received Externally, (£201k) Henderson Ward & (£197k) Neurology - cessation of Medinet usage£539k Services - Serco/ Procurement function
CNST Contribution (insurance) 7,640,325 7,640,325 0 6,529,986 1,110,339 17% Increase in 1617 CNST contributions
Stroke - Pass Through Payments 3,726,142 3,715,030 11,112 3,799,514 -73,372 -2%
Rates 2,555,462 2,598,363 -42,900 2,581,121 -25,658 -1%
Consultancy 4,327,093 4,019,788 307,305 £231k PWC Transformation team and external consultants, £52k PMO & £35k Lab Med
2,536,504 1,790,590 71% Prior year £2,099k incurred for Transformation Project (Newton costs). £4,051k incurred current year for the PWC transformation team and external consultants
Electricity 1,923,515 2,055,594 -132,079 1,959,178 -35,662 -2%
Rent 1,601,908 1,724,213 -122,305 (£92k) Henderson Ward closure & (£26k) Audiology
1,659,182 -57,274 -3% (£92k) Henderson ward closure & £43k Cotman Centre
Comp.H/W-Maint 1,674,132 1,543,915 130,217 £141k IT - increase in expenditure 1,685,434 -11,302 -1%
ISS Transport 1,082,709 1,099,442 -16,732 1,092,983 -10,273 -1%
Printing & Stationery 1,138,152 1,124,783 13,370 1,069,809 68,343 6%
Travel & Subsistence 1,399,802 1,233,742 166,060 £26k T&O, £22k Paediatrics, £18k Radiology, £14k Public Health Trainees (income-backed), £14k Dermatology, £13k Vascular Surgery, £12k Ophthalmology, £10k General Surgery & £10k Community Midwives
1,078,584 321,217 30% £76k Anaesthetics, £33k Services, £31k T&O, £27k Ophthalmology, £23k Paediatrics, £21k Radiology, £20k Obs & Gynae, £19k General Surgery, £16k Lab Med & £13k Dermatology
Gas 840,022 842,894 -2,872 916,791 -76,769 -8%
Computer equipment and materials 717,813 728,346 -10,532 840,026 -122,213 -15%
Postage 644,791 586,790 58,001 615,034 29,757 5%
Training 437,013 438,970 -1,956 716,720 -279,707 -39% (£109k) NANIME - will be offset by income underachievement, as income funded
Operating leases 609,466 609,466 0 587,592 21,875 4%
Professional fees 518,346 80,647 437,699 £131k Armed Forces Programme, funded by Education and Training income & £22k NANIME
573,757 -55,411 -10%
Other non-clinical supplies 7,056,061 7,038,600 17,461 7,070,043 -13,982 0%Sub-Total 51,031,806 50,146,305 885,501 44,778,541 6,253,265 14%
Specialty CIP - Non Clinical Supplies 0 -488,543 488,543 0 0 0%Sub-Total 0 -488,543 488,543 0 0 0%
Research & DevelopmentClrn Payments - Pass Through Payments 15,730,081 16,900,492 -1,170,411 NNUH hosts the Clinical Research Network for
the East of England (previously the Trust hosted the CLRN for just Norfolk and Suffolk). Expenditure is a pass through cost matched to income
16,722,777 -992,697 -6%
R&D (Non CLRN) 903,532 -210,340 1,113,872 Research Capability Funding programme slippage (£428k). Other programme slippage (£264k). R&D reserve £1,806k. Expenditure is a pass through cost matched to income
826,274 77,258 9%
Clinical Trials -56,293 0 -56,293 -47,840 -8,453 18%
Sub-Total 67,609,126 66,347,914 1,261,212 62,279,753 5,329,374 9%
Reserves -508,526 -522,982 14,456 -160,942 -347,584 216%
Grand Total 67,100,600 65,824,932 1,275,668 62,118,811 4,981,789 8%
16/17 Prior Year
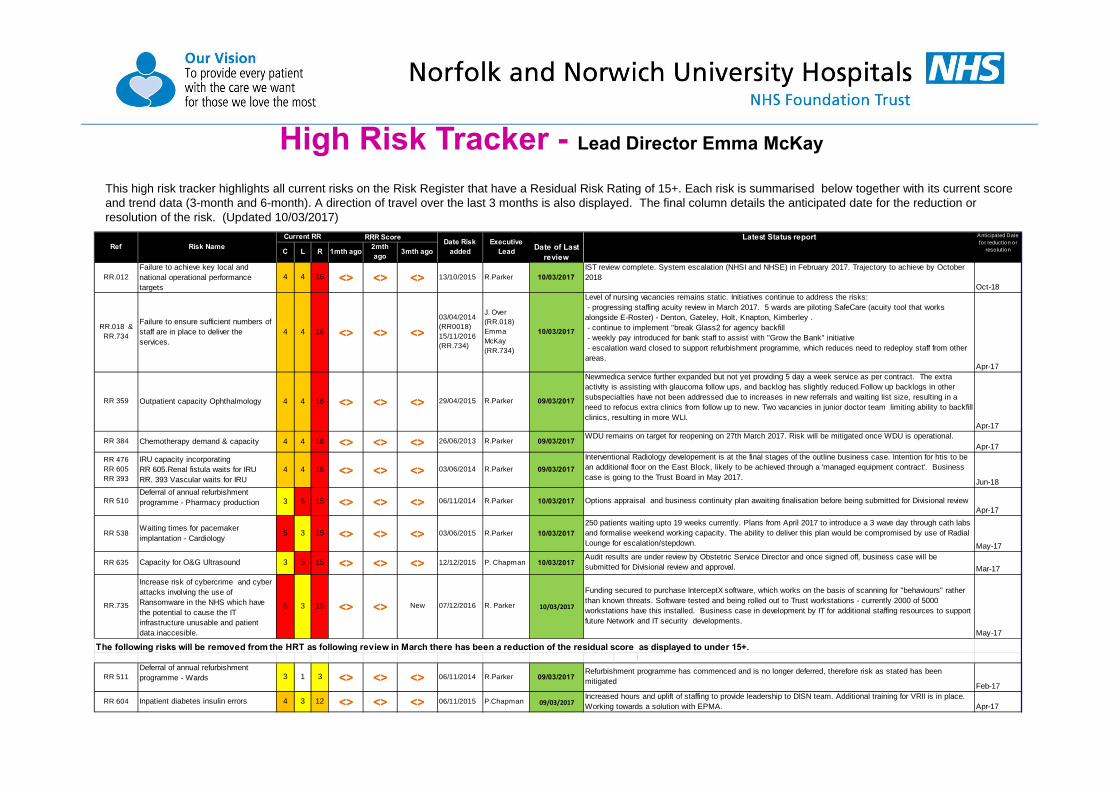
High Risk Tracker - Lead Director Emma McKay
This high risk tracker highlights all current risks on the Risk Register that have a Residual Risk Rating of 15+. Each risk is summarised below together with its current score and trend data (3-month and 6-month). A direction of travel over the last 3 months is also displayed. The final column details the anticipated date for the reduction or resolution of the risk. (Updated 10/03/2017)
RR.012Failure to achieve key local and national operational performance targets
4 4 16 ˂˃ ˂˃ ˂˃ 13/10/2015 R.Parker 10/03/2017Oct-18
RR.018 & RR.734
Failure to ensure sufficient numbers of staff are in place to deliver the services.
4 4 16 ˂˃ ˂˃ ˂˃03/04/2014 (RR0018) 15/11/2016 (RR.734)
J. Over (RR.018) Emma McKay (RR.734)
10/03/2017
Apr-17
RR 359 Outpatient capacity Ophthalmology 4 4 16 ˂˃ ˂˃ ˂˃ 29/04/2015 R.Parker 09/03/2017
Apr-17
RR 384 Chemotherapy demand & capacity 4 4 16 ˂˃ ˂˃ ˂˃ 26/06/2013 R.Parker 09/03/2017Apr-17
RR 476 RR 605 RR 393
IRU capacity incorporating RR 605.Renal fistula waits for IRU RR. 393 Vascular waits for IRU
4 4 16 ˂˃ ˂˃ ˂˃ 03/06/2014 R.Parker 09/03/2017
Jun-18
RR 510Deferral of annual refurbishment programme - Pharmacy production 3 5 15 ˂˃ ˂˃ ˂˃ 06/11/2014 R.Parker 10/03/2017
Apr-17
RR 538Waiting times for pacemaker implantation - Cardiology
5 3 15 ˂˃ ˂˃ ˂˃ 03/06/2015 R.Parker 10/03/2017
May-17
RR 635 Capacity for O&G Ultrasound 3 5 15 ˂˃ ˂˃ ˂˃ 12/12/2015 P. Chapman 10/03/2017Mar-17
RR.735
Increase risk of cybercrime and cyber attacks involving the use of Ransomware in the NHS which have the potential to cause the IT infrastructure unusable and patient data inaccesible.
5 3 15 ˂˃ ˂˃ New 07/12/2016 R. Parker 10/03/2017
May-17
RR 511Deferral of annual refurbishment programme - Wards 3 1 3 ˂˃ ˂˃ ˂˃ 06/11/2014 R.Parker 09/03/2017
Feb-17
RR 604 Inpatient diabetes insulin errors 4 3 12 ˂˃ ˂˃ ˂˃ 06/11/2015 P.Chapman 09/03/2017 Apr-17
Current RR
Increased hours and uplift of staffing to provide leadership to DISN team. Additional training for VRII is in place. Working towards a solution with EPMA.
The following risks will be removed from the HRT as following review in March there has been a reduction of the residual score as displayed to under 15+.
Funding secured to purchase InterceptX software, which works on the basis of scanning for "behaviours" rather than known threats. Software tested and being rolled out to Trust workstations - currently 2000 of 5000 workstations have this installed. Business case in development by IT for additional staffing resources to support future Network and IT security developments.
Risk Name
Newmedica service further expanded but not yet providing 5 day a week service as per contract. The extra activity is assisting with glaucoma follow ups, and backlog has slightly reduced.Follow up backlogs in other subspecialties have not been addressed due to increases in new referrals and waiting list size, resulting in a need to refocus extra clinics from follow up to new. Two vacancies in junior doctor team limiting ability to backfill clinics, resulting in more WLI.
Refurbishment programme has commenced and is no longer deferred, therefore risk as stated has been mitigated
Audit results are under review by Obstetric Service Director and once signed off, business case will be submitted for Divisional review and approval.
Ref C L Date of Last review
RRR Score
1mth ago 2mth ago
Anticipated Date for reduction or
reso lution
Latest Status reportExecutive LeadR
Options appraisal and business continuity plan awaiting finalisation before being submitted for Divisional review
Level of nursing vacancies remains static. Initiatives continue to address the risks: - progressing staffing acuity review in March 2017. 5 wards are piloting SafeCare (acuity tool that works alongside E-Roster) - Denton, Gateley, Holt, Knapton, Kimberley . - continue to implement "break Glass2 for agency backfill - weekly pay introduced for bank staff to assist with "Grow the Bank" initiative - escalation ward closed to support refurbishment programme, which reduces need to redeploy staff from other areas.
250 patients waiting upto 19 weeks currently. Plans from April 2017 to introduce a 3 wave day through cath labs and formalise weekend working capacity. The ability to deliver this plan would be compromised by use of Radial Lounge for escalation/stepdown.
WDU remains on target for reopening on 27th March 2017. Risk will be mitigated once WDU is operational.
Interventional Radiology developement is at the final stages of the outline business case. Intention for htis to be an additional floor on the East Block, likely to be achieved through a 'managed equipment contract'. Business case is going to the Trust Board in May 2017.
3mth agoDate Risk
added
IST review complete. System escalation (NHSI and NHSE) in February 2017. Trajectory to achieve by October 2018
Our Values: People-focused Respect Integrity Dedication Excellence
REPORT TO THE COUNCIL OF GOVERNORS
Date 20 April 2017
Title
Membership Activities and Analysis
Author(s) & Exec Lead Janice Bradfield, Membership Manager
Purpose For Discussion
A summary of the Governor and member activities, plus an analysis of the Trust’s Membership.
Recommendations: The Council is recommended to:
note the activities taking place for both Governors and members:
comment on the Membership analysis.

Our Values: People-focused Respect Integrity Dedication Excellence
1. Membership and Governor Activities
Governors are expected to represent to the Trust the views of the Trust’s Members and to communicate to the Members that they have done so. This paper details activities undertaken in the Trust which contribute towards achieving these aims. A flavour of our recent activities is set out below:
Governors have reviewed the quality report.
Staff Governors have signed up to be speak up guardians
North Norfolk Governors are getting involved with development plans for Cromer Hospital services
A number of governors are reviewing patient information as part of a patient panel. 1.1 Governors The latest open meeting for governors to meet with the Chairman, Chief Executive and Non-Executive Directors was held on 8 March. Dates for future sessions are:
22 May
8 September
29 November
All meetings being held in the boardroom from 10am to 12pm. 1.2 Events for members
A Medicine for Members talk is being held on Quadram Institute on 27 April 2017
A Medicine for Members talk is being held on head and neck cancer on 25 May 2017.
The Open Day and Fete is being held on 10 June 2017. 1.3 Dates for Council of Governors All meetings are held in the Boardroom, level 4, west outpatients at the Norfolk and Norwich University Hospital.
26 July 10am -12pm
28 September – 6pm AGM
12 October 10am -12pm 1.4 Viewpoint dates Chief Executive Mark Davies holds a monthly briefing for staff to talk about the latest developments and give employees the opportunity to ask questions. Governors are welcome to come along to the sessions if they wish. The meetings at the N&N are held at 1pm in the Benjamin Gooch Lecture Theatre and the next session is on 25 April 2017. 1.5 Trust Board meetings (start at 9am in the Board Room)
26 May 2017
28 July 2017
29 September 2017
24 November 2017 1.6 Updates sent to governors
Viewpoint in April
Deputy Lead Governor briefing - 3 April
Announcement about coming out of financial special measures - 20 February

Our Values: People-focused Respect Integrity Dedication Excellence
CQC visit message
1.7 Press releases sent to Governors since last CoG meeting:
Talk for the public on new Quadram Institute
Staff embark on innovative route to Registered Nursing
NNUH to mark Dementia Awareness Week 2017 by hosting information and advice fayre
NNUH launches new paediatric-led allergy service in the community
Cromer Hospital celebrates treating its 1,000,000th patient!
NNUH gains recognition for employees’ charitable donations
Mum and daughter raise £4,500 for NNUH charity to say thank you for the care they have
received
Tree planting marks NHS Sustainability Day at NNUH
State-of-the-art microscope will lead to revolution in skin cancer care
Norfolk cyclist gears up for his biggest challenge yet to raise money for NNUH charity
Hospital collaboration saves sight
Parents to host ball to raise money for NNUH charity in memory of their daughter
Specialist nurse elected president of national organisation
NNUH recruits patient to international trial
New survivorship team improves support for cancer patients
NNUH showcases opportunities during National Apprentice Week
NNUH selected to take part in National Collaborative
NNUH senior staff member selected for groundbreaking national initiative
Integrated Apprenticeship programme shortlisted for Norfolk Care Award
The sky’s the limit for NNUH patient raising money for hospital charity
NNUH consultant shortlisted for top award
Medal awarded to NNUH doctor for contribution to anaesthesia
New research trial tests benefits of exercise before and after cancer surgery
Find out why we love working at NNUH
1.8 Elections Eight governors are due for re-election this autumn after completing their three year term. 2. Membership analysis The Trust has an obligation to ensure that its Membership is representative of the population served by the Trust. The Trust has a Membership Strategy which has previously been reviewed by the Council. This sets out our objective to maintain our membership with a minimum level of 15,000 public members. 2.1 Breakdown by geography The Trust’s Membership is divided into constituencies which are consistent with local authority boundaries. Our current Public Membership numbers are as follows:
Constituency Number of members
Breckland 2,361
Broadland 3,128
Great Yarmouth and Waveney 890

Our Values: People-focused Respect Integrity Dedication Excellence
King's Lynn and West Norfolk 405
North Norfolk 2,786
Norwich 3,202
South Norfolk 3,095
Rest of England 394
Total 16,261
The breakdown below shows the number of Members in each constituency, compared to the local population (Census data). As previously discussed, and as may be expected, our membership is proportionately low in the constituencies to the east and west of the County, where there is an alternative local foundation trust membership available.
2.2 Breakdown by demography The table below shows a breakdown of our public membership is under-represented compared to the local population is in the younger age groups and amongst ethnic minority groups.
Age Total 16,261 % membership % of population
17-21 17 0.2% 7.5%
22+ 14,024 95.1% 76.2%
Unknown 2,220
Age bands
22-29 732
30-39 995
40-49 1,736
50-59 1,962
60-74 4,529
75+ 4,070
0.00
5.00
10.00
15.00
20.00
25.00
% of Membership% of Area
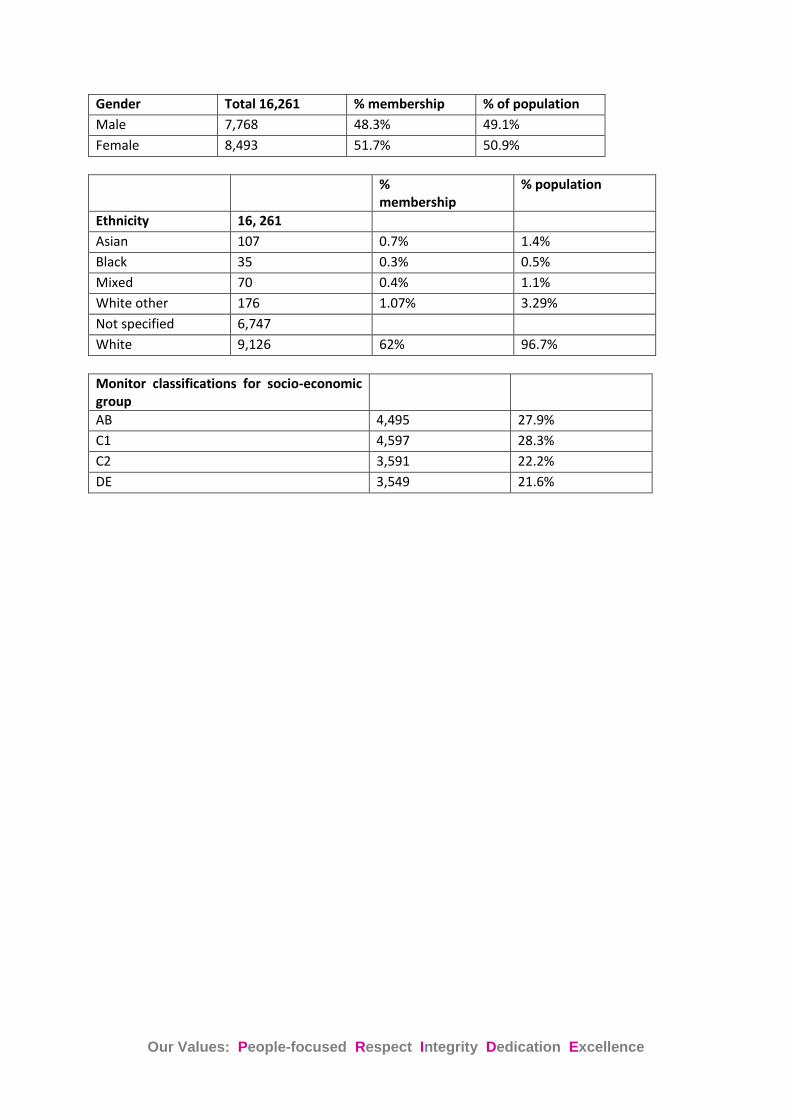
Our Values: People-focused Respect Integrity Dedication Excellence
Gender Total 16,261 % membership % of population
Male 7,768 48.3% 49.1%
Female 8,493 51.7% 50.9%
% membership
% population
Ethnicity 16, 261
Asian 107 0.7% 1.4%
Black 35 0.3% 0.5%
Mixed 70 0.4% 1.1%
White other 176 1.07% 3.29%
Not specified 6,747
White 9,126 62% 96.7%
Monitor classifications for socio-economic group
AB 4,495 27.9%
C1 4,597 28.3%
C2 3,591 22.2%
DE 3,549 21.6%
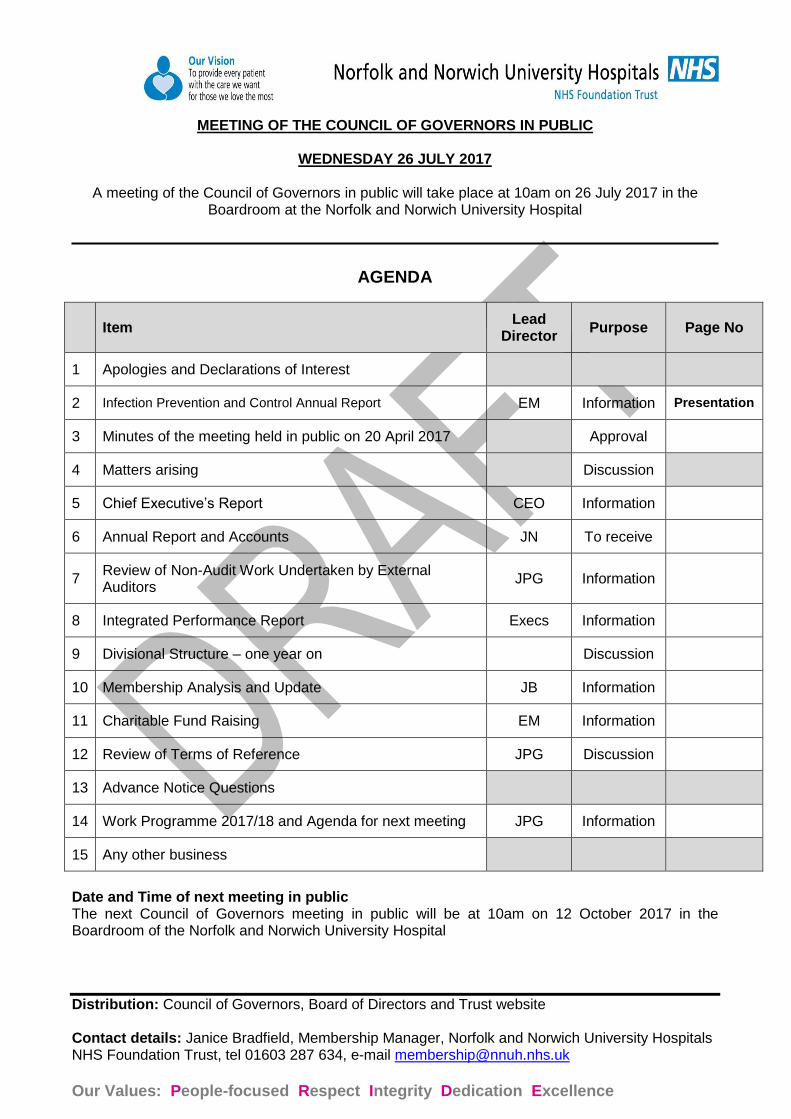
Distribution: Council of Governors, Board of Directors and Trust website Contact details: Janice Bradfield, Membership Manager, Norfolk and Norwich University Hospitals NHS Foundation Trust, tel 01603 287 634, e-mail [email protected]
Our Values: People-focused Respect Integrity Dedication Excellence
MEETING OF THE COUNCIL OF GOVERNORS IN PUBLIC
WEDNESDAY 26 JULY 2017
A meeting of the Council of Governors in public will take place at 10am on 26 July 2017 in the Boardroom at the Norfolk and Norwich University Hospital
AGENDA
Item Lead
Director Purpose Page No
1 Apologies and Declarations of Interest
2 Infection Prevention and Control Annual Report EM Information Presentation
3 Minutes of the meeting held in public on 20 April 2017 Approval
4 Matters arising Discussion
5 Chief Executive’s Report CEO Information
6 Annual Report and Accounts JN To receive
7 Review of Non-Audit Work Undertaken by External Auditors
JPG Information
8 Integrated Performance Report Execs Information
9 Divisional Structure – one year on Discussion
10 Membership Analysis and Update JB Information
11 Charitable Fund Raising EM Information
12 Review of Terms of Reference JPG Discussion
13 Advance Notice Questions
14 Work Programme 2017/18 and Agenda for next meeting JPG Information
15 Any other business
Date and Time of next meeting in public The next Council of Governors meeting in public will be at 10am on 12 October 2017 in the Boardroom of the Norfolk and Norwich University Hospital