agenda item: 8.2, public q3 ward to board report. january/8.2 q3 ward... · q3 ward to board report...
TRANSCRIPT

Q3 Ward to Board Report 30 January 2013 Page 1 of 23
Agenda item:
8.2, Public Date: 30 January 2013
Title:
Q3 Ward to Board Report
Prepared by:
Ian Bramley, Deputy Director of Nursing and Patient Care
Presented by:
Em Wilkinson-Brice, Chief Nurse and Executive Director of Service Delivery
Responsible Executive:
Em Wilkinson-Brice, Chief Nurse and Executive Director of Service Delivery
Summary:
Brief overview of issues addressed in the paper.
Actions required:
For information
Status (*): Decision Approval Discussion Information
X
History:
Previous Ward to Board (W2B) Drill Down Report was discussed in October 2012 Board of Directors Meeting.
Link to strategy/ Assurance framework:
Board Assurance Framework Strategic Risk 1C
Monitoring Information Please specify CQC standard
numbers and tick other boxes as appropriate
Care Quality Commission Standards Outcomes
Monitor Finance
Service Development Strategy Performance Management X
Local Delivery Plan Business Planning
Assurance Framework X Complaints
Equality, diversity, human rights implications assessed
Other (please specify)

Q3 Ward to Board Report 30 January 2013 Page 2 of 23
1. PURPOSE
1.1 To provide the Board with the quarterly drill down report into the Ward to Board (W2B) quality framework.
2. BACKGROUND
2.1
This report monitors performance at acute inpatient ward and divisional level and provides a RAG rated outcome indicator based on scores for each indicator against the set trajectory and target. This report forms part of the Integrated Performance report for scrutiny by the Board. The monthly report is scrutinised by the Chief Nurse / Director of Service Delivery and it is currently monitored on a monthly basis by the Deputy Director of Nursing and Patient Care. A rolling action plan is developed and maintained by the Divisions in response to the monthly reports. The Deputy Director of Nursing and Patient Care holds the Lead Nurses to account for performance against the action plan. This information is presented with the Clinical Quality Assessment Tool (CQAT) data and with information from incidents and complaints. Information is triangulated with complaint and incident data to provide an overall evaluation of performance.
2.2 The individual directorate aggregate scorecards are presented at the end of the narrative report.
2.2.1 Medicine: This Division has successfully opened Ashburn and Yealm Wards this Quarter. This has contributed significantly to the Trust’s capacity plans. All the staff required for these new wards have been recruited and have undergone a comprehensive induction programme. The Division has seen a significant increase in unplanned activity. Norovirus has been very active in the local community and this has had a impact which has required several Wards to restrict admissions and movement of staff and patients around the hospital. The Division has seen an improvement in the prevention of Pressure Ulcers culminating in December when there were no Pressure Ulcers of grade 2 or above. The MUST Nutritional assessment and compliance audits of compliance with the triggers have shown a deterioration. This has been reviewed by the Lead Nurse for Medicine, who reports that the focus on this work is having a noticeable effect at patient level with far more patients receiving appropriate monitoring and suitable nutrition and supplements. A review of the timeliness of the initial assessment is being carried out. At the current time this assessment is often completed under pressure, and it is felt that there will be improved compliance and accuracy if this assessment is moved to later in the acute admission process. This is part of a wider review of the timing and documentation of all admission assessments which was commissioned by the Senior Nurses through the Care Matters meetings chaired by the Chief Nurse / Director of Service Delivery. There has been a general deterioration in the Division’s Performance in Hand Hygiene Audits. Taw Ward has consistently failed to meet an acceptable level of hand hygiene for a number of months despite input from the Infection Control Team. There has been increased education and supervision in the area. A review of the last 6 months of data

Q3 Ward to Board Report 30 January 2013 Page 3 of 23
does not indicate that this problem sits with any individual or professional group and is proving difficult to manage. A Senior Management meeting has reviewed all actions taken so far and to further understand this issue. The review has shown there has been no harm to patients that can be linked to this. The Division will continue to address the poor compliance by observing individual practice and using the Trust’s performance management process where indicated. The Division has seen an increase in inpatient falls in the latter part of the Quarter. This is against a backdrop of improved falls assessment. The opening of Ashburn and Yealm has contributed to this increase. The number of falls in each area has increased marginally; none of these on their own represents a significant increase for any one ward, however in aggregation they show a peak. The Division will continue to monitor this situation closely. The Division has seen a peak in sickness caused by staff suffering predominantly from Norovirus or colds. The Directorate continue with robust application of the Sickness Management Policy. This is reviewed through the monthly management review meeting. The Ward to Board and CQAT results have been reviewed as part of Speciality and Directorate Governance Groups. Torridge Ward has a higher number of red triggers than would be expected, therefore the management team of Torridge has been requested to submit a review of their Ward to Board and CQAT supporting their action plan for review by the Divisional Governance Group.
2.2.2 Surgery: Overall the Division continues to perform well, but there has been a slight general deterioration across all measures. In order to understand and address this before it becomes a problem the Lead Nurse for Surgery has called a meeting with Ward Matrons to reinforce minimum standards and to set trajectories for improvement where they are required. Four Wards have been identified as contributing significantly to deterioration in compliance with the hand hygiene standards. The frequency of audits in these areas has been increased to weekly and the Infection Prevention and Control Team are actively engaged in monitoring and challenging practice in those areas. Early evidence from these audits is showing an improvement in compliance The Division reported poor compliance with the MUST Nutritional Risk Triggers in November. This has been investigated and it is largely due to the complexities caused by the necessary restrictions on diets that are often required in surgical specialties. This has resulted in the need to refine the audit process. This work has taken place through December and the resulting improvement in the data can be seen. The challenges in this audit process have not had an impact on patient care as the issue is purely one of audit design. However some wards are showing a deteriorating compliance with the MUST initial nutritional assessment. Ward Matrons are proactively managing this. In order to understand whether there is another cause for this all missing data is currently being reviewed at an individual patient level. There has been a reduction in the number of falls assessments being completed and an increase in the number of falls. There has not been an increase in harm to patients

Q3 Ward to Board Report 30 January 2013 Page 4 of 23
as a result of these falls. Ward Matrons are formally monitoring all patients on a daily basis to ensure assessments are complete. This is being performance managed formally through a weekly review with Senior Matrons
2.2.3 Women’s Health – Wynard Ward:
Wynard Ward continues to deliver good performance against all the indicators with the exception of VTE risk assessment. There is some confusion regarding the
identification of patients for whom risk assessment is indicated. This is predominately focussed on discrepancies with the day case service. The Ward Matron is working to improve the understanding of this and adjustments are currently being made to the recording systems within the Day Case Unit on Wynard.
2.2.4 Cancer Services: Cancer Services have continued to deliver excellent performance. They have delivered 97.2%% harm free care.
2.2.5 Paediatrics: The paediatric measures are showing excellent performance with 100% harm-free care and 100% compliance with the hand hygiene audit.
2.2.6 Trauma and Orthopaedics: The Division has delivered an excellent set of results with the Safety Thermometer showing a complete absence of new harm and the delivery of 100% harm free care in December. The only indicator causing concern within Trauma and Orthopaedics is sickness absence. This is largely as a result of seasonal illness.
4. PROPOSALS
4.1 The Infection Prevention and Control Team have developed a performance dashboard. A representation of this currently populated with sample data is attached at Appendix A for the Board’s information. It is proposed that the Board receives this dashboard as part of this report quarterly
5. FINANCIAL/OTHER IMPLICATIONS
5.1 The reduction in Agency Nurse usage will reduce the cost pressures associated with temporary staffing. The Trust is required to achieve 90% compliance with electronic VTE reporting during Quarter 3 and 4 in order to realise the associated CQUIN money
6. RECOMMENDATIONS

Q3 Ward to Board Report 30 January 2013 Page 5 of 23
6.1 The Board is requested to note the Quarter 3 Ward to Board drill down report and to accept the proposal to include the Infection Prevention and Control Performance Dashboard in future reports
Ward to Board Quarter Four Report April 2012 25th April 2012 Page 6 of 23
Appendix A
`
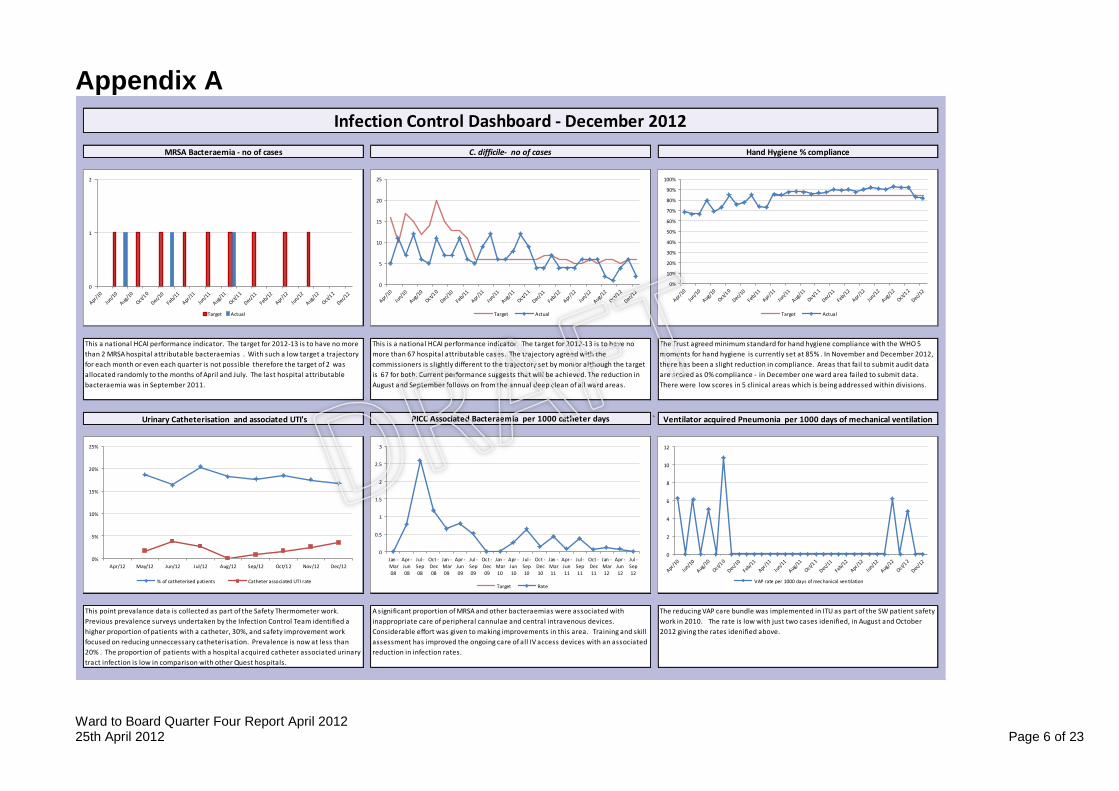
A significant proportion of MRSA and other bacteraemias were associated with
inappropriate care of peripheral cannulae and central intravenous devices.
Considerable effort was given to making improvements in this area. Training and skill
assessment has improved the ongoing care of all IV access devices with an associated
reduction in infection rates.
This a national HCAI performance indicator. The target for 2012-13 is to have no more
than 2 MRSA hospital attributable bacteraemias . With such a low target a trajectory
for each month or even each quarter is not possible therefore the target of 2 was
allocated randomly to the months of April and July. The last hospital attributable
bacteraemia was in September 2011.
This is a national HCAI performance indicator. The target for 2012-13 is to have no
more than 67 hospital attributable cases. The trajectory agreed with the
commissioners is slightly different to the trajectory set by monior although the target
is 67 for both. Current performance suggests that will be achieved. The reduction in
August and September follows on from the annual deep clean of all ward areas.
The Trust agreed minimum standard for hand hygiene compliance with the WHO 5
moments for hand hygiene is currently set at 85% . In November and December 2012,
there has been a slight reduction in compliance. Areas that fail to submit audit data
are scored as 0% compliance - in December one ward area failed to submit data.
There were low scores in 5 clinical areas which is being addressed within divisions.
Urinary Catheterisation and associated UTI's PICC Associated Bacteraemia per 1000 catheter days Ventilator acquired Pneumonia per 1000 days of mechanical ventilation
This point prevalance data is collected as part of the Safety Thermometer work.
Previous prevalence surveys undertaken by the Infection Control Team identified a
higher proportion of patients with a catheter, 30%, and safety improvement work
focused on reducing unneccessary catheterisation. Prevalence is now at less than
20% . The proportion of patients with a hospital acquired catheter associated urinary
tract infection is low in comparison with other Quest hospitals.
Data Not Yet Available
The reducing VAP care bundle was implemented in ITU as part of the SW patient safety
work in 2010. The rate is low with just two cases idenified, in August and October
2012 giving the rates idenified above.
Infection Control Dashboard - December 2012
MRSA Bacteraemia - no of cases C. difficile- no of cases Hand Hygiene % compliance
Data Not Yet Available
0
5
10
15
20
25
Target Actual
0
0.5
1
1.5
2
2.5
3
Jan -Mar
08
Apr -Jun
08
Jul -Sep
08
Oct -Dec
08
Jan -Mar
09
Apr -Jun
09
Jul -Sep
09
Oct -Dec
09
Jan -Mar
10
Apr -Jun
10
Jul -Sep
10
Oct -Dec
10
Jan -Mar
11
Apr -Jun
11
Jul -Sep
11
Oct -Dec
11
Jan -Mar
12
Apr -Jun
12
Jul -Sep
12
Target Rate
0
1
2
Target Actual
0%
5%
10%
15%
20%
25%
Apr/12 May/12 Jun/12 Jul/12 Aug/12 Sep/12 Oct/1 2 Nov/12 Dec/12
% of catheterised patients Catheter associated UTI rate
0
2
4
6
8
10
12
VAP rate per 1000 days of mechanical ventilation
0%
10%
20%
30%
40%
50%
60%
70%
80%
90%
100%
Target Actual

Ward to Board Quarter Four Report April 2012 25th April 2012 Page 7 of 23
% surgical site infection in spinal surgery
Antimicrobial CQUIN 6a (Indication) & 6b (Duration Antimicrobial CQUIN 6c (Guideline Compliance) Bed days lost to outbreaks
% of surgical site infection in hip replacement surgery% of surgical site infection in knee replacement surgery
Continuous surveillance is undertaken for knee replacement surgery. The rate rose in
2010 with the RD&E bacame a high outlier against other partcipating centres and was
above the benchmark for 4 sucessive quarters Despite , focused efforts by the knee
team to address this, the quartely rate has remained higher than the national
benchmark in alternative quarters. However, the mean % rate for the last 4 quarters
is 0.65 with the national benchmark at 0.6.
Continous surveillance is undertaken for patients undergoing hip replacement. The
rate of infection is consistently below the national benchmark.
Continuous surveillance has been undertaken for spinal surgery after a a high rate
was identified having completed a surveillance module in 2009. The rate is now
consistently below the national bench mark.
Prudent antimicrobial prescribing optimises treatment of infection and minimises
side effects such as the emergence & spread of resistant organisms and C.difficile
associated diarrhoea. CQUIN targets for drug chart documentation of indication and
duration for antimicrobials were introduced in April 2012. Subsequently there has
been a progressive improvement in prescribing documentation, although there is
capacity to further raise and sustain standards.
CQUIN targets for in-patient antimicrobial prescribing compliance with Trust
prescribing guidelines were introduced in October 2012. This has seen a considerable
and sustained improvement in compliance across the acute Trust.
NB - The data used in this graph has not been validated, has been included in this draft
as an example and is likely to be significantly lower once validated. Definition of bed
days lost is: the sum of empty beds each day (to which patients cannot be admitted
because the ward is closed to admissions) for the duration of a ward outbreak. For
example a ward is closed to admissions for 3 days - if on day 1 there are 0 empty
beds, on day 2 there is 1 empty bed, day 3 there are 2 empty beds. Total bed days lost
= 3 bed days.
0
0.2
0.4
0.6
0.8
1
1.2
1.4
Jan -
Mar08
Apr -
Jun08
Jul -
Sep08
Oct -
Dec08
Jan -
Mar09
Apr -
Jun09
Jul -
Sep09
Oct -
Dec09
Jan -
Mar10
Apr -
Jun10
Jul -
Sep10
Oct -
Dec10
Jan -
Mar11
Apr -
Jun11
Jul -
Sep11
Oct -
Dec11
Jan -
Mar12
Apr -
Jun12
Jul -
Sep12
National Benchmark Total Hip - 3 month inpt/ readm RD&E Total Hip SSI - 3 month inpt/ readm
0
0.5
1
1.5
2
2.5
Jan -
Mar08
Apr -
Jun08
Jul -
Sep08
Oct -
Dec08
Jan -
Mar09
Apr -
Jun09
Jul -
Sep09
Oct -
Dec09
Jan -
Mar10
Apr -
Jun10
Jul -
Sep10
Oct -
Dec10
Jan -
Mar11
Apr -
Jun11
Jul -
Sep11
Oct -
Dec11
Jan -
Mar12
Apr -
Jun12
Jul -
Sep12
National Benchmark Knee Inpt/readm- 3 month data RD&E Knee Inpt/readm rate- 3 month data
0
0.2
0.4
0.6
0.8
1
1.2
1.4
1.6
1.8
2
Jan -
Mar08
Apr -
Jun08
Jul -
Sep08
Oct -
Dec08
Jan -
Mar09
Apr -
Jun09
Jul -
Sep09
Oct -
Dec09
Jan -
Mar10
Apr -
Jun10
Jul -
Sep10
Oct -
Dec10
Jan -
Mar11
Apr -
Jun11
Jul -
Sep11
Oct -
Dec11
Jan -
Mar12
Apr -
Jun12
Jul -
Sep12
National Benchmark Spinal < 5 year data RD&E Spinal 3 month inpatient/ readmission
0%
10%
20%
30%
40%
50%
60%
70%
80%
90%
100%
% of courses with Indication CQUIN Target % of courses with stop/review date
0%
10%
20%
30%
40%
50%
60%
70%
80%
90%
100%
Apr/12 May/12 Jun/12 Jul/12 Aug/12 Sep/12 Oct/1 2 Nov/12 Dec/12
Empirical Therapy as per guidelines CQUIN Target
0
100
200
300
400
500
600
700
800
900
Apr/12 May/12 Jun/12 Jul/12 Aug/12 Sep/12 Oct/1 2 Nov/12 Dec/12
Number of bed days lost due to Infection Control issues

Ward to Board Quarter Four Report April 2012 25th April 2012 Page 8 of 23
Medicine

Ward to Board Quarter Four Report April 2012 25th April 2012 Page 9 of 23

Ward to Board Quarter Four Report April 2012 25th April 2012 Page 10 of 23

Ward to Board Quarter Four Report April 2012 25th April 2012 Page 11 of 23
Surgery

Ward to Board Quarter Four Report April 2012 25th April 2012 Page 12 of 23

Ward to Board Quarter Four Report April 2012 25th April 2012 Page 13 of 23

Ward to Board Quarter Four Report April 2012 25th April 2012 Page 14 of 23
T&O

Ward to Board Quarter Four Report April 2012 25th April 2012 Page 15 of 23
Ward to Board Quarter Four Report April 2012 25th April 2012 Page 16 of 23

Ward to Board Quarter Four Report April 2012 25th April 2012 Page 17 of 23
Cancer Services

Ward to Board Quarter Four Report April 2012 25th April 2012 Page 18 of 23

Ward to Board Quarter Four Report April 2012 25th April 2012 Page 19 of 23

Ward to Board Quarter Four Report April 2012 25th April 2012 Page 20 of 23
Child & Women’s Health

Ward to Board Quarter Four Report April 2012 25th April 2012 Page 21 of 23

Ward to Board Quarter Four Report April 2012 25th April 2012 Page 22 of 23

Ward to Board Quarter Four Report April 2012 25th April 2012 Page 23 of 23
Paediatrics