agenda finance committee december 1, 2016 page i. … · maryland and virginia transit partnership...
TRANSCRIPT

Washington
Metropolitan Area
Transit Authority
600 Fifth Street, NW
Washington, DC 20001
202/962-1234
By Metrorail:
Judiciary Square---Red
Line
Gallery Place-Chinatown---
Red, Green and
Yellow Lines
By Metrobus:
Routes D1, D3, D6, P6,
70, 71, 80, X2
A District of Columbia,
Maryland and Virginia
Transit Partnership
Agenda
Finance Committee December 1, 2016
FINANCE COMMITTEE
Mr. Michael Goldman, Chair Mr. Tom Bulger, Vice-Chair Mr. Jack Evans Ms. Keturah Harley Mr. Jim Corcoran Mr. David Strickland Mrs. Catherine Hudgins Ms. Carol Carmody Mr. Malcolm Augustine Mr. Christian Dorsey Mr. Robert Lauby Mr. Leif Dormsjo Ms. Kathryn Porter Mr. Paul Smedberg Mr. Anthony Costa
Page I. Approval of Agenda II. Approval of Minutes 2 III. Action Items A. Approval of SelectPass Fare Product (S. Kannan) 4 B. FY2017 Reimbursable Bus Service (J. Hamre) C. Request for FY2018 Budget Public Hearing (D. Anosike) IV. Information Items A. GM/CEO Proposed FY2018 Capital Budget and FY2018-
2023 Capital Improvement Program (P. Wiedefeld/ D. Anosike)
B. FY2018 Operating Budget Work Session (D. Anosike/ T. Webster)
V. Subsequent Finance Committee Agenda

Finance Committee
Item II
December 1, 2016
Minutes of November 3, 2016

Washington
Metropolitan Area
Transit Authority
600 Fifth Street, NW
Washington, DC 20001
202/962-1234
By Metrorail:
Judiciary Square---Red
Line
Gallery Place-Chinatown---
Red, Green and
Yellow Lines
By Metrobus:
Routes D1, D3, D6, P6,
70, 71, 80, X2
A District of Columbia,
Maryland and Virginia
Transit Partnership
Minutes Finance Committee November 3, 2016
Mr. Goldman called the meeting to order at 10:31 a.m. Present were: Committee Members
Mr. Michael Goldman, Chair Mr. Tom Bulger, Vice-Chair Mr. Jack Evans Ms. Keturah Harley (phone) Mr. Jim Corcoran Mr. David Strickland Mrs. Catherine Hudgins Ms. Carol Carmody
Mr. Malcolm Augustine Mr. Christian Dorsey Mr. Robert Lauby Mr. Leif Dormsjo Ms. Kathryn Porter Mr. Paul Smedberg Mr. Anthony Costa
The agenda was approved as presented. The minutes of the October 13, 2016, meeting were approved as submitted. Action Item A. Amendments to FY2017-2022 Capital Improvement Program (CIP)
Three proposed amendments to the FY2017-2022 CIP were approved:
Mr. Bulger moved, and Mrs. Hudgins seconded, to increase the FY2017 budgets for Railcar Acquisition by $90 million and for Fixed Rail by $60 million, to be funded in FY2017 through lines of credit or other short-term debt financing. The motion was approved unanimously.
Ms. Carmody moved, and Mr. Bulger seconded, to reprogram FY2017 CIP budget to reflect updated expenditure forecasts with no net funding impact:
o Propulsion: reduce by $7 million o Signals & Communication: reduce by $6 million o Platforms & Structures: increase by $13 million
The motion was approved unanimously. Mr. Smedberg moved, and Ms. Hudgins seconded, to modify the FY2017-
2022 CIP to incorporate $17.4 million of NVTA grant funding. The motion was approved unanimously.
The Committee also received information on the progress and delivery rates for the FY2017 capital program through the first quarter (July to September).
Information Items A. GM/CEO FY2018 Operating Budget Proposal
Mr. Wiedefeld presented the proposed FY2018 operating budget, including forecasts of revenue and expense and descriptions of the various actions necessary to ensure a balanced budget, including management actions to reduce headcount and expense; utilization of Federal Transit Administration (FTA) grant funds for eligible preventive maintenance (PM) expenses; proposed changes to fares on Metrobus, Metrorail, and MetroAccess, as well as to parking fees; proposed rationalizations of Metrobus and Metrorail service to correspond to current lower levels of demand; and increases in jurisdictional contributions.
B. FY2017 First Quarter Operating Update
Mr. Anosike presented a summary of FY2017 first quarter operating results, including ridership, revenue, and expenses.
The meeting was adjourned at 11:52 a.m.

Finance Committee
Action Item III-A
December 1, 2016
SelectPass: Pilot Performance and
Tariff Update

Washington Metropolitan Area Transit Authority
Board Action/Information Summary
TITLE:
SelectPass: Pilot Performance and Tariff Update
PRESENTATION SUMMARY:
The presentation provides a history of the SelectPass pilot and describes its performance to date. The Board is asked to approve the equity analysis of SelectPass, as required by Title VI of the Civil Rights Act of 1964, approve making the SelectPass available as a permanent fare product, and authorize Staff to make conforming changes to the Tariff.
PURPOSE:
To provide an update on the SelectPass pilot program, seek Board approval of the equity analysis and the SelectPass as a permanent fare product, and authorize Staff to make conforming changes to the Tariff to make the Select Pass a permanent fare product.
DESCRIPTION:
Key Highlights:
A pilot of SelectPass, a customizable, unlimited monthly pass product, began in April of 2016,
The product has been well received by the public, continues to grow, and shows no risk to net revenues
An equity analysis of the pilot shows no concerns.
Background and History:
At the December 2015 meeting, the Board approved a resolution directing staff to pilot an unlimited monthly pass program. This directive resulted from customer research indicating interest in unlimited monthly passes paired with low market penetration of existing pass products. Additionally, such a pass was seen as a potential solution to decreasing ridership, revenue, and customer satisfaction by providing customers with up to 5 days of commute travel for free. Based on industry research, results from consumer surveys, and analysis of WMATA’s fare system data, it was determined that a monthly pass program modeled after the SoundTransit (Seattle) PugetPass would be both popular and feasible.
Action Information MEAD Number:
201800 Resolution:
Yes No

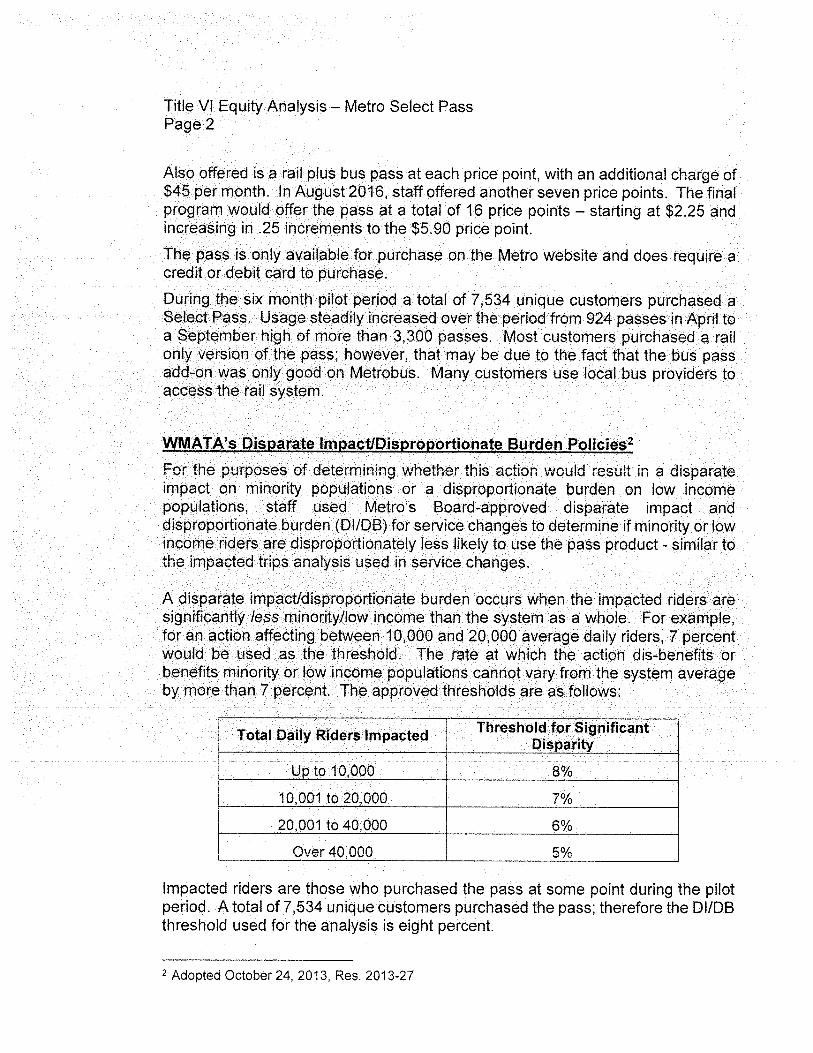
The pilot of the new pass program, called SelectPass, was launched on March 16, 2016. A Metro customer can specify the cost of his/her "usual" commute trip and would purchase a pass priced 36 times that value, in effect purchasing 18-days’ worth of peak commute travel to gain unlimited travel for a month. All trips costing equal to or less than the pass specified "value" are included in the pass, and customers pay only the difference for trips that cost more. In preparation for the pilot, staff worked with the Federal Transit Administration (FTA) to determine an appropriate timeline for the pilot that allowed enough time to gather data for an equity analysis while also working with the Board’s schedule. The FTA has allowed WMATA to operate the pilot until December 15, 2016, after which time there must be a completed Title VI equity analysis. The launch of the SelectPass pilot program was paired with a robust marketing of the pass and extensive public outreach to inform low-income and limited-English customers of the availability of the pilot pass (Public Participation Plan). Street teams were dispatched to selected stations during the first three months, totaling 23 outreach events. Staff also advertised the SelectPass in English and Spanish through in-station and in-vehicle signage and advertised in the Express, via audio streaming services and via selected radio broadcasts. SelectPass was also featured on an episode of MetroFocus. Staff reached out to SmartBenefits® administrators in both the public and private sector to encourage offering Transit Pass Benefits to their employees in order to allow use of SmartBenefits® to purchase passes. Feedback from a customer interest survey helped define the pass parameters as well as the naming and branding. Since the beginning of the pilot, six customer experience surveys have been conducted, which have provided overwhelmingly positive feedback on the pass, as described below. Finally, staff developed performance targets for the SelectPass pilot so that its overall effectiveness could be measured objectively. Throughout the pilot, these performance targets were met and surpassed.
Discussion:
Customers have provided very positive feedback: 93% rate their experience with SelectPass a 7 or higher on a scale of 1 to 10; and nearly all respondents (95%) think Metro is moving in the right direction with the pass. When asked what they liked about SelectPass, three themes emerged: (1) saving money; (2) worrying less; and (3) riding Metro more. "Thank you for SelectPass!" Sales of SelectPass have gone from 950 in April 2016 to 3,700 in October 2016. By comparison, sales of the current offering, the 28-Day Fast Pass, have ranged between 400 and 1,000 per month over the past year. Staff has assessed the performance targets, and has noted positive impacts on both ridership and revenue. Approximately two-thirds of pass users renew month-over-month and approximately twenty percent of pass customers are new to Metro. The net financial impact of SelectPass as of October 2015 is estimated to be slightly positive despite the increased usage exhibited by customers. Staff conducted an equity analysis to determine if implementation of the SelectPass would have a disparate impact (DI) on minority riders or a disproportionate burden (DB)

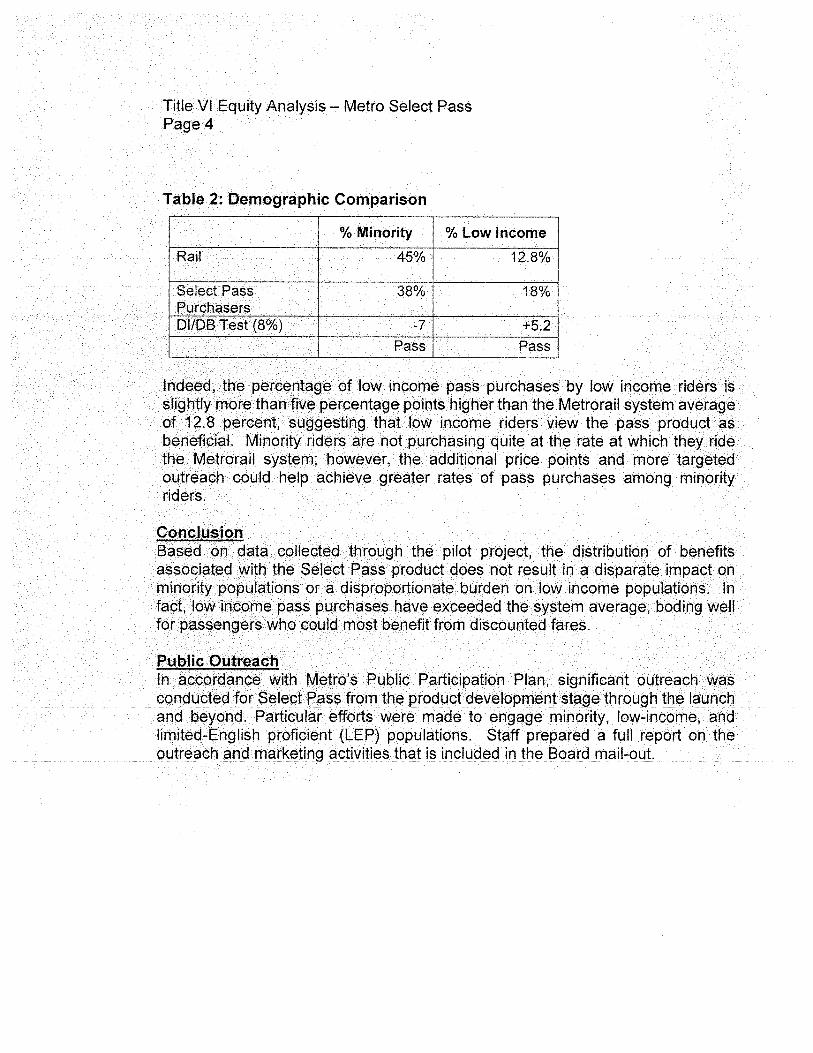
on low income riders. To do so, staff determined the number and percentage of minority and low income trips benefitting from the new pass product. These percentages were then compared to the system wide averages for minority and low-income ridership on Metrorail, and the differences evaluated using the appropriate DI/DB threshold. Staff analysis has determined that the SelectPass would not result in a disparate impact (DI) on minority populations or a disproportionate burden (DB) on low income populations. The ratio of minority riders benefiting from the pass is 38%, which is somewhat lower than the system average of 45%. However, this difference falls within the disparate impact threshold of 8%. The ratio of low income riders benefiting from SelectPass is actually higher than the system average, at 18% compared to 12.8%. Therefore, there is no disproportionate burden on low income customers. SelectPass shows high levels of customer satisfaction, no adverse impact on protected rider groups, and no revenue risk; therefore, staff recommends that the Board approve the equity analysis, make SelectPass available as a fare product permanently, and authorize staff to make conforming changes the Tariff. As a permanent fare product, SelectPass would be available at multiple rail price points from $2.25 to $5.75 at $0.25 increments, and the max fare of $5.90, and priced at 36 trips at each price point. Additionally, a rail-bus option would be available at each of therail-only SelectPass price points plus $45. The expansion of the program to all price points is contingent on technical feasibility within the current automatic fare collection system. SelectPass will be sold only on-line unless it is decided it is within WMATA’s interests to offer the pass through additional distribution channels.
FUNDING IMPACT:
TIMELINE:
. None. Approval of recommendations will not result in expenditure of funds.
Project Manager: Shyam Kannan
Project Department/Office:
Chief Engineer / Office of Planning
Previous Actions
Dec 2015 – Approval of pilot May 2016 -- Memo to board with update on SelectPass pilot implementation
Anticipated actions after presentation
Jan 2017 -- Expand to all price points Jul 2017 -- Include local bus operators in Rail+Bus version of pass
RECOMMENDATION:
• Approve Title VI equity analysis
• Approve SelectPass as a permanent fare product
• Authorize conforming changes to the Tariff

SelectPass: Conclusion of Pilot Program and Approval as Permanent Fare Product
Finance CommitteeDecember 1, 2016
Washington Metropolitan Area Transit Authority
Purpose
• Provide update on SelectPass pilot program • Seek Board approval of equity analysis and SelectPass as
permanent fare product
2
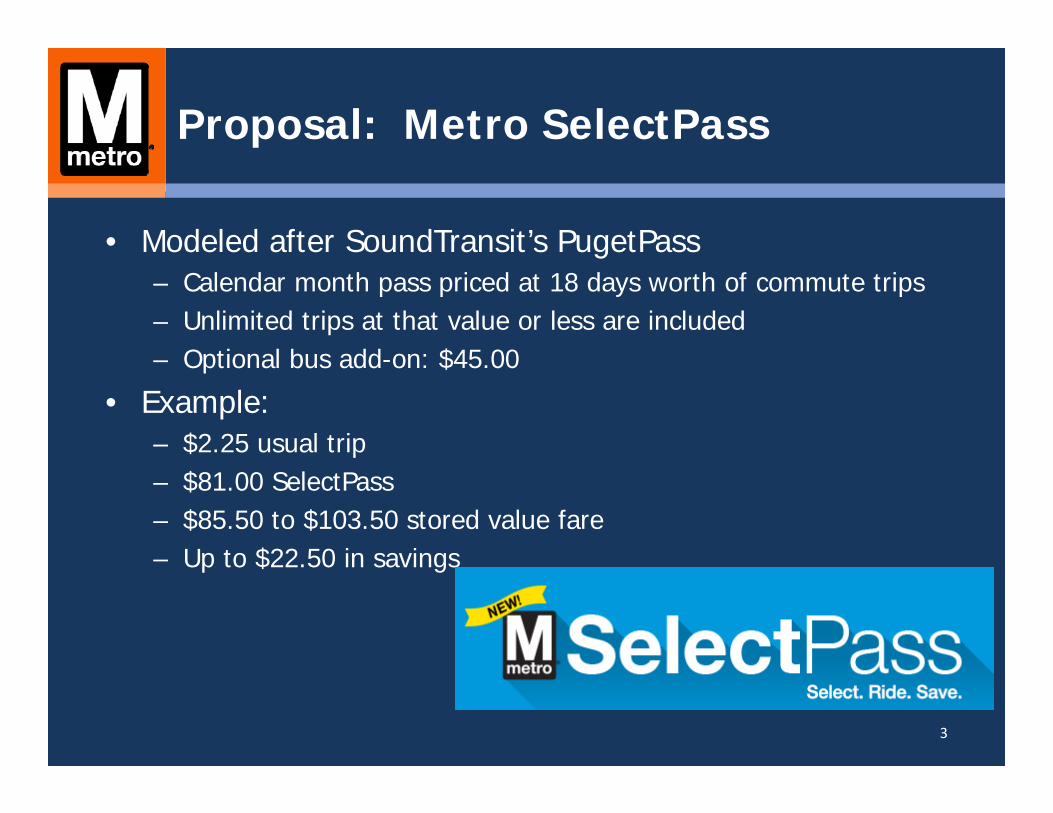
Proposal: Metro SelectPass
3
• Modeled after SoundTransit’s PugetPass– Calendar month pass priced at 18 days worth of commute trips– Unlimited trips at that value or less are included– Optional bus add-on: $45.00
• Example:– $2.25 usual trip– $81.00 SelectPass– $85.50 to $103.50 stored value fare– Up to $22.50 in savings

Marketing, Surveys & Implementation
SelectPass Street Team, March 17 2016, Dupont Circle 4
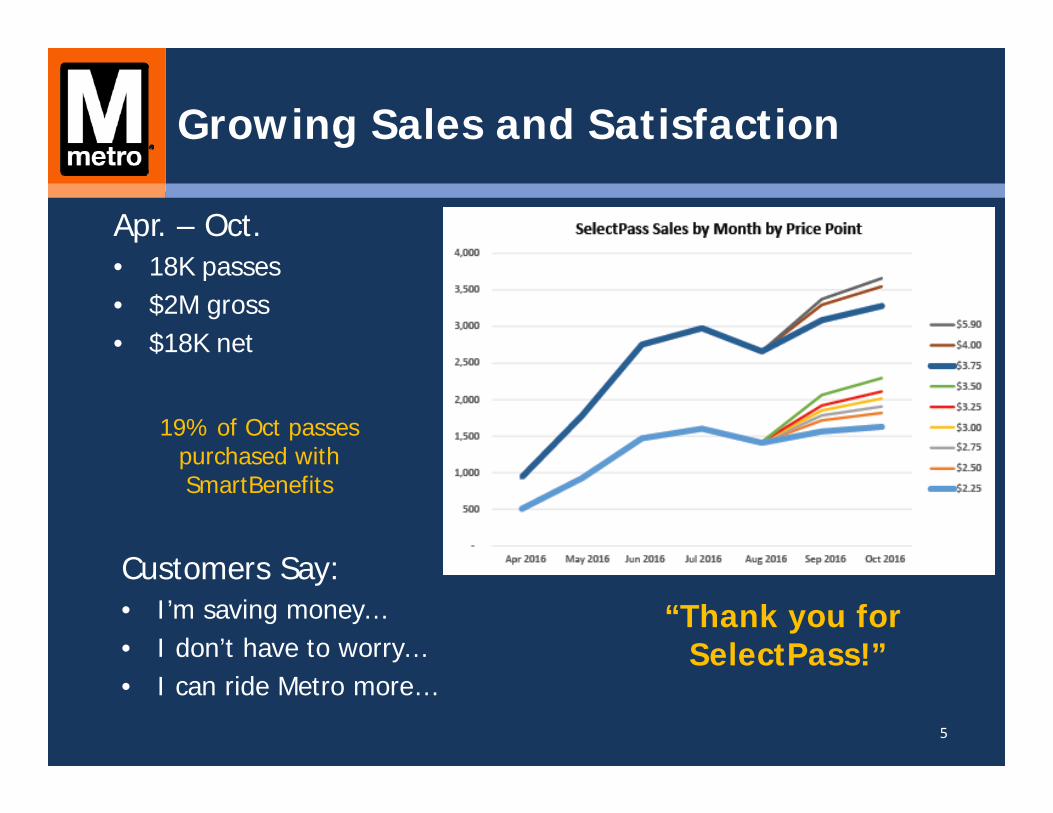
Growing Sales and Satisfaction
Customers Say:• I’m saving money…• I don’t have to worry…• I can ride Metro more…
Apr. – Oct.• 18K passes• $2M gross• $18K net
“Thank you for SelectPass!”
5
19% of Oct passes purchased with SmartBenefits
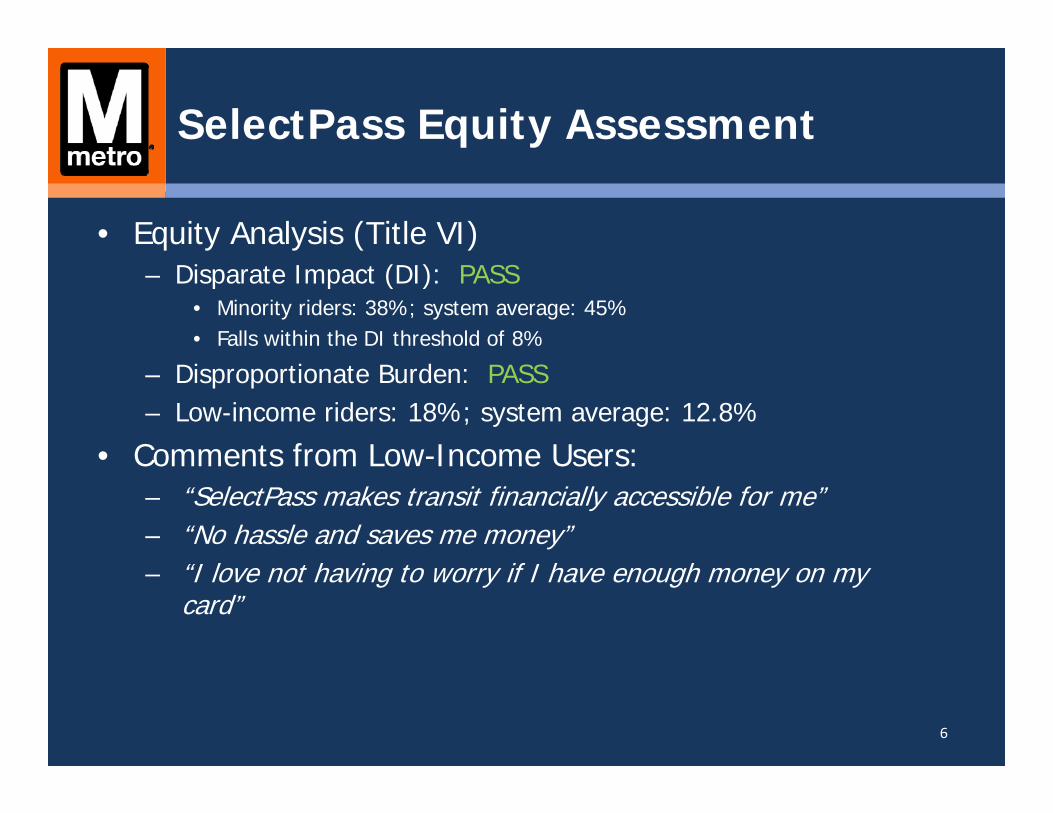
SelectPass Equity Assessment
• Equity Analysis (Title VI)– Disparate Impact (DI): PASS
• Minority riders: 38%; system average: 45% • Falls within the DI threshold of 8%
– Disproportionate Burden: PASS– Low-income riders: 18%; system average: 12.8%
• Comments from Low-Income Users:– “SelectPass makes transit financially accessible for me”– “No hassle and saves me money”– “I love not having to worry if I have enough money on my
card”
6

Recommendation
• Approve Title VI equity analysis• Approve SelectPass as a permanent fare product
7


Washington Metropolitan Area Transit Authority
Public Outreach & Input Report
SelectPass Pilot

2
Introduction
Metro staff, challenged with developing new pass products to increase pass usage
and create a steady fare revenue stream, developed a monthly pass called
SelectPass. Based on industry research, results from consumer surveys, and
analysis of WMATA’s fare system data, it was determined that a monthly pass
program modeled after the SoundTransit (Seattle) PugetPass would be both
popular and feasible.
In December 2015, the WMATA Board of Directors approved a resolution directing
staff to pilot an unlimited monthly pass program to test the feasibility and market
acceptance of the new monthly pass. SelectPass was launched on March 16,
2016 for monthly passes to begin in April. The pass was modeled after a product implemented in Seattle -
- a Metro customer can specify the cost of his/her "usual" commute trip and would purchase a pass priced
36 times that value, in effect purchasing 18-days’ worth of peak commute travel to gain unlimited travel
for a month. All trips costing equal to or less than the pass specified "value" are included in the pass, and
customers pay only the difference for trips that cost more.
When SelectPass launched, four price points were available:
Rail Only: $80/month. Included unlimited rail base trips up to $2.25. Customers were charged the difference if rail trip exceeded $2.25.
Rail + Bus: $125/month. Included unlimited rail base trips up to $2.25 and unlimited regular Metrobus. Customers were charged the difference if rail trip exceeded $2.25 on Express or Airport Express bus service was used.
Rail Only: $135/month. Included unlimited rail base trips up to $3.75. Customers were charged the difference if rail trip exceeded $2.25.
Rail + Bus: $180/month. Included unlimited rail base trips up to $3.75 and unlimited regular Metrobus. Customers were charged the difference if rail trip exceeded $3.75 on Express or Airport Express bus service was used.
In mid-August 2016, five additional price points were added as part of the pilot. Additional price points
were not available due to technology system limitations.
In order to purchase a SelectPass during the pilot period, customers must have a registered SmarTrip®
card with a valid email address and must purchase online. Future methods of distribution are still under
discussion.
The pilot period for SelectPass is scheduled to continue through the end of December 2016 or until the
WMATA Board of Directors approves to make SelectPass a permanent pass option.

3
Workshop signage and notification memo
Communications & Outreach to the Public
In order to generate awareness and increase the number of SelectPass pilot users, as well as to fulfill
WMATA’s Public Participation Plan, Metro tailored a communications and outreach plan that targeted
current customers who ride Metrorail somewhat frequently or frequently, with an emphasis on Title VI
populations.
All communications and outreach efforts began in mid-March 2016 and continued through December
2016. The final plan included the following efforts:
SmarTrip® registration workshops for Community Based Organizations/social service locations
In-station pop-up events
SmartBenefits® outreach
Stakeholder communication
Targeted marketing & media
SmarTrip® Registration Workshops to Community Based
Organizations & Social Service Locations
Knowing that SelectPass distribution was limited to online only and that purchasers
must have a registered SmarTrip card, staff wanted to increase the number of
registered SmarTrip card holders, especially amongst Title VI populations where
there may be language or technology barriers.
Metro coordinated with the WMATA Community Based Organization (CBO) Outreach
Committee to find locations in Washington DC, Maryland and Virginia where staff
could assist riders with the SmarTrip registration process and talk to them about
SelectPass. Seven workshops were held within the DMV region as part of the pilot,
with each workshop lasting 1½-3 hours.
Staff from Metro’s Customer Relations, Treasury and External Relations departments
assisted at each event and were identified by wearing a Metro name tag or shirt.
Bilingual Spanish speaking staff were at specific locations with high Spanish-speaking
populations. Equipped with SelectPass take-ones and other Metro materials, like local
Metrobus timetables for that area, staff aided customers step-by-step in SmarTrip
cards on-site, sometimes even helping them set up an email account first.
After the pilot concluded, the feedback received from the CBO Outreach Committee
and staff at the locations visited applauded the workshops and requested that Metro
consider continuing the model since it benefited their constituents who have limited
means and/or limited knowledge of English.
4
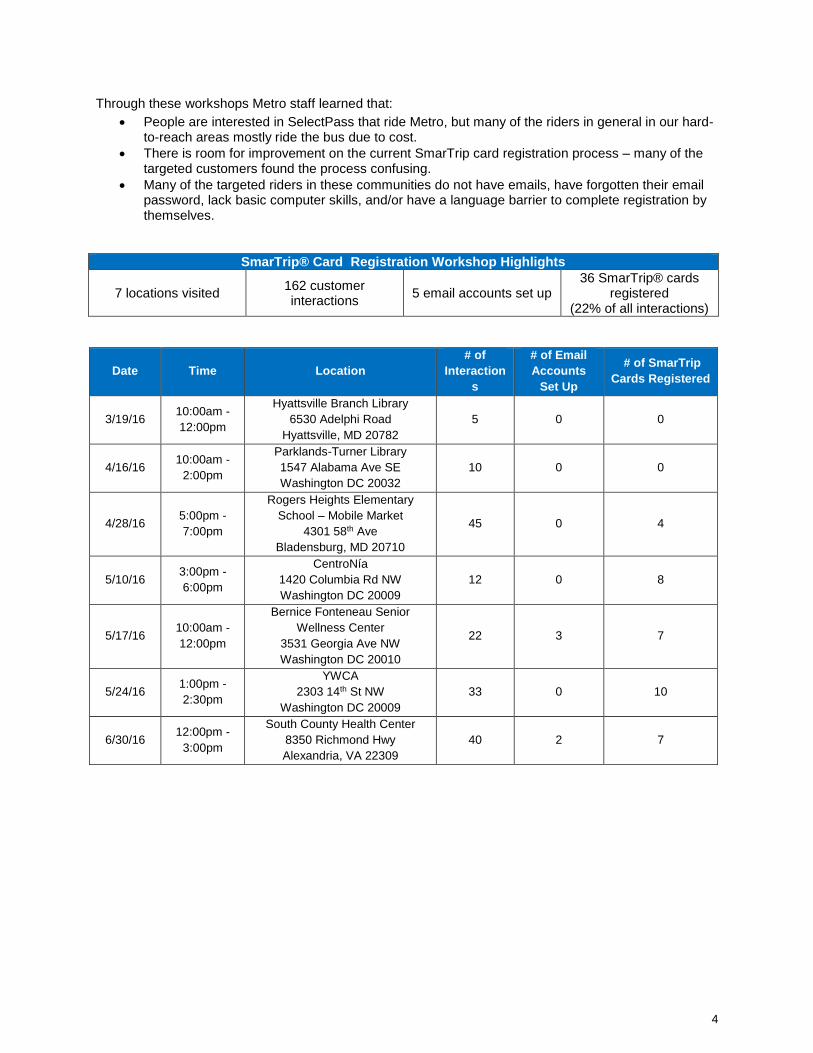
Through these workshops Metro staff learned that:
People are interested in SelectPass that ride Metro, but many of the riders in general in our hard-to-reach areas mostly ride the bus due to cost.
There is room for improvement on the current SmarTrip card registration process – many of the targeted customers found the process confusing.
Many of the targeted riders in these communities do not have emails, have forgotten their email password, lack basic computer skills, and/or have a language barrier to complete registration by themselves.
SmarTrip® Card Registration Workshop Highlights
7 locations visited 162 customer interactions
5 email accounts set up 36 SmarTrip® cards
registered (22% of all interactions)
Date Time Location
# of
Interaction
s
# of Email
Accounts
Set Up
# of SmarTrip
Cards Registered
3/19/16 10:00am -
12:00pm
Hyattsville Branch Library
6530 Adelphi Road
Hyattsville, MD 20782
5 0 0
4/16/16 10:00am -
2:00pm
Parklands-Turner Library
1547 Alabama Ave SE
Washington DC 20032
10 0 0
4/28/16 5:00pm -
7:00pm
Rogers Heights Elementary
School – Mobile Market
4301 58th Ave
Bladensburg, MD 20710
45 0 4
5/10/16 3:00pm -
6:00pm
CentroNía
1420 Columbia Rd NW
Washington DC 20009
12 0 8
5/17/16 10:00am -
12:00pm
Bernice Fonteneau Senior
Wellness Center
3531 Georgia Ave NW
Washington DC 20010
22 3 7
5/24/16 1:00pm -
2:30pm
YWCA
2303 14th St NW
Washington DC 20009
33 0 10
6/30/16 12:00pm -
3:00pm
South County Health Center
8350 Richmond Hwy
Alexandria, VA 22309
40 2 7

5
In-station Pop-up Events
Metro created a robust outreach pop-up event plan to target
Metrorail customers in key stations. Outreach street teams,
comprised of contractors, traveled to multiple stations in the
system to distribute informational take-ones. Locations, dates and
times were selected to correspond with the price point availability
during high ridership periods, with special emphasis on stations
with higher bus transfers and Title VI populations. Outreach in
stations was suspended beginning in May due to the start of the
SafeTrack maintenance initiative, but resumed in October at
stations that had minimal to no SafeTrack impact.
Contracted street teams were identified by bright blue Metro
SelectPass aprons and distributed take-ones that were in English
and Spanish. Bilingual Spanish-speaking team members were
present at each shift.
A total of 27 outreach events have been executed thus far with
another six events in progress.
SelectPass In-Station Take-one Distribution
March 2016 April 2016 October 2016 November 2016 Grand Total
As on October 31, 2016
25,309 43, 800 3,966 TBD 80,675
Outreach street teams in stations

6
SelectPass In-Station Take-one Distribution Schedule
Date Time Location
Total # of
take-ones
distributed
# of English
take-ones
distributed
# of Spanish
take-ones
distributed
3/14/2016 4:00pm –
6:30pm Union Station 1600 1600 0
3/15/2016 4:00pm –
6:30pm Farragut North 1405 1400 5
3/17/2016 4:00pm –
6:30pm Dupont Circle 2200 2203 3
3/21/2016 4:00pm –
6:30pm Farragut West 2604 2600 4
3/22/2016 4:00pm –
6:30pm McPherson Sq 3000 2500 500
3/23/2016 4:00pm –
6:30pm Metro Center 2800 2800 0
3/24/2016 4:00pm –
6:30pm Pentagon 3000 3000 0
3/28/2016 4:00pm –
6:30pm L’Enfant Plaza 2250 2000 250
3/29/2016 4:00pm –
6:30pm
Foggy Bottom-
GWU 2250 2000 250
3/30/2016 4:00pm –
6:30pm Rosslyn 1800 1800 0
3/31/2016 4:00pm –
6:30pm
Columbia
Heights 2400 2000 400
4/19/2016 4:00pm –
6:30pm Silver Spring 3000 2400 600
4/20/2016 4:00pm –
6:30pm Union Station 4600 4000 600
4/21/2016 7:00am –
9:30am Federal Triangle 1000 900 100

7
SelectPass In-Station Take-one Distribution Schedule continued
Date Time Location
Total # of
take-ones
distributed
# of English
take-ones
distributed
# of Spanish
take-ones
distributed
4/21/2016 4:00pm –
6:30pm Gallery Place 3600 3000 600
4/25/2016 7:00am –
9:30am
Navy Yard-
Ballpark 3800 3400 400
4/26/2016 7:00am –
9:30am Farragut North 7200 6000 1200
4/26/2016 4:00pm –
6:30pm L’Enfant Plaza 4000 3800 200
4/27/2016 7:30am –
9:30am
NoMa-Gallaudet
U 600 600 0
4/27/2016 4:00pm –
6:30pm Metro Center 4400 3200 1200
4/28/2016 7:00am –
9:30am L’Enfant Plaza 6000 4800 1200
4/28/2016 4:00pm –
6:30pm Farragut West 3800 3000 800
4/29/2016 7:00am –
9:30am Pentagon 1800 1400 400
10/18/2016 7:30am –
9:30am Rosslyn 1350 1250 100
10/18/2016 4:30pm –
6:30pm McPherson Sq 550 538 12
10/19/2016 7:30am –
9:30am
Foggy Bottom-
GWU 1063 1063 0
10/19/2016 4:30pm –
6:30pm Federal Triangle 1003 1000 3
11/15/2016 7:30am –
9:30am Huntington TBD TBD TBD
8
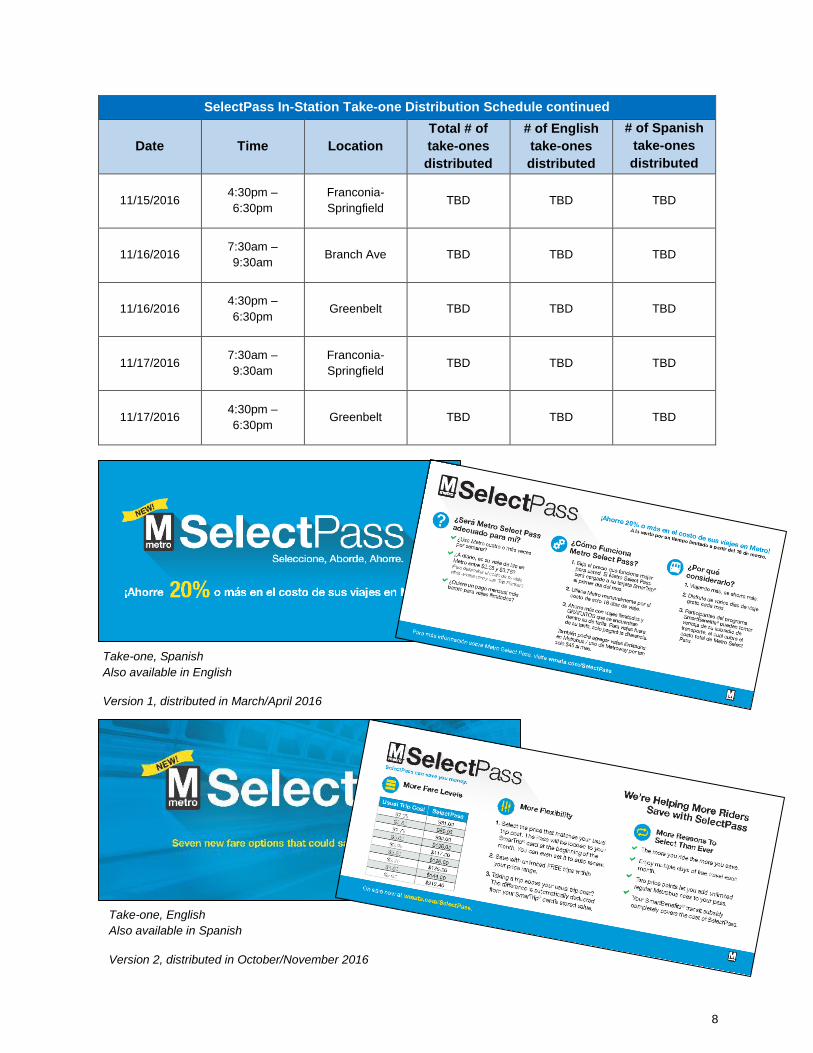
Take-one, English
Also available in Spanish
Version 2, distributed in October/November 2016
SelectPass In-Station Take-one Distribution Schedule continued
Date Time Location
Total # of
take-ones
distributed
# of English
take-ones
distributed
# of Spanish
take-ones
distributed
11/15/2016 4:30pm –
6:30pm
Franconia-
Springfield TBD TBD TBD
11/16/2016 7:30am –
9:30am Branch Ave TBD TBD TBD
11/16/2016 4:30pm –
6:30pm Greenbelt TBD TBD TBD
11/17/2016 7:30am –
9:30am
Franconia-
Springfield TBD TBD TBD
11/17/2016 4:30pm –
6:30pm Greenbelt TBD TBD TBD
Take-one, Spanish
Also available in English
Version 1, distributed in March/April 2016

9
SmartBenefits® Outreach
Staff reached out to SmartBenefits® administrators in both the public and private sector to encourage offering Transit Pass Benefits to their employees in order to allow use of SmartBenefits® to purchase passes. Outreach efforts included the following:
The top 60 customers were contacted via telephone and e-mail in May, with an additional update in September with the new price points.
Three SmartBenefits® Seminars were held on May 11th, June 8th and October 18, 2016 with an attendance total of 125 companies. The seminars promoted the SelectPass and trained employers on how to set it up in SmartBenefits®. Some of the top customers who attended includes but not limited to American Pharmacists Association, Congressional Black Caucus Foundation, Environmental Protection Agency, Department Health and Human Services, Ford Agency, U.S. Holocaust Museum.
Metro staff attended 50 SmartBenefits® Employer benefits fairs including Department of Defense, Keiser Permeate, Capitol One, Senate office staffers, Navy Federal Credit Union, Northrop Grumman, GEICO, and Freddie Mac and distributed approximately 3,000 SelectPass take-ones.
Staff attended five college Back-to-School orientations that included Northern Virginia Community College, University of District of Columbia, Prince George’s Community College, Howard University, and Virginia Tech and distributed approximately 800 SelectPass take-ones.
A pop-up message about SelectPass was placed about on the SmartBenefits® log-on webpage which is accessed several times a month by over 3,500 employers.
A direct e-mail was sent out to the entire customer base of over 4,000 employer SmartBenefits® administrators in both May and September 2016 to inform them of the SelectPass option and how to set it up in SmartBenefits®.
Stakeholder Communication
Local stakeholders helped spread the word about the SelectPass pilot.
Community Based Organizations were notified through emails and in-person meetings about SelectPass. A presentation was given to the CBO Outreach Committee on April 2, 2016 and the committee played a big part in spreading the word about the SmarTrip Card Registration Workshops and SelectPass.
Staff gave a presentation to the Jurisdiction Coordinating Committee in March 2016 and the Riders Advisory Council Budget and Finance Committee in April 2016 about SelectPass.
Amplify members were asked to weigh in on their interest of a pass product like SelectPass and their preferred pass name. Amplify is a community of 3,500 customers who provide on-going feedback to WMATA for immediate decision making.
Employees were notified about SelectPass through the General Manager’s weekly email message, the MetroWeekly employee newsletter and the Metrobus and Metrorail “hot sheets” that are shared with the operation divisions.
Metrorail “hot sheet”

10
Targeted Marketing & Media
Metro used targeted marketing and media strategies to increase
awareness and encourage riders to purchase SelectPass.
TRANSIT SIGNAGE
80 “two-sheets”, large ad displays in Metrorail stations, were posted where space was available.
450 rail car cards were posted on various Metrorail cars.
500 interior bus cards were posted in buses.
Digital screens in stations displayed ads for SelectPass.
LOCAL PRINT
A press release was published on August 22, 2016.
An advertisement in English was placed in the Washington Express on October 20, November 4, and November 17, 2016.
TELEVISION & RADIO
Banner ads were placed on Pandora for eight weeks from October through December, 2016 and the Mobile version of Magic 95.5 which aired the week of October 31, 2016.
Television advertisements were placed on the Spanish channels of Univision and Telemundo for six weeks.
Radio advertisements were placed on WKYS (93.9) for three weeks, ESPN/ Redskins TV & radio for nine weeks and on WHUR (96.3) for three weeks.
SelectPass was mentioned in an episode of MetroFocus, a television show that broadcasts on four public access stations throughout the greater Washington region (MD, DC, VA) and online.
DIGITAL
The webpage wmata.com/selectpass was created which included a “mini-site” that included a survey feature. Metro’s center image on the homepage also had a rotating ad.
Social media (Facebook, Twitter) was used to advertise SelectPass.
Local blog Greater Greater Washington wrote articles about SelectPass.
Metro teamed up with the Goodway Group to use geo-fencing from October through December, 2016. Geofencing is an opt-in software feature that uses the global positioning system (GPS) or radio frequency identification (RFID) to define geographical boundaries. Geo-fence push notifications are a way for small businesses to send extremely targeted messages to local customers inside a “virtual fence”.
EVENT MARKETING
Rail car card
SelectPass webpage
11
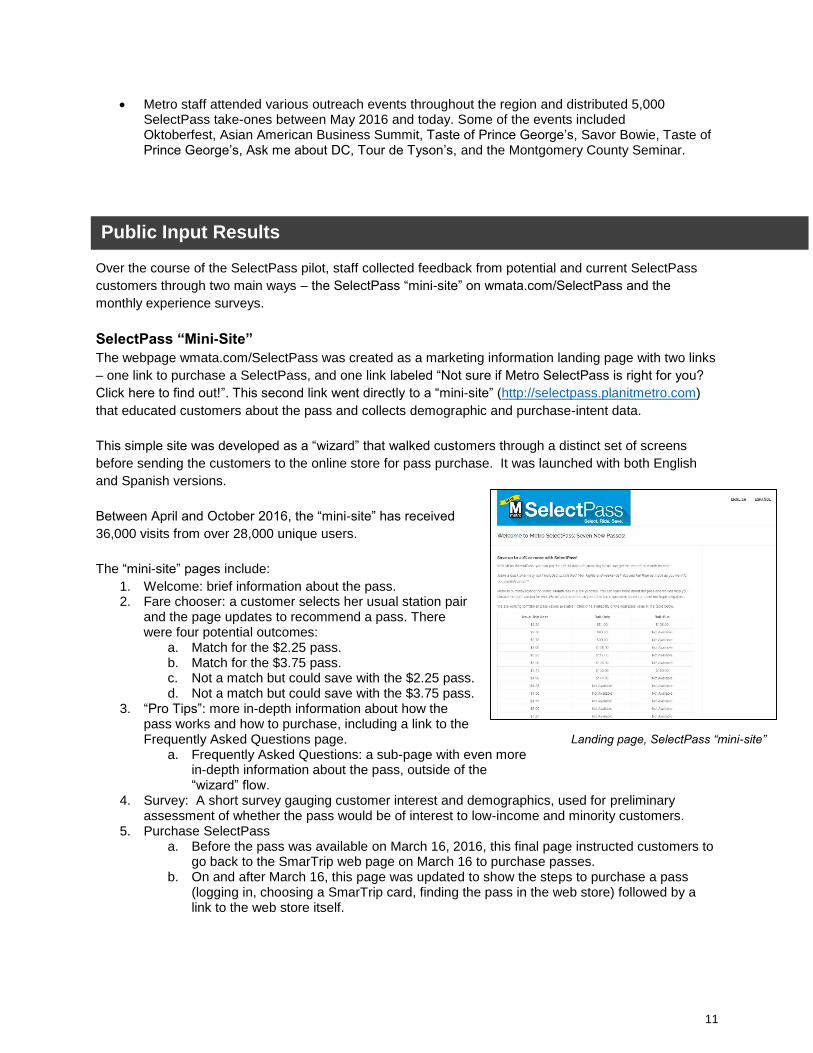
Metro staff attended various outreach events throughout the region and distributed 5,000 SelectPass take-ones between May 2016 and today. Some of the events included Oktoberfest, Asian American Business Summit, Taste of Prince George’s, Savor Bowie, Taste of Prince George’s, Ask me about DC, Tour de Tyson’s, and the Montgomery County Seminar.
Public Input Results
Over the course of the SelectPass pilot, staff collected feedback from potential and current SelectPass
customers through two main ways – the SelectPass “mini-site” on wmata.com/SelectPass and the
monthly experience surveys.
SelectPass “Mini-Site”
The webpage wmata.com/SelectPass was created as a marketing information landing page with two links
– one link to purchase a SelectPass, and one link labeled “Not sure if Metro SelectPass is right for you?
Click here to find out!”. This second link went directly to a “mini-site” (http://selectpass.planitmetro.com)
that educated customers about the pass and collects demographic and purchase-intent data.
This simple site was developed as a “wizard” that walked customers through a distinct set of screens
before sending the customers to the online store for pass purchase. It was launched with both English
and Spanish versions.
Between April and October 2016, the “mini-site” has received
36,000 visits from over 28,000 unique users.
The “mini-site” pages include:
1. Welcome: brief information about the pass. 2. Fare chooser: a customer selects her usual station pair
and the page updates to recommend a pass. There were four potential outcomes:
a. Match for the $2.25 pass. b. Match for the $3.75 pass. c. Not a match but could save with the $2.25 pass. d. Not a match but could save with the $3.75 pass.
3. “Pro Tips”: more in-depth information about how the pass works and how to purchase, including a link to the Frequently Asked Questions page.
a. Frequently Asked Questions: a sub-page with even more in-depth information about the pass, outside of the “wizard” flow.
4. Survey: A short survey gauging customer interest and demographics, used for preliminary assessment of whether the pass would be of interest to low-income and minority customers.
5. Purchase SelectPass a. Before the pass was available on March 16, 2016, this final page instructed customers to
go back to the SmarTrip web page on March 16 to purchase passes. b. On and after March 16, this page was updated to show the steps to purchase a pass
(logging in, choosing a SmarTrip card, finding the pass in the web store) followed by a link to the web store itself.
Landing page, SelectPass “mini-site”
12
After the first month, the site was updated to include a “buy now” on the bottom of every page, allowing a
customer to break out of the flow of the “wizard.”
To support the expansion of the available price points, the English version of the mini-site was updated in
August 2016. The main page displayed all available price points, and the chooser was updated to
recommend which of the price points – including the new ones – was the best fit for the customers. The
Spanish version will be updated if SelectPass is approved as a permanent pass.
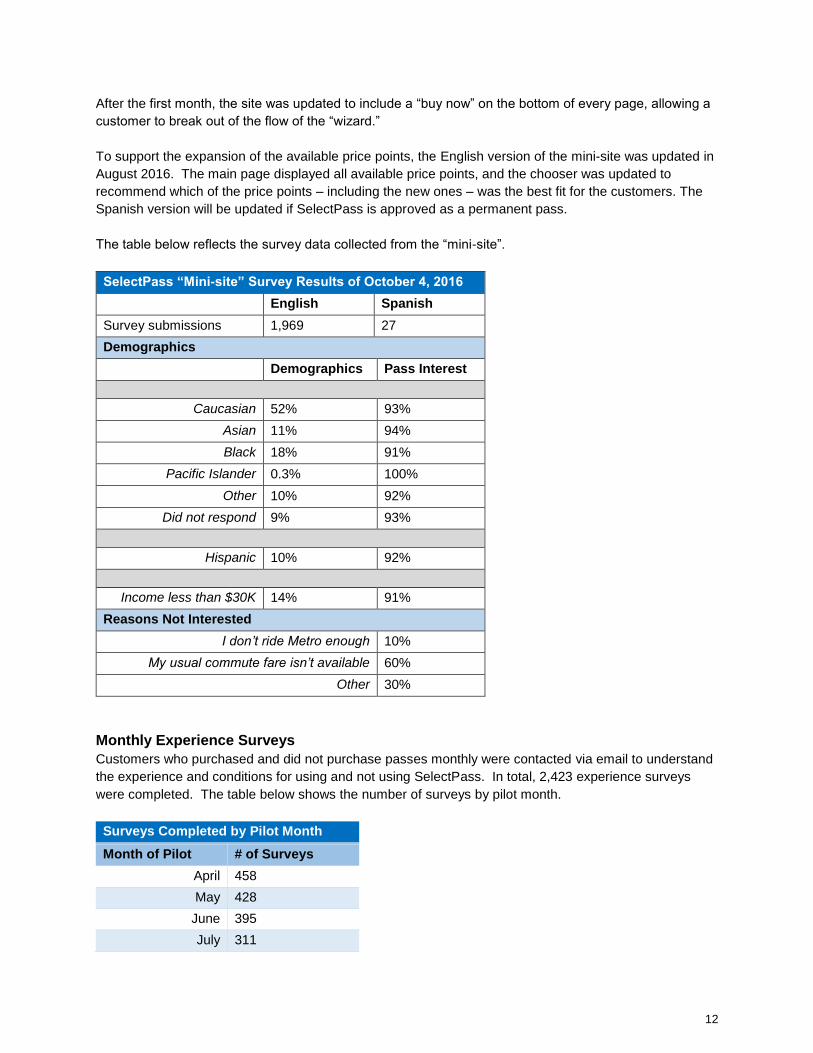
The table below reflects the survey data collected from the “mini-site”.
SelectPass “Mini-site” Survey Results of October 4, 2016
English Spanish
Survey submissions 1,969 27
Demographics
Demographics Pass Interest
Caucasian 52% 93%
Asian 11% 94%
Black 18% 91%
Pacific Islander 0.3% 100%
Other 10% 92%
Did not respond 9% 93%
Hispanic 10% 92%
Income less than $30K 14% 91%
Reasons Not Interested
I don’t ride Metro enough 10%
My usual commute fare isn’t available 60%
Other 30%
Monthly Experience Surveys
Customers who purchased and did not purchase passes monthly were contacted via email to understand
the experience and conditions for using and not using SelectPass. In total, 2,423 experience surveys
were completed. The table below shows the number of surveys by pilot month.
Surveys Completed by Pilot Month
Month of Pilot # of Surveys
April 458
May 428
June 395
July 311
13
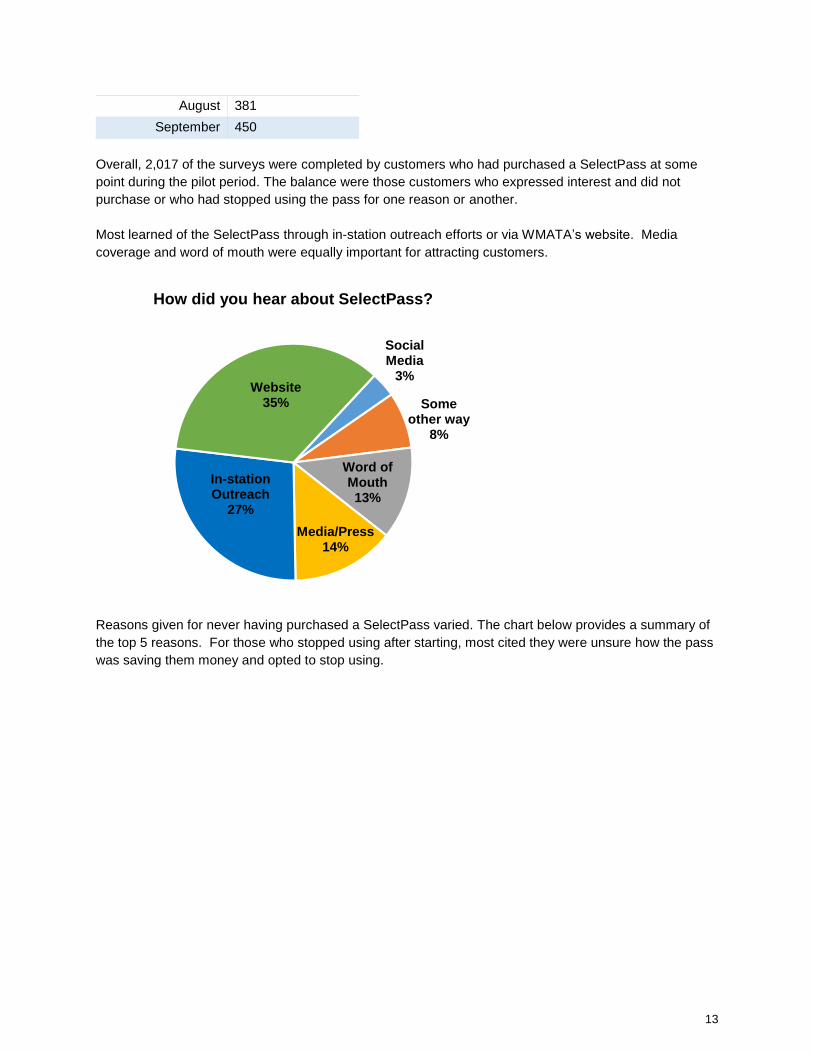
August 381
September 450
Overall, 2,017 of the surveys were completed by customers who had purchased a SelectPass at some
point during the pilot period. The balance were those customers who expressed interest and did not
purchase or who had stopped using the pass for one reason or another.
Most learned of the SelectPass through in-station outreach efforts or via WMATA’s website. Media
coverage and word of mouth were equally important for attracting customers.
Reasons given for never having purchased a SelectPass varied. The chart below provides a summary of
the top 5 reasons. For those who stopped using after starting, most cited they were unsure how the pass
was saving them money and opted to stop using.
Social Media
3%
Some other way
8%
Word of Mouth13%
Media/Press14%
In-station Outreach
27%
Website 35%
How did you hear about SelectPass?

14
Less than $30K18%
$30K or more82%
Participation in the SelectPass pilot was diverse as shown in the demographic charts below. Nearly half
(48%) were non-white, 18 percent were low income, and 8 percent were Hispanic.
38%
9%
11%
11%
13%
18%
0% 5% 10% 15% 20% 25% 30% 35% 40%
Some other reason
Wasnt making enough trips to be worthwhile
Pilot doesnt include SmartBenefits
I was planning reduced travel during the month inquestion/vacation other absence from work
Too confusing managing the Select pass andadditional money
Stopped using because of SafeTrack
Minority48%
Non-Minority
52%
Hispanic8%
Non-Hispanic
92%

Finance Committee
Action Item III-B
December 1, 2016
FY2017 Reimbursable Bus Improvements:
G9 Rhode Island Avenue and 16Y Columbia Pike

Washington Metropolitan Area Transit Authority
Board Action/Information Summary
TITLE:
FY2017 Reimbursable Bus Service
PRESENTATION SUMMARY:
Staff will provide information on two bus services to be funded by jurisdictions, and then request authority to amend the FY2017 budget accordingly.
PURPOSE:
To obtain Board approval to add FY2017 reimbursable operating service specifically requested by two jurisdictions: the implementation of limited stop MetroExtra G9 bus service on Rhode Island Avenue and additional service on MetroExtra16Y Columbia Pike in Arlington.
DESCRIPTION:
Key Highlights:
The Council of the District of Columbia provided specific funds in its FY2017 budget to operate limited stop Metrobus service along Rhode Island Avenue, a rapidly growing corridor. Service would begin in March 2017, and operate as reimbursable service during its evaluation period. If successful, the G9 would be incorporated into the FY2019 operating budget as a regular regional route. Arlington County asked Metro to provide additional Columbia Pike service in December as FY2017 reimbursable service on Metrobus route 16Y. The extra service is not currently in the FY2018 proposed budget, but could be incorporated into regular regional service in FY2018.
Background and History:
Rhode Island Avenue Service
A Metro Priority Corridor Network (PCN) study of Rhode Island Avenue bus services was completed in April 2014. The study included a robust public outreach component and recommended establishing peak period bi-directional limited stop service between Mount Rainier and downtown DC.
The Rhode Island Avenue Main Street business group is a solid supporter of limited stop bus service.
The Council of the District of Columbia provided funding in its FY2017 budget to operate limited stop bus service along Rhode Island Avenue.
Action Information MEAD Number:
201809 Resolution:
Yes No

Columbia Pike Service
The 16Y MetroExtra limited stop service on Columbia Pike was established in 2002.
The route has grown increasingly popular, especially as a Metrorail alternative, and now experiences serious overcrowding.
Arlington County, as part of its 2016 Transit Development Plan (TDP), did extensive study and public outreach and recommended many improvements to bus service on Columbia Pike, including a reduction in crowding.
Discussion:
Rhode Island Avenue
The Rhode Island Avenue corridor has seen major growth and development, with many new multi-family residences and retail establishments recently joining the heavily traveled roadway that connects downtown with Eckington, Brentwood, and the Hyattsville and College Park areas of Maryland. Demand for bus transportation, especially along the DC portion of the roadway, has grown along with these changes, and the corridor can now support limited stop MetroExtra bus service.
The proposed G9 service would operate on weekdays from 6 – 9 AM and 3 – 7 PM. Buses would run in each direction every 15 minutes, connecting Franklin Square (13th and I Streets NW) and Eastern Avenue.
The projected annual operating cost of the service is $1.16 million. Estimated initial annual ridership is 276,000 trips, and the annual subsidy required for the service is approximately $0.83 million. The service will require seven buses.
If the G9 is approved, service would begin pilot operation as a reimbursable service in FY2017 and FY2018; the FY2017 cost estimate for the service is $277,000.
During FY2018, Metro staff would conduct a service evaluation to assess ridership, cost recovery, future demand and the demographics of riders (including a Title VI equity analysis, as required by FTA.)
If the route is successful, and with Board approval, the G9 would continue and be incorporated as a regular regional route in FY2019 and beyond. Columbia Pike In Arlington, similar extensive growth and development is underway along the Columbia Pike, and this corridor was a major focus of the recently completed Transit Development Plan (TDP).
Proposed for the 16Y, which connects McPherson Square and Barcroft along Columbia Pike, are three additional morning short trips and two additional afternoon full trips. The projected annual operating cost of the additional service is $265,000, with an annual subsidy of $220,000.
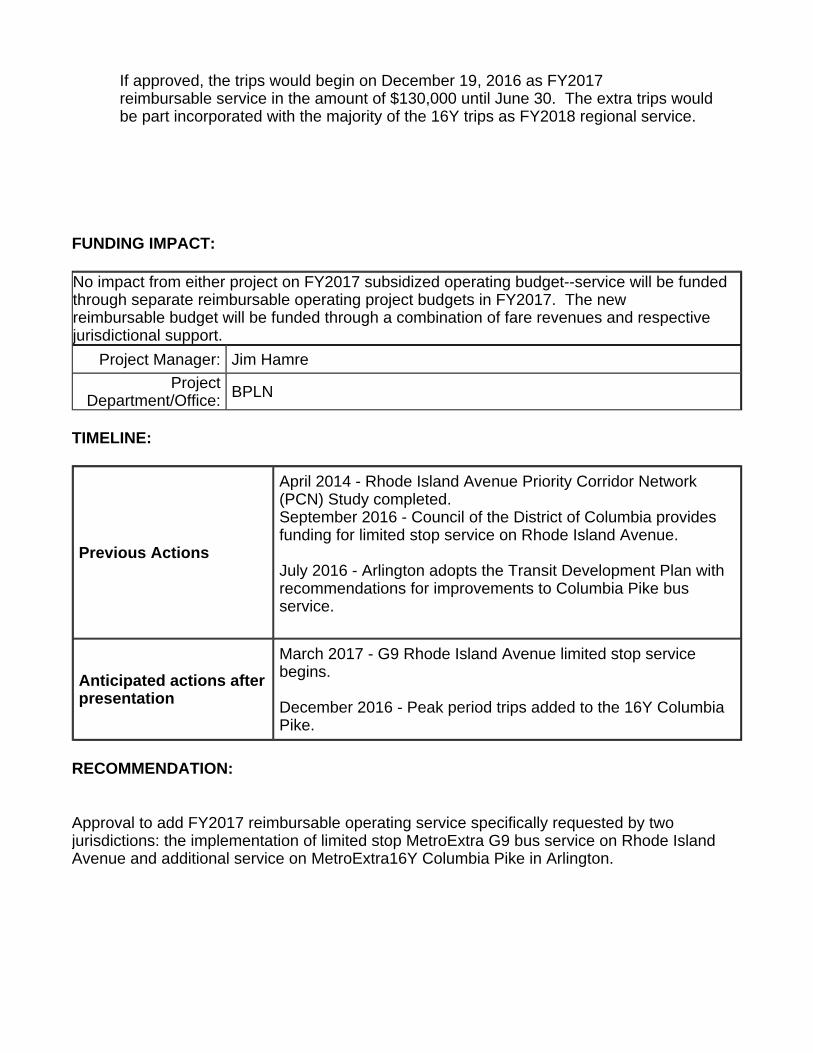
If approved, the trips would begin on December 19, 2016 as FY2017 reimbursable service in the amount of $130,000 until June 30. The extra trips would be part incorporated with the majority of the 16Y trips as FY2018 regional service.
FUNDING IMPACT:
TIMELINE:
RECOMMENDATION:
Approval to add FY2017 reimbursable operating service specifically requested by two jurisdictions: the implementation of limited stop MetroExtra G9 bus service on Rhode Island Avenue and additional service on MetroExtra16Y Columbia Pike in Arlington.
No impact from either project on FY2017 subsidized operating budget--service will be funded through separate reimbursable operating project budgets in FY2017. The new reimbursable budget will be funded through a combination of fare revenues and respective jurisdictional support.
Project Manager: Jim Hamre
Project Department/Office:
BPLN
Previous Actions
April 2014 - Rhode Island Avenue Priority Corridor Network (PCN) Study completed. September 2016 - Council of the District of Columbia provides funding for limited stop service on Rhode Island Avenue. July 2016 - Arlington adopts the Transit Development Plan with recommendations for improvements to Columbia Pike bus service.
Anticipated actions after presentation
March 2017 - G9 Rhode Island Avenue limited stop service begins. December 2016 - Peak period trips added to the 16Y Columbia Pike.

Washington Metropolitan Area Transit Authority
FY2017 Reimbursable Bus Service Improvements: G9 Rhode Island Avenue and 16Y Columbia Pike
Finance CommitteeDecember 1, 2016
Purpose
Seek approval to amend the FY2017 budget for two reimbursable bus services requested by jurisdictions
2

MetroExtra G9 Rhode Island Ave
• Metrobus Priority Corridor Network (PCN) study completed April 2014
• Residential/business growth along a heavily traveled commuter corridor can support limited-stop MetroExtra service
• In its FY2017 budget DC provided funding for service with start up before spring
3

MetroExtra G9 Rhode Island Ave
• Proposed service:– Every 15 minutes connecting Eastern Avenue with
Franklin Square – Weekdays 6 – 9 AM and 3 – 7 PM with seven buses
• Begin in March 2017 as reimbursable service at net cost of $225,760
• Staff to assess current and future ridership, cost recovery, and Title VI equity in FY2018 – if approved would be a regional route in FY2019 and beyond
• Annual operating subsidy of approx. $830,0004

MetroExtra 16Y Columbia Pike
• Rider demand for 16Y MetroExtra limited stop service on Columbia Pike in Arlington has grown– Route now experiences serious
overcrowding
• Arlington County 2016 Transit Development Plan (TDP) recommended many improvements to bus service on Columbia Pike
5

MetroExtra 16Y Columbia Pike
• Service requested by Arlington– Three additional morning short trips from Walter
Reed Drive to McPherson Square– Two additional afternoon full trips connecting
McPherson Square and Barcroft
• Begin in December 2016 as reimbursable service at net cost of $103,000
• Continuation of service would be subject to inclusion in Regional Service funding in the FY2018 Budget
6

Recommendation
Approval to amend the FY2017 budget for two reimbursable operating services requested by jurisdictions
7


Finance Committee
Action Item III-C
December 1, 2016
Request for FY2018 Budget Public Hearing

Washington Metropolitan Area Transit Authority
Board Action/Information Summary
TITLE:
Request for FY2018 Budget Public Hearing
PRESENTATION SUMMARY:
Staff will review public hearing requirements and seek Board authorization to conduct an FY2018 budget public hearing, including approval of hearing dockets outlining the proposed fare increases, service changes, and Capital Improvement Program (CIP).
PURPOSE:
The Board will be asked to authorize an FY2018 budget public hearing. The proposed fare increases, service changes, and capital investment program for FY2018 are included in hearing dockets that the Board will approve as part of the hearing authorization.
DESCRIPTION:
Key Highlights:
Following Board approval, Metro will hold a public hearing in late January or early February 2017 on the proposed fare increases and service changes in the FY2018 operating budget. The hearing will also provide the public an opportunity to review Metro's proposed CIP and use of Federal Transit Administration (FTA) grant funds.
In addition to the public hearing, staff will develop and implement an outreach program (as outlined in the Board-adopted Public Participation Plan) that will invite additional public input through written email or website submissions, a survey, social media, outreach to riders, and outreach to community groups, all of which shall become part of the public record of the hearing.
The Board will consider all findings from the hearing and the outreach prior to adopting the FY2018 operating budget and FY2018-2023 CIP.
Background and History:
In November 2016, the GM/CEO put forward a proposed FY2018 operating budget. In order to close a budget gap of nearly $300 million, the proposed budget includes Metro employee headcount reductions, fare increases, service reductions on bus and rail, limited use of FTA grant funds for eligible preventive maintenance activities, and increased jurisdictional contributions. Section 62 of the WMATA Compact requires that any proposed increase in fares or major service change requires a public hearing.
Action Information MEAD Number:
201827 Resolution:
Yes No

In December 2016 (contemporaneously with this request), the GM/CEO is also proposing the FY2018-2023 CIP. Metro's capital program receives significant support from FTA grants, and FTA requires that its grant recipients annually provide the public with an opportunity to review and comment on the proposed capital program and the use of the federal grants.
Discussion:
The proposed fare increases, service changes, and capital program for FY2018 are described in detail in the dockets attached to the Board resolution. For the fare increases and service changes, these proposals represent the maximum changes that the Board may adopt as part of the FY2018 budget. The Board may choose to make lesser changes (or no changes at all), but greater changes cannot be made without returning to the public for another opportunity to provide comment.
FUNDING IMPACT:
TIMELINE:
RECOMMENDATION:
Recommend Board authorization to hold FY2018 budget public hearing, including approval of hearing dockets, and authorization to initiate public participation plan activities.
Information item only - no immediate funding impact.
Project Manager: Thomas J. Webster
Project Department/Office:
CFO/OMBS
Previous Actions
November 2016 - GM/CEO Proposal of FY2018 Operating Budget December 2016 - GM/CEO Proposal of FY2018 Capital Budget and FY2018-2023 Capital Improvement Program
Anticipated actions after presentation
January 14 - February 6, 2017: Public outreach and public comment period Week of January 30 (tentative): Public hearing February 6: Public comment period closes March 2017: Adoption of FY2018 Budget

FY2017 Budget:Ridership and Revenue
Finance & Administration CommitteeOctober 8, 2015
Washington Metropolitan Area Transit Authority
Request for FY2018 Budget Public Hearing
Finance CommitteeDecember 1, 2016

Purpose
Seek Board authorization to hold FY2018 budget public hearing, including approval of hearing dockets describing proposed fare increases, service changes, and capital improvement program
2

Introduction
GM/CEO’s proposed FY2018 operating budget includes employee headcount reductions, fare increases, service cuts, and increased jurisdictional contributions WMATA Compact requires public hearing on any fare
increase or major service change
GM/CEO also proposing FY2018-2023 CIP this month – includes significant FTA grant funding FTA requires public hearing on proposed Program of
Projects and use of grant funds
3

Proposed Fare Increases
Fares unchanged since July 2014Raise fares to generate $21 million net revenue: All base fares increase to at least
$2.00 Bus fare and minimum off-peak
rail fare increase by $0.25 All peak rail fares increase $0.10
(base $2.25, max $6.00) and daily parking by $0.10
Access fare remain at 2x fastest fixed-route (capped at $6.50)
Total ridership loss of ~10 million trips4
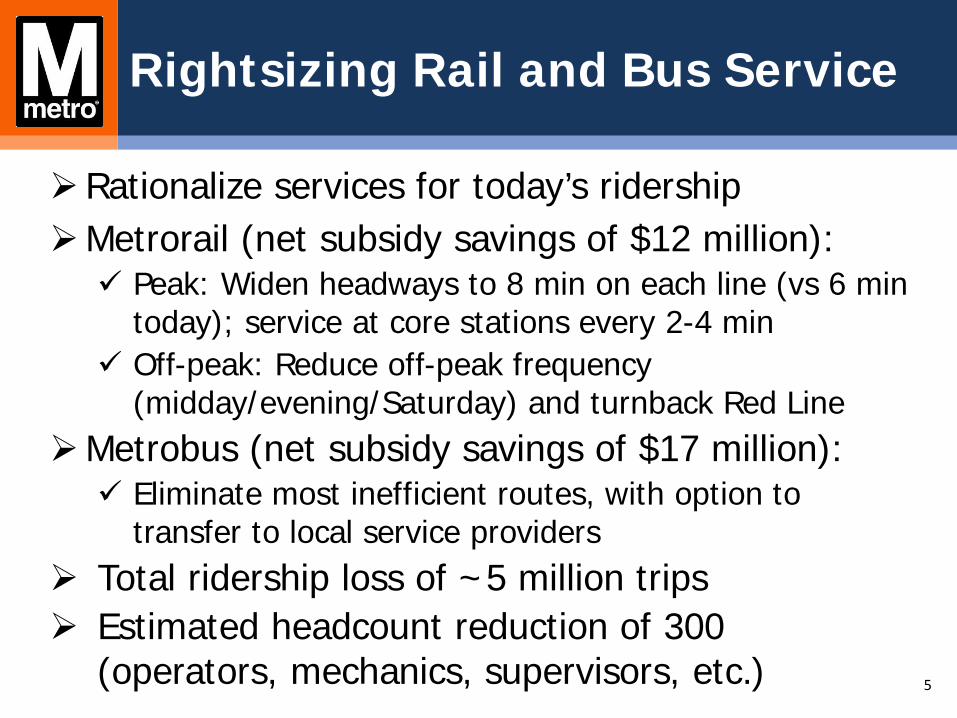
Rightsizing Rail and Bus Service
Rationalize services for today’s ridership Metrorail (net subsidy savings of $12 million): Peak: Widen headways to 8 min on each line (vs 6 min
today); service at core stations every 2-4 min Off-peak: Reduce off-peak frequency
(midday/evening/Saturday) and turnback Red LineMetrobus (net subsidy savings of $17 million): Eliminate most inefficient routes, with option to
transfer to local service providers Total ridership loss of ~5 million trips Estimated headcount reduction of 300
(operators, mechanics, supervisors, etc.) 5

Proposed Rail Service Changes
Line RushHour Midday Early
Evening Saturday Sunday
8 min 15 min 15 min 15 min 15 min
8 min 15 min 15 min 15 min 15 min
8 min 15 min 15 min 15 min 15 min
8 min 15 min 15 min 15 min 15 min
8 min 15 min 15 min 15 min 15 min
8 min 15 min 15 min 15 min 15 min
Line Peak Off-Peak
4 min 7-8 min
2-3min 5 min
More Frequent ServiceAt Core Stations
6

Proposed Bus Service Reductions
Line Name Route(s)Regional/
Non-Regional State
Weekday Daily
RidersCost
RecoverySubsidy/
RiderRiders per Rev Trip
Riders per Rev Mile Riders Subsidy
Pimmit Hills-Falls Church 3T Regional VA 616 8.2% $13.04 8.9 1.0 166,018 $2,165,018Arlington-Union Station 13Y Regional VA 0 8.4% $12.72 8.4 1.1 6,726 $85,582Indian Head Express W19 Non-Regional MD 311 20.5% $12.34 11.4 0.5 78,933 $974,110Kings Park 17A,B,F,M Non-Regional VA 417 20.6% $12.27 9.0 0.5 105,423 $1,293,904Greenbelt-BWI Airport Express B30 Non-Regional MD 370 40.3% $9.14 7.6 0.3 132,250 $1,209,160Tysons Corner-Dunn Loring 2T Regional VA 505 11.8% $8.78 9.9 1.2 161,831 $1,421,585I-270 Express J7,9 Non-Regional MD 326 26.8% $8.73 9.9 0.6 82,080 $716,616Burke Centre 18P,R,S Non-Regional VA 676 27.1% $8.58 11.2 0.9 170,709 $1,464,804Wisconsin Avenue Limited 37 Regional DC 599 13.7% $7.37 27.2 4.1 150,900 $1,112,008Bock Road W13,14 Regional MD 658 32.0% $6.77 19.2 1.3 167,541 $1,133,613Oxon Hill-Fort Washington P17,18,19 Regional MD 1,167 32.3% $6.68 21.3 1.3 296,228 $1,977,655Fair Oaks-Fairfax Blvd 1C Regional VA 973 15.1% $6.57 18.5 1.3 320,729 $2,107,075Chain Bridge Road 15K,L Regional VA 486 15.2% $6.51 16.8 1.3 122,580 $798,091Fair Oaks-Jermantown Rd 2B Regional VA 916 15.3% $6.48 18.0 1.3 257,612 $1,668,943
Bus Line Descr ipt ions Performance Cr iter ia Ranking A nnual Data
7

Proposed FY2018 Capital Program
Program TotalRailcar Acquisition $344Railcar Maintenance/Overhaul $139Railcar Maintenance Facilities $40Railcar Investments $523Propulsion $33Signals & Communications $84Rail Systems Investments $117Fixed Rail $100Structures $13Track Maintenance Equipment <$1Track and Structures Rehabilitation Investments $113Platforms & Structures $88Vertical Transportation $61Fare Collection $20Station Systems $30Parking Facilities $8Stations and Passenger Facilities Investments $207Bus Acquisition $63Bus Maintenance/Overhaul $67Bus Maintenance Facilities $70Bus Passenger Facilities/Systems $8Paratransit $17Bus and Paratransit Investments $225IT $48MTPD $1Support Equipment/Services $16Business Support Investments $65Total Capital Program $1,250
8
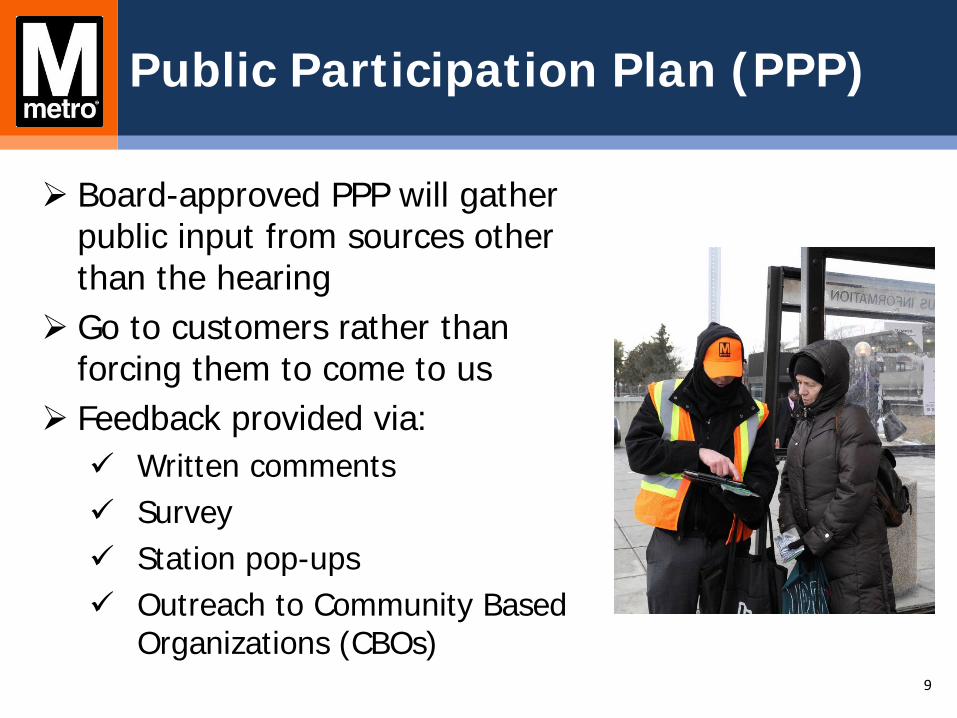
Public Participation Plan (PPP)
Board-approved PPP will gather public input from sources other than the hearing
Go to customers rather than forcing them to come to us
Feedback provided via: Written comments Survey Station pop-ups Outreach to Community Based
Organizations (CBOs)9

Recommendation
Recommend Board authorization to hold FY2018 budget public hearing, including approval of hearing dockets, and authorization to initiate public participation plan activities
10

Next Steps
Jan 14-Feb 6: Public outreach and public comment period begin
Week of Jan 30 (tentative): Public hearingFeb 6: Public comment period closesMarch: Adoption of FY2018 Budget
Budget approval in March is needed to fully implement any fare or service changes by July 1
11

SUBJECT: PUBLIC HEARING ON PROPOSED FY2018 FARE AND SERVICE CHANGES AND PROPOSED FY2018 CAPITAL PROGRAM
RESOLUTION OF THE
BOARD OF DIRECTORS OF THE
WASHINGTON METROPOLITAN AREA TRANSIT AUTHORITY WHEREAS, The Washington Metropolitan Area Transit Authority (WMATA) provides Metrobus, Metrorail, and MetroAccess services to the residents of the region; and WHEREAS, The operating cost of Metrobus, Metrorail, and MetroAccess services is funded in part by passenger fares, parking fees, and other operating revenues, and in part by subsidies provided by the District of Columbia, the State of Maryland, and local jurisdictions in Virginia; and WHEREAS, The General Manager/Chief Executive Officer’s (GM/CEO) proposed Fiscal Year (FY) 2018 operating budget forecasts a substantial increase in local jurisdictional subsidy compared to FY2017 as a result of declining ridership and fare revenue as well as cost growth in certain areas, including expected costs for planned Customer Accountability Report (CARe) Plan activities; and WHEREAS, The Board of Directors is considering a range of options for reducing the required local jurisdictional subsidy in the FY2018 operating budget, including management actions to reduce headcount; use of Federal Transit Administration (FTA) grant funds to support eligible preventive maintenance activities; fare increases; and major service changes; and WHEREAS, Any increase in fares or major change in service requires a public hearing pursuant to Section 62 of the WMATA Compact; and WHEREAS, The GM/CEO has also proposed the FY2018-2023 Capital Improvement Program (CIP) for the Board’s review and consideration; and WHEREAS, The proposed $1.3 billion capital program for FY2018 funds critical safety investments for customers and employees as well as necessary state of good repair investments to ensure the reliable and effective performance of the Metro transit system; and WHEREAS, The proposed FY2018-2023 CIP includes substantial federal funding from FTA annual formula grant programs, including funding received through the Urbanized Area Formula Program (49 U.S.C. 5307 or “Section 5307”); and
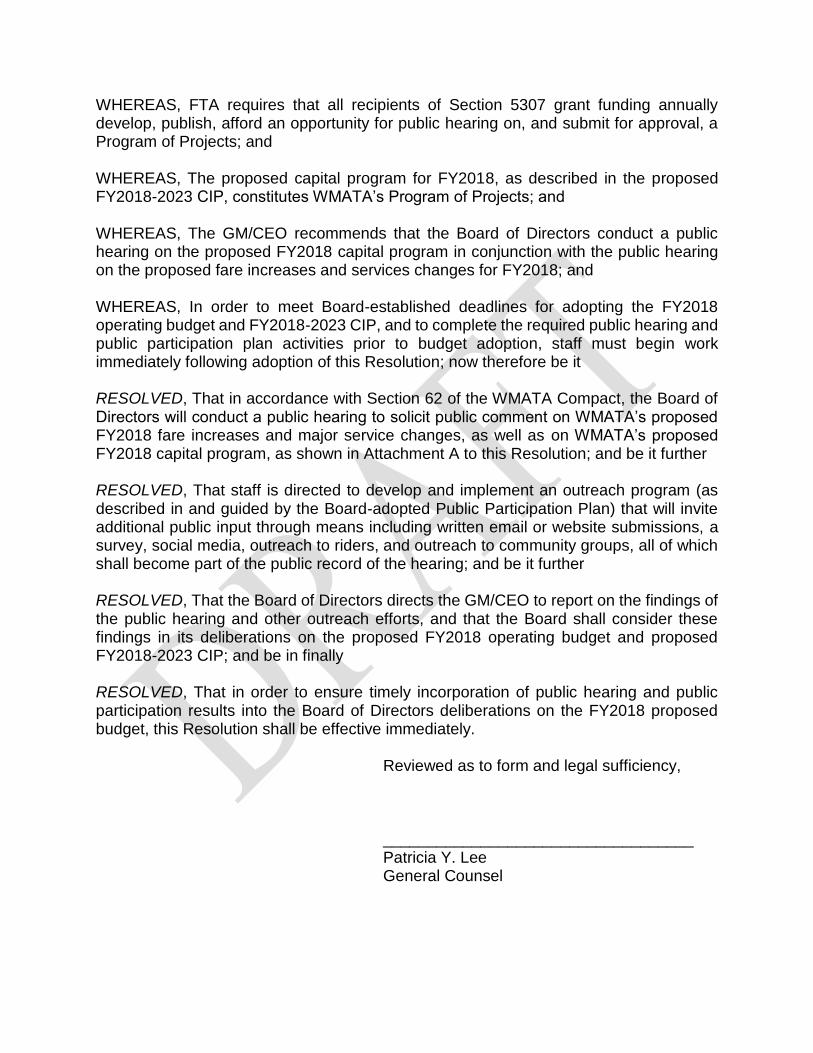
WHEREAS, FTA requires that all recipients of Section 5307 grant funding annually develop, publish, afford an opportunity for public hearing on, and submit for approval, a Program of Projects; and WHEREAS, The proposed capital program for FY2018, as described in the proposed FY2018-2023 CIP, constitutes WMATA’s Program of Projects; and WHEREAS, The GM/CEO recommends that the Board of Directors conduct a public hearing on the proposed FY2018 capital program in conjunction with the public hearing on the proposed fare increases and services changes for FY2018; and WHEREAS, In order to meet Board-established deadlines for adopting the FY2018 operating budget and FY2018-2023 CIP, and to complete the required public hearing and public participation plan activities prior to budget adoption, staff must begin work immediately following adoption of this Resolution; now therefore be it RESOLVED, That in accordance with Section 62 of the WMATA Compact, the Board of Directors will conduct a public hearing to solicit public comment on WMATA’s proposed FY2018 fare increases and major service changes, as well as on WMATA’s proposed FY2018 capital program, as shown in Attachment A to this Resolution; and be it further RESOLVED, That staff is directed to develop and implement an outreach program (as described in and guided by the Board-adopted Public Participation Plan) that will invite additional public input through means including written email or website submissions, a survey, social media, outreach to riders, and outreach to community groups, all of which shall become part of the public record of the hearing; and be it further RESOLVED, That the Board of Directors directs the GM/CEO to report on the findings of the public hearing and other outreach efforts, and that the Board shall consider these findings in its deliberations on the proposed FY2018 operating budget and proposed FY2018-2023 CIP; and be in finally RESOLVED, That in order to ensure timely incorporation of public hearing and public participation results into the Board of Directors deliberations on the FY2018 proposed budget, this Resolution shall be effective immediately. Reviewed as to form and legal sufficiency, ___________________________________ Patricia Y. Lee General Counsel
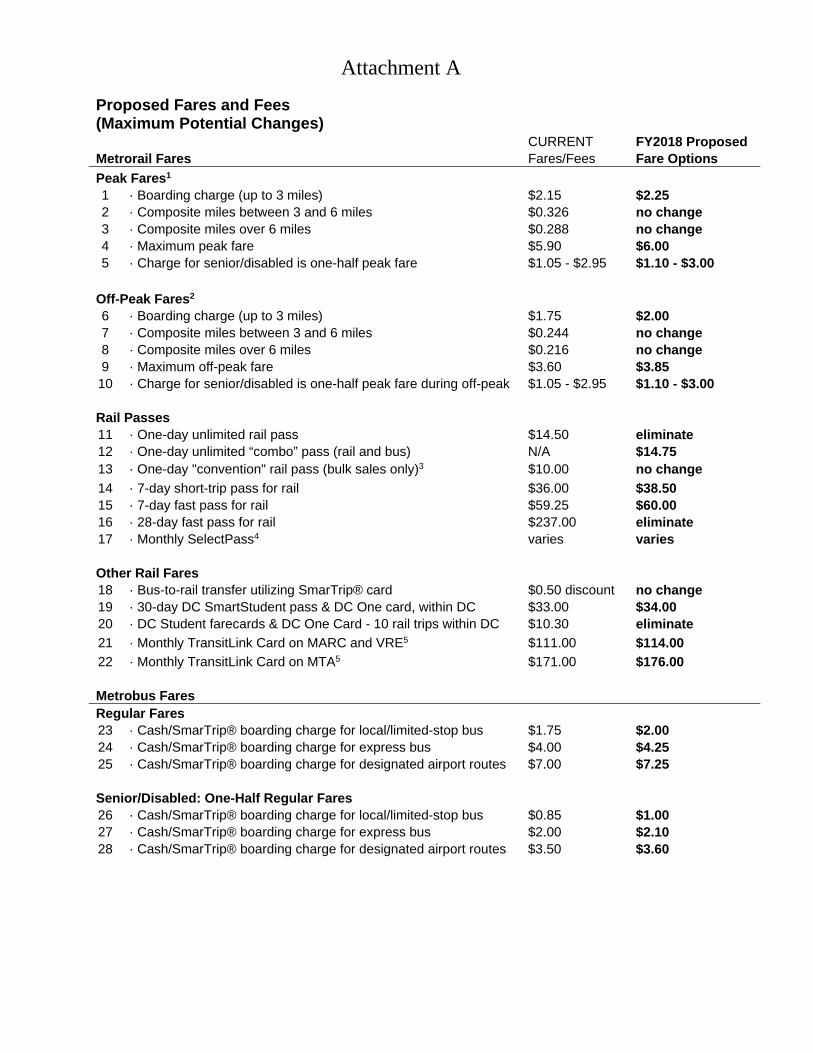
Attachment A
Proposed Fares and Fees (Maximum Potential Changes)
CURRENT FY2018 Proposed Metrorail Fares Fares/Fees Fare Options
Peak Fares1 1 · Boarding charge (up to 3 miles) $2.15 $2.25 2 · Composite miles between 3 and 6 miles $0.326 no change 3 · Composite miles over 6 miles $0.288 no change 4 · Maximum peak fare $5.90 $6.00 5 · Charge for senior/disabled is one-half peak fare $1.05 - $2.95 $1.10 - $3.00
Off-Peak Fares2 6 · Boarding charge (up to 3 miles) $1.75 $2.00 7 · Composite miles between 3 and 6 miles $0.244 no change 8 · Composite miles over 6 miles $0.216 no change 9 · Maximum off-peak fare $3.60 $3.85 10 · Charge for senior/disabled is one-half peak fare during off-peak $1.05 - $2.95 $1.10 - $3.00
Rail Passes 11 · One-day unlimited rail pass $14.50 eliminate 12 · One-day unlimited “combo” pass (rail and bus) N/A $14.75 13 · One-day "convention" rail pass (bulk sales only)3 $10.00 no change
14 · 7-day short-trip pass for rail $36.00 $38.50 15 · 7-day fast pass for rail $59.25 $60.00 16 · 28-day fast pass for rail $237.00 eliminate 17 · Monthly SelectPass4 varies varies
Other Rail Fares 18 · Bus-to-rail transfer utilizing SmarTrip® card $0.50 discount no change 19 · 30-day DC SmartStudent pass & DC One card, within DC $33.00 $34.00 20 · DC Student farecards & DC One Card - 10 rail trips within DC $10.30 eliminate
21 · Monthly TransitLink Card on MARC and VRE5 $111.00 $114.00
22 · Monthly TransitLink Card on MTA5 $171.00 $176.00
Metrobus Fares Regular Fares 23 · Cash/SmarTrip® boarding charge for local/limited-stop bus $1.75 $2.00 24 · Cash/SmarTrip® boarding charge for express bus $4.00 $4.25 25 · Cash/SmarTrip® boarding charge for designated airport routes $7.00 $7.25
Senior/Disabled: One-Half Regular Fares 26 · Cash/SmarTrip® boarding charge for local/limited-stop bus $0.85 $1.00 27 · Cash/SmarTrip® boarding charge for express bus $2.00 $2.10 28 · Cash/SmarTrip® boarding charge for designated airport routes $3.50 $3.60

Attachment A
Metrobus Fares (cont.) CURRENT Fares/Fees
FY2018 Proposed Fare Options
Bus Transfers 29 · Bus-to-bus transfers utilizing SmarTrip® card varies varies 30 · Rail-to-bus transfer utilizing SmarTrip® card $0.50 discount no change 31 · Transfer from MARC, VRE, & MTA with weekly/monthly pass $0.00 no change 32 · Transfer from regional bus partners varies varies
Bus Passes 33 · 7-Day Regional Bus Pass $17.50 $20.00 34 · 7-Day Regional Senior/Disabled Pass $8.75 $10.00
Other Fare Media 35 · Package of 10 tokens, available to organizations $17.50 $20.00 36 · DC student tokens - 10 trips per pack $8.75 $10.00 37 · DC student pass on DC One Card - 10 trips $8.75 eliminate
MetroAccess Fares6 38 · MetroAccess fare (within ADA 3/4 mile service corridor) varies varies 39 · Maximum fare $6.50 no change
Parking Fees7 40 · District of Columbia $4.60 $4.70 41 · Montgomery County $4.35 - $5.10 $4.45 - $5.20 42 · Prince George's County $4.60 - $5.10 $4.70 - $5.20 43 · Virginia $4.85 $4.95 44 · Monthly reserved parking fee $45.00 - $65.00 no change 45 · Parking meters $1.00/60 minutes $1.00 no change 46 · Prince George's parking garage at New Carrollton (monthly) $85.00 no change 47 · Non-Metro rider parking fees $8.60 - $15.00 no change
Other Fees 48 · Bicycle locker rental $120.00 (annual) no change 49 · Surcharge on Entry/Exit for station improvements, two
stations per Compact jurisdiction8 $0.05 no change
1 Peak fares are in effect from opening through 9:30 a.m. and from 3:00 p.m. to 7:00 p.m. weekdays, except on national holidays. Peak fares are in effect from midnight until closing Friday and Saturday nights. 2 Off-peak fares are in effect during all other hours on weekdays, Saturday and Sunday, and all national holidays. 3 Discounted unlimited one-day pass for convention attendees, available through WMATA bulk sales only. 4 The monthly SelectPass is available at multiple price points and priced at 36 times the corresponding fare. The pass holder may take an unlimited number of trips at that fare or lower; the difference in fare must be paid for any trip with a higher fare. The purchaser may choose to add an unlimited Metrobus pass at a discounted price of $45 per month. 5 Metro's portion of the TransitLink Cards on MARC, VRE, and MTA. 6 MetroAccess fare is twice the equivalent fixed route SmarTrip® fare based on fastest trip. 7 Parking fees consist of Metro's base fee plus jurisdiction surcharge. Monthly fee for Prince George's parking at New Carrollton is $70 base fee plus $15 surcharge. 8 Rail stations with surcharge are designated per jurisdiction discretion pending Board approval.
Attachment A
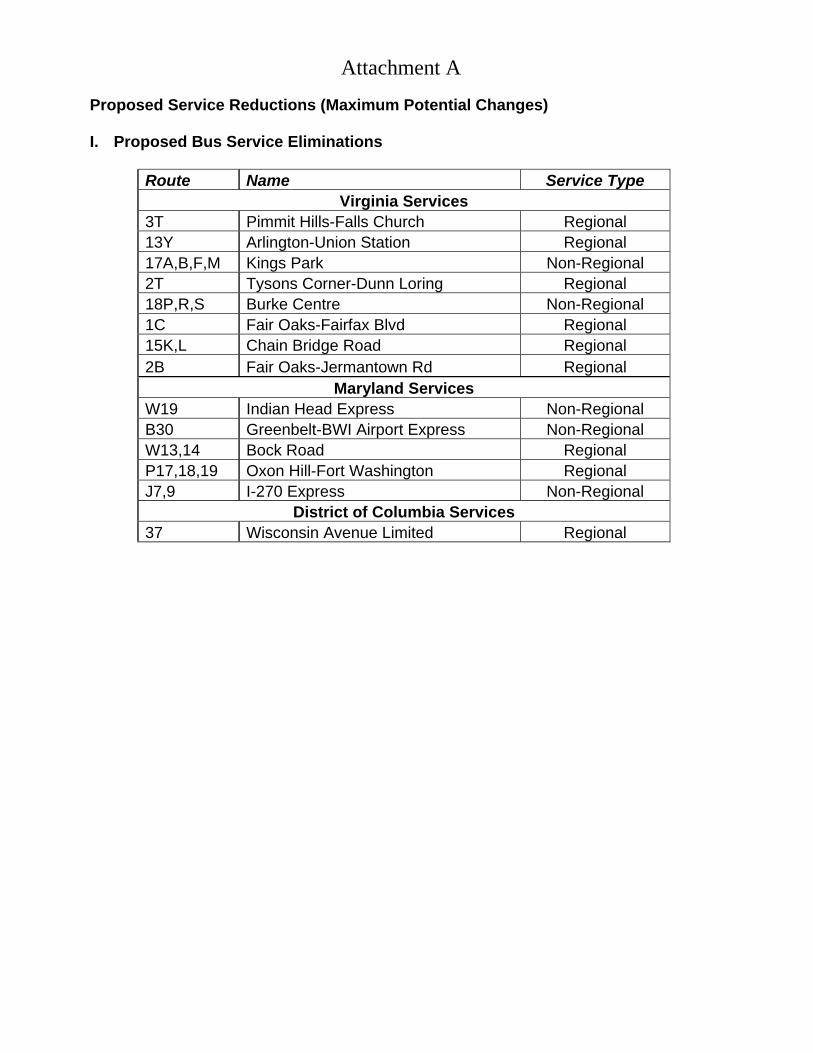
Proposed Service Reductions (Maximum Potential Changes) I. Proposed Bus Service Eliminations
Route Name Service Type Virginia Services
3T Pimmit Hills-Falls Church Regional
13Y Arlington-Union Station Regional
17A,B,F,M Kings Park Non-Regional
2T Tysons Corner-Dunn Loring Regional
18P,R,S Burke Centre Non-Regional
1C Fair Oaks-Fairfax Blvd Regional
15K,L Chain Bridge Road Regional
2B Fair Oaks-Jermantown Rd Regional
Maryland Services W19 Indian Head Express Non-Regional
B30 Greenbelt-BWI Airport Express Non-Regional
W13,14 Bock Road Regional
P17,18,19 Oxon Hill-Fort Washington Regional
J7,9 I-270 Express Non-Regional
District of Columbia Services 37 Wisconsin Avenue Limited Regional

Attachment A
II. Proposed Rail Service Changes
1 Widen WEEKDAY peak period headways
- Widen Orange/Green/Yellow/Silver Line weekday peak headways from 6 minutes to 8 minutes. Add Trippers on Orange/Green when necessary. Increase percentage of 8-car consists when possible.
- Reduce Blue Line headway from 12 minutes to 8 minutes and eliminate Rush Plus Yellow Line service
- Widen Red Line weekday peak headways from 6 to 8 minutes north of Silver Spring and Grosvenor. Widen Red Line weekday peak headways from 3 to 4 minutes at all other stations.
2 Widen WEEKDAY off-peak headway:
- Widen weekday midday headway from 12 to 15 minutes
- Widen weekday evening headway from 12 to 15 minutes between 6:30-9:30pm
3 Widen WEEKEND headway:
- Widen Saturday headways from 12 to 15 minutes during the day (10:00 am to 6:00pm)
4 Reduce off peak/weekend service on the Red Line north of Grosvenor (Reinstate Red Line off-peak/weekend turnback at Grosvenor)
- Weekday off-peak/evening turnbacks
- Saturday and Sunday turnbacks

Attachment A
Proposed FY2018 Capital Improvement Program and Federal FY2017 Grant Applications WMATA intends to apply for Federal Fiscal Year 2017 grants under the Fixing America’s Surface Transportation (FAST) Act and the Passenger Rail Investment and Improvement Act of 2008 (PRIIA) to support ongoing capital investments. These applications will be filed under the provisions of FAST (P.L. 114-94) and PRIIA (P.L. 110-432). Based on preliminary information provided by the Federal Transit Administration (FTA), the Washington DC Metropolitan Region expects to receive approximately $360 million in FTA formula funding under the FAST Act in Federal FY2017. This regional funding is distributed between WMATA, the Potomac and Rappahannock Transportation Commission (PRTC), and the Maryland Transit Administration (MTA) subject to a pre-existing agreement. Under this agreement, in Federal FY2016, WMATA received approximately 86 percent of the total FTA formula funding for the region. If WMATA’s funding share remains consistent with the prior year, WMATA will receive approximately $310 million in federal funding, which includes a small amount of discretionary funding (e.g., resiliency grants). Additionally, WMATA estimates $148.5 million will be available to the agency through the PRIIA program in Federal FY2017. This funding partnership between the federal government and the District of Columbia, Maryland, and Virginia, which has been in effect since 2009 and is authorized for ten years, provides critical resources to WMATA for safety improvements, railcar purchases, and other important state of good repair investments. In accordance with Board policy, WMATA intends to apply for these grant funds within four weeks of the Board’s adoption of the capital budget, which is currently scheduled for March 2017. WMATA also intends to submit the final Program of Projects to the National Capital Region Transportation Planning Board (TPB) as input to the updated Transportation Improvement Program (TIP) for the Washington Metropolitan area. WMATA FY2018 CAPITAL IMPROVEMENT PROGRAM The Washington Metropolitan Area Transit Authority’s proposed FY2018 Capital Improvement Program (CIP) is a $1.25 billion capital investment plan focused on safety improvements, the rebuilding of the Metro system, and improving the effectiveness of the current rail and bus network. The vast majority of the planned investment advances the safety, rehabilitation, and replacement of Metro’s infrastructure, facilities, equipment, systems, railcars, buses, and paratransit vehicles.

Attachment A
The proposed FY2018 program will be funded through investments from the federal government, state and local governments, and other sources. The proposed program assumes federal sources make up $461 million of the $1.4 billion funding plan (which includes repayment of $150 million of short-term debt projected to be incurred in FY2017). The remaining portion of the program is funded with $806 million of state and local investment (including match to federal funds, direct local contributions, and long-term debt), $106 million from the Metropolitan Washington Airports Authority (MWAA), $14 million for jurisdictional projects, and $6 million of other sources. The Capital Improvement Program consists of the following six major investment categories:
Railcars, which includes acquisition of new vehicles, maintenance and overhaul activities on existing vehicles to ensure safe and reliable operation, and construction and rehabilitation on railcar maintenance facilities;
Rail Systems, which includes investment in propulsion (including tie-breaker stations, traction power substations, power cables, and transformers) and signals and communications systems (including radio systems and underground wireless infrastructure);
Track & Structures, which includes fixed rail (e.g., running rail, switches, fasteners, crossties, etc.), structures (e.g., tunnels and bridges), and track maintenance equipment;
Stations & Passenger Facilities, which includes platforms and other structures, vertical transportation (elevators and escalators), fare collection systems, station systems, and parking facilities;
Bus & Paratransit, which includes bus acquisition, bus overhaul and maintenance activities to ensure safe and reliable operation, bus maintenance facilities, bus passenger facilities, and replacement of paratransit vehicles; and
Business Support, which includes information technology (IT), Metro Transit Police (MTPD) investments, and other support and equipment services.
Attachment A
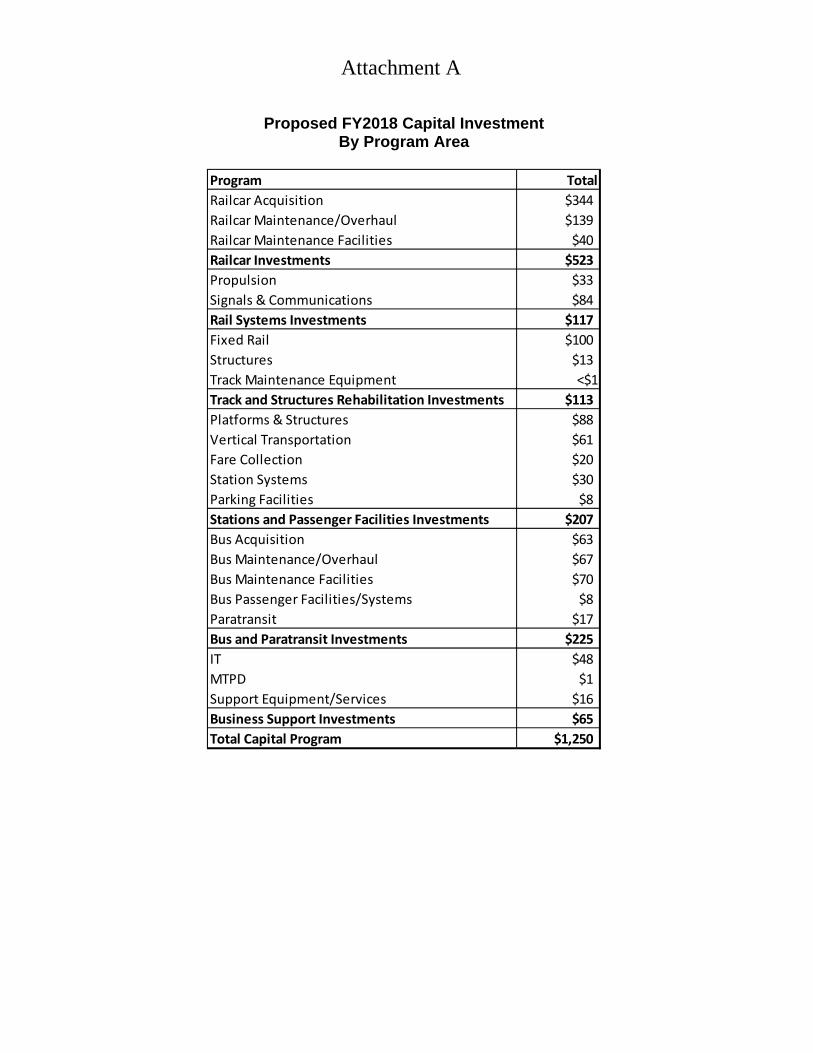
Proposed FY2018 Capital Investment
By Program Area
Program Total
Railcar Acquisition $344Railcar Maintenance/Overhaul $139Railcar Maintenance Facilities $40Railcar Investments $523
Propulsion $33Signals & Communications $84Rail Systems Investments $117
Fixed Rail $100Structures $13Track Maintenance Equipment <$1Track and Structures Rehabilitation Investments $113
Platforms & Structures $88Vertical Transportation $61Fare Collection $20Station Systems $30Parking Facilities $8Stations and Passenger Facilities Investments $207
Bus Acquisition $63Bus Maintenance/Overhaul $67Bus Maintenance Facilities $70Bus Passenger Facilities/Systems $8Paratransit $17Bus and Paratransit Investments $225
IT $48MTPD $1Support Equipment/Services $16Business Support Investments $65
Total Capital Program $1,250

Attachment A
FY2018 Proposed Capital Funding Sources
SourceAmount
(millions)
Federal Grants $461 State & Local Investment and Debt District of Columbia $281 Maryland $278 Virginia $242 Metropolitan Washington Airports Authority (MWAA) $118 Jurisdictional Projects $14 Other $6 TOTAL $1,400
Note: FY2018 funding plan includes $150 million to repay Board-approved short-term debt projected to be used in FY2017

Finance Committee
Information Item IV-A
December 1, 2016
GM/CEO Proposed FY2018 Capital Budget and FY2018-2023 Capital Improvement
Program (CIP)

Washington Metropolitan Area Transit Authority
Board Action/Information Summary
TITLE:
Proposed FY2018-2023 Capital Improvement Program
PRESENTATION SUMMARY:
Staff will provide information to the Board on the General Manager/Chief Executive Officer's (GM/CEO) proposed $1.25 billion FY2018 capital budget and proposed $7.2 billion FY2018-2023Capital Improvement Program (CIP).
PURPOSE:
To present the Board with the GM/CEO’s proposed $1.25 billion FY2018 capital budget and proposed $7.2 billion FY2018-2023 Capital Improvement Program (CIP) ahead of the planned budget adoption in March 2017.
DESCRIPTION:
Key Highlights:
The proposed $1.25 billion FY2018 capital budget and $7.2 billion FY2018-2023 six-year CIP focus Metro's capital investment on the safety, state of good repair, and reliability of Metrorail, Metrobus, and MetroAccess assets.CIP investment priorities include the acquisition of new 7000 railcars, construction of infrastructure to support radio and wireless communications, replacement of old buses and paratransit vehicles, rehabilitation and maintenance of existing railcars and buses to improve and sustain safety and reliability, continued investment in rail and bus system infrastructure to improve safety and address state of good repair backlogs, and reinvestment in rail stations.The proposed budget also includes the establishment of a Development and Evaluation (D&E) program for major capital needs, including: Red Line Water Remediation; 2000/3000 Series Railcar Replacement; Red Line Core Capacity; Tunnel Ventilation; Bladensburg/Northern Bus Garage Rebuild or Replacement; and Metro Office Facilities.Metro’s rate of capital program investment continues to improve. Over $1 billion wasinvested through the FY2016 CIP, and management forecasts that between $1.1 and $1.2 billion will be invested in FY2017.The FY2018-2023 CIP Financial Plan assumes continued federal grant funding at current levels ($2.8 billion over the six-year period) and $4.2 billion of jurisdictional investment and long-term financing.
Background and History:
Through the Capital Improvement Program (CIP), Metro advances major capital projects and capital reinvestment programs to improve the safety, state of good repair and reliability of
Action Information MEAD Number:201826
Resolution:Yes No

Metrorail, Metrobus, and MetroAccess assets. In April 2016, the Board of Directors adopted a $950 million FY2017 capital budget and a $6 billion FY2017-2022 six-year CIP.
FY2017 Capital Investment ForecastBased on the investment progress through the first quarter, total capital program expenditures for FY2017 are now forecast to be between $1.1 and $1.2 billion. In order to ensure uninterrupted delivery and acceptance of new 7000 series railcars and continuation of the SafeTrack program, the Board recently approved an additional $150 million in FY2017 budget authority across two program areas: $90 million for Railcar Acquisition and $60 million for Fixed Rail (which includes the SafeTrack program). This additional investment will be financed in FY2017 with Metro's existing lines of credit (LOC) or other short-term debt instruments. This short-term financing will be repaid during FY2018 either by a long termdebt issuance or by additional jurisdictional contributions.
Capital Improvement Program StructureMetro’s CIP is grouped into six major investment categories: Railcars, Rail Systems, Track &Structures, Stations & Passenger Facilities, Bus & Paratransit, and Business Support. These investment categories are further subdivided into a total of 22 program areas. The FY2018 and six-year investments by category are described below, and the investment by program area is detailed in the presentation.
Within these CIP categories and programs are three types of capital investments:
Major Capital Projects: These are large, multi-year construction and acquisition projects, such as the construction of a new maintenance facility or the acquisition of railcars. Several major capital projects are currently underway, including the 7000 series railcar acquisition, construction of the Cinder Bed Road and Andrews Federal Center Bus Maintenance facilities, the Radio and Wireless Infrastructure project, and the construction of Silver Line Phase 2 to Dulles Airport and Loudoun County, which is funded and managed by the Metropolitan Washington Airports Authority (MWAA).
Development and Evaluation (D&E) of Major Capital Projects: Before major capital projects are funded for the construction or acquisition phase, it is critical that sufficient planning, development, and evaluation occur to ensure that capital investments are efficient and effective and that project risks are mitigated. This process helps to ensure that projects have clearly defined scopes, schedules, and cost estimates and that appropriate consideration has been given to risks and alternative solutions.
The GM/CEO proposes to establish a formalized D&E Program as part of the FY2018-2023 CIP to advance identified major capital needs to deliverable capital projects. Proposed needs to be developed and evaluated include:
Red Line Water Remediation2000/3000 Series Railcar ReplacementRed Line Core CapacityTunnel VentilationBladensburg/Northern Bus Garage Rebuild or ReplacementMetro Office Facilities
Additional capital investment needs can be added to the D&E program in the future as the program matures, subject to the availability of funding and regional and system capacity to advance major capital projects.

Safety and State of Good Repair Programs and Minor Projects: A significant amount of Metro’s capital investment advances the maintenance, rehabilitation, and replacement of elements and components of Metro’s existing infrastructure and vehicle assets andcomponents. These safety and state of good repair reinvestments are advanced through annual, recurring programs. The programs are informed by safety and compliance recommendations and requirements, and they typically rely on the age or the condition of the specific assets to determine work plan prioritization. Examples include, but are not limited to: railcar component maintenance and rehabilitation; bus and paratransit vehicle repair, rehabilitation, and replacement; rail, crosstie, and track fastener replacement; track circuit replacement; power cable replacement; and elevator and escalator repair, rehabilitation, and replacement.
Jurisdictional ProjectsBeginning in FY2018, management proposes to begin including capital reimbursable projects within the CIP, rather than as a separate program. Capital reimbursable projects are sponsored by jurisdictions and other entities in the region. Incorporating these projects into the CIP will improve awareness and oversight but will have no impact on regional fundingrequirements, as the projects are fully funded by the sponsoring entity. Current active jurisdictional projects include the Silver Line extension and the associated expansion railcars (MWAA), Potomac Yard station (Alexandria), King Street Bus Loop (Alexandria), support for the Purple Line (Maryland), and the jurisdictional project development program.
Capital Needs InventoryMetro recently completed a Capital Needs Inventory (CNI) update that estimates Metro’s unconstrained capital needs to be approximately $25 billion over the next ten years. While the proposed FY2018 capital budget is primarily comprised of projects that are already underway, this first phase of the CNI informed the formulation of the proposed six-year plan with respect to both state of good repair priorities and the identification and prioritization of major needs that are proposed for the Development and Engineering program. Information on the CNI process and results will be provided separately to the Board through the Capital Program, Planning, and Real Estate Committee.
Capital Funding AgreementThe current Capital Funding Agreement (CFA) among Metro and the funding jurisdictions expires on June 30, 2017. The CFA provides the framework for jurisdictional investment in the CIP, including match to federal formula and discretionary grants, additional state and local contributions, and Metro’s short- and long-term debt strategies. The agreement must be renewed or replaced prior to July 1, 2017, to avoid significant disruption to the capitalprogram.
Discussion:
FY2018-2023 Proposed CIPThe priorities and highlights of the proposed $1.25 billion FY2018 budget and $7.2 billion FY2018-2023 CIP are summarized below by major investment category:
Railcars (FY2018 $523 million; FY2018-2023 $2.5 billion): Investment prioritiesinclude the acquisition of new 7000 series railcars (224 in FY2018) to replace the 1000, 4000, and 5000 series cars; preventive maintenance; repair and rehabilitation to improve and sustain the safety and reliability of the existing railcar fleet; and rehabilitation and repair of rail yard maintenance facilities and equipment.Rail Systems (FY2018 $117 million; FY2018-2023 $858 million): Investment priorities include the construction and implementation of a new radio and wireless
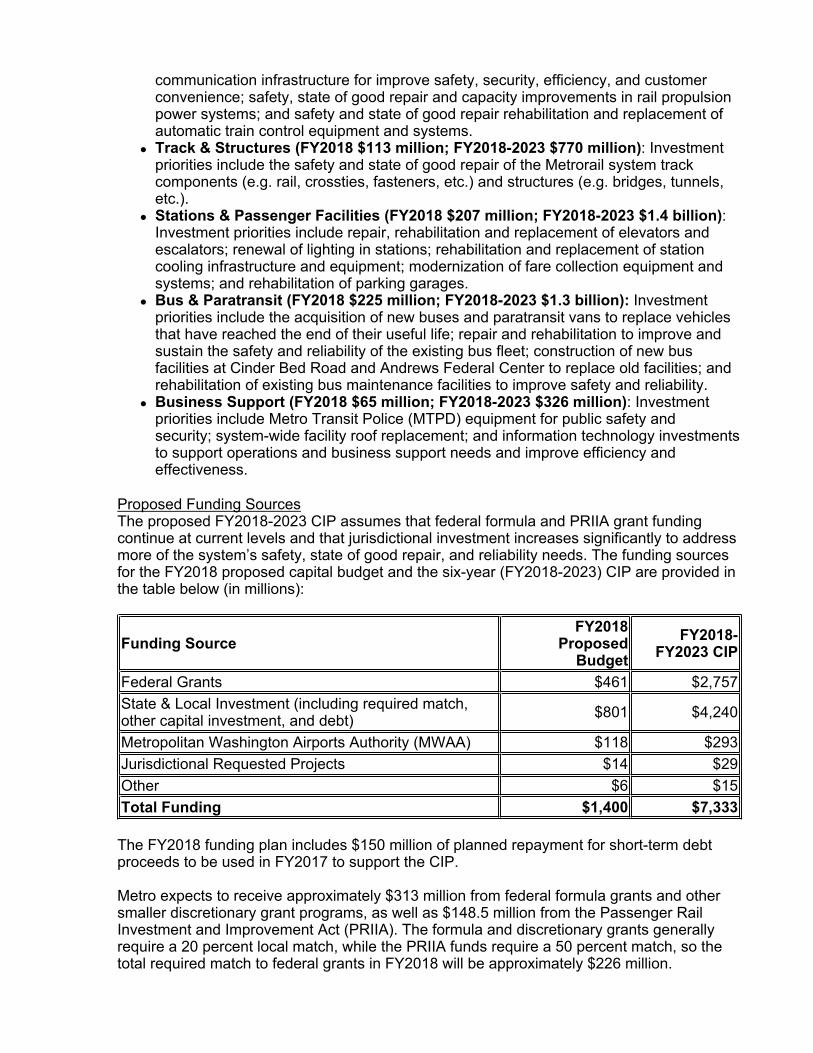
communication infrastructure for improve safety, security, efficiency, and customerconvenience; safety, state of good repair and capacity improvements in rail propulsion power systems; and safety and state of good repair rehabilitation and replacement of automatic train control equipment and systems.Track & Structures (FY2018 $113 million; FY2018-2023 $770 million): Investment priorities include the safety and state of good repair of the Metrorail system track components (e.g. rail, crossties, fasteners, etc.) and structures (e.g. bridges, tunnels,etc.).Stations & Passenger Facilities (FY2018 $207 million; FY2018-2023 $1.4 billion): Investment priorities include repair, rehabilitation and replacement of elevators and escalators; renewal of lighting in stations; rehabilitation and replacement of station cooling infrastructure and equipment; modernization of fare collection equipment and systems; and rehabilitation of parking garages.Bus & Paratransit (FY2018 $225 million; FY2018-2023 $1.3 billion): Investment priorities include the acquisition of new buses and paratransit vans to replace vehicles that have reached the end of their useful life; repair and rehabilitation to improve and sustain the safety and reliability of the existing bus fleet; construction of new busfacilities at Cinder Bed Road and Andrews Federal Center to replace old facilities; and rehabilitation of existing bus maintenance facilities to improve safety and reliability.Business Support (FY2018 $65 million; FY2018-2023 $326 million): Investment priorities include Metro Transit Police (MTPD) equipment for public safety andsecurity; system-wide facility roof replacement; and information technology investments to support operations and business support needs and improve efficiency and effectiveness.
Proposed Funding SourcesThe proposed FY2018-2023 CIP assumes that federal formula and PRIIA grant funding continue at current levels and that jurisdictional investment increases significantly to address more of the system’s safety, state of good repair, and reliability needs. The funding sources for the FY2018 proposed capital budget and the six-year (FY2018-2023) CIP are provided in the table below (in millions):
The FY2018 funding plan includes $150 million of planned repayment for short-term debt proceeds to be used in FY2017 to support the CIP.
Metro expects to receive approximately $313 million from federal formula grants and other smaller discretionary grant programs, as well as $148.5 million from the Passenger RailInvestment and Improvement Act (PRIIA). The formula and discretionary grants generally require a 20 percent local match, while the PRIIA funds require a 50 percent match, so the total required match to federal grants in FY2018 will be approximately $226 million.
Funding SourceFY2018
Proposed Budget
FY2018-FY2023 CIP
Federal Grants $461 $2,757State & Local Investment (including required match, other capital investment, and debt) $801 $4,240
Metropolitan Washington Airports Authority (MWAA) $118 $293Jurisdictional Requested Projects $14 $29Other $6 $15Total Funding $1,400 $7,333

In addition to providing the required match to federal grants, Metro’s funding jurisdictions also contribute unmatched capital funds (referred to as system performance funds) andparticipate in Metro’s long-term debt issuances. The proposed FY2018 capital budget includes $801 million in total state and local investment and debt. The proposed budget currently assumes that $441 million of this $801 million is long-term debt. Metro and the jurisdictions will make a final determination on the use of long-term debt versus system performance funding as part of the broader discussions regarding the renewal of the Capital Funding Agreement (CFA).
The proposed CIP financial plan assumes that federal grant funding will continue to be appropriated by Congress at a level consistent with Federal Fiscal Year 2016, amounting to a total of $2.76 billion over six year. The financial plan also assumes that PRIIA funding will be reauthorized at its current annual funding level.
Projected MWAA funding in support of railcar acquisition and the construction of the Silver Line will total $293 million over the six-year period.
Additional information on the GM/CEO’s proposed FY2018-2023 CIP will be included in Metro’s FY2018 Proposed Budget publication which will be available in mid-December.
FUNDING IMPACT:
TIMELINE:
RECOMMENDATION:
No action required - information item only.
Information item only - no impact on funding.Project Manager: Thomas J. Webster
ProjectDepartment/Office: CFO/OMBS
Previous Actions November 2016 - FY2017 CIP amendment and outlook for FY2018
Anticipated actions afterpresentation
January-February 2017 - public hearing and outreach activitiesMarch 2017 - adoption of FY2018-2023 CIP and approval of renewed six-year Capital Funding Agreement (CFA)

FY2017 Budget:Ridership and Revenue
Finance & Administration CommitteeOctober 8, 2015
Washington Metropolitan Area Transit Authority
Proposed FY2018-FY2023 Capital Improvement Program
Finance CommitteeDecember 1, 2016
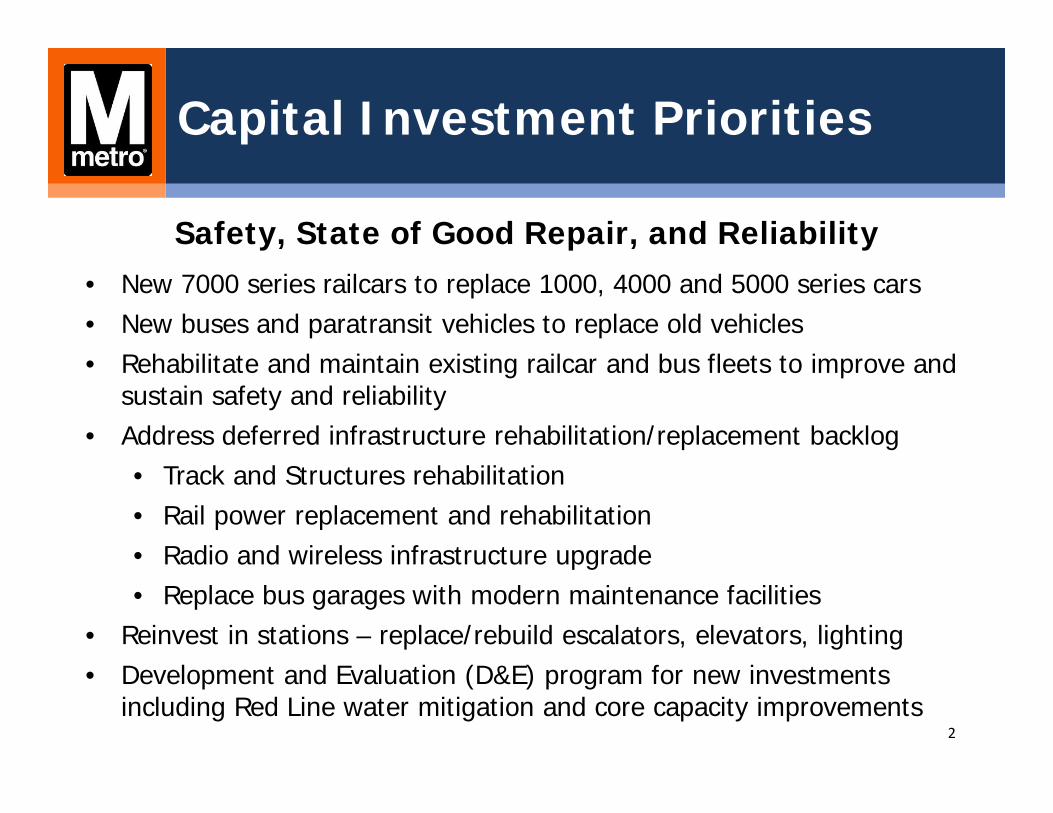
Capital Investment Priorities
Safety, State of Good Repair, and Reliability• New 7000 series railcars to replace 1000, 4000 and 5000 series cars• New buses and paratransit vehicles to replace old vehicles• Rehabilitate and maintain existing railcar and bus fleets to improve and
sustain safety and reliability• Address deferred infrastructure rehabilitation/replacement backlog
• Track and Structures rehabilitation• Rail power replacement and rehabilitation• Radio and wireless infrastructure upgrade• Replace bus garages with modern maintenance facilities
• Reinvest in stations – replace/rebuild escalators, elevators, lighting• Development and Evaluation (D&E) program for new investments
including Red Line water mitigation and core capacity improvements2
Proposed Capital Budget and Six-Year Plan
FY2018 Proposed Capital Budget:• Proposed investment of $1.25 billion• Over 85 percent of planned investment already underway• Includes jurisdiction sponsored projects within CIP
Six Year Plan:• Based on ongoing projects and prioritized state of good
repair investments from Capital Needs Inventory• Proposed $7.2 billion six-year investment acknowledges
regional funding constraints and Metro commitment not to request more than can be delivered
3

FY2018 – FY2023 Proposed Investment Summary
Investment Category ($M) FY2017 Forecast
FY2018 Proposed
6 Year Proposed
Railcars $489 $523 $2,535
Rail Systems $98 $117 $858
Track & Structures $152 $113 $770
Stations & Passenger Facilities $175 $207 $1,425
Bus & Paratransit Vehicles $230 $225 $1,270
Business Support $63 $65 $326
TOTAL $1,207 $1,250 $7,183
4

Railcars
Program ($M) FY2017 Forecast
FY2018 Proposed
6 Year Proposed
Acquisition $332 $344 $1,567
Maintenance/Overhaul $116 $139 $698
Maintenance Facilities $41 $40 $269
Total $489 $523 $2,535
FY2018 Key Deliverables• Acquisition of 224 new 7000 series railcars • Continue railcar preventive maintenance
and rehabilitation activities • Increased local funding for parts for railcar
rehabilitation • Complete repairs at Alexandria and
Brentwood rail yards; rehab railcar lifts
6 Year Highlights• 748 new 7000 series railcars in service• 1000, 4000, and 5000 fleets replaced• Accelerate replacement of 2000/3000 fleets• Complete replacement of railcar lifts and
other equipment at rail yard facilities• Focused investment in existing railcar fleet
to improve safety and reliability 5

Rail Systems
FY2018 Key Deliverables• Complete underground installation of
radio infrastructure on Green Line and acquire sites for above ground radio towers
• Install 15 power quality meters, and replace 6 transformers
• Install 6 tie-breaker stations• Design and begin work on Generation
Three track circuit replacement• Pilot wayside-worker protection system
Program ($M) FY2017 Forecast
FY2018 Proposed
6 Year Proposed
Propulsion $32 $33 $307
Signals & Communications $66 $84 $551
Total $98 $117 $858
6 Year Highlights• Complete upgrades to radio system and
underground wireless infrastructure • Full implementation of wayside-worker
protection system • Complete power upgrades on Orange and
Blue Line; begin Red Line power upgrades• Rail power system repair and rehabilitation• Complete replacement of Generation three
track circuits6

Track & Structures
FY2018 Key Deliverables• Replace 8 switches and 13 miles of
running rail• 23,500 direct fixation fasteners • Remove and replace 13,000 crossties• Replace 7,000 insulators • Repair, mitigate, and eliminate tunnel
leaks; rehabilitate 110,000 linear feet of drainage
Program ($M) FY2017 Forecast
FY2018 Proposed
6 Year Proposed
Fixed Rail $144 $100 $554
Structures $8 $13 $206
Track Maintenance Equipment <$1 $1 $10
Total $152 $113 $770
6 Year Highlights• Maintain track in a state of good repair
with annual program to replace components including crossties, fasteners, switches, and insulators based on condition
• Development & Evaluation of Red Line Water Mitigation Project
7

Stations & Passenger Facilities
Program ($M) FY2017Forecast
FY2018 Proposed
6 Year Proposed
Platforms & Structures $89 $88 $551
Vertical Transportation $51 $61 $323
Fare Collection $9 $20 $259
Station Systems $22 $30 $202
Parking Facilities $4 $8 $90
Total $175 $207 $1,425
FY2018 Key Deliverables• Replace 14 escalators, rehabilitate 12
escalators, rehabilitate 14 elevators• Drainage improvements at 8 locations• Replace station chillers and cooling towers• Start College Park parking garage rehab• Design for Huntington parking garage• Complete development of new Potomac Yard
Station (jurisdictional project)
6 Year Highlights• Continue reinvestment in elevators and
escalators• Replace and modernize existing fare
collection assets• Rehabilitation of parking facilities• Station lighting renewal
8
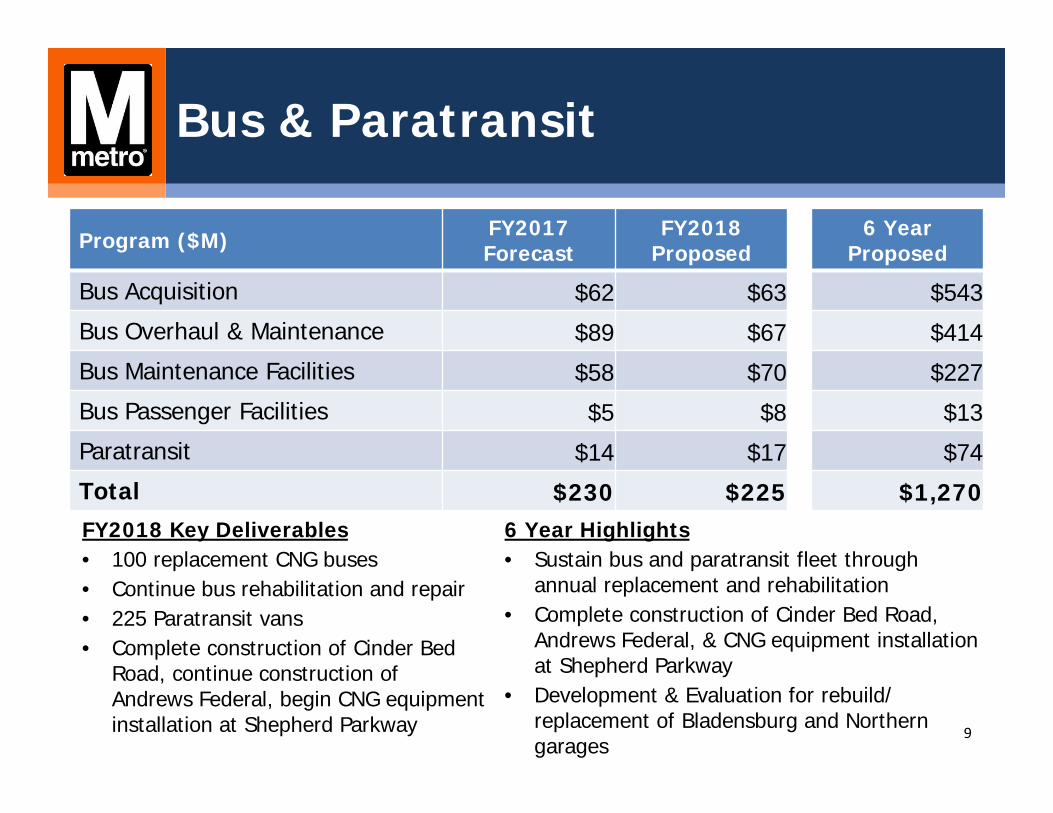
Bus & Paratransit
FY2018 Key Deliverables• 100 replacement CNG buses • Continue bus rehabilitation and repair• 225 Paratransit vans• Complete construction of Cinder Bed
Road, continue construction of Andrews Federal, begin CNG equipment installation at Shepherd Parkway
Program ($M) FY2017 Forecast
FY2018 Proposed
6 YearProposed
Bus Acquisition $62 $63 $543
Bus Overhaul & Maintenance $89 $67 $414
Bus Maintenance Facilities $58 $70 $227
Bus Passenger Facilities $5 $8 $13
Paratransit $14 $17 $74
Total $230 $225 $1,270 6 Year Highlights• Sustain bus and paratransit fleet through
annual replacement and rehabilitation• Complete construction of Cinder Bed Road,
Andrews Federal, & CNG equipment installation at Shepherd Parkway
• Development & Evaluation for rebuild/ replacement of Bladensburg and Northern garages
9
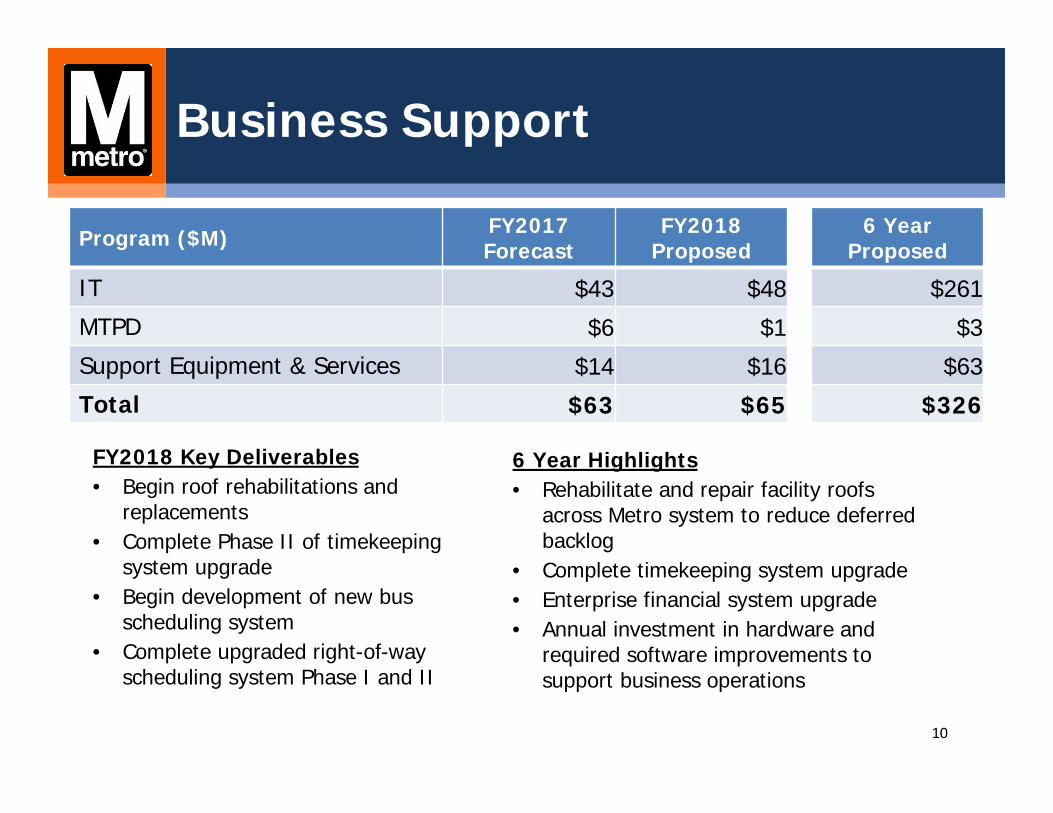
Business Support
Program ($M) FY2017Forecast
FY2018 Proposed
6 Year Proposed
IT $43 $48 $261
MTPD $6 $1 $3
Support Equipment & Services $14 $16 $63
Total $63 $65 $326
FY2018 Key Deliverables• Begin roof rehabilitations and
replacements• Complete Phase II of timekeeping
system upgrade• Begin development of new bus
scheduling system• Complete upgraded right-of-way
scheduling system Phase I and II
6 Year Highlights• Rehabilitate and repair facility roofs
across Metro system to reduce deferred backlog
• Complete timekeeping system upgrade• Enterprise financial system upgrade • Annual investment in hardware and
required software improvements to support business operations
10

Proposed Development & Evaluation Program
Develop major capital investment needs into capital projects before programming for construction/acquisition
Development & Evaluation Program: Red Line Water Remediation 2000/3000 Series Railcar
Replacement Red Line Core Capacity Tunnel Ventilation Bladensburg/Northern Garage
Rebuild/Replacement Office Facilities/JGB Rail Degradation from Tunnel Water Infiltration
11

FY2018 Proposed Capital Budget Funding Plan of $1.4 Billion
*Funding plan includes $150 million in FY2018 to repay short-term debt projected to be used in FY201712
Other $6
Jurisdictional Projects $14
1%
MWAA$118 9%
Federal Grants $461 33%
District of Columbia
$281 20%
Maryland$278 20%
Virginia$242 17%
State & Local Investment and Debt*
$801 57%
in millions
<1%

FY2018-2023 Proposed Six-Year Funding - $7.3 Billion
*Funding plan includes $150 million in FY2018 to repay short-term debt projected to be used in FY201713
Other$15
Jurisdictional Projects$29
MWAA$293 4%
Federal Grants $2,757 38%
District of Columbia
$1,502 21%
Maryland$1,465 20%
Virginia$1,273 17%
State & Local Investment and Debt*
$4,240 58%
in millions
<1%<1%

Next Steps
December: Continue jurisdictional discussions on Capital Funding Agreement (CFA) renewal
Jan 14-Feb 6: Public outreach and public comment period begin
Week of Jan 30 (tentative): Public hearing Feb 6: Public comment period closes March: Adoption of FY2018 Budget and Execution of
renewed CFA
Budget approval in March is recommended to ensure uninterrupted regional funding of the capital program and to
allow for the timely application and award of FTA grants14
Appendices
15
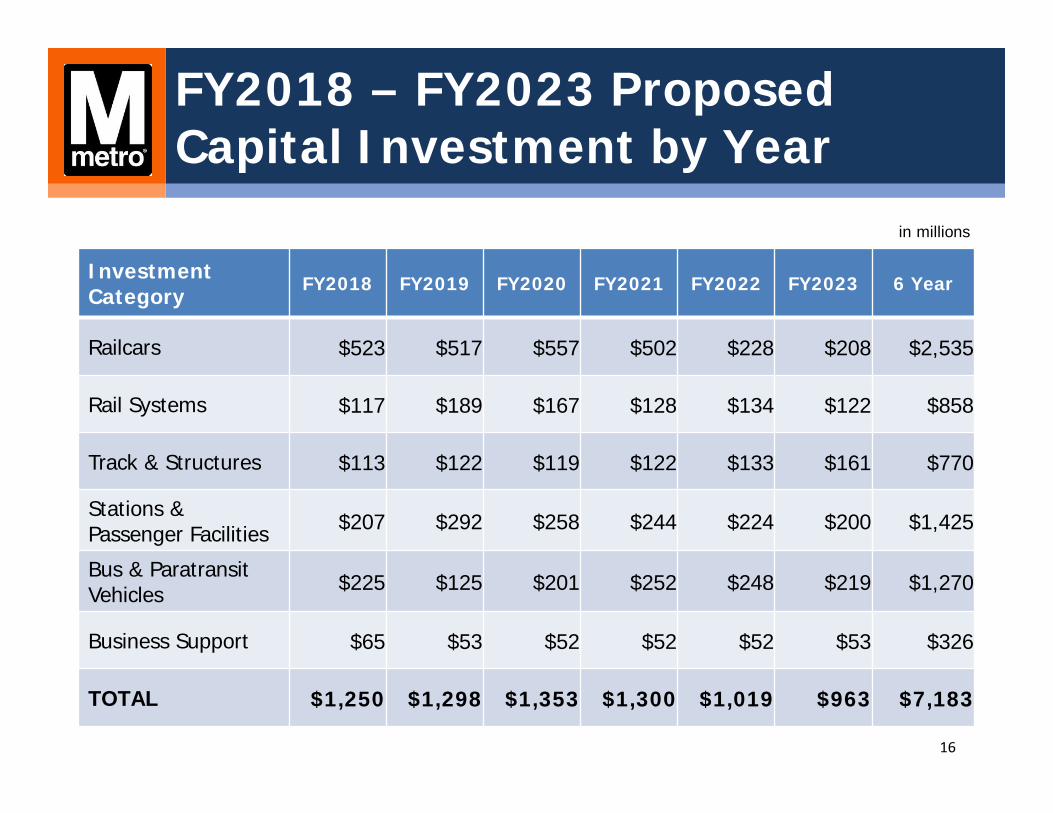
FY2018 – FY2023 Proposed Capital Investment by Year
Investment Category
FY2018 FY2019 FY2020 FY2021 FY2022 FY2023 6 Year
Railcars $523 $517 $557 $502 $228 $208 $2,535
Rail Systems $117 $189 $167 $128 $134 $122 $858
Track & Structures $113 $122 $119 $122 $133 $161 $770
Stations & Passenger Facilities $207 $292 $258 $244 $224 $200 $1,425
Bus & ParatransitVehicles $225 $125 $201 $252 $248 $219 $1,270
Business Support $65 $53 $52 $52 $52 $53 $326
TOTAL $1,250 $1,298 $1,353 $1,300 $1,019 $963 $7,183
16
in millions

FY2018 – FY2023 Proposed Funding Sources by Year
Funding Source FY2018* FY2019 FY2020 FY2021 FY2022 FY2023 6 Year
Federal Grants $460 $461 $458 $459 $459 $459 $2,757
State & Local $361 $571 $646 $646 $521 $495 $3,240
Long Term Debt $441 $222 $212 $124 -- -- $1,000
MWAA $118 $33 $32 $69 $35 $5 $293
Other $6 $8 $1 -- -- -- $15
JurisdictionalProjects $14 $3 $3 $3 $3 $3 $29
Total Funding $1,400 $1,298 $1,353 $1,300 $1,019 $963 $7,333
17
in millions
*Funding plan includes $150 million in FY2018 to repay short-term debt projected to be used in FY2017

FY2018 Proposed Jurisdictional Contributions & Long Term Debt
Jurisdiction FY2017Budget
FY2018 Proposed* Change
District of Columbia $144 $282 $138
Maryland $148 $283 $135
City of Alexandria $11 $37 $26 Arlington County $20 $58 $38 City of Fairfax $1 $2 $1 Fairfax County $36 $101 $66 City of Falls Church $1 $2 $1 Commonwealth of Virginia $50 $50 --Virginia Subtotal $119 $250 $131
Total Contribution $410 $815 $405
18*Funding plan includes $150 million in FY2018 to repay short-term debt projected to be used in FY2017

FY2018-2023 Proposed Jurisdictional Contributions & Long Term Debt By Year
Jurisdiction FY2018* FY2019 FY2020 FY2021 FY2022 FY2023 6 Year
District of Columbia $282 $283 $306 $274 $185 $175 $1,505
Maryland $283 $274 $297 $266 $179 $170 $1,469
City of Alexandria $37 $31 $34 $30 $18 $17 $167 Arlington County $58 $56 $62 $54 $32 $30 $292 City of Fairfax $2 $2 $2 $2 $1 $1 $9 Fairfax County $101 $99 $109 $96 $58 $55 $518 City of Falls Church $2 $2 $2 $2 $1 $1 $9 Commonwealth of Virginia $50 $50 $50 $50 $50 $50 $300
Virginia Subtotal $250 $239 $258 $233 $160 $153 $1,296
Total Contribution $815 $796 $861 $773 $524 $498 $4,269
19
*Funding plan includes $150 million in FY2018 to repay short-term debt projected to be used in FY2017

Finance Committee
Information Item IV-B
December 1, 2016
FY2018 Operating Budget Work Session

Washington Metropolitan Area Transit Authority
Board Action/Information Summary
TITLE:
FY2018 Operating Budget Work Session
PRESENTATION SUMMARY:
In the first of three work sessions on the proposed FY2018 operating budget, staff will provide additional information on ridership and revenue.
PURPOSE:
In response to Board member requests for additional information on ridership and revenue assumptions in the FY2018 operating budget, staff will conduct the first of three budget work sessions covering these topics.
DESCRIPTION:
Key Highlights:
Following the General Manager/Chief Executive Officer's (GM/CEO) proposal of the FY2018 operating budget in November, the Finance Committee is convening three work sessions in December and January to review the budget in greater detail. The work sessions will cover revenue and ridership, personnel expenses, and non-personnel expenses.
Background and History:
In order to bridge a projected budget gap of nearly $300 million, the GM/CEO has proposed an FY2018 operating budget that includes WMATA employee headcount reductions, fare increases, bus and rail service cuts, limited use of Federal Transit Administration (FTA) grant funds for eligible preventive maintenance activities, and increased jurisdictional contributions. Following the presentation of the proposed budget, Metro Board members submitted follow-up questions to staff covering a range of topics. These questions will serve as the basis for three public work sessions in December and January covering revenue and ridership, personnel expenses, and non-personnel expenses.
Discussion:
Complete answers to the Board member questions regarding revenue and ridership are included as an attachment. The presentation to the Finance Committee summarizes
Action Information MEAD Number:
201828 Resolution:
Yes No
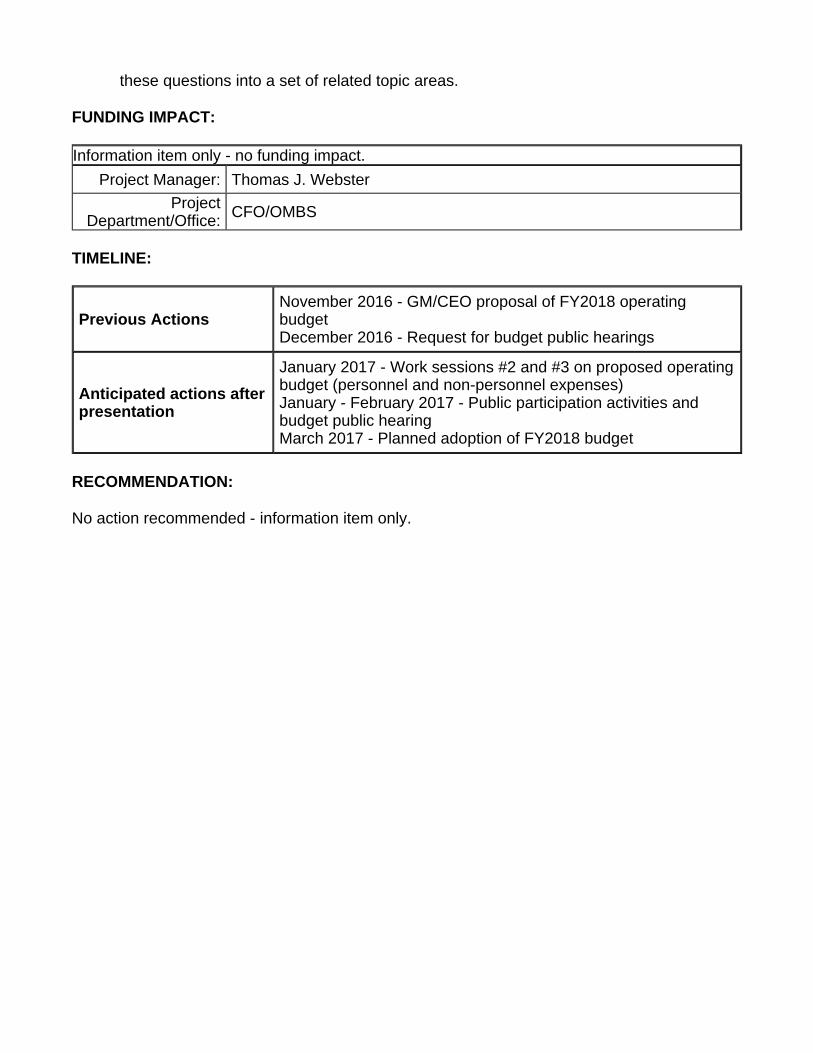
these questions into a set of related topic areas.
FUNDING IMPACT:
TIMELINE:
RECOMMENDATION:
No action recommended - information item only.
Information item only - no funding impact.
Project Manager: Thomas J. Webster
Project Department/Office:
CFO/OMBS
Previous ActionsNovember 2016 - GM/CEO proposal of FY2018 operating budget December 2016 - Request for budget public hearings
Anticipated actions after presentation
January 2017 - Work sessions #2 and #3 on proposed operating budget (personnel and non-personnel expenses) January - February 2017 - Public participation activities and budget public hearing March 2017 - Planned adoption of FY2018 budget

Page 1 of 9
Washington Metropolitan Area Transit Authority FY2018 Proposed Operating Budget Board Member Questions and Answers Ridership / Revenue 1. With the 100,000 per year ridership decline, when did the drop accelerate?
Provide a longer term history of the decline.
Total annual Metrorail ridership peaked in FY2009, but as the chart below shows, the decline since that time has not been consistent. The chart shows average weekday and weekend ridership for October each year from FY2008 through FY2017. Along with May, October is a “typical” month for Metro that is not strongly affected by holidays, tourists, weather, or other factors. However, given the relatively small sample size for weekends (i.e., only 4-5 weekends per month), the underlying trend is shown in both FY2011 and FY2015 when a few strong weekend ridership days boosted the monthly average above the underlying trend in those years.

Page 2 of 9
From FY2009 through FY2012, despite the recession, average weekday ridership held essentially flat at around 750,000 trips. The drop in total ridership during that period was driven by declines in weekend ridership, which fell by nearly 10 percent (from 650,000 combined on Saturday/Sunday to 600,000). This was the period when weekend service interruptions for rail system maintenance and rehabilitation began to be more frequent and more intense. Between FY2012 and FY2015, average weekday ridership experienced its first sustained decline of about 4 percent, falling to 725-730,000 daily. This was attributed to a combination of largely external factors, including increased telecommuting, a pullback in federal employment, growth in alternative transportation options (such as Uber and Capital Bikeshare), and relatively low gas prices, among others. Weekend ridership also continued to decline during the same period, falling to approximately 550,000 as service interruptions continued due to weekend track work.
The drop in ridership then accelerated substantially in FY2016 (prior to SafeTrack) and has continued in FY2017. Average weekday ridership fell below 700,000 in FY2016 and was only 624,000 in FY2017 (i.e., October 2016, the month which was just completed). The drop in FY2016 was primarily due to customer reaction to declining safety and service reliability. This drop has been exacerbated in FY2017 by the SafeTrack program, which has significantly interrupted weekday (including peak hour) service for many thousands of riders. Weekend ridership has also declined further (to only 450,000) as service frequency of only three trains per hour (or every 20 minutes) on most lines has become the norm. Overall, since peaking in FY2009, average weekday ridership in October has declined 18 percent, while average weekend (Saturday plus Sunday) ridership has declined 31 percent. Through SafeTrack and railcar investments, Metro is focused on restoring safety, reliability, and customer confidence.
2. What information is available about ridership in October?
October Rail ridership is 15.0 million, down 2.1 million trips or 12 percent from last year, or 14 percent below budget. Year-to-date Rail ridership is down 13 percent from prior year and is 15 percent below budget. Preliminary October Bus ridership is 10.7 million, which is 7 percent below prior year and 10 percent below budget. Year-to-date Bus ridership is down 7 percent from prior year and is 9 percent below budget.
3. Fare revenue is down $85M from FY2017 budget. Please provide your methodology for fare revenue to go from $775M in FY2017 to $690M in FY2018, and what is the ridership decline that is at the root of the 11% revenue decline?
Through FY2016, Metro’s ridership declined due to customer reaction to system reliability challenges, changes in transportation options, low gas prices and

Page 3 of 9
telecommuting; as a result passenger revenue was $57 million below prior year. The FY2017 budget did not fully recognize the lower ridership levels and associated revenue. Based on current trends, FY2017 revenue is forecasted to be nearly $100 million below the FY2017 budget. This reflects the change in ridership environment and decreased ridership for continued track and safety improvements, as well as lower bus and rail ridership due to fare increase and service reductions. Between Metrobus and Metrorail, ridership is estimated to be 15 million trips less than the FY2017 forecast. The proposed fare increases will decrease ridership by 10 million, and the service reduction proposals will impact an estimated 5 million trips.
Ridership FY2016 Actual
FY2017 Projected
FY2017 Forecast
FY2018 Proposed
Metrorail 191,348 203,500 183,510 177,105
Metrobus 127,432 135,598 123,432 115,230
MetroAccess 2,281 2,420 2,281 2,300
Total 321,060 341,518 309,222 294,635
Revenue FY2016 Actual
FY2017 Budget
FY2017 Forecast
FY2018 Proposed
Metrorail $574,351 $612,800 $532,851 $534,991
Metrobus $141,053 $152,120 $135,793 $145,350
MetroAccess $9,156 $9,972 $9,156 $9,732
Total $724,560 $774,892 $677,800 $690,073
4. If the operating budget expenses are $1.8B and farebox revenue are $841M,
what is the farebox recovery rate for FY2018? What was it for the past 5 years?
The following table provides both farebox recovery rate and total cost recovery rate for FY2012 through FY2018. Farebox recovery rate includes only passenger fares and parking fees, while total cost recovery rate adds in all other non-passenger revenue sources, including advertising, fiber optic leases, and joint development.
FY2012
Actual FY2013
Actual FY2014
Actual FY2015
Actual FY2016
Actual FY2017 Budget
FY2018 Proposed
Farebox Recovery Ratio
52.0% 51.8% 48.1% 49.6% 46.0% 47.1% 41.4%
Cost Recovery Ratio
57.4% 56.8% 53.1% 55.5% 50.8% 52.5% 46.3%

Page 4 of 9
Fare Adjustments 5. Could staff expand on the expected decrease in total ridership from the
proposed fare increases? How much of this would be riders deciding to make fewer trips versus completely abandoning the system?
The proposed fare increase for Metrobus is expected to result in a decrease of 6 million bus trips annually, while the Metrorail fare changes are expected to reduce rail ridership by 3.5 million trips. Metro’s fare impact modeling does not analyze individual rider decisions, but instead uses the total number of trips on an average day, by length/cost, period, income level, minority status, etc. Therefore Metro staff is not able to project how much of the decrease would be the result of reduced trip-making versus riders shifting entirely to another mode.
6. For the fare increase proposal, what is the demand elasticity imputed by the projected ridership decline?
Fare elasticities used in the ridership projections were developed for Metro as part of a recent study conducted by the University of Maryland’s National Center for Smart Growth. Different elasticities were assumed for different modes and trip lengths. The weighted average of the demand elasticity is approximately -0.5, which means a 10 percent increase in fare will result in a 5 percent decrease in ridership. However, given the current ridership environment and overall uncertainty, management has been more conservative in forecasting FY2018 than the results of the ridership elasticity calculation (e.g., assuming less net revenue increase from various fare increases).
7. Were alternatives such as increasing the transfer benefit modeled to reduce the demand elasticities?
Staff evaluated a number of potential fare change scenarios as part of the development of the FY2018 proposed budget. Some scenarios that included larger rail fare increases also included increases to the bus-rail transfer discount as a way to partially offset the fare increase impact for some riders. However, the net revenue impact of an increase to the transfer discount is negative – that is, more revenue is lost from existing riders paying less than is gained from incremental new riders – and therefore an increase in the transfer discount was not included in the proposal.
8. What would be the cost of increasing the bus-to-rail and rail-to-bus transfer discount by $0.25 to a total of $0.75?
Increasing bus transfer discount by $0.25 to $0.75 would result in an annual revenue loss of approximately $7 million.

Page 5 of 9
9. What percent of bus riders make a transfer to or from Metrorail? What is the
jurisdiction of residency of these transfer customers?
According to the 2014 Metrobus survey, 30 percent of Metrobus trips include a transfer from or to Metrorail. Of those customers transferring, 43 percent live in the District of Columbia, 36 percent reside in the State of Maryland and 18 percent are residents of the Commonwealth of Virginia. An additional 3 percent are from jurisdictions outside of the region.
10. Did we benchmark bus fares to understand how the proposed $2 fare compares to comparable systems?
City/Agency Single-ride bus fare
NYC Transit $2.75
Dallas (DART) $2.50
Atlanta (MARTA) $2.50
San Francisco (Muni) $2.25
Philadelphia (SEPTA) $2.25 cash / $1.80 token
Chicago (CTA) $2.00
Boston (MBTA) $2.00 cash / $1.70 card
Los Angeles (LACMTA) $1.75
WMATA $1.75
Baltimore (MTA) $1.70
11. Please provide an estimate of the net additional revenue from increasing the
fare on the B30 and the 5A airport routes to $9.00.
Monthly ridership on the two airport routes is approximately 53,000. Increasing the fare from current $7.00 per trip to $9.00 per trip would generate approximately $800,000 in net additional revenue annually after accounting for reduced demand. However, the B30 route has been proposed for elimination as part of the proposed FY2018 service reductions on Metrobus. It is also expected that the 5A will be considered for elimination once Silver Line Phase 2 opens and Dulles Airport is connected to the Metrorail system.
12. What percent of bus riders use the 7-day unlimited ride bus pass? If the single-ride bus trip increased to $2.00 and the pricing on the 7-day bus pass

Page 6 of 9
was adjusted to nine times the single ride fare, what would be the revenue loss when compared to keeping the pricing at ten times the single ride fare?
Approximately 3.5 percent of customers who use Metrobus at least once a week use a weekly bus pass. If the 7-day bus pass is set at $18 ($2 single-ride bus trip multiplied by nine times the fare), the annual revenue loss is estimated at $1.5 million, and is not projected to increase passenger trips.
13. What does each dime of parking rates increase bring in revenue?
At current utilization rates, total parking fee revenue to Metro is expected to be approximately $42 million in FY2017 on a base of approximately 11 million parking transactions. If no other fare increases or service changes on rail were implemented, the net revenue gain from a $0.10 parking fee increase would be approximately $1 million. However, given that additional fare increases on rail are proposed, as well as reductions in peak period service frequency, Metro estimates a net gain of $0.5 million from the proposed $0.10 increase.
Service Reductions 14. The rail and bus service rightsizings are expected to save $12M/rail and
$17M/bus, for a total of $29M. Where are these “savings” reflected in the operating budget for FY2018?
The service reduction savings are reflected as reductions in personnel costs (salary, wages and fringe) as well as reductions in fuel and materials & supplies for Bus and Rail. In addition, the revenue impact is reflected in passenger fares.
$ in Millions Bus Rail Total
Personnel $15.2 $9.7 $24.9
Non-Personnel 2.7 0.0 2.7
Fuel / Propulsion 1.6 10.2 11.8
Revenue Loss (2.7) (7.7) (10.4)
Net savings $16.8 $12.2 $29.0
15. What is the rationale behind and methodology used in calculating the
ridership loss attributed to rail right-sizing?
For the rail service rightsizing proposal, staff used ridership data for May 2016 as this was a representative month without any major disruptions and was prior to the start of SafeTrack surges. For each of the service proposals (peak, off-peak,

Page 7 of 9
evening and weekends), modest ridership losses of 1 to 2 percent are projected as service headways would widen and passenger travel times would increase, in addition to the trains being more crowded. The projected peak loading, Passenger per Car (PPC), was then calculated to determine whether the resulting PPC was within the Board policy standard of 80 to 120 PPC.
The source for the rail ridership data is a monthly consolidation of fare gate and SmarTrip data. The PPC calculations are sourced from field data to generate monthly analysis on passenger loads during the peak periods.
16. What is the projected a.m. and p.m. peak load point(s) on the Green line with the proposed abolition of Rush Plus service and what would be the expected PPC at those peak load points?
The projected peak load point on the Green line is Shaw-Howard University in the A.M. and Mt Vernon Square in the P.M. The average passenger per car (PPC) will be within the Board policy standard of 80 and 120.
17. What would be the percentage of eight-car trains operating during rush hours in the 8 minute rush hour service frequency scenario? What would be the percentage for the remainder of the system if the Yellow line is excluded since it currently operates with all six-car trains at all times?
Metro currently assumes scheduled operation of 50 percent 8-car trains on Red, Orange, Green, and Blue lines during peak periods. The proposed plan would allow Metro to operate up to 75 percent 8-car trains on line segments, subject to power system capacity. Metro would continue to operate 6-car trains on Silver and Yellow lines.
18. What is the time range for “Early Evening” service in the Metrorail service change proposal? How would the Red line be treated in this proposal, i.e. what would be the span of Grosvenor and Silver Spring turnbacks?
“Early Evening” service is defined as 6:30 pm to 9:30 pm. Currently, the short trip is operated between Grosvenor and Silver Spring only during the peak period. The proposal also reinstitutes the “Grosvenor turnback” during off-peak times, such that every other Red Line train to Shady Grove terminates at Grosvenor. The short trip will operate between Grosvenor and Silver Spring all day.
19. What is the cost savings from reinstituting midday Grosvenor turnbacks and how many riders board or exit at affected stations on an average midday?
The annual operating savings to reinstituting the Grosvenor turn backs (on weekday and weekend) is $1.21 million less projected revenue loss of $0.35

Page 8 of 9
million, which equals an estimated subsidy reduction of $ 0.86 million. The following is midday ridership based on May 2016:
May-2016 WEEKDAY AVERAGES
AM MID PM EVN TOTAL
SHADY GROVE ENTRY 8,465 1,867 1,214 325 11,870
EXIT 923 1,041 6,940 2,564 11,468
ROCKVILLE ENTRY 2,157 804 882 303 4,147
EXIT 721 575 2,058 814 4,168
TWINBROOK ENTRY 2,196 770 970 241 4,178
EXIT 786 526 1,900 874 4,086
WHITE FLINT ENTRY 1,506 650 1,096 253 3,505
EXIT 943 491 1,367 637 3,438
20. What is the dollar value savings from closing the rail system early on
weeknights and weekends as proposed by the GM? Is this value already included in the proposed FY18 budget? Is the proposed $4.0 million in additional late night bus service included in the GM’s FY18 budget?
The net savings (expense reductions less revenue loss) for closing the rail system early is projected at $2.5 million annually, and is included in the FY2018 Proposed Budget. Supplementary Bus service is not included in the proposed budget.
21. What would be the approximate savings from closing all rail station second entrances at 8 p.m. on weeknights and all day on Saturday and Sunday (excluding Navy Yard on baseball game days)?
There are 22 stations with two or more mezzanines, with a minimum of one station manager scheduled for each station mezzanine during rail service hours. If Metro closed one mezzanine at a location, there would be cost savings in station manager labor and a small reduction in custodial needs; a portion of the savings would be negated by increased security patrol at the closed mezzanines and impacts to ridership. The preliminary estimated annual savings of closing one mezzanine during the weekend period is $50-$90K and closing one mezzanine
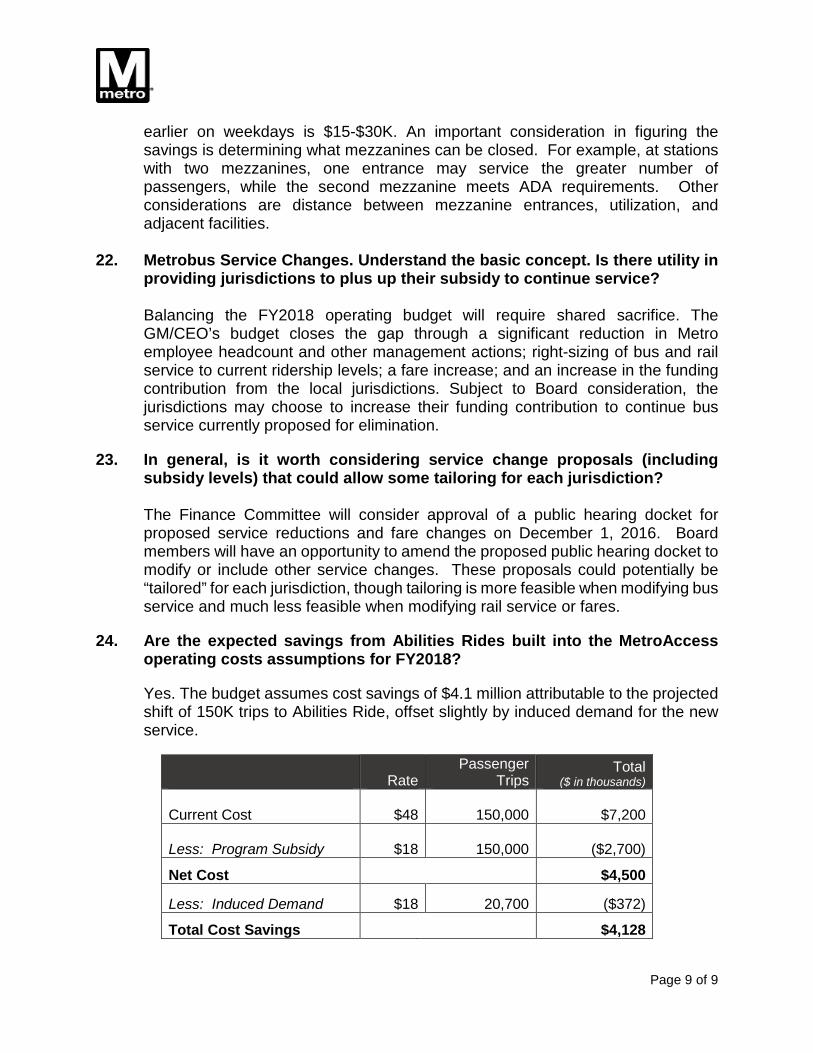
Page 9 of 9
earlier on weekdays is $15-$30K. An important consideration in figuring the savings is determining what mezzanines can be closed. For example, at stations with two mezzanines, one entrance may service the greater number of passengers, while the second mezzanine meets ADA requirements. Other considerations are distance between mezzanine entrances, utilization, and adjacent facilities.
22. Metrobus Service Changes. Understand the basic concept. Is there utility in providing jurisdictions to plus up their subsidy to continue service? Balancing the FY2018 operating budget will require shared sacrifice. The GM/CEO’s budget closes the gap through a significant reduction in Metro employee headcount and other management actions; right-sizing of bus and rail service to current ridership levels; a fare increase; and an increase in the funding contribution from the local jurisdictions. Subject to Board consideration, the jurisdictions may choose to increase their funding contribution to continue bus service currently proposed for elimination.
23. In general, is it worth considering service change proposals (including subsidy levels) that could allow some tailoring for each jurisdiction? The Finance Committee will consider approval of a public hearing docket for proposed service reductions and fare changes on December 1, 2016. Board members will have an opportunity to amend the proposed public hearing docket to modify or include other service changes. These proposals could potentially be “tailored” for each jurisdiction, though tailoring is more feasible when modifying bus service and much less feasible when modifying rail service or fares.
24. Are the expected savings from Abilities Rides built into the MetroAccess operating costs assumptions for FY2018?
Yes. The budget assumes cost savings of $4.1 million attributable to the projected shift of 150K trips to Abilities Ride, offset slightly by induced demand for the new service.
Rate Passenger
Trips Total
($ in thousands)
Current Cost $48
150,000 $7,200
Less: Program Subsidy $18
150,000 ($2,700)
Net Cost $4,500
Less: Induced Demand $18 20,700 ($372)
Total Cost Savings $4,128

FY2017 Budget:Ridership and Revenue
Finance & Administration CommitteeOctober 8, 2015
Washington Metropolitan Area Transit Authority
FY2018 Budget Work Session:Ridership & Revenue
Finance CommitteeDecember 1, 2016

2
A Trend Defying the NormJobs, Population Up – People Travelling Less?

3
Customers Expect Fast, Frequent, and Reliable Service

44
150,000 new entries/day
$400,000 in new fareboxrevenue each weekday
Market STILL Wants MetroDevelopment-Related Ridership
100M SF TOD Underway
>90% of Region’s
Commercial Development within ½ mile of Metrorail
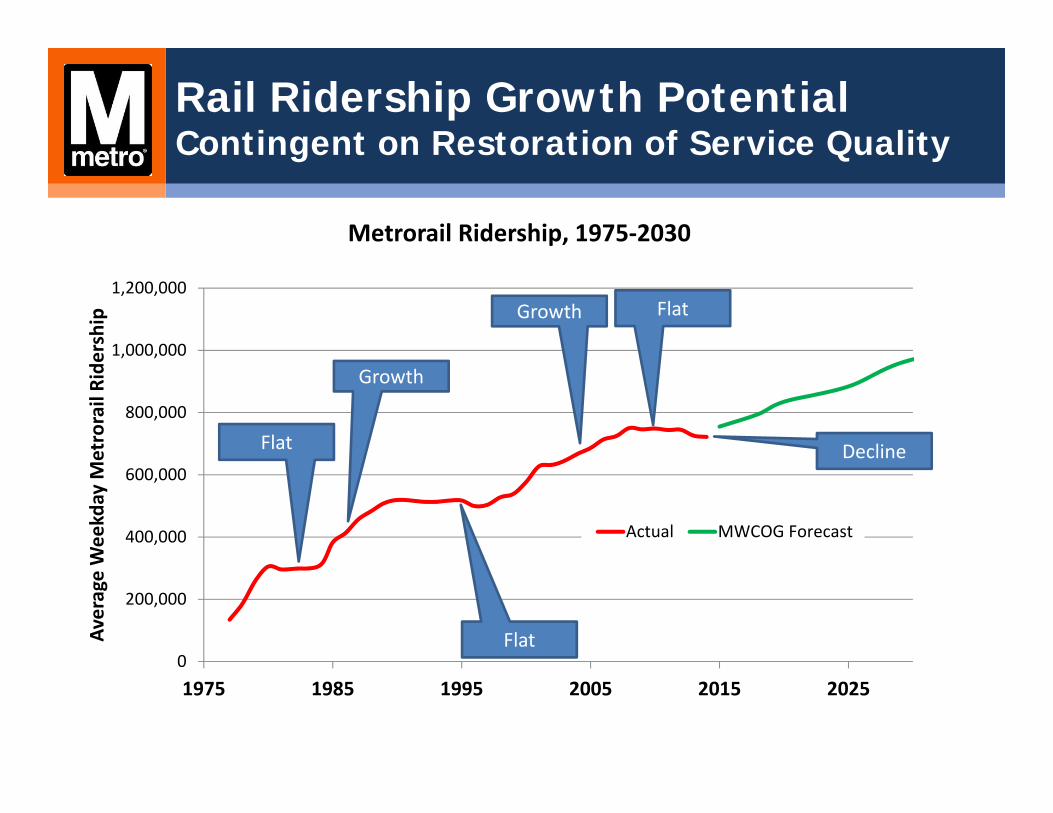
Rail Ridership Growth PotentialContingent on Restoration of Service Quality
5
0
200,000
400,000
600,000
800,000
1,000,000
1,200,000
1975 1985 1995 2005 2015 2025
Average W
eekday M
etrorail Ridership
Metrorail Ridership, 1975‐2030
Actual MWCOG Forecast
Flat
Growth
Flat
Growth Flat
Decline

Review Board Questions
6
Overall ridership trends
FY2018 ridership/revenue projections
Cost recovery
Transfers
Metrobus pricing

Rail Ridership TrendFY2008-FY2017
7 400
450
500
550
600
650
700
750
800
FY08 FY09 FY10 FY11 FY12 FY13 FY14 FY15 FY16 FY17
October Rail Ridership (000s)
Average Weekday
Average Weekend (Sat+Sun)
Change in Avg. October Ridership
FY09-17 FY14-17Weekday -18% -14%Weekend -31% -17%

Impact of Specific Events on Ridership
8
Red Line accident (June 2009): No evident long-term impact on ridership
Government shutdown (Oct. 2013): Significant impact during two-week closure, but ridership bounced back quickly
Sequestration (started 2013): coincided with peak period ridership decline, but was one of many factors

Ridership & Revenue
9
RidershipFY2016
ActualFY2017
ProjectedFY2017
ForecastFY2018
ProposedMetrorail 191,348 203,500 183,510 177,105 Metrobus 127,432 135,598 123,432 115,230 MetroAccess 2,281 2,420 2,281 2,300 Total 321,060 341,518 309,222 294,635
RevenueFY2016
ActualFY2017 Budget
FY2017 Forecast
FY2018 Proposed
Metrorail $574,351 $612,800 $532,851 $534,991Metrobus $141,053 $152,120 $135,793 $145,350MetroAccess $9,156 $9,972 $9,156 $9,732Total $724,560 $774,892 $677,800 $690,073

Cost Recovery
10
FY2012 Actual
FY2013 Actual
FY2014 Actual
FY2015 Actual
FY2016 Actual
FY2017 Budget
FY2018 Proposed
FareboxRecovery Ratio
52.0% 51.8% 48.1% 49.6% 46.0% 47.1% 41.4%
CostRecovery Ratio
57.4% 56.8% 53.1% 55.5% 50.8% 52.5% 46.3%
Note:
Farebox recovery includes fare and parking fee revenues from passengers.
Cost recovery includes all passenger revenues and all non-passenger revenues
such as advertising, joint development, and fiber optic leases.

Transfers
11
Riders can transfer between Metrobus routes for free if using a SmarTrip® card Transfers between Metrobus and other local providers
also free except for any required upcharge if local fare is different
Rail-bus (or bus-rail) transfers get a $0.50 discount off the second fare
Increasing transfer discount would mitigate fare increase for some current riders, but would reduce net revenue by approximately $7 million

Metrobus Fares
12
7-day bus pass is most-used pass product: Could mitigate fare increase by lowering pricing to 9
trips rather than 10 Would reduce revenue approximately $1.5 million, not
expected to attract new customers
Airport buses (B30 and 5A): B30 currently proposed for elimination, 5A may be
eliminated after Silver Line Phase 2 opens Could consider increasing airport fares – if B30 and 5A
both still in service, increase from $7 to $9 would generate approximately $0.8 million

Finance Committee
Item V
December 1, 2016
Subsequent Finance Committee Agenda
Washington
Metropolitan Area
Transit Authority
600 Fifth Street, NW
Washington, DC 20001
202/962-1234
By Metrorail:
Judiciary Square---Red
Line
Gallery Place-Chinatown---
Red, Green and
Yellow Lines
By Metrobus:
Routes D1, D3, D6, P6,
70, 71, 80, X2
A District of Columbia,
Maryland and Virginia
Transit Partnership
Subsequent Finance Committee Agenda December 1, 2016
January 12, 2017
January 26, 2017
I. Information Item A. FY2018 Budget Work Session: Personnel Expenses
(D. Anosike)
I. Information Item A. FY2018 Budget Work Session: Non-Personnel Expenses
(D. Anosike)