agenda 1. announcements 2. bellringer 3. review: observations/inference 4. scientific inquiry ppt 5....
TRANSCRIPT

Agenda
• 1. Announcements• 2. Bellringer• 3. Review: Observations/Inference• 4. Scientific Inquiry PPT• 5. Scientific Inquiry Activity
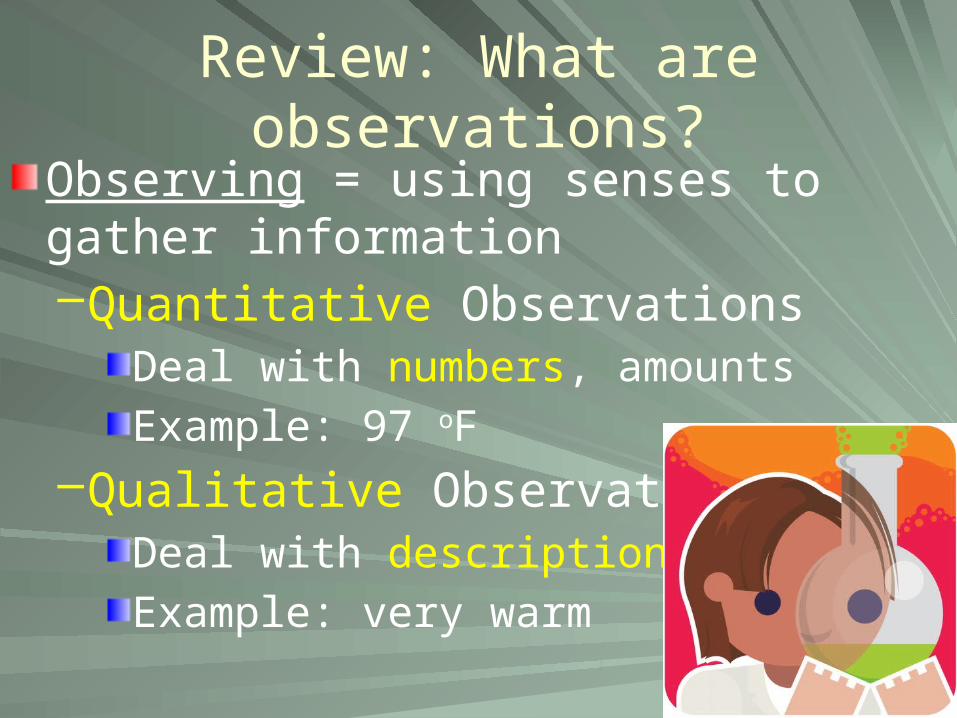
Review: What are observations?
Observing = using senses to gather information–Quantitative Observations
Deal with numbers, amountsExample: 97 oF
–Qualitative ObservationsDeal with descriptionsExample: very warm
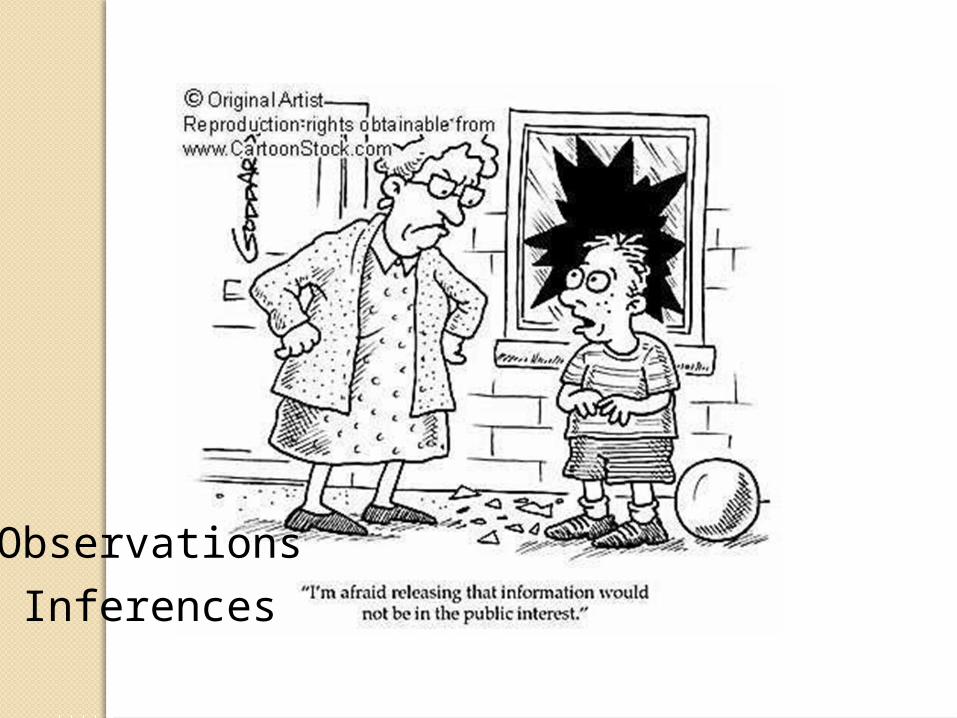
Observations
Inferences

The things that make you go hmmm????
Picture it. Everyday you go for a walk around the lake. There are so many animals and plants. You often hear frogs croaking and hopping along the path. You and your family have been going there for years.
Then suddenly you notice something unusual

A day at the lake!!
• Here is what you see!!


What is scientific inquiry?
• You see something happen, you ask why?• You want to make something happen, you
ask how?• Science is a tool for answering why and
how.

The Scientific Method involves a series of steps that
are used to investigate a
natural occurrence.
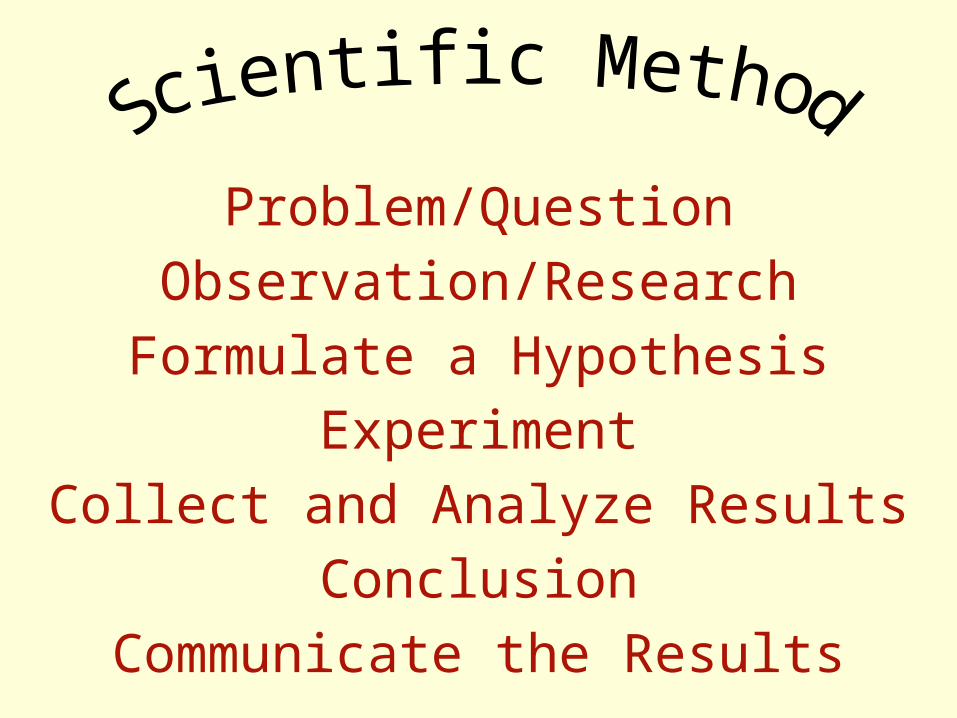
Problem/Question
Observation/Research
Formulate a Hypothesis
Experiment
Collect and Analyze Results
Conclusion
Communicate the Results

Steps of the Scientific Method
1. Problem/Question: Develop a question or problem that can
be solved through experimentation.
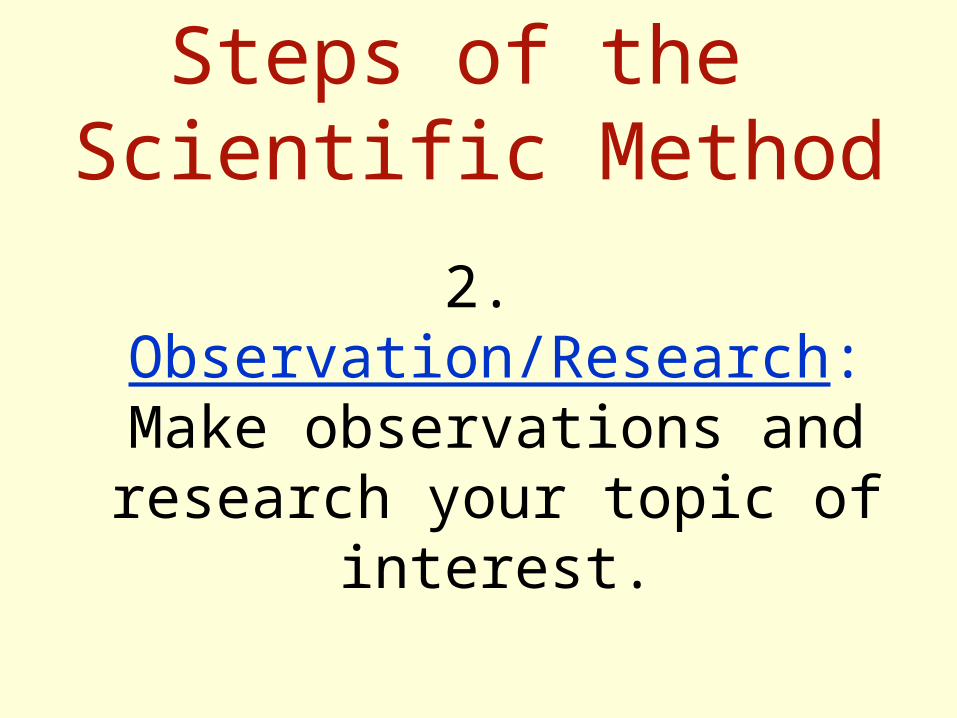
Steps of the Scientific Method
2. Observation/Research: Make observations and research
your topic of interest.

Observations• Any information collected with the senses.
• Quantitative – measureable or countable» 3 meters long
• Qualitative – describable, not measureable » red flowers

Do you remember the next step?

Topic: Scientific Inquiry (Hypotheses)
• EQ: What are the steps of scientific inquiry? (ISN 21)
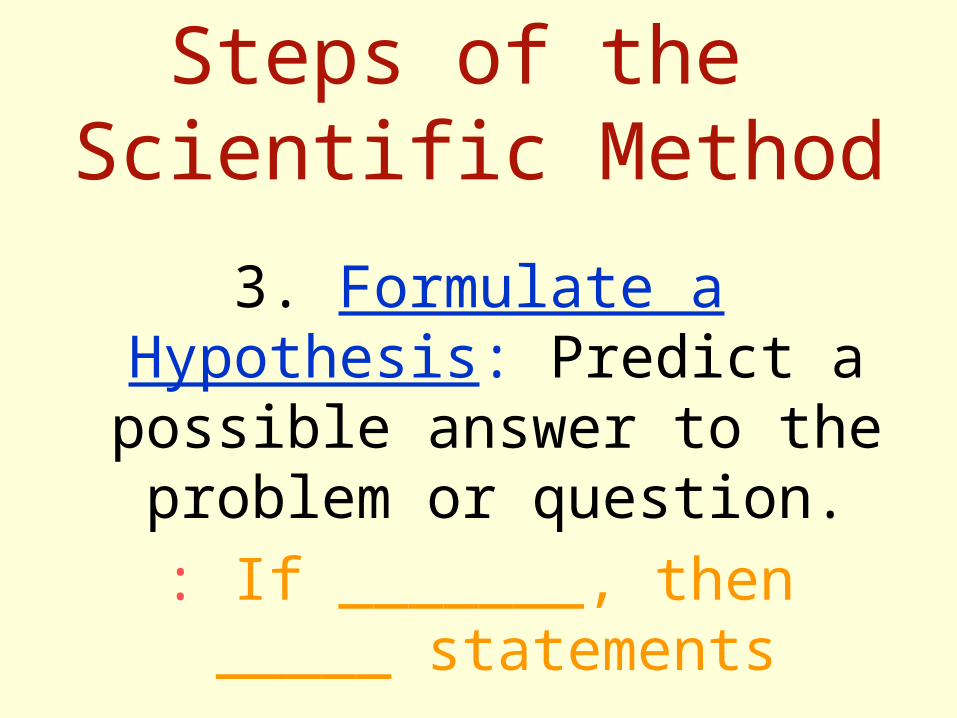
Steps of the Scientific Method
3. Formulate a Hypothesis: Predict a possible answer to
the problem or question.
: If _______, then _____ statements
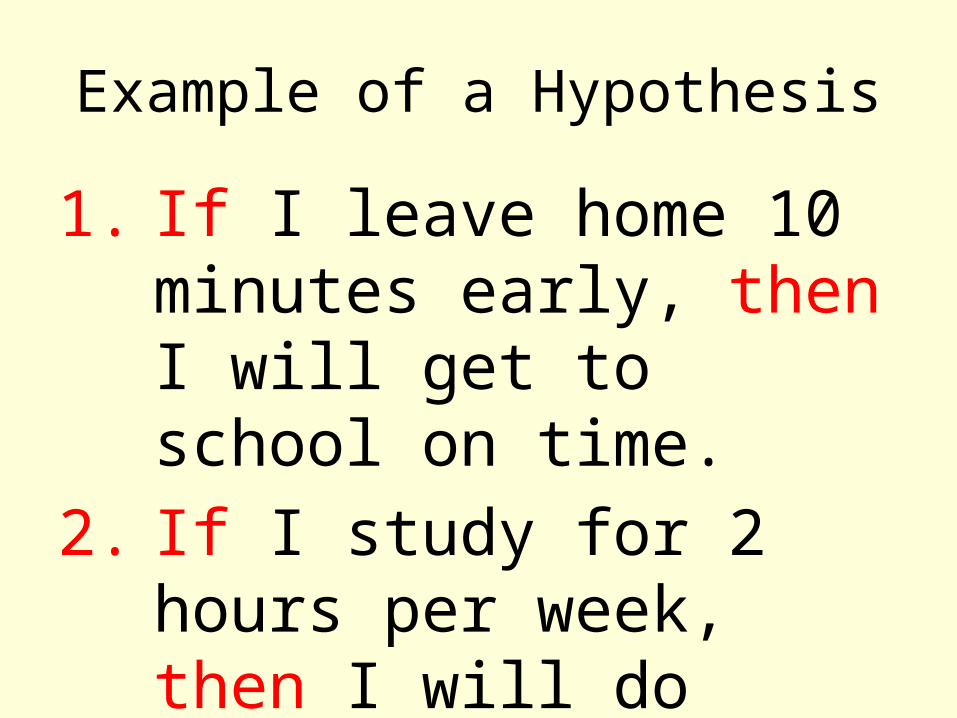
Example of a Hypothesis
1. If I leave home 10 minutes early, then I will get to school on time.
2. If I study for 2 hours per week, then I will do better in science class.

What is a hypothesis?
• A tentative explanation that can be tested and is based on observation or scientific knowledge
• Used to investigate a scientific question
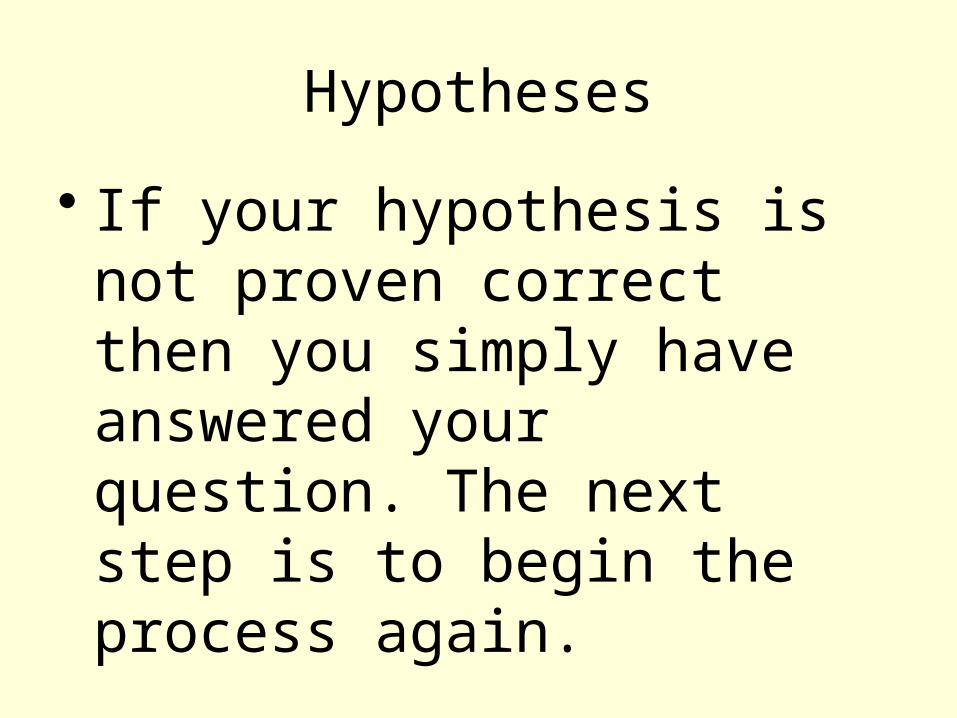
Hypotheses
• If your hypothesis is not proven correct then you simply have answered your question. The next step is to begin the process again.
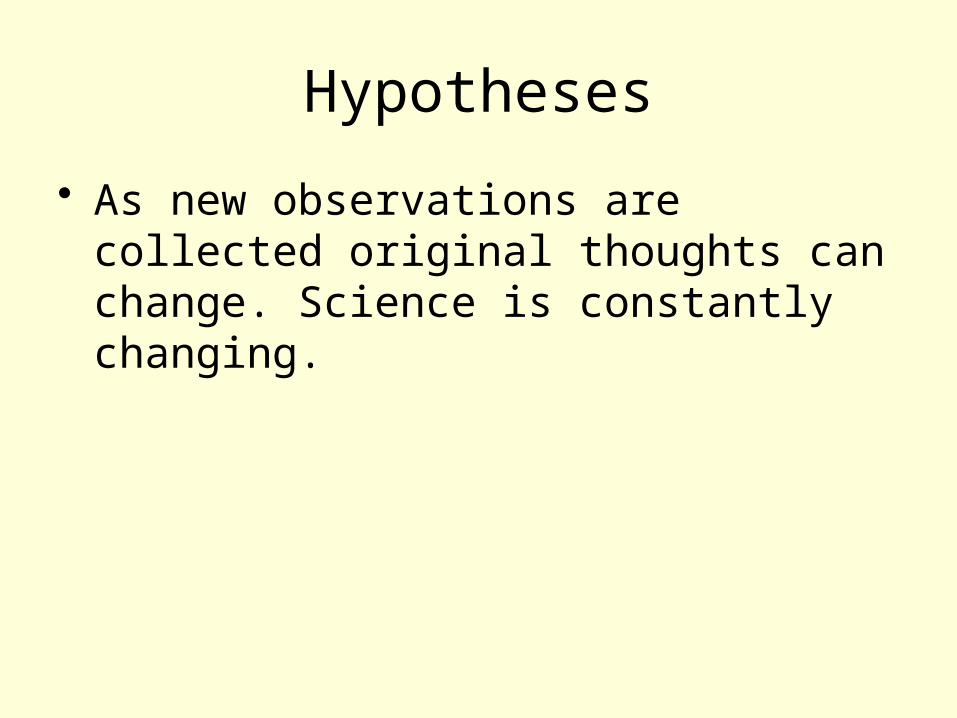
Hypotheses
• As new observations are collected original thoughts can change. Science is constantly changing.
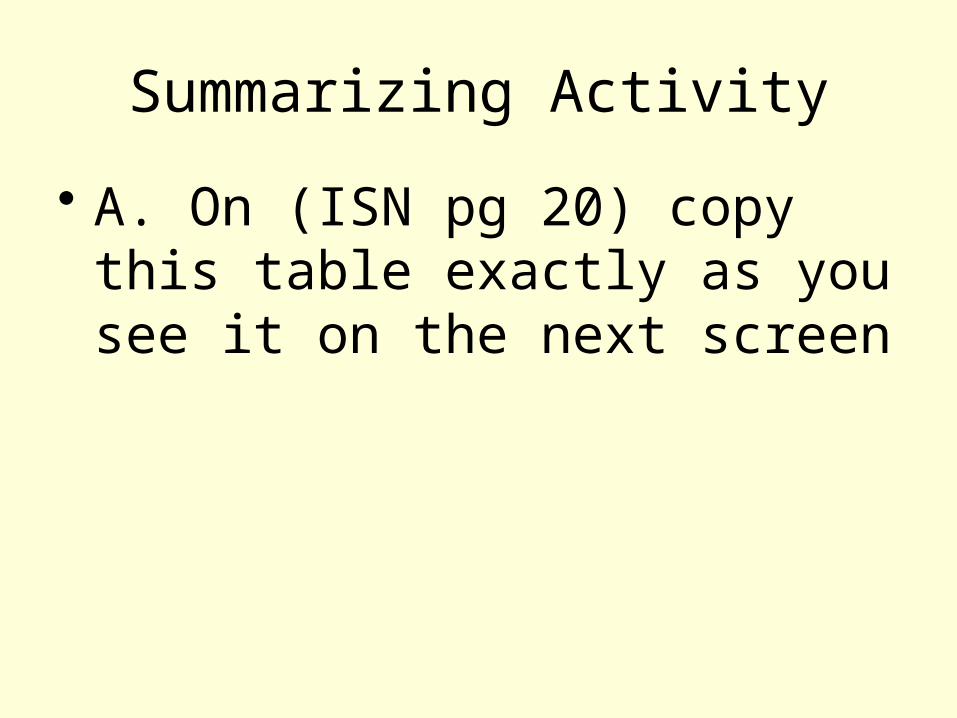
Summarizing Activity
• A. On (ISN pg 20) copy this table exactly as you see it on the next screen

Steps of the Scientific Method
4. Experiment: Develop and follow a procedure.
Include a detailed materials list.
The outcome must be measurable (quantifiable).
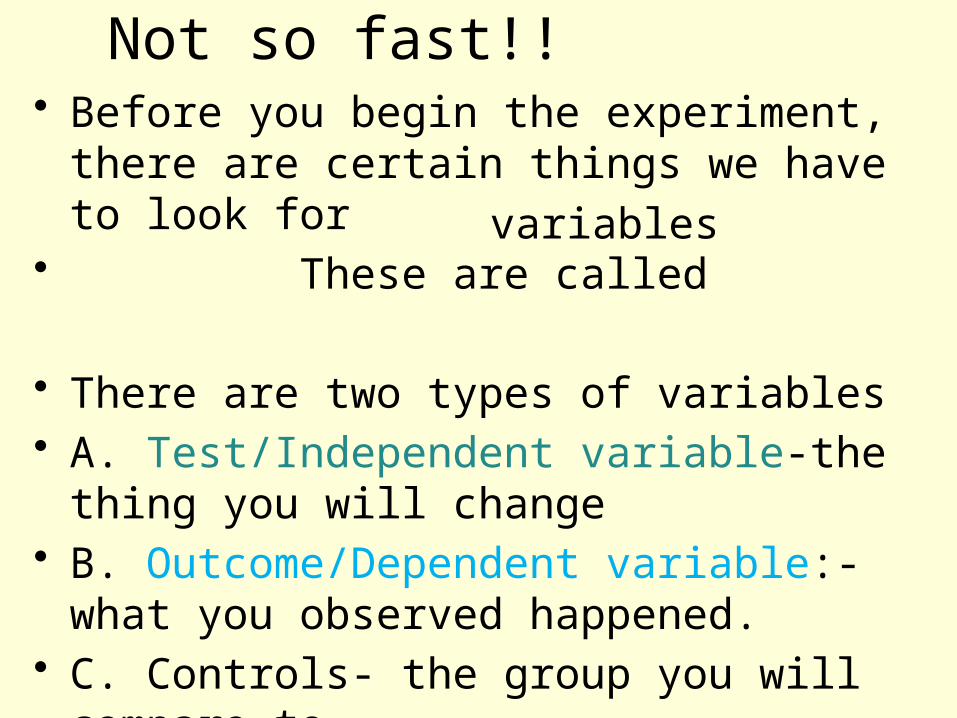
Not so fast!!• Before you begin the experiment, there are
certain things we have to look for• These are called
• There are two types of variables• A. Test/Independent variable-the thing you
will change• B. Outcome/Dependent variable:-what you
observed happened.• C. Controls- the group you will compare to
variables

Test/Independent variables are…
What is being testedWhat is being changedThe ‘cause’ of a change
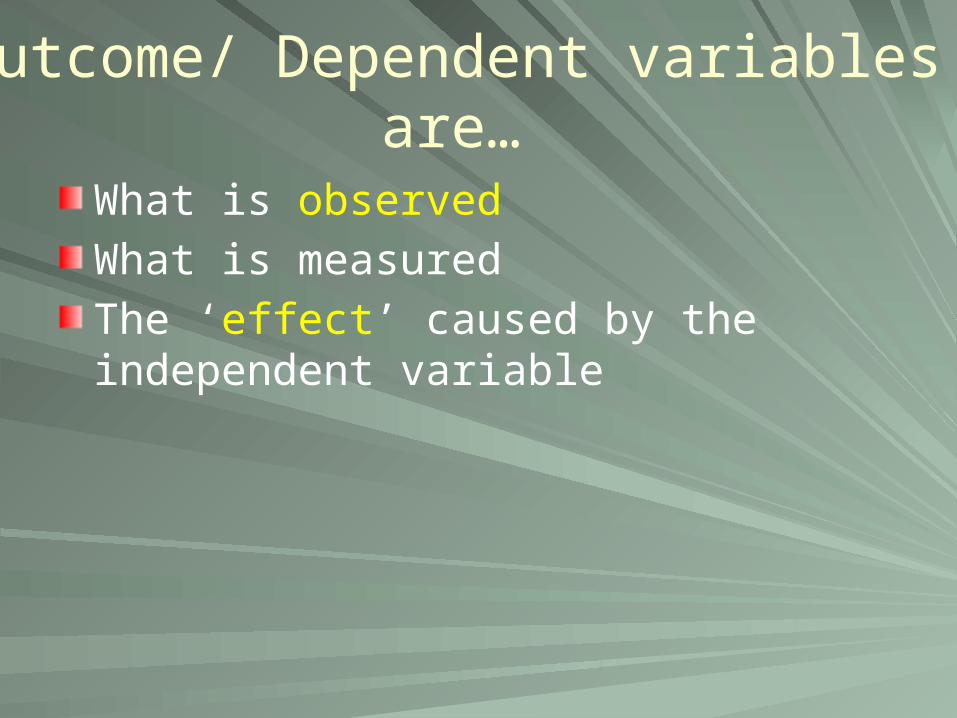
Outcome/ Dependent variables are…
What is observedWhat is measured The ‘effect’ caused by the independent variable
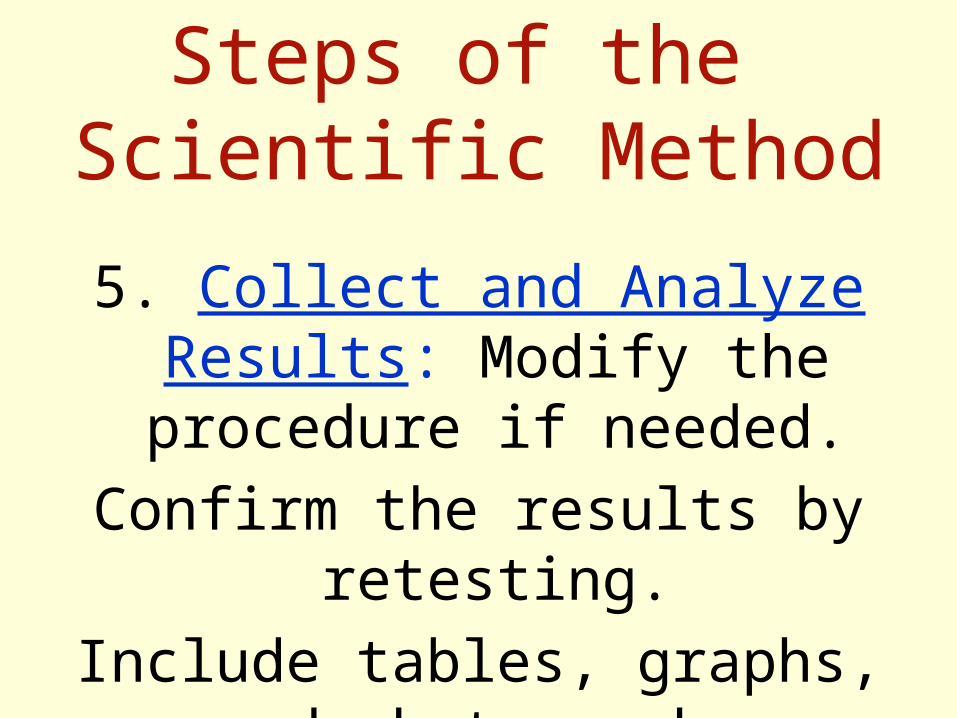
Steps of the Scientific Method
5. Collect and Analyze Results: Modify the procedure if
needed.
Confirm the results by retesting.
Include tables, graphs, and photographs.
Steps of the Scientific Method
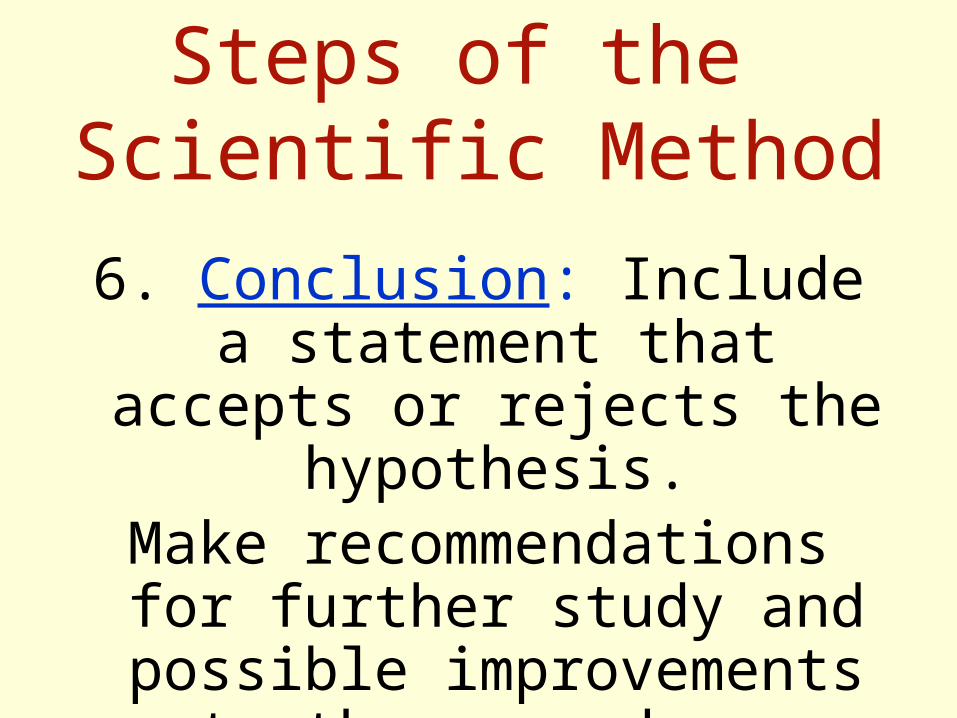
6. Conclusion: Include a statement that accepts or
rejects the hypothesis.Make recommendations for
further study and possible improvements to the
procedure.
Steps of the Scientific Method
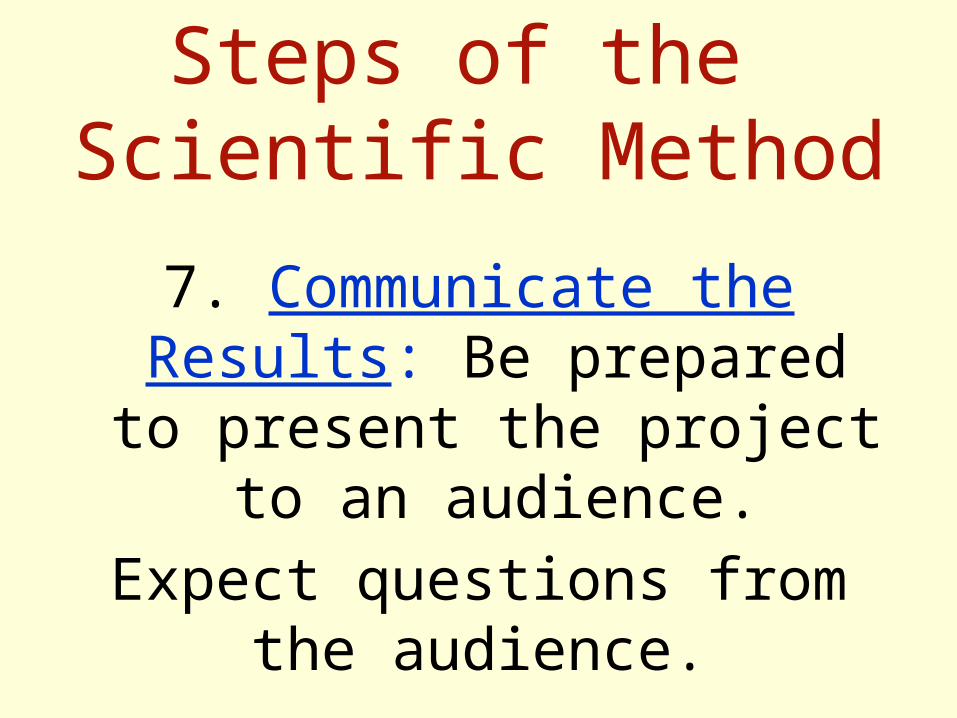
7. Communicate the Results: Be prepared to present the project
to an audience.
Expect questions from the audience.

Observation/Research
John researches the areas of baking and
fermentation and tries to come up with a way
to test his question.
He keeps all of his information on this topic in a journal.
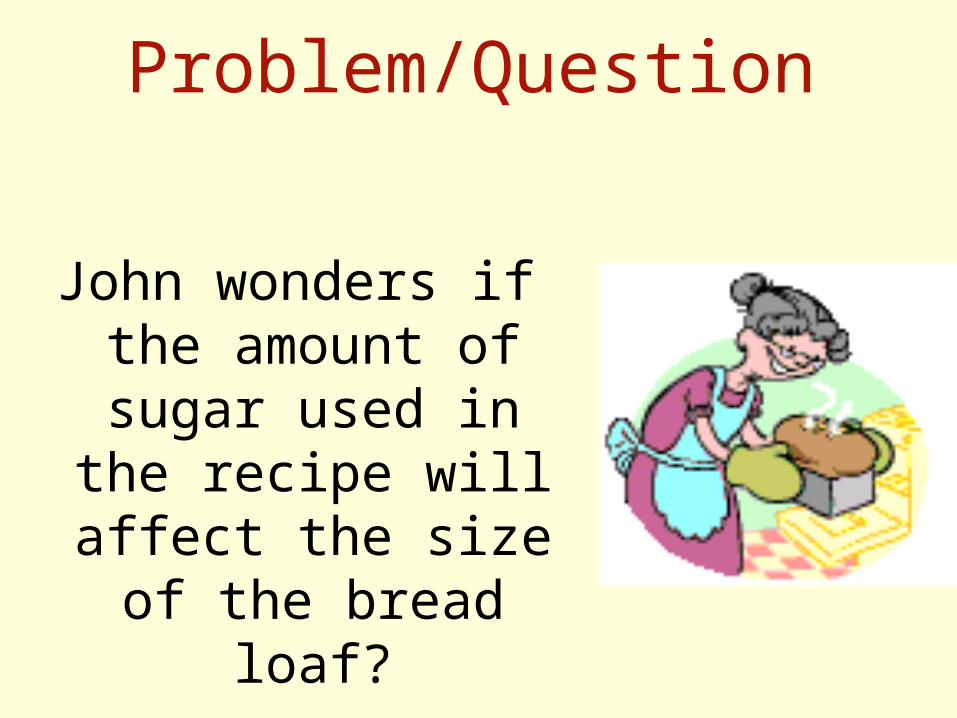
Problem/Question
John wonders if the amount of sugar used in the recipe will affect the size of the bread
loaf?

Problem/Question
John watches his grandmother bake bread. He ask his grandmother what
makes the bread rise.
She explains that yeast releases a gas as it
feeds on sugar.
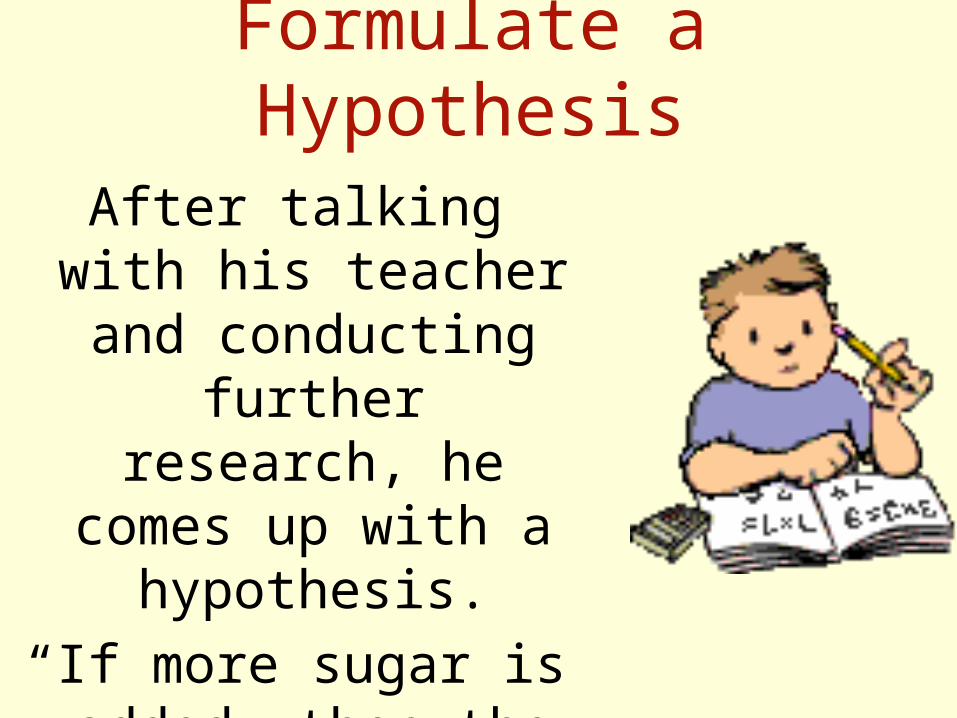
Formulate a Hypothesis
After talking with his teacher and
conducting further research, he comes
up with a hypothesis.
“If more sugar is added, then the bread will rise
higher.”

Experiment
His teacher helps him come up with a
procedure and list of needed materials.
She discusses with John how to
determine the control group.
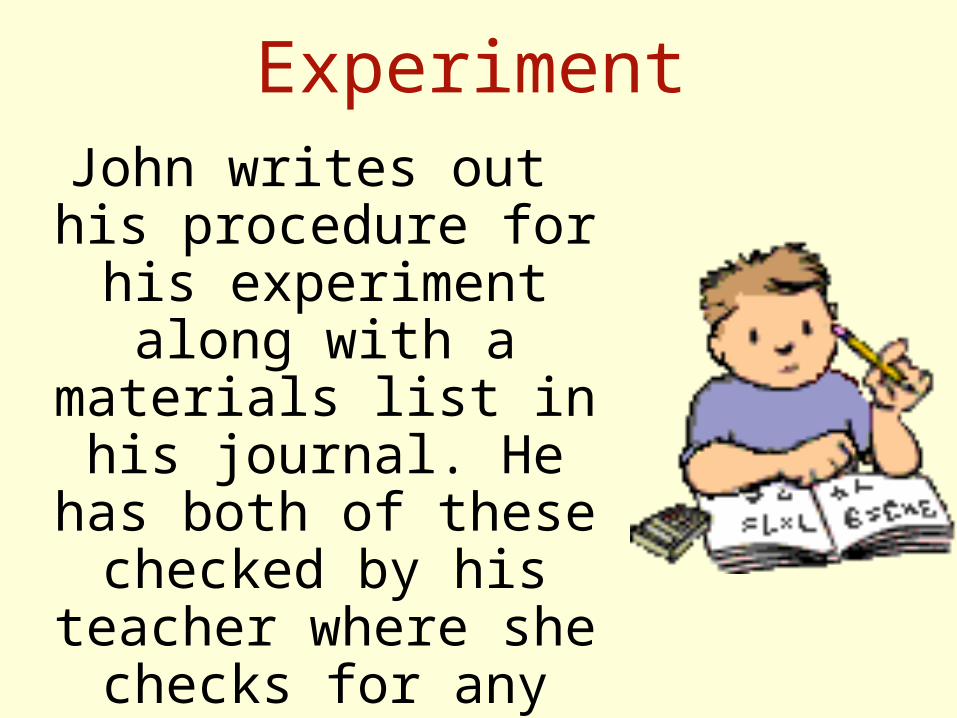
ExperimentJohn writes out his
procedure for his experiment along with a materials list in his
journal. He has both of these checked by his
teacher where she checks for any safety
concerns.

Experiment
Once again, John gathers his materials and carries out his
experiment.
.

Collect and Analyze Results
John comes up with a table he can use to record his data.John gets all his materials together and carries out his
experiment.
Collect and Analyze Results
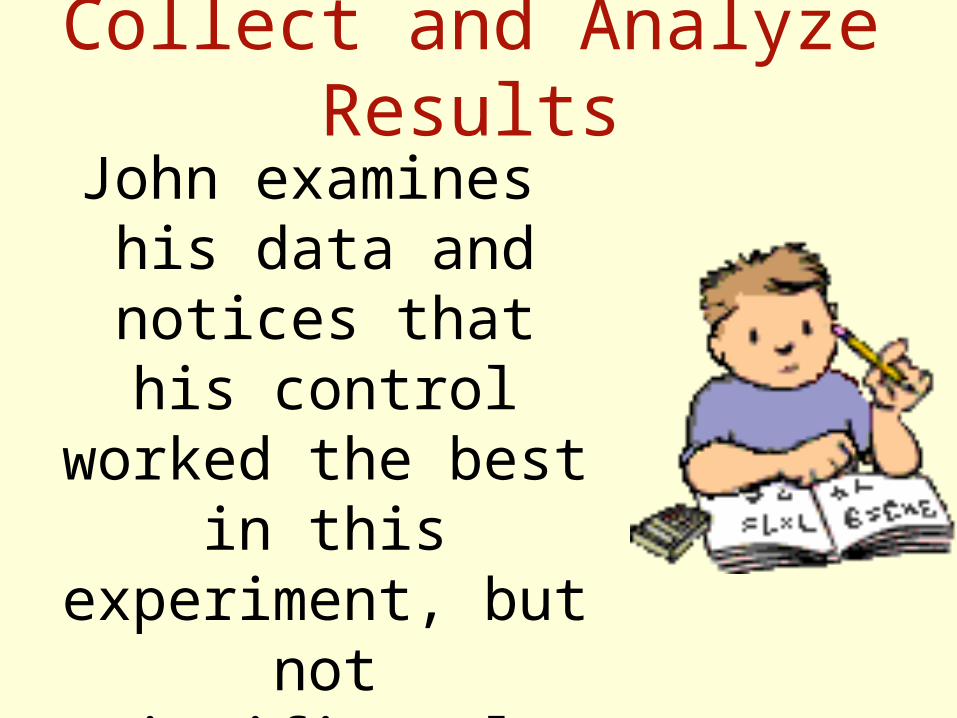
John examines his data and notices that
his control worked the best in this
experiment, but not significantly better
than 100g. of sugar.

Size of Baked Bread (LxWxH) cm3
Amt. of Sugar (g.)
1 2 3 AverageSize (cm3)
25 768 744 761 758
50 1296 1188 1296 1260
100 1188 1080 1080 1116
250 672 576 588 612
500 432 504 360 432
Size of Bread Loaf (cm3)
Trials
Control group
Conclusion
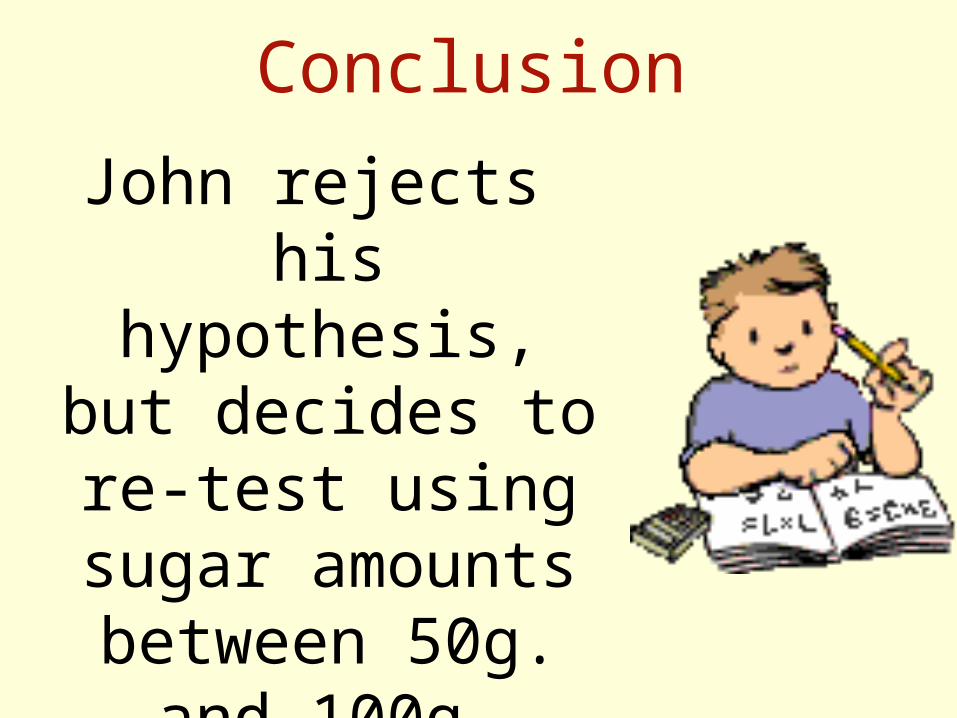
John rejects his hypothesis, but
decides to re-test using sugar
amounts between 50g. and 100g.

Conclusion
John finds that 70g. of sugar produces
the largest loaf.
His hypothesis is accepted.

Communicate the Results
John tells his grandmother about
his findings and prepares to present
his project in Science class.
Think you can name all seven steps?
Problem/QuestionObservation/ResearchFormulate a HypothesisExperimentCollect and Analyze ResultsConclusionCommunicate the Results

Homework:
• A. Create a visual vocabulary sheet on the scientific method:
• 1. Picture representing each step• 2. Explanation in your own words to
describe the step.Problem/Question
Observation/ResearchFormulate a Hypothesis
ExperimentCollect and Analyze Results
ConclusionCommunicate the Results

Application of the Scientific Method• Problem:
• You recently purchased a new plant from your hardware store. You water the plant everyday according to the directions, and notice the plant is beginning to wilt.
• Apply the steps of the scientific method to this situation. Be prepared to share with the class
Let’s put our knowledge of the Scientific Method to a realistic
example that includes some of the terms you’ll be needing to use and
understand.
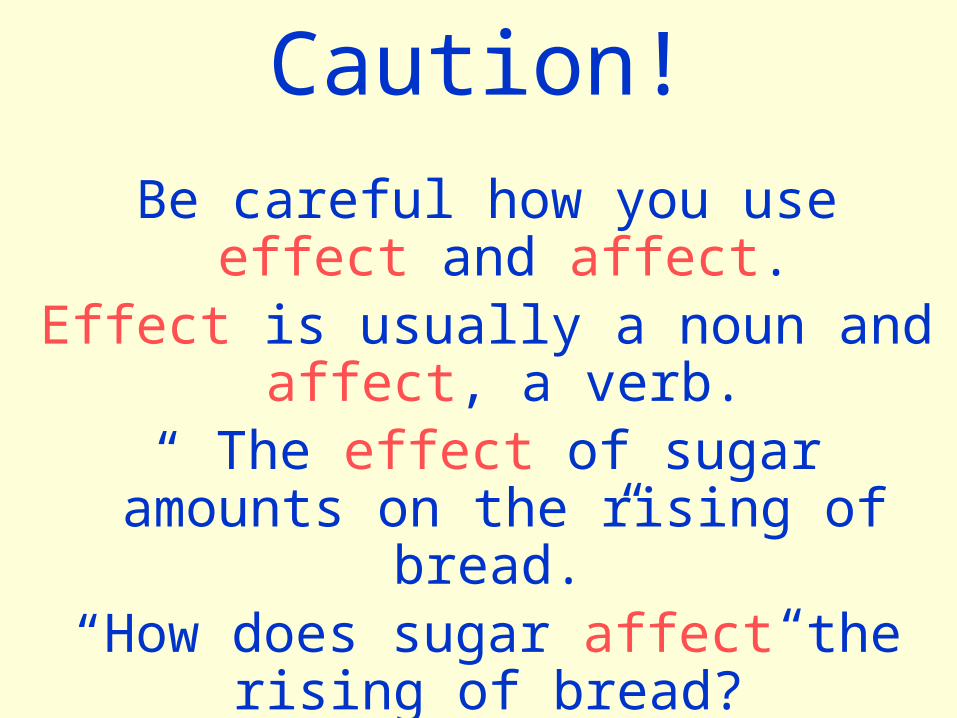
Caution!
Be careful how you use effect and affect.
Effect is usually a noun and affect, a verb.
“ The effect of sugar amounts on the rising of bread.”
“How does sugar affect the rising of bread?”
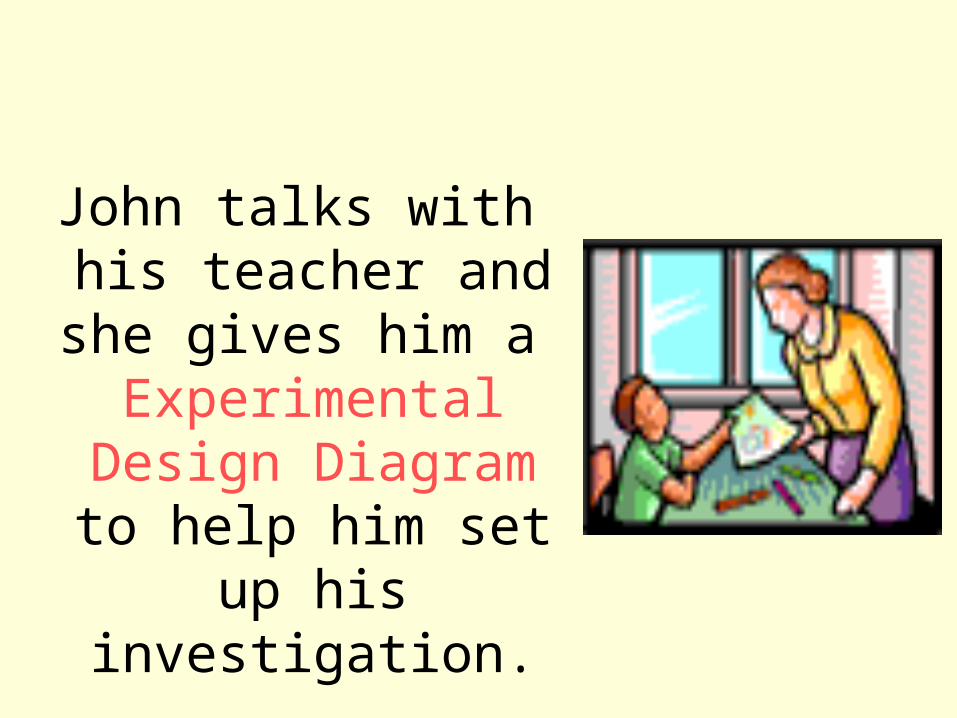
John talks with his teacher and she gives him a Experimental Design Diagram to help him set up his
investigation.


Hypothesis
The hypothesis is an educated guess about the relationship
between the independent and dependent variables.
Note: These variables will be defined in the next few slides.
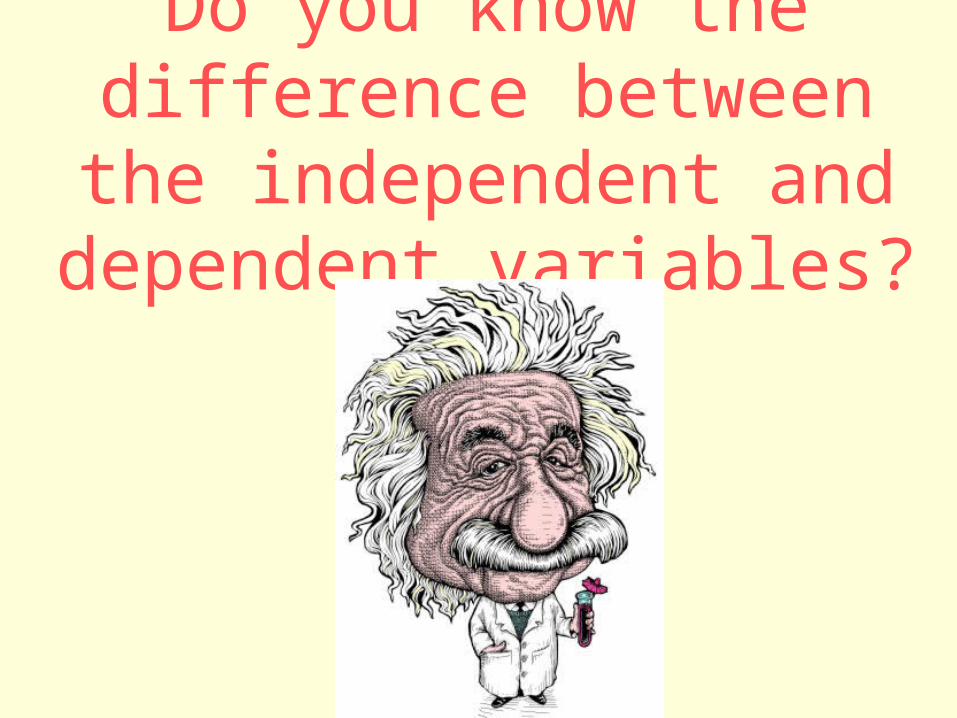
Do you know the difference between the independent and dependent variables?

Independent Variable The independent, or test variable, is a factor that’s intentionally varied by the
experimenter.John is going to use 25g., 50g.,
100g., 250g., 500g. of sugar in his experiment.

Dependent Variable The dependent, or outcome variable, is the factor that may change as a result of changes
made in the independent variable.
In this case, it would be the size of the loaf of bread.

Control Group
In a scientific experiment, the control is the group that serves as the standard of comparison.
The control group may be a “no treatment" or an “experimenter
selected” group.

Control Group
The control group is exposed to the same conditions as the
experimental group, except for the variable being tested.
All experiments should have a control group.
Control Group
Because his grandmother always used 50g. of sugar in
her recipe, John is going to use that amount in his control
group.

Constants
John’s teacher reminds him to keep all other factors the same so that any observed
changes in the bread can be attributed to the variation in the amount of sugar.

Constants
The constants in an experiment are all the
factors that the experimenter attempts
to keep the same.

Can you think of some constants for this
experiment?

ConstantsThey might include:
Other ingredients to the bread recipe, oven used,
rise time, brand of ingredients, cooking time,
type of pan used, air temperature and humidity
where the bread was rising, oven temperature,
age of the yeast…

Trials
Trials refer to replicate groups that are exposed to the same conditions
in an experiment.
John is going to test each sugar variable 3 times.
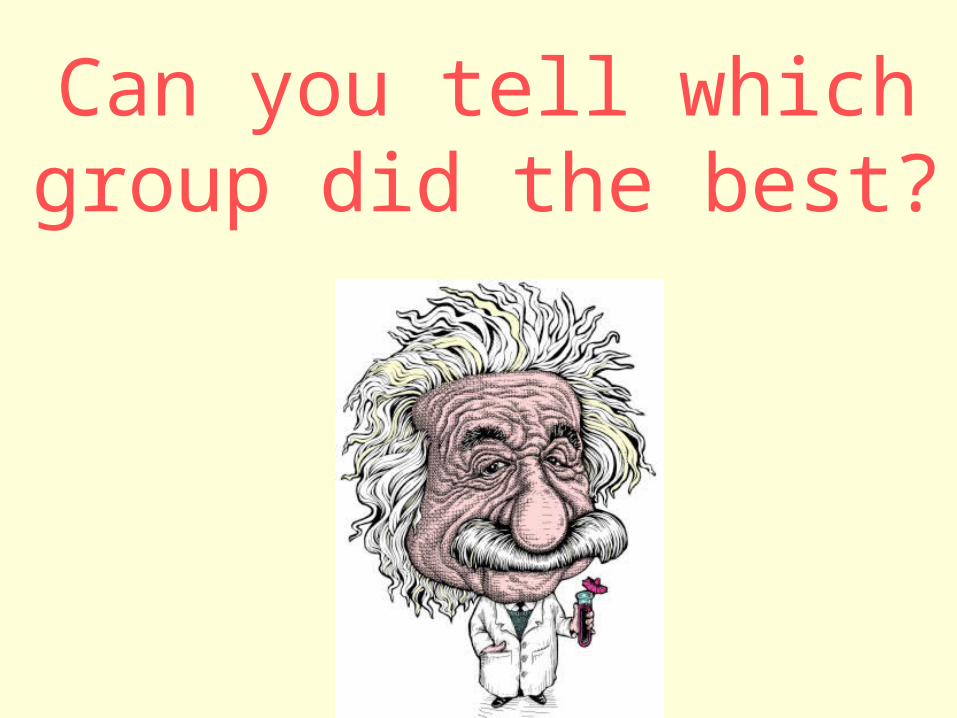
Can you tell which group did the best?

Size of Baked Bread (LxWxH) cm3
Amt. of Sugar (g.)
1 2 3 AverageSize (cm3)
50 1296 1440 1296 1344
60 1404 1296 1440 1380
70 1638 1638 1560 1612
80 1404 1296 1296 1332
90 1080 1200 972 1084
Size of Bread Loaf (cm3)
Trials
Control group
