agency workers’ compensation and safety report · emergency management agency 16 environmental...
TRANSCRIPT

Agency Workers’ Compensation and Safety Report
FY 2013-2014

Table of Contents
Executive Summary 1
Commonwealth Benchmarks 2 Agencies with the Highest Claims Rates 2 Agencies with the Highest Cost Rates 2 Agencies with Increased Claims Rates 3 Agencies with Reduced Claims Rates 3 Agencies with the Lowest Frequency Rates 4 Agencies with Zero Claims 4
Commonwealth and Agency Data 6
Explanation of Metrics 6 Three-Year Analysis 7 Detailed Data 9 Commonwealth Totals 9 Aging 10 Agriculture 10 Attorney General 11 Auditor General 11 Banking and Securities 12 Capitol Preservation Committee 12 Civil Service Commission 13 Community and Economic Development 13 Conservation and Natural Resources 14 Corrections 14 Drug and Alcohol Programs 15 Education 15 Emergency Management Agency 16 Environmental Protection 16 Ethics Commission 17 Executive Offices/Human Relations Commission 17 Fish and Boat Commission 18 Game Commission 18 Gaming Control Board 19 General Services 19 Governor’s Office 20 Health 20 Historical and Museum Commission 21 House of Representatives 21

Table of Contents (continued)
Human Services 22 Insurance 22 Labor and Industry 23 Legislative Reference Bureau 23 Liquor Control Board 24 Military and Veterans Affairs 24 Milk Marketing Board 25 Municipal Retirement System 25 Philadelphia Regional Port Authority 26 Probation and Parole 26 Public School Employees’ Retirement System 27 Public Utility Commission 27 Revenue 28 Senate 28 State 29 State Employees’ Retirement System 29 State Police 30 Thaddeus Stevens College of Technology 30 Transportation 31 Treasury 31
Executive Summary The safety and well-being of our employees is of the utmost importance. Yet, each
year, the commonwealth pays over $120 million to employees and medical providers because of injuries suffered on the job. As a participant in the commonwealth’s workers’ compensation program, your agency makes an annual
contribution to the fund based on its safety performance.
There are also indirect costs from workplace injuries. These can include lost productivity due to the absence of an injured employee, increased workloads for co-
workers of the injured employee, lower morale and damage to your agency’s reputation as a safe place to work.
You are no doubt already aware of your agency’s injuries and claims. This report is an opportunity for you to compare your performance to other agencies and against
the commonwealth’s benchmarks. Regardless of your agency’s metrics, as budgets become even tighter, we need to
look for ways to reduce program costs. Improving your agency’s safety program is one way to achieve a cost reduction.
I challenge each of you to be creative in finding ways to promote safety and manage the agency’s safety program. Additionally, if your agency needs assistance
evaluating its program or identifying ways to improve, the OA Bureau of Employee Absences and Safety is available to assist. Please do not hesitate to take advantage
of this valuable resource. Questions about the metrics can be sent to Rene Russell, Commonwealth Safety
and Health Consultant Manager, or Sherri Keiter-Reed, Director of the OA Bureau of Employee Absences and Safety, at [email protected] or at 717.346.4667.
1
Commonwealth Benchmarks
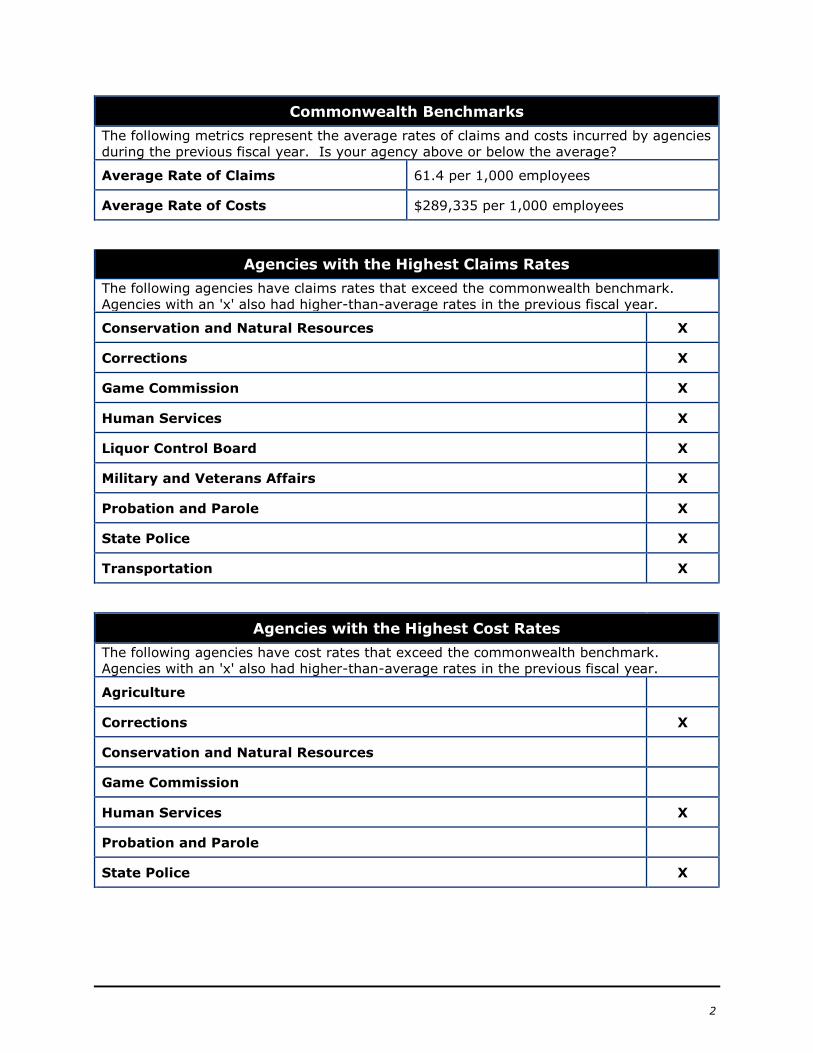
The following metrics represent the average rates of claims and costs incurred by agencies
during the previous fiscal year. Is your agency above or below the average?
Average Rate of Claims 61.4 per 1,000 employees
Average Rate of Costs $289,335 per 1,000 employees
Agencies with the Highest Claims Rates
The following agencies have claims rates that exceed the commonwealth benchmark.
Agencies with an 'x' also had higher-than-average rates in the previous fiscal year.
Conservation and Natural Resources X
Corrections X
Game Commission X
Human Services X
Liquor Control Board X
Military and Veterans Affairs X
Probation and Parole X
State Police X
Transportation X
Agencies with the Highest Cost Rates
The following agencies have cost rates that exceed the commonwealth benchmark.
Agencies with an 'x' also had higher-than-average rates in the previous fiscal year.
Agriculture
Corrections X
Conservation and Natural Resources
Game Commission
Human Services X
Probation and Parole
State Police X
2

Agencies with Increased Claims Rates
The following agencies have shown an increase in their claims rate for each consecutive
year.
Attorney General
Banking and Securities
Civil Service Commission
Corrections
House of Representatives
Legislative Reference Bureau
Senate
State
Thaddeus Stevens College of Technology
Agencies with Reduced Claims Rates
The following agencies have reduced their claims rate for each consecutive year.
Aging
Agriculture
Emergency Management Agency
Executive Offices/Human Relations Commission
Game Commission
Human Services
Labor and Industry
Military and Veterans Affairs
3

Agencies with the Lowest Frequency Rates
The following agencies have claims frequency rates below 15 per 1,000 employees.
Agencies with a star also had low frequency rates in the previous fiscal year. Agencies
with zero total claims are recognized in the next section.
Auditor General
Community and Economic Development
Emergency Management Agency ★
Education ★
Gaming Control Board
Insurance ★
Legislative Reference Bureau ★
Public School Employees' Retirement System ★
State Employees’ Retirement System ★
Treasury ★
Agencies with the Zero Claims
The following agencies had no claims in the previous fiscal year. Agencies with a star also
had zero claims in the previous fiscal year.
Aging
Capitol Preservation Committee ★
Center for Rural Pennsylvania ★
E-Health Partnership Authority ★
Ethics Commission
Environmental Hearing Board ★
Health Care Cost Containment Council ★
Independent Fiscal Office ★
Independent Regulatory Review Commission ★
Joint Legislative Air and Water Conservation Committee ★
Joint State Government Commission ★
Legislative Budget and Finance Committee ★
4

Legislative Data Processing Center ★
Lieutenant Governor's Office ★
Local Government Commission ★
PA Infrastructure Investment Authority (PENNVEST) ★
State Public School Building Authority ★
5
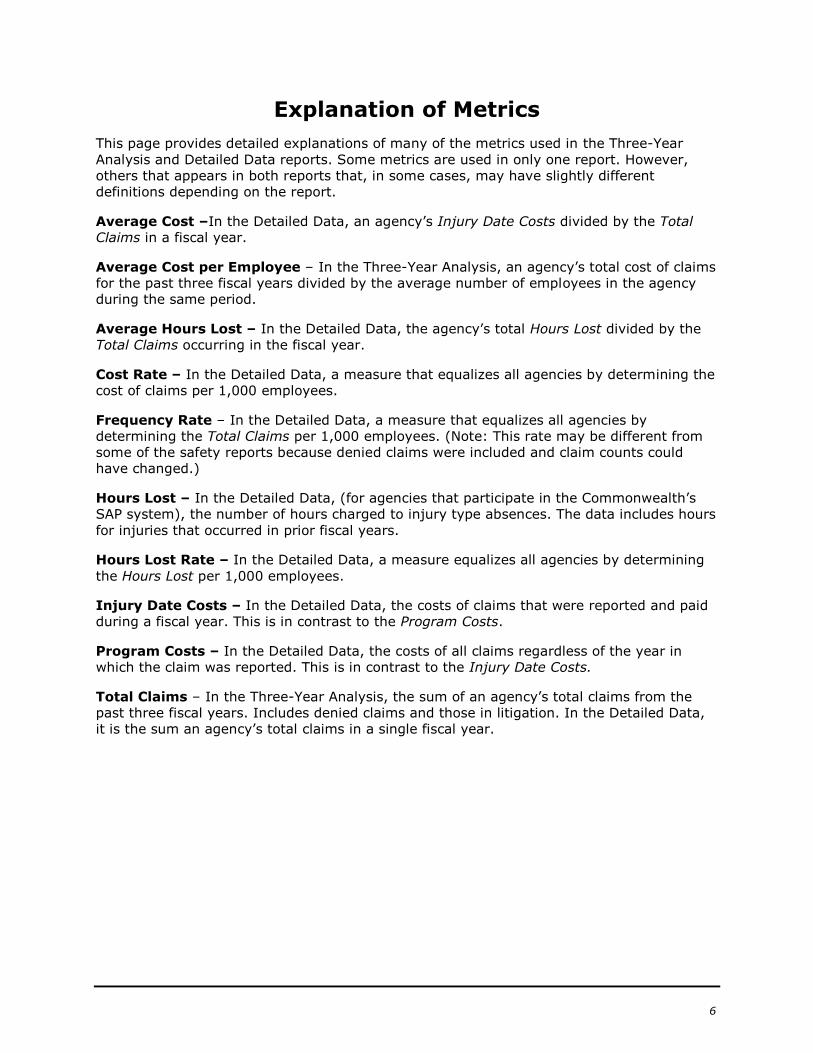
Explanation of Metrics
This page provides detailed explanations of many of the metrics used in the Three-Year
Analysis and Detailed Data reports. Some metrics are used in only one report. However,
others that appears in both reports that, in some cases, may have slightly different
definitions depending on the report.
Average Cost –In the Detailed Data, an agency’s Injury Date Costs divided by the Total
Claims in a fiscal year.
Average Cost per Employee – In the Three-Year Analysis, an agency’s total cost of claims
for the past three fiscal years divided by the average number of employees in the agency
during the same period.
Average Hours Lost – In the Detailed Data, the agency’s total Hours Lost divided by the
Total Claims occurring in the fiscal year.
Cost Rate – In the Detailed Data, a measure that equalizes all agencies by determining the
cost of claims per 1,000 employees.
Frequency Rate – In the Detailed Data, a measure that equalizes all agencies by
determining the Total Claims per 1,000 employees. (Note: This rate may be different from
some of the safety reports because denied claims were included and claim counts could
have changed.)
Hours Lost – In the Detailed Data, (for agencies that participate in the Commonwealth’s
SAP system), the number of hours charged to injury type absences. The data includes hours
for injuries that occurred in prior fiscal years.
Hours Lost Rate – In the Detailed Data, a measure equalizes all agencies by determining
the Hours Lost per 1,000 employees.
Injury Date Costs – In the Detailed Data, the costs of claims that were reported and paid
during a fiscal year. This is in contrast to the Program Costs.
Program Costs – In the Detailed Data, the costs of all claims regardless of the year in
which the claim was reported. This is in contrast to the Injury Date Costs.
Total Claims – In the Three-Year Analysis, the sum of an agency’s total claims from the
past three fiscal years. Includes denied claims and those in litigation. In the Detailed Data,
it is the sum an agency’s total claims in a single fiscal year.
6
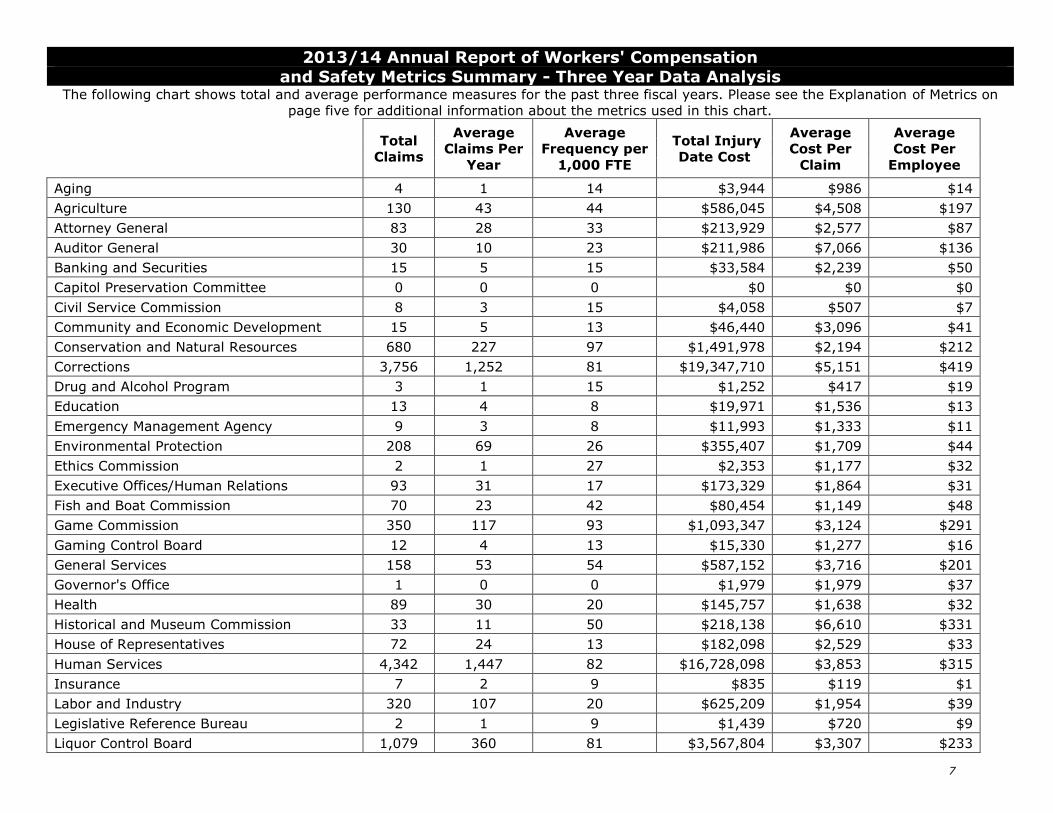
2013/14 Annual Report of Workers' Compensation
and Safety Metrics Summary - Three Year Data Analysis The following chart shows total and average performance measures for the past three fiscal years. Please see the Explanation of Metrics on
page five for additional information about the metrics used in this chart.
Total
Claims
Average
Claims Per
Year
Average
Frequency per
1,000 FTE
Total Injury
Date Cost
Average
Cost Per
Claim
Average
Cost Per
Employee
Aging 4 1 14 $3,944 $986 $14
Agriculture 130 43 44 $586,045 $4,508 $197
Attorney General 83 28 33 $213,929 $2,577 $87
Auditor General 30 10 23 $211,986 $7,066 $136
Banking and Securities 15 5 15 $33,584 $2,239 $50
Capitol Preservation Committee 0 0 0 $0 $0 $0
Civil Service Commission 8 3 15 $4,058 $507 $7
Community and Economic Development 15 5 13 $46,440 $3,096 $41
Conservation and Natural Resources 680 227 97 $1,491,978 $2,194 $212
Corrections 3,756 1,252 81 $19,347,710 $5,151 $419
Drug and Alcohol Program 3 1 15 $1,252 $417 $19
Education 13 4 8 $19,971 $1,536 $13
Emergency Management Agency 9 3 8 $11,993 $1,333 $11
Environmental Protection 208 69 26 $355,407 $1,709 $44
Ethics Commission 2 1 27 $2,353 $1,177 $32
Executive Offices/Human Relations 93 31 17 $173,329 $1,864 $31
Fish and Boat Commission 70 23 42 $80,454 $1,149 $48
Game Commission 350 117 93 $1,093,347 $3,124 $291
Gaming Control Board 12 4 13 $15,330 $1,277 $16
General Services 158 53 54 $587,152 $3,716 $201
Governor's Office 1 0 0 $1,979 $1,979 $37
Health 89 30 20 $145,757 $1,638 $32
Historical and Museum Commission 33 11 50 $218,138 $6,610 $331
House of Representatives 72 24 13 $182,098 $2,529 $33
Human Services 4,342 1,447 82 $16,728,098 $3,853 $315
Insurance 7 2 9 $835 $119 $1
Labor and Industry 320 107 20 $625,209 $1,954 $39
Legislative Reference Bureau 2 1 9 $1,439 $720 $9
Liquor Control Board 1,079 360 81 $3,567,804 $3,307 $233
7
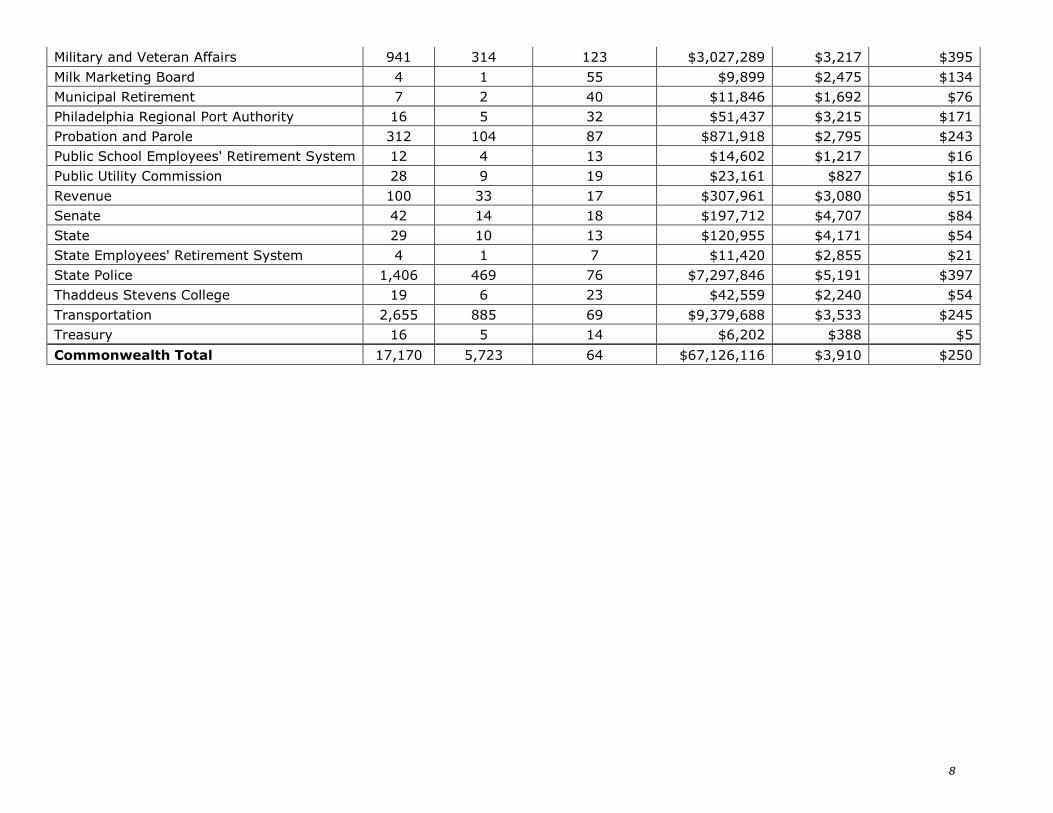
Military and Veteran Affairs 941 314 123 $3,027,289 $3,217 $395
Milk Marketing Board 4 1 55 $9,899 $2,475 $134
Municipal Retirement 7 2 40 $11,846 $1,692 $76
Philadelphia Regional Port Authority 16 5 32 $51,437 $3,215 $171
Probation and Parole 312 104 87 $871,918 $2,795 $243
Public School Employees' Retirement System 12 4 13 $14,602 $1,217 $16
Public Utility Commission 28 9 19 $23,161 $827 $16
Revenue 100 33 17 $307,961 $3,080 $51
Senate 42 14 18 $197,712 $4,707 $84
State 29 10 13 $120,955 $4,171 $54
State Employees' Retirement System 4 1 7 $11,420 $2,855 $21
State Police 1,406 469 76 $7,297,846 $5,191 $397
Thaddeus Stevens College 19 6 23 $42,559 $2,240 $54
Transportation 2,655 885 69 $9,379,688 $3,533 $245
Treasury 16 5 14 $6,202 $388 $5
Commonwealth Total 17,170 5,723 64 $67,126,116 $3,910 $250
8
2013/2014 Annual Report of Workers' Compensation and Safety Metrics
Lost Time Medical Only Fatality Total Claims Lost Time Medical Only Total Claims Lost Time Medical Only Total Claims
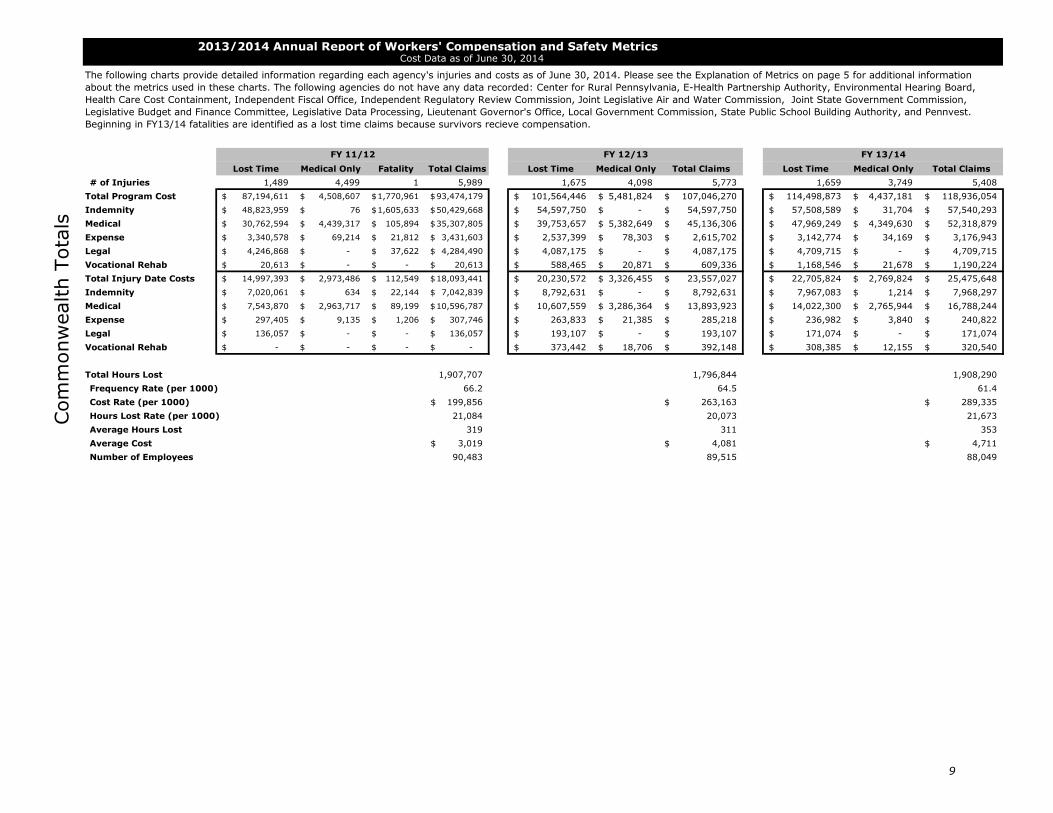
# of Injuries 1,489 4,499 1 5,989 1,675 4,098 5,773 1,659 3,749 5,408
Total Program Cost 87,194,611$ 4,508,607$ 1,770,961$ 93,474,179$ 101,564,446$ 5,481,824$ 107,046,270$ 114,498,873$ 4,437,181$ 118,936,054$
Indemnity 48,823,959$ 76$ 1,605,633$ 50,429,668$ 54,597,750$ -$ 54,597,750$ 57,508,589$ 31,704$ 57,540,293$
Medical 30,762,594$ 4,439,317$ 105,894$ 35,307,805$ 39,753,657$ 5,382,649$ 45,136,306$ 47,969,249$ 4,349,630$ 52,318,879$
Expense 3,340,578$ 69,214$ 21,812$ 3,431,603$ 2,537,399$ 78,303$ 2,615,702$ 3,142,774$ 34,169$ 3,176,943$
Legal 4,246,868$ -$ 37,622$ 4,284,490$ 4,087,175$ -$ 4,087,175$ 4,709,715$ -$ 4,709,715$
Vocational Rehab 20,613$ -$ -$ 20,613$ 588,465$ 20,871$ 609,336$ 1,168,546$ 21,678$ 1,190,224$
Total Injury Date Costs 14,997,393$ 2,973,486$ 112,549$ 18,093,441$ 20,230,572$ 3,326,455$ 23,557,027$ 22,705,824$ 2,769,824$ 25,475,648$
Indemnity 7,020,061$ 634$ 22,144$ 7,042,839$ 8,792,631$ -$ 8,792,631$ 7,967,083$ 1,214$ 7,968,297$
Medical 7,543,870$ 2,963,717$ 89,199$ 10,596,787$ 10,607,559$ 3,286,364$ 13,893,923$ 14,022,300$ 2,765,944$ 16,788,244$
Expense 297,405$ 9,135$ 1,206$ 307,746$ 263,833$ 21,385$ 285,218$ 236,982$ 3,840$ 240,822$
Legal 136,057$ -$ -$ 136,057$ 193,107$ -$ 193,107$ 171,074$ -$ 171,074$
Vocational Rehab -$ -$ -$ -$ 373,442$ 18,706$ 392,148$ 308,385$ 12,155$ 320,540$
Total Hours Lost 1,907,707 1,796,844 1,908,290
Frequency Rate (per 1000) 66.2 64.5 61.4
Cost Rate (per 1000) 199,856$ 263,163$ 289,335$
Hours Lost Rate (per 1000) 21,084 20,073 21,673
Average Hours Lost 319 311 353
Average Cost 3,019$ 4,081$ 4,711$
Number of Employees 90,483 89,515 88,049
Cost Data as of June 30, 2014
FY 13/14FY 11/12
Com
monw
ealth T
ota
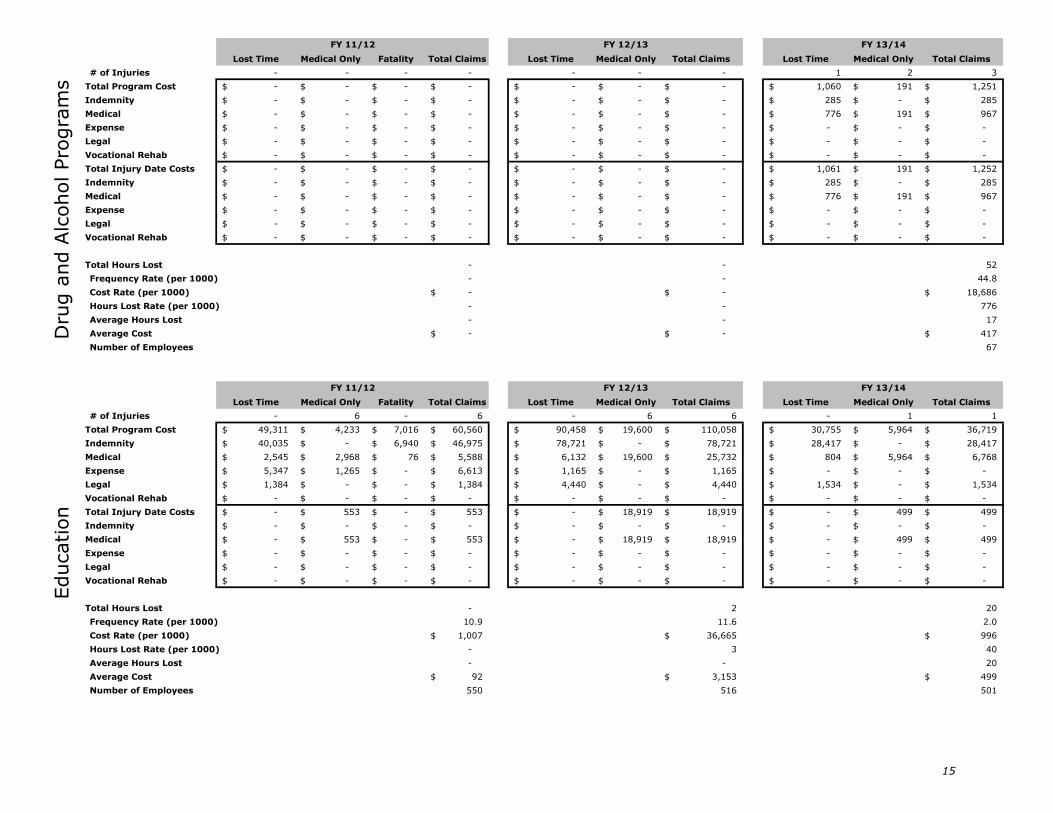
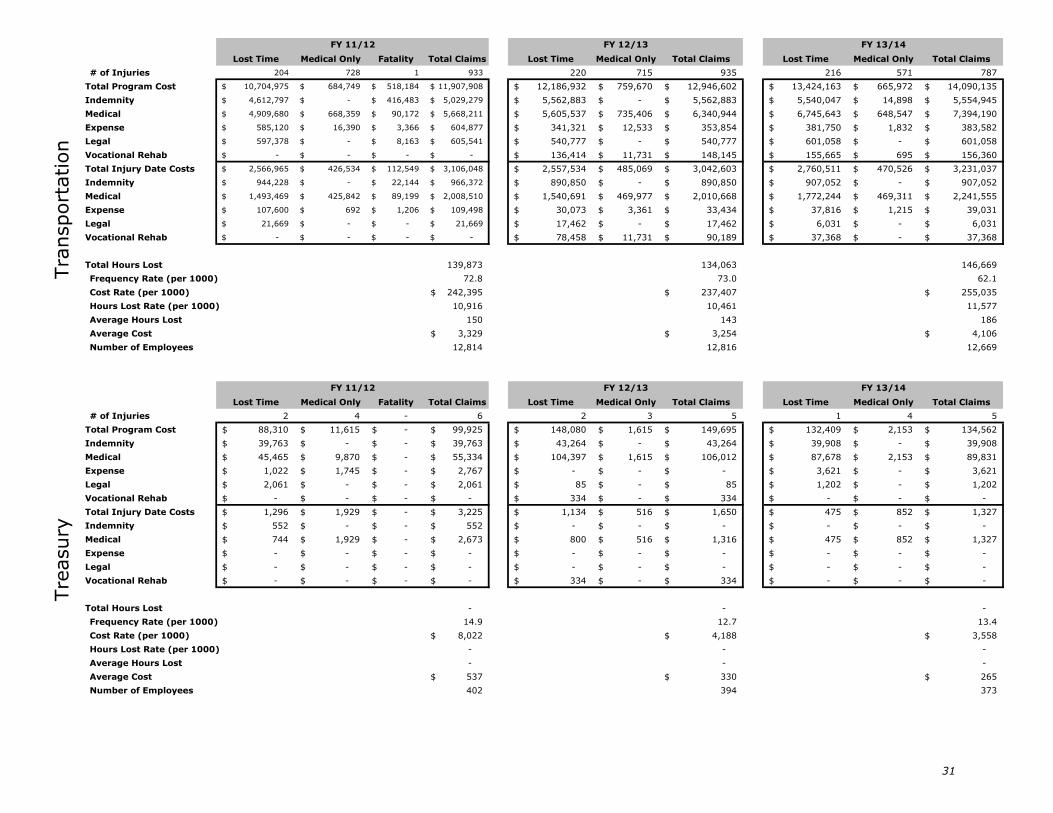
lsThe following charts provide detailed information regarding each agency's injuries and costs as of June 30, 2014. Please see the Explanation of Metrics on page 5 for additional information
about the metrics used in these charts. The following agencies do not have any data recorded: Center for Rural Pennsylvania, E-Health Partnership Authority, Environmental Hearing Board,
Health Care Cost Containment, Independent Fiscal Office, Independent Regulatory Review Commission, Joint Legislative Air and Water Commission, Joint State Government Commission,
Legislative Budget and Finance Committee, Legislative Data Processing, Lieutenant Governor's Office, Local Government Commission, State Public School Building Authority, and Pennvest.
Beginning in FY13/14 fatalities are identified as a lost time claims because survivors recieve compensation.
FY 12/13
9
Lost Time Medical Only Fatality Total Claims Lost Time Medical Only Total Claims Lost Time Medical Only Total Claims
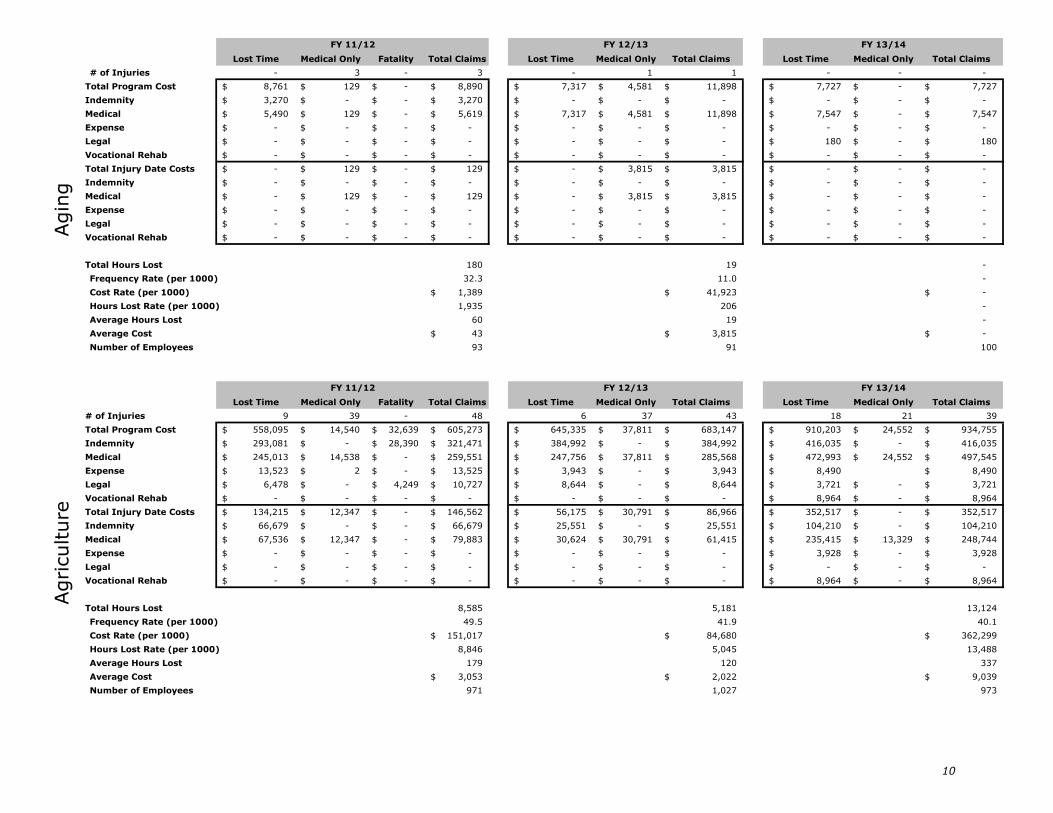
# of Injuries - 3 - 3 - 1 1 - - -
Total Program Cost 8,761$ 129$ -$ 8,890$ 7,317$ 4,581$ 11,898$ 7,727$ -$ 7,727$
Indemnity 3,270$ -$ -$ 3,270$ -$ -$ -$ -$ -$ -$
Medical 5,490$ 129$ -$ 5,619$ 7,317$ 4,581$ 11,898$ 7,547$ -$ 7,547$
Expense -$ -$ -$ -$ -$ -$ -$ -$ -$ -$
Legal -$ -$ -$ -$ -$ -$ -$ 180$ -$ 180$
Vocational Rehab -$ -$ -$ -$ -$ -$ -$ -$ -$ -$
Total Injury Date Costs -$ 129$ -$ 129$ -$ 3,815$ 3,815$ -$ -$ -$
Indemnity -$ -$ -$ -$ -$ -$ -$ -$ -$ -$
Medical -$ 129$ -$ 129$ -$ 3,815$ 3,815$ -$ -$ -$
Expense -$ -$ -$ -$ -$ -$ -$ -$ -$ -$
Legal -$ -$ -$ -$ -$ -$ -$ -$ -$ -$
Vocational Rehab -$ -$ -$ -$ -$ -$ -$ -$ -$ -$
Total Hours Lost 180 19 -
Frequency Rate (per 1000) 32.3 11.0 -
Cost Rate (per 1000) 1,389$ 41,923$ -$
Hours Lost Rate (per 1000) 1,935 206 -
Average Hours Lost 60 19 -
Average Cost 43$ 3,815$ -$
Number of Employees 93 91 100
Lost Time Medical Only Fatality Total Claims Lost Time Medical Only Total Claims Lost Time Medical Only Total Claims
# of Injuries 9 39 - 48 6 37 43 18 21 39
Total Program Cost 558,095$ 14,540$ 32,639$ 605,273$ 645,335$ 37,811$ 683,147$ 910,203$ 24,552$ 934,755$
Indemnity 293,081$ -$ 28,390$ 321,471$ 384,992$ -$ 384,992$ 416,035$ -$ 416,035$
Medical 245,013$ 14,538$ -$ 259,551$ 247,756$ 37,811$ 285,568$ 472,993$ 24,552$ 497,545$
Expense 13,523$ 2$ -$ 13,525$ 3,943$ -$ 3,943$ 8,490$ 8,490$
Legal 6,478$ -$ 4,249$ 10,727$ 8,644$ -$ 8,644$ 3,721$ -$ 3,721$
Vocational Rehab -$ -$ -$ -$ -$ -$ -$ 8,964$ -$ 8,964$
Total Injury Date Costs 134,215$ 12,347$ -$ 146,562$ 56,175$ 30,791$ 86,966$ 352,517$ -$ 352,517$
Indemnity 66,679$ -$ -$ 66,679$ 25,551$ -$ 25,551$ 104,210$ -$ 104,210$
Medical 67,536$ 12,347$ -$ 79,883$ 30,624$ 30,791$ 61,415$ 235,415$ 13,329$ 248,744$
Expense -$ -$ -$ -$ -$ -$ -$ 3,928$ -$ 3,928$
Legal -$ -$ -$ -$ -$ -$ -$ -$ -$ -$
Vocational Rehab -$ -$ -$ -$ -$ -$ -$ 8,964$ -$ 8,964$
Total Hours Lost 8,585 5,181 13,124
Frequency Rate (per 1000) 49.5 41.9 40.1
Cost Rate (per 1000) 151,017$ 84,680$ 362,299$
Hours Lost Rate (per 1000) 8,846 5,045 13,488
Average Hours Lost 179 120 337
Average Cost 3,053$ 2,022$ 9,039$
Number of Employees 971 1,027 973
FY 13/14
FY 13/14FY 11/12
Agin
gFY 11/12
Agriculture
FY 12/13
FY 12/13
10
Lost Time Medical Only Fatality Total Claims Lost Time Medical Only Total Claims Lost Time Medical Only Total Claims
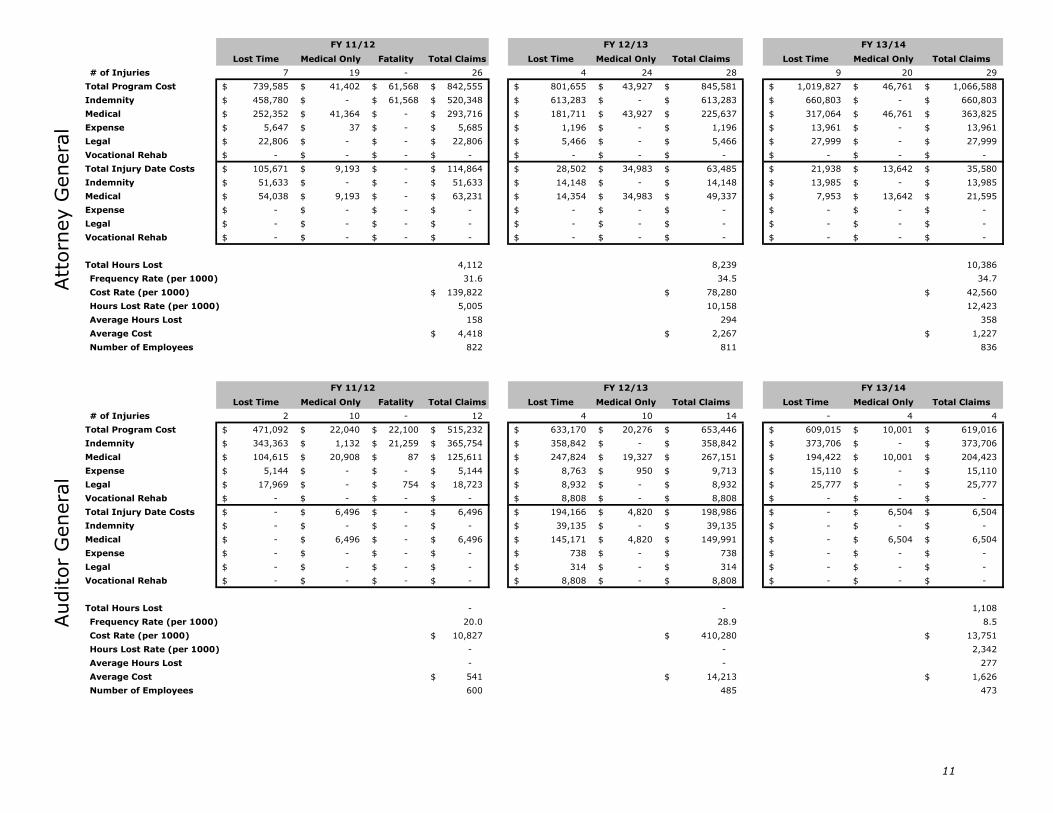
# of Injuries 7 19 - 26 4 24 28 9 20 29
Total Program Cost 739,585$ 41,402$ 61,568$ 842,555$ 801,655$ 43,927$ 845,581$ 1,019,827$ 46,761$ 1,066,588$
Indemnity 458,780$ -$ 61,568$ 520,348$ 613,283$ -$ 613,283$ 660,803$ -$ 660,803$
Medical 252,352$ 41,364$ -$ 293,716$ 181,711$ 43,927$ 225,637$ 317,064$ 46,761$ 363,825$
Expense 5,647$ 37$ -$ 5,685$ 1,196$ -$ 1,196$ 13,961$ -$ 13,961$
Legal 22,806$ -$ -$ 22,806$ 5,466$ -$ 5,466$ 27,999$ -$ 27,999$
Vocational Rehab -$ -$ -$ -$ -$ -$ -$ -$ -$ -$
Total Injury Date Costs 105,671$ 9,193$ -$ 114,864$ 28,502$ 34,983$ 63,485$ 21,938$ 13,642$ 35,580$
Indemnity 51,633$ -$ -$ 51,633$ 14,148$ -$ 14,148$ 13,985$ -$ 13,985$
Medical 54,038$ 9,193$ -$ 63,231$ 14,354$ 34,983$ 49,337$ 7,953$ 13,642$ 21,595$
Expense -$ -$ -$ -$ -$ -$ -$ -$ -$ -$
Legal -$ -$ -$ -$ -$ -$ -$ -$ -$ -$
Vocational Rehab -$ -$ -$ -$ -$ -$ -$ -$ -$ -$
Total Hours Lost 4,112 8,239 10,386
Frequency Rate (per 1000) 31.6 34.5 34.7
Cost Rate (per 1000) 139,822$ 78,280$ 42,560$
Hours Lost Rate (per 1000) 5,005 10,158 12,423
Average Hours Lost 158 294 358
Average Cost 4,418$ 2,267$ 1,227$
Number of Employees 822 811 836
Lost Time Medical Only Fatality Total Claims Lost Time Medical Only Total Claims Lost Time Medical Only Total Claims
# of Injuries 2 10 - 12 4 10 14 - 4 4
Total Program Cost 471,092$ 22,040$ 22,100$ 515,232$ 633,170$ 20,276$ 653,446$ 609,015$ 10,001$ 619,016$
Indemnity 343,363$ 1,132$ 21,259$ 365,754$ 358,842$ -$ 358,842$ 373,706$ -$ 373,706$
Medical 104,615$ 20,908$ 87$ 125,611$ 247,824$ 19,327$ 267,151$ 194,422$ 10,001$ 204,423$
Expense 5,144$ -$ -$ 5,144$ 8,763$ 950$ 9,713$ 15,110$ -$ 15,110$
Legal 17,969$ -$ 754$ 18,723$ 8,932$ -$ 8,932$ 25,777$ -$ 25,777$
Vocational Rehab -$ -$ -$ -$ 8,808$ -$ 8,808$ -$ -$ -$
Total Injury Date Costs -$ 6,496$ -$ 6,496$ 194,166$ 4,820$ 198,986$ -$ 6,504$ 6,504$
Indemnity -$ -$ -$ -$ 39,135$ -$ 39,135$ -$ -$ -$
Medical -$ 6,496$ -$ 6,496$ 145,171$ 4,820$ 149,991$ -$ 6,504$ 6,504$
Expense -$ -$ -$ -$ 738$ -$ 738$ -$ -$ -$
Legal -$ -$ -$ -$ 314$ -$ 314$ -$ -$ -$
Vocational Rehab -$ -$ -$ -$ 8,808$ -$ 8,808$ -$ -$ -$
Total Hours Lost - - 1,108
Frequency Rate (per 1000) 20.0 28.9 8.5
Cost Rate (per 1000) 10,827$ 410,280$ 13,751$
Hours Lost Rate (per 1000) - - 2,342
Average Hours Lost - - 277
Average Cost 541$ 14,213$ 1,626$
Number of Employees 600 485 473
FY 13/14
FY 13/14
FY 11/12
Auditor
Genera
l
FY 11/12
Att
orn
ey G
enera
l
FY 12/13
FY 12/13
11

Lost Time Medical Only Fatality Total Claims Lost Time Medical Only Total Claims Lost Time Medical Only Total Claims
# of Injuries - 2 - 2 2 4 6 3 4 7
Total Program Cost -$ 6,509$ -$ 6,509$ 616$ 2,422$ 3,039$ 41,265$ 735$ 42,000$
Indemnity -$ -$ -$ -$ -$ -$ -$ 20,592$ -$ 20,592$
Medical -$ 5,516$ -$ 5,516$ 616$ 1,432$ 2,049$ 19,696$ 735$ 20,431$
Expense -$ 993$ -$ 993$ -$ 990$ 990$ 52$ -$ 52$
Legal -$ -$ -$ -$ -$ -$ -$ 925$ -$ 925$
Vocational Rehab -$ -$ -$ -$ -$ -$ -$ -$ -$ -$
Total Injury Date Costs -$ 2,423$ -$ 2,423$ 616$ 1,123$ 1,739$ 28,917$ 505$ 29,422$
Indemnity -$ -$ -$ -$ -$ -$ -$ 18,795$ -$ 18,795$
Medical -$ 2,423$ -$ 2,423$ 616$ 1,123$ 1,739$ 10,122$ 505$ 10,627$
Expense -$ -$ -$ -$ -$ -$ -$ -$ -$ -$
Legal -$ -$ -$ -$ -$ -$ -$ -$ -$ -$
Vocational Rehab -$ -$ -$ -$ -$ -$ -$ -$ -$ -$
Total Hours Lost 27 9 1,101
Frequency Rate (per 1000) 8.2 27.5 33.7
Cost Rate (per 1000) 9,962$ 7,977$ 141,452$
Hours Lost Rate (per 1000) 109 40 5,293
Average Hours Lost 13 1 157
Average Cost 1,212$ 290$ 4,203$
Number of Employees 243 218 208
Lost Time Medical Only Fatality Total Claims Lost Time Medical Only Total Claims Lost Time Medical Only Total Claims
# of Injuries - - - 0 - - 0 - - 0
Total Program Cost 27,282$ -$ -$ 27,282$ 32,957$ -$ 32,957$ 2,569$ -$ 2,569$
Indemnity 18,559$ -$ -$ 18,559$ 17,846$ -$ 17,846$ -$ -$ -$
Medical 5,779$ -$ -$ 5,779$ 9,017$ -$ 9,017$ 325$ -$ 325$
Expense 1,819$ -$ -$ 1,819$ 900$ -$ 900$ -$ -$ -$
Legal 1,125$ -$ -$ 1,125$ 5,194$ -$ 5,194$ 2,244$ -$ 2,244$
Vocational Rehab -$ -$ -$ -$ -$ -$ -$ -$ -$ -$
Total Injury Date Costs -$ -$ -$ -$ -$ -$ -$ -$ -$ -$
Indemnity -$ -$ -$ -$ -$ -$ -$ -$ -$ -$
Medical -$ -$ -$ -$ -$ -$ -$ -$ -$ -$
Expense -$ -$ -$ -$ -$ -$ -$ -$ -$ -$
Legal -$ -$ -$ -$ -$ -$ -$ -$ -$ -$
Vocational Rehab -$ -$ -$ -$ -$ -$ -$ -$ -$ -$
Total Hours Lost - - -
Frequency Rate (per 1000) - - -
Cost Rate (per 1000) -$ -$ -$
Hours Lost Rate (per 1000) - - -
Average Hours Lost - - -
Average Cost -$ -$ -$
Number of Employees 7 5 6
FY 13/14
Capitol Pre
serv
ation C
om
mitte
eFY 13/14FY 11/12
FY 11/12
Bankin
g a
nd S
ecurities
FY 12/13
FY 12/13
12

Lost Time Medical Only Fatality Total Claims Lost Time Medical Only Total Claims Lost Time Medical Only Total Claims
# of Injuries - 1 - 1 - 3 3 - 4 4
Total Program Cost -$ 594$ -$ 594$ -$ 2,250$ 2,250$ -$ 5,846$ 5,846$
Indemnity -$ -$ -$ -$ -$ -$ -$ -$ -$ -$
Medical -$ 594$ -$ 594$ -$ 2,250$ 2,250$ -$ 5,846$ 5,846$
Expense -$ -$ -$ -$ -$ -$ -$ -$ -$ -$
Legal -$ -$ -$ -$ -$ -$ -$ -$ -$ -$
Vocational Rehab -$ -$ -$ -$ -$ -$ -$ -$ -$ -$
Total Injury Date Costs -$ 594$ -$ 594$ -$ 2,250$ 2,250$ -$ 1,214$ 1,214$
Indemnity -$ -$ -$ -$ -$ -$ -$ -$ 1,214$ 1,214$
Medical -$ 594$ -$ 594$ -$ 2,250$ 2,250$ -$ -$ -$
Expense -$ -$ -$ -$ -$ -$ -$ -$ -$ -$
Legal -$ -$ -$ -$ -$ -$ -$ -$ -$ -$
Vocational Rehab -$ -$ -$ -$ -$ -$ -$ -$ -$ -$
Total Hours Lost - 11 -
Frequency Rate (per 1000) 5.0 15.8 22.7
Cost Rate (per 1000) 2,975$ 11,842$ 6,898$
Hours Lost Rate (per 1000) - 55 -
Average Hours Lost - 4 -
Average Cost 594$ 750$ 304$
Number of Employees 200 190 176
Lost Time Medical Only Fatality Total Claims Lost Time Medical Only Total Claims Lost Time Medical Only Total Claims
# of Injuries 1 5 - 6 4 3 7 - 2 2
Total Program Cost 12,666$ 966$ -$ 13,632$ 34,995$ 970$ 35,965$ 45,378$ 7,064$ 52,442$
Indemnity 3,309$ -$ -$ 3,309$ 20,237$ -$ 20,237$ 19,670$ -$ 19,670$
Medical 8,981$ 758$ -$ 9,739$ 12,491$ 970$ 13,460$ 22,973$ 7,064$ 30,037$
Expense 375$ 208$ -$ 583$ 2,268$ -$ 2,268$ 484$ -$ 484$
Legal -$ -$ -$ -$ -$ -$ -$ 1,652$ -$ 1,652$
Vocational Rehab -$ -$ -$ -$ -$ -$ -$ 599$ -$ 599$
Total Injury Date Costs 7,262$ 521$ -$ 7,784$ 30,875$ 821$ 31,696$ -$ 6,960$ 6,960$
Indemnity 3,026$ -$ -$ 3,026$ 20,236$ -$ 20,236$ -$ -$ -$
Medical 4,237$ 521$ -$ 4,758$ 8,371$ 821$ 9,192$ -$ 6,960$ 6,960$
Expense -$ -$ -$ -$ 2,268$ -$ 2,268$ -$ -$ -$
Legal -$ -$ -$ -$ -$ -$ -$ -$ -$ -$
Vocational Rehab -$ -$ -$ -$ -$ -$ -$ -$ -$ -$
Total Hours Lost 231 1,338 767
Frequency Rate (per 1000) 15.5 18.1 5.5
Cost Rate (per 1000) 20,061$ 81,902$ 19,016$
Hours Lost Rate (per 1000) 595 3,456 2,096
Average Hours Lost 39 191 384
Average Cost 1,297$ 4,528$ 3,480$
Number of Employees 388 387 366
Com
munity a
nd E
conom
ic
Develo
pm
ent
FY 13/14
FY 13/14
Civ
il S
erv
ice C
om
mis
sio
nFY 11/12
FY 11/12
FY 12/13
FY 12/13
13

Lost Time Medical Only Fatality Total Claims Lost Time Medical Only Total Claims Lost Time Medical Only Total Claims
# of Injuries 36 213 - 249 32 172 204 33 194 227
Total Program Cost 1,710,660$ 158,261$ 12,752$ 1,881,673$ 1,939,351$ 180,531$ 2,119,883$ 1,972,454$ 119,353$ 2,091,807$
Indemnity 687,261$ -$ 12,752$ 700,013$ 776,932$ -$ 776,932$ 587,605$ -$ 587,605$
Medical 883,563$ 157,146$ -$ 1,040,709$ 1,044,766$ 180,511$ 1,225,277$ 1,288,592$ 119,182$ 1,407,774$
Expense 48,959$ 1,115$ -$ 50,074$ 62,155$ 21$ 62,176$ 26,772$ -$ 26,772$
Legal 90,876$ -$ -$ 90,876$ 43,700$ -$ 43,700$ 20,343$ -$ 20,343$
Vocational Rehab -$ -$ -$ -$ 11,798$ -$ 11,798$ 49,142$ 171$ 49,313$
Total Injury Date Costs 302,956$ 118,365$ -$ 421,321$ 171,719$ 144,574$ 316,293$ 671,399$ 82,965$ 754,364$
Indemnity 112,276$ -$ -$ 112,276$ 59,562$ -$ 59,562$ 162,068$ -$ 162,068$
Medical 189,502$ 118,363$ -$ 307,865$ 102,991$ 144,553$ 247,544$ 455,744$ 77,653$ 533,397$
Expense 1,179$ 2$ -$ 1,180$ -$ 21$ 21$ 9,295$ -$ 9,295$
Legal -$ -$ -$ -$ -$ -$ -$ 5,312$ -$ 5,312$
Vocational Rehab -$ -$ -$ -$ 9,166$ -$ 9,166$ 38,980$ 5,312$ 44,292$
Total Hours Lost 19,709 9,480 14,329
Frequency Rate (per 1000) 107.4 87.2 95.3
Cost Rate (per 1000) 181,780$ 135,226$ 316,561$
Hours Lost Rate (per 1000) 8,503 4,053 6,013
Average Hours Lost 79 46 63
Average Cost 1,692$ 1,550$ 3,323$
Number of Employees 2,318 2,339 2,383
Lost Time Medical Only Fatality Total Claims Lost Time Medical Only Total Claims Lost Time Medical Only Total Claims
# of Injuries 434 803 - 1,237 513 739 1,252 517 750 1,267
Total Program Cost 23,865,478$ 697,057$ 228,346$ 24,790,881$ 28,039,900$ 839,022$ 28,878,922$ 32,184,455$ 788,100$ 32,972,555$
Indemnity 14,520,175$ -$ 198,050$ 14,718,225$ 16,522,483$ -$ 16,522,483$ 18,175,363$ 3,679$ 18,179,042$
Medical 7,442,581$ 686,174$ 7,533$ 8,136,288$ 9,893,341$ 823,197$ 10,716,538$ 11,962,704$ 777,971$ 12,740,675$
Expense 775,489$ 10,884$ 8,897$ 795,269$ 634,436$ 14,976$ 649,412$ 805,472$ 6,450$ 811,922$
Legal 1,124,633$ -$ 13,866$ 1,138,499$ 900,691$ -$ 900,691$ 1,007,903$ -$ 1,007,903$
Vocational Rehab 2,600$ -$ -$ 2,600$ 88,949$ 849$ 89,798$ 233,013$ -$ 233,013$
Total Injury Date Costs 4,633,213$ 477,097$ -$ 5,110,309$ 6,282,768$ 538,987$ 6,821,755$ 6,892,120$ 523,526$ 7,415,646$
Indemnity 2,550,357$ -$ -$ 2,550,357$ 3,381,024$ -$ 3,381,024$ 3,182,797$ -$ 3,182,797$
Medical 1,981,775$ 477,022$ -$ 2,458,797$ 2,707,472$ 537,001$ 3,244,473$ 3,541,394$ 521,421$ 4,062,815$
Expense 65,545$ 74$ -$ 65,619$ 76,710$ 1,137$ 77,847$ 67,542$ 2,105$ 69,647$
Legal 35,536$ -$ -$ 35,536$ 47,021$ -$ 47,021$ 43,055$ -$ 43,055$
Vocational Rehab -$ -$ -$ -$ 70,541$ 849$ 71,390$ 57,332$ -$ 57,332$
Total Hours Lost 840,546 663,638 650,615
Frequency Rate (per 1000) 78.6 80.7 84.8
Cost Rate (per 1000) 324,531$ 439,603$ 496,595$
Hours Lost Rate (per 1000) 53,379 42,766 43,569
Average Hours Lost 680 530 514
Average Cost 4,131$ 5,449$ 5,853$
Number of Employees 15,747 15,518 14,933
FY 13/14
FY 13/14FY 11/12
Conserv
ation a
nd N
atu
ral
Resourc
es
FY 11/12
Corr
ections
FY 12/13
FY 12/13
14
Lost Time Medical Only Fatality Total Claims Lost Time Medical Only Total Claims Lost Time Medical Only Total Claims
# of Injuries - - - - - - - 1 2 3
Total Program Cost -$ -$ -$ -$ -$ -$ -$ 1,060$ 191$ 1,251$
Indemnity -$ -$ -$ -$ -$ -$ -$ 285$ -$ 285$
Medical -$ -$ -$ -$ -$ -$ -$ 776$ 191$ 967$
Expense -$ -$ -$ -$ -$ -$ -$ -$ -$ -$
Legal -$ -$ -$ -$ -$ -$ -$ -$ -$ -$
Vocational Rehab -$ -$ -$ -$ -$ -$ -$ -$ -$ -$
Total Injury Date Costs -$ -$ -$ -$ -$ -$ -$ 1,061$ 191$ 1,252$
Indemnity -$ -$ -$ -$ -$ -$ -$ 285$ -$ 285$
Medical -$ -$ -$ -$ -$ -$ -$ 776$ 191$ 967$
Expense -$ -$ -$ -$ -$ -$ -$ -$ -$ -$
Legal -$ -$ -$ -$ -$ -$ -$ -$ -$ -$
Vocational Rehab -$ -$ -$ -$ -$ -$ -$ -$ -$ -$
Total Hours Lost - - 52
Frequency Rate (per 1000) - - 44.8
Cost Rate (per 1000) -$ -$ 18,686$
Hours Lost Rate (per 1000) - - 776
Average Hours Lost - - 17
Average Cost -$ -$ 417$
Number of Employees 67
Lost Time Medical Only Fatality Total Claims Lost Time Medical Only Total Claims Lost Time Medical Only Total Claims
# of Injuries - 6 - 6 - 6 6 - 1 1
Total Program Cost 49,311$ 4,233$ 7,016$ 60,560$ 90,458$ 19,600$ 110,058$ 30,755$ 5,964$ 36,719$
Indemnity 40,035$ -$ 6,940$ 46,975$ 78,721$ -$ 78,721$ 28,417$ -$ 28,417$
Medical 2,545$ 2,968$ 76$ 5,588$ 6,132$ 19,600$ 25,732$ 804$ 5,964$ 6,768$
Expense 5,347$ 1,265$ -$ 6,613$ 1,165$ -$ 1,165$ -$ -$ -$
Legal 1,384$ -$ -$ 1,384$ 4,440$ -$ 4,440$ 1,534$ -$ 1,534$
Vocational Rehab -$ -$ -$ -$ -$ -$ -$ -$ -$ -$
Total Injury Date Costs -$ 553$ -$ 553$ -$ 18,919$ 18,919$ -$ 499$ 499$
Indemnity -$ -$ -$ -$ -$ -$ -$ -$ -$ -$
Medical -$ 553$ -$ 553$ -$ 18,919$ 18,919$ -$ 499$ 499$
Expense -$ -$ -$ -$ -$ -$ -$ -$ -$ -$
Legal -$ -$ -$ -$ -$ -$ -$ -$ -$ -$
Vocational Rehab -$ -$ -$ -$ -$ -$ -$ -$ -$ -$
Total Hours Lost - 2 20
Frequency Rate (per 1000) 10.9 11.6 2.0
Cost Rate (per 1000) 1,007$ 36,665$ 996$
Hours Lost Rate (per 1000) - 3 40
Average Hours Lost - - 20
Average Cost 92$ 3,153$ 499$
Number of Employees 550 516 501
FY 13/14
FY 13/14
FY 11/12
Education
FY 11/12
Dru
g a
nd A
lcohol Pro
gra
ms
FY 12/13
FY 12/13
15
Lost Time Medical Only Fatality Total Claims Lost Time Medical Only Total Claims Lost Time Medical Only Total Claims
# of Injuries - 4 - 4 - 4 4 1 - 1
Total Program Cost 1,654$ 1,003$ 29,087$ 31,744$ 30,983$ 17,876$ 48,859$ (91,845)$ 3,586$ (88,259)$
Indemnity -$ -$ 27,504$ 27,504$ 29,729$ -$ 29,729$ (93,701)$ -$ (93,701)$
Medical 1,284$ 1,003$ -$ 2,286$ 747$ 17,876$ 18,623$ 1,829$ 2,546$ 4,375$
Expense 370$ -$ -$ 370$ 370$ -$ 370$ -$ 1,040$ 1,040$
Legal -$ -$ 1,584$ 1,584$ 137$ -$ 137$ 27$ -$ 27$
Vocational Rehab -$ -$ -$ -$ -$ -$ -$ -$ -$ -$
Total Injury Date Costs -$ -$ -$ -$ -$ 11,837$ 11,837$ 156$ -$ 156$
Indemnity -$ -$ -$ -$ -$ -$ -$ -$ -$ -$
Medical -$ -$ -$ -$ -$ 11,837$ 11,837$ 156$ -$ 156$
Expense -$ -$ -$ -$ -$ -$ -$ -$ -$ -$
Legal -$ -$ -$ -$ -$ -$ -$ -$ -$ -$
Vocational Rehab -$ -$ -$ -$ -$ -$ -$ -$ -$ -$
Total Hours Lost - 60 2
Frequency Rate (per 1000) 11.1 10.6 2.6
Cost Rate (per 1000) -$ 31,315$ 409$
Hours Lost Rate (per 1000) - 159 5
Average Hours Lost - 15 2
Average Cost -$ 2,959$ 156$
Number of Employees 362 378 381
Lost Time Medical Only Fatality Total Claims Lost Time Medical Only Total Claims Lost Time Medical Only Total Claims
# of Injuries 6 72 - 78 7 40 47 14 69 83
Total Program Cost 643,473$ 57,903$ 77,655$ 779,031$ 746,922$ 74,810$ 821,732$ 685,760$ 136,195$ 821,955$
Indemnity 233,704$ -$ 77,655$ 311,359$ 279,034$ -$ 279,034$ 284,298$ -$ 284,298$
Medical 393,634$ 57,361$ -$ 450,995$ 451,937$ 74,810$ 526,748$ 360,816$ 135,242$ 496,058$
Expense 3,955$ 543$ -$ 4,498$ 3,080$ -$ 3,080$ 20,761$ 953$ 21,714$
Legal 12,180$ -$ -$ 12,180$ 12,871$ -$ 12,871$ 17,735$ -$ 17,735$
Vocational Rehab -$ -$ -$ -$ -$ -$ -$ 2,149$ -$ 2,149$
Total Injury Date Costs 19,267$ 45,846$ -$ 65,113$ 74,466$ 37,178$ 111,644$ 124,840$ 53,810$ 178,650$
Indemnity 9,689$ -$ -$ 9,689$ 32,825$ -$ 32,825$ 58,825$ -$ 58,825$
Medical 8,686$ 45,846$ -$ 54,532$ 41,020$ 37,178$ 78,198$ 60,203$ 53,810$ 114,013$
Expense 28$ -$ -$ 28$ -$ -$ -$ 3,662$ -$ 3,662$
Legal 864$ -$ -$ 864$ 621$ -$ 621$ -$ -$ -$
Vocational Rehab -$ -$ -$ -$ -$ -$ -$ 2,150$ -$ 2,150$
Total Hours Lost 470 1,850 2,682
Frequency Rate (per 1000) 28.8 17.6 31.8
Cost Rate (per 1000) 24,000$ 41,846$ 68,475$
Hours Lost Rate (per 1000) 173 693 1,028
Average Hours Lost 6 39 32
Average Cost 835$ 2,375$ 2,152$
Number of Employees 2,713 2,668 2,609
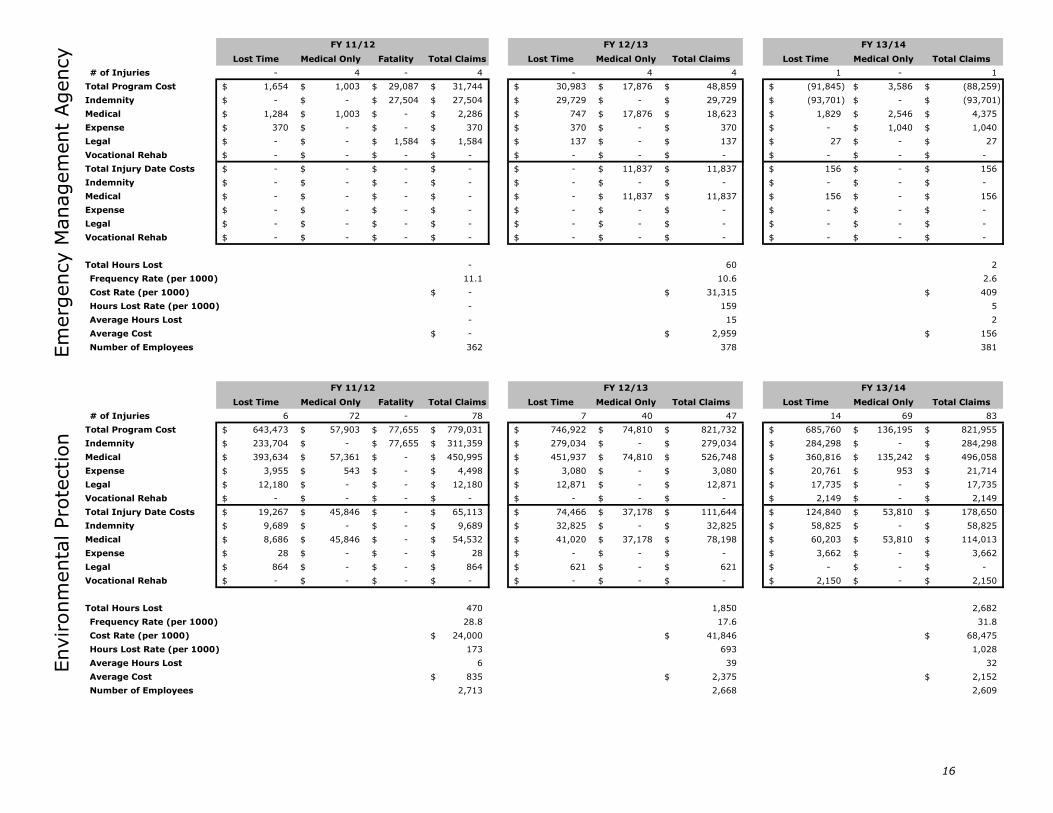
Em
erg
ency M
anagem
ent
Agency
FY 13/14
FY 13/14
FY 11/12
FY 11/12 FY 12/13
Environm
enta
l Pro
tection
FY 12/13
16
Lost Time Medical Only Fatality Total Claims Lost Time Medical Only Total Claims Lost Time Medical Only Total Claims
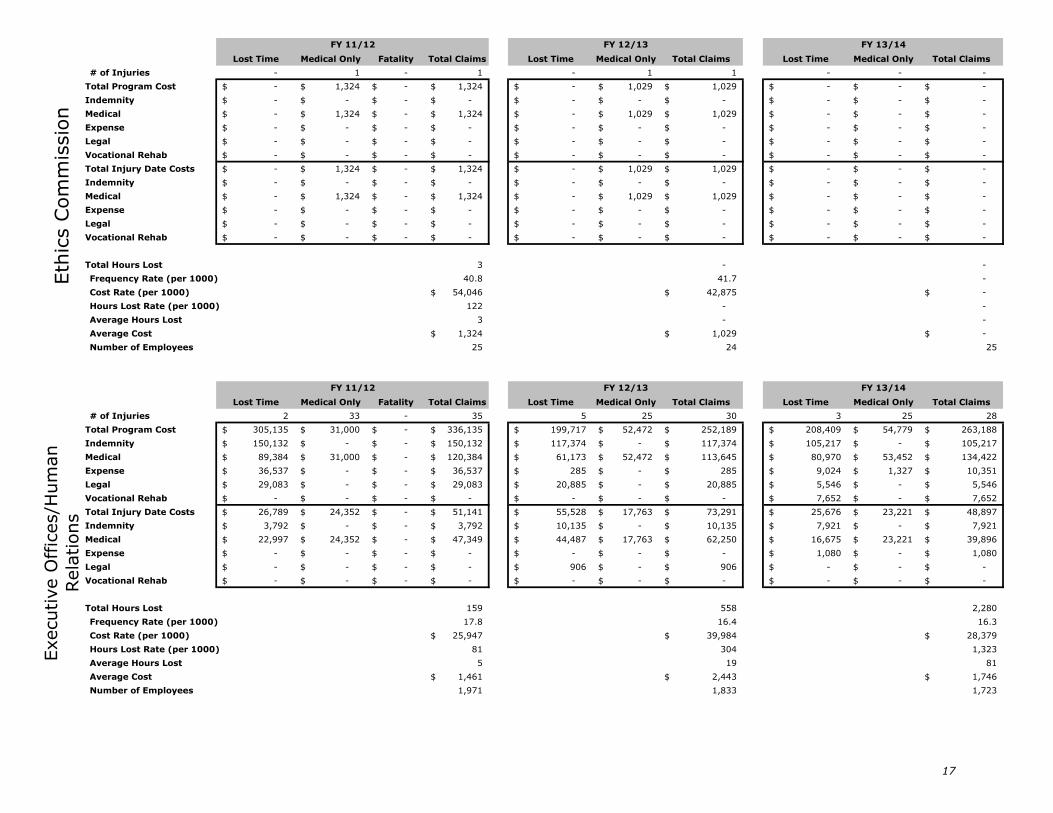
# of Injuries - 1 - 1 - 1 1 - - -
Total Program Cost -$ 1,324$ -$ 1,324$ -$ 1,029$ 1,029$ -$ -$ -$
Indemnity -$ -$ -$ -$ -$ -$ -$ -$ -$ -$
Medical -$ 1,324$ -$ 1,324$ -$ 1,029$ 1,029$ -$ -$ -$
Expense -$ -$ -$ -$ -$ -$ -$ -$ -$ -$
Legal -$ -$ -$ -$ -$ -$ -$ -$ -$ -$
Vocational Rehab -$ -$ -$ -$ -$ -$ -$ -$ -$ -$
Total Injury Date Costs -$ 1,324$ -$ 1,324$ -$ 1,029$ 1,029$ -$ -$ -$
Indemnity -$ -$ -$ -$ -$ -$ -$ -$ -$ -$
Medical -$ 1,324$ -$ 1,324$ -$ 1,029$ 1,029$ -$ -$ -$
Expense -$ -$ -$ -$ -$ -$ -$ -$ -$ -$
Legal -$ -$ -$ -$ -$ -$ -$ -$ -$ -$
Vocational Rehab -$ -$ -$ -$ -$ -$ -$ -$ -$ -$
Total Hours Lost 3 - -
Frequency Rate (per 1000) 40.8 41.7 -
Cost Rate (per 1000) 54,046$ 42,875$ -$
Hours Lost Rate (per 1000) 122 - -
Average Hours Lost 3 - -
Average Cost 1,324$ 1,029$ -$
Number of Employees 25 24 25
Lost Time Medical Only Fatality Total Claims Lost Time Medical Only Total Claims Lost Time Medical Only Total Claims
# of Injuries 2 33 - 35 5 25 30 3 25 28
Total Program Cost 305,135$ 31,000$ -$ 336,135$ 199,717$ 52,472$ 252,189$ 208,409$ 54,779$ 263,188$
Indemnity 150,132$ -$ -$ 150,132$ 117,374$ -$ 117,374$ 105,217$ -$ 105,217$
Medical 89,384$ 31,000$ -$ 120,384$ 61,173$ 52,472$ 113,645$ 80,970$ 53,452$ 134,422$
Expense 36,537$ -$ -$ 36,537$ 285$ -$ 285$ 9,024$ 1,327$ 10,351$
Legal 29,083$ -$ -$ 29,083$ 20,885$ -$ 20,885$ 5,546$ -$ 5,546$
Vocational Rehab -$ -$ -$ -$ -$ -$ -$ 7,652$ -$ 7,652$
Total Injury Date Costs 26,789$ 24,352$ -$ 51,141$ 55,528$ 17,763$ 73,291$ 25,676$ 23,221$ 48,897$
Indemnity 3,792$ -$ -$ 3,792$ 10,135$ -$ 10,135$ 7,921$ -$ 7,921$
Medical 22,997$ 24,352$ -$ 47,349$ 44,487$ 17,763$ 62,250$ 16,675$ 23,221$ 39,896$
Expense -$ -$ -$ -$ -$ -$ -$ 1,080$ -$ 1,080$
Legal -$ -$ -$ -$ 906$ -$ 906$ -$ -$ -$
Vocational Rehab -$ -$ -$ -$ -$ -$ -$ -$ -$ -$
Total Hours Lost 159 558 2,280
Frequency Rate (per 1000) 17.8 16.4 16.3
Cost Rate (per 1000) 25,947$ 39,984$ 28,379$
Hours Lost Rate (per 1000) 81 304 1,323
Average Hours Lost 5 19 81
Average Cost 1,461$ 2,443$ 1,746$
Number of Employees 1,971 1,833 1,723
FY 13/14
FY 13/14
FY 11/12
Eth
ics C
om
mis
sio
nExecutive O
ffic
es/H
um
an
Rela
tions
FY 11/12
FY 12/13
FY 12/13
17

Lost Time Medical Only Fatality Total Claims Lost Time Medical Only Total Claims Lost Time Medical Only Total Claims
# of Injuries 4 16 - 20 7 21 28 4 18 22
Total Program Cost 108,635$ 25,662$ 38,409$ 172,705$ 191,438$ 89,366$ 280,803$ 269,341$ 14,944$ 284,285$
Indemnity 61,625$ -$ 38,409$ 100,034$ 111,606$ -$ 111,606$ 231,545$ -$ 231,545$
Medical 32,827$ 25,659$ -$ 58,486$ 50,328$ 89,366$ 139,694$ 28,823$ 14,944$ 43,767$
Expense 1,209$ 3$ -$ 1,212$ 8,199$ -$ 8,199$ 1,116$ -$ 1,116$
Legal 12,973$ -$ -$ 12,973$ 21,305$ -$ 21,305$ 7,857$ -$ 7,857$
Vocational Rehab -$ -$ -$ -$ -$ -$ -$ -$ -$ -$
Total Injury Date Costs 19,671$ 7,519$ -$ 27,190$ 26,493$ 11,210$ 37,703$ 8,902$ 6,659$ 15,561$
Indemnity 8,335$ -$ -$ 8,335$ 17,104$ -$ 17,104$ 4,006$ -$ 4,006$
Medical 11,326$ 7,519$ -$ 18,845$ 9,389$ 11,210$ 20,599$ 4,896$ 6,659$ 11,555$
Expense 10$ -$ -$ 10$ -$ -$ -$ -$ -$ -$
Legal -$ -$ -$ -$ -$ -$ -$ -$ -$ -$
Vocational Rehab -$ -$ -$ -$ -$ -$ -$ -$ -$ -$
Total Hours Lost 1,258 1,070 275
Frequency Rate (per 1000) 33.4 51.1 42.5
Cost Rate (per 1000) 45,373$ 68,801$ 30,041$
Hours Lost Rate (per 1000) 2,100 1,952 531
Average Hours Lost 63 38 13
Average Cost 1,359$ 1,347$ 707$
Number of Employees 599 548 518
Lost Time Medical Only Fatality Total Claims Lost Time Medical Only Total Claims Lost Time Medical Only Total Claims
# of Injuries 13 125 - 138 10 101 111 20 81 101
Total Program Cost 583,984$ 54,775$ 20,602$ 659,361$ 937,534$ 94,698$ 1,032,232$ 1,210,164$ 60,438$ 1,270,602$
Indemnity 421,449$ -$ 20,602$ 442,051$ 403,853$ -$ 403,853$ 449,070$ -$ 449,070$
Medical 100,841$ 54,692$ -$ 155,533$ 470,196$ 94,695$ 564,891$ 711,634$ 60,438$ 772,072$
Expense 29,652$ 83$ -$ 29,735$ 20,875$ 3$ 20,877$ 24,205$ -$ 24,205$
Legal 29,299$ -$ -$ 29,299$ 42,610$ -$ 42,610$ 18,865$ -$ 18,865$
Vocational Rehab 2,743$ -$ -$ 2,743$ -$ -$ -$ 6,390$ -$ 6,390$
Total Injury Date Costs 133,617$ 34,817$ -$ 168,434$ 185,784$ 73,411$ 259,195$ 629,929$ 35,789$ 665,718$
Indemnity 65,897$ -$ -$ 65,897$ 76,634$ -$ 76,634$ 132,701$ -$ 132,701$
Medical 60,937$ 34,734$ -$ 95,671$ 102,164$ 73,411$ 175,575$ 485,451$ 35,789$ 521,240$
Expense 3,437$ 83$ -$ 3,521$ 1,005$ -$ 1,005$ 5,209$ -$ 5,209$
Legal 3,346$ -$ -$ 3,346$ 5,981$ -$ 5,981$ 2,352$ -$ 2,352$
Vocational Rehab -$ -$ -$ -$ -$ -$ -$ 4,216$ -$ 4,216$
Total Hours Lost 8,264 15,946 16,681
Frequency Rate (per 1000) 105.8 90.5 82.2
Cost Rate (per 1000) 129,093$ 211,243$ 541,675$
Hours Lost Rate (per 1000) 6,333 12,996 13,573
Average Hours Lost 60 144 165
Average Cost 1,221$ 2,335$ 6,591$
Number of Employees 1,305 1,227 1,229
FY 13/14
FY 13/14
Fis
h a
nd B
oat
Com
mis
sio
nFY 11/12
Gam
e C
om
mis
sio
n
FY 11/12
FY 12/13
FY 12/13
18

Lost Time Medical Only Fatality Total Claims Lost Time Medical Only Total Claims Lost Time Medical Only Total Claims
# of Injuries - 4 - 4 1 4 5 1 2 3
Total Program Cost 1,687$ 4,851$ -$ 6,538$ 2,729$ 2,279$ 5,008$ 1,976$ 5,873$ 7,849$
Indemnity -$ -$ -$ -$ -$ -$ -$ 1,800$ -$ 1,800$
Medical -$ 4,851$ -$ 4,851$ 2,527$ 2,279$ 4,806$ 176$ 5,873$ 6,049$
Expense 33$ -$ -$ 33$ 39$ -$ 39$ -$ -$ -$
Legal 1,654$ -$ -$ 1,654$ 162$ -$ 162$ -$ -$ -$
Vocational Rehab -$ -$ -$ -$ -$ -$ -$ -$ -$ -$
Total Injury Date Costs -$ 4,700$ -$ 4,700$ 3,364$ 1,412$ 4,776$ -$ 5,854$ 5,854$
Indemnity -$ -$ -$ -$ 87$ -$ 87$ -$ -$ -$
Medical -$ 4,700$ -$ 4,700$ 3,277$ 1,412$ 4,689$ -$ 5,854$ 5,854$
Expense -$ -$ -$ -$ -$ -$ -$ -$ -$ -$
Legal -$ -$ -$ -$ -$ -$ -$ -$ -$ -$
Vocational Rehab -$ -$ -$ -$ -$ -$ -$ -$ -$ -$
Total Hours Lost - - 171
Frequency Rate (per 1000) 12.6 16.0 9.6
Cost Rate (per 1000) 14,862$ 15,259$ 18,703$
Hours Lost Rate (per 1000) - - 546
Average Hours Lost - - 57
Average Cost 1,175$ 955$ 1,951$
Number of Employees 316 313 313
Lost Time Medical Only Fatality Total Claims Lost Time Medical Only Total Claims Lost Time Medical Only Total Claims
# of Injuries 12 45 - 57 15 42 57 15 29 44
Total Program Cost 739,345$ 45,268$ 21,788$ 806,401$ 798,557$ 64,743$ 863,300$ 996,425$ 24,760$ 1,021,185$
Indemnity 369,069$ -$ 21,788$ 390,857$ 380,802$ -$ 380,802$ 472,257$ -$ 472,257$
Medical 297,957$ 42,796$ -$ 340,753$ 328,670$ 60,108$ 388,778$ 445,630$ 24,184$ 469,814$
Expense 42,661$ 2,472$ -$ 45,132$ 24,758$ 2,470$ 27,227$ 16,313$ -$ 16,313$
Legal 29,659$ -$ -$ 29,659$ 36,722$ -$ 36,722$ 39,756$ -$ 39,756$
Vocational Rehab -$ -$ -$ -$ 27,606$ 2,166$ 29,771$ 22,469$ 576$ 23,045$
Total Injury Date Costs 117,152$ 35,305$ -$ 152,457$ 187,428$ 28,024$ 215,452$ 205,533$ 13,710$ 219,243$
Indemnity 43,647$ -$ -$ 43,647$ 86,276$ -$ 86,276$ 95,890$ -$ 95,890$
Medical 70,236$ 32,833$ -$ 103,069$ 84,478$ 27,976$ 112,454$ 103,269$ 13,710$ 116,979$
Expense 3,269$ 2,472$ -$ 5,741$ 1,492$ 48$ 1,540$ 24$ -$ 24$
Legal -$ -$ -$ -$ -$ -$ -$ -$ -$ -$
Vocational Rehab -$ -$ -$ -$ 15,182$ -$ 15,182$ 6,350$ -$ 6,350$
Total Hours Lost 7,951 10,783 10,519
Frequency Rate (per 1000) 56.2 58.9 46.9
Cost Rate (per 1000) 150,315$ 222,574$ 233,486$
Hours Lost Rate (per 1000) 7,839 11,139 11,202
Average Hours Lost 139 189 239
Average Cost 2,675$ 3,780$ 4,983$
Number of Employees 1,014 968 939
FY 13/14
FY 13/14
Gam
ing C
ontr
ol Board
FY 11/12
Genera
l Serv
icesFY 11/12 FY 12/13
FY 12/13
19

Lost Time Medical Only Fatality Total Claims Lost Time Medical Only Total Claims Lost Time Medical Only Total Claims
# of Injuries - - - - - - - - 1 1
Total Program Cost -$ -$ -$ -$ -$ -$ -$ -$ 1,978$ 1,978$
Indemnity -$ -$ -$ -$ -$ -$ -$ -$ -$ -$
Medical -$ -$ -$ -$ -$ -$ -$ -$ 1,978$ 1,978$
Expense -$ -$ -$ -$ -$ -$ -$ -$ -$ -$
Legal -$ -$ -$ -$ -$ -$ -$ -$ -$ -$
Vocational Rehab -$ -$ -$ -$ -$ -$ -$ -$ -$ -$
Total Injury Date Costs -$ -$ -$ -$ -$ -$ -$ -$ 1,979$ 1,979$
Indemnity -$ -$ -$ -$ -$ -$ -$ -$ -$ -$
Medical -$ -$ -$ -$ -$ -$ -$ -$ 1,979$ 1,979$
Expense -$ -$ -$ -$ -$ -$ -$ -$ -$ -$
Legal -$ -$ -$ -$ -$ -$ -$ -$ -$ -$
Vocational Rehab -$ -$ -$ -$ -$ -$ -$ -$ -$ -$
Total Hours Lost - - -$
Frequency Rate (per 1000) - - -$
Cost Rate (per 1000) -$ -$ 37,339$
Hours Lost Rate (per 1000) - - -$
Average Hours Lost - - -$
Average Cost -$ -$ 1,979$
Number of Employees 53
Lost Time Medical Only Fatality Total Claims Lost Time Medical Only Total Claims Lost Time Medical Only Total Claims
# of Injuries 8 25 - 33 8 25 33 5 18 23
Total Program Cost 199,544$ 54,911$ -$ 254,455$ 102,166$ 22,105$ 124,271$ 160,007$ 6,323$ 166,330$
Indemnity 58,312$ -$ -$ 58,312$ 22,955$ -$ 22,955$ 34,389$ -$ 34,389$
Medical 127,687$ 53,961$ -$ 181,648$ 59,087$ 21,175$ 80,262$ 105,854$ 6,323$ 112,177$
Expense 9,133$ 950$ -$ 10,083$ 3,335$ 930$ 4,265$ 4,588$ -$ 4,588$
Legal 4,412$ -$ -$ 4,412$ 16,789$ -$ 16,789$ 13,218$ -$ 13,218$
Vocational Rehab -$ -$ -$ -$ -$ -$ -$ 1,958$ -$ 1,958$
Total Injury Date Costs 60,991$ 25,163$ -$ 86,154$ 8,028$ 22,769$ 30,797$ 25,662$ 3,144$ 28,806$
Indemnity 10,628$ -$ -$ 10,628$ 3,665$ -$ 3,665$ 6,759$ -$ 6,759$
Medical 47,084$ 25,163$ -$ 72,247$ 4,363$ 22,769$ 27,132$ 17,303$ 3,144$ 20,447$
Expense 2,933$ -$ -$ 2,933$ -$ -$ -$ -$ -$ -$
Legal 346$ -$ -$ 346$ -$ -$ -$ 803$ -$ 803$
Vocational Rehab -$ -$ -$ -$ -$ -$ -$ 797$ -$ 797$
Total Hours Lost 2,677 1,021 1,904
Frequency Rate (per 1000) 19.8 22.7 16.1
Cost Rate (per 1000) 51,698$ 21,152$ 20,116$
Hours Lost Rate (per 1000) 1,606 701 1,330
Average Hours Lost 81 31 83
Average Cost 2,611$ 933$ 1,252$
Number of Employees 1,667 1,456 1,432
FY 13/14
FY 11/12 FY 12/13 FY 13/14
FY 11/12
Govern
or's O
ffic
eH
ealth
FY 12/13
20

Lost Time Medical Only Fatality Total Claims Lost Time Medical Only Total Claims Lost Time Medical Only Total Claims
# of Injuries 2 12 - 14 2 5 7 3 9 12
Total Program Cost 89,332$ 5,363$ -$ 94,695$ 170,164$ 134,481$ 304,645$ 110,045$ 20,122$ 130,167$
Indemnity 46,717$ -$ -$ 46,717$ 55,763$ -$ 55,763$ 39,502$ -$ 39,502$
Medical 27,081$ 5,363$ -$ 32,445$ 102,810$ 134,481$ 237,290$ 68,777$ 19,132$ 87,909$
Expense 4,721$ -$ -$ 4,721$ 3,739$ -$ 3,739$ 289$ 990$ 1,279$
Legal 10,813$ -$ -$ 10,813$ 7,853$ -$ 7,853$ 1,477$ -$ 1,477$
Vocational Rehab -$ -$ -$ -$ -$ -$ -$ -$ -$ -$
Total Injury Date Costs 9,473$ 4,639$ -$ 14,112$ 52,190$ 132,301$ 184,491$ 7,486$ 12,049$ 19,535$
Indemnity 7,377$ -$ -$ 7,377$ 13,448$ -$ 13,448$ 1,910$ -$ 1,910$
Medical 2,096$ 4,639$ -$ 6,735$ 38,742$ 132,301$ 171,043$ 5,576$ 12,049$ 17,625$
Expense -$ -$ -$ -$ -$ -$ -$ -$ -$ -$
Legal -$ -$ -$ -$ -$ -$ -$ -$ -$ -$
Vocational Rehab -$ -$ -$ -$ -$ -$ -$ -$ -$ -$
Total Hours Lost 10 1,155 816
Frequency Rate (per 1000) 63.2 33.2 53.1
Cost Rate (per 1000) 63,713$ 874,365$ 86,438$
Hours Lost Rate (per 1000) 43 5,474 3,611
Average Hours Lost 1 165 68
Average Cost 1,008$ 26,356$ 1,628$
Number of Employees 222 211 226
Lost Time Medical Only Fatality Total Claims Lost Time Medical Only Total Claims Lost Time Medical Only Total Claims
# of Injuries 3 21 - 24 4 17 21 4 23 27
Total Program Cost 284,540$ 29,235$ 7,307$ 321,082$ 357,985$ 13,832$ 371,817$ 299,136$ 19,328$ 318,464$
Indemnity 97,808$ -$ 7,307$ 105,115$ 244,346$ -$ 244,346$ 199,448$ -$ 199,448$
Medical 143,160$ 27,866$ -$ 171,026$ 82,605$ 13,832$ 96,437$ 50,211$ 16,589$ 66,800$
Expense 19,504$ 1,369$ -$ 20,873$ 7,294$ -$ 7,294$ 24,204$ 17$ 24,221$
Legal 23,812$ -$ -$ 23,812$ 22,300$ -$ 22,300$ 25,273$ -$ 25,273$
Vocational Rehab 256$ -$ -$ 256$ 1,439$ -$ 1,439$ -$ 2,722$ 2,722$
Total Injury Date Costs 37,631$ 9,985$ -$ 47,616$ 99,000$ 9,161$ 108,161$ 8,716$ 17,605$ 26,321$
Indemnity 14,043$ -$ -$ 14,043$ 61,721$ -$ 61,721$ 3,732$ -$ 3,732$
Medical 21,997$ 9,985$ -$ 31,982$ 33,095$ 9,161$ 42,256$ 4,110$ 14,883$ 18,993$
Expense 476$ -$ -$ 476$ 2,745$ -$ 2,745$ -$ -$ -$
Legal 1,115$ -$ -$ 1,115$ -$ -$ -$ 874$ -$ 874$
Vocational Rehab -$ -$ -$ -$ 1,439$ -$ 1,439$ -$ 2,722$ 2,722$
Total Hours Lost - - 816
Frequency Rate (per 1000) 11.5 12.5 15.5
Cost Rate (per 1000) 22,848$ 64,382$ 15,127$
Hours Lost Rate (per 1000) - - 469
Average Hours Lost - - 30
Average Cost 1,984$ 5,151$ 975$
Number of Employees 2,084 1,680 1,740
FY 13/14
FY 13/14FY 11/12
FY 11/12
House o
f Repre
senta
tives
FY 12/13
FY 12/13H
isto
rical and M
useum
Com
mis
sio
n
21

Lost Time Medical Only Fatality Total Claims Lost Time Medical Only Total Claims Lost Time Medical Only Total Claims
# of Injuries 443 1,167 - 1,610 474 942 1,416 437 879 1,316
Total Program Cost 25,066,463$ 1,165,955$ 213,245$ 26,445,664$ 30,902,940$ 1,387,387$ 32,290,327$ 34,252,551$ 1,082,245$ 35,334,796$
Indemnity 14,732,174$ -$ 196,606$ 14,928,780$ 16,403,981$ -$ 16,403,981$ 17,517,598$ 2,083$ 17,519,681$
Medical 8,408,530$ 1,161,066$ 7,998$ 9,577,593$ 12,329,689$ 1,356,282$ 13,685,971$ 13,467,064$ 1,060,958$ 14,528,022$
Expense 872,677$ 4,890$ 6,788$ 884,355$ 800,248$ 29,544$ 829,793$ 1,117,189$ 10,876$ 1,128,065$
Legal 1,047,655$ -$ 1,853$ 1,049,508$ 1,194,555$ -$ 1,194,555$ 1,652,095$ -$ 1,652,095$
Vocational Rehab 5,427$ -$ -$ 5,427$ 174,466$ 1,561$ 176,027$ 498,605$ 8,328$ 506,933$
Total Injury Date Costs 3,493,066$ 791,800$ -$ 4,284,866$ 6,102,603$ 762,453$ 6,865,056$ 4,903,451$ 674,725$ 5,578,176$
Indemnity 1,671,285$ -$ -$ 1,671,285$ 2,481,494$ -$ 2,481,494$ 1,845,515$ -$ 1,845,515$
Medical 1,714,970$ 788,584$ -$ 2,503,554$ 3,313,497$ 747,305$ 4,060,802$ 2,827,860$ 674,725$ 3,502,585$
Expense 62,063$ 3,216$ -$ 65,279$ 111,538$ 13,587$ 125,125$ 70,933$ -$ 70,933$
Legal 44,748$ -$ -$ 44,748$ 93,523$ -$ 93,523$ 58,957$ -$ 58,957$
Vocational Rehab -$ -$ -$ -$ 102,551$ 1,561$ 104,112$ 100,186$ -$ 100,186$
Total Hours Lost 626,442 715,941 733,695
Frequency Rate (per 1000) 88.6 79.4 77.1
Cost Rate (per 1000) 235,912$ 384,964$ 327,012$
Hours Lost Rate (per 1000) 34,490 40,147 43,012
Average Hours Lost 389 506 558
Average Cost 2,661$ 4,848$ 4,239$
Number of Employees 18,163 17,833 17,058
Lost Time Medical Only Fatality Total Claims Lost Time Medical Only Total Claims Lost Time Medical Only Total Claims
# of Injuries - 3 - 3 - 1 1 - 3 3
Total Program Cost 56,461$ 1,128$ -$ 57,589$ 99,840$ 703$ 100,543$ 81,698$ 932$ 82,630$
Indemnity 26,702$ -$ -$ 26,702$ 53,404$ -$ 53,404$ 36,823$ -$ 36,823$
Medical 3,143$ 1,128$ -$ 4,271$ 4,579$ 703$ 5,282$ 43,991$ 932$ 44,923$
Expense 7,941$ -$ -$ 7,941$ 11,180$ 11,180$ -$ -$ -$
Legal 18,675$ -$ -$ 18,675$ 30,677$ -$ 30,677$ 884$ -$ 884$
Vocational Rehab -$ -$ -$ -$ -$ -$ -$ -$ -$ -$
Total Injury Date Costs -$ 401$ -$ 401$ -$ 148$ 148$ -$ 286$ 286$
Indemnity -$ -$ -$ -$ -$ -$ -$ -$ -$ -$
Medical -$ 401$ -$ 401$ -$ 148$ 148$ -$ 286$ 286$
Expense -$ -$ -$ -$ -$ -$ -$ -$ -$ -$
Legal -$ -$ -$ -$ -$ -$ -$ -$ -$ -$
Vocational Rehab -$ -$ -$ -$ -$ -$ -$ -$ -$ -$
Total Hours Lost 4 - -
Frequency Rate (per 1000) 10.9 3.8 12.0
Cost Rate (per 1000) 1,457$ 567$ 1,144$
Hours Lost Rate (per 1000) 13 - -
Average Hours Lost 1 - -
Average Cost 134$ 148$ 95$
Number of Employees 276 261 250
FY 13/14FY 11/12
Insura
nce
FY 12/13
FY 11/12 FY 12/13 FY 13/14
Hum
an S
erv
ices
22

Lost Time Medical Only Fatality Total Claims Lost Time Medical Only Total Claims Lost Time Medical Only Total Claims
# of Injuries 17 101 - 118 21 78 99 23 80 103
Total Program Cost 2,394,229$ 109,560$ 82,282$ 2,586,071$ 1,885,542$ 100,320$ 1,985,863$ 1,776,719$ 114,711$ 1,891,430$
Indemnity 1,279,784$ -$ 73,574$ 1,353,358$ 996,781$ -$ 996,781$ 931,849$ -$ 931,849$
Medical 625,326$ 99,548$ -$ 724,875$ 648,420$ 97,938$ 746,358$ 653,008$ 113,896$ 766,904$
Expense 304,784$ 10,011$ 2,760$ 317,556$ 66,158$ 2,382$ 68,540$ 51,100$ -$ 51,100$
Legal 180,210$ -$ 5,948$ 186,158$ 172,942$ -$ 172,942$ 135,463$ -$ 135,463$
Vocational Rehab 4,124$ -$ -$ 4,124$ 1,241$ -$ 1,241$ 5,299$ 815$ 6,114$
Total Injury Date Costs 95,562$ 70,917$ -$ 166,479$ 122,294$ 59,866$ 182,160$ 197,829$ 78,741$ 276,570$
Indemnity 30,019$ -$ -$ 30,019$ 32,552$ -$ 32,552$ 81,144$ -$ 81,144$
Medical 65,535$ 70,917$ -$ 136,452$ 84,047$ 59,866$ 143,913$ 102,059$ 78,741$ 180,800$
Expense 8$ -$ -$ 8$ 1,583$ -$ 1,583$ 5,635$ -$ 5,635$
Legal -$ -$ -$ -$ 4,112$ -$ 4,112$ 5,054$ -$ 5,054$
Vocational Rehab -$ -$ -$ -$ -$ -$ -$ 3,937$ -$ 3,937$
Total Hours Lost 8,831 5,339 11,481
Frequency Rate (per 1000) 20.4 18.8 20.0
Cost Rate (per 1000) 28,832$ 34,585$ 53,599$
Hours Lost Rate (per 1000) 1,529 1,014 2,225
Average Hours Lost 75 54 111
Average Cost 1,411$ 1,840$ 2,685$
Number of Employees 5,774 5,267 5,160
Lost Time Medical Only Fatality Total Claims Lost Time Medical Only Total Claims Lost Time Medical Only Total Claims
# of Injuries - - - 0 - 1 1 - 1 1
Total Program Cost -$ -$ -$ -$ -$ -$ -$ -$ 1,314$ 1,314$
Indemnity -$ -$ -$ -$ -$ -$ -$ -$ -$ -$
Medical -$ -$ -$ -$ -$ -$ -$ -$ 1,314$ 1,314$
Expense -$ -$ -$ -$ -$ -$ -$ -$ -$ -$
Legal -$ -$ -$ -$ -$ -$ -$ -$ -$ -$
Vocational Rehab -$ -$ -$ -$ -$ -$ -$ -$ -$ -$
Total Injury Date Costs -$ -$ -$ -$ -$ 125$ 125$ -$ 1,314$ 1,314$
Indemnity -$ -$ -$ -$ -$ -$ -$ -$ -$ -$
Medical -$ -$ -$ -$ -$ 125$ 125$ -$ 1,314$ 1,314$
Expense -$ -$ -$ -$ -$ -$ -$ -$ -$ -$
Legal -$ -$ -$ -$ -$ -$ -$ -$ -$ -$
Vocational Rehab -$ -$ -$ -$ -$ -$ -$ -$ -$ -$
Total Hours Lost - - -
Frequency Rate (per 1000) - 13.9 14.1
Cost Rate (per 1000) -$ 1,736$ 18,507$
Hours Lost Rate (per 1000) - - -
Average Hours Lost - - -
Average Cost -$ 125$ 1,314$
Number of Employees 14 72 71
FY 13/14
FY 13/14
FY 11/12
FY 11/12
Legis
lative R
efe
rence B
ure
au
Labor
and I
ndustr
y
FY 12/13
FY 12/13
23

Lost Time Medical Only Fatality Total Claims Lost Time Medical Only Total Claims Lost Time Medical Only Total Claims
# of Injuries 116 259 - 375 113 238 351 120 233 353
Total Program Cost 6,652,307$ 321,653$ 32,317$ 7,006,278$ 7,094,526$ 433,433$ 7,527,959$ 7,928,227$ 312,568$ 8,240,795$
Indemnity 3,797,381$ -$ 32,098$ 3,829,479$ 3,947,682$ -$ 3,947,682$ 3,873,797$ 534$ 3,874,331$
Medical 2,385,802$ 319,739$ 28$ 2,705,569$ 2,642,072$ 428,527$ 3,070,599$ 3,447,840$ 308,578$ 3,756,418$
Expense 183,410$ 1,914$ -$ 185,324$ 145,769$ 4,906$ 150,675$ 190,548$ 1,267$ 191,815$
Legal 284,956$ -$ 192$ 285,147$ 343,272$ -$ 343,272$ 349,323$ -$ 349,323$
Vocational Rehab 758$ -$ -$ 758$ 15,731$ -$ 15,731$ 66,719$ 2,189$ 68,908$
Total Injury Date Costs 782,815$ 224,035$ -$ 1,006,851$ 881,859$ 238,813$ 1,120,672$ 1,246,639$ 193,642$ 1,440,281$
Indemnity 334,663$ -$ -$ 334,663$ 356,386$ -$ 356,386$ 366,704$ -$ 366,704$
Medical 446,783$ 224,035$ -$ 670,818$ 511,354$ 238,247$ 749,601$ 842,982$ 191,778$ 1,034,760$
Expense 1,361$ -$ -$ 1,361$ 4,449$ 566$ 5,015$ 13,194$ -$ 13,194$
Legal 9$ -$ -$ 9$ 3,192$ -$ 3,192$ 6,768$ -$ 6,768$
Vocational Rehab -$ -$ -$ -$ 6,478$ -$ 6,478$ 16,991$ 1,864$ 18,855$
Total Hours Lost 76,476 56,450 78,063
Frequency Rate (per 1000) 78.6 66.8 66.8
Cost Rate (per 1000) 210,903$ 213,258$ 272,471$
Hours Lost Rate (per 1000) 16,019 10,742 14,768
Average Hours Lost 204 161 221
Average Cost 2,685$ 3,193$ 4,080$
Number of Employees 4,774 5,255 5,286
Lost Time Medical Only Fatality Total Claims Lost Time Medical Only Total Claims Lost Time Medical Only Total Claims
# of Injuries 64 293 - 357 76 251 327 66 191 257
Total Program Cost 5,222,537$ 379,495$ -$ 5,602,031$ 5,569,326$ 357,427$ 5,926,753$ 5,583,393$ 317,756$ 5,901,149$
Indemnity 2,914,330$ -$ -$ 2,914,330$ 2,920,162$ -$ 2,920,162$ 3,036,769$ -$ 3,036,769$
Medical 1,683,718$ 370,820$ -$ 2,054,538$ 2,015,103$ 346,487$ 2,361,589$ 1,835,357$ 305,867$ 2,141,224$
Expense 207,617$ 8,675$ -$ 216,291$ 205,427$ 6,376$ 211,803$ 251,668$ 5,707$ 257,375$
Legal 412,679$ -$ -$ 412,679$ 378,569$ 378,569$ 418,895$ -$ 418,895$
Vocational Rehab 4,193$ -$ -$ 4,193$ 50,065$ 4,565$ 54,630$ 40,704$ 6,182$ 46,886$
Total Injury Date Costs 802,144$ 248,717$ -$ 1,050,862$ 1,062,320$ 231,969$ 1,294,289$ 529,933$ 152,205$ 682,138$
Indemnity 315,602$ -$ -$ 315,602$ 320,652$ -$ 320,652$ 157,772$ -$ 157,772$
Medical 450,755$ 246,123$ -$ 696,877$ 677,192$ 224,799$ 901,991$ 325,617$ 149,428$ 475,045$
Expense 20,028$ 2,595$ -$ 22,622$ 16,924$ 2,605$ 19,529$ 13,530$ 520$ 14,050$
Legal 15,760$ -$ -$ 15,760$ 11,434$ -$ 11,434$ 25,847$ -$ 25,847$
Vocational Rehab -$ -$ -$ -$ 36,118$ 4,565$ 40,683$ 7,167$ 2,257$ 9,424$
Total Hours Lost 75,025 71,704 58,843
Frequency Rate (per 1000) 139.9 126.2 102.0
Cost Rate (per 1000) 411,941$ 499,340$ 270,690$
Hours Lost Rate (per 1000) 29,410 27,664 23,350
Average Hours Lost 210 219 229
Average Cost 2,944$ 3,958$ 2,654$
Number of Employees 2,551 2,592 2,520
FY 12/13 FY 13/14
FY 13/14FY 11/12
FY 11/12
Liq
uor
Contr
ol Board
Military
and V
ete
rans A
ffairs
FY 12/13
24

Lost Time Medical Only Fatality Total Claims Lost Time Medical Only Total Claims Lost Time Medical Only Total Claims
# of Injuries - 1 - 1 - 1 1 1 1 2
Total Program Cost 898$ 2,030$ -$ 2,929$ 171$ 4,774$ 4,945$ 2,948$ 391$ 3,339$
Indemnity -$ -$ -$ -$ -$ -$ -$ 1,757$ -$ 1,757$
Medical 898$ 2,030$ -$ 2,929$ 171$ 4,774$ 4,945$ 1,191$ 391$ 1,582$
Expense -$ -$ -$ -$ -$ -$ -$ -$ -$
Legal -$ -$ -$ -$ -$ -$ -$ -$ -$ -$
Vocational Rehab -$ -$ -$ -$ -$ -$ -$ -$ -$ -$
Total Injury Date Costs -$ 2,030$ -$ 2,030$ -$ 4,580$ 4,580$ 2,948$ 341$ 3,289$
Indemnity -$ -$ -$ -$ -$ -$ -$ 1,757$ -$ 1,757$
Medical -$ 2,030$ -$ 2,030$ -$ 4,580$ 4,580$ 1,191$ 341$ 1,532$
Expense -$ -$ -$ -$ -$ -$ -$ -$ -$ -$
Legal -$ -$ -$ -$ -$ -$ -$ -$ -$ -$
Vocational Rehab -$ -$ -$ -$ -$ -$ -$ -$ -$ -$
Total Hours Lost 8 - 101
Frequency Rate (per 1000) 40.4 40.0 83.3
Cost Rate (per 1000) 82,032$ 183,200$ 137,042$
Hours Lost Rate (per 1000) 303 - 4,208
Average Hours Lost 8 - 51
Average Cost 2,030$ 4,580$ 1,645$
Number of Employees 25 25 24
Lost Time Medical Only Fatality Total Claims Lost Time Medical Only Total Claims Lost Time Medical Only Total Claims
# of Injuries 2 3 - 5 - 1 1 - 1 1
Total Program Cost 20,211$ 2,694$ -$ 22,905$ -$ 1,370$ 1,370$ 1,296$ 463$ 1,759$
Indemnity 8,367$ -$ -$ 8,367$ -$ -$ -$ -$ -$ -$
Medical 11,844$ 2,694$ -$ 14,538$ -$ 1,370$ 1,370$ -$ 463$ 463$
Expense -$ -$ -$ -$ -$ -$ -$ 117$ -$ 117$
Legal -$ -$ -$ -$ -$ -$ -$ 1,179$ -$ 1,179$
Vocational Rehab -$ -$ -$ -$ -$ -$ -$ -$ -$ -$
Total Injury Date Costs 7,319$ 2,694$ -$ 10,012$ -$ 1,370$ 1,370$ -$ 464$ 464$
Indemnity 5,919$ -$ -$ 5,919$ -$ -$ -$ -$ -$ -$
Medical 1,400$ 2,694$ -$ 4,094$ -$ 1,370$ 1,370$ -$ 464$ 464$
Expense -$ -$ -$ -$ -$ -$ -$ -$ -$ -$
Legal -$ -$ -$ -$ -$ -$ -$ -$ -$
Vocational Rehab -$ -$ -$ -$ -$ -$ -$ -$ -$ -$
Total Hours Lost 696 - 25
Frequency Rate (per 1000) 52.1 33.3 33.3
Cost Rate (per 1000) 104,296$ 45,667$ 15,467$
Hours Lost Rate (per 1000) 7,250 - 833
Average Hours Lost 139 - 25
Average Cost 2,002$ 1,370$ 464$
Number of Employees 96 30 30
FY 13/14
FY 13/14FY 11/12
FY 11/12
Milk M
ark
eting B
oard
Munic
ipal Retire
ment
Syste
mFY 12/13
FY 12/13
25
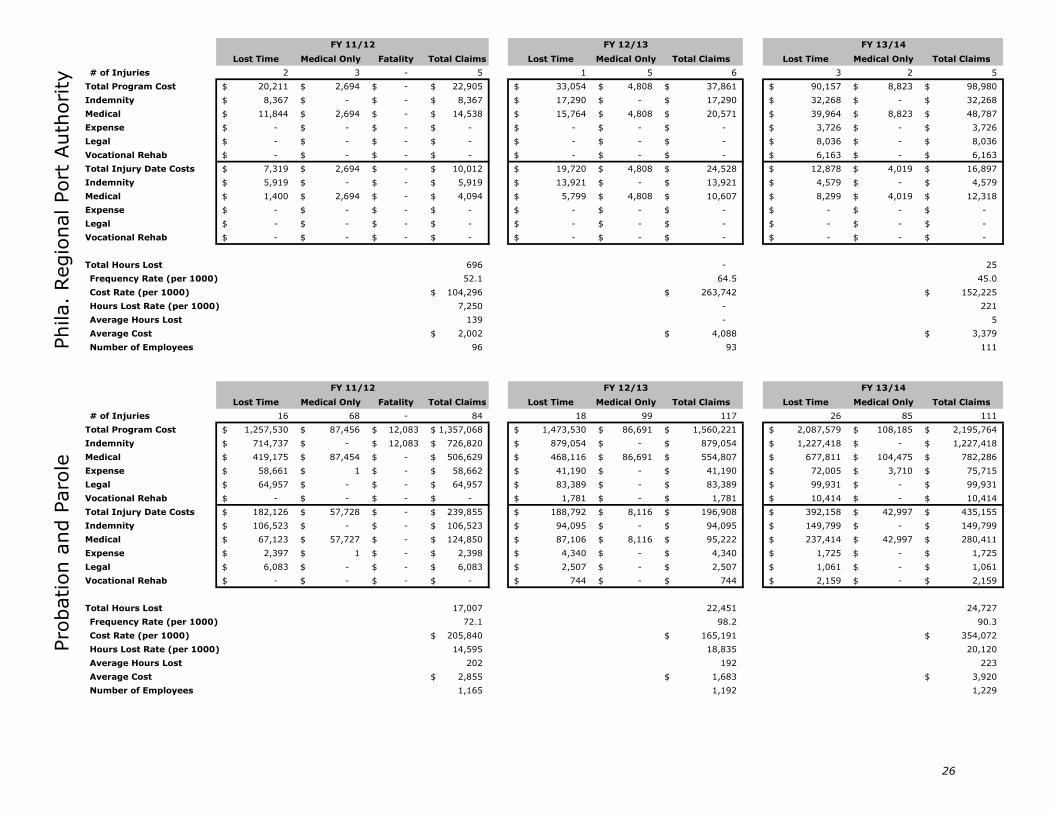
Lost Time Medical Only Fatality Total Claims Lost Time Medical Only Total Claims Lost Time Medical Only Total Claims
# of Injuries 2 3 - 5 1 5 6 3 2 5
Total Program Cost 20,211$ 2,694$ -$ 22,905$ 33,054$ 4,808$ 37,861$ 90,157$ 8,823$ 98,980$
Indemnity 8,367$ -$ -$ 8,367$ 17,290$ -$ 17,290$ 32,268$ -$ 32,268$
Medical 11,844$ 2,694$ -$ 14,538$ 15,764$ 4,808$ 20,571$ 39,964$ 8,823$ 48,787$
Expense -$ -$ -$ -$ -$ -$ -$ 3,726$ -$ 3,726$
Legal -$ -$ -$ -$ -$ -$ -$ 8,036$ -$ 8,036$
Vocational Rehab -$ -$ -$ -$ -$ -$ -$ 6,163$ -$ 6,163$
Total Injury Date Costs 7,319$ 2,694$ -$ 10,012$ 19,720$ 4,808$ 24,528$ 12,878$ 4,019$ 16,897$
Indemnity 5,919$ -$ -$ 5,919$ 13,921$ -$ 13,921$ 4,579$ -$ 4,579$
Medical 1,400$ 2,694$ -$ 4,094$ 5,799$ 4,808$ 10,607$ 8,299$ 4,019$ 12,318$
Expense -$ -$ -$ -$ -$ -$ -$ -$ -$ -$
Legal -$ -$ -$ -$ -$ -$ -$ -$ -$ -$
Vocational Rehab -$ -$ -$ -$ -$ -$ -$ -$ -$ -$
Total Hours Lost 696 - 25
Frequency Rate (per 1000) 52.1 64.5 45.0
Cost Rate (per 1000) 104,296$ 263,742$ 152,225$
Hours Lost Rate (per 1000) 7,250 - 221
Average Hours Lost 139 - 5
Average Cost 2,002$ 4,088$ 3,379$
Number of Employees 96 93 111
Lost Time Medical Only Fatality Total Claims Lost Time Medical Only Total Claims Lost Time Medical Only Total Claims
# of Injuries 16 68 - 84 18 99 117 26 85 111
Total Program Cost 1,257,530$ 87,456$ 12,083$ 1,357,068$ 1,473,530$ 86,691$ 1,560,221$ 2,087,579$ 108,185$ 2,195,764$
Indemnity 714,737$ -$ 12,083$ 726,820$ 879,054$ -$ 879,054$ 1,227,418$ -$ 1,227,418$
Medical 419,175$ 87,454$ -$ 506,629$ 468,116$ 86,691$ 554,807$ 677,811$ 104,475$ 782,286$
Expense 58,661$ 1$ -$ 58,662$ 41,190$ -$ 41,190$ 72,005$ 3,710$ 75,715$
Legal 64,957$ -$ -$ 64,957$ 83,389$ -$ 83,389$ 99,931$ -$ 99,931$
Vocational Rehab -$ -$ -$ -$ 1,781$ -$ 1,781$ 10,414$ -$ 10,414$
Total Injury Date Costs 182,126$ 57,728$ -$ 239,855$ 188,792$ 8,116$ 196,908$ 392,158$ 42,997$ 435,155$
Indemnity 106,523$ -$ -$ 106,523$ 94,095$ -$ 94,095$ 149,799$ -$ 149,799$
Medical 67,123$ 57,727$ -$ 124,850$ 87,106$ 8,116$ 95,222$ 237,414$ 42,997$ 280,411$
Expense 2,397$ 1$ -$ 2,398$ 4,340$ -$ 4,340$ 1,725$ -$ 1,725$
Legal 6,083$ -$ -$ 6,083$ 2,507$ -$ 2,507$ 1,061$ -$ 1,061$
Vocational Rehab -$ -$ -$ -$ 744$ -$ 744$ 2,159$ -$ 2,159$
Total Hours Lost 17,007 22,451 24,727
Frequency Rate (per 1000) 72.1 98.2 90.3
Cost Rate (per 1000) 205,840$ 165,191$ 354,072$
Hours Lost Rate (per 1000) 14,595 18,835 20,120
Average Hours Lost 202 192 223
Average Cost 2,855$ 1,683$ 3,920$
Number of Employees 1,165 1,192 1,229
FY 13/14
FY 13/14
FY 11/12
FY 11/12
Pro
bation a
nd P
aro
lePhila.
Regio
nal Port
Auth
ority
FY 12/13
FY 12/13
26
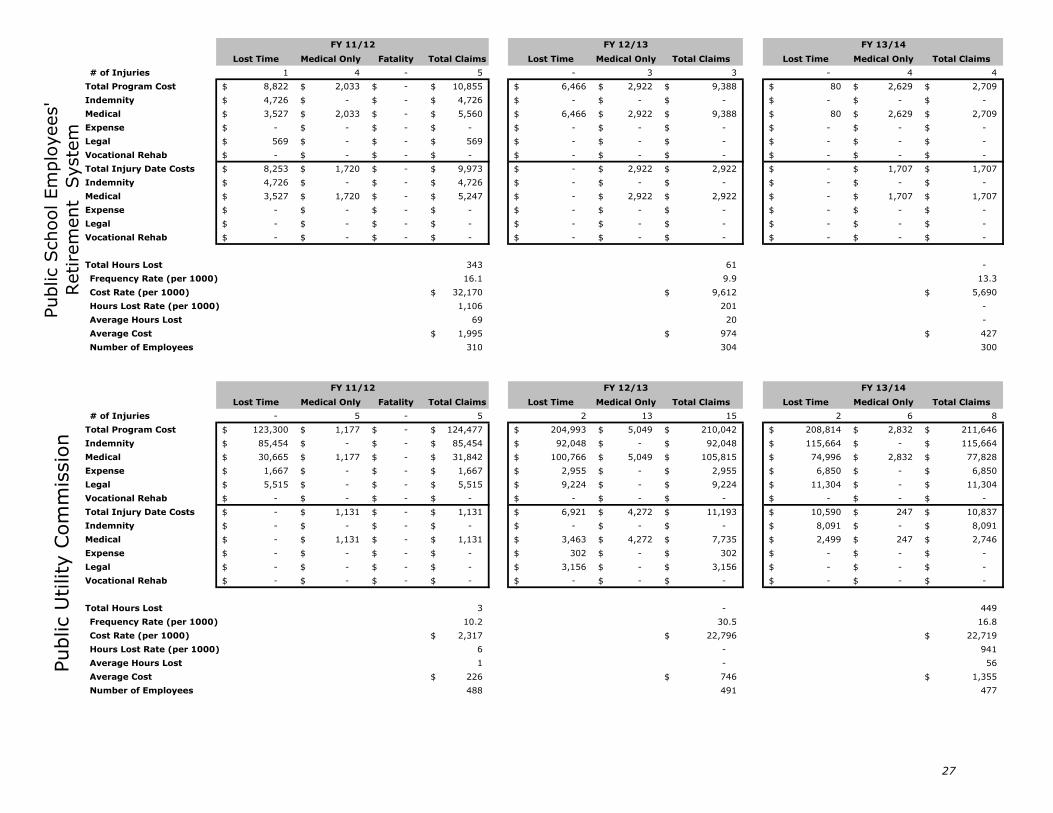
Lost Time Medical Only Fatality Total Claims Lost Time Medical Only Total Claims Lost Time Medical Only Total Claims
# of Injuries 1 4 - 5 - 3 3 - 4 4
Total Program Cost 8,822$ 2,033$ -$ 10,855$ 6,466$ 2,922$ 9,388$ 80$ 2,629$ 2,709$
Indemnity 4,726$ -$ -$ 4,726$ -$ -$ -$ -$ -$ -$
Medical 3,527$ 2,033$ -$ 5,560$ 6,466$ 2,922$ 9,388$ 80$ 2,629$ 2,709$
Expense -$ -$ -$ -$ -$ -$ -$ -$ -$ -$
Legal 569$ -$ -$ 569$ -$ -$ -$ -$ -$ -$
Vocational Rehab -$ -$ -$ -$ -$ -$ -$ -$ -$ -$
Total Injury Date Costs 8,253$ 1,720$ -$ 9,973$ -$ 2,922$ 2,922$ -$ 1,707$ 1,707$
Indemnity 4,726$ -$ -$ 4,726$ -$ -$ -$ -$ -$ -$
Medical 3,527$ 1,720$ -$ 5,247$ -$ 2,922$ 2,922$ -$ 1,707$ 1,707$
Expense -$ -$ -$ -$ -$ -$ -$ -$ -$ -$
Legal -$ -$ -$ -$ -$ -$ -$ -$ -$ -$
Vocational Rehab -$ -$ -$ -$ -$ -$ -$ -$ -$ -$
Total Hours Lost 343 61 -
Frequency Rate (per 1000) 16.1 9.9 13.3
Cost Rate (per 1000) 32,170$ 9,612$ 5,690$
Hours Lost Rate (per 1000) 1,106 201 -
Average Hours Lost 69 20 -
Average Cost 1,995$ 974$ 427$
Number of Employees 310 304 300
Lost Time Medical Only Fatality Total Claims Lost Time Medical Only Total Claims Lost Time Medical Only Total Claims
# of Injuries - 5 - 5 2 13 15 2 6 8
Total Program Cost 123,300$ 1,177$ -$ 124,477$ 204,993$ 5,049$ 210,042$ 208,814$ 2,832$ 211,646$
Indemnity 85,454$ -$ -$ 85,454$ 92,048$ -$ 92,048$ 115,664$ -$ 115,664$
Medical 30,665$ 1,177$ -$ 31,842$ 100,766$ 5,049$ 105,815$ 74,996$ 2,832$ 77,828$
Expense 1,667$ -$ -$ 1,667$ 2,955$ -$ 2,955$ 6,850$ -$ 6,850$
Legal 5,515$ -$ -$ 5,515$ 9,224$ -$ 9,224$ 11,304$ -$ 11,304$
Vocational Rehab -$ -$ -$ -$ -$ -$ -$ -$ -$ -$
Total Injury Date Costs -$ 1,131$ -$ 1,131$ 6,921$ 4,272$ 11,193$ 10,590$ 247$ 10,837$
Indemnity -$ -$ -$ -$ -$ -$ -$ 8,091$ -$ 8,091$
Medical -$ 1,131$ -$ 1,131$ 3,463$ 4,272$ 7,735$ 2,499$ 247$ 2,746$
Expense -$ -$ -$ -$ 302$ -$ 302$ -$ -$ -$
Legal -$ -$ -$ -$ 3,156$ -$ 3,156$ -$ -$ -$
Vocational Rehab -$ -$ -$ -$ -$ -$ -$ -$ -$ -$
Total Hours Lost 3 - 449
Frequency Rate (per 1000) 10.2 30.5 16.8
Cost Rate (per 1000) 2,317$ 22,796$ 22,719$
Hours Lost Rate (per 1000) 6 - 941
Average Hours Lost 1 - 56
Average Cost 226$ 746$ 1,355$
Number of Employees 488 491 477
FY 13/14
FY 13/14
FY 11/12
FY 11/12
Public U
tility
Com
mis
sio
nPublic S
chool Em
plo
yees'
Retire
ment
Syste
m
FY 12/13
FY 12/13
27

Lost Time Medical Only Fatality Total Claims Lost Time Medical Only Total Claims Lost Time Medical Only Total Claims
# of Injuries 5 24 - 29 7 29 36 10 25 35
Total Program Cost 521,426$ 35,279$ 13,425$ 570,130$ 616,938$ 29,334$ 646,273$ 904,135$ 21,008$ 925,143$
Indemnity 301,394$ -$ 13,425$ 314,819$ 322,404$ -$ 322,404$ 462,290$ -$ 462,290$
Medical 134,586$ 33,579$ -$ 168,166$ 247,555$ 28,344$ 275,900$ 363,394$ 21,008$ 384,402$
Expense 16,544$ 1,700$ -$ 18,244$ 12,174$ 990$ 13,164$ 27,022$ -$ 27,022$
Legal 68,902$ -$ -$ 68,902$ 26,970$ -$ 26,970$ 40,630$ -$ 40,630$
Vocational Rehab -$ -$ -$ -$ 7,836$ -$ 7,836$ 10,799$ -$ 10,799$
Total Injury Date Costs 10,916$ 23,613$ -$ 34,529$ 81,955$ 18,775$ 100,730$ 160,289$ 12,413$ 172,702$
Indemnity 2,923$ -$ -$ 2,923$ 25,194$ -$ 25,194$ 77,621$ -$ 77,621$
Medical 6,669$ 23,613$ -$ 30,282$ 44,972$ 18,775$ 63,747$ 75,320$ 12,413$ 87,733$
Expense -$ -$ -$ -$ 1,881$ -$ 1,881$ -$ -$ -$
Legal 1,325$ -$ -$ 1,325$ 2,878$ -$ 2,878$ 751$ -$ 751$
Vocational Rehab -$ -$ -$ -$ 7,030$ -$ 7,030$ 6,597$ -$ 6,597$
Total Hours Lost 873 3,961 11,673
Frequency Rate (per 1000) 14.0 18.3 18.0
Cost Rate (per 1000) 16,623$ 51,340$ 88,702$
Hours Lost Rate (per 1000) 420 2,019 5,995
Average Hours Lost 30 110 334
Average Cost 1,191$ 2,798$ 4,934$
Number of Employees 2,077 1,962 1,947
Lost Time Medical Only Fatality Total Claims Lost Time Medical Only Total Claims Lost Time Medical Only Total Claims
# of Injuries 2 8 - 10 3 12 15 2 15 17
Total Program Cost 83,300$ 13,312$ -$ 96,612$ 200,161$ 4,814$ 204,975$ 146,476$ 17,318$ 163,794$
Indemnity 25,276$ -$ -$ 25,276$ 54,285$ -$ 54,285$ 42,378$ -$ 42,378$
Medical 25,228$ 13,312$ -$ 38,541$ 128,665$ 4,814$ 133,479$ 99,869$ 17,318$ 117,187$
Expense 6,419$ -$ -$ 6,419$ 7,241$ -$ 7,241$ -$ -$ -$
Legal 26,377$ -$ -$ 26,377$ 7,980$ -$ 7,980$ 4,229$ -$ 4,229$
Vocational Rehab -$ -$ -$ -$ 1,990$ -$ 1,990$ -$ -$ -$
Total Injury Date Costs 84$ 13,258$ -$ 13,342$ 97,417$ 3,508$ 100,925$ 67,786$ 15,659$ 83,445$
Indemnity -$ -$ -$ -$ 26,004$ -$ 26,004$ 19,709$ -$ 19,709$
Medical 84$ 13,258$ -$ 13,342$ 68,736$ 3,508$ 72,244$ 48,077$ 15,659$ 63,736$
Expense -$ -$ -$ -$ 687$ -$ 687$ -$ -$ -$
Legal -$ -$ -$ -$ -$ -$ -$ -$ -$ -$
Vocational Rehab -$ -$ -$ -$ 1,990$ -$ 1,990$ -$ -$ -$
Total Hours Lost - - 11,673
Frequency Rate (per 1000) 12.5 20.3 21.1
Cost Rate (per 1000) 16,740$ 136,385$ 103,530$
Hours Lost Rate (per 1000) - - 14,482
Average Hours Lost - - 687
Average Cost 1,334$ 6,728$ 4,909$
Number of Employees 797 740 806
FY 13/14
FY 13/14FY 11/12
FY 11/12
Senate
Revenue
FY 12/13
FY 12/13
28

Lost Time Medical Only Fatality Total Claims Lost Time Medical Only Total Claims Lost Time Medical Only Total Claims
# of Injuries 1 4 - 5 2 8 10 4 10 14
Total Program Cost 106,397$ 7,069$ -$ 113,466$ 178,656$ 18,891$ 197,547$ 176,782$ 5,941$ 182,723$
Indemnity 78,371$ -$ -$ 78,371$ 124,479$ -$ 124,479$ 67,557$ -$ 67,557$
Medical 22,041$ 7,069$ -$ 29,110$ 45,393$ 18,891$ 64,284$ 107,732$ 5,941$ 113,673$
Expense 2,950$ -$ -$ 2,950$ 50$ -$ 50$ -$ -$ -$
Legal 3,034$ -$ -$ 3,034$ 8,734$ -$ 8,734$ 1,493$ -$ 1,493$
Vocational Rehab -$ -$ -$ -$ -$ -$ -$ -$ -$ -$
Total Injury Date Costs 1,495$ 461$ -$ 1,956$ 1,844$ 16,103$ 17,947$ 98,582$ 2,470$ 101,052$
Indemnity -$ -$ -$ -$ -$ -$ -$ 34,773$ -$ 34,773$
Medical 415$ 461$ -$ 876$ 1,844$ 16,103$ 17,947$ 63,809$ 2,470$ 66,279$
Expense -$ -$ -$ -$ -$ -$ -$ -$ -$ -$
Legal 1,081$ -$ -$ 1,081$ -$ -$ -$ -$ -$ -$
Vocational Rehab -$ -$ -$ -$ -$ -$ -$ -$ -$ -$
Total Hours Lost 898 743 3,150
Frequency Rate (per 1000) 6.7 13.6 18.5
Cost Rate (per 1000) 2,625$ 24,351$ 133,667$
Hours Lost Rate (per 1000) 1,205 1,008 4,167
Average Hours Lost 180 74 225
Average Cost 391$ 1,795$ 7,218$
Number of Employees 745 737 756
Lost Time Medical Only Fatality Total Claims Lost Time Medical Only Total Claims Lost Time Medical Only Total Claims
# of Injuries - 1 - 1 - 2 2 1 - 1
Total Program Cost -$ 7,039$ -$ 7,039$ 9,584$ 3,326$ 12,910$ 66,700$ -$ 66,700$
Indemnity -$ -$ -$ -$ -$ -$ -$ 39,684$ -$ 39,684$
Medical -$ 7,039$ -$ 7,039$ 5,213$ 3,326$ 8,539$ 21,869$ -$ 21,869$
Expense -$ -$ -$ -$ 1,497$ -$ 1,497$ 399$ -$ 399$
Legal -$ -$ -$ -$ 2,873$ -$ 2,873$ 4,748$ -$ 4,748$
Vocational Rehab -$ -$ -$ -$ -$ -$ -$ -$ -$ -$
Total Injury Date Costs -$ 6,150$ -$ 6,150$ -$ 3,326$ 3,326$ 1,944$ -$ 1,944$
Indemnity -$ -$ -$ -$ -$ -$ -$ -$ -$ -$
Medical -$ 6,150$ -$ 6,150$ -$ 3,326$ 3,326$ -$ -$ -$
Expense -$ -$ -$ -$ -$ -$ -$ -$ -$ -$
Legal -$ -$ -$ -$ -$ -$ -$ 1,944$ -$ 1,944$
Vocational Rehab -$ -$ -$ -$ -$ -$ -$ -$ -$ -$
Total Hours Lost 14 3 -
Frequency Rate (per 1000) 5.7 11.1 5.6
Cost Rate (per 1000) 34,797$ 18,478$ 10,983$
Hours Lost Rate (per 1000) 81 17 -
Average Hours Lost 14 2 -
Average Cost 6,150$ 1,663$ 1,944$
Number of Employees 177 180 177
FY 13/14
FY 13/14FY 11/12
FY 11/12
Sta
te E
mplo
yees' Retire
ment
Syste
m
FY 12/13
FY 12/13
Sta
te
29

Lost Time Medical Only Fatality Total Claims Lost Time Medical Only Total Claims Lost Time Medical Only Total Claims
# of Injuries 77 364 - 441 109 408 517 95 353 448
Total Program Cost 4,467,777$ 417,424$ 340,157$ 5,225,357$ 5,134,870$ 559,556$ 5,694,426$ 6,934,480$ 408,735$ 7,343,215$
Indemnity 2,387,696$ (1,056)$ 339,143$ 2,725,783$ 2,736,890$ -$ 2,736,890$ 2,517,289$ 10,510$ 2,527,799$
Medical 1,878,734$ 414,517$ -$ 2,293,252$ 2,094,678$ 558,322$ 2,653,001$ 4,154,314$ 398,225$ 4,552,539$
Expense 86,089$ 3,962$ -$ 90,051$ 115,388$ 1,233$ 116,622$ 65,785$ -$ 65,785$
Legal 114,745$ -$ 1,014$ 115,759$ 127,905$ -$ 127,905$ 155,250$ -$ 155,250$
Vocational Rehab 512$ -$ -$ 512$ 60,009$ -$ 60,009$ 41,842$ -$ 41,842$
Total Injury Date Costs 1,437,443$ 277,086$ -$ 1,714,529$ 1,614,916$ 351,678$ 1,966,594$ 3,314,718$ 302,005$ 3,616,723$
Indemnity 656,244$ 634$ -$ 656,879$ 704,781$ -$ 704,781$ 518,683$ -$ 518,683$
Medical 749,952$ 276,452$ -$ 1,026,404$ 868,434$ 351,618$ 1,220,052$ 2,765,170$ 302,005$ 3,067,175$
Expense 27,071$ -$ -$ 27,071$ 7,098$ 60$ 7,158$ 3,409$ -$ 3,409$
Legal 4,176$ -$ -$ 4,176$ -$ -$ -$ 12,265$ -$ 12,265$
Vocational Rehab -$ -$ -$ -$ 34,603$ -$ 34,603$ 15,191$ -$ 15,191$
Total Hours Lost 67,583 65,771 50,035
Frequency Rate (per 1000) 73.6 85.0 70.8
Cost Rate (per 1000) 286,053$ 323,293$ 571,814$
Hours Lost Rate (per 1000) 11,276 10,812 7,911
Average Hours Lost 153 127 112
Average Cost 3,888$ 3,804$ 8,073$
Number of Employees 5,994 6,083 6,325
Lost Time Medical Only Fatality Total Claims Lost Time Medical Only Total Claims Lost Time Medical Only Total Claims
# of Injuries - 3 - 3 2 5 7 1 8 9
Total Program Cost 19,410$ 1,912$ -$ 21,322$ 53,518$ 2,023$ 55,541$ 26,140$ 6,312$ 32,452$
Indemnity 8,357$ -$ -$ 8,357$ 24,343$ -$ 24,343$ 19,192$ -$ 19,192$
Medical 9,454$ 1,912$ -$ 11,366$ 28,653$ 2,023$ 30,675$ 4,832$ 6,312$ 11,144$
Expense 1,600$ -$ -$ 1,600$ -$ -$ -$ 153$ -$ 153$
Legal -$ -$ -$ -$ 522$ -$ 522$ 1,963$ -$ 1,963$
Vocational Rehab -$ -$ -$ -$ -$ -$ -$ -$ -$ -$
Total Injury Date Costs -$ 1,912$ -$ 1,912$ 34,161$ 860$ 35,021$ 241$ 5,385$ 5,626$
Indemnity -$ -$ -$ -$ 5,151$ -$ 5,151$ -$ -$ -$
Medical -$ 1,912$ -$ 1,912$ 29,010$ 860$ 29,870$ 241$ 5,385$ 5,626$
Expense -$ -$ -$ -$ -$ -$ -$ -$ -$ -$
Legal -$ -$ -$ -$ -$ -$ -$ -$ -$ -$
Vocational Rehab -$ -$ -$ -$ -$ -$ -$ -$ -$ -$
Total Hours Lost - - 50,035
Frequency Rate (per 1000) 13.3 23.7 33.3
Cost Rate (per 1000) 8,497$ 118,715$ 20,837$
Hours Lost Rate (per 1000) - - 185,315
Average Hours Lost - - 5,559
Average Cost 637$ 5,003$ 625$
Number of Employees 225 295 270
FY 13/14
FY 11/12 FY 13/14
FY 11/12
Thaddeus S
tevens C
ollege
Sta
te P
olice
FY 12/13
FY 12/13
30
Lost Time Medical Only Fatality Total Claims Lost Time Medical Only Total Claims Lost Time Medical Only Total Claims
# of Injuries 204 728 1 933 220 715 935 216 571 787
Total Program Cost 10,704,975$ 684,749$ 518,184$ 11,907,908$ 12,186,932$ 759,670$ 12,946,602$ 13,424,163$ 665,972$ 14,090,135$
Indemnity 4,612,797$ -$ 416,483$ 5,029,279$ 5,562,883$ -$ 5,562,883$ 5,540,047$ 14,898$ 5,554,945$
Medical 4,909,680$ 668,359$ 90,172$ 5,668,211$ 5,605,537$ 735,406$ 6,340,944$ 6,745,643$ 648,547$ 7,394,190$
Expense 585,120$ 16,390$ 3,366$ 604,877$ 341,321$ 12,533$ 353,854$ 381,750$ 1,832$ 383,582$
Legal 597,378$ -$ 8,163$ 605,541$ 540,777$ -$ 540,777$ 601,058$ -$ 601,058$
Vocational Rehab -$ -$ -$ -$ 136,414$ 11,731$ 148,145$ 155,665$ 695$ 156,360$
Total Injury Date Costs 2,566,965$ 426,534$ 112,549$ 3,106,048$ 2,557,534$ 485,069$ 3,042,603$ 2,760,511$ 470,526$ 3,231,037$
Indemnity 944,228$ -$ 22,144$ 966,372$ 890,850$ -$ 890,850$ 907,052$ -$ 907,052$
Medical 1,493,469$ 425,842$ 89,199$ 2,008,510$ 1,540,691$ 469,977$ 2,010,668$ 1,772,244$ 469,311$ 2,241,555$
Expense 107,600$ 692$ 1,206$ 109,498$ 30,073$ 3,361$ 33,434$ 37,816$ 1,215$ 39,031$
Legal 21,669$ -$ -$ 21,669$ 17,462$ -$ 17,462$ 6,031$ -$ 6,031$
Vocational Rehab -$ -$ -$ -$ 78,458$ 11,731$ 90,189$ 37,368$ -$ 37,368$
Total Hours Lost 139,873 134,063 146,669
Frequency Rate (per 1000) 72.8 73.0 62.1
Cost Rate (per 1000) 242,395$ 237,407$ 255,035$
Hours Lost Rate (per 1000) 10,916 10,461 11,577
Average Hours Lost 150 143 186
Average Cost 3,329$ 3,254$ 4,106$
Number of Employees 12,814 12,816 12,669
Lost Time Medical Only Fatality Total Claims Lost Time Medical Only Total Claims Lost Time Medical Only Total Claims
# of Injuries 2 4 - 6 2 3 5 1 4 5
Total Program Cost 88,310$ 11,615$ -$ 99,925$ 148,080$ 1,615$ 149,695$ 132,409$ 2,153$ 134,562$
Indemnity 39,763$ -$ -$ 39,763$ 43,264$ -$ 43,264$ 39,908$ -$ 39,908$
Medical 45,465$ 9,870$ -$ 55,334$ 104,397$ 1,615$ 106,012$ 87,678$ 2,153$ 89,831$
Expense 1,022$ 1,745$ -$ 2,767$ -$ -$ -$ 3,621$ -$ 3,621$
Legal 2,061$ -$ -$ 2,061$ 85$ -$ 85$ 1,202$ -$ 1,202$
Vocational Rehab -$ -$ -$ -$ 334$ -$ 334$ -$ -$ -$
Total Injury Date Costs 1,296$ 1,929$ -$ 3,225$ 1,134$ 516$ 1,650$ 475$ 852$ 1,327$
Indemnity 552$ -$ -$ 552$ -$ -$ -$ -$ -$ -$
Medical 744$ 1,929$ -$ 2,673$ 800$ 516$ 1,316$ 475$ 852$ 1,327$
Expense -$ -$ -$ -$ -$ -$ -$ -$ -$ -$
Legal -$ -$ -$ -$ -$ -$ -$ -$ -$ -$
Vocational Rehab -$ -$ -$ -$ 334$ -$ 334$ -$ -$ -$
Total Hours Lost - - -
Frequency Rate (per 1000) 14.9 12.7 13.4
Cost Rate (per 1000) 8,022$ 4,188$ 3,558$
Hours Lost Rate (per 1000) - - -
Average Hours Lost - - -
Average Cost 537$ 330$ 265$
Number of Employees 402 394 373
FY 13/14
FY 13/14FY 11/12
FY 11/12
Tre
asury
Tra
nsport
ation
FY 12/13
FY 12/13
31