agency organization chart secretary of tolling craig stone ems5 0e216 director finance & program...
TRANSCRIPT

Agency Organization Chart
A-1

A-2

Citizens of the State of WashingtonGovernor Jay Inslee
Chief Executive OfficerSecretary of Transportation
L. Peterson
Deputy SecretaryC. Gilmour
Intergovernmental Relations
A. Camden
Audit OfficeS. McKerney
Attorney GeneralB. Brown
Equal OpportunityOffice
B. Nnambi
Assistant SecretaryStrategic, Enterprise & Employee Services
K. Taylor
Assistant SecretaryWashington State
Ferries
G. Capacci (Acting)
Assistant SecretaryEngineering &
Regional OperationsChief Engineer
L. Laird
Assistant SecretaryToll Division
C. Stone
Assistant SecretaryCommunity &
Economic Development
A. Scarton
Assistant SecretaryFinancial AdministrationChief Financial Officer
A. Arnis DeputyChief Engineer
Regional OperationsK. Metcalf
CommunicationsL. Erickson
Human Resources& SafetyJ. Pelton
Strategic Assessment & Performance
AnalysisD. Bremmer
Enterprise RiskManagement
J. Milton
InformationTechnology
G. Rodeheaver
State Rail &Marine Ports
R. Pate
Accounting &Financial Services
J. Dahl
Multi-modalPlanning
K. Woehler
LocalProgramsK. Davis
AviationT. Atkins
OperationsP. Rubstello
New CorridorsJ. White
FinanceE. Shumpert
Freight SystemsB. Ivanov
Public TransportationB. Lagerberg
Southwest RegionD. Wagner
Eastern RegionK. Metcalf
North CentralRegion
D. Sarles
Northwest RegionL. Eng
Olympic RegionK. Dayton
ConstructionJ. Carpenter
DevelopmentP. Bakotich
Alaska WayViaduct Project
T. Trepanier
SR 520 ProjectJ. Meredith
Maintenance &Operations
C. Christopher
Traffic OperationsJ. Nisbet
South CentralRegion
D. Whitehouse
Board of PilotageComm.
H. Dudley
Deputy ChiefConstruction & Ops
G. Capacci
Deputy ChiefFinance &
AdminstrationJ. Baker
OperationsS. Rodgers
Vessel Preservation& Maintenance
Vacant
TerminalEngineering
T. Smith
Budget & FinancialAnalysis
D. Vaughn
Capital ProgramDevelopment &ManagementJ. Alexander
Public-PrivatePartnerships
J. Doyle
Lynn Peterson
Date
07/01/14Tribal Relations Liaison
M. Cotton
Engineering Policy & Innovation
N. Boyd
A-3

A-4

Division Organization Charts
A-5

A-6

~
~ Washington State Department of Transportation
C;am GilmQur Chief Operating Officer
Deputy Secretary
Linea Laird Chief Engineer
Assistant Secretary Engineering & Regionai
OperP.tions
I I I .!i!ll Al~x§!ng~r I DQ!l9 Vi!!l9hn I Director
Director ' -Capital Program
Budget & Financial Development & Mgmt
Analysis
I Alyssa Devoe Pat Morin Lizbeth Martin-
Admin Assistant Asset Mgmt Ops & Andrea Duane Mahar Policy Mgr Executive Assistant Economic Analysis
Assist. Director
Faris AI-Memar Matt Neeley Systems Analysis & Priority Programming Elise Greet Rich Struna
Planning Mgr Mgr Budget Assist. Financial Planning Director Assist. Director
I I Laura Sanborn
John Jeffreys Program Analysis & Megan Atkinson
Federal Funds Mgr Mgmt Services Mgr Budget Assist.
Director
Gary Lebow Linda Kneeland Capital Budget Budget Analyst Delivery Mgr
Financial Administration
Aml£ Arni~ Chief Financial Officer Yumi Hong
Assistant Secretary Executive Assistant Financial Administration
J~noif~r Di!hl Director
Accounting & Financial Services
l_
Stephanie Grout Scott Kibler Accounting Ops
Admin Assistant Operations Assist. Director
1 Jamie Langford
Cindy Kay Financial Reporting Financial Systems & Consulting
Assist. Director Services Assist. Director
Dave Davis Procurement & Materials
Mgmt Assist. Director
I ~ Director
Public/Private Partnerships
I Tonia Buell
Project Develop. & Communications Mgr
4
-- 1
I I I I I I I I I I I I I
--'
8/25/2014 A-7

A-8
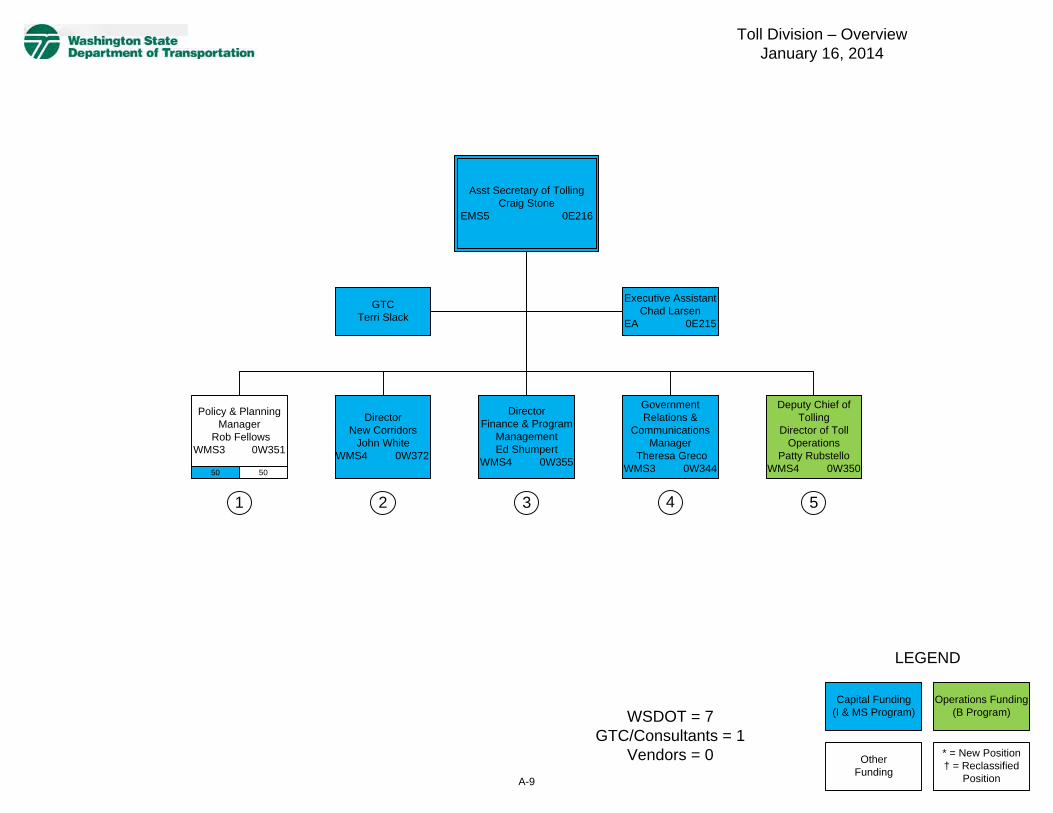
Asst Secretary of TollingCraig Stone
EMS5 0E216
DirectorFinance & Program
ManagementEd Shumpert
WMS4 0W355
Deputy Chief of Tolling
Director of TollOperations
Patty RubstelloWMS4 0W350
Government Relations &
Communications Manager
Theresa GrecoWMS3 0W344
DirectorNew Corridors
John WhiteWMS4 0W372
Executive AssistantChad Larsen
EA 0E215
GTCTerri Slack
Toll Division – OverviewJanuary 16, 2014
Operations Funding(B Program)
Capital Funding(I & MS Program)
OtherFunding
LEGEND
* = New Position† = Reclassified
Position
WSDOT = 7GTC/Consultants = 1
Vendors = 0
Policy & Planning Manager
Rob FellowsWMS3 0W351
50 50
2 3 4 51
A-9
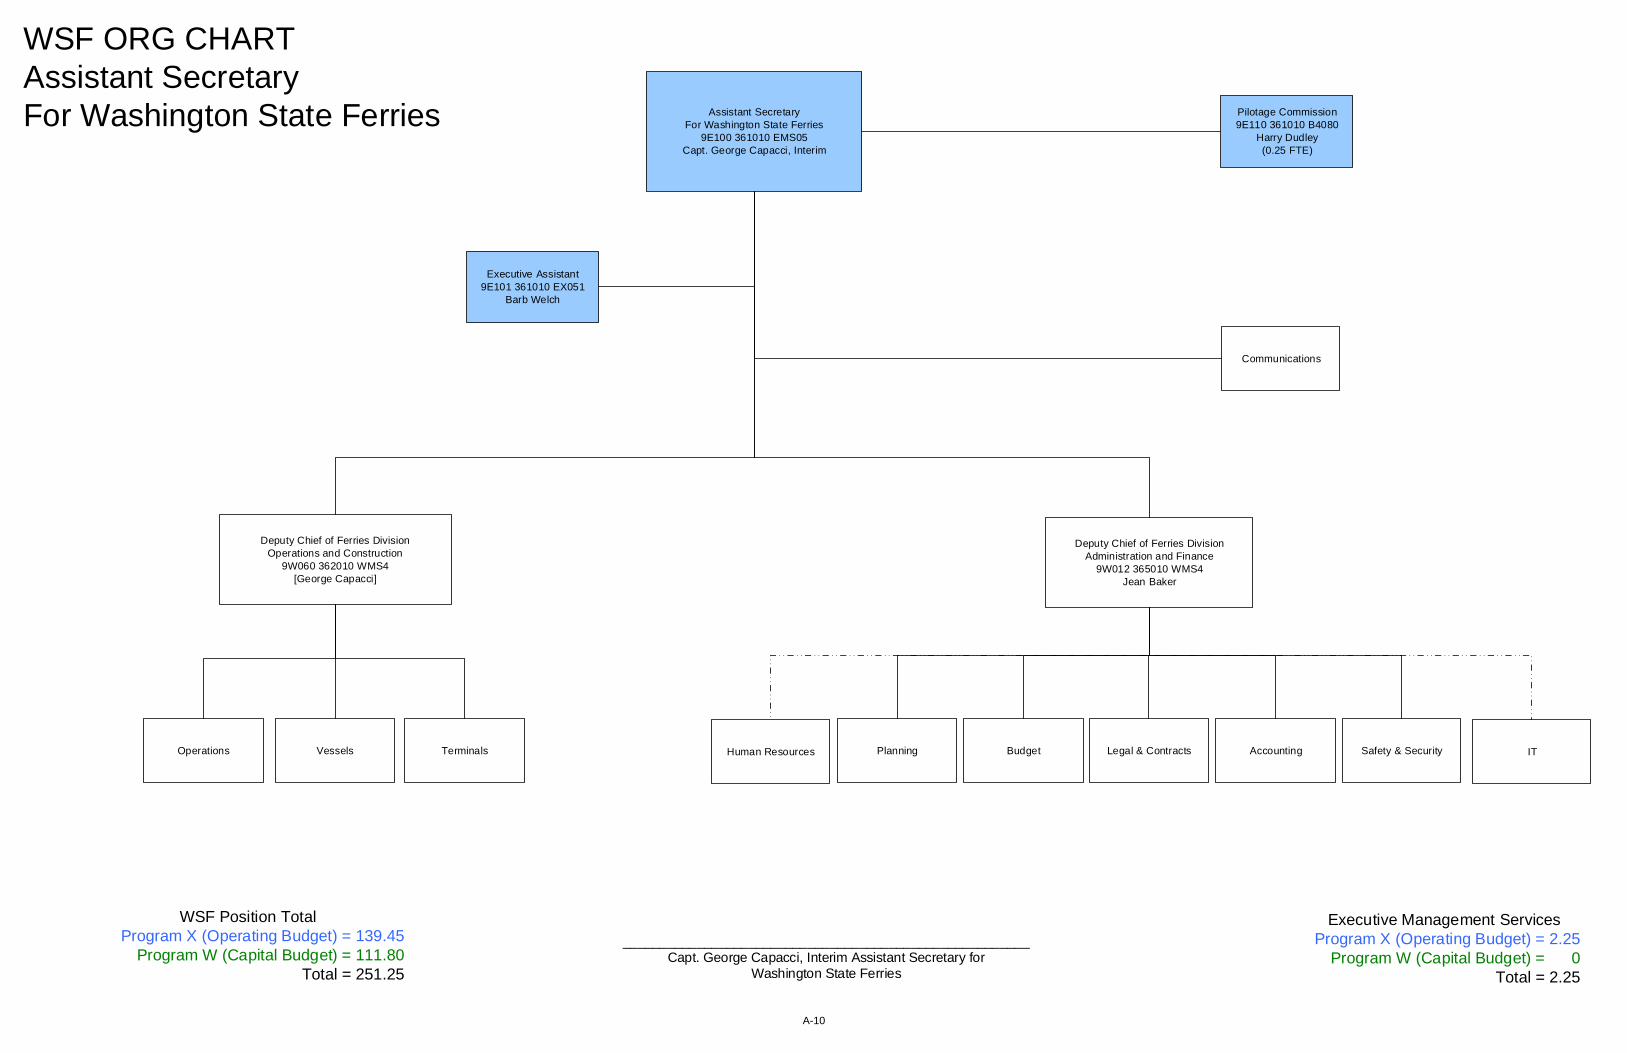
WSF ORG CHARTAssistant SecretaryFor Washington State Ferries Assistant Secretary
For Washington State Ferries9E100 361010 EMS05
Capt. George Capacci, Interim
Executive Assistant9E101 361010 EX051
Barb Welch
Pilotage Commission9E110 361010 B4080
Harry Dudley (0.25 FTE)
Deputy Chief of Ferries Division Administration and Finance
9W012 365010 WMS4Jean Baker
Deputy Chief of Ferries DivisionOperations and Construction
9W060 362010 WMS4[George Capacci]
Safety & SecurityPlanning Budget AccountingLegal & Contracts
Executive Management ServicesProgram X (Operating Budget) = 2.25
Program W (Capital Budget) = 0Total = 2.25
_______________________________________________________Capt. George Capacci, Interim Assistant Secretary for
Washington State Ferries
TerminalsVesselsOperations
Communications
WSF Position TotalProgram X (Operating Budget) = 139.45
Program W (Capital Budget) = 111.80 Total = 251.25
Human Resources IT
A-10

Agency Activity Inventory Report
A-11

A-12

405 - Department of Transportation B001 Tolling Maintenance and Preservation This activity provides statewide maintenance and preservation of the Tacoma Narrows Bridge, State Route 167, and State Route 520. It also includes inspections, erosion prevention, landscape maintenance, snow and ice removal, bridge deck repair, and painting. FY 2016 FY 2017 Biennial Total FTE's 20.9 29.3 25.1 GFS $0 $0 $0 Other $2,285,000 $3,053,000 $5,338,000 Total $2,285,000 $3,053,000 $5,338,000 Statewide Result Area: Prosperous Economy Statewide Strategy: Manage mobility system demand and maximize operations Expected Results To improve the predictable movement of goods and people throughout the system. B002 Tolling Operations This activity is responsible for current and future statewide toll collection operations, including toll account management, customer service, and toll payment enforcement in order to safeguard state assets. The activity manages the quality and efficiency of toll operations for state transportation facilities financed through direct user fees or tolls. Toll Operations is responsible to forecast and analyze traffic, revenue, operations, and maintenance costs for the purpose of recommending toll schedule adjustments to the toll setting authority. It also provides statewide tolling operations, which currently include the Tacoma Narrows Bridge, State Route 167, and State Route 520. FY 2016 FY 2017 Biennial Total FTE's 46.0 56.4 51.2 GFS $0 $0 $0 Other $38,024,000 $45,163,000 $83,187,000 Total $38,024,000 $45,163,000 $83,187,000 Statewide Result Area: Prosperous Economy Statewide Strategy: Manage mobility system demand and maximize operations Expected Results To improve the predictable movement of goods and people throughout the system.
C001 Implementing Systems This activity provides management of the department's architectural environment for enterprise business applications. It also includes project management knowledge and expertise, project planning, project execution, project coordination, and oversight of enterprise technology projects.
A-13

FY 2016 FY 2017 Biennial Total FTE's 7.9 8.1 8.0 GFS $0 $0 $0 Other $866,000 $970,000 $1,836,000 Total $866,000 $970,000 $1,836,000 Statewide Result Area: Prosperous Economy Statewide Strategy: Effective transportation system governance and management Expected Results To continuously improve the quality, effectiveness, and efficiency of the transportation system. C002 Region Services This activity provides operational coordination of distributed technology units across the department statewide. Geographically dispersed business units, including the department's six regional locations and the Washington State Ferries that require on-site technology, operational support, and services. These dispersed technology groups also serve the department's more remote locations such as maintenance shops and highway construction project offices. FY 2016 FY 2017 Biennial Total FTE's 99.2 100.6 99.9 GFS $0 $0 $0 Other $14,209,000 $16,035,000 $30,244,000 Total $14,209,000 $16,035,000 $30,244,000 Statewide Result Area: Prosperous Economy Statewide Strategy: Effective transportation system governance and management Expected Results To continuously improve the quality, effectiveness, and efficiency of the transportation system. C003 Systems Maintenance This activity provides management for the enterprise mainframe operations, server operations, network infrastructure, data management, enterprise software license management, and support and maintenance of enterprise business applications. FY 2016 FY 2017 Biennial Total FTE's 116.4 118.0 117.2 GFS $0 $0 $0 Other $20,506,000 $22,463,000 $42,969,000 Total $20,506,000 $22,463,000 $42,969,000 Statewide Result Area: Prosperous Economy Statewide Strategy: Effective transportation system governance and management
A-14

Expected Results To continuously improve the quality, effectiveness, and efficiency of the transportation system. D001 Capital Facilities Maintenance and Operation This activity operates, maintains, and is responsible for capital improvements and preservation of 966 department-owned buildings and structures at 289 separate sites across the state. Sites include region headquarters, maintenance shops, project engineer offices, laboratories, materials storage sites, communication sites, pits, quarries, and stock pile storage areas. FY 2016 FY 2017 Biennial Total FTE's 79.5 83.9 81.7 GFS $0 $0 $0 Other $13,557,000 $14,275,000 $27,832,000 Total $13,557,000 $14,275,000 $27,832,000 Statewide Result Area: Prosperous Economy Statewide Strategy: Preserve and maintain state, regional and local transportation systems Expected Results To maintain, preserve, and extend the life and utility of prior investments in transportation systems and services. D00C Capital Facilities Capital Improvements This activity includes replacement, preservation, and improvements to the department's buildings and related sites. It focuses on providing a safe and efficient work environment by preserving the department's assets. The activity also performs preservation projects such as roof replacements, site environmental cleanups, and other code compliance requirements for facilities. FY 2016 FY 2017 Biennial Total FTE's 7.5 7.5 7.5 GFS $0 $0 $0 Other $3,131,000 $3,142,000 $6,273,000 Total $3,131,000 $3,142,000 $6,273,000 Statewide Result Area: Prosperous Economy Statewide Strategy: Preserve and maintain state, regional and local transportation systems Expected Results To improve the predictable movement of goods and people through the system. E001 Transportation Equipment Fund Fuel Operations This activity includes services by the Transportation Equipment Fund that owns, operates, and maintains 129 vehicle fuel stations throughout the state, which provide fuel to the Department of
A-15

Transportation, State Patrol, and approximately 100 other governmental agencies. This includes ensuring 24-hour access to fuel during regular operations as well as during inclement weather, earthquakes, or other emergencies. FY 2016 FY 2017 Biennial Total FTE's 4.8 4.8 4.8 GFS $0 $0 $0 Other $25,308,000 $25,945,000 $51,253,000 Total $25,308,000 $25,945,000 $51,253,000 Statewide Result Area: Prosperous Economy Statewide Strategy: Preserve and maintain state, regional and local transportation systems Expected Results To maintain, preserve, and extend the life and utility of prior investments in transportation systems and services. E002 Transportation Equipment Fund Equipment Operations This activity includes services by the Transportation Equipment Fund that provide mission critical vehicles, equipment, and wireless communication systems to agency programs so that they can accomplish their missions, such as emergency communications, emergency response, snow and ice removal, roadway maintenance, bridge maintenance, field engineering, traffic control, highway construction, and responding to natural disasters. It also includes the costs of equipment replacement, maintenance and repair, fleet management, logistical support, equipment disposal, and inventory management. FY 2016 FY 2017 Biennial Total FTE's 204.1 204.9 204.5 GFS $0 $0 $0 Other $49,563,000 $50,824,000 $100,387,000 Total $49,563,000 $50,824,000 $100,387,000 Statewide Result Area: Prosperous Economy Statewide Strategy: Preserve and maintain state, regional and local transportation systems Expected Results To maintain, preserve, and extend the life and utility of prior investments in transportation systems and services.
F001 Aviation Planning, Operations, and Airport Investment This activity preserves an adequate system of 136 public use airports, promotes the benefits of airports, advocates for aviation safety, provides air search and rescue, and manages state airports. Activities include the airport aid grant program, aviation system and land use planning, air search and rescue operations, aircraft registration, and maintenance of 16 state-operated airports, eight of
A-16

which are owned by the state. State grants and technical assistance are provided to public use airports for infrastructure improvements, planning, safety, and security. FY 2016 FY 2017 Biennial Total FTE's 11.3 11.9 11.6 GFS $0 $0 $0 Other $5,674,000 $6,312,000 $11,986,000 Total $5,674,000 $6,312,000 $11,986,000 Statewide Result Area: Prosperous Economy Statewide Strategy: Preserve and maintain state, regional and local transportation systems Expected Results To maintain, preserve, and extend the life and utility of prior investments in transportation systems and services. H001 Program Delivery Management and Support This activity provides the construction program management and support to headquarters and the six regions. Regional activities include executive management, human resources, financial functions, and administrative support. It funds headquarters' executive management positions and their administrative support in the functional areas of construction, design, real estate services, bridge and structures, environmental services, and program development. The activity also provides statewide safety administration in headquarters and all six regions. FY 2016 FY 2017 Biennial Total FTE's 168.6 177.9 173.3 GFS $0 $0 $0 Other $17,431,000 $17,120,000 $34,551,000 Total $17,431,000 $17,120,000 $34,551,000 Statewide Result Area: Prosperous Economy Statewide Strategy: Effective transportation system governance and management Expected Results To continuously improve the quality, effectiveness, and efficiency of the transportation system. H002 Environmental Services This activity provides technical, policy, and regulatory support to project teams and offices. Key objectives are minimizing impacts to air, land, and water; protecting biological resources; protecting cultural resources; improving and streamlining environmental documentation; and improving regulatory coordination and compliance. Activities include supporting the department’s fish passage commitments and sustainable transportation objectives, obtaining statewide environmental approvals and permits , setting environmental compliance expectations and improvements, implementing WSDOT's stormwater permit, maintaining statewide environmental procedures, and providing statewide environmental leadership and issue resolution. This activity involves close coordination with external groups and governments that have environmental interests related to transportation.
A-17

FY 2016 FY 2017 Biennial Total FTE's 80.2 83.8 82.0 GFS $0 $0 $0 Other $10,531,000 $11,004,000 $21,535,000 Total $10,531,000 $11,004,000 $21,535,000 Statewide Result Area: Prosperous Economy Statewide Strategy: Effective transportation system governance and management Expected Results To continuously improve the quality, effectiveness, and efficiency of the transportation system. I0C1 Mobility Improvements This activity funds projects that increase highway capacity, with the long term goal of reducing congestion, increasing mobility, and funding urban bike lane connections. Examples include completing the High Occupancy Vehicle (HOV) lane system in the Puget Sound Region, improving the level of service on rural highways, and mitigating congestion on urban highways in cooperation with local and regional jurisdictions. FY 2016 FY 2017 Biennial Total FTE's 1,046.3 1,046.3 1,046.3 GFS $0 $0 $0 Other $992,775,000 $993,779,000 $1,986,554,000 Total $992,775,000 $993,779,000 $1,986,554,000 Statewide Result Area: Prosperous Economy Statewide Strategy: Enhance mobility system quality and service Expected Results To improve the predictable movement of goods and people through the system. I0C2 Safety Improvements This activity funds projects for collision reduction and prevention. Examples include correcting deficiencies in high accident locations, corridors, and pedestrian crossings; making impovements at potentially hazardous locations; addressing roadway intersections; and including railroad crossings on multi-lane highways. FY 2016 FY 2017 Biennial Total FTE's 124.2 124.2 124.2 GFS $0 $0 $0 Other $42,089,000 $42,457,000 $84,546,000 Total $42,089,000 $42,457,000 $84,546,000 Statewide Result Area: Prosperous Economy Statewide Strategy: Enhance mobility system quality and service
A-18

Expected Results To improve the predictable movement of goods and people through the system. I0C3 Other Improvements This activity funds the improvement of other highway features for which the department is responsible. Examples include strengthening highways where travel is restricted due to freeze-thaw closures, improving bridges and overpasses that have height or weight restrictions, completing construction of the existing trunk system, constructing truck climbing lanes, and constructing new safety rest areas. FY 2016 FY 2017 Biennial Total FTE's 124.7 124.7 124.7 GFS $0 $0 $0 Other $58,077,000 $58,171,000 $116,248,000 Total $58,077,000 $58,171,000 $116,248,000 Statewide Result Area: Prosperous Economy Statewide Strategy: Enhance mobility system quality and service Expected Results To improve the predictable movement of goods and people through the system. I0C4 Environmental Improvements This activity provides funding to correct or reduce the impact of transportation facilities on the environment. Examples include addressing highway storm water runoff, removing fish passage barriers that are caused by the highway, and reducing public exposure to noise by constructing noise abatement walls along highways. FY 2016 FY 2017 Biennial Total FTE's 70.9 70.9 70.9 GFS $0 $0 $0 Other $50,359,000 $50,397,000 $100,756,000 Total $50,359,000 $50,397,000 $100,756,000 Statewide Result Area: Prosperous Economy Statewide Strategy: Enhance mobility system quality and service Expected Results To enhance Washington's quality of life through transportation investments that promote energy conservation, enhance healthy communities, and protect the environment. K001 Public Private Partnerships This activity explores and cultivates opportunities to create public and private sector partnerships that can help advance transportation projects, programs, and policies. This is accomplished by the
A-19

following: 1) analysis and assessment of new ideas and possibilities for achieving transportation goals; 2) consulting with and advising agency administrators, project engineers, and elected or appointed officials who seek innovative solutions for transportation issues; 3) assisting businesses that have expertise or resources that the department may need, by explaining state laws, policies and programs, and helping them find a way to do business with the department; and 4) assisting in the development of a project once the value to be gained has been demonstrated. FY 2016 FY 2017 Biennial Total FTE's 2.8 2.1 2.5 GFS $0 $0 $0 Other $1,147,000 $949,000 $2,096,000 Total $1,147,000 $949,000 $2,096,000 Statewide Result Area: Prosperous Economy Statewide Strategy: Effective transportation system governance and management Expected Results To continually improve the quality, effectiveness, and efficiency of the transportation system.
M201 Roadway Maintenance and Operations This activity includes pavement patching and repair, crack sealing and chip seals, shoulder maintenance, sweeping and cleaning, and safety patrol activities. FY 2016 FY 2017 Biennial Total FTE's 248.1 248.1 248.1 GFS $0 $0 $0 Other $42,622,000 $50,016,000 $92,638,000 Total $42,622,000 $50,016,000 $92,638,000 Statewide Result Area: Prosperous Economy Statewide Strategy: Preserve and maintain state, regional and local transportation systems Expected Results To maintain, preserve, and extend the life and utility of prior investments in transportation systems and services.
M202 Drainage Maintenance and Slope Repair Activities include ditch maintenance, culvert maintenance, catch basin maintenance, retention and detention basins, and slope repairs. FY 2016 FY 2017 Biennial Total FTE's 192.9 192.9 192.9 GFS $0 $0 $0 Other $26,850,000 $29,129,000 $55,979,000 Total $26,850,000 $29,129,000 $55,979,000
A-20
Statewide Result Area: Prosperous Economy Statewide Strategy: Preserve and maintain state, regional and local transportation systems Expected Results To maintain, preserve, and extend the life and utility of prior investments in transportation systems and services.
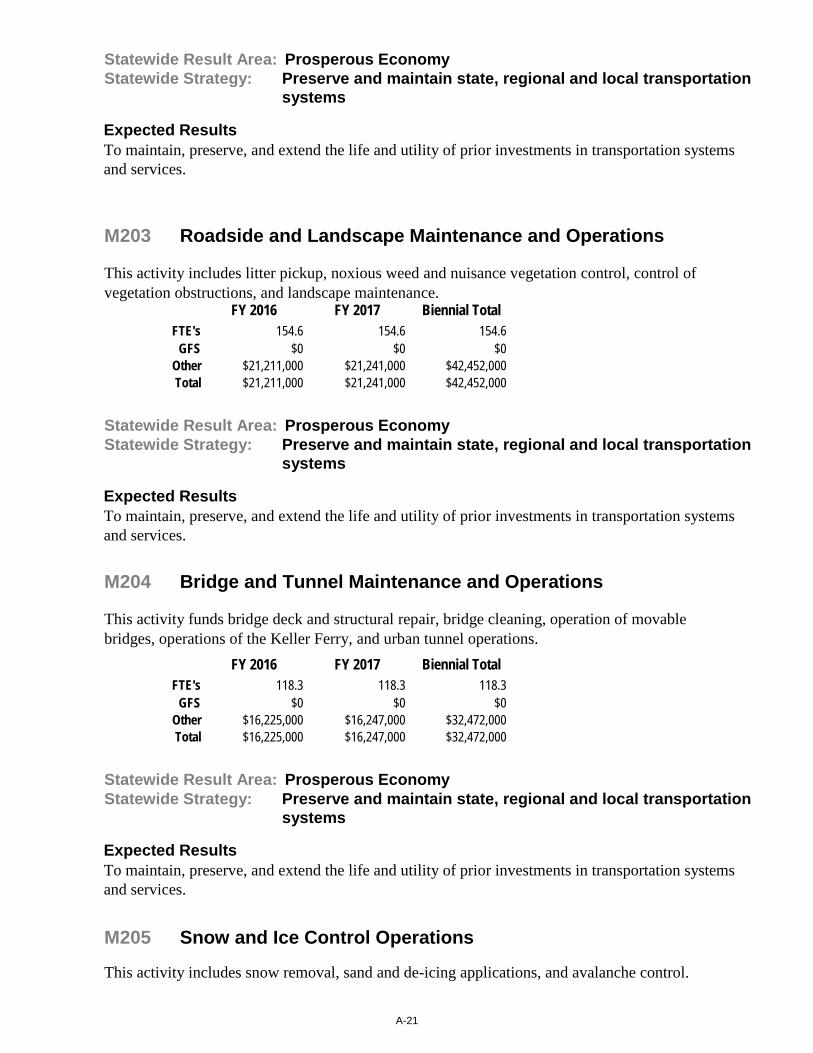
M203 Roadside and Landscape Maintenance and Operations This activity includes litter pickup, noxious weed and nuisance vegetation control, control of vegetation obstructions, and landscape maintenance. FY 2016 FY 2017 Biennial Total FTE's 154.6 154.6 154.6 GFS $0 $0 $0 Other $21,211,000 $21,241,000 $42,452,000 Total $21,211,000 $21,241,000 $42,452,000 Statewide Result Area: Prosperous Economy Statewide Strategy: Preserve and maintain state, regional and local transportation systems Expected Results To maintain, preserve, and extend the life and utility of prior investments in transportation systems and services. M204 Bridge and Tunnel Maintenance and Operations This activity funds bridge deck and structural repair, bridge cleaning, operation of movable bridges, operations of the Keller Ferry, and urban tunnel operations. FY 2016 FY 2017 Biennial Total FTE's 118.3 118.3 118.3 GFS $0 $0 $0 Other $16,225,000 $16,247,000 $32,472,000 Total $16,225,000 $16,247,000 $32,472,000 Statewide Result Area: Prosperous Economy Statewide Strategy: Preserve and maintain state, regional and local transportation systems Expected Results To maintain, preserve, and extend the life and utility of prior investments in transportation systems and services.
M205 Snow and Ice Control Operations This activity includes snow removal, sand and de-icing applications, and avalanche control.
A-21
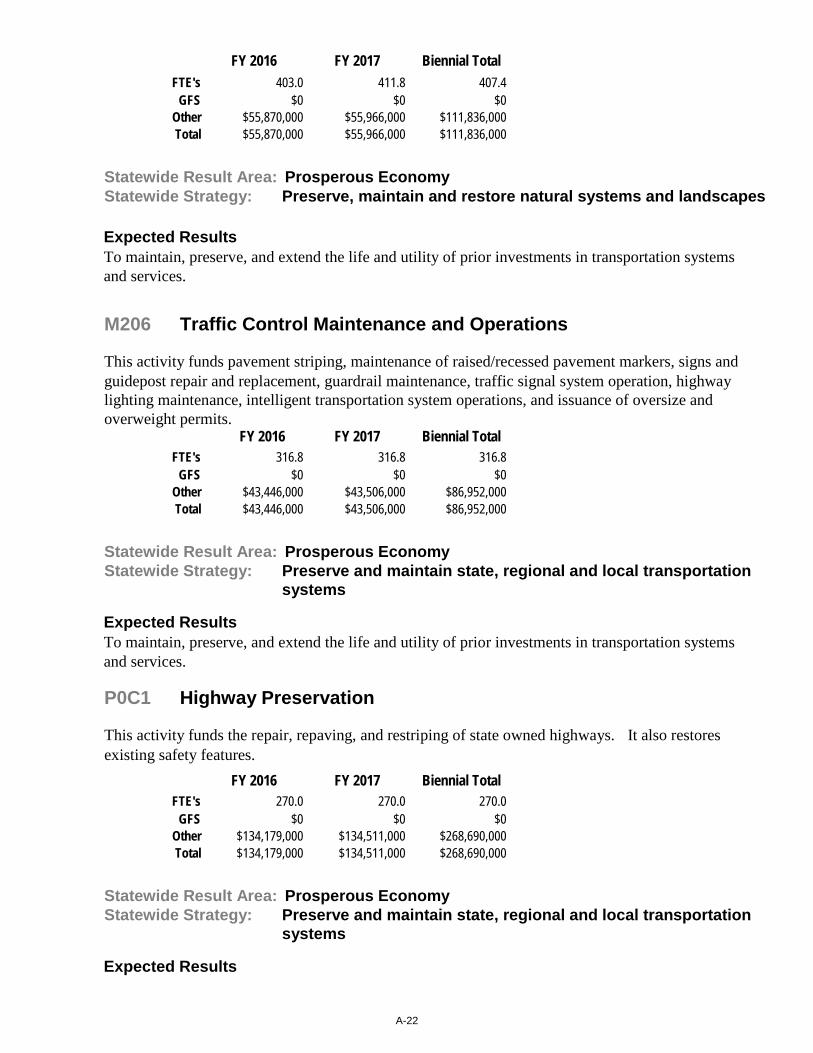
FY 2016 FY 2017 Biennial Total FTE's 403.0 411.8 407.4 GFS $0 $0 $0 Other $55,870,000 $55,966,000 $111,836,000 Total $55,870,000 $55,966,000 $111,836,000 Statewide Result Area: Prosperous Economy Statewide Strategy: Preserve, maintain and restore natural systems and landscapes Expected Results To maintain, preserve, and extend the life and utility of prior investments in transportation systems and services.
M206 Traffic Control Maintenance and Operations This activity funds pavement striping, maintenance of raised/recessed pavement markers, signs and guidepost repair and replacement, guardrail maintenance, traffic signal system operation, highway lighting maintenance, intelligent transportation system operations, and issuance of oversize and overweight permits.
FY 2016 FY 2017 Biennial Total FTE's 316.8 316.8 316.8 GFS $0 $0 $0 Other $43,446,000 $43,506,000 $86,952,000 Total $43,446,000 $43,506,000 $86,952,000 Statewide Result Area: Prosperous Economy Statewide Strategy: Preserve and maintain state, regional and local transportation systems Expected Results To maintain, preserve, and extend the life and utility of prior investments in transportation systems and services. P0C1 Highway Preservation This activity funds the repair, repaving, and restriping of state owned highways. It also restores existing safety features. FY 2016 FY 2017 Biennial Total FTE's 270.0 270.0 270.0 GFS $0 $0 $0 Other $134,179,000 $134,511,000 $268,690,000 Total $134,179,000 $134,511,000 $268,690,000 Statewide Result Area: Prosperous Economy Statewide Strategy: Preserve and maintain state, regional and local transportation systems Expected Results
A-22

To maintain, preserve, and extend the life and utility of prior investments in transportation systems and services.
P0C2 Bridge Preservation This activity provides funds to preserve, replace, and rehabilitate bridges and other highway structures. Work includes painting, bridge deck repairs, and seismic protections. The focus is to preserve the operational and structural integrity of bridges and structures and reduce the risk of catastrophic bridge failure from natural causes. FY 2016 FY 2017 Biennial Total FTE's 262.4 262.4 262.4 GFS $0 $0 $0 Other $62,259,000 $62,389,000 $124,648,000 Total $62,259,000 $62,389,000 $124,648,000 Statewide Result Area: Healthy and Safe Communities Statewide Strategy: Identify and mitigate risk to public safety Expected Results To maintain, preserve, and extend the life and utility of prior investments in transportation systems and services. P0C3 Other Preservation This activity funds the preservation of other facilities and highway features for which the department is responsible, such as rest areas and weigh stations. Projects include rehabilitating drainage systems, stabilizing slopes, and refurbishing existing rest areas and weigh stations to extend their service life. FY 2016 FY 2017 Biennial Total FTE's 101.5 101.5 101.5 GFS $0 $0 $0 Other $40,128,000 $40,349,000 $80,477,000 Total $40,128,000 $40,349,000 $80,477,000 Statewide Result Area: Prosperous Economy Statewide Strategy: Preserve and maintain state, regional and local transportation systems Expected Results To maintain, preserve, and extend the life and utility of prior investments in transportation systems and services. Q001 Traffic Operations Mobility and Safety Services This activity is directed at maximizing highway transportation system efficiency, and working toward ensuring the safe use and operation of the highway system. The activity includes, but is not
A-23

limited to, the following: traffic management centers; high occupancy vehicle operation and analysis; express lane and ramp meter operation and analysis; commercial vehicle information systems and networks; traffic signal operations; 511 traveler information; outdoor advertising control; radio operations; and safety investigations and responding to public concerns. FY 2016 FY 2017 Biennial Total FTE's 174.3 178.6 176.5 GFS $0 $0 $0 Other $18,353,000 $21,678,000 $40,031,000 Total $18,353,000 $21,678,000 $40,031,000 Statewide Result Area: Prosperous Economy Statewide Strategy: Manage mobility system demand and maximize operations Expected Results To improve the predictable movement of goods and people throughout the system. Q002 Incident Response This activity minimizes the traffic impact of disabled vehicles, collisions, and other roadway incidents through early detection and quick clearance. Its main function is clearing roads and helping drivers to restore the normal flow of traffic as safely and quickly as possible. The activity also maintains operational readiness to respond to and expedite the safe clearance of major traffic incidents in cooperation and coordination with other responding entities under the National Incident Traffic Management System. FY 2016 FY 2017 Biennial Total FTE's 47.1 47.1 47.1 GFS $0 $0 $0 Other $4,821,000 $4,897,000 $9,718,000 Total $4,821,000 $4,897,000 $9,718,000 Statewide Result Area: Prosperous Economy Statewide Strategy: Manage mobility system demand and maximize operations Expected Results To improve the predictable movement of goods and people throughout the system. Q003 Low Cost Enhancements This activity includes low cost/high return projects that can be implemented quickly to improve the operational safety or reduce congestion on the highway system. Projects generally target problem areas identified in either the priority programming process, or by constituents, or elected officials. This activity can also be used to respond quickly to emerging issues related to roadway safety. Typical projects include: traffic control signing improvements; roadway striping, rumble strip installation or other road marking improvements; installation or improvement of traffic signals or other electronic devices; and roadway access control through channelization or lane reconfiguration.
A-24
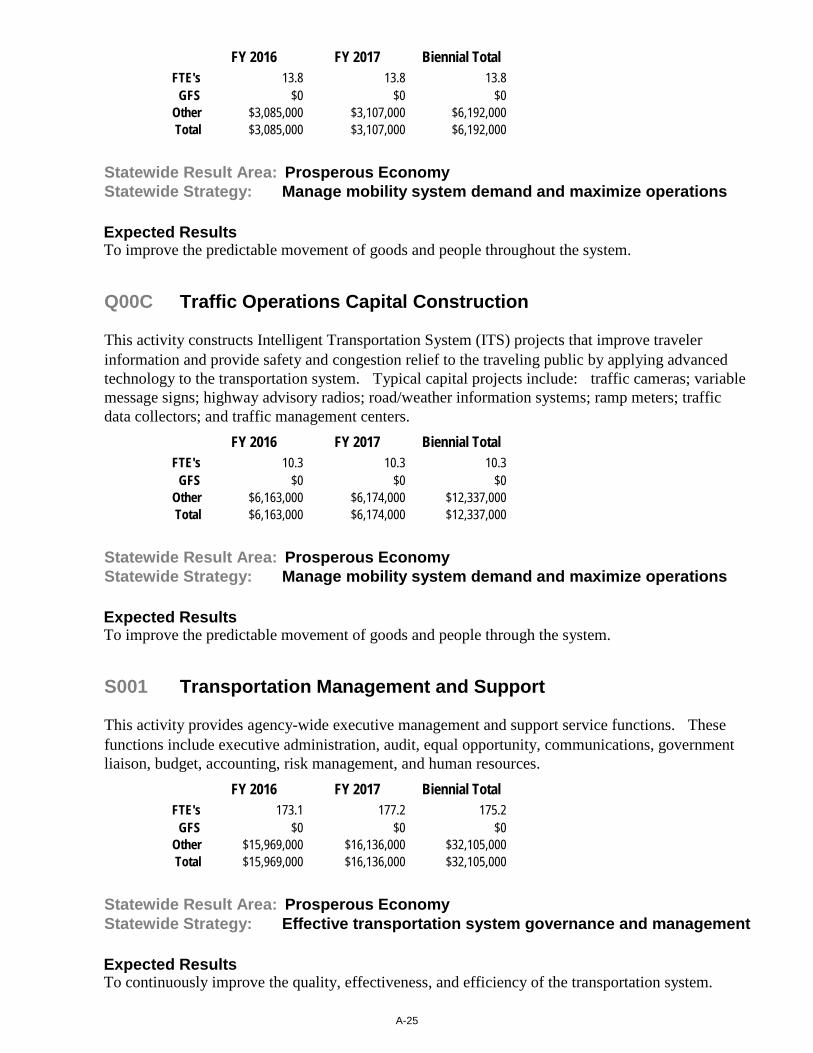
FY 2016 FY 2017 Biennial Total FTE's 13.8 13.8 13.8 GFS $0 $0 $0 Other $3,085,000 $3,107,000 $6,192,000 Total $3,085,000 $3,107,000 $6,192,000 Statewide Result Area: Prosperous Economy Statewide Strategy: Manage mobility system demand and maximize operations Expected Results To improve the predictable movement of goods and people throughout the system. Q00C Traffic Operations Capital Construction This activity constructs Intelligent Transportation System (ITS) projects that improve traveler information and provide safety and congestion relief to the traveling public by applying advanced technology to the transportation system. Typical capital projects include: traffic cameras; variable message signs; highway advisory radios; road/weather information systems; ramp meters; traffic data collectors; and traffic management centers. FY 2016 FY 2017 Biennial Total FTE's 10.3 10.3 10.3 GFS $0 $0 $0 Other $6,163,000 $6,174,000 $12,337,000 Total $6,163,000 $6,174,000 $12,337,000 Statewide Result Area: Prosperous Economy Statewide Strategy: Manage mobility system demand and maximize operations Expected Results To improve the predictable movement of goods and people through the system. S001 Transportation Management and Support This activity provides agency-wide executive management and support service functions. These functions include executive administration, audit, equal opportunity, communications, government liaison, budget, accounting, risk management, and human resources. FY 2016 FY 2017 Biennial Total FTE's 173.1 177.2 175.2 GFS $0 $0 $0 Other $15,969,000 $16,136,000 $32,105,000 Total $15,969,000 $16,136,000 $32,105,000 Statewide Result Area: Prosperous Economy Statewide Strategy: Effective transportation system governance and management Expected Results To continuously improve the quality, effectiveness, and efficiency of the transportation system.
A-25

T001 Transportation Planning, Data, and Research This activity supports planning activities within the Strategic Planning Division, as well as Capital Program Development and Management, Budget and Financial Analysis, Public Transportation, Freight Systems, and planning units within WSDOT Regions. Federal “State Planning and Research” (SPR) funds, a two percent set aside of transportation funds coming to Washington, provide over half of the Program T budget and can only be used for eligible planning related activities. Program T provides the data, information, analysis, and research decision makers need when making transportation system investments. Units supported by Program T collaborate with local government, regional transportation planning organizations, other state agencies, tribal transportation planners, and federal transportation agencies to make efficient use of resources and to provide an integrated transportation system supporting our communities, economy, and environment. They conduct statewide and regional planning programs; conduct self-initiated and legislatively requested corridor studies; perform financial, statistical, and economic analyses; conduct data activities including the collection and analysis of information about roadway characteristics and conditions, traffic volumes, vehicle speeds, and traffic collisions, as well as mapping and Geographic Information System services; and conduct research activities concerning construction and materials, traffic management, environment, design and safety, bridges and structures, security, maintenance, and multimodal transportation. The Strategic Planning Division oversees federal (PL) pass-through and state-appropriated funds that aredistributed directily to federal designated Metropolitan Planning Organizations and state Regional Transportation Planning Organizations respectively. FY 2016 FY 2017 Biennial Total FTE's 181.8 193.1 187.5 GFS $0 $0 $0 Other $26,145,000 $27,313,000 $53,458,000 Total $26,145,000 $27,313,000 $53,458,000 Statewide Result Area: Prosperous Economy Statewide Strategy: Manage mobility system demand and maximize operations Expected Results To continuously improve the quality, effectiveness, and efficiency of the transportation system. V001 Provide Rural and Special Needs Transportation Services This activity administers state and federal grants awarded to public and private transportation organizations serving rural communities, the elderly, and persons with disabilities and provides the overall administration, policy development, and reporting for public transportation programs. Staff is responsible for planning and providing technical assistance to public and private transportation organizations, including transit agencies and local jurisdictions. Staff also provides support for the Agency Council on Coordinated Transportation (ACCT). FY 2016 FY 2017 Biennial Total FTE's 10.8 12.6 11.7 GFS $0 $0 $0 Other $23,662,000 $22,776,000 $46,438,000 Total $23,662,000 $22,776,000 $46,438,000
A-26

Statewide Result Area: Prosperous Economy Statewide Strategy: Preserve and maintain state, regional and local transportation systems Expected Results To improve the predictable movement of goods and people throughout the system. V002 Trips with Public Transportation Choices This activity administers a competitive grant process to fund projects that maximize and increase the efficiency of transportation corridors, working statewide to improve connections and integrate public transportation and highway systems. State and federal grants are awarded to public transportation organizations, local jurisdictions, and major employers for public transportation projects focused on trip reduction, ridesharing, and vanpooling. Staff is responsible for administering the statewide Commute Trip Reduction program and its distribution of funds, as well as a vanpool grant program for public transit agencies to add vanpool vehicles to their fleet. Staff also provides technical assistance, coordination, trip reduction strategies, and educational materials to the public, the department's regional offices, local and regional jurisdictions, and public transportation providers. These efforts support statewide programs to reduce single-occupancy vehicle use and vehicle miles traveled. This activity also includes the statewide oversight of safety and security functions for local rail transit systems. FY 2016 FY 2017 Biennial Total FTE's 11.8 14.2 13.0 GFS $0 $0 $0 Other $35,396,000 $29,025,000 $64,421,000 Total $35,396,000 $29,025,000 $64,421,000 Statewide Result Area: Prosperous Economy Statewide Strategy: Manage mobility system demand and maximize operations Expected Results To improve the predictable movement of goods and people throughout the system.
W1C3 Ferry Preservation - Terminals This activity supports the statewide mobility of people, goods, and services by preserving ferry system terminals that facilitate users of the transportation system moving between marine and land modes of travel. A terminal capital preservation project extends the life of an existing facility without significantly changing its use. Its focus is refurbishment or replacement of the systems making up the terminal that have reached the end of their life cycles. Examples of these systems include trestles, towers, transfer spans, bridge seats, dolphins, wingwalls, buildings, vehicle holding areas, and toll booths. FY 2016 FY 2017 Biennial Total FTE's 23.7 23.7 23.7 GFS $0 $0 $0 Other $37,179,000 $37,202,000 $74,381,000 Total $37,179,000 $37,202,000 $74,381,000
A-27

Statewide Result Area: Prosperous Economy Statewide Strategy: Preserve and maintain state, regional and local transportation systems Expected Results To maintain, preserve, and extend the life and utility of prior investments in transportation systems and services. W1C4 Ferry Improvements - Terminals This activity supports the statewide mobility of people, goods, and services by building new terminals, increasing existing terminal throughput capacity and connectivity to other modes of travel, improving terminal conditions, accommodating changes in service or clientele, promoting efficient and effective operation of the ferry system, achieving cost savings and generating new revenue, protecting the environment, ensuring the safety of people and property, and responding to emergencies. Examples of this type of activity include building a new multimodal terminal, adding a new operating slip to facilitate more vessel landings and sailings, expanding vehicle holding lanes, building a pedestrian bridge from the ferry terminal to a commuter rail station, building a food court inside a terminal building, replanting eel grass displaced by expansion of a terminal's footprint, and implementing safety systems either voluntarily or in accordance with regulatory agency mandates. FY 2016 FY 2017 Biennial Total FTE's 46.8 46.8 46.8 GFS $0 $0 $0 Other $28,036,000 $27,759,000 $55,795,000 Total $28,036,000 $27,759,000 $55,795,000 Statewide Result Area: Prosperous Economy Statewide Strategy: Preserve and maintain state, regional and local transportation systems Expected Results To improve the predictable movement of goods and people throughout the system. W2C3 Ferry Preservation - Vessels This activity supports the statewide mobility of people, goods, and services by preserving the systems that comprise the vessels that provide the public with marine transportation services. A vessel preservation project refurbishes or replaces the systems making up the vessel that have reached the end of their life cycles. This type of investment extends the lives of existing vessel systems without significantly changing their uses. Examples of these systems include the hull, engines, propulsion controls, sprinkler piping, radars, auto decks, and passenger spaces. FY 2016 FY 2017 Biennial Total FTE's 19.1 19.1 19.1 GFS $0 $0 $0 Other $24,225,000 $24,239,000 $48,464,000 Total $24,225,000 $24,239,000 $48,464,000
A-28

Statewide Result Area: Prosperous Economy Statewide Strategy: Preserve and maintain state, regional and local transportation systems Expected Results To maintain, preserve, and extend the life and utility of prior investments in transportation systems and services. W2C4 Ferry Improvements - Vessels This activity supports the statewide mobility of people, goods, and services by acquiring new vessels either to replace retiring vessels or to increase the carrying capacity of the fleet, expanding the capacity of existing vessels, improving vessel conditions, accommodating changes in service or clientele, promoting efficient and effective operation of the ferry system, achieving cost savings and generating new revenue, protecting the environment, ensuring the safety of people and property, and responding to emergencies. Examples of this type of activity include new vessel construction, installation of fuel consumption equipment to facilitate greater fuel economy, generating revenue through advertising, and implementing safety systems either voluntarily or in accordance with regulatory agency mandates. FY 2016 FY 2017 Biennial Total FTE's 36.4 36.4 36.4 GFS $0 $0 $0 Other $42,342,000 $42,383,000 $84,725,000 Total $42,342,000 $42,383,000 $84,725,000 Statewide Result Area: Prosperous Economy Statewide Strategy: Preserve and maintain state, regional and local transportation systems Expected Results To improve the predictable movement of goods and people throughout the system. X101 Ferry Operations - Vessels This activity directly supports the legislatively-approved service schedule and service hours for the ferry system. It includes labor, fuel, and materials for deck and engine operations of the fleet. FY 2016 FY 2017 Biennial Total FTE's 1,115.9 1,155.4 1,135.7 GFS $0 $0 $0 Other $179,925,000 $180,289,000 $360,214,000 Total $179,925,000 $180,289,000 $360,214,000 Statewide Result Area: Prosperous Economy Statewide Strategy: Preserve and maintain state, regional and local transportation systems
A-29

Expected Results To improve the predictable movement of goods and people throughout the system.
X201 Ferry Operations - Terminals This activity directly supports the legislatively approved service schedule and service hours for the ferry system. It includes labor and materials for terminal operations, revenue collection costs, traffic control costs and costs for contracted terminal agents in the San Juan Islands and at Sidney, British Columbia.. FY 2016 FY 2017 Biennial Total FTE's 377.1 378.1 377.6 GFS $0 $0 $0 Other $38,801,000 $39,907,000 $78,708,000 Total $38,801,000 $39,907,000 $78,708,000 Statewide Result Area: Prosperous Economy Statewide Strategy: Preserve and maintain state, regional and local transportation systems Expected Results To improve the predictable movement of goods and people throughout the system. X401 Ferry Maintenance - Vessels This activity includes labor, materials, repair contracts, and miscellaneous costs associated with vessel maintenance. It also includes the labor costs for engine room crews when vessels are in maintenance or lay-up status. Vessel maintenance is accomplished by Washington State Ferries at its dedicated maintenance facility at Eagle Harbor. Larger vessel maintenance contracts and drydockings are performed at commercial shipyards around Puget Sound. FY 2016 FY 2017 Biennial Total FTE's 140.2 140.2 140.2 GFS $0 $0 $0 Other $25,242,500 $25,838,500 $51,081,000 Total $25,242,500 $25,838,500 $51,081,000 Statewide Result Area: Prosperous Economy Statewide Strategy: Preserve and maintain state, regional and local transportation systems Expected Results To maintain, preserve, and extend the life and utility of prior investments in transportation systems and services. X601 Ferry Maintenance - Terminals This activity includes labor, materials, repair contracts, and miscellaneous costs associated with
A-30

terminal maintenance. Terminal maintenance includes routine asset maintenance and inspection performed by Eagle Harbor maintenance facility staff, and contracted maintenance for major maintenance needs. FY 2016 FY 2017 Biennial Total FTE's 82.6 82.6 82.6 GFS $0 $0 $0 Other $13,017,500 $13,469,500 $26,487,000 Total $13,017,500 $13,469,500 $26,487,000 Statewide Result Area: Prosperous Economy Statewide Strategy: Preserve and maintain state, regional and local transportation systems Expected Results To maintain, preserve, and extend the life and utility of prior investments in transportation systems and services. Y001 Rail Passenger Operations This activity is responsible for funding, planning, and implementing rail passenger service; supporting operation of state sponsored service between Vancouver, British Columbia and Portland, Oregon; and maintaining state owned trains used for state-sponsored operations. FY 2016 FY 2017 Biennial Total FTE's 7.8 10.1 9.0 GFS $0 $0 $0 Other $30,160,000 $18,498,000 $48,658,000 Total $30,160,000 $18,498,000 $48,658,000 Statewide Result Area: Prosperous Economy Statewide Strategy: Enhance mobility system quality and service Expected Results To improve the predictable movement of goods and people throughout the system. Y0C4 Rail Passenger Capital This activity funds capital investments in the passenger rail program, including track improvements, and acquisition of passenger train equipment. FY 2016 FY 2017 Biennial Total FTE's 26.0 26.0 26.0 GFS $0 $0 $0 Other $185,716,000 $185,743,000 $371,459,000 Total $185,716,000 $185,743,000 $371,459,000 Statewide Result Area: Prosperous Economy Statewide Strategy: Enhance mobility system quality and service
A-31

Expected Results To improve the predictable movement of goods and people through the system. Y0C5 Rail Freight Projects This activity analyzes conditions, trends, light density rail issues, and potential needs of Washington's freight rail system; oversees operations of state owned rail lines in Eastern Washington; and provides grants for investments to preserve and improve freight rail service in the state. FY 2016 FY 2017 Biennial Total FTE's 4.0 4.0 4.0 GFS $0 $0 $0 Other $5,012,000 $5,167,000 $10,179,000 Total $5,012,000 $5,167,000 $10,179,000 Statewide Result Area: Prosperous Economy Statewide Strategy: Enhance mobility system quality and service
Expected Results To improve the predictable movement of goods and people through the system. Z001 Bicycle and Pedestrian Coordination and Safe Routes to Schools This activity provides program and policy oversight for sidewalks, bike lanes, trails, pedestrians, transit rider crossing improvements, and safe routes to schools. It also provides technical assistance on pedestrian and bicycle projects for the department and local agencies; coordinates training for local public works agencies and regional staff; and assists local agencies in complying with the transportation element of the Growth Management Act. FY 2016 FY 2017 Biennial Total FTE's 4.0 4.0 4.0 GFS $0 $0 $0 Other $446,000 $450,000 $896,000 Total $446,000 $450,000 $896,000 Statewide Result Area: Prosperous Economy Statewide Strategy: Manage mobility system demand and maximize operations Expected Results To provide for and improve the safety and security of transportation customers and the transportation system. Z00C Local Program Planning, Design, and Construction This activity manages the local agency federal aid program that provides funds to cities, counties, ports, tribal governments, transit systems, and metropolitan and regional planning organizations for
A-32

transportation improvement projects off and on the state highway system. This activity also administers state-funded, local agency grant programs as well as individual local agency projects including freight mobility. FY 2016 FY 2017 Biennial Total FTE's 36.1 43.2 39.7 GFS $0 $0 $0 Other $26,837,000 $26,840,000 $53,677,000 Total $26,837,000 $26,840,000 $53,677,000 Statewide Result Area: Prosperous Economy Statewide Strategy: Enhance mobility system quality and service Expected Results To improve the predictable movement of goods and people through the system.
Grand Total FY 2016 FY 2017 Biennial Total FTE's 6,825.6 6,948.2 6,886.9 GFS $0 $0 $0 Other $2,558,855,000 $2,574,304,000 $5,133,159,000 Total $2,558,855,000 $2,574,304,000 $5,133,159,000
A-33

A-34

Indirect Cost Allocation to Activities
A-35

A-36

2015-17 Agency-Request Budget Indirect Cost Allocation to Activities Indirect costs are accounted for within each WSDOT operating program’s budget and, because the department’s activity inventory is closely aligned to the agency’s program structure, those indirect costs are “pre-allocated.” In the case of Highway Improvement and Highway Preservation capital programs, the direct project support (DPS) costs for headquarters office activities and regions’ support are allocated to the associated activities on a pro rata basis, generally by dollar value.
A-37

A-38

Agency Strategic Plan
A-39

A-40

Results WSDOT is the future of our agency. It combines our strengths with forward-thinking values and goals to ensure
WSDOT is the leader in providing sustainable, integrated multimodal transportation systems.
Our vision is an aspiration for us to work toward. Our mission is WSDOT’s
purpose for being. Our values describe the manner in which we conduct
ourselves and the core principles we use to carry out our work. The scope
of what this agency provides to Washington residents is broad and Results
WSDOT is our roadmap for Washington’s multimodal transportation future.
With this roadmap in hand, WSDOT will work with and engage employees and public and private partners to achieve
our goals. Through a culture of continuous improvement, we are building a more effi cient, effective and accountable
government for those we serve.
The Washington State Department of Transportation’s
vision is to be the best in providing a sustainable and
integrated multimodal transportation system.
2014-2017
WSDOT’s Values
WSDOT’s Vision WSDOT’s Mission
The Washington State Department of Transportation
provides and supports safe, reliable and cost-effective
transportation options to improve livable communities
and economic vitality for people and businesses.
Sustainability
Make decisions and take actions that promote the
conservation of resources for future generations by
focusing on the balance of economic, environmental and
community needs
Safety
Promote the safety of the public and employees
at all times
Inclusion
Ensure a wide array of perspectives, disciplines
and backgrounds are represented in our outreach,
decision making and workforce
Innovation
Foster an environment of trust that encourages
creativity, fi nding solutions for challenges and leveraging
opportunities
Integrity
Build trust with each other and our communities by being
ethical, accountable, responsive and honest
Leadership
Inspire, motivate and support to give each other the
confi dence to do great things
New Strategic Plan sets WSDOT’s direction
A-41

Goal 1 STRATEGIC INVESTMENTS
Effectively manage system assets
and multimodal investments on
corridors to enhance
economic vitality
Goal 1 priority outcomes:
• Prioritize strategic investments for preservation,
maintenance and capacity improvements on
corridors, to achieve the broadest benefi ts to the
system, within existing resources, by using
appropriate scopes to deliver specifi c results.
• Strategically manage assets on corridors.
• Inform strategic investment decisions in corridors
through a broad understanding of system
performance and community goals and values.
• Deliver transportation projects and services
that are on time and on budget.
Goal 2 MODAL INTEGRATION
Optimize existing system capacity
through better interconnectivity of
all transportation modes
Goal 2 priority outcomes:
• Reduce number of fatal and serious injuries
for all transportation modes.
• Align the operation of all modes in
corridors to optimize throughput capacity
to move people and freight.
• Improve coordination between transportation
providers and modes that results in more seamless
system operations.
Goal 3 ENVIRONMENTAL STEWARDSHIP
Promote sustainable practices to
reduce greenhouse gas emissions
and protect natural habitat
and water quality
Goal 3 priority outcomes:
• Improve environmental conditions; leave it better
than before.
• Reduce WSDOT’s overall carbon footprint.
• Improve energy effi ciency of transportation systems
and WSDOT operations.
Goal 4 ORGANIZATIONAL STRENGTH
Support a culture of multi-disciplinary
teams, innovation and people
development through training,
continuous improvement and Lean efforts
Goal 4 priority outcomes:
• Foster a capable, engaged and valued workforce
balancing project and service delivery demands with
professional development needs.
• Improve multi-disciplinary engagement, early in the
process, to increase collaborative solutions and
improve decision making.
• Cultivate and enhance WSDOT’s ability to attract,
develop and retain a core workforce targeting
mission critical skills.
Results WSDOT – Goals and Outcomes
For more information on WSDOT’s Strategic Plan, visit
www.wsdot.wa.gov/resultsWSDOT
A-42

Goal 6 SMART TECHNOLOGY
Improve information system
effi ciency to users and enhance
service delivery by expanding
the use of technology
Goal 6 priority outcomes:
• Improve organizational effectiveness to expand the
timely evaluation, adoption, application and
deployment of new technologies used to manage
demand and/or enhance system operations to
improve system performance.
• Improve organizational effectiveness to expand the
timely evaluation, adoption, application and
deployment of innovative technologies associated
with internal enterprise systems.
• Enhance traveler information exchange with the
public by improving seamless integration and
usability between transportation facilities, modes
and services.
Strategic Plan supports WSDOT Reforms
WSDOT adopted ten reforms aimed at achieving our mission of providing and supporting safe,
reliable, and cost-effective transportation options to all Washingtonians. Some are directed
at a specifi c program or department while others will be implemented agency-wide. The
Strategic Plan aligns with and supports these reforms. These 10 reforms will put into action
common-sense changes that foster effi cient, effective and accountable government.
The ten reforms are:
Reform I: Ensure effi ciency and accuracy through strong management direction
Reform II: Reward innovation in cost-effective design and construction management
Reform III: Develop workforce
Reform IV: Increase opportunities for disadvantaged business enterprise (DBE)
Reform V: Implement Practical Design
Reform Vi: Strengthen quality assurance protocols for increased accountability
Reform VII: Expand and strengthen construction contracting methods and protocols
Reform VIII: Implement vessel construction and maintenance
improvements suggested by State Auditor’s Offi ce
Reform IX: Lean, more cost-effective operations
Reform X: Streamline tolling operation, costs and effi ciencies
Goal 5 COMMUNITY ENGAGEMENT
Strengthen partnerships to increase
credibility, drive priorities and inform
decision making
Goal 5 priority outcomes:
• Increase consent on decisions made by WSDOT,
communities, stakeholders and the Legislature
based on a shared understanding of needs and
opportunities.
• Improve the understanding of transportation
expenditures and investments and respective
benefi ts (outcomes).
• Improve public access to information and decision
making so that WSDOT is recognized as the most
credible source for information.
Results WSDOT – Goals and Outcomes
A-43

The gray notebook
will be used to track,
monitor and report
on the strategic plan’s
performance results.
WSDOT’s strategic plan represents a shift in the way
we do business getting the most capacity of the entire
multimodal transportation system, leveraging limited
funding and engaging with communities and partners.
Results WSDOT sets Agency’s direction2014 through 2017 Strategic Plan
Recent Gray Notebook articles
Goal 1: STRATEGIC INVESTMENTS
Effectively manage system assets and multimodal
investments on corridors to enhance economic vitality
-Bridges: GNB 54, pp. 4-11.
-Ferries preservation: GNB 54, pp. 12-17.
-Highway maintenance: GNB 52, pp. 12-13.
-Pavement conditions: GNB 52, pp. 6-11.
-Capital facilities: GNB 51, pp. 3-6.
Goal 2: MODAL INTEGRATION
Optimize existing system capacity through better
interconnectivity of all transportation modes
-Ferries: GNB 54, pp. 18-19.
-Trucks, goods and freight: GNB 54, pp. 28-32.
-Rail: Amtrak Cascades: GNB 53, pp. 10-11.
-Aviation: GNB 51, pp. 7-9.
-Trip reduction: GNB 51, pp. 16-18.
Goal 3: ENVIRONMENTAL STEWARDSHIP
Promote sustainable practices to reduce greenhouse
gas emissions and protect natural habitat and water
quality
-General permitting: GNB 54, pp. 26-27.
-Air quality: GNB 53, pp. 15-16.
-Wetlands preservation: GNB 53, pp. 19-21.
-Environmental compliance: GNB 52, p. 25.
-Fish passage barriers: GNB 52, pp.23-24.
-Water quality: GNB 51, pp. 19-21.
Goal 4: ORGANIZATIONAL STRENGTH
Support a culture of multi-disciplinary teams, innovation
and people development through training, continuous
improvement and Lean efforts
-Lean: GNB 54, pp. 37-38.
-Worker safety: GNB 53, p. 1.
-Worker training: GNB 53, pp. 28-29.
Goal 5: COMMUNITY ENGAGEMENT
Strengthen partnerships to increase credibility, drive
priorities and inform decision making
-Highway system safety: GNB 54, pp. 1-3.
-Bicyclist & pedestrian safety: GNB 52, pp. 2-5.
Goal 6: SMART TECHNOLOGY
Improve information system effi ciency to users and
enhance service delivery by expanding the
use of technology
-Commerical Vehicle Information Systems & Networks:
GNB 53, pp. 22-23.
-Travel information: GNB 53, p. 14.
-Tolling: GNB 52, pp. 31-33.
Data source: WSDOT Offi ce of Strategic Assessment and Performance Analysis.
Reporting on Results WSDOT
Amerians with Disabilities Act (ADA) Information: This material can be made available in an alternate format by emailing the WSDOT Diversity/ADA Affairs team at [email protected] or by calling toll free, 855-362-4ADA(4232). Persons who are deaf or hard of hearing may make a request by calling the Washington
State Relay at 711.Title VI Statement to Public: It is the Washington State Department of Transportation’s (WSDOT) policy to assure that no person shall, on the grounds of race, color, national origin or sex, as provided by Title VI of the Civil Rights Act of 1964, be excluded from participation in, be denied the benefi ts of, or be otherwise discriminated against under any of its federally funded programs and activities. Any person who believes his/her Title VI protection has been violated, may fi le a complaint with WSDOT’s Offi ce of Equal Opportunity (OEO). For additional information regarding Title VI complaint procedures and/or information regarding our non- discrimination obligations, please contact OEO’s Title VI Coordinators, George Laué at (509) 324-6018 or Jonté Sulton at (360) 705-7082.
A-44