agec 340 – international economic development course slides for week 13 (april 6-8) trade policy*...
Post on 19-Dec-2015
218 views
TRANSCRIPT

AGEC 340 – International Economic Development
Course slides for week 13 (April 6-8)
Trade Policy*
If trade is so desirable, why do governments restrict it?
* In the textbook, this material is covered in Chapter 17.

So far…we’ve explained prices and quantities in terms of market equilibrium between supply and demand
Price($/lb)
Quantity (thousands of tons/yr)
1.25
10
1.00
15
0.75
17
D
S

…but usually trade is available, so our price is determined by equilibrium with trade
Price($/lb)
1.25
10
1.00
0.75
17
Price($/lb)
1.25
10
1.00
0.75
17
Imports = 7Exports = 7
D
S
D
S
For exported goods For imported goods

Our production & consumption depend on our S & D curves relative to the given world price...
Pt
Q
S
D
Our exportsQd Qs
An export
Pt
Q
S
D
Our importsQdQs
An import

So why worry about trade? Who cares about the WTO or NAFTA?
Pt
Q
S
D
Our exportsQd Qs
An export
Pt
Q
S
D
Our importsQdQs
An import
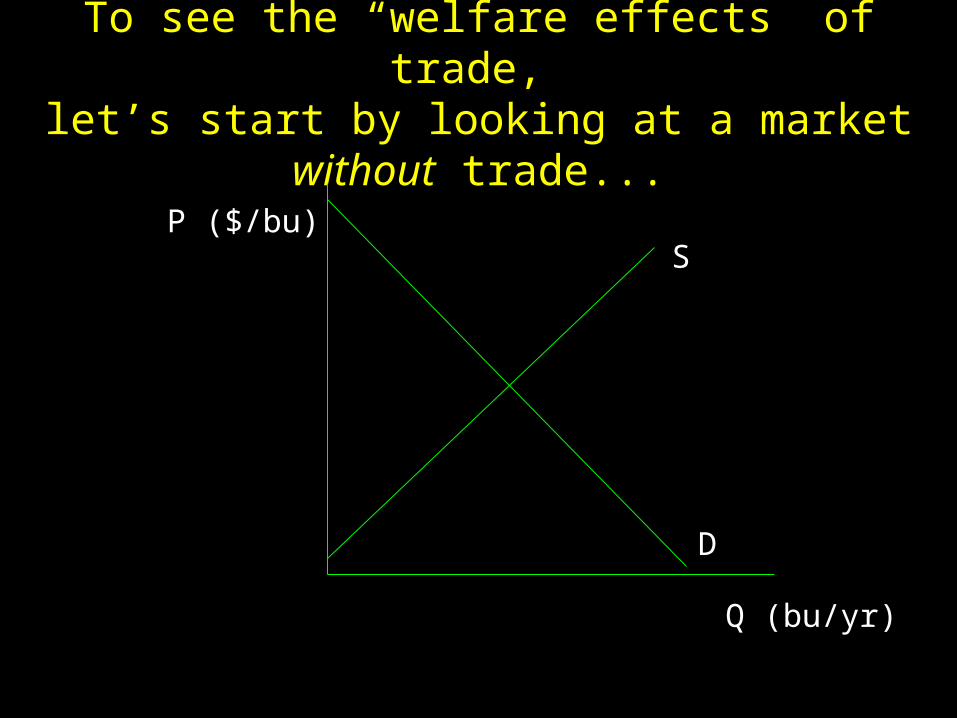
To see the “welfare effects” of trade, let’s start by looking at a market without trade...
Q (bu/yr)
S
D
P ($/bu)

What price do we expect to observe?
Q (bu/yr)
S
D
P ($/bu)

The equilibrium price is the only price where Qs = Qd
Q (bu/yr)
S
D
P ($/bu)
Pe
Qe
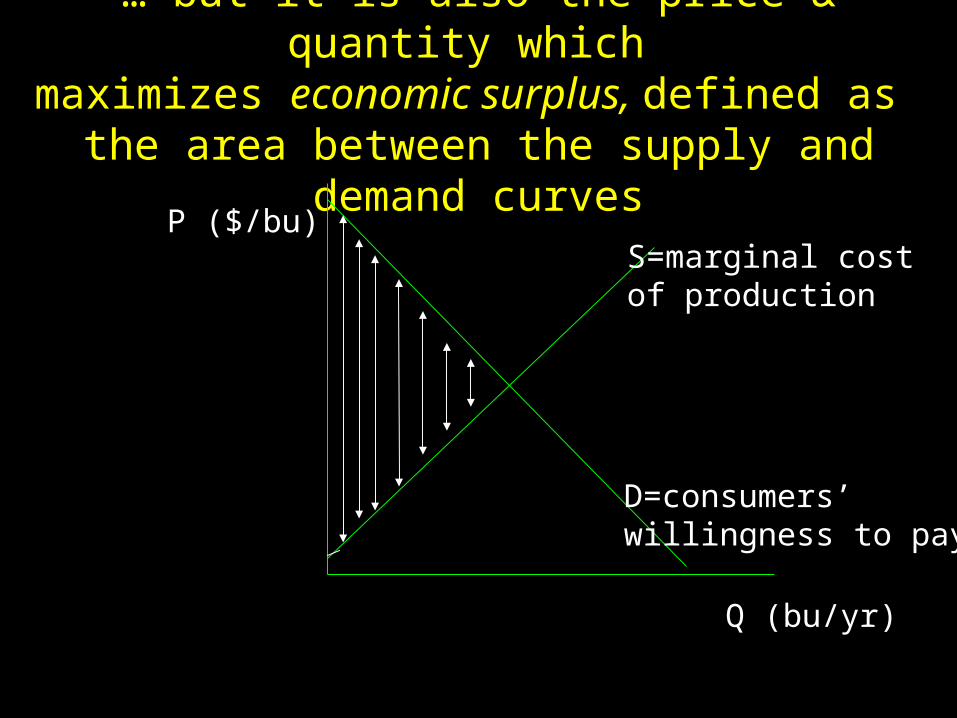
… but it is also the price & quantity which maximizes economic surplus, defined as
the area between the supply and demand curves
Q (bu/yr)
S=marginal cost of production
D=consumers’ willingness to pay
P ($/bu)

… at low quantities, there’s a big gap, so increasing quantity is very valuable!
Q (bu/yr)
S=marginal cost of production
D=consumers’ willingness to pay
P ($/bu)
a small quantity

As production & consumption increase, the gain in economic surplus gets smaller...
Q (bu/yr)
S=marginal cost of production
D=consumers’ willingness to pay
P ($/bu)
an increased quantity

… but stays positive..
Q (bu/yr)
S=marginal cost of production
D=consumers’ willingness to pay
P ($/bu)
an increased quantity

… but stays positive..
Q (bu/yr)
S=marginal cost of production
D=consumers’ willingness to pay
P ($/bu)
an increased quantity

… but stays positive..
Q (bu/yr)
S=marginal cost of production
D=consumers’ willingness to pay
P ($/bu)
an increased quantity

… but stays positive..
Q (bu/yr)
S=marginal cost of production
D=consumers’ willingness to pay
P ($/bu)
an increased quantity

…until it hits the equilibrium quantity!
Q (bu/yr)
S=marginal cost of production
D=consumers’ willingness to pay
P ($/bu)
Qe

At the equilibrium quantity, consumers are willing to pay for one more unit exactly what it costs to produce.
Q (bu/yr)
S=producers’marginal cost
D=consumers’ willingness to pay
P ($/bu)
Qe
Pe

… so “economic surplus” is maximized.
Q (bu/yr)
S=marginal cost of production
D=consumers’ willingness to pay
P ($/bu)

What would happen to economic surplus if production were higher than Qe?
Q (bu/yr)
S=marginal cost of production
D=consumers’ willingness to pay
P ($/bu)
Qe
Pe

Above Qe, marginal costs would be higher than willingness to pay, so economic surplus would fall.
Q (bu/yr)
S=marginal cost of production
D=consumers’ willingness to pay
P ($/bu)
Qe
Pe
above Qe...
costs exceed benefits

How does trade enter the picture?
Q (bu/yr)
S=producers’marginal cost
D=consumers’ willingness to pay
P ($/bu)
Qe
Pe

For an export, Pt exceeds Pe...
Q (bu/yr)
S=producers’marginal cost
D=consumers’ willingness to pay
P ($/bu)
Qe
Pe
Pt

So Qs exceeds Qd by the amount of exports...
Q (bu/yr)
S=producers’marginal cost
D=consumers’ willingness to pay
P ($/bu)
Qe
Pe
Pt
QsQd
exports

Who gains from trade? Who loses?
Q (bu/yr)
S=producers’marginal cost
D=consumers’ willingness to pay
P ($/bu)
Qe
Pe
Pt
QsQd
the price rises
consumption falls production rises

To value gains and losses, we need to distinguish between consumers’ economic surplus
and producers’ economic surplus
Q (bu/yr)
S=producers’marginal cost
D=consumers’ willingness to pay
P ($/bu)
Qe
Pe
Pt
QsQd
the price rises
consumption falls production rises

the change from no-trade to exports reduces consumers’ surplus,
defined as area between demand curve and price
Q (bu/yr)
S=producers’marginal cost
D=consumers’ willingness to pay
P ($/bu)
Qe
Pe
Pt
QsQd
loss in consumers’ surplus due to higher price
consumption falls production rises
CS loss:

the change from no-trade to exports increases producers’ surplus,
defined as area between supply curve and price
Q (bu/yr)
S=producers’marginal cost
D=consumers’ willingness to pay
P ($/bu)
Qe
Pe
Pt
QsQdconsumption falls production rises
PS gain:
gain in producers’ surplus due to higher price

Which is bigger?Here, PS gain is always larger than CS loss!
Q (bu/yr)
S=producers’marginal cost
D=consumers’ willingness to pay
P ($/bu)
Qe
Pe
Pt
QsQd
This triangle is a net gain innational economic surplus
consumption falls production rises
CS loss:
PS gain:
Net gain:

Magic! Exports offer money for nothing, requiring only that we adjust to the foreigners’ prices…
Q (bu/yr)
S=producers’marginal cost
D=consumers’ willingness to pay
P ($/bu)
Qe
Pe
Pt
QsQd
This triangle is a net gain innational economic surplus
consumption falls production rises

OK, so exports create economic gains… what about imports?
Q (bu/yr)
S=producers’marginal cost
D=consumers’ willingness to pay
P ($/bu)
Qe
Pe
Pt
QsQdconsumption falls production rises

the change from no-trade to imports reduces producers’ surplus
Q (bu/yr)
S=producers’marginal cost
D=consumers’ willingness to pay
P ($/bu)
Qe
Pe
Pt
QdQsproduction falls consumption rises
PS loss:

…but going from no-trade to imports increases consumer surplus
Q (bu/yr)
S=producers’marginal cost
D=consumers’ willingness to pay
P ($/bu)
Qe
Pe
Pt
CS gain:
PS loss:
QdQsproduction falls consumption rises

Again magic! Imports also offer money for nothing, requiring only that we adjust to foreign prices…
Q (bu/yr)
S=producers’marginal cost
D=consumers’ willingness to pay
P ($/bu)
Qe
Pe
Pt
This triangle is a net gain innational economic surplus
CS gain:
PS loss:
Net gain:
QdQsproduction falls consumption rises

But do governments usually allow completely free trade?

Now, we need to start from free trade, and ask:Who gains and who loses what
from an import tariff?
Pd
Pt
Qs’Qs Qd’Qd
Supply Demand
Qty.
Price
A B C D
Gains and losses from the tariff Change in:
Producer surplus: +A Consumer surplus: -ABCD Govt. revenue: +C Nat’l. econ. surplus: -BDt
price in domestic
market
price in trade, or “world price”
import tariff

How about when government restricts an export?Who gains and who loses what
from an export tax?
Pd
Pt
Qs’ QsQd’Qd
SupplyDemand
Price
A B C DGains and losses from the tax Change in
Producer surplus: -ABCD Consumer surplus: +A Gov’t. revenue: +C Nat’l. econ. surplus: -BD
t
price in domestic
market
price in trade, or “world price”
export tax

So is more trade better? What if government subsidizes exports?
Who gains and who loses what from an export subsidy?
Pt
Pd
Qs’ QsQd’Qd
SupplyDemand
Price
A BC D Gains and losses from the subsidy
Change inProducer surplus: +ABCDE
Consumer surplus: -AB Gov’t. revenue: -BCDEF Nat’l. econ. surplus: -BF
s
price in domestic
market
price in trade, or “world price”
exportsubsidy F
E
Conclusion: it’s not trade thatcreates value; it’s free trade

Some preliminary conclusions…
• The simple bit of economics so far tells us that…• Exports are not “better” than imports • More trade is not “better” than less trade• What’s best is free trade…
• But, from the example of environmental policies in week 8, may need plenty of domestic taxes, subsidies, or regulations to offset externalities in production and consumption.

Now, some more detail
• So far we have taken foreign prices as given – just like in the first half of the semester, the household takes market prices as given
• But where do foreign prices come from? We need to understand that market too!

Start with our country’s S&D diagram...
Our country

...as compared with the rest of the world:
Our country The rest of the world

But the quantity scales are different!
Our country The rest of the world
Q(tons)
Q(thou. tons)
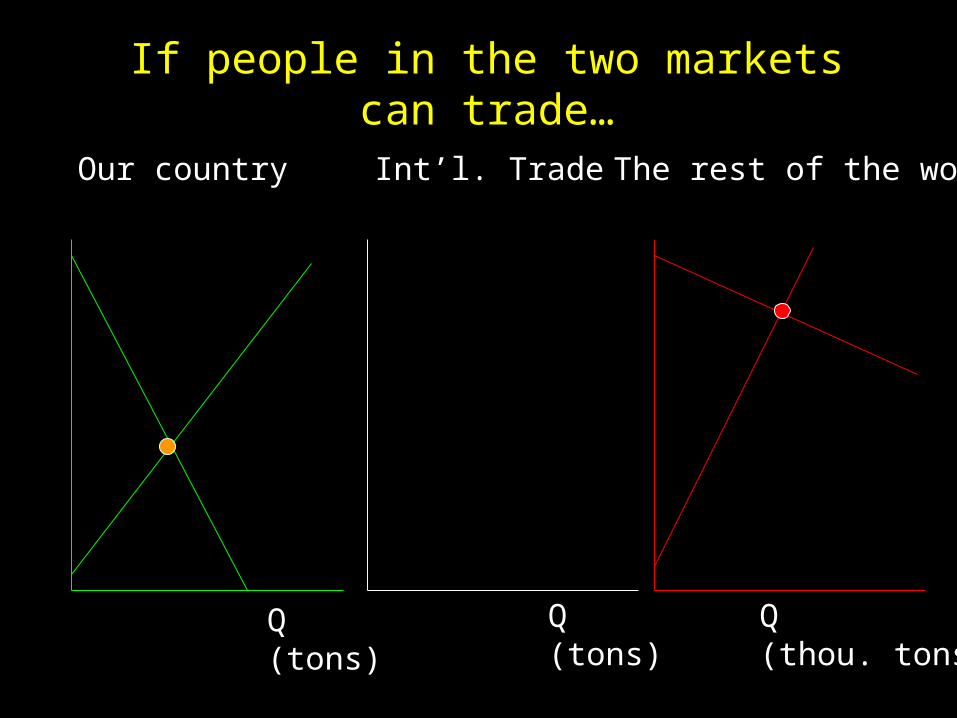
If people in the two markets can trade…
Our country The rest of the worldInt’l. Trade
Q(tons)
Q(tons)
Q(thou. tons)

...our country won’t trade anything at our Pe.
Our country The rest of the worldInt’l. Trade
Q(tons)
Q(tons)
Q(thou. tons)
Pe

…but at higher prices, we’d export the “surplus” (production - consumption)
Our country The rest of the worldInt’l. Trade
Q(tons)
Q(tons)
Q(thou. tons)

…creating a “supply of exports” curve
Our country The rest of the worldInt’l. Trade
Q(tons)
Sexports
Q(tons)
Q(thou. tons)

…and similarly for the rest of the world...
Our country The rest of the worldInt’l. Trade
Q(tons)
Sexports
Q(tons)
Q(thou. tons)

…except that the scale is different!Our country The rest of the worldInt’l. Trade
Q(tons)
Sexports
Q(tons)
Q(thou. tons)
a small gap hereis a large gap here, because ofdifferent scales

…so their “demand for imports” curve is very flat
Our country The rest of the worldInt’l. Trade
Q(tons)
Sexports
Q(tons)
Q(thou. tons)
Dimports

Let’s clean up the diagram a little...Our country The rest of the worldInt’l. Trade
Q(tons)
Sexports
Q(tons)
Q(thou. tons)
Simports

…to see the equilibrium point in world trade...Our country The rest of the worldInt’l. Trade
Q(tons)
Sexports
Dimports
Q(tons)
Q(thou. tons)

…which shows where trade prices come from!
Our country The rest of the worldInt’l. Trade
Q(tons)
Sexports
Dimports
Q(tons)
Q(thou. tons)
Pt

When we have a small share of world production, our trade prices are fixed by the rest of the world.Our country The rest of the worldInt’l. Trade
Q(tons)
Sexports
Dimports
Q(tons)
Q(thou. tons)
Pt

Our S & D curves do not affect trade prices, but only the quantities produced, consumed, and traded.
Our country The rest of the worldInt’l. Trade
Sexports
Dimports
Pt
Our exports
Q Q QTheir imports
Qd QdQs Qs
S
D
S
D

Trade prices depend on world supply and demand. For example, if foreign supply & demand shift down...
Our country The rest of the worldInt’l. Trade
Pt
Q Q Q
S
D
S
D
S’
D’

Trade prices could fall so much thatour country begins to import.
Our country The rest of the worldInt’l. Trade
Sexports
Dimports
Pt
Our imports
Q Q QTheir exports
Qd QdQs Qs
S
D
S
D

…in any case, because the rest of the world is so big, we can draw Pt as an (almost) horizontal lineand look only at the “our country” diagram
Our country The rest of the worldInt’l. TradeSexports
Dimports
Pt
Our exports
Q Q QTheir imports
Qd QdQs Qs
S
D
S
D
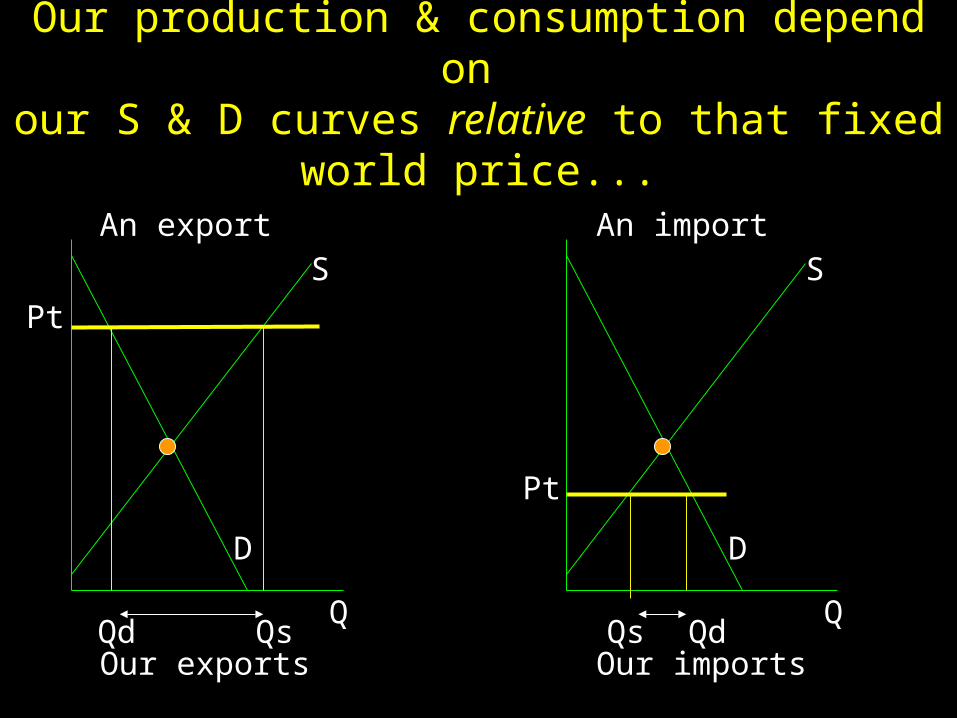
Our production & consumption depend on our S & D curves relative to that fixed world price...
Pt
Q
S
D
Our exportsQd Qs
An export
Pt
Q
S
D
Our importsQdQs
An import

This is our pattern of comparative advantage, using the “small country assumption”
that foreign prices are fixed
Pt
Q
S
D
Our exportsQd Qs
Export this:
Pt
Q
S
D
Our importsQdQs
And import this:

Does free international trade always help a country maximize its national income?
– there are many arguments against free trade, such asto keep high-paying jobsto stop foreigners from ‘dumping’ their productsto help our firms grow or recover from bad times
– but these are rarely valid reasons for trade restrictions most restrictions benefit favored groups, at the
expense of others who have less influence– is this always true? Can trade policy help remedy
market failures? what did our result depend on?

The only data we used were...
Q (bu/yr)
S=producers’marginal cost
D=consumers’ willingness to pay
P ($/bu)
Pt
How could this picture be misleading?

Remember the possibility of “externalities” from production or consumption?
Q (bu/yr)
D=consumers’ willingness to pay
P ($/bu)
Pt
S=producers’marginal cost of production
“external” benefit to others from production
S’=society’s netmarginal cost of production
If production provides external benefits to other people…

With externalities, society’s optimumis not the market outcome
Q (bu/yr)
D=consumers’ willingness to pay
P ($/bu)
Pt
producers’ optimal production
society’soptimal production
S (producers’ marginal costs)
=S’ (society’s marginal cost)
- EB (benefits to other people)

So if there are externalities, how could people get the outcome they want?
Q (bu/yr)
D=consumers’ willingness to pay
P ($/bu)
Ptproducers’ optimal production
society’soptimal production
Q*Q
S (producers’ marginal costs)
=S’ (society’s marginal cost)
- EB (benefits to other people)

The government could raise production to Q* by restricting trade...
Q (bu/yr)
D=consumers’ willingness to pay
P ($/bu)
Ptproducers’ optimal production
society’soptimal production
Q*Q
Pd
S (producers’ marginal costs)
=S’ (society’s marginal cost)
- EB (benefits to other people)

… the economy would gain from capturing the external benefit from more production...
Q (bu/yr)
D=consumers’ willingness to pay
P ($/bu)
Ptproducers’ optimal production
society’soptimal production
S - producers’ costs
S’ - society’s net costs
external benefit
Q*Q
Pd
economic-surplusgain from increasingproduction to Q*

… but the economy would also lose from higher costs paid by consumers, thus offsetting any gain;
this is like pushing both accelerator and brake at once.
Q (bu/yr)
D=consumers’ willingness to pay
P ($/bu)
Ptproducers’ optimal production
society’soptimal consumption
S - producers’ costs
S’ - society’s net costs
external benefit
Q*Q
Pd
economic-surplusgain from increasingproduction to Q*
Qd
economic-surplusloss from decreasing consumption

To have a net gain governmentwould need to use a subsidy to producers only!
Q (bu/yr)
D=consumers’ willingness to pay
P ($/bu)
Ptproducers’ optimal production
society’soptimal consumption
S - producers’ costs
S’ - society’s net costs
external benefit
Q*Q
Pd
Qd
subsidy toproducers only

Some conclusions…
• To reach the highest possible national income, (almost) always governments should…–keep the economy open to international trade, –while using domestic policies to offset
externalities and other “market failures” in production or consumption.