age structure dynamics
TRANSCRIPT

8/9/2019 Age Structure Dynamics
http://slidepdf.com/reader/full/age-structure-dynamics 1/34
Age Structure Dynamics in Asia and Dependence on Foreign CapitalAuthor(s): Matthew Higgins and Jeffrey G. WilliamsonSource: Population and Development Review, Vol. 23, No. 2 (Jun., 1997), pp. 261-293Published by: Population CouncilStable URL: http://www.jstor.org/stable/2137546
Accessed: 21/07/2010 12:58
Your use of the JSTOR archive indicates your acceptance of JSTOR's Terms and Conditions of Use, available at
http://www.jstor.org/page/info/about/policies/terms.jsp. JSTOR's Terms and Conditions of Use provides, in part, that unless
you have obtained prior permission, you may not download an entire issue of a journal or multiple copies of articles, and youmay use content in the JSTOR archive only for your personal, non-commercial use.
Please contact the publisher regarding any further use of this work. Publisher contact information may be obtained at
http://www.jstor.org/action/showPublisher?publisherCode=popcouncil.
Each copy of any part of a JSTOR transmission must contain the same copyright notice that appears on the screen or printed
page of such transmission.
JSTOR is a not-for-profit service that helps scholars, researchers, and students discover, use, and build upon a wide range of
content in a trusted digital archive. We use information technology and tools to increase productivity and facilitate new forms
of scholarship. For more information about JSTOR, please contact [email protected].
Population Council is collaborating with JSTOR to digitize, preserve and extend access to Population and
Development Review.
http://www.jstor.org

8/9/2019 Age Structure Dynamics
http://slidepdf.com/reader/full/age-structure-dynamics 2/34
Age Structure Dynamicsin Asia and Dependence
on Foreign Capital
MATTHEWIGGINS
JEFFREY G. WILLIAMSON
As THisCENTURYraws to a close, it seems appropriateto take a last look at
a hypothesis that has generated heated debate ever since Ansley Coale and
Edgar Hoover (1958) wrote about it some four decades ago and, in so do-
ing, to focus on that part of the world where they thought it mattered
most-Asia. The thesis is simple enough: sustained high fertility and fall-ing mortality leave households and governments burdened with high youth
dependency rates, and therefore unable to save more than a small share of
household incomes or tax revenues. While the hypothesis has had its em-
pirical ups and downs since 1958, no one seems to deny that it has proven
to be most germane to Asia and that the twentieth-century economic his-
tory of the region offers the greatest variety in the demographic variables
that matter most to the hypothesis. This article uses that history to exam-
ine the relationshipbetween demographic factors,notably age structure dy-
namics, and foreigncapitaldependency in the presentcenturyand the next.
What does a child dependency burden cost? Obviously the answer
depends both on the number of children (their quantity) and expenditures
per child (in economic jargon, their quality): households tend to substitute
quality for quantity as their incomes rise. While we have insufficient evi-
dence on dependency burden costs for Asia, we do have a good estimate of
that figure for the United States in 1992: one-seventh of gross domestic
product (Haveman and Wolfe 1995: Table 1). We also know that about
two-thirds of this was a burden on parents (including the opportunity costsof mothers' time), while one-third was a burden on governments (most of
which was publicly financed formal education). These burdens seem big
enough to worry about, even for an economy in which children are a rela-
tively small share of the total population.
POPULATION AND DEVELOPMENT REVIEW 23(2):261-293 (JUNE 1997) 261
8/9/2019 Age Structure Dynamics
http://slidepdf.com/reader/full/age-structure-dynamics 3/34
262 AGE STRUCTURE DYNAMICS IN ASIA
While the literature on the dependency rate hypothesis is extensive,
it has three surprising limitations. First, typically it stops after testing the
hypothesis. Rarely does it take the next step, namely to use the economet-
rics to decompose the sources of saving rate changes through time or acrosscountries. Second, the dependency rate models use steady-state behavior
to analyze a problem of transitional dynamics. Third, and perhaps most
important, the focus has been almost exclusively on domestic savings. Rarely
has anyone asked whether dependency rates (or other demographic vari-
ables correlated with them) might have a significant impact on domestic
investment. Rarely, too, has anyone explored the impact of these demo-
graphic events on excess investment demand, and thus on net capital in-
flows. As Alan Taylor and one of the present authors argued when tryingto explain the massive late-nineteenth-century capital flows out of the de-
mographically older Europe and into the demographically younger periph-
ery, one might even view them as intergenerational transfers from old to
young (Taylor and Williamson 1994; Taylor 1995). Can the same be said
about Asia since the 1950s?
This article will seek answers to such questions as: How much of the
impressive rise in Asian saving rates can be explained by the equally im-
pressive decline in dependency burdens? How much of the fall in external
capital dependency throughout much of Asia can be explained by the same
demographic phenomenon?' How much of the difference in saving rates
and external capital dependency between economically sluggish South Asia
and booming East Asia can be explained by their different dependency bur-
dens? Will the young Asian tigers full of productive adults have become
net capital exporters by the year 2025? What about the older Asian tigers
who may by then have become glutted with retiredadults?
The following section surveys the evidence on the evolution of the
dependency rate in Asia. It considers the radicaldemographic transforma-tion that has taken place since the 1950s, as the region moved away from
its preindustrial demographic structure. It also assesses the magnitude of
changes in the dependency rate by comparing those changes with the ex-
perience of other countries at comparable stages of development. The sub-
sequent section documents the evolution of domestic savings, investment,
and foreign capital flows as shares of GDP.Is foreign capital dependency at
least crudely correlated with the evolution of dependency burdens over
time and across regions in Asia? We then explore the theory relevant tothe dependency rate debate, and estimate the impact of dependency rate
changes on Asian savings and investment, and thus on net capital flows.
These econometric results are used to identify the role of dependency rates
in accounting for changes in Asian savings, investment, and capital flows
since the 1950s. The concluding section explores their likely role in shap-
ing changes by the year 2025.

8/9/2019 Age Structure Dynamics
http://slidepdf.com/reader/full/age-structure-dynamics 4/34
MATTHEW HIGGINS / JEFFREY G. WILLIAMSON 263
Does Asian history suggest that heavy child dependency burdens tend
to create heavy foreign capital dependency? As Asian countries aged and
their child dependency burdens fell, did dependence on foreign capital tend
to diminish? And will Asian foreign capital dependency diminish still fur-ther as dependency burdens continue to fall in the next century?
A revolutionary change in Asian dependencyrates since the 1950s?
The demographic past
Coale and Hoover showed in 1958 that the sharp decline in infant mortal-
ity initiated in the 1930s implied a sizable future increase in the Asian youth
dependency rate, especially if reinforced by the persistence of high birth
rates. They were, of course, correct. With only two precocious exceptions,
Sri Lanka (1955-59) and Japan (1950-54), Asia reached peak youth de-
pendency rates in the 1960s and 1970s.2 The modal country peaked in the
1960s. The evidence on changing Asian dependency rates in the second
half of this century is summarized in Table 1.
Elderly dependency rates have been comparatively stable in Asia dur-
ing this century. Japan, the region's demographic and economic leader,began to see a rise in its share of persons aged 65 and older beginning in
the 1970s, while a rising trend emerged among the more advanced Asian
tigers-Hong Kong, Singapore, South Korea, Taiwan-by the 1980s. As
these countries enter the next century, however, the trend toward rising
elderly shares is expected to show a marked acceleration.
Youth dependency rates were much higher in developing Asia than
they were in the developed countries. While the OECD 'young" share-
those aged less than 15-averaged about 26 percent during the baby boomin the 1950S,3 the peak rates in Asia were in many cases 20 percentage
points higher, two of the most extreme examples being from the area about
which Coale and Hoover were writing in 1958-Bangladesh and Pakistan
(both about 46 percent). At their respective peaks, the youth dependency
burden in Asia was far higher than in Europe and North America. It was
also far higher than in Japan at its peak (34.7 percent in 1950-54). Fur-
thermore, what limited data we have confirm that the increase in Asian
youth dependency rateshas occurredlargelyin the second half of the twen-
tieth century, with youth dependency remaining fairly stable at high lev-
els prior to World War II (Higgins and Williamson 1996: Table 2). Asian
demographic history has been in dynamic transition ever since.
Asian dependency rates were not exceptional, however, when com-
pared to the experience of newly settled regions in the late nineteenth cen-
tury. Alan Taylor and one of the present authors (Taylorand Williamson

8/9/2019 Age Structure Dynamics
http://slidepdf.com/reader/full/age-structure-dynamics 5/34
264 AGE STRUCTUREDYNAMICS IN ASIA
TABLE 1 Distribution of the population by age in Asia during thesecond half of the twentieth century (in percent)
Peak years for
youth dependency Young: Prime: Old: A to A from
Country and most recent years 0-14 25-59 65+ peak peak
BangladeSh 1975-79 46.0 29.6 3.5 +8.0 -2.7
1990-92 43.3 31.4 2.9
China 1965-69 40.0 35.5 4.4 +5.0 -13.6
1990-92 26.4 43.7 6.0
Hong Kong 1960-64 40.7 40.9 3.0 +8.3 -20.6
1990-92 20.1 50.8 9.3
India 1965-69 40.4 35.8 3.6 +1.5 -4.1
1990-92 36.3 37.3 4.6 (+0.4)
IndoneSia 1970-74 42.2 34.4 3.1 +3.1 -7.3
1990-92 34.9 37.7 4.1
Japan 1950-54 34.7 38.1 5.1 0 -16.7
1990-92 18.0 48.9 12.4 (-1.9)
South Korea 1965-69 42.8 34.6 3.3 +2.0 -18.0
1990-92 24.8 47.3 5.0 (+2.9)
MalaySia 1960-64 45.6 31.8 3.3 +4.1 -7.6
1990-92 38.0 37.2 3.8
Myanmar 1965-69 41.1 34.2 3.6 +2.6 -4.3
1990-92 36.8 36.2 4.2 (+3.7)
Nepal 1975-79 42.2 34.9 3.2 +3.5 -0.3
1990-92 41.9 34.1 3.2
PakiStan 1965-69 46.3 31.1 3.4 +7.1 -0.4
1990-92 45.9 31.3 2.7
PhilippineS 1965-69 45.2 30.7 2.8 +1.3 -5.6
1990-92 39.6 35.3 3.4 (+2.2)
Singapore 1960-64 43.5 35.1 2.4 +2.5 -20.2
1990-92 23.3 51.8 5.9
Sri Lanka 1955-59 41.7 34.3 3.7 +0.7 -9.9
1990-92 31.8 41.1 5.4 (+4.4)
Taiwan 1960-64 45.2 34.8 2.6 +0.9 -18.8
1990-92 26.4 45.5 6.5 (+4.7)
Thailand 1965-69 46.2 31.5 3.0 +3.6 -14.7
1990-92 31.5 40.6 4.1 (+7.1)
NOTE:Ato peak' refers o the percentagepointchangebetweenthe earliestdate, usually 1950-54, and thepeak.Thefigure n parentheses efers o changefrom1931 or 1941to thepeak,where available romHigginsandWilliamson 1996:Table2). Theageshares ormultiyearperiodsareaverages,derived romquadrennialdatavia linear nterpolation.SOURCE: nitedNations(1992).

8/9/2019 Age Structure Dynamics
http://slidepdf.com/reader/full/age-structure-dynamics 6/34
MATTHEW HIGGINS / JEFFREY G. WILLIAMSON 265
1994: 352-353) document very high youth dependency rates in the coun-
tries of the New World when they started modern economic growth; for
example, 56 percent for Canada in 1851 and 45.2 percent for Argentina in
1869.4 Furthermore, those youth dependency burdens correlate well withheavy foreign capital dependency in both cases. The capital flows from ma-
ture Europe to the adolescent New World were enormous, with Argen-
tina, Australia, and Canada largely dependent on foreign capital to fulfill
their accumulation requirements. The same seems to have been true of
Asia. Is the correlation spurious?
Table 1 also documents the large decline in the youth dependency
rate in Asia from its peak. Some of the declines from peak have been spec-
tacular. The biggest have occurred among the old and new tigers in Eastand Southeast Asia: for example, South Korea, -18.0 percentage points;
Japan, -16.7. The smallest declines have occurred among the economic
slow growers of South Asia: for example, India, -4.1 percentage points;
Pakistan, -0.4. With the exception of Sri Lanka, the intermediate cases are
all in Southeast Asia. This decline in youth dependency was compressed
within two or three decades, only half the time it took most late-nine-
teenth-century industrializing countries to record less-spectacular reduc-
tions (Taylorand Williamson 1994: Appendix Table Al). Even by the stan-
dards of history, then, Asian dependency rate changes in the late twentieth
century have been revolutionary.
The demographic present
How does Asia look today? Table2 reports the evidence for 1990-92. This
time the figures are given for the prime labor force age group (those aged
25-59).
The range across Asia is very large, almost 21 percentage points be-tween rich Singapore and poor Bangladesh. The rich city-states of Hong
Kong and Singapore are in the economically most favorablesituation, with
just over half of their populations in prime ages. Japan, South Korea, and
Taiwan are close behind. At the other extreme, Pakistan and Bangladesh
are the least favored, with less than a third of their populations in prime
ages. Nepal and the Philippines slightly exceed one-third, and the remain-
ing countries fall somewhere in between. This wide variation in Asian de-
pendency burdensmay have inhibitedeconomic convergencein the region.Equally important, there has been no dependency rate convergence
in Asia over the past three decades. Comparedwith the richer countries in
East Asia, the poorer countries in South Asia already had higher depen-
dency burdens and lower prime age shares in the 1960s, but the demo-
graphic distance between the two regions grew even wider by the 1990s.

8/9/2019 Age Structure Dynamics
http://slidepdf.com/reader/full/age-structure-dynamics 7/34
266 AGE STRUCTURE DYNAMICS IN ASIA
TABLE 2 Percent of the population of Asian countries in the prime
ages, 25-59, 1990-2025
Country 1990-92 2005 2025 A2025-1990
BangladeSh 31.4 36.2 46.1 +14.7
China 43.7 50.0 50.4 +6.7
Hong Kong 50.8 55.4 45.0 -5.8
India 37.3 40.2 47.5 +10.2
IndoneSia 37.6 44.1 49.5 +11.9
Japan 48.9 47.6 43.6 -5.3
South Korea 47.3 53.6 49.5 +2.2
Malaysia 37.2 41.7 49.2 +12.0
Myanmar 36.2 40.6 47.3 +11.1
Nepal 34.1 35.9 46.9 +12.8
Pakistan 31.3 33.4 45.0 +13.7
PhilippineS 35.3 39.9 47.5 +12.2
Singapore 51.8 53.4 45.0 -6.8
Sri Lanka 41.1 46.2 47.5 +6.4
Taiwan 45.5 na na na
Thailand 40.6 48.8 48.9 +8.3
Range: From high to low 20.6 20.2 6.8
NOTE:'A 2025-1990" refers to the percentage point change between 2025 and 1990-92 in the percent aged
25-59 years.
SOURCE:United Nations (1991).
The demographic future
The UN projections in the second and third columns of Table 2 imply a
considerable degree of demographic convergence up to 2025. The prime
age share is expected to rise in the poorest partsof Asia: the canonical case
is Bangladesh, whose prime age share would rise from 31.4 to 46.1 per-
cent, an increase of 14.7 percentage points. The prime age share is expected
to fall in the richest parts of Asia: the canonical case is Japan, whose share
would fall by 5.3 percentage points. The range between the lowest and
highest prime age share should drop from 20.6 to 6.8 percentage points
between 1990 and 2025, with almost all of that convergence taking place
between 2005 and 2025. How might this narrowing of demographic dif-
ferentials influence Asia's economic future?
Foreign capital dependency in Asia since
the 1950s
TheGDP hares or domesticsavings, nvestment,andnet capital lows are
reported for the three regions in Table 3. Net capitalflows are measured by

8/9/2019 Age Structure Dynamics
http://slidepdf.com/reader/full/age-structure-dynamics 8/34
MATTHEW HIGGINS / JEFFREY G. WILLIAMSON 267
TABLE 3 Savings, investment, and net capital flows inthree regions of Asia expressed as percent shares ofGDP, 1950-92
Region and Current accountperiod Savings Investment balance
East Asia
1950-54 18.0
1955-59 13.9 18.8 -4.9
1960-64 18.3 23.5 -4.6
1965-69 24.0 25.1 -3.4
1970-74 29.0 28.5 -1.4
1975-79 29.7 30.0 -0.7
1980-84 28.6 29.1 0.11985-89 34.0 28.3 5.3
1990-92 35.0 30.8 2.4
South Asia
1950-54 15.2 11.0 3.1
1955-59 10.4 12.8 -3.2
1960-64 9.1 14.0 -6.8
1965-69 9.5 13.4 -5.9
1970-74 8.4 12.8 -4.4
1975-79 11.0 16.4 -5.4
1980-84 10.7 20.4 -9.8
1985-89 10.0 18.8 -8.2
1990-92 9.5 19.7 -8.6
Southeast Asia
1950-54 13.2 13.9 -2.0
1955-59 15.5 14.1 1.4
1960-64 15.4 15.6 -0.3
1965-69 16.2 19.0 -2.8
1970-74 22.3 26.5 -4.2
1975-79 26.8 29.7 -2.9
1980-84 27.2 32.4 -5.3
1985-89 28.3 28.2 0.1
1990-92 32.6 34.6 -2.0
NOTES: All entries are unweighted country averages. Accordingly, the identity (savings -
investment = current account balance) is only approximate. For population-weighted
averages, see Higgins and Williamson (1996: Table 5).
the current account balance (CAB) or, equivalently, the gap, country by
country,between domestic savingsand domestic investment. Negative num-
bers imply net inflows, that is to say, foreign capitaldependency.
These unweighted regional averages show that the investment rate
has risen markedly since the early 1950s, gaining an impressive 12.8 per-

8/9/2019 Age Structure Dynamics
http://slidepdf.com/reader/full/age-structure-dynamics 9/34
268 AGE STRUCTURE DYNAMICS IN ASIA
centage points in East Asia, a robust 20.7 percentage points in SoutheastAsia, and a more sedate 8.7 percentage points in South Asia. In spite ofthis great surge in investment rates, East Asia has been growing out of
foreign capital dependency over the past four decades, the CAB share fall-ing from -4.9 percent in 1955-59 to 2.4 percent in 1990-92, for a total fall
of 7.3 percentage points. Southeast Asia, in contrast, has grown out of for-eign capitaldependency much more slowly-a delayed weaning, as it were,consistent with the more spectacular nvestment boom there. Oddlyenough,
where the investment boom has been the most modest, foreign capital de-pendency has been the most persistent: South Asia has not grown out offoreign capital dependency at all, the CAB having risen almost withoutinterruption since the 1950s.
The CAB shares for some individual countries have been enormous,
far largerthan those recorded for the regional aggregates. Almost all of the
double-digit country figures are in the region where the youth dependencyrateshave been largest,namely South Asia: for example, Bangladesh 1980-
89, Pakistan 1975-89, and SriLanka1980-92. The countries that have been
most successful in shaking off foreign capitaldependency also seem to have
undergone the most dramatic decline in dependency rates (at least where
reduced youth dependency is not heavily offset by aging, as it is in Japan).
The classic correlation is revealed by Korea's recent history. In theearly 1970s, Koreawas concerned with its heavy dependence on Japanesefinancing and commissioned World Bank studies to explore why Koreans
saved so little (Williamson 1979). By the late 1980s, Korea had doubled its
saving rate, and its CAB share had swung from -8 percent in 1970-74 to
3.2 percent. Over the same period, the dependency rate fell by more than12 percentage points, and at least one commentator has argued persua-
sively that the correlation is not spurious (Kang 1994).
How much of this experience can be explained by changes in depen-dency rates?
The life-cycle model and the dependency ratedebate
Coale and Hoover's(1958) dependencyhypothesiswas based on a simplebutpowerful ntuition:rapidpopulationgrowthresulting romfallingmor-
tality and risingfertilityswells the ranks of dependentyoung, and thischangein age structure houldincreaseconsumptionrequirementsat theexpense of savings.NathanielLeff's(1969) studya decade laterappearedto place the youth-dependency hypothesis on solid empirical footing. But
later research by Arthur Goldberger (1973), Rati Ram (1982), and others
failed to confirm the dependency hypothesis, and thus cast doubt on the
validity of the deductive reasoning and the empirical methods employedin the earlier studies.

8/9/2019 Age Structure Dynamics
http://slidepdf.com/reader/full/age-structure-dynamics 10/34
MATTHEW HIGGINS / JEFFREY G. WILLIAMSON 269
Theoretical developments also seemed to shake the foundations of
the dependency hypothesis. JamesTobin's (1967) life-cycle model held that
the national saving rate should increasewith fasterpopulation growth. The
reason is simple, at least in that model: faster population growth tilts theage distribution toward young, savings households and away from older,
dissaving ones.5The representative-agent elaboration of Solow's neoclassi-
cal growth model pointed in the same directionas Tobin's,with faster popu-
lation growth raising saving rates in response to augmented investment
demand (Solow 1956; Cass 1965; Phelps 1968).
However, the models just described failed to deal with the dynamics
implied by the demographic transition studied by Coale and Hoover. The
Wageilt' in Tobin'ssteady-state model results from the fact that it describes
a world restrictedto active adults and retireddependents; the model might
yield very different results if youth dependency were also acknowledged.
Similarly, the neoclassical growth models assume fixed labor participation
rates, and by implication assume no change in the dependency rate, ex-
actly what one would assume in a model of steady-state behavior, but in-
consistent with the facts of demographic change. In effect, both models
sacrifice the rich population dynamics implicit in Coale and Hoover's pre-
dictions about the Asian demographictransition.
The tension between the dependency rate and life-cycle models wasaddressed in the 1980s by Maxwell Fry and Andrew Mason (1982) and
Mason (1988). These authors developed what they called a "variablerate-
of-growth effect" model to link youth dependency and national saving rates.
Their model rests on the premise that a decline in the youth dependency
rate may induce changes in the timing of life-cycle consumption. If con-
sumption is shifted from childrearing to later, non-childrearing stages of
the life cycle, aggregate savings rise with a strength that depends directly
on the growth rate of national income. As a result, the model argues thatthe saving rate depends on the product of the youth-dependency ratio and
the growth rate of national income (the "growth-tilteffect"), as well as on
the dependency ratio itself (the "level effect").
Under the aegis of this new model, the dependency hypothesis has
enjoyed something of a renaissance.Drawingon cross-sectiondatafor about
50 countries, Mason (1988) found a negative relationship between youth
dependency and saving rates after controlling for the interactive effect of
dependency and income growth. Susan Collins (1991)reportedsimilar re-
sults using the variable rate-of-growth effect model to study saving rates
for a smaller cross-section of developing countries. Alan Taylorand Jeffrey
Williamson (1994) applied that model to a century of savings behavior in
Canada, Australia, and Argentina, finding suggestive evidence of demo-
graphicorigins for late-nineteenth-century capital flows.
In our view, despite these empiricalsuccesses6Mason's model has two
drawbacks as a vehicle for understanding Asian saving rates and capital

8/9/2019 Age Structure Dynamics
http://slidepdf.com/reader/full/age-structure-dynamics 11/34
270 AGE STRUCTURE DYNAMICS IN ASIA
dependency during the postwar era. First, the variable rate-of-growth ef-
fect model describesonly the steady-staterelationshipbetween dependency
and saving rates-a shortcoming derived from its life-cycle ancestry.7Yet
the rapid pace of demographic change in Asia over the past half-centurysurely supports the presumption that the observed surge in the saving rate
since the 1960s reflects out-of-steady-state behavior. Second, the variable
rate-of-growth effect model focuses exclusively on the link between de-
pendency and saving rates, ignoring the determinants of investment de-
mand (but see Auerbach and Kotlikoff 1992). Yet saving is determined in-
dependently of investment only under perfect capital mobility, that is, in a
small, open economy facing an exogenous world interest rate. In any other
setting, the observed saving rate depends on both domestic savingssupply
and investment demand (e.g., Feldstein and Horioka 1980; Obstfeld 1986;
Feldstein and Bacchetta 1991; Frankel 1991). By abstracting from demo-
graphic influences on investment demand, the variable rate-of-growth ef-
fect model provides no guidance concerning the effects of demographic
change on the residual of greatest interest in this article, net capital flows.
To address these issues requires a dynamic model, one capable of in-
corporating demographic effects on both savings supply and investment
demand. Fortunately, the variablerate-of-growth effect model is easily ex-
tended to accommodate these requirements.Higginsand Williamson (1996)
show that the variable rate-of-growth effect model can be subsumed un-
der the textbook neoclassical growth model (e.g., Blanchard and Fischer
1988), inhabited by an overlapping generations population: the former
model is, in essence, the open-economy, steady-state version of the latter.
In the extended model (outlined in the Appendix), saving remains moti-
vated by life-cycle considerations, while investment demand is driven by
the need to equip a growing labor force. For an open economy, the gap
between savings supply and investment demand is reflected in net capitalflows (the current account balance); for a closed economy, the balance be-
tween these forces determines the equilibrium (i.e., observed) saving rate.
We rely on simulations to study the economy's dynamic evolution in
response to empirically plausible patterns of demographic change. (Ana-
lytical solutions are generally unavailable, even given simple functional
forms.) A simulated "demographic transition,' in which fertility rises for
several generations before falling to a new, lower steady-state level, repre-
sents an attractive experiment, because such a pattern roughly describesthe demographic history of many Asian countries over the postwar era.
The simulation results highlight an important qualitative implication
of standardgrowth models: the demographic 'center of gravity' for invest-
ment demand should be earlier in the age distribution than that for sav-
ings supply. In particular, investment demand should be most closely re-
lated to the shareof young (throughits connection with laborforce growth),

8/9/2019 Age Structure Dynamics
http://slidepdf.com/reader/full/age-structure-dynamics 12/34
MATTHEW HIGGINS / JEFFREY G. WILLIAMSON 271
while savings supply should be most closely related to shareof mature adults
(through its connection with retirement needs). The divergence between
these centers of gravity implies that the effects of demographic change on
savings and net capital flows will depend on the economy's degree of open-ness to capital flows. For a financially open economy, a shift in the popula-
tion age distribution toward younger ages should produce a tendency to-
ward current account deficits: saving falls due to the increased dependency
burden, even as investment rises in response to higher labor force growth.
As the age distribution shifts toward the center, savings supply should in-
crease, even as investment demand slackens, pushing the current account
into surplus. In contrast,for a closed economy, the younger center of gravity
for investment would cause the observed(i.e., equilibrium)saving rate to ap-
pear positivelyrelated to relativelyyoung aspects of the age distribution.
It is not immediately clear whether the open- or closed-economy as-
sumption provides the better guide in analyzing the observed dynamics of
savings, investment, and capital flows. The fact that many Asian countries
have, since the 1950s, relied so heavily on capital imports might appear to
create a strong prima facie case against the closed-economy assumption.
The real issue, however, is whether investment is constrained by domestic
savings (Williamson 1993). If the economy faces a binding constraint on
capital inflows, equilibrium in the domestic capital market will depend onboth local savings supply and investment demand, and demographic de-
pendency will alter the market outcome in a way qualitatively similar to a
closed economy. For example, an increase in fertility under such condi-
tions would lower the supply of savings at a given interest rate, leading to
an equal decline in investment, leaving the volume of capital inflows un-
changed. Under weaker restrictions on foreign mobility, dependency rate
changes will affect equilibrium in the domestic capital market in a way
that would display features of both the closed- and open-economy models.Suppose, for example, that potential borrowers must pay a risk premium
in order to attract foreign capital, and that the premium rises with the de-
sired inflow. A dependency-rate-induced fall in the domestic supply of sav-
ings at a given interest rate would then be only partly offset by increased
capital inflows, forcing up the interest rate and causing a decline in invest-
ment. A positive link between youth dependency and capital dependency
would be observed, but it would be weaker than the one generated under
perfect world capital markets.Although the model described here represents a generalization of the
existing macroeconomic models of the savings/demography nexus, it re-
mains subject to several obvious limitations. Because parents are treated as
having no bequest motive, the model abstractsfrom the effects of demo-
graphic change on the transmission of wealth across generations. Fertility
itself is treated as exogenous, so that the model abstractsfrom the chang-

8/9/2019 Age Structure Dynamics
http://slidepdf.com/reader/full/age-structure-dynamics 13/34
272 AGE STRUCTURE DYNAMICS IN ASIA
ing costs and benefits of childrearing over the course of development. (We
return to this topic in the concluding section. The exogeneity assumption
implies, of course, that we sidestepthe issue of whether childrearing n poor
countries is motivatedpartly by the need for old-age support.)Investment isdrivenby demand for socialoverheadand residentialas well as business capi-
tal, and thus the model may be unduly reductionistin emphasizingthe con-
nection between investmentand labor forcegrowth.We areaware of no trac-
table model thataccommodates hese complexities,but they may be important
nonetheless. Our empiricalanalysis (in common with previous cross-coun-
try studies) should be regardedas capturingthe effect of demographicforces
driving accumulation, rather than as a test of a particularcausal channel.
Estimating dependency rate effects in Asia
In this section, we report estimates of the links between youth and old-age
dependency and national savings and investment rates for Asia in the late
twentieth century. The resultssuggest substantialdemographiceffects, with
increases in both youth and old-age dependency bringing about lower sav-
ing rates. The results also point to differential demographic effects on sav-
ings supply and investment demand. Higher youth dependency depresses
savings more than investment, inducing capitalinflows, while higher elderly
dependencydepresses nvestmentmore than savings,inducing capitalexports.
Empiricalresults
We follow the economics literature on age structure effects in treating
changes in national savings (and investment) rates as the result of changes
in demographic variables, growth in real national income (GROWTH),and
interactions among these variables.Following Alan Taylor (1995), we alsoadd the relative price of investment goods (RPI)to control for their pos-
sible effects on savings supply or investment demand. The demographic
variables (ZJ and Z2) provide a summary measure of the age distribution
and are constructed as described in Higgins and Williamson (1996) (also
see the Appendix). Because labor force growth is a simple function of the
age distribution (abstractingfrom changes in labor force participation and
mortalityrates among the working-age population), our demographicspeci-
fication should also capture the potential effects of this variable. Detailsconcerning our econometric specification, data sources, and measurement
issues are reported in the Appendix.
Our estimates indicate that changing age distributionshave had a sta-
tistically significant impact on Asian saving and investment rates (see Table
4). For both the national savings and the investment equations, the age-
distribution variables are jointly significant at the one percent level.8 Our

8/9/2019 Age Structure Dynamics
http://slidepdf.com/reader/full/age-structure-dynamics 14/34
MATTHEW HIGGINS / JEFFREY G. WILLIAMSON 273
TABLE 4 Empirical results, specification tests,and data sources
Dependent variable
variable National savings Investment
LDV .809** .809**
(40.34) (40.34)
GROWTH -3.54E-2 .238**
(.419) (3.10)
RPI 4.57E-2** 1.44E-2
(2.68) (.889)
ZJ .703** .566**
(3.40) (2.77)
Z2 -4.64E-2** 4.OOE-2*
(2.87) (2.52)
F-statistic 22.55 9.66
Marginal significance <.001 <.001
NOTES:1 See Appendix or variabledefinitions,variablesused as instruments,data
sources,and detailsof econometricmethod.
2 Methodof estimation: hree-stage east squares 3SLS).
3 Totalnumberof observations= 916. System-weightedR2= .915.4 Estimates or constant erm and dummyvariablesnot reported.
5 Absolute -statistics re in parentheses.The F-statistics t the bottomof thetable ndicate hejoint significance f the two demographic ariables.
6 Testforequalityof the demographicariables cross he two equations:F2,,.= 4.43, withmarginal ignificanceevelof .012. This est is equivalent o a testof the significance f the demographic ariablesn explainingmovements nthe currentaccount.
estimation procedure implicitly yields estimates of demographic effects on
capital flows via the identity: National Savings = Investment + CurrentAc-count Balance. We are able to reject, at close to the one percent level, the
null hypothesis that the demographic coefficients are equal for the savings
and investment equations (Table 4). This implies, of course, a statistically
significant link between demographic effects and net capital flows.9
Using the parameter estimates for the demographic variables, Figure
1 reveals the relationship between Asian age distributions and the three
national income shares: savings, investment, and the current account bal-
ance. The coefficients plotted are the change in each of the three sharesassociated with a unit increase in the log age shares, that is they assess the
impact of changes in the age share ceteris paribus.The figure shows clearly
that youth and old-age dependency have a depressing effect on savings,
with the largest impact for ages 0-10 and ages above 64. Moreover, the
coefficients appear to be consistent with the "hump"savings pattern pre-
dicted by the life-cycle hypothesis, attaining their highest values during

8/9/2019 Age Structure Dynamics
http://slidepdf.com/reader/full/age-structure-dynamics 15/34
274 AGE STRUCTURE DYNAMICS IN ASIA
FIGURE1 Estimated age distribution coefficients for savings,investment, and the current account balance
5
2.5
0
-2.5 Xav'mgs
-5 / ~~~~~~~~~~~~~Investment-5
-7.5
-10
0-4 10-14 20-25 30-35 40-44 50-54 60-64 70+
Age
2
1
Current account balance
0
-1
-2
0-4 10-14 20-25 30-35 40-44 50-54 60-64 70+
Age
NOTE: hecoefficients efer o the estimated hange n nationalsavings, nvestment,andthe currentaccount
balanceas sharesof GDPassociatedwith a unit increase n the correspondingog populationageshares.
SOURCE: ee discussionn text.

8/9/2019 Age Structure Dynamics
http://slidepdf.com/reader/full/age-structure-dynamics 16/34
MATTHEW HIGGINS / JEFFREY G. WILLIAMSON 275
midlife. But they reach a peak rather early in Asia, at ages 35-39, declin-
ing sharply thereafter so as to become negative by ages 55-59. Yet, the
rather young "center of gravity"found for the saving rate is what might
have been expected if Asia has been only imperfectly integrated into theworld capital market.'0
The implicit age distribution coefficients for the investment equation
appear at first glance to be quite similar to those for savings. To bring the
differences into relief, the bottom half of Figure 1 plots the implicit age
distribution coefficients for the current account balance. The coefficients
are clearly negative for the early portion of life (up to age 39), indicating
that the young-adult-induced increase in investment demand (transmit-
ted via both employment and infrastructureneeds) outweighs its inducedincrease in savings supply. This implies that relatively young countries pass
through a long period of foreign capital dependency which includes peri-
ods of child, adolescent, and young adult gluts. The coefficients turn posi-
tive after age 40 as the induced fall in investment demand outstrips the
induced fall in savings." According to these estimates, relatively young
countries (like those in Asia) are net capital importers and relatively old
countries are net capital exporters: if global capital markets let it happen,
capital in the late twentieth century tends to move between countries in
the manner of an intergenerational transfer.
In-sample effects and out-of-sample projections
The results just described will be used in the rest of the article to construct
estimates of the impact of the changing dependency burden on Asian sav-
ings, investment, and net capital dependency. The estimates refer to de-
mographically induced deviations of, say, a country's saving rate from the
country average for the full sample period. We also construct projectionsof the effects of expected changes in the dependency burden on savings,
investment, and capital flows, using the UN's estimates of population age
shares for 2010 and 2025. The same procedure, of course, is followed for
investment and the current account balance.
Did dependency ratesdriveAsian capitalflowsin thepast?
This section uses the model estimated above to assess the impact of depen-
dency rates on Asian savings, investment, and capital flows in two ways.
First,we ask how much of the observed change in these variablesbetween
1950 and 1992 can be explained by changes in the dependency burden.
That is, we isolate the impact of the Asian demographic transition on these

8/9/2019 Age Structure Dynamics
http://slidepdf.com/reader/full/age-structure-dynamics 17/34
276 AGE STRUCTURE DYNAMICS IN ASIA
three aspects of accumulation over much of the late twentieth century by
applying observed demographic changes to the estimated beta coefficients
derived in the previous section. Second, we ask how much of the good or
poor accumulation performance of countries and regions in Asia since the1950s has been due to heavy or light dependency burdens, using the same
decompositionprocedure.Forexample,how would SouthAsia haveperformed
if it had the lighterdependency burdens of EastAsia? Or,how would Korea
have performedunder the heavierdependencyburdenof Bangladesh?
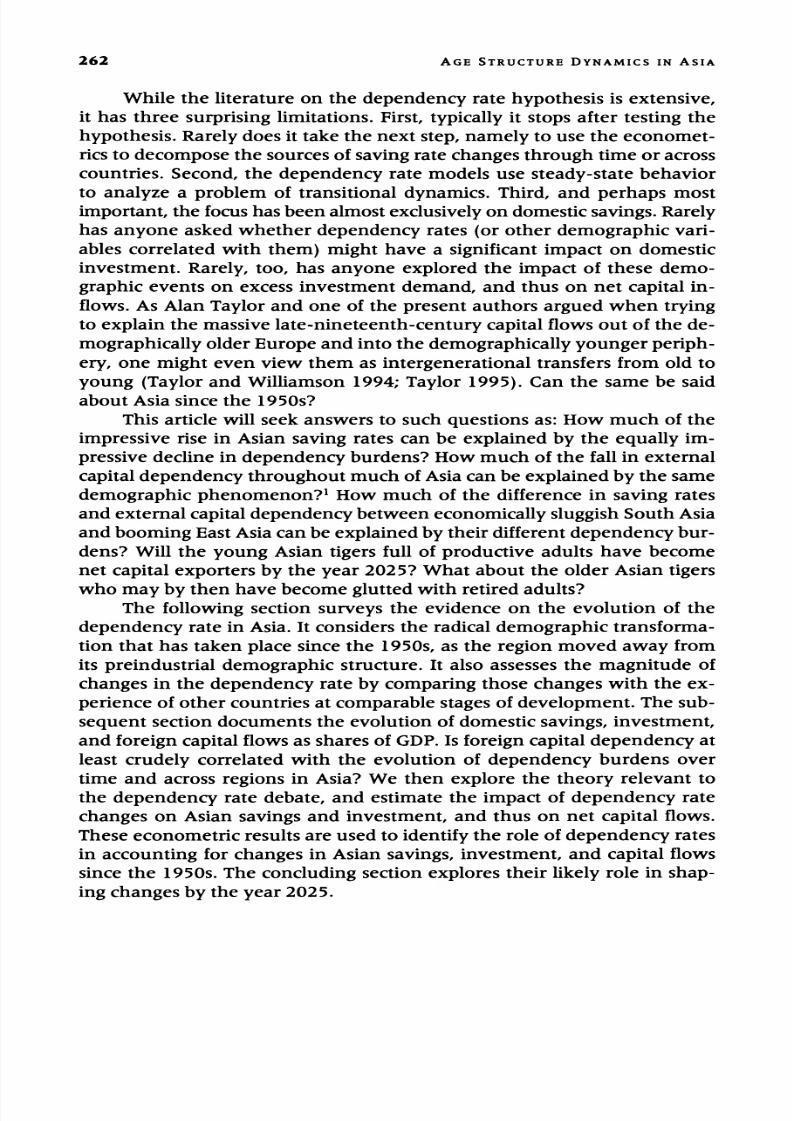
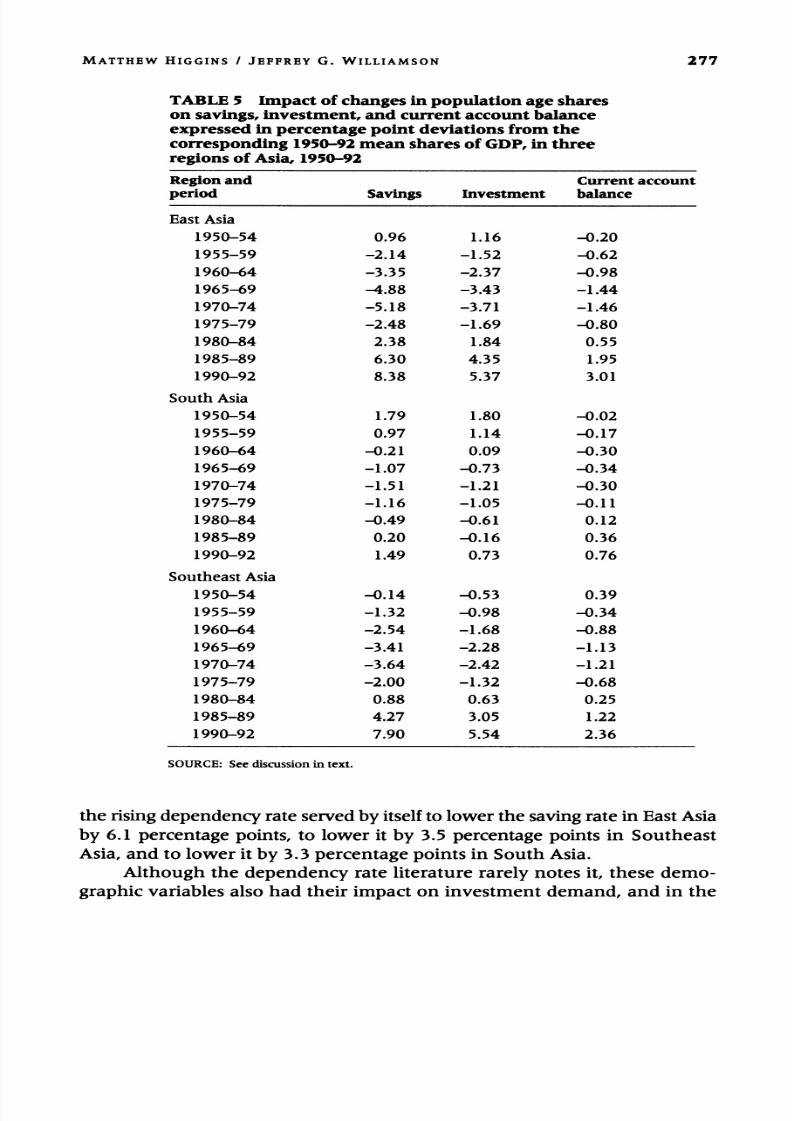
Dependency rate impact over time
We calculate the impact of the demographic transition on accumulationperformance through time relative to the mean values for the full period
of the late twentieth century (see Appendix, equation 5). Thus, the figures
for savings in Table 5 tell us the effect of changes in population age shares
on the saving rate as it deviated from the 1950-92 mean. Another way of
stating this is that saving rates would have been x percentage points higher
or lower during a given period had the population age shares remained
constant at their 1950-92 means. The best way to readTable5 is in terms of
the implieddemographictransitionor demographicswing effect.
According to our estimates in Table 5, EastAsia's saving rate in 1990-92 was 8.4 percentage points above its 1950-92 average due to the region's
transition to a much lighter dependency burden. Similarly,East Asia's sav-
ing rate in 1970-74 was 5.2 percentage points below its 1950-92 average
due to the heavy dependency rate burden at that time. The total demo-
graphicswing was an enormous 13.6 percentage points over these 20 years,
accounting for all of the total rise in the saving rate in East Asia over this
period (6 percentage points: Table 3). The figures for Southeast Asia are
similar, though not quite so pronounced. Southeast Asia's saving rate was7.9 percentage points higher in 1990-92 than its 1950-92 average due to
its lighter dependency burdenlate in the twentieth century.And the region's
saving rate was 3.6 percentage points lower in 1970-74 due to the heavier
burden at that time. The total demographic swing was 11.5 percentage
points, accounting, once again, for all of the total rise in the saving rate in
Southeast Asia after 1970 (10.3 percentage points: Table 3). The region
with the slowest demographic transition (but highest dependency burden)
has been South Asia, so the far more modest changesin
the savingrate
there are predictable:the weak dependency rate impact on the saving rate
(an induced 3 percentage point rise: Table 5) accounts for all of the weak
rise in that rate (1.1 percentage points: Table 3).
Of course the Asian demographic transition started earlier, perhaps
in the 1930s, but the historical national accounts are not good enough to
measure its impact earlier than 1950. Yet, between 1950-54 and 1970-74
8/9/2019 Age Structure Dynamics
http://slidepdf.com/reader/full/age-structure-dynamics 18/34
MATTHEW HIGGINS / JEFFREY G. WILLIAMSON 277
TABLE 5 Impact of changes in population age shareson savings, investment, and current account balanceexpressed in percentage point deviations from thecorresponding 1950-92 mean shares of GDP, in three
regions of Asia, 1950-92
Region and Current accountperiod Savings Investment balance
East Asia
1950-54 0.96 1.16 -0.20
1955-59 -2.14 -1.52 -0.62
1960-64 -3.35 -2.37 -0.98
1965-69 -4.88 -3.43 -1.44
1970-74 -5.18 -3.71 -1.46
1975-79 -2.48 -1.69 -0.80
1980-84 2.38 1.84 0.55
1985-89 6.30 4.35 1.95
1990-92 8.38 5.37 3.01
South Asia
1950-54 1.79 1.80 -0.02
1955-59 0.97 1.14 -0.17
1960-64 -0.21 0.09 -0.30
1965-69 -1.07 -0.73 -0.34
1970-74 -1.51 -1.21 -0.30
1975-79 -1.16 -1.05 -0.11
1980-84 -0.49 -0.61 0.12
1985-89 0.20 -0.16 0.36
1990-92 1.49 0.73 0.76
Southeast Asia
1950-54 -0.14 -0.53 0.39
1955-59 -1.32 -0.98 -0.34
1960-64 -2.54 -1.68 -0.88
1965-69 -3.41 -2.28 -1.13
1970-74 -3.64 -2.42 -1.21
1975-79 -2.00 -1.32 -0.68
1980-84 0.88 0.63 0.25
1985-89 4.27 3.05 1.22
1990-92 7.90 5.54 2.36
SOURCE: See discussion in text.
the risingdependency rate servedby itself to lower the savingratein East Asia
by 6.1 percentage points, to lower it by 3.5 percentage points in Southeast
Asia, and to lower it by 3.3 percentage points in South Asia.
Although the dependency rate literature rarely notes it, these demo-graphic variables also had their impact on investment demand, and in the

8/9/2019 Age Structure Dynamics
http://slidepdf.com/reader/full/age-structure-dynamics 19/34
278 AGE STRUCTURE DYNAMICS IN ASIA
same direction: dependents generate lower investment demand than do
mature adults, who have to be equipped at work and transported to job
sites. But the demographic impact on Asian investment rates has been less
dramatic in the recent past than on saving rates, as Table 5 shows, and asthe previous section implied.
The net dependency rate effect would by itself have produced a long
historical swing in foreign capital dependency in Asia over the past half
century. During their periods of peak dependency burdens, all three re-
gions were net importers of foreign capital:demographic dependency has
been associated with foreign capital dependency in this century. But the
demographic transition-when left to its own devices and not offset by
other forces-caused foreign capitaldependencyto wax and wane. In East
Asia, the changing dependency rate by itself raised the (negative) current
account balance share in GDPby 1.3 percentage points between 1950-54
and 1970-74 and then lowered it by 4.5 percentage points between 1970-
74 and 1990-92. Indeed, the declining dependency burden by itself caused
East Asia to switch from a net capital importing position in 1970-74 (-1.5
percentage points) to a net capital exporting position in 1990-92 (+3 per-
centage points). Similarly, changing demographic dependency in South-
east Asia would by itself have produced the same swing in foreign capital
dependency after 1950, although not quite as marked as in East Asia. Wecan see its influence in South Asia too, but it has been far more modest
there, as has the speed of the demographic transition.
Certainly the dependency rate was not the only force driving foreign
capital dependency in Asia. Indeed, offsetting forces may well have been
at work, some of them related to changing policy toward foreign presence
in local capital markets and others related to investment booms during
which the pace of development accelerated abruptly. No long-run model
can expect to accommodatesuch short-runand medium-term changes. Nev-ertheless, in the present context the relevant question is this: How much
of the past performance can be explained by dependency rate changes?
We answer that demographic events explain all of the foreign capital de-
pendency decline in Southeast Asia after the early 1970s (3.6 percentage
point change between 1970-74 and 1990-92 predictedfromTable5 as com-
pared to the actual 2.2 percentage point change shown in Table 3); they
explain all of the decline in East Asia (4.5 versus 3.8 percentagepoints);but
they explainnone of the risein South Asia (1.1 versus-4.2 percentagepoints).The experiences of individual East Asian countries retell the aggre-
gate East Asian story with remarkably little deviance, but some country
dependency rate effects are especially spectacular. Recall that East Asia as
a whole reached a peak dependency rateimpact in 1970-74 (although some
countries reached their peaks earlier), and the fall thereafter served to aug-
ment the saving rate by 13.6 percentage points. While the subsequent fall
in the dependency rate from the peak to 1990-92 raised the saving rate in

8/9/2019 Age Structure Dynamics
http://slidepdf.com/reader/full/age-structure-dynamics 20/34
MATTHEW HIGGINS / JEFFREY G. WILLIAMSON 279
Japan by 'only' 12.2 percentage points, it raised it by almost 26 percent-
age points in both South Korea and Taiwan. The other East Asian coun-
tries fell in between these two extremes. The impact of dependency rates
on investment rates was everywhere in East Asia somewhat less than onsaving rates, so that declining dependency rates implied declining foreign
capital dependency. For example, from the peak in 1955-59 to 1985-89,
this demographic effect by itself caused Taiwan's current account balance
share to switch from -4.8 to +4.8 percent, for a total swing of 9.6 percent.
Even the smallest impacts in East Asia were impressive: based on the de-
pendency rate effects alone, Korea would have evolved from a CAB share
of -1.7 percent in 1955-59 to +5.4 percent in 1990-92; and China would
have gone from a CAB share of -1.5 percent in 1970-74 to +2.9 percent in1990-92. Once again, other forces were also driving EastAsian CAB shares.
To consider Taiwan again, its actual CAB share rose by 22.3 percentage
points between 1955-59 and 1985-89, so that the declining dependency
rate accounted for more than four-tenths of the change.
In Southeast Asia, too, the impact of dependency ratechanges on sav-
ings outweighed their impact on investment, so that declining dependency
rates in Southeast Asia implied declining foreign capital dependency, just
as in East Asia. While the impact was less in Southeast Asia, it is neverthe-
less impressive. The standard East Asian story is replicatedby Singapore'sexperience: due to dependency rate effects alone, the share of the current
account balance in GDPwould have switched from -1.7 percent in 1965-
69 to +6.8 percent in 1990-92, for a total rise of 8.5 percentage points.
Over the same period, the CAB share actually rose by 16.9 percentage
points, so that the falling dependency rate accounted for about half of the
rising CAB share.
The experience of other Southeast Asian countries differs from that
of East Asia. In one sense, less interesting cases are offered by Indonesia,Malaysia, the Philippines, and Thailand: the dependency rate effects by
themselves raised the CAB share by 'only' about 3 to 5 percentage points
between 1970-74 and 1990-92. In another sense, however, these four cases
(new tigers among them) are the most interesting in Southeast Asia: de-
pendency rate effects were completely swamped by other, offsetting, forces.
Falling dependency rates by themselves should have raised the CABshare
among these young tigers, reducing their foreign capital dependency. Yet
all four increased their foreign capital dependency, and some-like Malay-sia and Thailand-did so dramatically. Rising foreign capital dependency
was inconsistent with the moderating dependency rate influences. Other
forces-such as the vigorous investment boom-were pushing in the op-
posite direction, and they dominated.
Most South Asian country experiences are at variance with the East
Asian pattern of dependency effects. Pakistan'sforeign capital dependency
has marginallyfallen since 1965-69, while India's has marginally increased;

8/9/2019 Age Structure Dynamics
http://slidepdf.com/reader/full/age-structure-dynamics 21/34
280 AGE STRUCTURE DYNAMICS IN ASIA
for both countries dependency effects alone would have produced a small
change in the opposite direction. Sri Lanka experienced a marked rise in
foreign capital dependency between 1950-54 and 1990-92 (perhaps due
to the depressing effects on saving of civil strife and the attendant militaryexpenditure), in spite of improved dependency rate conditions. Only for
Bangladesh do demographic forces appear to have dominated, with the
rising youth dependency burden accounting for the bulk of the 2.9 per-
centage point decline in the CAB balance between 1970-74 and 1990-92.
Dependency rate impact acrossAsia
The poor countries of South Asia have carried greater dependency bur-dens, implying higher net domestic savings shortfalls and greater foreign
capital dependency. The best way to illustrate that fact is by recourse to
the counterfactual. Suppose the fast-transition countries of East Asia had
carried the heavier demographic burdens of South Asia.'2 And suppose
South Asia had carriedthe lighter demographic burdens of the fast-transi-
tion countries of EastAsia.
The results of these thought experiments appear in Table 6 for three
points in time: early in the demographic transition, 1955-59; the middle,
1975-79; and toward the end, 1990-92. The table first reports the share of
the current account balance in GDP that was recorded under the actual
dependency burden. The table also reports the share that would have pre-
vailed had the country carried the dependency burden which character-
ized other partsof Asia ('counterfactual'), and the difference between the
two. (The shares are calculated following equation (6) in the Appendix.)
Even though national accounts data may make it impossible to document
the actual share for some periods and countries, the difference (col. 3) can
always be calculated given the estimated within-sample beta coefficientsand the dependency burdens. Panel A asks how East Asia would have be-
haved given South Asian demographics.Panel B turns the question around,
asking how South Asia would have behaved given the demographics of
EastAsia.
To illustrate the first question, consider Panel B in Table 6: while Pa-
kistan was a significant net capital importer in 1990-92 (-6.9 percent of
GDP),it would have been a net capital exporter (+3.9 of GDP)had it been
favored with the lighter demographic burden of the fast-transition coun-tries during the same period. The switch between the actual and counter-
factual demographic regimes implies a 10.8 percentage point change. This
figure is huge: if the dependency rate can really be taken as exogenous,
and if the coefficients estimated above are even close to the mark, it sug-
gests that much of South Asia's heavy dependence on foreign capital has
been due to the fact that the dependency burden has been far higher there
than in East Asian countries. And the 1990-92 period is no outlier:

8/9/2019 Age Structure Dynamics
http://slidepdf.com/reader/full/age-structure-dynamics 22/34
MATTHEW HIGGINS / JEFFREY G. WILLIAMSON 281
TABLE 6 Impact of changes in population age shares on current accountbalance in selected countries of Asia: Calculations for three periods basedon counterfactual assumptions, 1955-92 (in percent of GDP)
Shares in GDP
Actual Counterfactual Difference
Country Period (1) (2) (2) - (1)
A. Fast-transition countries with South Asian age shares
China 1955-59 -3.06
1975-79 +0.16 -1.99 -2.15
1990-92 +2.29 -2.79 -5.08
Hong Kong 1955-59 +1.37
1975-79 -6.21
1990-92 -9.55
Korea 1955-59 -8.73 -7.45 +1.28
1975-79 -5.43 -5.78 -0.35
1990-92 -4.87
Singapore 1955-59 +4.43
1975-79 -7.13 -9.39 -2.26
1990-92 +9.61 +3.33 -6.28
Taiwan 1955-59 -6.61 -2.03 +4.58
1975-80 +1.92 +0.22 -1.70
1990-92 -6.10
B. South Asian countries with fast-transition age shares
Bangladesh 1955-59 +1.83
1975-79 -8.79 -4.03 +4.76
1990-92 -8.22 1.93 +10.15
India 1955-59 -3.24 -0.19 +3.05
1975-79 -0.56 +0.73 +1.29
1990-92 +3.60
Myanmar 1955-59 +2.70
1975-79 -2.71 -0.83 +1.88
1990-92 +4.95
Nepal 1955-59 +2.42
1975-79 -3.51 +0.50 +4.01
1990-92 +7.55
Pakistan 1955-59 -7.59 -5.23 +2.36
1975-79 -11.38 -5.39 +5.99
1990-92 -6.92 +3.91 +10.83
Sri Lanka 1955-59 +1.24 +5.08 +3.84
1975-79 -5.28 -3.93 +1.35
1990-92 -10.74 -9.17 +1.57
NOTES: heperiods orwhichthere are blanksreflectabsenceof nationalaccountsdata,but calculationof the"difference"oes not require hatinformation.See text fordefinitionof the counterfactuals.SOURCE:eediscussionn text.

8/9/2019 Age Structure Dynamics
http://slidepdf.com/reader/full/age-structure-dynamics 23/34
282 AGE STRUCTURE DYNAMICS IN ASIA
Pakistan's CAB would have been higher by 6 percentage points of GDP
during 1975-79 given EastAsian demographics, and 2.4 percentage points
higher as far back as 1955-59. Nor is Pakistan itself an outlier. The
counterfactual swing in the CABshare is similarfor Bangladesh, and insig-nificant only for SriLanka.
The question can, of course, be posed the other way round. Panel A
asks how East Asia would have fared if it experienced the heavier depen-
dency burden of South Asia. Again the figures are very large: in 1990-92,
Hong Kong's CAB share would have been lower by some 9.6 percentage
points of GDP,while CABsharesof the other fast-transitioncountries would
have been lower by 5 or 6 percentage points. Interestingly,however, South
Asiandemographicswould have brought higher CABbalances in 1955-59,
reflecting demographic divergence between rich and poor Asian countries.
Could dependency rates drive Asian capital flows
in the future?
Economistsmake projections or the next centuryat theirperil, but what
followsis not projection. ndeed,we havebeen careful o beginthe titleof
this section with the word could,rather than will. There are just too many
things that might offset the potential impact of demographyon foreign capi-
tal dependency over the next 30 years. Globalcapital markets may retreat
behind autarkic barriers, ust as they did between 1914 and the early 1970s
(Williamson 1996). China may open its doors wide to foreign capital, or
slam them shut. Capitalscarcity in world markets may rise or fall (Barro
1992). The robust investment boom among the new Southeast Asian ti-
gers may falter, or it may instead spread throughout South Asia. We have
nothing to say about these important influences, save to recall how in the
recent past they have had a big impact in delaying the switch to foreigncapital independence in Southeast Asia and offsetting it entirely in South
Asia. We admit that the real world in the year 2025 may look very differ-
ent from the one we depict here.
Having issued these warnings, we now assess the impact of demo-
graphicevents alone on foreign capitaldependency by the year 2025. What
might be the implications of the anticipated demographic trends depicted
in Table 2? After harvesting the benefits of an enormous past decline in
the youth dependency rate, how will Japan and the old East Asian tigersrespond to a future rise in the elderly dependency rate? What will happen
to foreign capital dependency in South Asia as Bangladesh, India, and Pa-
kistan enjoy a spectacularrise in the prime age share?
Our guess at the future is based on the predictable demographic facts
underlying Table 2 and on the demographic beta coefficients estimated
above. Nothing else enters into the calculations, so Table 7 can speak only

8/9/2019 Age Structure Dynamics
http://slidepdf.com/reader/full/age-structure-dynamics 24/34
MATTHEW HIGGINS I JEFFREY G. WILLIAMSON 283
TABLE 7 Projected impact of expected changes in population age shares oncurrent account balance in selected countries of Asia, 1990-2025 (in percent of GDP)
Country Share in GDP of Country Share in GDP ofand years current account balance and years current account balance
Bangladesh Myanmar
1990-92 -8.22 1985-89 -3.39*
2005 -6.56 2005 -1.26
2015 -3.11 2015 +1.35
2025 +1.40 2025 +4.80
China Pakistan
1990-92 +2.29 1990-92 -6.92
2005 +5.93 2005 -4.67
2015 +9.15 2015 -1.22
2025 +11.21 2025 +3.02
India Philippines
1985-89 -3.81* 1990-92 -2.33
2005 -1.51 2005 +1.28
2015 +1.08 2015 +4.67
2025 +4.05 2025 +8.18
Indonesia Singapore
1990-92 -3.45 1990-92 +9.61
2005 +0.93 2005 +14.93
2015 +4.03 2015 +18.04
2025 +6.97 2025 +19.13
Japan Sri Lanka
1990-92 +2.46 1990-92 -10.74
2005 +4.36 2005 -6.33
2015 +4.81 2015 -3.57
2025 +4.51 2025 -1.61
Korea Thailand
1985-89 +3.18* 1990-92 -7.66
2005 +8.82 2005 -2.31
2015 +11.68 2015 +1.07
2025 +13.86 2025 +4.02
Malaysia
1990-92 -6.20
2005 -1.67
2015 +2.18
2025 +5.10
NOTES: hefiguresdenotedbyan asteriskmean that the CAB hare or 1990-92 cannotbedocumented n oursource;we use1985-89 instead.TheCAB hare orNepal s not even available or 1985-89,and thuswasexcluded romthis table.HongKongand Taiwanarenot included n these projections.SOURCE: eediscussion n text.
to the impact of future demographic events. But some loud and interesting
suggestions emerge from the table.

8/9/2019 Age Structure Dynamics
http://slidepdf.com/reader/full/age-structure-dynamics 25/34
284 AGE STRUCTURE DYNAMICS IN ASIA
Population aging in Japan will lower the saving rate, of course, but it
will also lower the investment rate, and by a bit more. Thus, if demographic
forces are permitted to have their way, Japan will not become a nation of
old people unable to find the resources to export capital to the poorer partsof Asia. Actually, it looks as though the CAB share will rise by about 2
percentage points over its level in 1990-92. But what distinguishes Japan
is that the rise is so modest: it is likely to be dramatic elsewhere in Asia.
South Asia will graduate from its current heavy dependency on for-
eign capital to complete independence by 2025. The CAB in Bangladesh
will switch from -8.2 percent of GDPin 1990-92 to +1.4 percent in 2025,
a total change of 9.6 percentage points, almost identical with the impact of
the fall in the dependency rate recorded by Japan between 1950-54 and
1990-92. India will undergo a similar trend, although the total impact will
not be as great (a 7.9 percentage point drop in the CAB share). Pakistan
and Sri Lanka will closely replicate the case of Bangladesh. The experience
in East Asia will be similar (Japan aside), with the CAB share rising by
about 10 percentage points for China and Korea.
Nevertheless, the movement toward net capital export positions will
be most pronounced in Southeast Asia. Between 1990-92 and 2025, the
CAB share will rise by 10.4 percentage points in Indonesia, by 11.3 in Ma-
laysia,by 10.5 in the Philippines,by 9.5 in Singapore,and by 11.7 in Thailand.If demographicforcesare allowed to have their way, capitalflows over
Asian borders will be very different three decades from now.
The bottom line: Coale and Hooverwere right
As anticipated by Coale and Hoover, falling mortality and lagging declines
in fertility have had a profound impact on Asian savings, investment, and
foreign capital dependency over the half-century since 1950. While thedependency rate literature looks almost exclusively at the effect on do-
mestic savings, this article also looks at age structure effects on investment
and the current account balance. The wider focus has paid off in providing
insight into Asian foreign capital dependency in the past, present, and fu-
ture. And we have done so with a model that rejects steady-state analysis
in favor of transition analysis, a model that offers a compatible marriage
between the demographic transition and the economic models used to ex-
plore its impact.We find that much of the impressive rise in Asian saving rates since
the 1960s can be explained by the equally impressive decline in youth de-
pendency burdens. Wherever the youth dependency burden has fallen dra-
matically, Asian countries have relinquished their reliance on foreign capi-
tal. Much of the contrast in level of foreign capital dependency between
South and East Asia can be explained by the size of the youth dependency

8/9/2019 Age Structure Dynamics
http://slidepdf.com/reader/full/age-structure-dynamics 26/34

8/9/2019 Age Structure Dynamics
http://slidepdf.com/reader/full/age-structure-dynamics 27/34
286 AGE STRUCTURE DYNAMICS IN ASIA
endowed with one unit of time, which is inelastically supplied to the labor force.
Laborincome is divided among current consumption, child support, and savings
for old age. The lifetime budget constraint of a representative prime-age adult at
time t can then be written as:
C2,t + +nWt = Cl,t1 + r + ntco, (1)
where C1,and C2+l refer, respectively, to consumption during the prime years and
retirement, CO,s consumption per dependent offspring, and rt+,s the interest rate
on assets acquired at t and held until t+1.
Preferences are described by an additively separable utility function of the
form:
cl, p)-11 C2,t 1 +I n 11-c0, (2)
1-0 1-0 1-0
The substitutability of consumption across periods is described by (1/), the
intertemporal elasticity of substitution; for (1/0) > 1, higher interest rates lead to
increased savings. The pure rate of time preference is given by p. The parameter
O< ? < 1 allows for the possibility that the weight of the young generation in the
parental utility function is less than proportional to the number of children. Theparameter y < 1 allows for the possibility that a child can attain a given level of
utility while consuming less than an adult.
Output is produced according to a constant returns to scale, neoclassical pro-
duction function, Y,= F(Ke,Lt), here Lt= A1N1, epresents the aggregate labor sup-
ply measured in efficiency units. Exogenous technological progress occurs at the
rate g-1, so that A,+1= gAt.Using lower-case letters to represent variables defined
per unit of effective labor input, we can write: yt = f(kt). We rely on the standard
assumption that the size of the capital stock in period t is determined by the sav-
ings and investment choices made at t-1, so that K+1=K +I,.13Under perfect capital mobility-here understood to mean that domestic resi-
dents can borrow and lend in the international capital market at a given interest
rate-the marginal product of domestic capitalmust satisfy the arbitrageequation:
f'(k*) = r*, where r* is the world interest rate (assumed constant). This condition
fixes domestic capital intensity and, given the working-age population, the aggre-
gate capital stock. In contrast, if the economy is closed to capital flows, domestic
savings supply and investment demand must be equal, with the marginal product
of capital equated to the marginal rate of substitution in consumption between
the two periods of adult life.For an open economy, a steady-state increase in population growth reduces
the saving rate for (n*g- I)> 1, where ? represents the elasticity of savings as
a share of the representative adult's labor income with respect to the fertility rate.
This result confirmsthe principalinsight of the variable rate-of-growth effect model:
lower youth dependency may increase the saving rate, but only for a rapidlygrow-
ing economy. In contrast,a steady-stateincrease in population growth always raises

8/9/2019 Age Structure Dynamics
http://slidepdf.com/reader/full/age-structure-dynamics 28/34
MATTHEW HIGGINS / JEFFREY G. WILLIAMSON 287
the steady-state investment rate, with i'(n*) = g k*lf(k*). It can be shown that this
investment-promoting effect dominates even if saving rises, at least in our model,
so an increase in fertility always lowers the steady-state CAB (Higgins and
Williamson 1996).For the closed economy, savings supply and investment demand must be
equal. Using this equilibrium condition, we can show that higher fertility bringsan increase in the saving rate when:
n*g + (n*g- 1)XLEkn > 0 (3)
where XL is labor's income share and ekn is the elasticity of steady-state capital
intensity with respect to population growth. This elasticity is negative for 1/0 2 1
(that is, as long as higher interest rates do not lower savings), so that higher fertil-ity lowers the steady-state saving rate. The model thus allows for the possibility
that the saving (and investment) rate may fall with an increase in fertility, thus
generalizing the basicinsight of the variablerate-of-growth effect model to a closed-
economy setting.
Econometric issues and data sources
The estimating equations are thus of the form:
sit = P + PS +p2Z.t+ p3GROWTH.t+4Z,tGROWTH.tP5RPIt +u (4)
where si, is the national savings or investment rate in country i at year t, Z, refers
to a vector of demographic variables, GROWTH, is the growth rate of national in-
come, RPI,t represents the relative price of investment goods, and ui, is a random
disturbance term.
Z,. is constructed by using a quadratic polynomial to represent 15 popula-tion age shares: 0-4, 5-9,...,65-69, and 70+. This technique for incorporating
demographic information into macroeconomic equations was introduced by Fairand Dominguez (1991). The technique has the advantage of capturing the infor-
mation contained in the entire age distribution while maintaining a parsimonious
parameterization (see Higgins and Williamson 1996: Appendix, for additional de-
tails). In particular, it allows us to derive implicit estimates for all 15 age shares
while estimating only two underlying parameters.14
The estimated models are of the "fixed-effects"variety: the intercept term is
allowed to vary across countries, but the slope coefficients are treated as common
to all countries. A lagged dependent variable (LDV) specification was chosen in
order to control for temporal persistence in national savings or investment rates.The models are estimated using instrumental variables techniques to control
for the fact that some of our explanatory variables, particularly income growthand the relative price of investment goods, should themselves be endogenous. Two-
stage least squares (2SLS) is used to construct initial estimates for national sav-
ings, investment, and the current balance. The 2SLS estimates provide the basis
for various specification tests, reported fully in Higgins and Williamson (1996)."

8/9/2019 Age Structure Dynamics
http://slidepdf.com/reader/full/age-structure-dynamics 29/34
288 AGE STRUCTURE DYNAMICS IN ASIA
We then rely on 3SLSto construct our benchmark estimates, treating the savings
and investment equations as elements of a simultaneous system.'6This procedure
implicitly yields estimates of demographic effects on capital flows via the identity:
National Savings = Investment + CurrentAccount Balance. The statistical signifi-
cance of these demographic effects can be tested by imposing the restriction that
the coefficients of Zi and Z2 are equal for the savings and investment equations.
The national savings, investment, and current account shares are based on
national accounts data taken from International Financial Statistics (International
Monetary Fund 1995). The relative price of investment goods (RPI)and the growth
rate of aggregate GDP (GROWTH) are derived from the Penn World Tables, Mark 5.6
(Heston and Summers 1995). Demographic data are from the United Nations
(1992). Taiwan represents the sole exception to the above, with national accounts
and demographic data derived from the Statistical Yearbookof the Republic of China
(Republic of China, various years). Annual population age shares are derived from
quadrennial data via linear interpolation. As for variables used as instruments,
real output per worker and per capita are measured at purchasing power parity
from the Penn World Tables. The Penn World Tables is also the source of data on
labor force growth and the purchasing power parity for GDP. Exportsplus imports
as a share of GDP is based on national accounts data.
The current account balance (CAB) is measured as the sum of the trade bal-
ance and net factor income. National savings is measured by adding gross invest-
ment to this total. Our measures of both national savings and current account
balance exclude private and official transfers and, thus, are not strictly correct.
However, these definitions were chosen because data concerning transfers come
from balance-of-payments sources generally unavailable before 1970. The differ-
ence in measured savings or current account shares is almost always quite small,
and appears not to affect our results.
Calculation of demographic effects
The demographic effect on the saving rate for country i at time t is calculated as:
DemographicEffect, l (zl,,t- Zli) + 1- (Vi,t- Z2d) (5)
where PZ3 nd PZ2 are the estimated coefficients for Zi and Z2, ZTI nd Z27are the
country i averages for these variables, and IJDvis he estimated coefficient of the
lagged dependent variable. To capture the long-run effect of changes in the demo-
graphic variables, 1 -PLDVappears in the denominator.
Similarly, the effect of changes in country i's age structure on its saving rate
between, say, 1990 and 2025 is calculated as:
ANSAVE, = -Pz1 P(Z (i,2025-Zl ,1990)+ '2- (Z2i2025-z2 1990) (6)1hOPLDV 1PD
Because these calculations refer to the long-run or total effects, they may
slightly overstate the effects of changes in the demographic variables be-
tween any two given years.

8/9/2019 Age Structure Dynamics
http://slidepdf.com/reader/full/age-structure-dynamics 30/34
MATTHEW HIGGINS / JEFFREY G. WILLIAMSON 289
Notes
The authors acknowledge the researchassis-
tance of Ben Dennis and Suny Lay and help-ful comments by David Bloom, Allen Kelley,
Peter Lindert, Andrew Mason, Jonathan
Morduch, Alan Taylor, Peter Timmer, andparticipants at the Conference on East andSoutheast Asian Economic Change in theLong Run, Honolulu, Hawaii (11 April
1996), where an earlier version of this pa-per was presented. The views expressed inthis article are those of the authors and do
not necessarily reflect those of the FederalReserve Bank of New York or the FederalReserve System.
1 The term dependency should be inter-preted in this artide as "reliance."We do notintend to imply that reliance on foreigncapi-tal as a source of investment funds need have
negative welfare consequences.Indeed, in thesimpletheoreticalmodel outlined below, equi-
libriumnet capitalflows are welfare-improv-ing for both
borrowing and lending nations.2 We define the youth dependency rate
as the share of the population aged 14 years
and younger within the total population.Some other work defines the youth depen-
dency rate as the share 14 and younger di-
vided by the share 15 and older.
3 We refer to 18 OECD members, ex-
cluding Australiaand Japan:Mitchell (1978,
1983, 1992).
4 Fogel (1991) shows that these largemid-century New World dependency rateswere driven by labor supply responses in la-
bor-scarce areas of recent settlement-early
marriage, many births within marriage,and
high infant survival in an environment of
good-quality nutrition. In contrast,the Asian
experience in this century was driven by ex-
ogenous declines in mortality, especially in-
fant and early childhood mortality, associ-
ated with the diffusion of modern healthtechnologies from center to periphery. Yet
the result was the same: high youth depen-
dency rates.
5 Tobin (1967) also describes a second
model that allows for dependency effects on
savings.As observed by Mason (1988), how-
ever, this model assumes a fixed population
growth rate, and thus does not allow one to
determine whether the (negative) depen-dency or (positive) rate-of-growth effect on
savings is the stronger.
6 Continuing skepticism is illustrated by
Hammer (1986) and Kelley (1988). But see
also the recent supporting evidence reported
in Mason (1988); Masson (1990); Webb and
Zia (1990); Williamson (1993); Kang (1994);
Taylor (1995); Kelley and Schmidt (1995,
1996); Higgins and Williamson (1996);
Higgins (1997); and Lee, Mason, and Miller(1997).
7 The variable rate-of-growth effect
model assumes steady-state population and
productivity growth (Mason 1987). Rather
inconsistently, the youth dependency rate is
allowed to vary, although it is simply an in-
creasing function of the steady-state popu-
lation growth. We show below that the
model's qualitative implications remain un-
changed when the correspondence betweenpopulation growth and youth dependency is
acknowledged.
8 Initial specifications ncluded the prod-
ucts of the age-distribution variables and na-
tional income growth (that is, GROWTH,-z,).However, these interactive terms proved to
be statistically insignificant at the 10 percent
level for the saving, investment, and CAB
equations. Although the variable rate-of-
growth effect model plausibly implies that in-teractive terms should be important, the
finding that they are not such in late-twen-
tieth-century Asia supports similar evidence
from other times and places (Taylor and
Wiliamson 1994; Taylor 1995; Higgins 1997).
9 These basic results appear insensitive
to plausible modifications in the empirical
specification.Forexample, the estimated de-
mographic effects are qualitatively similar
and remain statistically significant if we relyon an AR(1) specificationto deal with the is-
sue of temporal persistence. Adding a time
trendor year-specificdummy variablesto the
model alsohas little effect on the scale or mag-
nitude of the estimated demographiceffects.
10 Savings supply and investment de-
mand are separately identified in the empiri-

8/9/2019 Age Structure Dynamics
http://slidepdf.com/reader/full/age-structure-dynamics 31/34
290 AGE STRUCTURE DYNAMICS IN ASIA
cal models developed here only to the ex-
tent thatcountriescan borrowand lend on the
internationalcapitalmarketwithout constraint
and at a given world interest rate. In the ab-
sence of perfectcapitalmobility,the estimatesfor savings will reflect a mix of the separate
demographicinfluences on both savings and
investment-a lesson made clear by the
Higgins-Williamson 1996) simulationmodel.
In this setting, an increase in the share of
young adults, who presumably save little,
might lead to an increase in the equilibrium
quantityof savingsby causingan outwardshift
in the investmentdemandschedule.Similarly,
an increase in the share of the middle-agedmight actually reduce savings if any outward
shift in savings supply is more than offset by
an inwardshift in investment demand.
11 Caution is warranted regarding the
CAB coefficents correspondingto elderly de-
pendency. Because there has been relatively
littlevariationin our Asiansamplein the eld-
erly dependency share, these coefficients are
likely to be less precisely estimated than
those corresponding to the youth or prime-age shares.
12 We omitJapanfromthe fast-transition
groupin order to focus the counterfactualex-
ercise on countries that attained their peak
youth dependency ratesin the early 1960s or
later. Thus, the group includes China, Hong
Kong,Korea, Singapore,and Taiwan.
13 For simplicity, we abstract from de-
preciation. The more general expression
would be:f'(k*) = r*+ 8. Introducing depre-ciation, as is done in the simulation experi-
ment reported in Higgins and Williamson
(1996), does not affect the model's qualita-
tive implications.
14 This representation of demographic
effects imposes some structure on the data,
requiring the relationship between savings
(or investment) and the population age
shares to vary smoothly and to exhibit a
single global maximum or minimum. We areunable to reject these restrictionsat even the
25 percent level when testing the polyno-
mial specification against one in which the
age shares are allowed to enter in an unre-
strictedmanner. Simple Chow tests, applied
to each equation separately, indicate that a
third or higher-order polynomial is not re-quired to capture the relationship between
accumulation and age structure.
15 We conduct specification tests to ad-
dress the following issues. Serialcorrelation:
Durbin's h-test for serial correlation in an
LDVspecificationis applied to each equation
separately.The presence of serial correlation
is rejected at the 5 percent level for each
equation. Overidentifyingestrictions: ansen's
J-test is applied to each equation separately,using 2SLS.For each equation, we fail to re-
ject at the 10 percent level the null hypoth-
esis that the six overidentifying restrictions
are valid (see Davidson and MacKinnon
1993: 232-237). Consistencyof OLS:The
Durbin-Wu-Hausman test is applied to each
equation separately, using 2SLS. The null
hypothesis that OLSis consistent is rejected
at the one percent level for the investment
equation and CAB equations, and narrowlyescapes rejection at the 10 percent level for
the savings equation(see Davidson and
MacKinnon 1993: 237-242). Fixed-effectss.
random-effectsnd common-interceptpecifica-
tions:Hausman's test for the consistency of
the random-effects estimator is applied to
each equation separately.We reject the con-
sistency of the random-effects specification
at the one percent level for the savings and
investment equations (see Greene 1993:
479-480). Simple Chow tests reject the null
alternative of a common intercept for all
countries at the one percent level for both
equations.
16 Because the initial 2SLS estimates
produced nearly identical coefficients for the
lagged dependent variable, this term was
constrained to be equal in generating the
3SLSestimates. Relaxing this constraint has
no appreciable effect on the coefficient esti-
mates for the other variables.

8/9/2019 Age Structure Dynamics
http://slidepdf.com/reader/full/age-structure-dynamics 32/34
MATTHEW HIGGINS / JEPPREY G. WILLIAMSON 291
References
Auerbach, Alan and Laurence Kotlikoff. 1992. "The impact of the demographic transition
on capital formation," Scandinavian Journal of Economics 94, no. 2: 281-295.
Barro, Robert. 1992. "World interest rates and investment," Scandinavian Journal of Econom-
ics 94, no. 2: 323-342.
Barro, R. and J. Lee. 1994. Data Set for a Panel of 138 Countries. Available on diskette from R.
Barro, HarvardUniversity, or via FTPfrom the NBER.
Blanchard, Oliver and Stanley Fischer. 1988. Lectures n Macroeconomics. ambridge, MA:
MITPress.
Borsch-Supan, Axel. 1996. 'The impact of population ageing on savings, investment and
growth in the OECD area," in Future Global Capital Shortages: Real Threat or Pure Fiction?
Paris: OECD.
Cass, David. 1965. 'Optimum growth in an aggregative model of capital accumulation,"
Review of Economic Studies 32: 233-240.Coale, Ansley J. and Edgar M. Hoover. 1958. Population Growth and EconomicDevelopment in
Low-IncomeCountries. rinceton: Princeton University Press.
Collins, Susan. 1991. 'Saving behavior in ten developing countries," in Douglas Bernheim
and John Shoven (eds.), National Saving and Economic Performance, pp. 349-373. Chi-
cago: University of Chicago Press.
Cutler, David, James Poterba, Louise Scheiner, and Lawrence Summers. 1990. 'An aging
population: Opportunity or challenge?" Brookings Papers on EconomicActivity, No. 1.
Davidson, Russell and James MacKinnon. 1993. Estimation and Inference in Econometrics.New
York: Oxford University Press.
Deaton, Angus and Christina Paxson. 1995. 'Saving, inequality and aging: An East Asiaperspective," Asia-Pacific Economic Review 1, no. 1: 7-19.
Edelstein, Michael. 1982. OverseasInvestment in theAge of High Imperialism. London: Muthuen.
Fair, Ray and Kathryn Dominguez. 1991. "Effectsof the changing U.S. age distribution on
macroeconomic equations," American Economic Review 81, no. 5: 1276-1294.
Feldstein, Martin and C. Horioka. 1980. 'Domestic saving and international capital flows,
EconomicJournal 90 (June): 314-329.
Feldstein, Martin and P. Bacchetta. 1991. 'National saving and international investment,"
in Douglas Bernheim and John Shoven (eds.), National Saving and EconomicPerformance,
pp. 201-224. Chicago:University of Chicago Press.
Fogel, Robert. 1991. 'The conquest of high mortality and hunger in Europe and America:
Timingand mechanism,"in PatriceHigonnet,DavidLandes,and Henry Rosovsky (eds.),
Favorites f Fortune,pp. 33-72. Cambridge,MA:HarvardUniversity Press.
Frankel, Jeffrey. 1991. 'Quantifying international capital mobility in the 1980's," in Dou-
glas Bernheim and John Shoven (eds.), National Saving and Economic Performance, pp.
227-265. Chicago: University of Chicago Press.
Fry, Maxwell and Andrew Mason. 1982. 'The variable rate-of-growth effect in the life-
cycle saving model: Children, capital inflows, interest and growth in a new specifica-
tion of the life-cycle model applied to seven Asian developing countries," Economic
Inquiry 20 (July): 426-442.
Goldberger,Arthur. 1973. 'Dependency rates and savings rates:Further comment," Ameri-
can Economic Review 63, no. 1: 232-233.Greene, William. 1993. Econometric Analysis. New York: Macmillan.
Hammer, Jeffrey. 1986. 'Population growth and savings in LDCs:A survey," WorldDevelop-
ment 14, no. 5: 579-591.
Haveman, Robert and BarbaraWolfe. 1995. 'The determinants of children's attainments: A
review of methods and findings," Journal of Economic Literature 33, no. 4: 1829-1878.

8/9/2019 Age Structure Dynamics
http://slidepdf.com/reader/full/age-structure-dynamics 33/34
292 AGE STRUCTURE DYNAMICS IN ASIA
Heston, Alan and Robert Summers. 1995. Penn WorldTables Mark5.6), on diskette. Avail-
able from the National Bureau of Economic Research, Cambridge,MA.
Higgins, Matthew. 1994. "Thedemographic determinants of savings, investment and inter-
national capital flows," Ph.D. dissertation, HarvardUniversity.
. 1997. 'Demography, national savings and international capital flows," InternationalEconomic Review, forthcoming.
Higgins, Matthew and Jeffrey G. Williamson. 1996. "Asian demography and foreign capital
dependence," NBERWorking aperNo. 5560, National Bureau of Economic Research,
Cambridge,MA.
Hsiao, Cheng. 1986. Analysisof Panel Data.Cambridge:Cambridge University Press.
InternationalMonetary Fund. 1995. International inancialStatistics, n magnetic tape. Wash-
ington, D.C.: International Monetary Fund.
Judson, Ruth and Anne Owen. 1997. 'Estimating dynamic panel data models: A practical
guide for macroeconomists," Finance and Economics Discussion Series, Federal Reserve
Board, Washington, D.C.Kang, Kenneth. 1994. 'Why did Koreans save so little and why do they now save so much?"
International Economic Journal 8, no. 4: 99-111.
Kelley, Allen C. 1988. 'Economic consequences of population change in the third world,"
Journal of EconomicLiterature 26, no. 4: 1685-1728.
Kelley, Allen C. and RobertM. Schmidt. 1995. 'Aggregate population and economic growth
correlations: The role of the components of demographic change," Demography32:
543-555.
. 1996. 'Saving, dependency and development," Journal of Population Economics 9:
365-386.
Lee, Ronald, Andrew Mason, and Tim Miller. 1997. 'Saving, population and economic
growth in East Asia," paper presented at the Conference on Population and the East
Asian Economic Miracle, East-West Center, Honolulu (7-10 January).
Leff, Nathaniel. 1969. 'Dependency rates and savings rates,"AmericanEconomicReview59,
no. 5: 886-896.
Mason, Andrew. 1987. 'National saving rates and population growth: A new model and
new evidence," in D. Gale Johnson and Ronald D. Lee (eds.), PopulationGrowthand
Economic Development: Issues and Evidence, pp. 523-560. Madison: University of Wis-
consin Press.
. 1988. 'Saving, economic growth, and demographic change," Populationand Devel-
opment Review 14, no. 1: 113-144.
Masson, Paul. 1990. 'Long-term macroeconomic effects of aging populations," FinanceandDevelopment 27: 6-9.
Mitchell, B. R. 1978. European Historical Statistics, 1750-1975. New York: Facts on File.
1983. International Historical Statistics:The Americas and Australasia. Detroit: Gale Re-
search.
. 1992. International Historical Statistics:Europe 1750-1988, 3rd ed. New York: Stockton
Press.
Obstfeld, Maurice. 1986. 'Capital mobility in the world economy: Theory and measure-
ment," Carnegie-RochesterConferenceSeries on Public Policy 24: 55-104.
Phelps, E. S. 1968. 'Population increase,"Canadian ournalofEconomics , no. 3: 497-518.
Ram, Rati. 1982. 'Dependency rates and aggregate savings: A new international cross-sec-tion study," American EconomicReview 72, no. 3: 537-544.
Republic of China. Statistical Yearbookof the Republic of China, various issues. Taipei: Republic
of China.
Sachs, J. and A. Warner. 1995. 'Economic reform and the process of global integration,"
Brookings Papers on EconomicActivity, No. 1.
Solow, Robert. 1956. 'A contribution to the theory of economic growth," Quarterly ournal
of Economics 70, no. 1: 65-94.

8/9/2019 Age Structure Dynamics
http://slidepdf.com/reader/full/age-structure-dynamics 34/34
MATTHEW HIGGINS / JEFFREY G. WILLIAMSON 293
Taylor, Alan. 1995. "Debt, dependence and the demographic transition: Latin America in
to the next century," WorldDevelopment3, no. 5: 869-879.
Taylor, Alan and Jeffrey G. Williamson. 1994. "Capital lows to the New World as an inter-
generational transfer," Journal of Political Economy 102, no. 2: 348-369.
Tobin, James. 1967. 'Life-cycle savings and balanced economic growth," in William Fellner(ed.), Ten Essays in the Tradition of Irving Fischer. New York: Wiley Press.
United Nations. 1992. The Sex and Age Distribution of the World Populations: The 1992 Revision.
New York.
Urga, Giovanni. 1992. "The econometrics of panel data: A selective introduction," Oxford
University Institute of Economics and Statisticsdiscussion paper.
Webb, Steven and Heidi Zia. 1990. 'Lower birth rates = higher saving in LDCs,"Financeand
Development 27: 12-14.
Williamson, Jeffrey G. 1979. 'Why do Koreans save 'so little'?"Journalof Development co-
nomics6, no. 3: 343-362.
.1993. 'Human capital deepening, inequality, and demographic events along theAsia Pacific Rim," in Gavin Jones, Naohiro Ogawa, and Jeffrey G. Williamson (eds.),
Human Resourcesand Development Along the Asia-Pacific Rim, pp. 129-158. Oxford: Ox-
ford University Press.
- 1996. 'Globalization, convergence, and history," JournalofEconomicHistory56, no.
2: 277-306.