age at introduction of solid foods and feeding ... · age at introduction of solid foods and...
TRANSCRIPT

Age at introduction of solid foods and feeding difficulties in childhood: findings from the
Southampton Women’s Survey
Hollis JL1,2, Crozier SR1, Inskip HM1,2, Cooper C1,2, Godfrey KM1,2, Robinson SM1,2 and the Southampton Women’s Survey Study Group.
1 MRC Lifecourse Epidemiology Unit, University of Southampton, UK 2 NIHR Nutrition Biomedical Research Centre, University of Southampton & University Hospital Southampton NHS Foundation Trust, Southampton, UK
Note: for non-commercial purposes only

Recommended age to introduce solid foods has changed over time
UK Infant feeding guidelines (2003) introduce solids at 6 months
Prior to 2003 introduced solids 4-6 months
Kramer & Kakuma systematic review for WHO
Concerns expressed on appropriateness
Critical windows children receptive to new flavours and textures
Delayed introduction aversions feeding difficulties?
Introduction

To determine whether age at introduction of solid foods is associated with
feeding difficulties in children at 3 years of age.
Aim

Methods
3158 births Children followed-up at 6, 12, 24 & 36 months. Samples seen
at 4, 6-7, 8-9 & 11-13 yrs.
12, 583 non-pregnant Southampton women aged 20-34 years interviewed between 1998 and 2002.
Subsequent pregnancies studied, ultrasound scans and interviews.
Adapted from Inskip et al. Int J Epidemiol. 2006

Methods
ALSPAC (1992) Avon Longitudinal Study of Parents and Children Questionnaires: child-based questionnaires. http://www.bristol.ac.uk/alspac/researchers/questionnaires/

Statistical analysis:
Exposure: age at introduction of solids <4 months, ≥4 & <6 months (reference group), ≥6 months
Outcome: 6 feeding difficulty questions (assessed separately) Binary outcome presence or absence of feeding difficulty
Poisson Regression model to estimate prevalence rate ratios Confounders:
Maternal: parity, pre-pregnancy maternal BMI, maternal age, maternal education, maternal employment, parenting difficulties, maternal diet quality
Child: age last breastfed, child sex, gestation
Methods

N = 2389 mother-child pairs
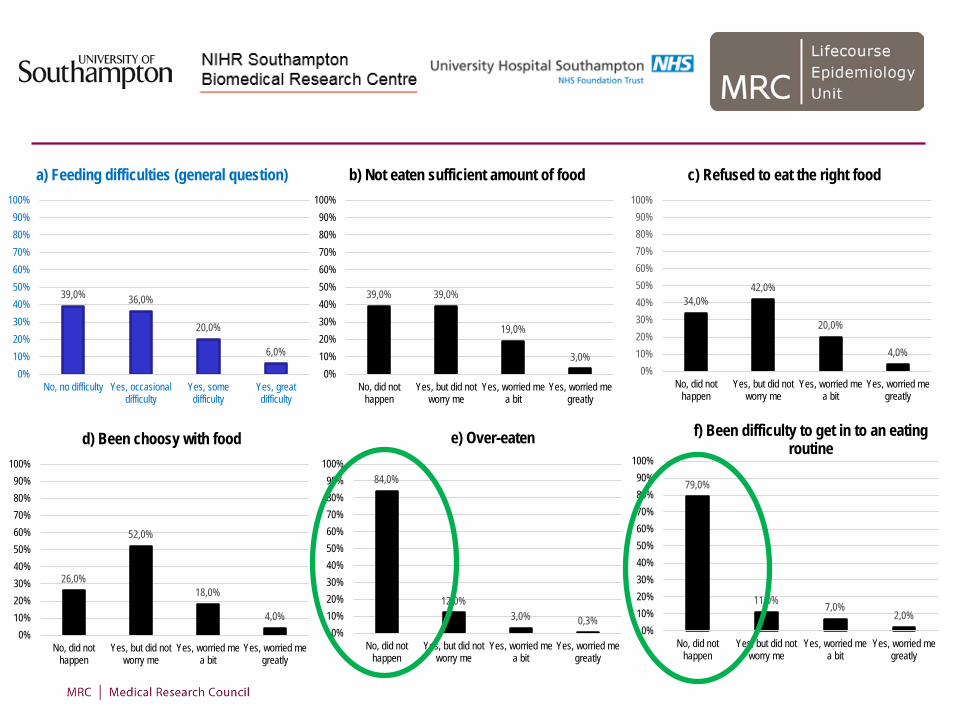
Results
0
200
400
600
800
Freq
uenc
y
0 10 20 30 40Age first solids (weeks)
Age at introduction of solid foods
< 4 months ≥4 & < 6 months ≥ 6 months
642 (27%) 1637 (69%) 110 (5%)

39,0% 36,0%
20,0%
6,0%
0%10%20%30%40%50%60%70%80%90%
100%
No, no difficulty Yes, occasionaldifficulty
Yes, somedifficulty
Yes, greatdifficulty
a) Feeding difficulties (general question)
39,0% 39,0%
19,0%
3,0% 0%
10%20%30%40%50%60%70%80%90%
100%
No, did nothappen
Yes, but did notworry me
Yes, worried mea bit
Yes, worried megreatly
b) Not eaten sufficient amount of food
34,0% 42,0%
20,0%
4,0% 0%
10%20%30%40%50%60%70%80%90%
100%
No, did nothappen
Yes, but did notworry me
Yes, worried mea bit
Yes, worried megreatly
c) Refused to eat the right food
26,0%
52,0%
18,0%
4,0% 0%
10%20%30%40%50%60%70%80%90%
100%
No, did nothappen
Yes, but did notworry me
Yes, worried mea bit
Yes, worried megreatly
d) Been choosy with food
84,0%
12,0% 3,0% 0,3%
0%10%20%30%40%50%60%70%80%90%
100%
No, did nothappen
Yes, but did notworry me
Yes, worried mea bit
Yes, worried megreatly
e) Over-eaten
79,0%
11,0% 7,0% 2,0%
0%10%20%30%40%50%60%70%80%90%
100%
No, did nothappen
Yes, but did notworry me
Yes, worried mea bit
Yes, worried megreatly
f) Been difficulty to get in to an eating routine

Age at introduction of solid foods Adjusted RR* 95% CI P-value Feeding difficulties <4 months 0.96 0.89, 1.04 0.36 ≥4 & <6 months 1.00 - - ≥6 months 0.73 0.59, 0.91 0.004

Age at introduction of solid foods Adjusted RR* 95% CI P-value Feeding difficulties <4 months 0.96 0.89, 1.04 0.36 ≥4 & <6 months 1.00 - - ≥6 months 0.73 0.59, 0.91 0.004 Not eaten sufficient amount of food <4 months 1.01 0.94, 1.10 0.72 ≥4 & <6 months 1.00 - - ≥6 months 0.90 0.75, 1.08 0.27 Refused to eat the right food <4 months 0.98 0.91, 1.05 0.61 ≥4 & <6 months 1.00 - - ≥6 months 0.96 0.83, 1.11 0.57 Been choosy with food <4 months 1.00 0.95, 1.06 0.90 ≥4 & <6 months 1.00 - - ≥6 months 0.91 0.80, 1.04 0.17 Over-eaten <4 months 1.13 0.91, 1.39 0.27 ≥4 & <6 months 1.00 - - ≥6 months 1.19 0.75, 1.87 0.46 Been difficult to get into an eating routine <4 months 1.12 0.94, 1.35 0.21 ≥4 & <6 months 1.00 - - ≥6 months 1.00 0.66, 1.52 0.99

Few associations found in SWS
No evidence that introducing solids ≥ 6 months is association with feeding difficulties
Small proportion (5%, n=110) of children introduced to solids ≥ 6 months
Observational study causal pathway
Other eating behaviour questionnaire E.g. Child Eating Behaviour Questionnaire
First analysis at 3y persistent at older ages in SWS?
Discussion

Continued debate over the evidence behind the revisions of the UK infant feeding recommendations in 2003
Few associations between feeding difficulties and age at introduction of solid foods
General feeding difficulties less common among infants introduced to solid foods ≥6 months of age
Conclusion

Acknowledgements and Questions Women of Southampton and their children and research nurses and staff
JLH supported by:
Endeavour Research Fellowship (Australian Govt. Department of Education & Training)
NIHR Southampton Biomedical Research Centre
SWS grant funding: UK Medical Research Council, British Heart Foundation, UK Foods Standards Agency, the Dunhill Medical Trust, NIHR Southampton Biomedical Research Centre, European Union’s Seventh Framework Programme, Projects EarlyNutrition and ODIN.
Hollis et al. Age at Introduction of solid foods and feeding difficulties in childhood: findings from the Southampton Women’s Survey. British Journal of Nutrition, 2016; 116: 743-750.

Age at introduction of solid food <4 months
(n = 642) ≥ 4 & < 6 months
(n = 1637) ≥ 6 months
(n = 110) P-value
Mother Education (≥A-levels) (n, %) 349 54% 1038 64% 65 60% <0.001 Primiparous (n, %) 277 43% 886 54% 68 62% <0.001 Smoked in pregnancy (n, %) 124 20% 205 13% 5 5% <0.001 Age at child’s birth (years) (mean, SD) 29.7 3.8 31.0 3.7 32.8 3.8 <0.001 Pre-pregnancy BMI (kg/m2) (median, IQR)
24.8 22.4-28.0
24.0 21.8-27.2
23.8 21.3-25.8 0.006
Child Birthweight (g) (mean, SD) 3587 503 3483 455 3382 445 <0.001 Male (n, %) 389 61% 791 48% 49 45% <0.001 Breastfed for ≥ 4 months (n, %) 187 30% 725 46% 56 54% <0.001 Overweight/obese, n (%) 103 17% 209 13% 10 10% 0.31 Meals per day at 3 years (median, IQR) 5 4-6 5 4-5 5 4-5.5 0.002 Prudent diet score at 3 years (mean, SD) -0.21 1.0 0.12 0.96 0.39 0.86 <0.001
Table 2. Characteristics of 2389 mother-child pairs according to age at introduction of solid foods in infancy.

DAG output - Confounding variables

In study
Characteristic No
(n = 554*)
Yes
(n = 2389) P-value
Mother Education (≥A-levels), n (%) 278 (51%) 1452 (61%) <0.001 Primiparous, n (%) 251 (45%) 1231 (52%) 0.009 Smoking in pregnancy, n (%) 112 (23%) 334 (14%) <0.001 Pre-pregnancy BMI, median (IQR) 24.1 (22.0-27.3) 24.2 (21.9-27.4) 0.87 Age at child’s birth, years, mean (SD) 30.3 (4.0) 30.8 (3.8) 0.006 Child Birthweight, g, mean (SD) 3486 (487) 3506 (471) 0.35 Males, n (%) 265 (48%) 1160 (49%) 0.85 Breastfed for ≥ 4 months, n (%) 120 (32%) 968 (42%) <0.0001 Child at 3 years Height, cm, mean (SD) 95.2 (3.7) 95.8 (3.5) 0.16 Weight, kg, median (IQR) 14.8 (13.6-15.9) 14.9 (13.8-16.1) 0.70 Overweight/obese, n (%) 10 (14%) 322 (14%) 0.97 Meals per day, median (IQR) 5.0 (4.0-5.0) 5.0 (4.0-6.0) 0.61
Table 1. Characteristics of mothers and children in study compared with term live singleton births not in study.