age and growth of loggerhead sea turtles in southern brazil · instituto de matemática,...
TRANSCRIPT
MARINE ECOLOGY PROGRESS SERIESMar Ecol Prog Ser
Vol. 456: 255–268, 2012doi: 10.3354/meps09681
Published June 7
INTRODUCTION
Age structure is one of the parameters that influ-ences the dynamics of a given population. Further-more, age-related data are essential for calculatingnatural growth rates and age at sexual maturity,which are needed to develop conservation manage-ment plans for endangered sea turtle species (Bjorn-dal & Bolten 1988, Zug et al. 2002). However, these
data are challenging to collect owing to the complexpattern of migration exhibited by sea turtles through-out their life cycle (Musick & Limpus 1996), andtherefore, many questions relating to this matter stillremain.
The loggerhead sea turtle Caretta caretta is one ofthe 7 species of sea turtles and is widely distributedthrough the oceans. Throughout its range, the log-gerhead faces a number of threats to its survival and
© Inter-Research 2012 · www.int-res.com*Corresponding author. Email: [email protected]
Age and growth of loggerhead sea turtles in southern Brazil
Roberta Petitet1,2,4,*, Eduardo R. Secchi3, Larisa Avens5, Paul G. Kinas2
1Programa de Pós-graduação em Oceanografia Biológica, Instituto de Oceanografia, 2Laboratório de Estatística Ambiental,Instituto de Matemática, Estatística e Física (IMEF), and 3Laboratório de Tartarugas e Mamíferos Marinhos, Instituto de
Oceanografia; Universidade Federal do Rio Grande (FURG), Avenida Itália km 8, CEP 96201-900, Rio Grande, Rio Grande doSul, Brazil
4Centro de Recuperação de Animais Marinhos - CRAM-FURG, Rua Capitão Heitor Perdigão, no. 10, CEP 96200-580, Centro, Rio Grande, Rio Grande do Sul, Brazil
5NOAA Fisheries, Southeast Fisheries Science Center, Center for Coastal Fisheries and Habitat Research, 101 Pivers Island Road, Beaufort, North Carolina 28516, USA
ABSTRACT: The juvenile and subadult stages of loggerhead sea turtles Caretta caretta are poorlystudied in Brazil. We present age estimates and a growth model for loggerhead sea turtles in theSouth Atlantic Ocean obtained through skeletochronological analysis of humeri from both neriticand oceanic stage individuals. The age estimation was based on the number of growth marks inthe humerus; however, for larger turtles early growth marks were resorbed and therefore it wasnecessary to use a correction factor to account for the lost growth marks. The estimated ages indi-cate that the oceanic stage lasts 8 to 19 yr (average: 11.5 yr). Schnute’s growth model was fit toage-at-length data, as its shape is versatile and it does not require data from all life stages (i.e.hatchlings through adults near asymptotic size). However, because the shape of Schnute’s curvewas almost linear for the age window comprising our data, a linear regression ultimately provideda better fit to the data, yielding an age at maturation estimate of 32 yr. Somatic growth rates werecalculated through incorporation of the Body Proportional Hypothesis into conversion of growthmark measurements to estimates of carapace length. Growth rates from neritic stage SouthAtlantic loggerheads were similar to those reported for neritic loggerhead sea turtles from theNorth Atlantic Ocean, but were lower than those of oceanic loggerheads from the South AtlanticOcean. This finding suggests that local environmental conditions influence loggerhead sea tur-tles’ growth rates as well as the energy expenditure during migrations, energy allocation andgenetic origin.
KEY WORDS: Age ·Growth ·Skeletochronology ·Bayesian inference ·Schnute’s curve ·Caretta caretta
Resale or republication not permitted without written consent of the publisher
Mar Ecol Prog Ser 456: 255–268, 2012
is therefore classified as ‘endangered’ in the IUCNRed List of Endangered Species of Fauna and Floraproposed by the International Union for Conserva-tion of Nature and Natural Resources (IUCN 2010).Like other species of sea turtles, loggerheads havecomplex life histories (Musick & Limpus 1996, Bolten2003). In general, as soon as they enter the sea, theyswim to oceanic zones in offshore waters where theyspend the first years of their life, which are termedthe ‘lost’ years, as it is a difficult phase of the turtle’slife cycle to research (Musick & Limpus 1996). There-after, when the curved carapace length (CCL)reaches approximately 46 to 64 cm, they recruit asjuveniles to foraging areas in the neritic zone (Bjorn-dal et al. 2000). Upon maturation, adults then startmigrating between foraging and breeding areas(Bolten 2003).
Demographic parameters such as mortality, re -cruitment, interhabitat dispersal, annual remigra-tion, and sex-, size- and age-specific growth ratescan be provided by mark−recapture data and usedto model a population (Chaloupka & Musick 1996).Although this method has been used with all seaturtle species throughout the world (Bjorndal et al.2000, Cha loupka & Limpus 2002, Reisser et al. 2008,Revelles et al. 2008, Casale et al. 2009), it requiresintensive long-term field work (Casale et al. 2007).Consequently, results became available only in thelong-term.
In contrast, skeletochronological studies have beenvalidated and applied to Caretta caretta (Zug et al.1986, Klinger & Musick 1992, Parham & Zug 1997,Snover & Hohn 2004, Casale et al. 2011a,b), allowingestimation of age from growth increments formed inthe humerus bone (Parham & Zug 1997). Thisapproach allows for understanding some age-basedparameters, similar to mark−recapture; however, theskeletochronological method has the potential toyield results more rapidly. Furthermore, if marks aredeposited annually and a proportional relationshipexists between bone and somatic growth (Klinger &Musick 1992, Snover & Hohn 2004), then it is possibleto obtain growth rates from each skeletal growthincrement. This, in turn, allows estimation of growthrates over multiple years and detection of ontoge-netic changes due to life stage intrinsic dynamics(Snover 2002).
Regardless of the means by which growth informa-tion is obtained, fitting a growth model to the agedata is essential to characterize the general growthpattern for a given population and to estimate theage of individuals based on their size. In the litera-ture, there are an extensive number of growth mod-
els to contemplate, such as Pütter, von Bertalanffy,Richards, Gompertz or logistic models. However,these growth models exhibit a limit or asymptote(Schnute 1981), which necessitates that samplinginclude all ages throughout the life cycle; otherwise itis not possible to adequately fit these growth modelsto the data. For sea turtles, the most commonly usedgrowth models are the von Bertallanffy, Gompertzand logistic models; however, for most of these stud-ies, it was necessary to estimate ages for post- hatchlings and early juveniles, and as well as foradults approaching asymptotic length, in order togenerate reasonable growth curves (Klinger &Musick 1995, Zug et al. 1995, 2002, Bjorndal et al.2000, Snover 2002, Goshe et al. 2010). Schnute (1981)developed a general growth model that encompassesmany specific models (like those cited above) as spe-cial cases, allowing the fit of a growth model even ifonly data from a limited age window of the completelife cycle is available.
Along the Brazilian coast, most studies of logger-head sea turtles focus on adult females on nestingbeaches, and the majority of nesting occurs in thestates of Bahia and Espírito Santo (Marcovaldi &Chaloupka 2007). Although information for imma-ture individuals during their oceanic and neriticstages is fragmentary, it is known that the southerncoast of Rio Grande do Sul state, southern Brazil, isan important foraging area for both stages of Carettacaretta (Martinez-Souza 2009, Barros 2010). Al -though the carcasses of loggerheads are frequentlywashed ashore (Monteiro et al. 2006), little is knownabout the species demography in this area, includingthe age and growth data essential for understandingpopulation dynamics of loggerheads in the SouthAtlantic Ocean. In this study, skeletochronologicaldata are used to describe growth patterns of logger-heads washed ashore or incidentally caught inpelagic longline fisheries off southern Brazil.
MATERIALS AND METHODS
Study area
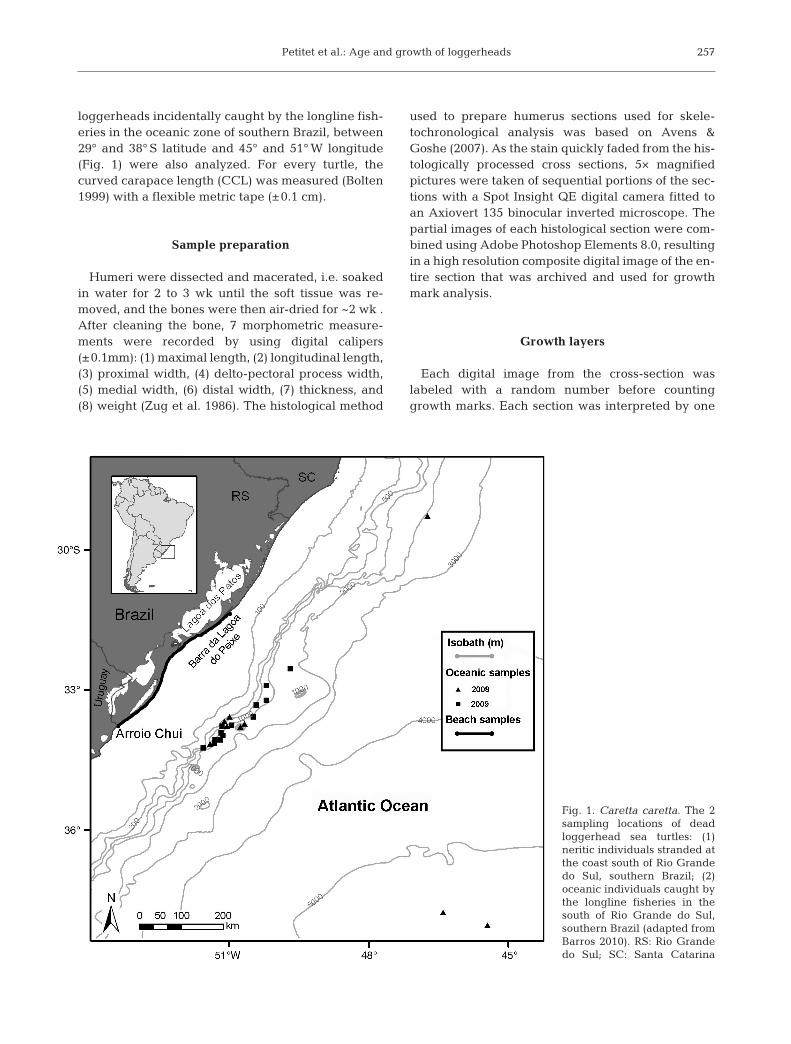
Sample collection took place on the south coast ofRio Grande do Sul, southern Brazil, between Lagoado Peixe (31° 20’ S, 51° 05’ W) and Arroio Chuí(33° 45’ S, 53° 22’ W), spanning 355 km of beach(Fig. 1). This stretch of beach was monitored once aweek, between November 2008 and December 2009,to collect humeri from sea turtles washed ashore forskeletochronological analysis. Humeri collected from
256
Petitet et al.: Age and growth of loggerheads
loggerheads incidentally caught by the longline fish-eries in the oceanic zone of southern Brazil, between29° and 38° S latitude and 45° and 51° W longitude(Fig. 1) were also analyzed. For every turtle, thecurved carapace length (CCL) was measured (Bolten1999) with a flexible metric tape (±0.1 cm).
Sample preparation
Humeri were dissected and macerated, i.e. soakedin water for 2 to 3 wk until the soft tissue was re -moved, and the bones were then air-dried for ~2 wk .After cleaning the bone, 7 morphometric measure-ments were recorded by using digital calipers(±0.1mm): (1) maximal length, (2) longitudinal length,(3) proximal width, (4) delto-pectoral process width,(5) medial width, (6) distal width, (7) thickness, and(8) weight (Zug et al. 1986). The histological method
used to prepare humerus sections used for skele-tochronological analysis was based on Avens &Goshe (2007). As the stain quickly faded from the his-tologically processed cross sections, 5× magnifiedpictures were taken of sequential portions of the sec-tions with a Spot Insight QE digital camera fitted toan Axiovert 135 binocular inverted microscope. Thepartial images of each histological section were com-bined using Adobe Photoshop Elements 8.0, resultingin a high resolution composite digital image of the en-tire section that was archived and used for growthmark analysis.
Growth layers
Each digital image from the cross-section waslabeled with a random number before countinggrowth marks. Each section was interpreted by one
257
Fig. 1. Caretta caretta. The 2sampling locations of deadloggerhead sea turtles: (1)neritic individuals stranded atthe coast south of Rio Grandedo Sul, southern Brazil; (2)oceanic individuals caught bythe longline fisheries in thesouth of Rio Grande do Sul,southern Brazil (adapted fromBarros 2010). RS: Rio Grandedo Sul; SC: Santa Catarina
Mar Ecol Prog Ser 456: 255–268, 2012258
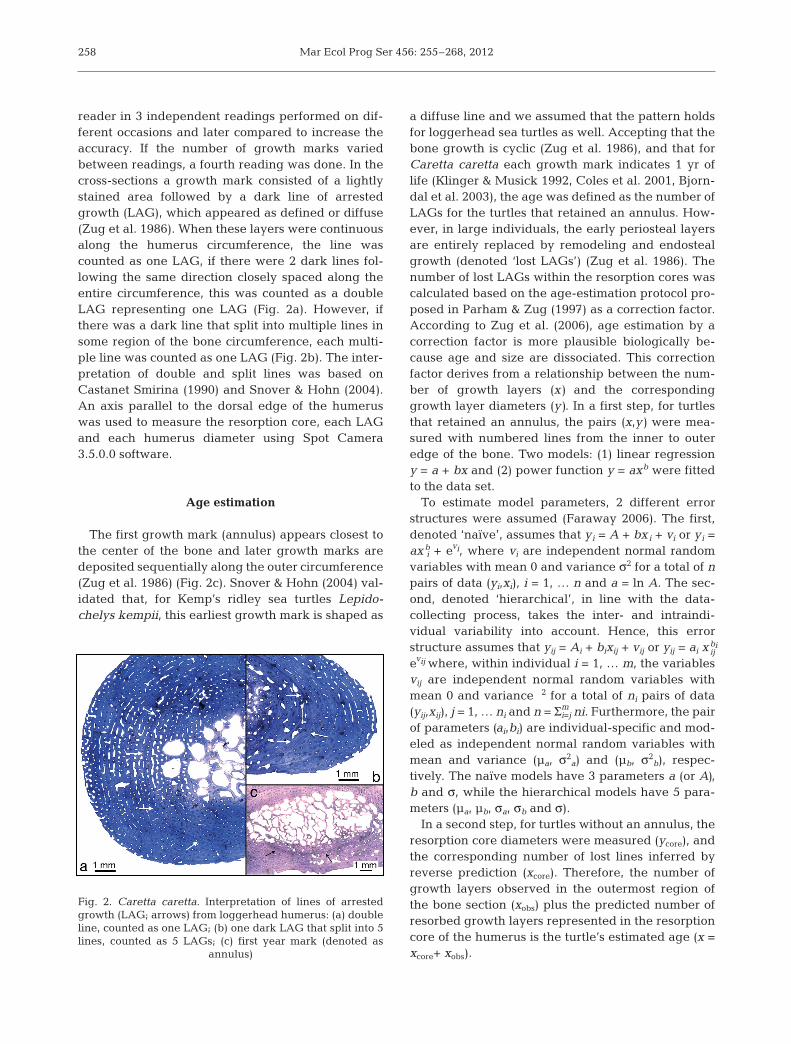
reader in 3 independent readings performed on dif-ferent occasions and later compared to increase theaccuracy. If the number of growth marks variedbetween readings, a fourth reading was done. In thecross-sections a growth mark consisted of a lightlystained area followed by a dark line of arrestedgrowth (LAG), which appeared as defined or diffuse(Zug et al. 1986). When these layers were continuousalong the humerus circumference, the line wascounted as one LAG, if there were 2 dark lines fol-lowing the same direction closely spaced along theentire circumference, this was counted as a doubleLAG representing one LAG (Fig. 2a). However, ifthere was a dark line that split into multiple lines insome region of the bone circumference, each multi-ple line was counted as one LAG (Fig. 2b). The inter-pretation of double and split lines was based on Castanet Smirina (1990) and Snover & Hohn (2004).An axis parallel to the dorsal edge of the humeruswas used to measure the resorption core, each LAGand each humerus diameter using Spot Camera3.5.0.0 software.
Age estimation
The first growth mark (annulus) appears closest tothe center of the bone and later growth marks aredeposited sequentially along the outer circumference(Zug et al. 1986) (Fig. 2c). Snover & Hohn (2004) val-idated that, for Kemp’s ridley sea turtles Lepido -chelys kempii, this earliest growth mark is shaped as
a diffuse line and we assumed that the pattern holdsfor loggerhead sea turtles as well. Accepting that thebone growth is cyclic (Zug et al. 1986), and that forCaretta caretta each growth mark indicates 1 yr oflife (Klinger & Musick 1992, Coles et al. 2001, Bjorn-dal et al. 2003), the age was defined as the number ofLAGs for the turtles that retained an annulus. How-ever, in large individuals, the early periosteal layersare entirely replaced by remodeling and endostealgrowth (denoted ‘lost LAGs’) (Zug et al. 1986). Thenumber of lost LAGs within the re sorption cores wascalculated based on the age- estimation protocol pro-posed in Parham & Zug (1997) as a correction factor.According to Zug et al. (2006), age estimation by acorrection factor is more plausible biologically be -cause age and size are dissociated. This correctionfactor derives from a relationship between the num-ber of growth layers (x) and the correspondinggrowth layer diameters (y). In a first step, for turtlesthat retained an annulus, the pairs (x,y) were mea-sured with numbered lines from the inner to outeredge of the bone. Two models: (1) linear regressiony = a + bx and (2) power function y = axb were fittedto the data set.
To estimate model parameters, 2 different errorstructures were assumed (Faraway 2006). The first,denoted ‘naïve’, assumes that yi = A + bxi + vi or yi =axb
i + evi, where vi are independent normal randomvariables with mean 0 and variance σ2 for a total of npairs of data (yi,xi), i = 1, … n and a = ln A. The sec-ond, denoted ‘hierarchical’, in line with the data- collecting process, takes the inter- and intraindi -vidual variability into account. Hence, this errorstructure assumes that yij = Ai + bixij + vij or yij = ai xbi
ij
evij where, within individual i = 1, … m, the variablesvij are independent normal random variables withmean 0 and variance 2 for a total of ni pairs of data(yij,xij), j = 1, … ni and n = Σm
i=j ni. Furthermore, the pairof parameters (ai,bi) are individual-specific and mod-eled as independent normal random variables withmean and variance (μa, σ2
a) and (μb, σ2b), respec-
tively. The naïve models have 3 parameters a (or A),b and σ, while the hierarchical models have 5 para-meters (μa, μb, σa, σb and σ).
In a second step, for turtles without an annulus, theresorption core diameters were measured (ycore), andthe corresponding number of lost lines inferred byreverse prediction (xcore). Therefore, the number ofgrowth layers observed in the outermost region ofthe bone section (xobs) plus the predicted number ofresorbed growth layers represented in the resorptioncore of the humerus is the turtle’s estimated age (x =xcore+ xobs).
Fig. 2. Caretta caretta. Interpretation of lines of arrestedgrowth (LAG; arrows) from loggerhead humerus: (a) doubleline, counted as one LAG; (b) one dark LAG that split into 5lines, counted as 5 LAGs; (c) first year mark (denoted as
annulus)
Petitet et al.: Age and growth of loggerheads
Back-calculation and growth rates
Back-calculation is a technique developed to esti-mate the length of a fish at an earlier time and isbased on body length measurements and the size ofhard parts (typically otoliths) used to assess ageobtained at the time of death. From these data, thebody length for all previously formed marks withinthe hard structure is estimated (Francis 1990). Smed-stad & Holm (1996) applied and validated the methodfor Atlantic cod Gadus morhua. In sea turtles, theback-calculation method has been applied and vali-dated for loggerheads and green sea turtles Cheloniamydas (Snover et al. 2007, Goshe et al. 2010, Casaleet al. 2011a).
We fitted 4 models to find the best relationshipbetween curved carapace length and humerus dia -meter, as did Snover et al. (2007) for North Atlanticloggerheads: (1) L = lop + b(D − dop)c; (2) L = lop + b(D− dop); (3) L = a + bDc; and (4) L = a + bD, where L isCCL, D is the diameter of the humerus, lop is a givenCCL of the turtle at hatching, dop is a given dia -meter of the humerus at hatching and c is the allo-metric coefficient, which is equal to 1 for Models 2and 4. For lop and dop, we used the hatchling meanstraight carapace length (SCL) of 4.6 cm in Snoveret al. (2007) converted to CCL based on the linearregression equation in Avens & Goshe (2007) (SCL= 0.923(CCL) − 0.189; lop = 4.77 cm).
Once the best model is established, back-calculationprovides estimates of size (CCL) for growth layer(LAG) diameters within the humerus. Thereafter,the ‘Body Proportional Hypothesis’ (BPH) was applied.This hypothesis says that the ratio between true size(L and model-estimated size L̂= f(D) for the associatedhumerus diameter (D) and a given model f, is the samefor all values of D (Francis 1990, Snover et al.2007). Under BPH, and taking the best-fitted model asf, the back-calculated length (Lb) for a given dia meterDbis:
Lb = [f(Db)] [Lfinal] [f(Dfinal)]−1 (1)
where Lfinal is the CCL of a turtle at death; and f(Dfinal)is the back-calculated CCL, based on humerus dia -meter.
To calculate the average yearly growth rate foreach turtle, the diameter of the innermost LAG wasmeasured and the corresponding CCL back- calculated with Eq. (1) and then subtracted from theCCL for the outermost LAG; the difference wasdivided by k + 1, where k is the number of LAGs inbetween.
Growth model
There are a number of published growth models,including the Pütter, von Bertalanffy, Richards,Gompertz and logistic growth models, among oth-ers. All these models are special cases of a general-ized model proposed by Schnute (1981). Logisticand von Bertalanffy growth models have beenapplied to skeletochronogical and mark−recapturegrowth data for loggerhead sea turtles (Frazer &Ehrhart 1985, Klinger & Musick 1995, Zug et al.1995, Bjorndal et al. 2000, Snover 2002). However,Schnute’s (1981) model is fitted here to age atlength owingto its generality in shape. Since the setof data included in the present analysis covers onlya specific age window of the turtle’s life cycle, theflexibility of this model is a possible advantage.Schnute’s (1981) generic equation with 4 parameterstakes the form
(2)
where y is the size of the specimen at age τ, in thiscase the size was the CCL. The parameters τ1 and τ2
are the ages fixed by the researcher, with the restric-tion that τ2 > τ1, which are usually the youngest andoldest ages present in the sample, respectively. Theparameters γ1 and γ2 are the expected sizes at ages τ1
and τ2, respectively, with the restriction that 0 < γ1 <γ2. The parameters a and b define the shape of thecurve and can be positive, negative or equal to zero.Parameter a is related to the curve slope and its unitis τ−1 and parameter b does not have a unit. Specificcombinations of these 2 parameters lead to differentgrowth models; for example, the von Bertalanffycurve when a > 0 and b = 1. The 5 parameters to beestimated are a, b, γ1, γ2, and σ, where σ is the SE ofresiduals. A linear regression (CCL = A + Bx) wasalso fitted, where x = (age – 15)s –1
x is the standardizeddistance at 15 yr of age, the full age closest to themean age in the sample.
Statistical analysis
Inference was performed within a Bayesian statisti-cal framework. In Bayesian analysis, estimates ofunknown parameters are given as probability distri-butions denoted ‘posteriors’ (Gelman et al. 2003).These posteriors are obtained by the integration ofthe data likelihood with other relevant informationexpressed in prior probability distributions, using
y b b ba
aτ
τ τ
τ τγ γ γ= − −[ ] × −−
− −( )
− −1 2 111
1
2
ee 11
1
( )⎡⎣⎢
⎤⎦⎥{ }b
259
Mar Ecol Prog Ser 456: 255–268, 2012
Bayes’ theorem. When analytical solutions are notfeasible, posteriors are approximated by randomsamples taken from it. If the inclusion of externalinformation is not possible or desirable, appropriatenon-informative or ‘open-minded’ priors are choseninstead.
We used non-informative priors in all butSchnute’s (1981) growth model, for which the priorfor the parameter vector (a, b, log γ1, log γ2, log σ)was a 5-dimensional Student’s distribution with 10df, centered at the mode of the log likelihood andwith a scale matrix equal to the inverse-Hessian.Although informative, this prior is considered open-minded in the sense that all possible parameter val-ues have positive prior probability. Samples fromthe posterior distributions were drawn by themethod of Markov chain Monte Carlo (MCMC)(Gelman et al. 2003). In MCMC, a Markov chain isset up in such a fashion that the posterior is its longrun equilibrium distribution.
Posterior means were used as parameter estimatesunless otherwise stated. Uncertainty about theseestimates were expressed in 95% posterior probabil-ity intervals with lower and upper limits equal to thequantiles 2.5 and 97.5% of the posterior sample,respectively. A posterior probability interval is theBayesian analog to conventional confidence intervals(Ellison 2004, McCarthy 2007). Model selection wasbased on the deviance information criterion (DIC)(Spiegelhalter et al. 2002). All analyses were per-formed with software R (R Development Core Team2008) and OpenBugs (Thomas et al. 2006), which isan application of BUGS language (The BUGS Pro-ject, www.mrc-bsu.cam.ac.uk/bugs/ [accessed 8 De -cember 2008]) to specify models and perform theBayesian analysis (Gilks et al. 1994). The R-code onall applications can be obtained on request from thefirst author.
RESULTS
A total of 69 humeri were collected, 49 from loggerhead tur-tles washed ashore and 20 fromturtles incidentally caught in pe -lagic long line fisheries. Sizes ofstran ded turtles ranged from 45.5to 102.0 cm CCL (mean ± SD =74.81 ± 11.59 cm), while individu-als caught in the ocean rangedfrom 47.0 to 66.5 cm CCL (58.92 ±5.00 cm) (see Table 3). The sample
was divided into oceanic and neritic individuals, i.e.the former being caught in the longline fishery oper-ating 150 km from shore and the latter stranded deadon mainland beaches. This separation is based ondifferent diets. Barros (2010) found only oceanic preyin 33 out of 35 stomachs in the oceanic turtles, whileboth benthic and oceanic prey were found in neriticturtles (n = 42). Data from the oceanic and neritic seaturtles were combined for growth analysis, becausethey were considered to be from the same population(Reis et al. 2010). The individuals were classified as‘possible’ adults or juveniles based on the size range(83.0 to 120.0 cm CCL) of mature loggerheads fromthe nearest nesting area (Baptistotte et al. 2003).
Age estimation
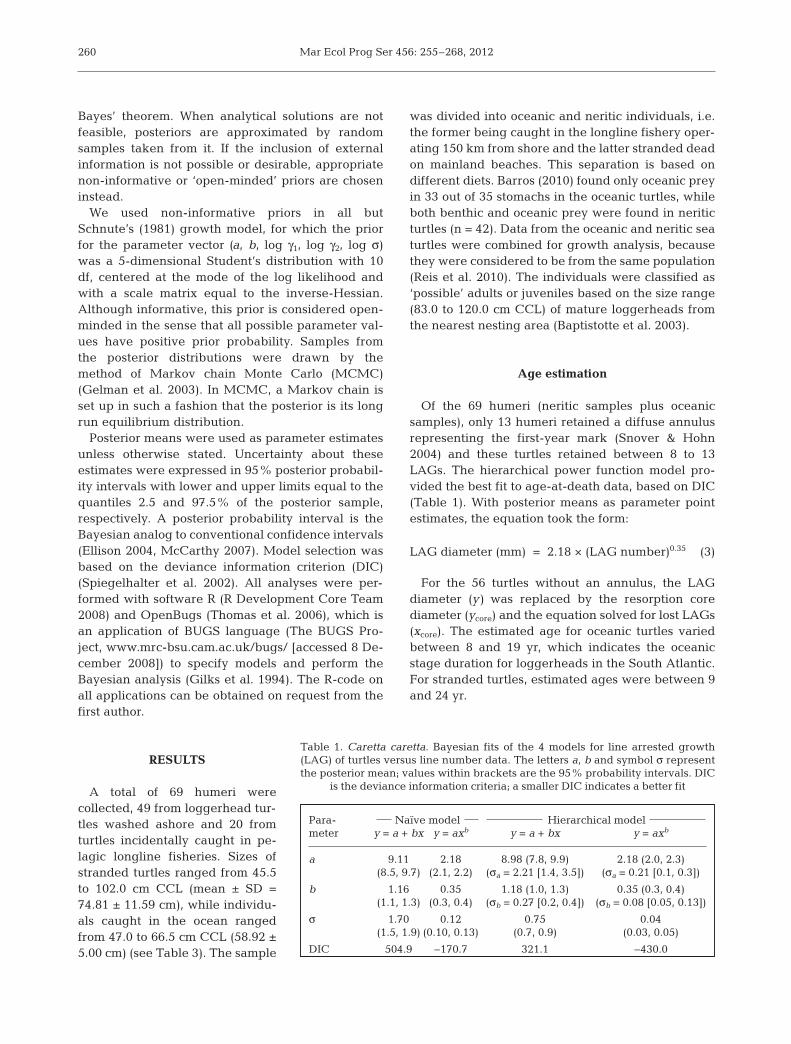
Of the 69 humeri (neritic samples plus oceanicsamples), only 13 humeri retained a diffuse annulusrepresenting the first-year mark (Snover & Hohn2004) and these turtles retained between 8 to 13LAGs. The hierarchical power function model pro-vided the best fit to age-at-death data, based on DIC(Table 1). With posterior means as parameter pointestimates, the equation took the form:
LAG diameter (mm) = 2.18 × (LAG number)0.35 (3)
For the 56 turtles without an annulus, the LAGdiameter (y) was replaced by the resorption corediameter (ycore) and the equation solved for lost LAGs(xcore). The estimated age for oceanic turtles variedbetween 8 and 19 yr, which indicates the oceanicstage duration for loggerheads in the South Atlantic.For stranded turtles, estimated ages were between 9and 24 yr.
260
Para- Naïve model Hierarchical modelmeter y = a + bx y = axb y = a + bx y = axb
a 9.11 2.18 8.98 (7.8, 9.9) 2.18 (2.0, 2.3) (8.5, 9.7) (2.1, 2.2) (σa = 2.21 [1.4, 3.5]) (σa = 0.21 [0.1, 0.3])
b 1.16 0.35 1.18 (1.0, 1.3) 0.35 (0.3, 0.4) (1.1, 1.3) (0.3, 0.4) (σb = 0.27 [0.2, 0.4]) (σb = 0.08 [0.05, 0.13])
σ 1.70 0.12 0.75 0.04(1.5, 1.9) (0.10, 0.13) (0.7, 0.9) (0.03, 0.05)
DIC 504.9 −170.7 321.1 −430.0
Table 1. Caretta caretta. Bayesian fits of the 4 models for line arrested growth(LAG) of turtles versus line number data. The letters a, b and symbol σ representthe posterior mean; values within brackets are the 95% probability intervals. DIC
is the deviance information criteria; a smaller DIC indicates a better fit
Petitet et al.: Age and growth of loggerheads
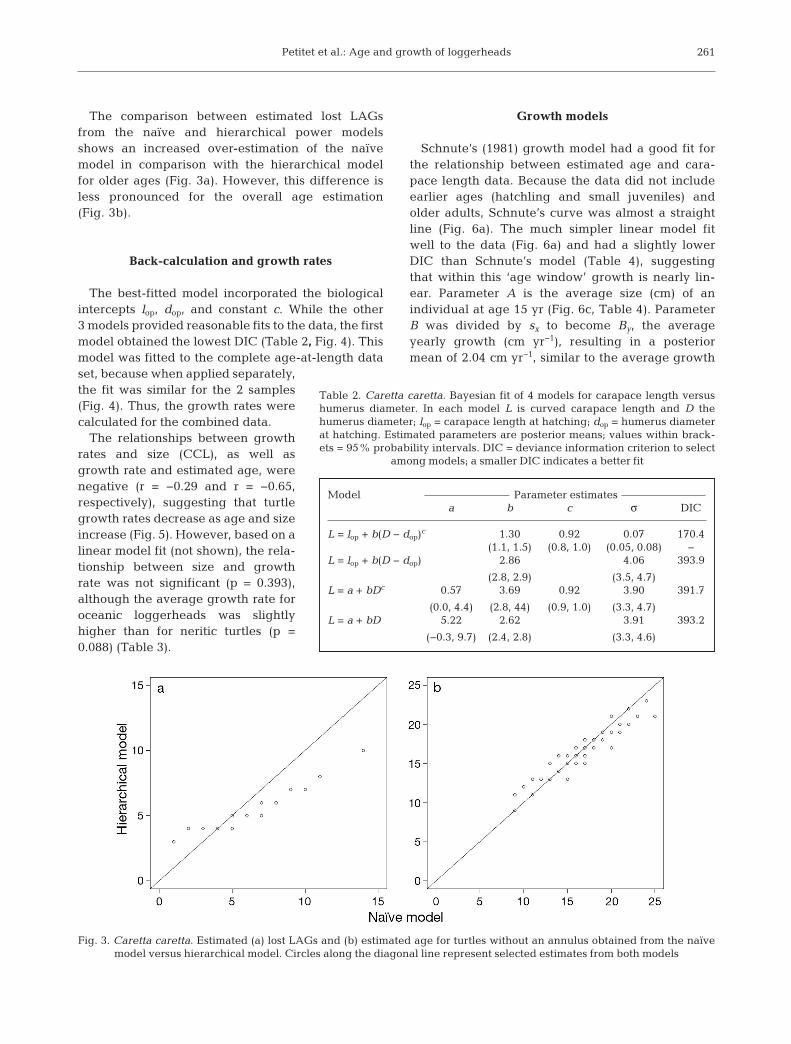
The comparison between estimated lost LAGsfrom the naïve and hierarchical power modelsshows an increased over-estimation of the naïvemodel in comparison with the hierarchical modelfor older ages (Fig. 3a). However, this difference isless pronounced for the overall age estimation(Fig. 3b).
Back-calculation and growth rates
The best-fitted model incorporated the biologicalintercepts lop, dop, and constant c. While the other3 models provided reasonable fits to the data, the firstmodel obtained the lowest DIC (Table 2, Fig. 4). Thismodel was fitted to the complete age-at-length dataset, because when applied separately,the fit was similar for the 2 samples(Fig. 4). Thus, the growth rates werecalculated for the combined data.
The relationships between growthrates and size (CCL), as well asgrowth rate and estimated age, werenegative (r = −0.29 and r = −0.65,respectively), suggesting that turtlegrowth rates decrease as age and sizeincrease (Fig. 5). However, based on alinear model fit (not shown), the rela-tionship between size and growthrate was not significant (p = 0.393),although the average growth rate foroceanic loggerheads was slightlyhigher than for neritic turtles (p =0.088) (Table 3).
Growth models
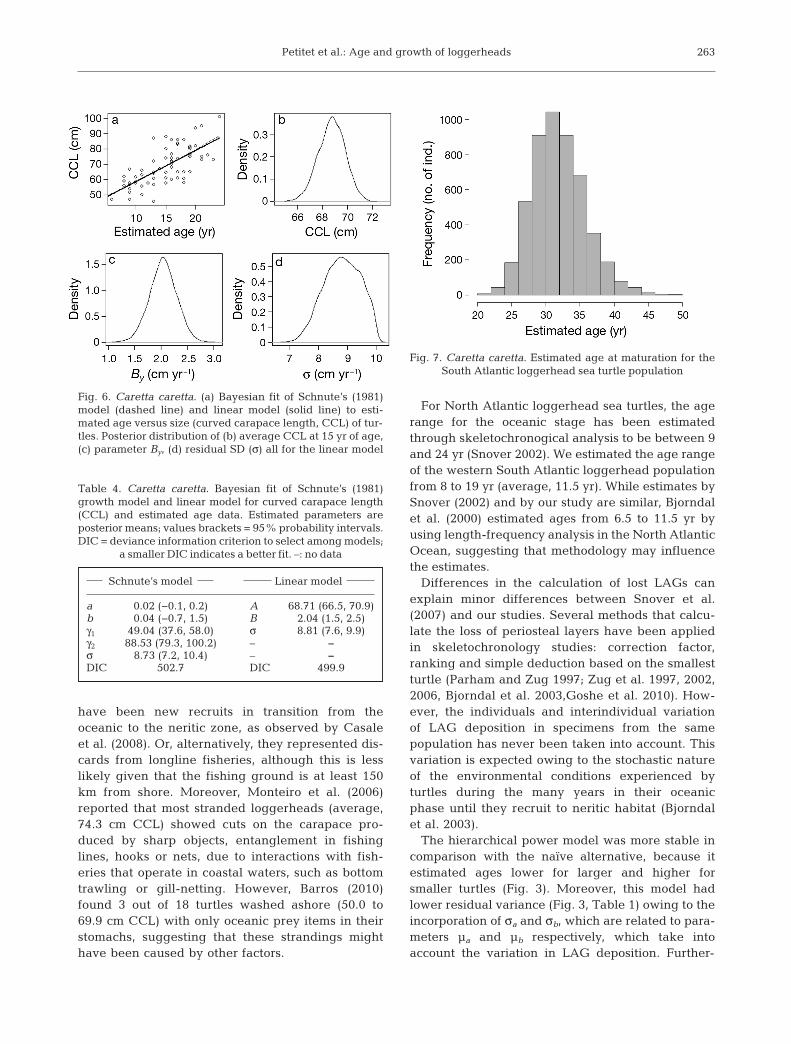
Schnute’s (1981) growth model had a good fit forthe relationship between estimated age and cara-pace length data. Because the data did not includeearlier ages (hatchling and small juveniles) andolder adults, Schnute’s curve was almost a straightline (Fig. 6a). The much simpler linear model fitwell to the data (Fig. 6a) and had a slightly lowerDIC than Schnute’s model (Table 4), suggestingthat within this ‘age window’ growth is nearly lin-ear. Parameter A is the average size (cm) of anindividual at age 15 yr (Fig. 6c, Table 4). ParameterB was divided by sx to become By, the averageyearly growth (cm yr−1), resulting in a posteriormean of 2.04 cm yr−1, similar to the average growth
261
Fig. 3. Caretta caretta. Estimated (a) lost LAGs and (b) estimated age for turtles without an annulus obtained from the naïve model versus hierarchical model. Circles along the diagonal line represent selected estimates from both models
Model Parameter estimatesa b c σ DIC
L = lop + b(D − dop)c 1.30 0.92 0.07 170.4(1.1, 1.5) (0.8, 1.0) (0.05, 0.08) −
L = lop + b(D − dop) 2.86 4.06 393.9
(2.8, 2.9) (3.5, 4.7)L = a + bDc 0.57 3.69 0.92 3.90 391.7
(0.0, 4.4) (2.8, 44) (0.9, 1.0) (3.3, 4.7)L = a + bD 5.22 2.62 3.91 393.2
(−0.3, 9.7) (2.4, 2.8) (3.3, 4.6)
Table 2. Caretta caretta. Bayesian fit of 4 models for carapace length versushumerus diameter. In each model L is curved carapace length and D thehumerus diameter; lop = carapace length at hatching; dop = humerus diameterat hatching. Estimated parameters are posterior means; values within brack-ets = 95% probability intervals. DIC = deviance information criterion to select
among models; a smaller DIC indicates a better fit

Mar Ecol Prog Ser 456: 255–268, 2012
rate obtained from back- calculation (2.45 cm yr−1)(Fig. 6b, Table 4).
As the much simpler linear model had a lower DICthan Schnute’s (1981) model, we used the former forestimating the age distribution of turtles within thesize range of mature loggerheads from the Braziliancoast (83.0 to 123.0 cm CCL) (Baptistotte et al. 2003).The estimated age distribution was based on theassumption that this size range has an approximatenormal distribution with the mean equal to 102.5 cmand the SD equal to 5.3 cm, and that the linearregression is acceptable up to the maximum size.Uncertainty in the parameter estimates of the linearage-at-size relation was included by use of the poste-
rior distribution. The simulated age distributionresulted in a mean age at maturation for the logger-head sea turtle population at 31.8 yr (±3.47 yr; 95%probability interval: 25.7−39.2) (Fig. 7).
DISCUSSION
Age estimation
The size range and age estimates of oceanic log-gerhead sea turtles in the South Atlantic werelower than for neritic ones inhabiting nearshoreareas along the coast of southern Brazil. Bjorndal etal. (2000) suggested that loggerheads from theNorth Atlantic Ocean recruit to the neritic zone at~46.0 to 64.0 cm CCL, which is similar to our find-ings for the South Atlantic Ocean. We show thatoceanic turtles ranged from 47.0 to 65.5 cm CCLwhile those from the neritic area were predomi-nantly >70 cm CCL. A few neritic individuals fellwithin the size range of oceanic turtles. They may
262
Fig. 4. Caretta caretta. Relationship between curved cara-pace length (CCL) and humerus diameter (n = 69). Greysolid line: model [CCL = lop + b(D − dop)c] fitted only to theoceanic turtle data set (d, n = 20). Black solid line: samemodel fitted only to the neritic turtle data set (s, n = 49).lop: CCL at hatching; dop: humerus diameter at hatching;
b: slope of the line; c: allometric coefficient
Fig. 5. Caretta caretta. Relationship between growth rates and (a) curved carapace length (CCL) (r = −0.29) and (b) estimated age (r = −0.65). n = 69
Size Neritic Oceanicclass n Growth rate n Growth rate(cm) (cm yr−1) (cm yr−1)
40−49 2 2.39 (1.8−3.0) 1 3.3750−59 4 2.82 (1.9−3.7) 10 3.51 (2.2−4.4)60−69 11 2.55 (1.4−4.6) 9 2.79 (1.1−4.5)70−79 16 2.55 (1.7−3.5) – –80−89 13 2.53 (1.2−4.1) – –90−99 2 – – –100−109 1 – – –
Table 3. Caretta caretta. Number (n) of turtles from neritic(beach) and oceanic (pelagic longline fisheries) zones andmean respective growth rates (range in brackets) by size
classes of curved carapace length (CCL). −: no data
Petitet et al.: Age and growth of loggerheads
have been new recruits in transition from theoceanic to the neritic zone, as observed by Casaleet al. (2008). Or, alternatively, they represented dis-cards from longline fisheries, although this is lesslikely given that the fishing ground is at least 150km from shore. Moreover, Monteiro et al. (2006)reported that most stranded loggerheads (average,74.3 cm CCL) showed cuts on the carapace pro-duced by sharp objects, entanglement in fishinglines, hooks or nets, due to inter actions with fish-eries that operate in coastal waters, such as bottomtrawling or gill-netting. However, Barros (2010)found 3 out of 18 turtles washed ashore (50.0 to69.9 cm CCL) with only oceanic prey items in theirstomachs, suggesting that these strandings mighthave been caused by other factors.
For North Atlantic loggerhead sea turtles, the agerange for the oceanic stage has been estimatedthrough skeletochronogical analysis to be between 9and 24 yr (Snover 2002). We es timated the age rangeof the western South Atlantic loggerhead populationfrom 8 to 19 yr (average, 11.5 yr). While estimates bySnover (2002) and by our study are similar, Bjorndalet al. (2000) estimated ages from 6.5 to 11.5 yr byusing length-frequency analysis in the North AtlanticOcean, suggesting that methodology may influencethe estimates.
Differences in the calculation of lost LAGs canexplain minor differences between Snover et al.(2007) and our studies. Several methods that calcu-late the loss of periosteal layers have been appliedin skeletochronology studies: correction factor,ranking and simple deduction based on the smallestturtle (Parham and Zug 1997; Zug et al. 1997, 2002,2006, Bjorndal et al. 2003,Goshe et al. 2010). How-ever, the individuals and interindividual variationof LAG deposition in specimens from the samepopulation has never been taken into account. Thisvariation is expected owing to the stochastic natureof the environmental conditions experienced byturtles during the many years in their oceanicphase until they recruit to neritic habitat (Bjorndalet al. 2003).
The hierarchical power model was more stable incomparison with the naïve alternative, because itestimated ages lower for larger and higher forsmaller turtles (Fig. 3). Moreover, this model hadlower residual variance (Fig. 3, Table 1) owing to theincorporation of σa and σb, which are related to para-meters μa and μb respectively, which take intoaccount the variation in LAG deposition. Further-
263
Fig. 6. Caretta caretta. (a) Bayesian fit of Schnute’s (1981)model (dashed line) and linear model (solid line) to esti-mated age versus size (curved carapace length, CCL) of tur-tles. Posterior distribution of (b) average CCL at 15 yr of age,(c) parameter By, (d) residual SD (σ) all for the linear model
Schnute’s model Linear model
a 0.02 (−0.1, 0.2) A 68.71 (66.5, 70.9)b 0.04 (−0.7, 1.5) B 2.04 (1.5, 2.5)γ1 49.04 (37.6, 58.0) σ 8.81 (7.6, 9.9)γ2 88.53 (79.3, 100.2) – –σ 8.73 (7.2, 10.4) – –DIC 502.7 DIC 499.9
Table 4. Caretta caretta. Bayesian fit of Schnute’s (1981)growth model and linear model for curved carapace length(CCL) and estimated age data. Estimated parameters areposterior means; values brackets = 95% probability intervals.DIC = deviance information criterion to select among models;
a smaller DIC indicates a better fit. –: no data
Fig. 7. Caretta caretta. Estimated age at maturation for the South Atlantic loggerhead sea turtle population
Mar Ecol Prog Ser 456: 255–268, 2012
more, the application of Bayesian inference providedfurther accuracy to estimated ages because theywere based on predictive probabilities over all possi-ble ages given the whole data set (Ellison 2004).
Growth rate
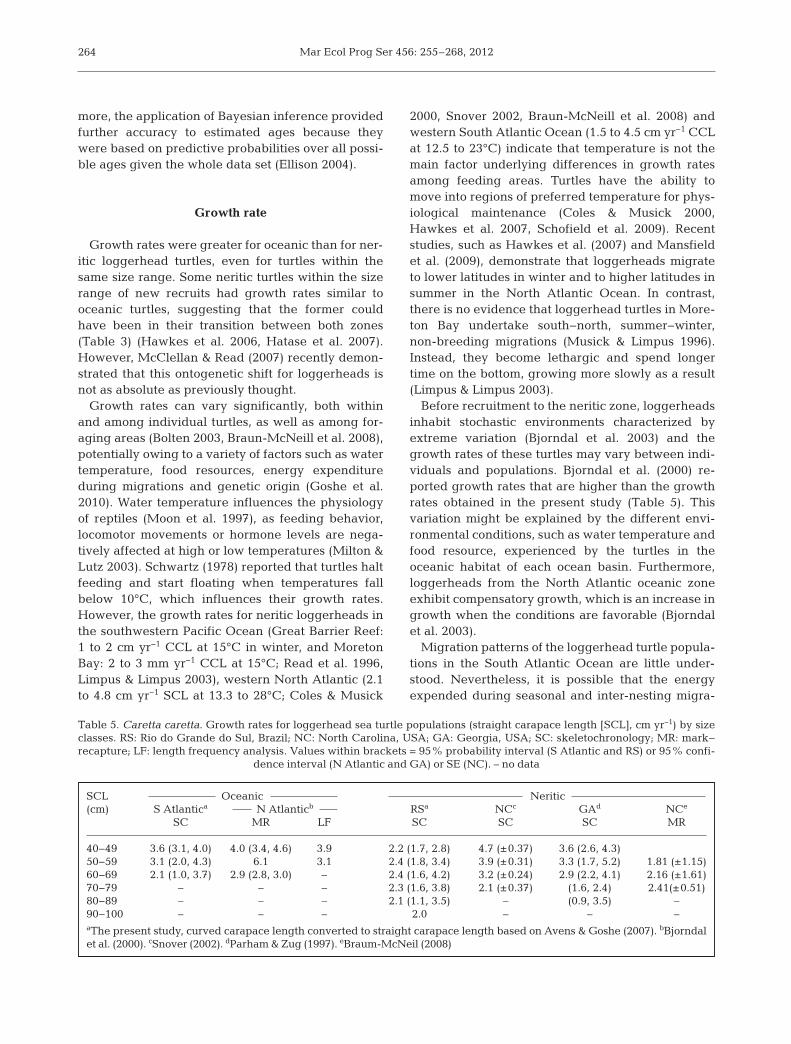
Growth rates were greater for oceanic than for ner-itic loggerhead turtles, even for turtles within thesame size range. Some neritic turtles within the sizerange of new recruits had growth rates similar tooceanic turtles, suggesting that the former couldhave been in their transition between both zones(Table 3) (Hawkes et al. 2006, Hatase et al. 2007).However, McClellan & Read (2007) recently demon-strated that this ontogenetic shift for loggerheads isnot as absolute as previously thought.
Growth rates can vary significantly, both withinand among individual turtles, as well as among for-aging areas (Bolten 2003, Braun-McNeill et al. 2008),potentially owing to a variety of factors such as watertemperature, food resources, energy expenditureduring migrations and genetic origin (Goshe et al.2010). Water temperature influences the physiologyof reptiles (Moon et al. 1997), as feeding behavior,locomotor movements or hormone levels are nega-tively affected at high or low temperatures (Milton &Lutz 2003). Schwartz (1978) reported that turtles haltfeeding and start floating when temperatures fallbelow 10°C, which influences their growth rates.However, the growth rates for neritic loggerheads inthe southwestern Pacific Ocean (Great Barrier Reef:1 to 2 cm yr−1 CCL at 15°C in winter, and MoretonBay: 2 to 3 mm yr−1 CCL at 15°C; Read et al. 1996,Limpus & Limpus 2003), western North Atlantic (2.1to 4.8 cm yr−1 SCL at 13.3 to 28°C; Coles & Musick
2000, Snover 2002, Braun-McNeill et al. 2008) andwestern South Atlantic Ocean (1.5 to 4.5 cm yr−1 CCLat 12.5 to 23°C) indicate that temperature is not themain factor under lying differences in growth ratesamong feeding areas. Turtles have the ability tomove into regions of preferred temperature for phys-iological maintenance (Coles & Musick 2000,Hawkes et al. 2007, Schofield et al. 2009). Recentstudies, such as Hawkes et al. (2007) and Mansfieldet al. (2009), demonstrate that loggerheads migrateto lower latitudes in winter and to higher latitudes insummer in the North Atlantic Ocean. In contrast,there is no evidence that loggerhead turtles in More-ton Bay undertake south−north, summer−winter,non-breeding migrations (Musick & Limpus 1996).Instead, they become lethargic and spend longertime on the bottom, growing more slowly as a result(Limpus & Limpus 2003).
Before recruitment to the neritic zone, loggerheadsinhabit stochastic environments characterized byextreme variation (Bjorndal et al. 2003) and thegrowth rates of these turtles may vary between indi-viduals and populations. Bjorndal et al. (2000) re -ported growth rates that are higher than the growthrates obtained in the present study (Table 5). Thisvariation might be explained by the different envi-ronmental conditions, such as water temperature andfood resource, experienced by the turtles in theoceanic habitat of each ocean basin. Furthermore,loggerheads from the North Atlantic oceanic zoneexhibit compensatory growth, which is an increase ingrowth when the conditions are favorable (Bjorndalet al. 2003).
Migration patterns of the loggerhead turtle popula-tions in the South Atlantic Ocean are little under-stood. Nevertheless, it is possible that the energyexpended during seasonal and inter-nesting migra-
264
SCL Oceanic Neritic(cm) S Atlantica N Atlanticb RSa NCc GAd NCe
SC MR LF SC SC SC MR
40−49 3.6 (3.1, 4.0) 4.0 (3.4, 4.6) 3.9 2.2 (1.7, 2.8) 4.7 (±0.37) 3.6 (2.6, 4.3)50−59 3.1 (2.0, 4.3) 6.1 3.1 2.4 (1.8, 3.4) 3.9 (±0.31) 3.3 (1.7, 5.2) 1.81 (±1.15)60−69 2.1 (1.0, 3.7) 2.9 (2.8, 3.0) – 2.4 (1.6, 4.2) 3.2 (±0.24) 2.9 (2.2, 4.1) 2.16 (±1.61)70−79 – – – 2.3 (1.6, 3.8) 2.1 (±0.37) (1.6, 2.4) 2.41(±0.51)80−89 – – – 2.1 (1.1, 3.5) – (0.9, 3.5) –90−100 – – – 2.0 – – –aThe present study, curved carapace length converted to straight carapace length based on Avens & Goshe (2007). bBjorndalet al. (2000). cSnover (2002). dParham & Zug (1997). eBraum-McNeil (2008)
Table 5. Caretta caretta. Growth rates for loggerhead sea turtle populations (straight carapace length [SCL], cm yr−1) by sizeclasses. RS: Rio do Grande do Sul, Brazil; NC: North Carolina, USA; GA: Georgia, USA; SC: skeletochronology; MR: mark−recapture; LF: length frequency analysis. Values within brackets = 95% probability interval (S Atlantic and RS) or 95% confi-
dence interval (N Atlantic and GA) or SE (NC). – no data
Petitet et al.: Age and growth of loggerheads
tion may influence growth rates. The wide seasonalwater temperature variation in southern Brazil (Gar-cia 1998) may induce the northward migration of log-gerhead during cold months, as was observed forgreen sea turtles (Hawkes et al. 2007, R. Petitetunpubl. data). Moreover, the turtles within the sizerange of mature loggerheads along the Braziliancoast (83.0 to 120.0 cm CCL) (Baptistotte et al. 2003)may perform seasonal migrations between foraging(southern Brazil) and nesting grounds (Espírito SantoState), thus contributing to the slow growth rates ofthis group (Table 3). Satellite telemetry would poten-tially improve the underzstanding of the migrationand distribution patterns of loggerhead sea turtles insouthern Brazil, which is an important foraging areafor the western South Atlantic population (Martinez-Souza 2009, Barros 2010).
Martinez-Souza (2009) and Barros (2010) haveobserved that oceanic loggerheads feed mostly onsalps and pyrosomes and suggested that these turtlesfeed constantly to balance the low energy budget ofthis food source. Thus, the trend for oceanic growthrates to be higher than those of neritic turtles (p =0.088) may be due to the amount of food intake andthe need for high growth rates to minimize predationrisks (Snover et al. 2007). Although in the neriticzone, loggerheads feed upon prey with higherenergy content (Barros 2010), their growth rates arelower in comparison. As it has been reported thatlarger turtles have lower growth rates (Klinger &Musick 1995, Goshe et al. 2010), the differencebetween our growth rate data and Moreton Bay stud-ies may be due to the size range of recruits. In Aus-tralia, loggerhead turtles recruit to neritic habitatwhen their average CCL is 78.62 cm (Limpus & Lim-pus 2003), which is a much larger size than thoseestimated for the turtles in the South (~58.9 cm CCL,the present study) or North Atlantic Oceans (~53.0 cmCCL, Bjorndal et al. 2000). The low growth rate forMoreton Bay turtles (2.3 mm yr−1 CCL) may bebecause the animals are already fairly large whenthey recruit to neritic habitat.
In addition to the various factors de-scribed above, growth rates may varydepending on the calculation method.As the BPH method was validated bySnover et al. (2007) for loggerheads,the calculation of growth rates becamemore accurate (Table 5). Skeleto chro -nological analysis can potentially yieldannual growth rates over multipleyears, whereas mark−recapture studiesproduce a growth rate estimate related
merely to the variable time interval between captureand recapture.
Growth model
Schnute’s (1981) growth model resulted in analmost straight line (Fig. 4), probably because thedata set incorporated only a small ‘age window’ ofthe loggerhead sea turtle’s life cycle. Furthermore,the majority of individuals were classified as ju -veniles (Limpus & Limpus 2003). Juvenile turtles ap -pear to grow faster than adults (Bjorndal et al. 2003)perhaps as rapid size increase may protect them frompredation (Snover & Hohn 2004).
An important advantage of Schnute’s (1981) growthmodel is the versatility to adapt its shape according tothe age window for which data are available. In con-trast, to fit the more conventional von Bertalanffygrowth model, a sample from all size classes rangingfrom hatchlings to old adults encompassing asymp-totic size, is required. Such a data set is difficult togather owing to the extensive migration pattern char-acteristic of the sea turtle’s life cycle and the uncer-tainty remaining with regard to the ‘lost years’ (Carr1987). In spite of these difficulties, the logistic or thevon Bertalanffy growth models have usually been ap-plied in most sea turtle growth studies (Fra zer &Ehrhart 1985, Klinger & Musick 1995, Zug et al. 1995,Bjorndal et al. 2000, Snover 2002).
Based on the linear model, the estimated age atmaturation was ~32 yr (Fig. 7). Snover (2002) re por -ted a mean of 30.8 yr for age at ma turation, andBjorndal et al. (2000) estimated it took 26.5 yr forreaching a CCL of 87 cm, which is considered to bethe minimum size at which loggerheads from theNorth Atlantic Ocean become mature. These esti-mates and those from Klinger & Musick (1995) (22 to26 yr) are within the credibility interval of our esti-mates; however, the estimates strongly depend onthe mean estimated size of mature loggerhead turtlesin the population (Table 6).
265
Method Population Age at Source maturation (yr)
Mark−recapture VA 22−26 Klinger & Musick (1995)Length frequency PT 26.5 Bjorndal et al. (2000)Sceletochronology NC 30.8 Snover (2002)Sceletochronology RS 31.8 Present study
Table 6. Caretta caretta. Estimated age at maturation in 4 different logger-head turtle populations. VA: Virginia, USA; PT: Azores, Portugal; NC: North
Carolina, USA; RS: Rio Grande do Sul, Brazil
Mar Ecol Prog Ser 456: 255–268, 2012
CONCLUSIONS
The south coast of Rio Grande do Sul is an impor-tant development area for oceanic juvenile logger-head sea turtles (8 to 19 yr) as well as for neritic juve-niles and adults (9 to 24 yr). Growth rates decreasedwith an increase in both age and size, reflecting thedifference between growth rates of individuals in theoceanic and neritic zones. During the post-hatchingto late juvenile stage, growth is linear, and the age atmaturation is ~30 yr.
Skeletochronological analysis is a powerful tool toprovide age- and growth-related data for character-izing sea turtle population dynamics throughout theworld. This study is the first to describe age andgrowth for Caretta caretta in the South Atlantic andprovides invaluable information for assessing logger-head sea turtle population dy na mics in southernBrazil.
Acknowledgements. We acknowledge the National MarineFisheries Service, Sea Turtle Aging Laboratory, NOAAFisheries, of skeletochronological training, with specialthanks to A. Hohn, L. Goshe and M. Godfrey. We acknowl-edge the Núcleo de Educação e Monitoramento Ambiental(NEMA) and Centro de Recuperação de Animais Marinhos(CRAM-FURG) for the humeri samples. Some sampleswere collected and the age determined with the logisticsprovided by the Laboratório de Tartarugas e MamíferosMarinhos (Instituto de Oceano grafia — FURG). This paperis a contribution of the Research Group ‘Ecologia e Conser-vação da Mega fauna Marinha — EcoMega/CNPq’. E.R.S.was supported by CNPq (PQ 305219/ 2008-1). R.P. receivedfinancial support from Coordenação de Aperfeiçoamentode Pessoal de Nível Superior (CAPES). This research ispart of the Master’s dissertation written by R.P. under theguidance of P.G.K.
LITERATURE CITED
Avens L, Goshe LR (2007) Comparative skeletochronologi-cal analysis of Kemp’s ridley (Lepidochelys kempii ) andloggerhead (Caretta caretta) humeri and scleral ossicles.Mar Biol 152: 1309−1317
Baptistotte C, Thomé JCA, Bjorndal KA (2003) Reproductivebiology and conservation status of the loggerhead seaturtle (Caretta caretta) in Espírito Santos state, Brazil.Chelonian Conserv Biol 4: 523−529
Barros J (2010) Alimentação da tartaruga-cabeçuda (Carettacaretta) em habitat oceanic e nerítico no Sul do Brasil: composição, aspectos nutricionais e resíduos sólidosAntropogênicos. MSc dissertation, Universidade Federaldo Rio Grande
Bjorndal KA, Bolten AB (1988) Growth rates of juvenile log-gerheads, Caretta caretta, in the southern Bahamas.J Herpetol 22: 480−482
Bjorndal KA, Bolten AB, Martins HR (2000) Somatic growthmodel of juvenile loggerhead sea turtles Caretta caretta: duration of pelagic stage. Mar Ecol Prog Ser 202: 265−272
Bjorndal KA, Bolten AB, Dellinger T, Delgado C, Martins HR(2003) Compensatory growth in oceanic loggerhead seaturtles: response to a stochastic environment. Ecology 84: 1237−1249
Bolten AB (1999) Techniques for measuring sea turtles. In: Eckert KL, Bjorndal KA, Abreu-Grobois FA, Donnelly M(eds) Research and management techniques for the conservation of sea turtles. IUCN/SSC Marine TurtleSpecialist Group, Publication No. 4, Washington, DC,p 1−5
Bolten AB (2003) Active swimmers — passive drifters: theoceanic stage of loggerheads in the Atlantic system. In: Bolten AB, Witherington BE (eds) Loggerhead sea tur-tles. Smithsonian Institution, Washington, DC, p 63−78
Braun-McNeill J, Epperly SP, Avens L, Snover ML, TaylorJC (2008) Growth rates of loggerhead (Caretta caretta)sea turtles from the western North Atlantic. HerpetolConserv Biology 3: 273−281
Carr A (1987) New perspectives on the pelagic stage of seaturtle development. Conserv Biol 1: 103−121
Casale P, Mazaris AD, Freggi D, Basso R, Argano R (2007)Survival probabilities of loggerhead sea turtles (Carettacaretta) estimated from capture-mark-recapture data inthe Mediterranean Sea. Sci Mar 71: 365−372
Casale P, Abbate G, Freggi D, Conte N, Oliverio M, ArganoR (2008) Foraging ecology of loggerhead sea turtlesCaretta caretta in the central Mediterranean Sea: evi-dence for a relaxed life history model. Mar Ecol Prog Ser372: 265−276
Casale P, Mazaris AD, Freggi D, Vallini C, Argano R (2009)Growth rates and age at adult size of loggerhead sea tur-tles (Caretta caretta) in the Mediterranean Sea, esti-mated through capture-mark-recapture records. Sci Mar73: 589−595
Casale P, Conte N, Freggi D, Cioni C, Argano R (2011a) Ageand growth determination by skeletochronology in log-gerhead sea turtles (Caretta caretta) from the Medi -terranean Sea. Sci Mar 75: 197−203
Casale P, Mazaris AD, Freggi D (2011b) Estimation of age atmaturity of loggerhead sea turtles Caretta caretta in theMediterranean using length frequency data. EndangSpecies Res 13: 123−129
Castanet J, Smirina E (1990) Introduction to the skeleto -chronological method in amphibians and reptiles. AnnSci Nat Zool 13e Sér 11: 191−196
Chaloupka MY, Limpus CJ (2002) Survival probability esti-mates for the endangered loggerhead sea turtle residentin southern Great Barrier Reef waters. Mar Biol 140: 267−277
Chaloupka MY, Musick JA (1996) Age, growth, and popula-tion dynamics. In: Lutz PL, Musick JA (eds) The biologyof sea turtles. CRC Press, Boca Raton, FL, p 233− 276
Coles WC, Musick JA (2000) Satellite sea surface tempera-ture analysis and correlation with sea turtle distributionoff North Carolina. Copeia 2000: 551−554
Coles WC, Musick JA, Williamson LA (2001) Skeleto -chronology validation from an adult loggerhead. Copeia2001: 240−242
Ellison AM (2004) Bayesian inference in ecology. Ecol Lett 7: 509−520
Faraway JJ (2006) Repeated measures and longitudinaldata. In: Faraway JJ (ed) Extending the linear modelwith R: generalized linear, mixed effects and nonpara-metric regression models. Chapman & Hall/CRC, BocaRaton, FL, p 185−199
266
Petitet et al.: Age and growth of loggerheads
Francis RICC (1990) Back-calculation of fish length: a criti-cal review. J Fish Biol 36: 883−902
Frazer NB, Ehrhart LM (1985) Preliminary growth rates forgreen, Chelonia mydas, and loggerhead, Caretta caretta,turtles in the wild. Copeia 1985: 73−79
Garcia CAE (1998) Oceanografia física. In: Seelinger U,Odebrecht C, Castello JP (eds) Os ecossistemas costeirose marinhos do extreme sul do Brasil. Ecoscientia, RioGrande, p 104−106
Gelman A, Carlin JB, Stern HS, Rubin DB (2003) Bayesiandata analysis, 2nd edn. Chapman & Hall, London
Gilks WR, Thomas A, Spiegelhalter DJ (1994) A languageand program for complex Bayesian modeling. Statisti-cian 43: 169−177
Goshe L, Avens L, Scharf FS, Southwood AL (2010) Estima-tion of age at maturation and growth of Atlantic greenturtles (Chelonia mydas) using skeletochronology. MarBiol 157: 1725−1740
Hatase H, Omuta K, Tsukamoto K (2007) Bottom or mid -water: alternative foraging behaviours in adult femaleloggerhead sea turtles. J Zool 273: 46−55
Hawkes LA, Broderick AC, Coyne MS, Godfrey MH andothers (2006) Phenotypically linked dichotomy in sea tur-tle foraging requires multiple conservation approaches.Curr Biol 16: 990−995
Hawkes LA, Broderick AC, Coyne MS, Godfrey MH, GodleyBJ (2007) Only some like it hot — quantifying the envi-ronmental niche of the loggerhead sea turtle. Divers Distrib 13: 447−457
IUCN (International Union for Conservation of Nature andNatural Resources) (2010) IUCN red list of threatenedspecies, version 2010.3. www.iucnredlist.org (accessed22 September 2010)
Klinger RC, Musick JA (1992) Annular growth layers injuvenile loggerhead turtles (Caretta caretta). Bull MarSci 51: 224−230
Klinger RC, Musick JA (1995) Age and growth of logger-head turtles (Caretta caretta) from Chesapeake Bay.Copeia 1995: 204−209
Limpus CJ, Limpus DJ (2003) Biology of the loggerhead tur-tle in western South Pacific Ocean foraging areas. In: Bolten AB, Witherington BE (eds) Loggerhead sea tur-tles, 1st edn. Smithsonian Institution, Washington, DC,p 63−78
Mansfield KL, Saba VS, Keinath JA, Musick JA (2009) Satel-lite tracking reveals a dichotomy in migration strategiesamong juvenile loggerhead turtles in the NorthwestAtlantic. Mar Biol 156: 2555−2570
Marcovaldi MA, Chaloupka M (2007) Conservation status ofthe loggerhead sea turtle in Brazil: an encouraging out-look. Endang Species Res 3: 133−143
Martinez-Souza G (2009). Ecologia alimentar da tartarugamarinha cabeçuda (Caretta caretta) no oceano AtlânticoSul Ocidental, Uruguai. MSc dissertation, UniversidadeFederal do Rio Grande
McCarthy MA (2007) Bayesian methods for ecology. Cam-bridge University Press, Cambridge
McClellan CM, Read AJ (2007) Complexity and variation inloggerhead sea turtle life history. Biol Lett 3: 592−594
Milton SL, Lutz PL (2003) Physiological and genetic res -ponses to environment stress. In: Lutz PL, Musick JA,Wyneken J (eds) The biology of sea turtles, Vol 2. CRCPress, Boca Raton, FL, p 163−197
Monteiro DS, Bugoni L, Estima SC (2006) Strandings andsea turtle fisheries interactions along the coast of Rio
Grande do Sul State, Brazil. In: Book of abstracts.Twenty-sixth annual symposium on sea turtle biologyand conservation, 3−8 April 2006, Island of Crete. Inter-national Sea Turtle Society, Athens, p 257 (Abstract)
Moon DY, Mackenzie DS, Owens DW (1997) Simulatedhibernation of sea turtles in the laboratory. I. Feeding,breathing frequency, blood pH, and blood gases. J ExpZool 278: 372−380
Musick JA, Limpus CJ (1996) Habitat utilization and migra-tion in juvenile sea turtles. In: Lutz PL, Musick JA (eds)The biology of sea turtles. CRC Press, New York, NY,p 137−163
Parham JF, Zug JR (1997) Age and growth of loggerhead seaturtles of coastal Georgia: an assessment of skeleto -chronological age-estimates. Bull Mar Sci 61: 287−304
R Development Core Team (2008) R: a language and envi-ronment for statistical computing. R Foundation for Statistical Computing, Vienna. www.R-project.org
Read MA, Grigg GC, Limpus CJ (1996) Body temperatureand winter feeding in immature green turtles, Cheloniamydas, in Moreton Bay, southeastern Queensland. J Her-petol 30: 262−265
Reis EC, Soares LS, Vargas SM, Santos FR and others (2010)Genetic composition, population structure and phylo-geography of the loggerhead sea turtle: colonizationhypothesis for the Brazilian rookeries. Conserv Genet 11: 1467−1477
Reisser J, Proietti M, Kinas PG (2008) Photographic identifi-cation of sea turtles: method description and validation,with an estimation of tag loss. Endang Species Res 5: 73−82
Revelles M, Camiñas JA, Cardona L, Parga M and others(2008) Tagging reveals limited exchange of immatureloggerhead sea turtles (Caretta caretta) betweenregions in the western Mediterranean. Sci Mar 72: 511−518
Schnute J (1981) A versatile growth model with statisticallystable parameters. Can J Fish Aquat Sci 38: 1128−1140
Schofield G, Bishop CM, Katselidis KA, Dimopoulos P, Pantis JD, Hays GC (2009) Microhabitat selection by seaturtles in a dynamic thermal environment. J Anim Ecol78: 14−21
Schwartz FJ (1978) Behavioral and tolerance response tocold water temperatures by three species of sea turtle(Reptilia: Chelonidae) in North Carolina. In: HendersonGE (ed) Proc Fl Interegion Conf Sea Turtle 24–25 July1976. Jensen Beach, FL. Mar Res Publ 33:16–18
Smedstad OM, Holm JC (1996) Validation of back-calcula-tion formulae for cod otoliths. J Fish Biol 49: 973−985
Snover ML (2002) Growth and ontogeny of sea turtles usingskeletochronology: methods, validation and applicationto conservation. PhD dissertation, Duke University,Durham
Snover ML, Hohn AA (2004) Validation and interpretation ofannual skeletal marks in loggerhead (Caretta caretta)and Kemp’s ridley (Lepidochelys kempii) sea turtles. FishRes 102: 682−692
Snover ML, Avens L, Hohn AA (2007) Back-calculatinglength from skeletal growth marks in loggerhead sea turtles Caretta caretta. Endang Species Res 3: 95−104
Spiegelhalter DJ, Best NJ, Carlin BP, van der Linde A (2002)Bayesian measure of model complexity and fit. J R StatSoc B Stat Methodol 64: 583−639
Thomas A, O’Hara B, Ligges U, Sturtz S (2006) MakingBUGS open. R News 6(1): 12−17
267

Mar Ecol Prog Ser 456: 255–268, 2012268
Zug GR, Wynn AH, Ruckdeschel CA (1986) Age determina-tion of loggerhead sea turtle, Caretta caretta, by incre-mental growth marks in the skeleton. Smithson ContribZool 427: 1−34
Zug GR, Balazs GH, Wetherall JA (1995) Growth in juvenileloggerhead sea turtles (Caretta caretta) in the NorthPacific pelagic habitat. Copeia 1995: 484−487
Zug GR, Kalb HJ, Luzar SJ (1997) Age and growth in wildKemp’s ridley sea turtles Lepidochelys kempii from
skeletochronological data. Biol Conserv 80: 261−268Zug GR, Balazs GH, Wetherall JA, Parker DM, Murakawa
SKK (2002) Age and growth of Hawaiian green sea tur-tles (Chelonia mydas): an analysis based on skeleto -chronology. Fish Bull 100: 117−127
Zug GR, Chaloupka M, Balazs GH (2006) Age and growth inolive ridley seaturtles (Lepidochelys olivacea) from theNorth-central Pacific: a skeletochronological analysis.Mar Ecol 27: 263−270
Editorial responsibility: Hans-Heinrich Janssen, Oldendorf/Luhe, Germany
Submitted: February 18, 2011; Accepted: February 17, 2012Proofs received from author(s): May 25, 2012