agco corporation form 10-k
TRANSCRIPT

Table of Contents
UNITED STATESSECURITIES AND EXCHANGE COMMISSION
WASHINGTON, D.C. 20549
FORM 10-K☒ ANNUAL REPORT PURSUANT TO SECTION 13 OR 15(d) OF THE SECURITIES EXCHANGE ACT OF 1934
For the fiscal year ended December 31, 2019OR
☐ TRANSITION REPORT PURSUANT TO SECTION 13 OR 15(d) OF THE SECURITIES EXCHANGE ACT OF 1934 For the transition period from _________ to _________
Commission File Number: 001-12930
AGCO CORPORATION(Exact name of Registrant as specified in its charter)
Delaware 58-1960019
(State or other jurisdiction of incorporation or organization) (I.R.S. Employer Identification No.)
4205 River Green Parkway Duluth, Georgia 30096
(Address of principal executive offices) (Zip Code)
(770) 813-9200(Registrants telephone number, including area code)
Securities registered pursuant to Section 12(b) of the Act:Title of Class Trading Symbol Name of exchange on which registeredCommon stock AGCO New York Stock Exchange
Indicate by check mark if the registrant is a well-known seasoned issuer as defined in Rule 405 of the Securities Act. Yes x No o
Indicate by check mark if the registrant is not required to file reports pursuant to Section 13 or Section 15(d) of the Act. Yes ☐ No x
Indicate by check mark whether the registrant: (1) has filed all reports required to be filed by Section 13 or 15(d) of the Securities Exchange Act of 1934 during the preceding12 months (or for such shorter period that the registrant was required to file such reports), and (2) has been subject to such filing requirements for the past 90 days. Yes x No o
Indicate by check mark whether the registrant has submitted electronically every Interactive Data File required to be submitted pursuant to Rule 405 of Regulation S-T(§232.405 of this chapter) during the preceding 12 months (or for such shorter period that the registrant was required to submit such files). Yes x No o
Indicate by check mark whether the registrant is a large accelerated filer, an accelerated filer, a non-accelerated filer, a smaller reporting company or an emerging growthcompany. See definitions of “large accelerated filer,” “accelerated filer,” “smaller reporting company” and “emerging growth company” in Rule 12b-2 of the ExchangeAct. (Check one):
x Large accelerated filer o Accelerated filer o Non-accelerated filer ☐ Smaller reporting company ☐ Emerging growth companyIf an emerging growth company, indicate by check mark if the registrant has elected not to use the extended transition period for complying with any new or revised financial
accounting standards provided pursuant to Section 13(a) of the Exchange Act. o
Indicate by check mark whether the registrant is a shell company (as defined in Rule 12b-2 of the Exchange Act). Yes ☐ No x
The aggregate market value of AGCO Corporation’s Common Stock (based upon the closing sales price quoted on the New York Stock Exchange) held by non-affiliates asof June 30, 2019 was approximately $4.9 billion. For this purpose, directors and officers and the entities that they control have been assumed to be affiliates. As of February 24,2020, 75,465,353 shares of AGCO Corporation’s Common Stock were outstanding.
Documents Incorporated by Reference
Portions of AGCO Corporation's Proxy Statement for the 2020 Annual Meeting of Stockholders are incorporated by reference into Part III of this Form 10-K.

Table of Contents
TABLE OF CONTENTSPART I Item 1. Business Item 1A. Risk Factors Item 1B. Unresolved Staff Comments Item 2. Properties Item 3. Legal Proceedings Item 4. Mine Safety DisclosuresPART II Item 5. Market For Registrant’s Common Equity, Related Stockholder Matters and Issuer Purchases of Equity Securities Item 6. Selected Financial Data Item 7. Management’s Discussion and Analysis of Financial Condition and Results of Operations Item 7A. Quantitative and Qualitative Disclosures About Market Risk Item 8. Financial Statements and Supplementary Data Item 9. Changes in and Disagreements with Accountants on Accounting and Financial Disclosure Item 9A. Controls and Procedures Item 9B. Other InformationPART III Item 10. Directors, Executive Officers and Corporate Governance Item 11. Executive Compensation Item 12. Security Ownership of Certain Beneficial Owners and Management and Related Stockholder Matters Item 13. Certain Relationships and Related Transactions, and Director Independence Item 14. Principal Accounting Fees and ServicesPART IV Item 15. Exhibits and Financial Statement Schedules Item 16. Form 10-K SummarySIGNATURES

Table of Contents
PART I
Item 1. Business
AGCO Corporation (“AGCO,” “we,” “us” or the “Company”) was incorporated in Delaware in 1991. Our executive offices are located at 4205River Green Parkway, Duluth, Georgia 30096, and our telephone number is (770) 813-9200. Unless otherwise indicated, all references in this Form 10-K tothe Company include our subsidiaries.
General
We are a leading manufacturer and distributor of agricultural equipment and related replacement parts throughout the world. We sell a full range ofagricultural equipment, including tractors, combines, self-propelled sprayers, hay tools, forage equipment, seeding and tillage equipment, implements, andgrain storage and protein production systems. Our products are widely recognized in the agricultural equipment industry and are marketed under a number ofwell-known brands, including Challenger®, Fendt®, GSI®, Massey Ferguson® and Valtra®. We distribute most of our products through approximately 3,275independent dealers and distributors in approximately 140 countries. We also provide retail and wholesale financing through our finance joint ventures withCoöperatieve Centrale Raiffeisen-Boerenleenbank B.A., which we refer to as “Rabobank.”
Products
The following table sets forth a description of the Company’s products and their percentage of net sales:
Percentage of Net Sales
Product Product Description 2019(1) 2018(1) 2017Tractors • High horsepower tractors (100 to 650 horsepower); typically used on large acreage farms, primarily for row crop
production, soil cultivation, planting, land leveling, seeding and commercial hay operations. 57%
57%
57%
• Utility tractors (40 to 130 horsepower); typically used on small- and medium-sized farms and in specialty agricultural
industries, including dairy, livestock, orchards and vineyards
• Compact tractors (under 40 horsepower); typically used on small farms and specialty agricultural industries, as well as for
landscaping, equestrian and residential uses Replacement Parts • Replacement parts for all of the products we sell, including products no longer in production. Most of our products can be
economically maintained with parts and service for a period of ten to 20 years. Our parts inventories are maintained anddistributed through a network of master and regional warehouses throughout North America, South America, Europe,Africa, China and Australia in order to provide timely response to customer demand for replacement parts
15%
14%
16%
Grain Storage and ProteinProduction Systems
• Grain storage bins and related drying and handling equipment systems; seed-processing systems; swine and poultry feedstorage and delivery, ventilation and watering systems; and egg production systems and broiler production equipment
11%
12%
13%
Hay Tools and ForageEquipment, Implements& Other Equipment
• Round and rectangular balers, loader wagons, self-propelled windrowers, forage harvesters, disc mowers, spreaders, rakes,tedders, and mower conditioners; used for the harvesting and packaging of vegetative feeds used in the cattle, dairy, horseand renewable fuel industries
10%
10%
7%
• Implements, including disc harrows, which cut through crop residue, leveling seed beds and mixing chemicals with the
soils; heavy tillage, which break up soil and mix crop residue into topsoil, with or without prior discing; field cultivators,which prepare a smooth seed bed and destroy weeds; and drills, which are primarily used for small grain seeding
• Planters and other planting equipment; used to plant seeds and apply fertilizer in the field, typically used for row crops,
including planting technologies that cover the areas of monitoring and measurement, liquid control and delivery, meteraccuracy and seed delivery
• Other equipment, including loaders; used for a variety of tasks, including lifting and transporting hay crops Combines • Combines, sold with a variety of threshing technologies and complemented by a variety of crop-harvesting heads;
typically used in harvesting grain crops such as corn, wheat, soybeans and rice 3%
3%
4%
Application Equipment • Self-propelled, three- and four-wheeled vehicles and related equipment; for use in the application of liquid and dryfertilizers and crop protection chemicals both prior to planting crops (“pre-emergence”) and after crops emerge from theground (“post-emergence”)
3%
3%
3%
____________________________________(1) The summation of these individual percentages does not total due to rounding.
1

Table of Contents
Smart Farming Technologies
We offer smart solutions to the farmer to optimize farming performance while improving ease of use. Our strategy is based upon an open approach todata management leveraging existing solutions offered by partnering with industry leaders while integrating AGCO products and innovation. These smartfarming technologies are based on connectivity, automation and digitalization and include satellite-based steering, field data collection, product self-adjustment, yield-mapping and telemetry-based fleet management systems. Our Fuse® and other smart-farming technologies support our products, brands andthe aftermarket with a comprehensive and customizable suite of solutions, enabling farmers to make individual, data based decisions in order to reduce costsand maximize efficiency, yields and profitability of their farms. A significant number of these technologies are developed by third parties and are integratedinto our products. We believe that these products and related devices are highly valued by professional farmers globally and are integral to the current andfuture growth of our equipment sales and revenues.
Marketing and Distribution
We distribute products primarily through a network of independent dealers and distributors. Our dealers are responsible for retail sales of equipmentto end users and after-sales service and support. Our distributors may sell our products through networks of dealers supported by the distributors, and ourdistributors also may directly market our products and provide customer service support. Our sales are not dependent on any specific dealer, distributor orgroup of dealers.
In some countries, we utilize associates and licensees to provide a distribution channel for our products and a source of low-cost production forcertain Massey Ferguson and Valtra products. Associates are entities in which we have an ownership interest, most notably in India. Licensees are entities inwhich we have no ownership interest. An associate or licensee generally has the exclusive right to produce and sell Massey Ferguson or Valtra equipment inits licensed territory under these tradenames, but may not sell these products outside the licensed territory. We generally license certain technology to theseassociates and licensees, and we may sell them certain components used in local manufacturing operations.
Independent Dealers and
Distributors Percent of Net SalesGeographical Region 2019 2019 2018(1) 2017Europe 770 58% 57% 53%North America 1,875 24% 23% 23%South America 250 9% 10% 13%Rest of World (2) 380 9% 9% 11%____________________________________(1) The summation of these individual percentages does not total due to rounding.(2) Consists of approximately 60 countries in Africa, the Middle East, Australia and Asia.
Dealer Support and Supervision
We believe that one of the most important criteria affecting a farmer’s decision to purchase a particular brand of equipment is the quality of thedealer who sells and services the equipment. We support our dealers in order to improve the quality of our dealer network. We monitor each dealer’sperformance and profitability and establish programs that focus on continuous dealer improvement. Our dealers generally have sales territories for which theyare responsible.
We believe that our ability to offer our dealers a full product line of agricultural equipment and related replacement parts, as well as our ongoingdealer training and support programs focusing on business and inventory management, sales, marketing, warranty and servicing matters and products, helpsensure the vitality and increase the competitiveness of our dealer network. We also maintain dealer advisory groups to obtain dealer feedback on ouroperations.
We provide our dealers with volume sales incentives, demonstration programs and other advertising support to assist sales. We design our salesprograms, including retail financing incentives, and our policies for maintaining parts and service availability with extensive product warranties to enhanceour dealers’ competitive position.
2

Table of Contents
Manufacturing and Suppliers
Manufacturing and Assembly
We manufacture and assemble our products in 45 locations worldwide, including four locations where we operate joint ventures. Our locations areintended to optimize capacity, technology or local costs. Furthermore, we continue to balance our manufacturing resources with externally-sourcedmachinery, components and/or replacement parts to enable us to better control costs, inventory levels and our supply of components. We believe that ourmanufacturing facilities are sufficient to meet our needs for the foreseeable future. Refer to Item 2, “Properties,” where a listing of our principalmanufacturing locations is presented.
Our AGCO Power engines division produces diesel engines, gears and generating sets. The diesel engines are manufactured for use in a portion ofour tractors, combines and sprayers, and also are sold to third parties. AGCO Power specializes in the manufacturing of off-road engines in the 75 to 600horsepower range.
Third-Party Suppliers
We externally source some of our machinery, components and replacement parts from third-party suppliers. Our production strategy is intended tooptimize our research and development and capital investment requirements and to allow us greater flexibility to respond to changes in market conditions.
We purchase some fully-manufactured tractors from Tractors and Farm Equipment Limited (“TAFE”), Carraro S.p.A. and Iseki & Company,Limited. We also purchase other tractors, implements and hay and forage equipment from various third-party suppliers. Refer to Note 14 of our ConsolidatedFinancial Statements contained in Item 8, “Financial Statements and Supplementary Data,” for further discussion of our relationship with TAFE.
In addition to the purchase of machinery, third-party suppliers supply us with significant components used in our manufacturing operations. Weselect third-party suppliers that we believe are low cost, high quality and possess the most appropriate technology.
We also assist in the development of these products or component parts based upon our own design requirements. Our past experience with outsidesuppliers generally has been favorable.
Seasonality
Generally, retail sales by dealers to farmers are highly seasonal and largely are a function of the timing of the planting and harvesting seasons. To theextent possible, we attempt to ship products to our dealers and distributors on a level basis throughout the year to reduce the effect of seasonal retail demandson our manufacturing operations and to minimize our investment in inventory. Our financing requirements are subject to variations due to seasonal changes inworking capital levels, which typically increase in the first half of the year and then decrease in the second half of the year. The fourth quarter is also typicallya period for higher retail sales because of our customers’ year-end tax planning considerations, the increase in the availability of funds from completedharvests and the timing of dealer incentives.
Competition
The agricultural industry is highly competitive. We compete with several large national and international full-line suppliers, as well as numerousshort-line and specialty manufacturers with differing manufacturing and marketing methods. Our two principal competitors on a worldwide basis are Deere &Company and CNH Industrial N.V. We have regional competitors around the world that have significant market share in a single country or a group ofcountries.
We believe several key factors influence a buyer’s choice of farm equipment, including the strength and quality of a company’s dealers, the qualityand pricing of products, dealer or brand loyalty, product availability, terms of financing and customer service. See “Marketing and Distribution” for additionalinformation.
Engineering and Research
We make significant expenditures for engineering and applied research to improve the quality and performance of our products, to develop newproducts and to comply with government safety and engine emissions regulations.
3

Table of Contents
Wholesale Financing
Primarily in the United States and Canada, we engage in the standard industry practice of providing dealers with floor plan payment terms for theirinventories of farm equipment for extended periods, generally through our AGCO Finance joint ventures. The terms of our wholesale finance agreementswith our dealers vary by region and product line, with fixed payment schedules on all sales, generally ranging from one to 12 months. In the United States andCanada, dealers typically are not required to make an initial down payment, and our terms allow for an interest-free period generally ranging from one to12 months, depending on the product. Amounts due from sales to dealers in the United States and Canada are immediately due upon a retail sale of theunderlying equipment by the dealer, with the exception of sales of grain storage and protein production systems, as discussed further below. If not previouslypaid by the dealer, installment payments generally are required beginning after the interest-free period with the remaining outstanding equipment balancegenerally due within 12 months after shipment. In limited circumstances, we provide sales terms, and in some cases, interest-free periods that are longer than12 months for certain products. These typically are specified programs, predominantly in the United States and Canada, where interest is charged after aperiod of up to 24 months, depending on various factors including dealers' sales volumes during the preceding year. We also provide financing to dealers onused equipment accepted in trade. We generally obtain a security interest in the new and used equipment we finance.
Typically, sales terms outside the United States and Canada are of a shorter duration, generally ranging from 30 to 180 days. In many cases, weretain a security interest in the equipment sold on extended terms. In certain international markets, our sales are generally backed by letters of credit or creditinsurance.
Sales of grain storage and protein production systems both in the United States and in other countries generally are payable within 30 days ofshipment. In certain countries, sales of such systems for which the Company is responsible for construction or installation may be contingent upon customeracceptance. Payment terms vary by market and product, with fixed payment schedules on all sales.
We have accounts receivable sales agreements that permit transferring, on an ongoing basis, a majority of our wholesale receivables in NorthAmerica, Europe and Brazil to our AGCO Finance joint ventures in the United States, Canada, Europe and Brazil. Upon transfer, the wholesale receivablesmaintain standard payment terms, including required regular principal payments on amounts outstanding and interest charges at market rates. Qualifieddealers may obtain additional financing through our U.S., Canadian, European and Brazilian finance joint ventures at the joint ventures’ discretion. Inaddition, our AGCO Finance joint ventures may provide wholesale financing directly to dealers in Europe, Brazil and Australia.
Retail Financing
Our AGCO Finance joint ventures offer financing to most of the end users of our products. Besides contributing to our overall profitability, theAGCO Finance joint ventures enhance our sales efforts by tailoring retail finance programs to prevailing market conditions. Our finance joint ventures arelocated in the United States, Canada, Europe, Brazil, Argentina and Australia and are owned by AGCO and by a wholly-owned subsidiary of Rabobank.Refer to “Finance Joint Ventures” within Item 7, “Management’s Discussion and Analysis of Financial Condition and Results of Operations,” for furtherinformation.
In addition, Rabobank is the primary lender with respect to our credit facility and our senior term loan, as are more fully described in “Liquidity andCapital Resources” within Item 7, “Management’s Discussion and Analysis of Financial Condition and Results of Operations.” Our historical relationshipwith Rabobank has been strong, and we anticipate its continued long-term support of our business.
Intellectual Property
We own and have licenses to the rights under a number of domestic and foreign patents, trademarks, trade names and brand names relating to ourproducts and businesses. We defend our patent, trademark and trade and brand name rights primarily by monitoring competitors’ machines and industrypublications and conducting other investigative work. We consider our intellectual property rights, including our right to use our trade and brand names,important in the operation of our businesses. However, we do not believe we are dependent on any single patent, trademark, trade name, brand name or groupof patents or trademarks, trade names or brand names. We intend to maintain the separate strengths and identities of our core brand names and product lines.
4

Table of Contents
Environmental Matters and Regulation
We are subject to environmental laws and regulations concerning emissions to the air, discharges of processed or other types of wastewater, and thegeneration, handling, storage, transportation, treatment and disposal of waste materials. These laws and regulations are constantly changing, and the effectsthat they may have on us in the future are impossible to accurately predict. It is our policy to comply with all applicable environmental, health and safety lawsand regulations. We believe that any expense or liability we may incur in connection with noncompliance with laws or regulations or the cleanup of any ofour properties will not have a materially adverse effect on us.
The engines manufactured by our AGCO Power engine division, which specializes in the manufacturing of non-road engines in the 75 to 600horsepower range, currently comply with emissions standards and related requirements set by European, Brazilian and U.S. regulatory authorities, includingboth the United States Environmental Protection Agency and various state authorities. We expect to meet future emissions requirements through theintroduction of new technology to our engines and exhaust after-treatment systems, as necessary. In some markets, such as the United States, we must obtaingovernmental environmental approvals in order to import our products, and these approvals can be difficult or time-consuming to obtain or may not beobtainable at all. For example, our AGCO Power engine division and our engine suppliers are subject to air quality standards, and production at our facilitiescould be impaired if AGCO Power and these suppliers are unable to timely respond to any changes in environmental laws and regulations affecting engineemissions, including the emissions of greenhouse gases (“GHG”). Compliance with environmental and safety regulations has added, and will continue to add,to the cost of our products and increase the capital-intensive nature of our business.
Climate change, as a result of emissions of GHG, is a significant topic of discussion and may generate U.S. and other regulatory responses. It isimpracticable to predict with any certainty the impact on our business of climate change or the regulatory responses to it, although we recognize that theycould be significant. The most direct impacts are likely to be an increase in energy costs, which would increase our operating costs (through increased utilityand transportation costs) and an increase in the costs of the products we purchase from others. In addition, increased energy costs for our customers couldimpact demand for our equipment. It is too soon for us to predict with any certainty the ultimate impact of additional regulation, either directionally orquantitatively, on our overall business, results of operations or financial condition.
Regulation and Government Policy
Domestic and foreign political developments and government regulations and policies directly affect the agricultural industry and indirectly affectthe agricultural equipment business in the United States and abroad. The application, modification or adoption of laws, regulations or policies could have anadverse effect on our business.
We have manufacturing facilities or other physical presence in approximately 33 countries and sell our products in approximately 140 countries. Thissubjects us to a range of trade, product, foreign exchange, employment, tax and other laws and regulations, in addition to the environmental regulationsdiscussed previously, in a significant number of jurisdictions. Many jurisdictions and a variety of laws regulate the contractual relationships with our dealers.These laws impose substantive standards on the relationships between us and our dealers, including events of default, grounds for termination, non-renewal ofdealer contracts and equipment repurchase requirements. Such laws could adversely affect our ability to terminate our dealers.
In addition, each of the jurisdictions within which we operate or sell products has an important interest in the success of its agricultural industry andthe consistency of the availability of reasonably priced food sources. These interests result in active political involvement in the agricultural industry, which,in turn, can impact our business in a variety of ways.
Corporate Social Responsibility
For AGCO, corporate social responsibility is a core business imperative that underlies our strategy to build a more valuable enterprise through long-term economic, social and environmental sustainability in support of our key stakeholders and AGCO communities. This aligns with our vision to providehigh-tech solutions for farmers feeding the world. To achieve that vision, we seek opportunities in every aspect of the AGCO agricultural value chain toaddress many of today’s most significant challenges, including food security, farmer livelihood and resource efficiency. We see efficiency as key tosustainable agriculture and achieving the United Nations Sustainable Development Goals related to minimizing the environmental impact of farming andending hunger.
Our products and processes address significant long-term issues, including (1) the reduction of fuel (carbon) usage and related emissions inconnection with the engines contained in the equipment that we manufacture, (2) the minimization of other inputs used by farmers, e.g., seeds, fertilizer,pesticide, and water, through smart farming technology and equipment, (3)
5
Table of Contents
improved crop storage and animal welfare, and (4) the reduction in our consumption of natural resources in the production of the equipment that wemanufacture. For example, for U.S. equipment, our engines now are Tier 4 compliant and, in Europe, they now are Stage V compliant; in both casesrepresenting meaningful reductions in fuel usage and greenhouse gases in our two largest markets. In addition, our sprayer equipment is equipped withvariable rate technology, nozzle controls and positioning systems that allow farmers to precisely apply nutrients and chemicals which result in overall reducedchemical and fertilizer usage.
Our efforts include the AGCO Future Farm and training center in Zambia, which teaches farmers how to farm more sustainably, with focusedefficiency, while preserving soil health and reducing post-harvest loss. Additionally, our AGCO Agriculture Foundation, initiated by AGCO in 2018, is aprivate foundation with the vision to prevent and relief hunger. The foundation initiates impactful programs that support food security, foster sustainableagricultural development and build needed agricultural infrastructure in marginalized farming communities. We launched the AGCO Agriculture Foundationto focus our philanthropy on building needed agricultural infrastructure to help feed the world sustainably and equitably.
Employees
As of December 31, 2019, we employed approximately 21,000 employees, including approximately 4,650 employees in the United States andCanada. A majority of our employees at our manufacturing facilities, both domestic and international, are represented by collective bargaining agreementsand union contracts with terms that expire on varying dates. We currently do not expect any significant difficulties in renewing these agreements.
Available Information
Our Internet address is www.agcocorp.com. We make the following reports filed by us available, free of charge, on our website under the heading“SEC Filings” in our website’s “Investors” section:
• annual reports on Form 10-K;• quarterly reports on Form 10-Q;• current reports on Form 8-K;• proxy statements for the annual meetings of stockholders; and• reports on Form SD.
These reports are made available on our website as soon as practicable after they are filed with the Securities and Exchange Commission (“SEC”).The SEC also maintains a website (www.sec.gov) that contains our reports and other information filed with the SEC.
We also provide corporate governance and other information on our website. This information includes:
• charters for the standing committees of our board of directors, which are available under the heading “Charters of the Committees of the Board”in the “Governance, Committees, & Charters” section of the “Corporate Governance” section of our website located under “Investors,” and
• our Global Code of Conduct, which is available under the heading “Global Code of Conduct” in the “Corporate Governance” section of ourwebsite located under “Investors.”
In addition, in the event of any waivers of our Global Code of Conduct, those waivers will be available under the heading “Corporate Governance”of our website. None of these materials, including the other materials available on our website, is incorporated by reference into this Form 10-K unlessexpressly provided.
6

Table of Contents
Item 1A. Risk Factors
We make forward-looking statements in this report, in other materials we file with the SEC, on our website, or otherwise release to the public. Inaddition, our senior management makes forward-looking statements orally to analysts, investors, the media and others. Statements, including the statementscontained in Item 7, “Management’s Discussion and Analysis of Financial Condition and Results of Operations,” concerning our future operations, prospects,strategies, products, manufacturing facilities, legal proceedings, financial condition, financial performance (including growth and earnings) and demand forour products and services, and other statements of our plans, beliefs or expectations, net sales, industry conditions, currency translation impacts, marketdemand, farm incomes, weather conditions, commodity prices, general economic conditions, availability of financing, working capital, capital expenditures,debt service requirements, margins, production volumes, cost reduction initiatives, investments in product development, compliance with financial covenants,support from lenders, recovery of amounts under guarantee, uncertain income tax provisions, funding of our pension and postretirement benefit plans, orrealization of net deferred tax assets, are forward-looking statements. The forward-looking statements we make are not guarantees of future performance andare subject to various assumptions, risks and other factors that could cause actual results to differ materially from those suggested by the forward-lookingstatements. These factors include, among others, those set forth below and in the other documents that we file with the SEC. There also are other factors thatwe may not describe, generally because we currently do not perceive them to be material, or likely to become material, that could cause actual results to differmaterially from our expectations.
These risks could impact our business in a number of ways, including by negatively impacting our future results of operations, cash flows andfinancial condition. For simplicity, below we collectively refer to these impacts as our “performance.”
We expressly disclaim any obligation to update or revise any forward-looking statements, whether as a result of new information, future events orotherwise, except as required by law.
Our financial results depend entirely upon the agricultural industry, and factors that adversely affect the agricultural industry generally, includingdeclines in the general economy, increases in farm input costs, weather conditions and lower commodity prices, will adversely affect us.
Our success depends entirely on the vitality of the agricultural industry. Historically, the agricultural industry has been cyclical and subject to avariety of economic and other factors. Sales of agricultural equipment, in turn, also are cyclical and generally reflect the economic health of the agriculturalindustry. The economic health of the agricultural industry is affected by numerous factors, including farm income, farm input costs, land values and debtlevels, all of which are influenced by levels of commodity prices, acreage planted, crop yields, agricultural product demand (including crops used asrenewable energy sources), government policies and government subsidies. The economic health also is influenced by general economic conditions, interestrate and exchange rate levels, and the availability of financing for retail customers, including financing subsidies to farmers, which can be significant incountries such as Brazil. Trends in the agricultural industry, such as farm consolidations, may affect the agricultural equipment market. In addition, weatherconditions, such as floods, heat waves or droughts, and pervasive livestock or crop diseases affect farmers’ buying decisions. Downturns in the agriculturalindustry due to these or other factors, which could vary by market, can result in decreases in demand for agricultural equipment, which would adversely affectour performance. Moreover, the unpredictable nature of many of these factors and the resulting volatility in demand make it difficult for us to accuratelypredict sales and optimize production. This, in turn, can result in higher costs, including inventory carrying costs and underutilized manufacturing capacity.During previous downturns in the agricultural industry, we experienced significant and prolonged declines in our performance, and we expect our business toremain subject to similar market fluctuations in the future.
The agricultural equipment industry is highly seasonal, and seasonal fluctuations significantly impact our performance.
The agricultural equipment business is highly seasonal, which causes our quarterly results and our cash flow to fluctuate during the year. Farmersgenerally purchase agricultural equipment in the Spring and Fall in conjunction with the major planting and harvesting seasons. In addition, the fourth quartertypically is a significant period for retail sales because of year-end tax planning considerations, the increase in availability of funds from completed harvests,and the timing of dealer incentives. Our net sales and income from operations historically have been the lowest in the first quarter and have increased insubsequent quarters as dealers anticipate increased retail sales in subsequent quarters.
7

Table of Contents
Most of our sales depend on the availability of financing to retail customers, and any disruption in their ability to obtain financing, whether due toeconomic downturns or otherwise, will result in the sale of fewer products by us. In addition, the collectability of receivables that are created from oursales, as well as from such retail financing, is critical to our business.
Most retail sales of our products are financed, either by our AGCO Finance joint ventures or by a bank or other private lender. The AGCO Financejoint ventures, which are controlled by Rabobank and are dependent upon Rabobank for financing as well, finance approximately 40% to 50% of the retailsales of our tractors and combines in the markets where the joint ventures operate. Any difficulty by Rabobank in continuing to provide that financing, or anybusiness decision by Rabobank as the controlling member not to fund the business or particular aspects of it (for example, a particular country or region),would require the joint ventures to find other sources of financing (which may be difficult to obtain) or would require us to find other sources of retailfinancing for our dealers and their retail customers, or our dealers and their retail customers would be required to utilize other retail financing providers. In aneconomic downturn, we expect that financing for capital equipment purchases generally would become more difficult or more expensive to obtain. To theextent that financing is not available, or available only at unattractive prices, our sales would be negatively impacted.
Both AGCO and our AGCO Finance joint ventures have substantial accounts receivable from dealers and retail customers, and we both areadversely impacted when the collectability of these receivables is not consistent with historical experience. This collectability is dependent on the financialstrength of the agricultural industry, which in turn is dependent upon the factors discussed elsewhere in this “Risk Factors” section. In addition, the AGCOFinance joint ventures may project estimated credit losses that exceed expectations and adversely affect their financial condition and results of operations.The finance joint ventures lease equipment as well and also may experience residual value losses that exceed expectations caused by lower pricing for usedequipment and higher than expected returns at lease maturity. To the extent that defaults and losses are higher than expected, our equity in the net earnings ofthe finance joint ventures would be less, or there could be losses, which could materially impact our performance.
Our success depends on the introduction of new products, which requires substantial expenditures.
Our long-term results depend upon our ability to introduce and market new products successfully. The success of our new products will depend on anumber of factors, including:
• innovation;• customer acceptance;• the efficiency of our suppliers in providing component parts and of our manufacturing facilities in producing final products; and• the performance and quality of our products relative to those of our competitors.
As both we and our competitors continuously introduce new products or refine versions of existing products, we cannot predict the level of marketacceptance or the amount of market share our new products will achieve. We have experienced delays in the introduction of new products in the past, and wemay experience delays in the future. Any delays or other problems with our new product launches will adversely affect our performance. In addition,introducing new products can result in decreases in revenues from our existing products. Consistent with our strategy of offering new products and productrefinements, we expect to make substantial investments in product development and refinement. We may need more funding for product development andrefinement than is readily available, which could adversely affect our business.
Our expansion plans in emerging markets entail significant risks.
Our long-term strategy includes establishing a greater manufacturing and supply-chain and/or marketing presence in emerging markets such as India,China and Africa. As we progress with these efforts, it will involve a significant investment of capital and other resources and entail various risks. Theseinclude risks attendant to obtaining necessary governmental approvals and the construction of facilities in a timely manner and within cost estimates, theestablishment of supply channels, the commencement of efficient manufacturing operations, and, ultimately, the acceptance of the products by retailcustomers. While we expect the expansion to be successful, should we encounter difficulties involving these or similar factors, it may not be as successful aswe anticipate.
8

Table of Contents
We face significant competition, and, if we are unable to compete successfully against other agricultural equipment manufacturers, we will lose dealersand their retail customers and our net sales and profitability will decline.
The agricultural equipment business is highly competitive, particularly in our major markets. Our two key competitors, Deere & Company and CNHIndustrial N.V., are substantially larger than we are and have greater financial and other resources. In addition, in some markets, we compete with smallerregional competitors with significant market share in a single country or group of countries. Our competitors may substantially increase the resources devotedto the development and marketing, including discounting, of products that compete with our products, which would necessitate our making similarexpenditures. In addition, competitive pressures in the agricultural equipment business may affect the market prices of new and used equipment, which, inturn, may adversely affect our performance.
We maintain an independent dealer and distribution network in the markets where we sell products. The financial and operational capabilities of ourdealers and distributors are critical to our ability to compete in these markets. In addition, we compete with other manufacturers of agricultural equipment fordealers. If we are unable to compete successfully against other agricultural equipment manufacturers, we could lose dealers and their retail customers andperformance may decline.
Rationalization or restructuring of manufacturing facilities, and plant expansions and system upgrades at our manufacturing facilities, may causeproduction capacity constraints and inventory fluctuations.
The rationalization of our manufacturing facilities has at times resulted in, and similar rationalizations or restructurings in the future may result in,temporary constraints upon our ability to produce the quantity of products necessary to fill orders and thereby complete sales in a timely manner. In addition,system upgrades at our manufacturing facilities that impact ordering, production scheduling, manufacturing and other related processes are complex, andcould impact or delay production. A prolonged delay in our ability to fill orders on a timely basis could affect customer demand for our products and increasethe size of our product inventories, causing future reductions in our manufacturing schedules and adversely affecting our performance. Moreover, ourcontinuous development and production of new products often involve the retooling of existing manufacturing facilities. This retooling may limit ourproduction capacity at certain times in the future, which could adversely affect our performance. In addition, the expansion and reconfiguration of existingmanufacturing facilities, as well as the start-up of new manufacturing operations in emerging markets, such as China and Russia, could increase the risk ofproduction delays, as well as require significant investments.
Our business will be adversely impacted if the coronavirus outbreak spreads widely or otherwise impacts our manufacturing and supply chain or demandfor our products
The extent that the coronavirus outbreak will spread widely and its impact on our results will depend on future developments, which are highlyuncertain and unpredictable. We have factories and suppliers in China and Italy, where the early outbreaks have been significant and where production of ourproducts could be directly impacted by actions taken to contain the virus. The virus could spread to areas in other countries where we have other factories andsuppliers. In response to intensifying efforts to contain the spread of this coronavirus, we have limited travel by our employees and stopped travel by ouremployees to certain countries. In addition, our factories are dependent upon parts and components manufactured by others, and to the extent that oursuppliers are impacted by the virus it likely will reduce the availability, or result in delays, of parts and components to us, which in turn could interrupt ourability to produce and sell completed products. Recently there have been circumstances of freight channels being interrupted and increases in the freightprices, which also could impact our business. While we do not anticipate a significant impact upon demand for our products, in the event that the virusspreads widely, or there are negative impacts to economic conditions and resulting farmer confidence, there could be a reduction in market demand or delaysin sales.
We depend on suppliers for components, parts and raw materials for our products, and any failure by our suppliers to provide products as needed, or byus to promptly address supplier issues, will adversely impact our ability to timely and efficiently manufacture and sell products. We also are subject to rawmaterial price fluctuations, which can adversely affect our manufacturing costs.
Our products include components and parts manufactured by others. As a result, our ability to timely and efficiently manufacture existing products,to introduce new products and to shift manufacturing of products from one facility to another depends on the quality of these components and parts and thetimeliness of their delivery to our facilities. At any particular time, we depend on numerous suppliers, and the failure by one or more of our suppliers toperform as needed will result in fewer products being manufactured, shipped and sold. If the quality of the components or parts provided by our suppliers isless than required and we do not recognize that failure prior to the shipment of our products, we will incur higher warranty costs. The timely supply ofcomponent parts for our products also depends on our ability to manage our relationships with suppliers,
9

Table of Contents
to identify and replace suppliers that fail to meet our schedules or quality standards, and to monitor the flow of components and accurately project our needs.The shift from our existing suppliers to new suppliers, including suppliers in emerging markets, also may impact the quality and efficiency of ourmanufacturing capabilities, as well as warranty costs.
Changes in the availability and prices of certain raw materials, components and parts could result in production disruptions or increased costs andlower profits on the sale of our products. Changes in the availability and price of these raw materials, components and parts, which have fluctuatedsignificantly in the past and are more likely to fluctuate during times of economic volatility, as well as regulatory instability or change in tariffs, cansignificantly increase the costs of production. This, in turn, could have a material negative effect on performance, particularly if, due to pricing considerationsor other factors, we are unable to recover the increased costs through pricing from our dealers.
A majority of our sales and manufacturing take place outside the United States, and, as a result, we are exposed to risks related to foreign laws, taxes,economic conditions, labor supply and relations, political conditions and governmental policies as well as U.S. laws governing who we sell to and how weconduct business. These risks may delay or reduce our realization of value from our international operations.
A majority of our sales are derived from sales outside the United States. The foreign countries in which our sales are the greatest are Germany,France, Brazil, the United Kingdom, Finland and Canada. We have significant manufacturing operations in France, Germany, Brazil, Italy and Finland, andwe have established manufacturing operations in emerging markets, such as China. Many of our sales involve products that are manufactured in one countryand sold in a different country, and, therefore, our performance can be adversely affected by adverse changes, in either the country of origin or the country ofdestination, in the factors discussed elsewhere in this "Risk Factors" section, particularly the factors that impact the delivered cost of our products. Ourbusiness practices in these foreign countries generally must comply with U.S. law, including limitations on where and to whom we may sell products and theForeign Corrupt Practices Act (“FCPA”). We have a compliance program in place designed to reduce the likelihood of potential violations of these laws, but itis difficult to identify and prevent violations. Significant violations could subject us to fines and other penalties as well as increased compliance costs. Someof our international operations also are, or might become, subject to various risks that are not present in domestic operations, including restrictions ondividends and the repatriation of funds. Foreign developing markets may present special risks, such as unavailability of financing, inflation, slow economicgrowth, price controls and difficulties in complying with U.S. regulations.
Domestic and foreign political developments and government regulations and policies directly affect the international agricultural industry, whichaffects the demand for agricultural equipment. If demand for agricultural equipment declines, our performance will be adversely affected. The application,modification or adoption of laws, regulations, trade agreements or policies adversely affecting the agricultural industry, including the imposition of importand export duties and quotas, expropriation and potentially burdensome taxation, could have an adverse effect on our business. Trade restrictions, includingpotential withdrawal from or modification of existing trade agreements, negotiation of new trade agreements, and imposition of new (and retaliatory) tariffsagainst certain countries or covering certain products, could limit our ability to capitalize on current and future growth opportunities in the internationalmarkets in which we operate and impair our ability to expand our business by offering new technologies, products and services. These changes also canimpact the cost of the products we manufacture, including the cost of steel. These trade restrictions and changes in, or uncertainty surrounding, global tradepolicy may affect our competitive position.
The health of the agricultural industry and the ability of our international dealers and retail customers to operate their businesses, in general, areaffected by domestic and foreign government programs that provide economic support to farmers. As a result, farm income levels and the ability of farmers toobtain advantageous financing and other protections would be reduced to the extent that any such programs are curtailed or eliminated. Any such reductionslikely would result in a decrease in demand for agricultural equipment. For example, a decrease or elimination of current price protections for commodities orof subsidy payments for farmers in the European Union, the United States, Brazil or elsewhere in South America would negatively impact the operations offarmers in those regions, and, as a result, our sales may decline if these farmers delay, reduce or cancel purchases of our products. In emerging markets, someof these (and other) risks can be greater than they might be elsewhere. In addition, in some cases, the financing provided by the AGCO Finance joint venturesor by others is supported by a government subsidy or guarantee. The programs under which those subsidies and guarantees are provided generally are oflimited duration and subject to renewal and contain various caps and other limitations. In some markets, for example Brazil, this support is quite significant.In the event the governments that provide this support elect not to renew these programs, and were financing not available on reasonable terms, whetherthrough our joint ventures or otherwise, our performance would be negatively impacted.
10
Table of Contents
As a result of the multinational nature of our business and the acquisitions that we have made over time, our corporate and tax structures arecomplex, with a significant portion of our operations being held through foreign holding companies. As a result, it can be inefficient, from a tax perspective,for us to repatriate or otherwise transfer funds, and we may be subject to taxation from multiple tax jurisdictions. In addition, we must comply with a greaterlevel of tax-related regulation and reviews by multiple governmental units than would companies with a more simplified structure. Our foreign andU.S. operations also routinely sell products to, and license technology to other operations of ours. The pricing of these intra-company transactions is subject toregulation and review as well. While we make every effort to comply with all applicable tax laws, audits and other reviews by governmental units could resultin our being required to pay additional taxes, interest and penalties.
Brexit and political uncertainty in the United Kingdom and the European Union could disrupt our operations and adversely affect our performance.
We have significant operations in the United Kingdom. The United Kingdom withdrew from the European Union on January 31, 2020 and is now ina period of transition which currently is stated to continue until the end of 2020. The transitional period maintains all existing trading arrangements. Thecurrent rules on trade, travel, and business for the United Kingdom and the European Union will continue to apply through the transitional period duringwhich time the United Kingdom and the European Union will negotiate future trading arrangements. Uncertainty related to the withdrawal of the UnitedKingdom from the European Union, and the outcome of the negotiations related to future trade and other arrangements, may reduce demand for our productsand services and may increase the costs and difficulty of doing business in the United Kingdom and the European Union.
Brexit also may result in significant changes in the British regulatory environment, which likely would increase our compliance costs. We may find itmore difficult to conduct business in the United Kingdom and the European Union, as Brexit may result in increased regulatory complexity and increasedrestrictions on the movement of capital, goods and personnel. Depending on the outcome of negotiations between the United Kingdom and the EuropeanUnion regarding the terms of Brexit, we may decide to relocate or otherwise alter certain of our European or United Kingdom operations to respond to thenew business, legal, regulatory, tax and trade environments. Brexit may adversely affect our relationships with our dealers and their retail customers, suppliersand employees and our performance could be adversely affected.
We can experience substantial and sustained volatility with respect to currency exchange rates and interest rates, which can adversely affect our reportedresults of operations and the competitiveness of our products.
We conduct operations in a variety of currencies. Our production costs, profit margins and competitive position are affected by the strength of thecurrencies in countries where we manufacture or purchase goods relative to the strength of the currencies in countries where our products are sold. We alsoare subject to currency exchange rate risk to the extent that our costs are denominated in currencies other than those in which we denominate sales and to risksassociated with translating the financial statements of our foreign subsidiaries from local currencies into United States dollars. Similarly, changes in interestrates affect us by increasing or decreasing borrowing costs and finance income. Our most significant transactional foreign currency exposures are the Euro,the Brazilian real and the Canadian dollar in relation to the United States dollar, and the Euro in relation to the British pound. Where naturally offsettingcurrency positions do not occur, we attempt to manage these risks by economically hedging some, but not necessarily all, of our exposures through the use offoreign currency forward exchange or option contracts. As with all hedging instruments, there are risks associated with the use of foreign currency forwardexchange or option contracts, interest rate swap agreements and other risk management contracts. While the use of such hedging instruments provides us withprotection for a finite period of time from certain fluctuations in currency exchange and interest rates, when we hedge we forego part or all the benefits thatmight result from favorable fluctuations in currency exchange and interest rates. In addition, any default by the counterparties to these transactions couldadversely affect us. Despite our use of economic hedging transactions, currency exchange rate or interest rate fluctuations may adversely affect ourperformance.
In July 2017, the Financial Conduct Authority in the UK, the governing body responsible for regulating the London Interbank Offered Rate(“LIBOR”), announced that it no longer will compel or persuade financial institutions and panel banks to make LIBOR submissions after 2021. This decisionis expected to result in the end of the use of LIBOR as a reference rate for commercial loans and other indebtedness. We have both LIBOR-denominated andEURIBOR-denominated indebtedness or derivative instruments. The transition to alternatives to LIBOR could be modestly disruptive to the credit markets,and while we do not believe that the impact would be material to us, we do not have insight into what the impacts might be. In the event that LIBOR is nolonger published, interest on our credit facility will be calculated based upon a base rate, as defined in the facility agreement. Our credit facility also providesfor an expedited amendment process once a replacement for LIBOR is established.
11
Table of Contents
We are subject to extensive environmental laws and regulations, including increasingly stringent engine emissions standards, and our compliance with,or our failure to comply with, existing or future laws and regulations could delay production of our products or otherwise adversely affect our business.
We are subject to increasingly stringent environmental laws and regulations in the countries in which we operate. These regulations govern, amongother things, emissions into the air, discharges into water, the use, handling and disposal of hazardous substances, waste disposal and the prevention andremediation of soil and groundwater contamination. Our costs of complying with these or any other current or future environmental regulations may besignificant. For example, several countries have adopted more stringent environmental regulations regarding emissions into the air, and it is possible that newemissions-related legislation or regulations will be adopted in connection with concerns regarding GHG. The regulation of GHG emissions from certainstationary or mobile sources could result in additional costs to us in the form of taxes or emission allowances, facilities improvements and energy costs, whichwould increase our operating costs through higher utility and transportation expenses and costs of materials. Increased input costs, such as fuel and fertilizer,and compliance-related costs also could impact retail customer operations and demand for our equipment. Because the impact of any future GHG legislative,regulatory or product standard requirements on our global businesses and products is dependent on the timing and design of mandates or standards, we areunable to predict its potential impact at this time.
In addition, we may be subject to liability in connection with properties and businesses that we no longer own or operate. We may be adverselyimpacted by costs, liabilities or claims with respect to our operations under existing laws or those that may be adopted in the future that could apply to bothfuture and prior conduct. If we fail to comply with existing or future laws and regulations, we may be subject to governmental or judicial fines or sanctions, orwe may not be able to sell our products and, therefore, our performance could be adversely affected.
In addition, the products that we manufacture or sell, particularly engines, are subject to increasingly stringent environmental regulations, includingthose that limit GHG emissions. As a result, on an ongoing basis we incur significant engineering expenses and capital expenditures to modify our products tocomply with these regulations. Further, we may experience production delays if we or our suppliers are unable to design and manufacture components for ourproducts that comply with environmental standards. For instance, as we are required to meet more stringent engine emission reduction standards that areapplicable to engines we manufacture or incorporate into our products, we expect to meet these requirements through the introduction of new technology toour products, engines and exhaust after-treatment systems, as necessary. Failure to meet applicable requirements could materially affect our business andresults of operations.
We are subject to SEC disclosure obligations relating to “conflict minerals” (columbite-tantalite, cassiterite (tin), wolframite (tungsten) and gold) thatare sourced from the Democratic Republic of Congo or adjacent countries. Complying with these requirements has and will require us to incur additionalcosts, including the costs to determine the sources of any conflict minerals used in our products and to modify our processes or products, if required. As aresult, we may choose to modify the sourcing, supply and pricing of materials in our products. In addition, we may face reputational and regulatory risks ifthe information that we receive from our suppliers is inaccurate or inadequate, or our process for obtaining that information does not fulfill the SEC’srequirements. We have a formal policy with respect to the use of conflict minerals in our products that is intended to minimize, if not eliminate, conflictminerals sourced from the covered countries to the extent that we are unable to document that they have been obtained from conflict-free sources.
Our labor force is heavily unionized, and our obligations under collective bargaining agreements and labor laws subject us to the risks of workinterruption or stoppage and could cause our costs to be higher.
Most of our employees, most notably at our manufacturing facilities, are subject to collective bargaining agreements and union contracts with termsthat expire on varying dates. Several of our collective bargaining agreements and union contracts are of limited duration and, therefore, must be re-negotiatedfrequently. As a result, we are at greater risk of work interruptions or stoppages than non-unionized companies, and any work interruption or stoppage couldsignificantly impact the volume of products we have available for sale. In addition, collective bargaining agreements, union contracts and labor laws mayimpair our ability to streamline existing manufacturing facilities, restructure our business or otherwise reduce our labor costs because of limitations onpersonnel and salary changes and similar restrictions.
12

Table of Contents
We have significant pension and retiree healthcare obligations with respect to our employees, and our cash flow available for other purposes may beadversely affected in the event that payments became due under any pension plans that are unfunded or underfunded. Declines in the market value of thesecurities used to fund these obligations will result in increased pension expense in future periods.
A portion of our active and retired employees participate in defined benefit pension and retiree healthcare plans under which we are obligated toprovide prescribed levels of benefits regardless of the value of the underlying assets, if any, of the applicable plans. To the extent that our obligations areunfunded or underfunded, we will have to use cash flow from operations and other sources to fulfill our obligations either as they become due or over someshorter funding period. In addition, since the assets that we already have provided to fund these obligations are invested in debt instruments and othersecurities, the value of these assets varies due to market factors. Historically, these fluctuations have been significant and sometimes adverse, and there can beno assurances that they will not be significant or adverse in the future. Similarly the amount of our obligations varies depending upon mortality assumptions,discount rates, salary growth, retirement rates and ages, inflation, changes in health care costs and similar factors. We also are subject to laws and regulationsgoverning the administration of our plans in certain countries, and the specific provisions, benefit formulas and related interpretations of such laws,regulations and provisions can be complex. Failure to properly administer the provisions of our plans and comply with applicable laws and regulations couldhave an adverse impact to our results of operations. As of December 31, 2019, we had substantial unfunded or underfunded obligations related to our pensionand other postretirement health care benefits. See the notes to our Consolidated Financial Statements contained in Item 8, “Financial Statements andSupplementary Data,” for more information regarding our unfunded or underfunded obligations.
Our business routinely is subject to claims and legal actions, some of which could be material.
We routinely are a party to claims and legal actions incidental to our business. These include claims for personal injuries by users of farm equipment,disputes with distributors, vendors and others with respect to commercial matters, and disputes with taxing and other governmental authorities regarding theconduct of our business. While these matters generally are not material, it is entirely possible that a matter will arise that is material to our business.
In addition, we use a broad range of technology in our products. We developed some of this technology, we license some of this technology fromothers, and some of the technology is embedded in the components and parts that we purchase from suppliers. From time-to-time, third parties make claimsthat the technology that we use violates their patent rights. While to date none of these claims have been significant, we cannot provide any assurances thatthere will not be significant claims in the future or that currently existing claims will not prove to be more significant than anticipated.
We have a substantial amount of indebtedness, and, as a result, we are subject to certain restrictive covenants and payment obligations that may adverselyaffect our ability to operate and expand our business.
Our credit facility and certain other debt agreements have various financial and other covenants that require us to maintain certain total debt toEBITDA and interest coverage ratios. In addition, the credit facility and certain other debt agreements contain other restrictive covenants, such as ones thatlimit the incurrence of indebtedness and the making of certain payments, including dividends, and are subject to acceleration in the event of default. If we failto comply with these covenants and are unable to obtain a waiver or amendment, an event of default would result.
If any event of default were to occur, our lenders could, among other things, declare outstanding amounts due and payable, and our cash may becomerestricted. In addition, an event of default or declaration of acceleration under our credit facility or certain other debt agreements also could result in an eventof default under our other financing agreements.
Our substantial indebtedness could have other important adverse consequences such as:
• requiring us to dedicate a substantial portion of our cash flow from operations to payments on our indebtedness, which would reduce theavailability of our cash flow to fund future working capital, capital expenditures, acquisitions and other general corporate purposes;
• increasing our vulnerability to general adverse economic and industry conditions;• limiting our flexibility in planning for, or reacting to, changes in our business and the agricultural industry;• restricting us from being able to introduce new products or pursuing business opportunities;• placing us at a competitive disadvantage compared to our competitors that may have less indebtedness; and
13

Table of Contents
• limiting, along with the financial and other restrictive covenants in our indebtedness, among other things, our ability to borrow additional funds,repurchase shares, pay cash dividends or engage in or enter into certain transactions.
Our business increasingly is subject to regulations relating to privacy and data protection, and if we violate any of those regulations we could be subject tosignificant claims, penalties and damages.
Increasingly, the United States, the European Union, Brazil and other governmental entities are imposing regulations designed to protect thecollection, maintenance and transfer of personal information. For example, the European Union adopted the General Data Protection Regulation (the“GDPR”) that imposed stringent data protection requirements and greater penalties for non-compliance beginning in May 2018. The GDPR also protects abroader set of personal information than traditionally has been protected in the United States and provides for a right of “erasure.” Other regulations governthe collection and transfer of financial data and data security generally. These regulations generally impose penalties in the event of violations. While weattempt to comply with all applicable cybersecurity regulations, their implementation is complex, and, if we are not successful, we may be subject to penaltiesand claims for damages from regulators and the impacted parties.
Cybersecurity breaches and other disruptions to our information technology infrastructure could interfere with our operations and could compromiseconfidential information, exposing us to liability that could cause our business and reputation to suffer.
We rely upon information technology networks and systems, some of which are managed by third parties, to process, transmit and store electronicinformation, and to manage or support a variety of business processes and activities, including supply chain, manufacturing, distribution, invoicing andcollection of payments from dealers or other purchasers of our equipment. We also use information technology systems to record, process and summarizefinancial information and results of operations for internal reporting purposes and to comply with regulatory financial reporting, legal and tax requirements.Additionally, we collect and store sensitive data, including intellectual property and proprietary business information, in data centers and on informationtechnology networks. The secure operation of these information technology networks and the processing and maintenance of this information is critical to ourbusiness operations and strategy. Despite security measures and business continuity plans, our information technology networks and infrastructure may bevulnerable to damage, disruptions or shutdowns due to attacks by cyber criminals or breaches due to employee error or malfeasance or other disruptionsduring the process of upgrading or replacing computer software or hardware, power outages, computer viruses, telecommunication or utility failures, terroristacts or, natural disasters or other catastrophic events. The occurrence of any of these events could compromise our networks, and the information stored therecould be accessed, publicly disclosed, lost or stolen. Any such access, disclosure or other loss of information could result in legal claims or proceedings,liability or regulatory penalties under laws protecting the privacy of personal information, and could disrupt our operations and damage our reputation, whichcould adversely affect our performance. In addition, as security threats continue to evolve and increase in frequency and sophistication, we may need to investadditional resources to protect the security of our systems.
We may encounter difficulties in integrating businesses we acquire and may not fully achieve, or achieve within a reasonable time frame, expectedstrategic objectives and other expected benefits of the acquisitions.
From time-to-time we seek to expand through acquisitions of other businesses. We expect to realize strategic and other benefits as a result of ouracquisitions, including, among other things, the opportunity to extend our reach in the agricultural industry and provide our dealers and their retail customerswith an even wider range of products and services. However, it is impossible to predict with certainty whether, or to what extent, these benefits will berealized or whether we will be able to integrate acquired businesses in a timely and effective manner. For example:
• the costs of integrating acquired businesses and their operations may be higher than we expect and may require significant attention from ourmanagement;
• the businesses we acquire may have undisclosed liabilities, such as environmental liabilities or liabilities for violations of laws, such as theFCPA, that we did not expect; and
• our ability to successfully carry out our growth strategies for acquired businesses will be affected by, among other things, our ability to maintainand enhance our relationships with their existing customers, our ability to provide additional product distribution opportunities to them throughour existing distribution channels, changes in the spending patterns and preferences of customers and potential customers, fluctuating economicand competitive conditions and our ability to retain their key personnel.
14
Table of Contents
Our ability to address these issues will determine the extent to which we are able to successfully integrate, develop and grow acquired businesses andto realize the expected benefits of these transactions. Our failure to do so could have a material adverse effect on our performance following the transactions.
Changes to United States tax, tariff, trade and import/export regulations may have a negative effect on global economic conditions, financial markets andour business.
There have been ongoing discussions and significant changes to United States trade policies, treaties, tariffs and taxes. Although the levels changefrom period to period, we generally have substantial imports into the United States of products and components that are either produced in our foreignlocations or are purchased from foreign suppliers, and also have substantial exports of products and components that we manufacture in the UnitedStates. The impact of any changes to current trade, tariff or tax policies relating to imports and exports of goods is dependent on factors such as the treatmentof exports as a credit to imports, and the introduction of any tariffs or taxes relating to imports from specific countries. The most significant changes havebeen the imposition of tariffs by the United States on imports from China and the imposition by China of tariffs on imports from the United States. Thesetrade restrictions include tariffs on the import of agricultural commodities into China, which are critical to our customers. Policies impacting exchange ratesand commodity prices or limiting the export of commodities could have a material adverse impact on the international flow of agricultural and othercommodities that may result in a corresponding negative impact on the demand for agricultural equipment across the world. Our sales could be negativelyimpacted by such policies because farm income strongly influences sales of such equipment globally.
In the past, we have had moderate amounts of imports into the U.S. from China. To date, the impact of U.S. import tariffs on China sourcedequipment has not been material to us because we have been able to redirect production and employ sourcing alternatives for products previously importedinto the U.S. from our China manufacturing facility. In addition, we do not export significant amounts from the United States into China. It is unclear whatother changes might be considered or implemented and what response to any such changes may be by the governments of other countries. Any changes thatincrease the cost of international trade or otherwise impact the global economy, including through the increase in domestic prices for raw materials, couldhave a material adverse effect on our performance. For example, the United States, Canada and Mexico have renegotiated the North America Free TradeAgreement, and the impacts of the changes brought about by the new agreement, named the United States, Mexico, Canada Agreement (the “USMCA”), arenot currently known. We continue to monitor closely the status and implementation of the USMCA.
We have joint ventures in the Netherlands and Russia with an entity that currently is operating under a time-limited general license from the U.S.Department of Treasury authorizing the maintenance or wind-down of operations and existing contracts. In the event that the license expires without furtherrelief being granted or without other authorization from the U.S. Department of the Treasury, we may no longer be able to continue the joint ventures'commercial operations, and we would be required to assess the fair value of certain assets related to the joint ventures for potential impairment. Our mostrecent preliminary assessment indicated that impairment, if any, would not be material.
Item 1B. Unresolved Staff Comments
Not applicable.
15
Table of Contents
Item 2. Properties
Our principal manufacturing locations and/or properties as of January 31, 2020, were as follows:
Location Description of Property Leased(Sq. Ft.)
Owned(Sq. Ft.)
United States: Assumption, Illinois Manufacturing/Sales and Administrative Office 933,900Batavia, Illinois Parts Distribution 310,200 Duluth, Georgia Corporate Headquarters 159,000 Hesston, Kansas Manufacturing 6,300 1,469,100Jackson, Minnesota Manufacturing 51,400 986,400
International: Beauvais, France(1) Manufacturing 14,300 2,231,300Breganze, Italy Manufacturing 11,800 1,562,000Ennery, France Parts Distribution 839,600 360,300Linnavuori, Finland Manufacturing 245,400 396,300Hohenmölsen, Germany Manufacturing 437,000Marktoberdorf, Germany Manufacturing 231,600 1,504,600Wolfenbüttel, Germany Manufacturing 546,700Stockerau, Austria Manufacturing 160,700Biatorbagy, Hungary Manufacturing 287,300 Thisted, Denmark Manufacturing 133,200 295,300Suolahti, Finland Manufacturing/Parts Distribution 97,500 561,400Canoas, Brazil Regional Headquarters/Manufacturing 12,900 1,120,000Mogi das Cruzes, Brazil Manufacturing 737,400Santa Rosa, Brazil Manufacturing 508,900Changzhou, China Manufacturing 186,800 767,000
_______________________________________(1) Includes our joint venture, GIMA, in which we own a 50% interest.
We consider each of our facilities to be in good condition and adequate for its present use. We believe that we have sufficient capacity to meet ourcurrent and anticipated manufacturing requirements.
16

Table of Contents
Item 3. Legal Proceedings
In August 2008, as part of a routine audit, the Brazilian taxing authorities disallowed deductions relating to the amortization of certain goodwillrecognized in connection with a reorganization of our Brazilian operations and the related transfer of certain assets to our Brazilian subsidiaries. The amountof the tax disallowance through December 31, 2019, not including interest and penalties, was approximately 131.5 million Brazilian reais (or approximately$32.6 million). The amount ultimately in dispute will be significantly greater because of interest and penalties. We have been advised by our legal and taxadvisors that our position with respect to the deductions is allowable under the tax laws of Brazil. We are contesting the disallowance and believe that it is notlikely that the assessment, interest or penalties will be required to be paid. However, the ultimate outcome will not be determined until the Brazilian taxappeal process is complete, which could take several years.
We are a party to various other legal claims and actions incidental to our business. We believe that none of these claims or actions, either individuallyor in the aggregate, is material to our business or financial statements as a whole, including our results of operations and financial condition.
Item 4. Mine Safety Disclosures
Not Applicable.
17
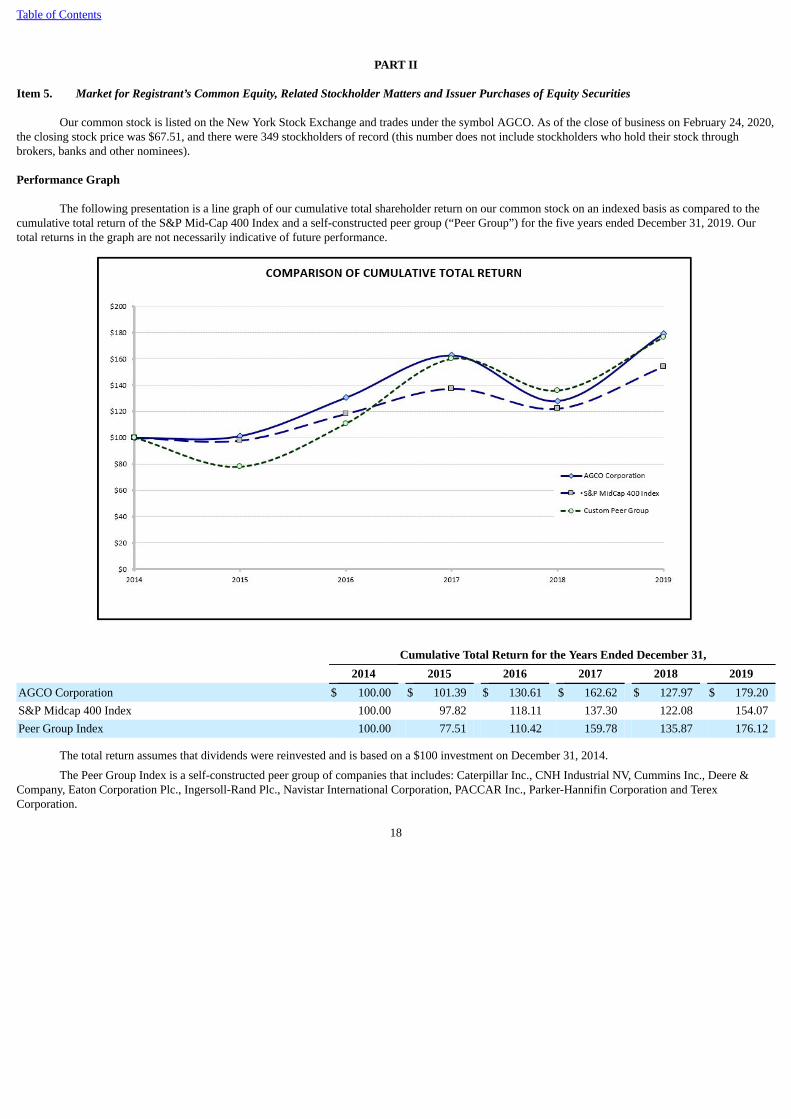
Table of Contents
PART II
Item 5. Market for Registrant’s Common Equity, Related Stockholder Matters and Issuer Purchases of Equity Securities
Our common stock is listed on the New York Stock Exchange and trades under the symbol AGCO. As of the close of business on February 24, 2020,the closing stock price was $67.51, and there were 349 stockholders of record (this number does not include stockholders who hold their stock throughbrokers, banks and other nominees).
Performance Graph
The following presentation is a line graph of our cumulative total shareholder return on our common stock on an indexed basis as compared to thecumulative total return of the S&P Mid-Cap 400 Index and a self-constructed peer group (“Peer Group”) for the five years ended December 31, 2019. Ourtotal returns in the graph are not necessarily indicative of future performance.
Cumulative Total Return for the Years Ended December 31, 2014 2015 2016 2017 2018 2019AGCO Corporation $ 100.00 $ 101.39 $ 130.61 $ 162.62 $ 127.97 $ 179.20S&P Midcap 400 Index 100.00 97.82 118.11 137.30 122.08 154.07Peer Group Index 100.00 77.51 110.42 159.78 135.87 176.12
The total return assumes that dividends were reinvested and is based on a $100 investment on December 31, 2014.
The Peer Group Index is a self-constructed peer group of companies that includes: Caterpillar Inc., CNH Industrial NV, Cummins Inc., Deere &Company, Eaton Corporation Plc., Ingersoll-Rand Plc., Navistar International Corporation, PACCAR Inc., Parker-Hannifin Corporation and TerexCorporation.
18

Table of Contents
Issuer Purchases of Equity Securities
The table below sets forth information with respect to purchases of our common stock made by or on behalf of us during the three months endedDecember 31, 2019:
Period Total Number of
Shares Purchased Average Price Paid
per Share
Total Number ofShares Purchased as
Part of PubliclyAnnounced Plans or
Programs
Maximum ApproximateDollar Value of Shares that
May Yet Be PurchasedUnder the Plans or
Programs (in millions)(3)
October 1, 2019 through October 31, 2019(1) 84,570 $ 71.39 84,570 $ 47.1November 1, 2019 through November 30, 2019(2) 308,880 $ 78.70 308,880 $ 17.1December 1, 2019 through December 31, 2019(2) 72,291 $ 78.70 72,291 $ 300.0
Total 465,741 $ 74.87 465,741 $ 300.0____________________________________(1) In August 2019, we entered into an ASR agreement with a third-party financial institution to repurchase $30.0 million of shares of our common stock. The ASR agreement resulted in the initial
delivery of our common stock, representing approximately 80% of the shares that was expected to be repurchased in connection with the transaction. In October 2019, the remaining shareswere delivered. As reflected in the table above, the average price paid per share for the ASR agreement was the volume-weighted average stock price of our common stock over the term of theASR agreement. Refer to Note 9 of our Consolidated Financial Statements contained in Item 8, “Financial Statements and Supplementary Data,” for a further discussion of this matter.
(2) In November 2019, we entered into an ASR agreement with a third-party financial institution to repurchase $30.0 million of shares of our common stock. Refer to Note 9 of our ConsolidatedFinancial Statements contained in Item 8, “Financial Statements and Supplementary Data,” for a further discussion of this matter.
(3) The remaining amount authorized to be repurchased under board-approved share repurchase authorizations was approximately $300.0 million, which has no expiration date.
19

Table of Contents
Item 6. Selected Financial Data
The following tables present our selected consolidated financial data. The data set forth below should be read together with Item 7, “Management’sDiscussion and Analysis of Financial Condition and Results of Operations,” and our historical Consolidated Financial Statements and the related notes. TheConsolidated Financial Statements as of December 31, 2019 and 2018 and for the years ended December 31, 2019, 2018 and 2017 and the reports thereon areincluded in Item 8, “Financial Statements and Supplementary Data.” The historical financial data may not be indicative of our future performance.
Years Ended December 31, 2019 2018 2017 2016 2015 (in millions, except per share data)Operating Data: Net sales $ 9,041.4 $ 9,352.0 $ 8,306.5 $ 7,410.5 $ 7,467.3Gross profit 1,984.3 1,996.7 1,765.3 1,515.5 1,560.6Income from operations 348.1 489.0 404.4 287.0 358.6Net income 122.8 283.7 189.3 160.2 264.0Net loss (income) attributable to noncontrolling interests 2.4 1.8 (2.9) (0.1) 2.4Net income attributable to AGCO Corporation and
subsidiaries $ 125.2 $ 285.5 $ 186.4 $ 160.1 $ 266.4Net income per common share — diluted $ 1.63 $ 3.58 $ 2.32 $ 1.96 $ 3.06Cash dividends declared and paid per common share $ 0.63 $ 0.60 $ 0.56 $ 0.52 $ 0.48Weighted average shares outstanding — diluted 77.0 79.7 80.2 81.7 87.1
As of December 31, 2019 2018 2017 2016 2015 (in millions, except number of employees)Balance Sheet Data: Cash and cash equivalents $ 432.8 $ 326.1 $ 367.7 $ 429.7 $ 426.7Total assets 7,759.7 7,626.4 7,971.7 7,168.4 6,497.7Total long-term debt, excluding current portion and debt
issuance costs 1,191.8 1,275.3 1,618.1 1,610.0 925.2Stockholders’ equity 2,907.0 2,993.5 3,095.3 2,837.2 2,883.3Other Data: Number of employees 20,961 21,232 20,462 19,795 19,588
20

Table of Contents
Item 7. Management’s Discussion and Analysis of Financial Condition and Results of Operations
We are a leading manufacturer and distributor of agricultural equipment and related replacement parts throughout the world. We sell a full range ofagricultural equipment, including tractors, combines, self-propelled sprayers, hay tools, forage equipment, seeding and tillage equipment, implements, andgrain storage and protein production systems. Our products are widely recognized in the agricultural equipment industry and are marketed under a number ofwell-known brand names, including: Challenger®, Fendt®, GSI®, Massey Ferguson® and Valtra®. We distribute most of our products through a combinationof approximately 3,275 dealers and distributors as well as associates and licensees. In addition, we provide retail financing through our finance joint ventureswith Rabobank.
Financial Highlights
We sell our equipment and replacement parts to our independent dealers, distributors and other customers. A large majority of our sales are toindependent dealers and distributors that sell our products to end users. To the extent practicable, we attempt to sell products to our dealers and distributors ona level basis throughout the year to reduce the effect of seasonal demands on our manufacturing operations and to minimize our investment in inventories.However, retail sales by dealers to farmers are highly seasonal and are linked to the planting and harvesting seasons. In certain markets, particularly in NorthAmerica, there is often a time lag, which varies based on the timing and level of retail demand, between our sale of the equipment to the dealer and thedealer’s sale to a retail customer.
The following table sets forth, for the periods indicated, the percentage relationship to net sales of certain items included in our ConsolidatedStatements of Operations:
Years Ended December 31, 2019(1) 2018(1) 2017(1)
Net sales 100.0% 100.0% 100.0 %Cost of goods sold 78.1 78.6 78.7Gross profit 21.9 21.4 21.3
Selling, general and administrative expenses 11.5 11.4 11.6Engineering expenses 3.8 3.8 3.9Impairment charges 2.0 — —Amortization of intangibles 0.7 0.7 0.7Restructuring expenses 0.1 0.1 0.1Bad debt expense 0.1 0.1 0.1
Income from operations 3.9 5.3 4.9Interest expense, net 0.2 0.6 0.5Other expense, net 0.7 0.8 0.9
Income before income taxes and equity in net earnings of affiliates 2.9 3.9 3.4Income tax provision 2.0 1.2 1.6
Income before equity in net earnings of affiliates 0.9 2.7 1.8Equity in net earnings of affiliates 0.5 0.4 0.5
Net income 1.4 3.0 2.3Net loss (income) attributable to noncontrolling interests — — —
Net income attributable to AGCO Corporation and subsidiaries 1.4% 3.1% 2.2 %___________________________________(1) Rounding may impact summation of amounts.
21

Table of Contents
2019 Compared to 2018
Net income attributable to AGCO Corporation and subsidiaries for 2019 was $125.2 million, or $1.63 per diluted share, compared to $285.5 million,or $3.58 per diluted share for 2018.
Net sales for 2019 were approximately $9,041.4 million, or 3.3% lower than 2018, primarily due to decreased sales volumes in our South Americanand Asia/Pacific/African (“APA”) regions and the negative impact of currency translation. Income from operations was $348.1 million in 2019 compared to$489.0 million in 2018. The decrease in income from operations during 2019 was primarily the result of non-cash goodwill and other intangible assetimpairment charges recorded during the fourth quarter of 2019 related to our grain storage and protein production systems operations in our Europe/MiddleEast (“EME”) region. Excluding the impact of $176.6 million of non-cash impairment charges, income from operations during 2019 increased compared to2018 due to improved gross profit margins, which largely offset the adverse impact of foreign currency translation.
Regionally, income from operations in EME increased by approximately $37.1 million in 2019 compared to 2018, driven primarily by the benefit ofhigher sales and margin improvement resulting from the impacts of pricing, better factory productivity and a favorable sales mix. In our North Americanregion, income from operations improved by approximately $18.5 million. Increased net sales levels and the benefit of favorable pricing impacts and expensecontrol initiatives contributed to the improvement in the region. In South America, operating losses increased approximately $29.3 million in 2019 comparedto 2018. The losses reflect low levels of industry demand and company production, as well as unfavorable cost impacts of newer product technology into ourBrazilian factories. Income from operations in our APA region decreased approximately $6.2 million in 2019 compared to 2018, primarily due to lower netsales and production volumes.
Industry Market Conditions
Farm economics remain challenged across the major crop-producing regions, and low commodity prices and international trade tensions continue toweigh on farmer sentiment, resulting in decreased global equipment demand during 2019. In North America, industry unit retail sales of utility and highhorsepower tractors for 2019 decreased slightly compared to 2018. Industry unit retail sales of combines for 2019 decreased approximately 6% compared to2018. A difficult growing season, as well as the uncertainty regarding the outcome of trade negotiations related to agricultural products and delayed marketfacilitation aid payments in the U.S., all contributed to weak demand in the large farm sector during 2019. In Western Europe, industry unit retail sales oftractors for 2019 declined approximately 2% compared to 2018. Industry unit retail sales of combines for 2019 decreased approximately 18% compared to2018. Industry demand trended progressively lower throughout 2019 due to the impact of lower wheat and milk prices as well as higher input costs for dairyproducers. During 2019, industry sales declines experienced in Italy, the United Kingdom and Germany were partially offset by industry sales growth inFrance and Finland. In South America, industry unit retail sales of tractors for 2019 dropped approximately 16% compared to 2018. Industry unit retail salesof combines for 2019 decreased approximately 5% compared to 2018. Despite improved grain production in Brazil and Argentina, industry demand wasnegatively impacted by interruptions in the government subsidized finance program in Brazil and weak economic conditions in Argentina.
Results of Operations
Net sales for 2019 were $9,041.4 million compared to $9,352.0 million for 2018, primarily as a result of sales declines in our South American andAPA regions, partially offset by sales growth in our North American and EME regions, on a constant currency basis. The following table sets forth, for theyear ended December 31, 2019, the impact to net sales of currency translation by geographical segment (in millions, except percentages):
Change Change due to Currency
Translation 2019 2018 $ % $ %North America $ 2,191.8 $ 2,180.1 $ 11.7 0.5 % $ (8.5) (0.4)%South America 802.2 959.0 (156.8) (16.4)% (49.9) (5.2)%EME 5,328.8 5,385.1 (56.3) (1.0)% (295.0) (5.5)%APA 718.6 827.8 (109.2) (13.2)% (35.8) (4.3)%
$ 9,041.4 $ 9,352.0 $ (310.6) (3.3)% $ (389.2) (4.2)%
22

Table of Contents
Regionally, net sales in North America increased during 2019 compared to 2018, with sales growth driven by a growth in net sales of lowhorsepower tractors, combines and parts, largely offset by a reduction in sales of protein production equipment and utility tractors. In the EME region, netsales, excluding the negative impact of foreign currency translation, increased during 2019 compared to 2018, primarily due to net sales growth in France,Germany and Italy, partially offset by declines in the United Kingdom and Eastern Europe. Net sales decreased in South America in 2019 compared to 2018,primarily due to weaker industry conditions resulting in sales declines in Brazil and other South American markets as well as the negative impact of foreigncurrency translation. In the APA region, net sales decreased in 2019 compared to 2018, primarily due to lower sales in China, Southeast Asia and Africa. Weestimate that worldwide average price increases were approximately 1.9% and 1.4% in 2019 and 2018, respectively. Consolidated net sales of tractors andcombines, which comprised approximately 61% of our net sales in 2019, decreased approximately 3.7% in 2019 compared to 2018. Unit sales of tractors andcombines decreased approximately 9.5% during 2019 compared to 2018. The unit sales decrease and the decrease in net sales can differ due to foreigncurrency translation, pricing and sales mix changes.
The following table sets forth, for the years ended December 31, 2019 and 2018, the percentage relationship to net sales of certain items included inour Consolidated Statements of Operations (in millions, except percentages):
2019 2018
$ % of
Net Sales(1) $ % of
Net SalesGross profit $ 1,984.3 21.9% $ 1,996.7 21.4%
Selling, general and administrative expenses 1,040.3 11.5% 1,069.4 11.4%Engineering expenses 343.4 3.8% 355.2 3.8%Impairment charges 176.6 2.0% — —%Amortization of intangibles 61.1 0.7% 64.7 0.7%Restructuring expenses 9.0 0.1% 12.0 0.1%Bad debt expense 5.8 0.1% 6.4 0.1%
Income from operations $ 348.1 3.9% $ 489.0 5.3%____________________________________(1) Rounding may impact summation of amounts.
Gross profit as a percentage of net sales increased during 2019 compared to 2018, primarily due to the benefit of pricing in excess of material costincreases, partially offset by the cost impact of lower production levels. Production hours decreased in both North America and South America, whileproduction hours increased in Europe during 2019. Overall, production hours decreased approximately 2% on a global basis during 2019 compared to 2018.We recorded stock compensation expense of approximately $1.7 million and $2.3 million during 2019 and 2018, respectively, within cost of goods sold, as ismore fully explained in Note 1 of our Consolidated Financial Statements contained in Item 8, “Financial Statements and Supplementary Data.”
Selling, general and administrative expenses (“SG&A expenses”) and engineering expenses, as a percentage of net sales, were relatively flat during2019 compared to 2018. We recorded stock compensation expense of approximately $40.0 million and $44.3 million during 2019 and 2018, respectively,within SG&A expenses, as is more fully explained in Note 1 of our Consolidated Financial Statements contained in Item 8, “Financial Statements andSupplementary Data.”
We recorded restructuring expenses of approximately $9.0 million and $12.0 million during 2019 and 2018, respectively. The restructuring expensesprimarily related to severance and related costs associated with the rationalization of employee headcount at various manufacturing facilities andadministrative offices located in Europe, South America, China, Africa and the United States during 2019, as well as the rationalization of our grain storageand protein production systems operations initiated in the fourth quarter of 2019. In addition, we recorded a loss of approximately $2.1 million within"Restructuring expenses" associated with the sale of our 50% interest in our USC, LLC joint venture. See Note 3 of our Consolidated Financial Statementscontained in Item 8, “Financial Statements and Supplementary Data,” for additional information.
During the three months ended December 31, 2019, we recorded non-cash goodwill and other intangible asset impairment charges of approximately$173.6 million associated with our grain storage and protein production systems operations in Europe/Middle East, as well as the impairment of long-livedintangible assets of approximately $3.0 million associated with brand and product rationalization within our grain storage and protein production systemsoperations in North
23

Table of Contents
America. These impairment charges are more fully described in “Critical Accounting Estimates - Goodwill, Other Intangible Assets and Long-Lived Assets”and Note 1 to our Consolidated Financial Statements contained in Item 8, “Financial Statements and Supplementary Data.”
Interest expense, net was $19.9 million for 2019 compared to $53.8 million for 2018. The decline was primarily the result of debt extinguishmentcosts incurred in 2018 associated with debt refinancings completed during 2018 that included the replacement of higher interest-bearing debt with lowerinterest-bearing debt. During 2018, we repurchased approximately $300.0 million of our outstanding 57/8% senior notes. The repurchase resulted in a loss onextinguishment of debt of approximately $24.5 million, including associated fees, offset by approximately $4.7 million of accelerated amortization of adeferred gain related to a terminated interest rate swap instrument associated with the senior notes. In addition, we repaid our outstanding term loan under ourformer revolving credit and term loan facility. We recorded approximately $0.7 million associated with the write-off of deferred debt issuance costs and a lossof approximately $3.9 million from a terminated interest rate swap instrument related to the term loan.
Other expense, net was $67.1 million in 2019 compared to $74.9 million in 2018. Losses on sales of receivables, primarily related to our accountsreceivable sales agreements with our finance joint ventures in North America, Europe and Brazil, were approximately $42.4 million and $36.0 million in2019 and 2018, respectively. Other expense, net for 2018 also included higher foreign exchanges losses, primarily associated with the significant devaluationof the Argentine peso.
We recorded an income tax provision of $180.8 million in 2019 compared to $110.9 million in 2018. Our tax provision and effective tax rate areimpacted by the differing tax rates of the various tax jurisdictions in which we operate, permanent differences for items treated differently for financialaccounting and income tax purposes and for losses in jurisdictions where no income tax benefit is recorded. At December 31, 2019 and 2018, we had grossdeferred tax assets of $396.0 million and $350.2 million, respectively, including $72.0 million and $74.5 million, respectively, related to net operating losscarryforwards. During 2019, we recognized a one-time income tax gain of approximately $21.8 million associated with the changing of Swiss federal andcantonal tax rates, as well as recognition of a deferred tax asset associated with the estimated value of a tax basis step-up of our Swiss subsidiary's assets.During 2019, we also recorded a non-cash adjustment to establish a valuation allowance against our Brazilian net deferred income tax assets of approximately$53.7 million. At December 31, 2019, we had total valuation allowances as an offset to our gross deferred tax assets of approximately $169.1 million. Thisvaluation allowance included allowances primarily against net operating loss carryforwards in Brazil, China, Hungary, the United Kingdom and theNetherlands, as well as allowances against our net deferred taxes primarily in the U.S. and Brazil. At December 31, 2018, we had total valuation allowancesas an offset to the gross deferred tax assets of approximately $83.9 million, primarily related to net operating loss carryforwards in Brazil, China, the UnitedKingdom and the Netherlands, as well as allowances against our net deferred taxes in the U.S. Realization of the net deferred tax assets as of December 31,2019 will depend on generating sufficient taxable income in future periods, net of reversing deferred tax liabilities. We believe it is more likely than not thatthe remaining net deferred tax assets will be realized. Refer to Note 6 of our Consolidated Financial Statements contained in Item 8, “Financial Statementsand Supplementary Data,” for further information.
Equity in net earnings of affiliates, which is primarily comprised of income from our AGCO Finance joint ventures, was $42.5 million in 2019compared to $34.3 million in 2018, primarily due to higher net earnings from our AGCO Finance joint ventures. See “Finance Joint Ventures” for furtherinformation regarding our finance joint ventures and their results of operations and Note 5 of our Consolidated Financial Statements contained in Item 8,“Financial Statements and Supplementary Data,” for further information.
2018 Compared to 2017
A comparison of the results of operations for 2018 versus that of 2017 was included in our Annual Report on Form 10-K for the year endedDecember 31, 2018.
24

Table of Contents
Quarterly Results
The following table presents unaudited interim operating results. We believe that the following information includes all adjustments, consisting onlyof normal recurring adjustments, necessary to present fairly our results of operations for the periods presented.
Three Months Ended March 31 June 30 September 30 December 31 (in millions, except per share data)2019: Net sales $ 1,995.8 $ 2,422.6 $ 2,109.4 $ 2,513.6Gross profit 456.7 563.9 450.2 513.5Income (loss) from operations 92.4 199.6 105.9 (49.8)Net income (loss) 65.7 140.4 6.3 (89.6)Net (income) loss attributable to noncontrolling interests (0.6) 0.4 1.3 1.3Net income (loss) attributable to AGCO Corporation and subsidiaries 65.1 140.8 7.6 (88.3)Net income (loss) per common share attributable to AGCO
Corporation and subsidiaries — diluted 0.84 1.82 0.10 (1.17)2018: Net sales $ 2,007.5 $ 2,537.6 $ 2,214.7 $ 2,592.2Gross profit 428.0 556.3 473.7 538.7Income from operations 50.5 168.1 111.3 159.1Net income 25.0 90.4 70.7 97.6Net (income) loss attributable to noncontrolling interests (0.7) 1.0 0.4 1.1Net income attributable to AGCO Corporation and subsidiaries 24.3 91.4 71.1 98.7Net income per common share attributable to AGCO Corporation and
subsidiaries — diluted 0.30 1.14 0.89 1.26
AGCO Finance Joint Ventures
Our AGCO Finance joint ventures provide both retail financing and wholesale financing to our dealers in the United States, Canada, Europe, Brazil,Argentina and Australia. The joint ventures are owned by AGCO and by a wholly-owned subsidiary of Rabobank. The majority of the assets of the financejoint ventures consist of finance receivables. The majority of the liabilities consist of notes payable and accrued interest. Under the various joint ventureagreements, Rabobank or its affiliates provide financing to the finance joint ventures, primarily through lines of credit. We do not guarantee the debtobligations of the joint ventures. As of December 31, 2019, our capital investment in the finance joint ventures, which is included in “Investment in affiliates”on our Consolidated Balance Sheets, was approximately $339.0 million compared to $358.7 million as of December 31, 2018. The total finance portfolio inour finance joint ventures was approximately $9.6 billion and $8.8 billion as of December 31, 2019 and 2018, respectively. The total finance portfolio as ofDecember 31, 2019 and 2018 included approximately $7.7 billion and $7.2 billion, respectively, of retail receivables and $1.9 billion and $1.6 billion,respectively, of wholesale receivables from AGCO dealers. The wholesale receivables either were sold directly to AGCO Finance without recourse from ouroperating companies or AGCO Finance provided the financing directly to the dealers. During 2019 and 2018, we did not make additional investments in ourfinance joint ventures. During 2019 and 2018, we received dividends of approximately $40.5 million and $29.4 million, respectively, from certain of ourfinance joint ventures. Our share in the earnings of the finance joint ventures, included in “Equity in net earnings of affiliates” within our ConsolidatedStatements of Operations, was $41.5 million and $34.7 million for the years ended December 31, 2019 and 2018, respectively, with the increase in earningsprimarily due to higher income in our European, Brazilian and U.S. finance joint ventures during 2019 as compared to 2018.
25

Table of Contents
Outlook
Our operations are subject to the cyclical nature of the agricultural industry. Sales of our equipment are affected by, among other things, changes innet cash farm income, farm land values, weather conditions, the demand for agricultural commodities, commodity prices and general economic conditions.
Our net sales are expected to increase in 2020 compared to 2019, resulting from relatively flat net sales volumes and positive pricing impacts. Grossand operating margins are expected to improve from 2019 levels, reflecting the positive impact of pricing and cost control initiatives. This assumes that thecoronavirus outbreak does not significantly impact our business. See, “Risk Factors.”
Liquidity and Capital Resources
Our financing requirements are subject to variations due to seasonal changes in inventory and receivable levels. Internally generated funds aresupplemented when necessary from external sources, primarily our credit facility and accounts receivable sales agreement facilities. We believe that thefollowing facilities, together with available cash and internally generated funds, will be sufficient to support our working capital, capital expenditures anddebt service requirements for the foreseeable future (in millions):
December 31, 20191.002% Senior term loan due 2025(1) $ 280.2Senior term loan due 2022(1) 168.1Credit facility, expires 2023 —Senior term loans due between 2021 and 2028(1) 736.2Other long-term debt 12.5____________________________________(1) The amounts above are gross of debt issuance costs of an aggregate amount of approximately $2.3 million.
Interest on U.S. dollar borrowings under our credit facility is calculated based upon LIBOR. In the event that LIBOR is no longer published, interestwill be calculated based upon a base rate. The credit facility also provides for an expedited amendment process once a replacement for LIBOR is established.
In December 2018, we entered into a term loan agreement with the European Investment Bank (“EIB”), which provided us with the ability to borrowup to €250.0 million. The €250.0 million (or approximately $280.2 million as of December 31, 2019) of funding was received on January 25, 2019 with amaturity date of January 24, 2025. We have the ability to prepay the term loan before its maturity date. Interest is payable on the term loan at 1.002% perannum, payable semi-annually in arrears. We had an additional term loan with the EIB in the amount of €200.0 million that was entered into in December2014 and had a maturity date of January 15, 2020. We repaid this €200.0 million (or approximately $220.0 million) term loan in December 2019.
In October 2018, we entered into a term loan agreement with Rabobank in the amount of €150.0 million (or approximately $168.1 million as ofDecember 31, 2019). We have the ability to prepay the term loan before its maturity date on October 28, 2022. Interest is payable on the term loan quarterly inarrears at an annual rate, equal to the EURIBOR plus a margin ranging from 0.875% to 1.875% based on our credit rating.
In October 2018, we entered into a multi-currency revolving credit facility of $800.0 million. The maturity date of the credit facility is October 17,2023. Interest accrues on amounts outstanding under the credit facility, at our option, at either (1) LIBOR plus a margin ranging from 0.875% to 1.875%based on our credit rating, or (2) the base rate, which is equal to the higher of (i) the administrative agent’s base lending rate for the applicable currency, (ii)the federal funds rate plus 0.5%, and (iii) one-month LIBOR for loans denominated in U.S. dollars plus 1.0%, plus a margin ranging from 0.0% to 0.875%based on our credit rating.
In October 2016, we borrowed an aggregate amount of €375.0 million through a group of seven related term loan agreements. These agreements hadmaturities ranging from October 2019 to October 2026. In October 2019, we repaid an aggregate amount of €56.0 million (or approximately $61.1 million) ofthese term loans. In August 2018, we borrowed an additional aggregate amount of indebtedness of €338.0 million through a group of another seven relatedterm loan agreements. Proceeds from the borrowings were used to repay borrowings under our former revolving credit facility. The provisions of the termloan agreements are identical in nature with the exception of interest rate terms and maturities. In aggregate, as of
26
Table of Contents
December 31, 2019, we have indebtedness of approximately €657.0 million (or approximately $736.2 million) under a total group of twelve term loanagreements with remaining maturities ranging from August 2021 to August 2028.
We are in compliance with the financial covenants contained in these facilities and expect to continue to maintain such compliance. Should we everencounter difficulties, our historical relationship with our lenders has been strong and we anticipate their continued long-term support of our business. Referto Note 7 to the Consolidated Financial Statements contained in Item 8, “Financial Statements and Supplementary Data,” for additional information regardingour current facilities, including the financial covenants contained in each debt instrument.
Our accounts receivable sales agreements in North America, Europe and Brazil permit the sale, on an ongoing basis, of a majority of our receivablesto our U.S., Canadian, European and Brazilian finance joint ventures. The sales of all receivables are without recourse to us. We do not service the receivablesafter the sales occur, and we do not maintain any direct retained interest in the receivables. These agreements are accounted for as off-balance sheettransactions and have the effect of reducing accounts receivable and short-term liabilities by the same amount. As of December 31, 2019 and 2018, the cashreceived from receivables sold under the U.S., Canadian, European and Brazilian accounts receivable sales agreements was approximately $1.6 billion and$1.4 billion, respectively.
Our finance joint ventures in Europe, Brazil and Australia also provide wholesale financing directly to our dealers. The receivables associated withthese arrangements also are without recourse to us. As of December 31, 2019 and 2018, these finance joint ventures had approximately $104.3 million and$82.5 million, respectively, of outstanding accounts receivable associated with these arrangements. These arrangements are accounted for as off-balance sheettransactions. In addition, we sell certain trade receivables under factoring arrangements to other financial institutions around the world. These arrangementsalso are accounted for as off-balance sheet transactions.
Our debt to capitalization ratio, which is total indebtedness divided by the sum of total indebtedness and stockholders’ equity, was 30.4% atDecember 31, 2019 compared to 32.8% at December 31, 2018.
Cash Flows
Cash flows provided by operating activities were $695.9 million during 2019 compared to $595.9 million during 2018 and $577.6 million during2017. The increase during 2019 was primarily due to a source of cash in operating assets and liabilities in 2019 compared to a use of cash in 2018. Inaddition, we received an increased amount of dividends from our finance joint ventures in 2019 as compared to 2018.
Our working capital requirements are seasonal, with investments in working capital typically building in the first half of the year and then reducingin the second half of the year. We had $844.6 million in working capital at December 31, 2019, as compared with $770.7 million at December 31, 2018.Accounts receivable and inventories, combined, at December 31, 2019 were $90.2 million higher than at December 31, 2018. Inventories as of December 31,2019 included stock related to the transition of production to products meeting new emissions standards in Europe. Weaker market conditions in many keymarkets contributed to lower net sales and resulting higher finished goods inventories as compared to 2018.
Share Repurchase Program
During 2019 and 2018, we repurchased 1,794,256 and 3,120,184 shares of our common stock, respectively, for approximately $130.0 million and$184.3 million, respectively, either through Accelerated Share Repurchase (“ASR”) agreements with financial institutions or through open markettransactions. All shares received were retired upon receipt, and the excess of the purchase price over par value per share was recorded to a combination of“Additional paid-in capital” and "Retained Earnings" within our Consolidated Balance Sheets.
In February 2020, we entered into an ASR agreement with a financial institution to repurchase an aggregate of $25.0 million of shares of ourcommon stock. We received approximately 297,000 shares to date in this transaction. Upon settlement of the ASR, we may be entitled to receive additionalshares of common stock or, under certain circumstances, be required to remit a settlement amount. We expect that the additional shares will be received by usupon final settlement of our current ASR agreement, which expires during the second quarter of 2020.
27

Table of Contents
Contractual Obligations
The future payments required under our significant contractual obligations, excluding foreign currency option and forward contracts, as ofDecember 31, 2019 are as follows (in millions):
Payments Due By Period
Total 2020 2021 to 2022 2023 to 2024 2025 andBeyond
Indebtedness(1) $ 1,270.9 $ 76.8 $ 468.3 $ 280.8 $ 445.0Interest payments related to indebtedness(2) 57.4 13.9 24.0 13.8 5.7Capital lease obligations 18.9 4.8 3.9 1.5 8.7Operating lease obligations 223.0 48.3 72.3 40.8 61.6Unconditional purchase obligations 127.7 102.1 25.4 0.2 —Other short-term and long-term obligations(3) 296.0 91.7 105.8 50.9 47.6
Total contractual cash obligations $ 1,993.9 $ 337.6 $ 699.7 $ 388.0 $ 568.6
Amount of Commitment Expiration Per Period
Total 2020 2021 to 2022 2023 to 2024 2025 andBeyond
Standby letters of credit and similar instruments $ 14.8 $ 14.8 $ — $ — $ —Guarantees 66.6 44.7 13.0 8.4 0.5
Total commercial commitments and letters of credit $ 81.4 $ 59.5 $ 13.0 $ 8.4 $ 0.5_______________________________________(1) Indebtedness amounts reflect the principal amount of our senior term loan, senior notes and credit facility.(2) Estimated interest payments are calculated assuming current interest rates over minimum maturity periods specified in debt agreements. Debt may be repaid sooner or later than such minimum
maturity periods.(3) Other short-term and long-term obligations include estimates of future minimum contribution requirements under our U.S. and non-U.S. defined benefit pension and postretirement plans.
These estimates are based on current legislation in the countries we operate within and are subject to change. Other short-term and long-term obligations also include income tax liabilitiesrelated to uncertain income tax positions connected with ongoing income tax audits in various jurisdictions.
Commitments and Off-Balance Sheet Arrangements
Guarantees
We maintain a remarketing agreement with our finance joint venture in the United States, whereby we are obligated to repurchase up to $6.0 millionof repossessed equipment each calendar year. We believe any losses that might be incurred on the resale of this equipment will not materially impact ourfinancial position or results of operations, due to the fact that the repurchase obligation would be equivalent to the fair value of the underlying equipment.
At December 31, 2019, we guaranteed indebtedness owed to third parties of approximately $47.6 million, primarily related to dealer and end-userfinancing of equipment. Such guarantees generally obligate us to repay outstanding finance obligations owed to financial institutions if dealers or end usersdefault on such loans through 2025. Losses under such guarantees historically have been insignificant. In addition, we generally would expect to be able torecover a significant portion of the amounts paid under such guarantees from the sale of the underlying financed farm equipment, as the fair value of suchequipment is expected to offset a substantial portion of the amounts paid. We also have obligations to guarantee indebtedness owed to certain of our financejoint ventures if dealers or end users default on loans. Losses under such guarantees historically have been insignificant and the guarantees are not material.We believe the credit risk associated with all of these guarantees is not material to our financial position or results of operations.
In addition, at December 31, 2019, we had accrued approximately $18.9 million of outstanding guarantees of minimum residual values that may beowed to our finance joint ventures in the United States and Canada due upon expiration of certain eligible operating leases between the finance joint venturesand end users. The maximum potential amount of future payments under the guarantee is approximately $26.7 million.
28

Table of Contents
Other
At December 31, 2019, we had outstanding designated and non-designated foreign exchange contracts with a gross notional amount ofapproximately $3,133.0 million. The outstanding contracts as of December 31, 2019 range in maturity through December 2020.
As discussed in “Liquidity and Capital Resources,” we sell a majority of our wholesale accounts receivable in North America, Europe and Brazil toour U.S., Canadian, European and Brazilian finance joint ventures. We also sell certain accounts receivable under factoring arrangements to financialinstitutions around the world. We have determined that these facilities should be accounted for as off-balance sheet transactions.
Contingencies
We are party to various claims and lawsuits arising in the normal course of business. We closely monitor these claims and lawsuits and frequentlyconsult with our legal counsel to determine whether they may, when resolved, have a material adverse effect on our financial position or results of operationsand accrue and/or disclose loss contingencies as appropriate. See Note 12 of our Consolidated Financial Statements contained in Item 8, “FinancialStatements and Supplementary Data,” and Item 3, “Legal Proceedings,” for further information.
Related Parties
In the ordinary course of business, the Company engages in transactions with related parties. See Note 14 of our Consolidated Financial Statementscontained in Item 8, “Financial Statements and Supplementary Data,” for information regarding related party transactions and their impact to our consolidatedresults of operations and financial position.
Foreign Currency Risk Management
We have significant manufacturing locations in the United States, France, Germany, Finland, Italy, China and Brazil, and we purchase a portion ofour tractors, combines and components from third-party foreign suppliers, primarily in various European countries and in Japan. We also sell products inapproximately 140 countries throughout the world. The majority of our net sales outside the United States are denominated in the currency of the customerlocation, with the exception of sales in Middle East, Africa, Asia and parts of South America, where net sales are primarily denominated in British pounds,Euros, or the United States dollar.
We manage our transactional foreign currency exposure by hedging foreign currency cash flow forecasts and commitments arising from theanticipated settlement of receivables and payables and from future purchases and sales. Where naturally offsetting currency positions do not occur, we hedgecertain, but not all, of our exposures through the use of foreign currency contracts. Our translation exposure resulting from translating the financial statementsof foreign subsidiaries into United States dollars may be partially hedged from time to time. When practical, this translation impact is reduced by financinglocal operations with local borrowings. Our hedging policy prohibits use of foreign currency contracts for speculative trading purposes.
The total notional value of our foreign currency instruments was $3,133.0 million and $1,462.8 million as of December 31, 2019 and 2018,respectively, inclusive of both those instruments that are designated and qualified for hedge accounting and non-designated derivative instruments. We enterinto cash flow hedges to minimize the variability in cash flows of assets or liabilities or forecasted transactions caused by fluctuations in foreign currencyexchange rates, and we enter into foreign currency contracts to economically hedge receivables and payables on our balance sheets that are denominated inforeign currencies other than the functional currency. In addition, we use derivative and non-derivative instruments to hedge a portion of our net investment inforeign operations against adverse movements in exchange rates. See Note 11 of our Consolidated Financial Statements contained in Item 8, “FinancialStatements and Supplementary Data,” for further information about our hedging transactions and derivative instruments.
Assuming a 10% change relative to the currency of the hedge contracts, the fair value of the foreign currency instruments could be negativelyimpacted by approximately $22.3 million as of December 31, 2019. Due to the fact that these instruments are primarily entered into for hedging purposes, thegains or losses on the contracts would largely be offset by losses and gains on the underlying firm commitment or forecasted transaction.
29

Table of Contents
Interest Rate Risk
Our interest expense is, in part, sensitive to the general level of interest rates. We manage our exposure to interest rate risk through our mix offloating rate and fixed rate debt. From time to time, we enter into interest rate swap agreements to manage our exposure to interest rate fluctuations. See Notes7 and 11 of our Consolidated Financial Statements contained in Item 8, “Financial Statements and Supplementary Data,” for additional information about ourinterest rate swap agreements.
Based on our floating rate debt and our accounts receivable sales facilities outstanding at December 31, 2019, a 10% increase in interest rates, wouldhave increased, collectively, “Interest expense, net” and “Other expense, net” for the year ended December 31, 2019 by approximately $5.6 million.
Recent Accounting Pronouncements
See Note 1 of our Consolidated Financial Statements contained in Item 8, “Financial Statements and Supplementary Data,” for information regardingrecent accounting pronouncements and their impact to our consolidated results of operations and financial position.
Critical Accounting Estimates
We prepare our Consolidated Financial Statements in conformity with U.S. generally accepted accounting principles. In the preparation of thesefinancial statements, we make judgments, estimates and assumptions that affect the reported amounts of assets and liabilities, the disclosure of contingentassets and liabilities at the date of the financial statements and the reported amounts of revenues and expenses during the reporting period. The significantaccounting policies followed in the preparation of the financial statements are detailed in Note 1 of our Consolidated Financial Statements contained in Item8, “Financial Statements and Supplementary Data.” We believe that our application of the policies discussed below involves significant levels of judgment,estimates and complexity.
Due to the levels of judgment, complexity and period of time over which many of these items are resolved, actual results could differ from thoseestimated at the time of preparation of the financial statements. Adjustments to these estimates would impact our financial position and future results ofoperations.
Discount and Sales Incentive Allowances
We provide various volume bonus and sales incentive programs with respect to our products. These sales incentive programs include reductions ininvoice prices, reductions in retail financing rates, dealer commissions and dealer incentive allowances. In most cases, incentive programs are established andcommunicated to our dealers on a quarterly basis. The incentives are paid either at the time of the cash settlement of the receivable (which is generally at thetime of retail sale), at the time of retail financing, at the time of warranty registration, or at a subsequent time based on dealer purchase volumes. Theincentive programs are product line specific and generally do not vary by dealer. The cost of sales incentives associated with dealer commissions and dealerincentive allowances is estimated based upon the terms of the programs and historical experience, is based on a percentage of the sales price, and estimatesfor sales incentives are made and recorded at the time of sale for expected incentive programs using the expected value method. These estimates arereassessed each reporting period and are revised in the event of subsequent modifications to incentive programs, as they are communicated to dealers. Therelated provisions and accruals are made on a product or product-line basis and are monitored for adequacy and revised at least quarterly in the event ofsubsequent modifications to the programs. Interest rate subsidy payments, which are a reduction in retail financing rates, are recorded in the same manner asdealer commissions and dealer incentive allowances. Volume discounts are estimated and recognized based on historical experience, and related reserves aremonitored and adjusted based on actual dealer purchase volumes and the dealers’ progress towards achieving specified cumulative target levels. Estimates ofthese incentives are based on the terms of the programs and historical experience. All incentive programs are recorded and presented as a reduction ofrevenue, due to the fact that we do not receive a distinct good or service in exchange for the consideration provided. In the United States and Canada, reservesfor incentive programs related to accounts receivable not sold to our U.S. and Canadian finance joint ventures are recorded as “accounts receivableallowances” within our Consolidated Balance Sheets due to the fact that the incentives are paid through a reduction of future cash settlement of the receivable.Globally, reserves for incentive programs that will be paid in cash or credit memos, as is the case with most of our volume discount programs, as well as salesincentives associated with accounts receivable sold to our finance joint ventures, are recorded within “Accrued expenses” within our Consolidated BalanceSheets.
At December 31, 2019, we had recorded an allowance for discounts and sales incentives of approximately $606.1 million that will be paid eitherthrough a reduction of future cash settlements of receivables and through credit memos
30

Table of Contents
to our dealers or through reductions in retail financing rates paid to our finance joint ventures. If we were to allow an additional 1% of sales incentives anddiscounts at the time of retail sale for those sales subject to such discount programs, our reserve would increase by approximately $21.0 million as ofDecember 31, 2019. Conversely, if we were to decrease our sales incentives and discounts by 1% at the time of retail sale, our reserve would decrease byapproximately $21.0 million as of December 31, 2019.
Deferred Income Taxes and Uncertain Income Tax Positions
We recorded an income tax provision of $180.8 million in 2019 compared to $110.9 million in 2018 and $133.6 million in 2017. Our tax provisionand effective tax rate are impacted by the differing tax rates of the various tax jurisdictions in which we operate, permanent differences for items treateddifferently for financial accounting and income tax purposes, and for losses in jurisdictions where no income tax benefit is recorded.
During the third quarter of 2019, we recorded a non-cash adjustment to establish a valuation allowance against our Brazilian net deferred income taxassets of approximately $53.7 million. In addition, we maintain a valuation allowance to fully reserve against our net deferred tax assets in the United Statesand certain other foreign jurisdictions. A valuation allowance is established when it is more likely than not that some portion or all of the deferred tax assetswill not be realized. We assessed the likelihood that our deferred tax assets would be recovered from estimated future taxable income and available taxplanning strategies and determined that the adjustment to the valuation allowance was appropriate. In making this assessment, all available evidence wasconsidered including the current economic climate, as well as reasonable tax planning strategies. We believe it is more likely than not that we will realize ourremaining net deferred tax assets, net of the valuation allowance, in future years.
Swiss tax reform was enacted during 2019 and eliminates certain preferential tax items as well as implements new tax rates at both the federal andcantonal levels. During the three months ended December 31, 2019, the Company recognized a one-time income tax gain of approximately $21.8 millionassociated with the changing of Swiss federal and cantonal tax rates as well as recognition of a deferred tax asset associated with the estimated value of a taxbasis step-up of our Swiss subsidiary's assets.
On December 22, 2017, the Tax Cuts and Jobs Act (“the 2017 Tax Act”) was enacted in the United States. During the three months ended December31, 2017, we recorded a tax provision of approximately $42.0 million in accordance with Staff Accounting Bulletin No. 118, which provided SEC Staffguidance for the application of Accounting Standards Codification (“ASC”) 740 “Income Taxes,” in the reporting period in which the 2017 Tax Act wasenacted. The $42.0 million tax provision included a provisional income tax charge related to a one-time transition tax associated with the mandatory deemedrepatriation of unremitted foreign earnings. The tax provision also included a provisional income tax charge associated with the income tax consequencesrelated to the expected future repatriation of certain underlying foreign earnings, as historically, we have considered them to be permanently reinvested. Theremaining balance of the tax provision primarily related to the remeasurement of certain net deferred tax assets using the lower enacted U.S. Corporate taxrate (from 35% to 21%), as well as other miscellaneous related impacts. During the three months ended December 31, 2018, we finalized our calculationsrelated to the 2017 Tax Act and recorded an income tax benefit of approximately $8.4 million.
At December 31, 2019 and 2018, we had gross deferred tax assets of $396.0 million and $350.2 million, respectively, including $72.0 million and$74.5 million, respectively, related to net operating loss carryforwards. At December 31, 2019 and 2018, we had total valuation allowances as an offset to ourgross deferred tax assets of $169.1 million and $83.9 million, respectively, which included allowances primarily against net operating loss carryforwards inBrazil, China, Hungary, the United Kingdom and the Netherlands, as well as allowances against our net deferred taxes primarily in the U.S. and Brazil, aspreviously discussed. Realization of the remaining deferred tax assets as of December 31, 2019 will depend on generating sufficient taxable income in futureperiods, net of reversing deferred tax liabilities. We believe it is more likely than not that the remaining net deferred tax assets will be realized.
We recognize income tax benefits from uncertain tax positions only when there is a more than 50% likelihood that the tax positions will be sustainedupon examination by the taxing authorities based on the technical merits of the positions. As of December 31, 2019 and 2018, we had approximately $210.7million and $166.1 million, respectively, of gross unrecognized tax benefits, all of which would impact our effective tax rate if recognized. As ofDecember 31, 2019 and 2018, we had approximately $51.0 million and $58.5 million, respectively, of current accrued taxes related to uncertain income taxpositions connected with ongoing tax audits in various jurisdictions that we expect to settle or pay in the next 12 months. We recognize interest and penaltiesrelated to uncertain income tax positions in income tax expense. As of December 31, 2019 and 2018, we had accrued interest and penalties related tounrecognized tax benefits of approximately $28.4 million and $27.2 million, respectively. See Note 6 of our Consolidated Financial Statements for furtherdiscussion of our uncertain income tax positions.
31

Table of Contents
Pensions
We sponsor defined benefit pension plans covering certain employees, principally in the United Kingdom, the United States, Germany, Switzerland,Finland, France, Norway and Argentina. Our primary plans cover certain employees in the United States and the United Kingdom.
In the United States, we sponsor a funded, qualified defined benefit pension plan for our salaried employees, as well as a separate funded qualifieddefined benefit pension plan for our hourly employees. Both plans are closed to new entrants and frozen, and we fund at least the minimum contributionsrequired under the Employee Retirement Income Security Act of 1974 and the Internal Revenue Code to both plans. In addition, we maintain an unfunded,nonqualified defined benefit pension plan for certain senior executives, which is our Executive Nonqualified Pension Plan (“ENPP”). The ENPP is alsoclosed to new entrants.
In the United Kingdom, we sponsor a funded defined benefit pension plan that provides an annuity benefit based on participants’ final averageearnings and service. Participation in this plan is limited to certain older, longer service employees and existing retirees. This plan is closed to newparticipants.
See Note 8 of our Consolidated Financial Statements contained in Item 8, “Financial Statements and Supplementary Data,” for additionalinformation regarding costs and assumptions for employee retirement benefits.
Nature of Estimates Required. The measurement date for all of our benefit plans is December 31. The measurement of our pension obligations, costsand liabilities is dependent on a variety of assumptions provided by management and used by our actuaries. These assumptions include estimates of thepresent value of projected future pension payments to all plan participants, taking into consideration the likelihood of potential future events such as salaryincreases and demographic experience. These assumptions may have an effect on the amount and timing of future contributions.
Assumptions and Approach Used. The assumptions used in developing the required estimates include, but are not limited to, the following keyfactors:
• Discount rates • Inflation• Salary growth • Expected return on plan assets• Retirement rates and ages • Mortality rates
For the years ended December 31, 2019, 2018 and 2017, we used a globally consistent methodology to set the discount rate in the countries whereour largest benefit obligations exist. In the United States, the United Kingdom and the Euro Zone, we constructed a hypothetical bond portfolio of high-quality corporate bonds and then applied the cash flows of our benefit plans to those bond yields to derive a discount rate. The bond portfolio and plan-specific cash flows vary by country, but the methodology in which the portfolio is constructed is consistent. In the United States, the bond portfolio is largeenough to result in taking a “settlement approach” to derive the discount rate, in which high-quality corporate bonds are assumed to be purchased and theresulting coupon payments and maturities are used to satisfy our U.S. pension plans’ projected benefit payments. In the United Kingdom and the Euro Zone,the discount rate is derived using a “yield curve approach,” in which an individual spot rate, or zero coupon bond yield, for each future annual period isdeveloped to discount each future benefit payment and, thereby, determine the present value of all future payments. The Company uses a spot yield curve todetermine the discount rate applicable in the United Kingdom to measure the U.K. pension plan’s service cost and interest cost. Under the settlement andyield curve approaches, the discount rate is set to equal the single discount rate that produces the same present value of all future payments.
The other key assumptions and methods were set as follows:
• Our inflation assumption is based on an evaluation of external market indicators.• The salary growth assumptions reflect our long-term actual experience, the near-term outlook and assumed inflation.• The expected return on plan asset assumptions reflects asset allocations, investment strategy, historical experience and the views of investment
managers, and reflects a projection of the expected arithmetic returns over ten years.• Determination of retirement rates and ages as well as termination rates, based on actual plan experience, actuarial standards of practice and the
manner in which our defined benefit plans are being administered.
32

Table of Contents
• The mortality rates for the U.K. defined benefit pension plan was updated in 2019 to reflect the latest expected improvements in the life expectancyof the plan participants. The mortality rates for the U.S. defined benefit pension plans were updated in 2019 to reflect the Society of Actuaries’ mostrecent findings on the topic of mortality.
• The fair value of assets used to determine the expected return on assets does not reflect any delayed recognition of asset gains and losses.
The effects of actual results differing from our assumptions are accumulated and amortized over future periods and, therefore, generally affect ourrecognized expense in such periods.
Our U.S. and U.K. defined benefit pension plans, including our ENPP, comprised approximately 86% of our consolidated projected benefitobligation as of December 31, 2019. If the discount rate used to determine the 2019 projected benefit obligation for our U.S. qualified defined benefit pensionplans and our ENPP was decreased by 25 basis points, our projected benefit obligation would have increased by approximately $4.8 million at December 31,2019, and our 2020 pension expense would increase by approximately $0.5 million. If the discount rate used to determine the 2019 projected benefitobligation for our U.S. qualified defined benefit pension plans and our ENPP was increased by 25 basis points, our projected benefit obligation would havedecreased by approximately $4.5 million at December 31, 2019, and our 2020 pension expense would decrease by approximately $0.5 million. If the discountrate used to determine the projected benefit obligation for our U.K. defined benefit pension plan was decreased by 25 basis points, our projected benefitobligation would have increased by approximately $25.3 million at December 31, 2019, and our 2020 pension expense would increase by approximately$0.2 million. If the discount rate used to determine the projected benefit obligation for our U.K. defined benefit pension plan was increased by 25 basis points,our projected benefit obligation would have decreased by approximately $23.1 million at December 31, 2019, and our 2020 pension expense would decreaseby approximately $0.3 million. In addition, if the expected long-term rate of return on plan assets related to our U.K. defined benefit pension plan wasincreased or decreased by 25 basis points, our 2020 pension expense would decrease or increase by approximately $1.6 million each, respectively. The impactto our U.S. defined benefit pension plans for a 25-basis-point change in our expected long-term rate of return would decrease or increase our 2020 pensionexpense by approximately $0.1 million, respectively.
Unrecognized actuarial net losses related to our defined benefit pension plans and ENPP were $362.2 million as of December 31, 2019 compared to$356.7 million as of December 31, 2018. The increase in unrecognized net actuarial losses between years primarily resulted from lower discount rates atDecember 31, 2019 compared to December 31, 2018. The unrecognized net actuarial losses will be impacted in future periods by actual asset returns,discount rate changes, currency exchange rate fluctuations, actual demographic experience and certain other factors. For some of our defined benefit pensionplans, these losses, to the extent they exceed 10% of the greater of the plan’s liabilities or the fair value of assets (“the gain/loss corridor”), will be amortizedon a straight-line basis over the periods discussed as follows. For our U.S. salaried, U.S. hourly and U.K. defined benefit pension plans, the populationcovered is predominantly inactive participants, and losses related to those plans, to the extent they exceed the gain/loss corridor, will be amortized over theaverage remaining lives of those participants while covered by the respective plan. For our ENPP, the population is predominantly active participants, andlosses related to the plan will be amortized over the average future working lifetime of the active participants expected to receive benefits. As ofDecember 31, 2019, the average amortization periods were as follows:
ENPP U.S. Plans U.K. PlanAverage amortization period of losses related to defined benefit pension plans 7 years 15 years 19 years
Unrecognized prior service cost related to our defined benefit pension plans was $22.5 million as of December 31, 2019 compared to $19.5 millionas of December 31, 2018. The increase in the unrecognized prior service cost between years is due primarily to a plan amendment related to our ENPP.
As of December 31, 2019, our unfunded or underfunded obligations related to our defined benefit pension plans and ENPP were approximately$206.3 million, primarily related to our defined benefit pension plans in Europe and the United States. In 2019, we contributed approximately $30.6 milliontowards those obligations, and we expect to fund approximately $33.6 million in 2020. Future funding is dependent upon compliance with local laws andregulations and changes to those laws and regulations in the future, as well as the generation of operating cash flows in the future. We currently have anagreement in place with the trustees of the U.K. defined benefit plan that obligates us to fund approximately £15.3 million per year (or approximately $20.2million) towards that obligation through December 2021. The funding arrangement is based upon the current funded status and could change in the future asdiscount rates, local laws and regulations, and other factors change.
33
Table of Contents
See Note 8 of our Consolidated Financial Statements contained in Item 8, “Financial Statements and Supplementary Data,” for more informationregarding the investment strategy and concentration of risk.
Goodwill, Other Intangible Assets and Long-Lived Assets
We test goodwill for impairment, at the reporting unit level, annually and when events or circumstances indicate that fair value of a reporting unitmay be below its carrying value. A reporting unit is an operating segment or one level below an operating segment, for example, a component. We combineand aggregate two or more components of an operating segment as a single reporting unit if the components have similar economic characteristics. Ourreportable segments are not our reporting units.
Goodwill is evaluated for impairment annually as of October 1 using a qualitative assessment or a quantitative one-step assessment. If we elect toperform a qualitative assessment and determine the fair value of our reporting units more likely than not exceeds their carrying value of net assets, no furtherevaluation is necessary. For reporting units where we perform a one-step quantitative assessment, we compare the fair value of each reporting unit to itsrespective carrying value of net assets, including goodwill. If the fair value of the reporting unit exceeds its carrying value of net assets, the goodwill is notconsidered impaired. If the carrying value of net assets is higher than the fair value of the reporting unit, the impairment charge is the amount by which thecarrying value exceeds the reporting unit’s fair value.
We utilize a combination of valuation techniques, including a discounted cash flow approach and a market multiple approach, when makingquantitative goodwill assessments.
We review our long-lived assets, which include intangible assets subject to amortization, for impairment whenever events or changes incircumstances indicate that the carrying amount of an asset may not be recoverable. The evaluation for recoverability is performed at a level whereindependent cash flows may be attributed to either an asset or asset group. If we determine that the carrying amount of an asset or asset group is notrecoverable based on the expected undiscounted future cash flows of the asset or asset group, an impairment loss is recorded equal to the excess of thecarrying amounts over the estimated fair value of the long-lived assets. Estimates of future cash flows are based on many factors, including current operatingresults, expected market trends and competitive influences. We also evaluate the amortization periods assigned to our intangible assets to determine whetherevents or changes in circumstances warrant revised estimates of useful lives. Assets to be disposed of by sale are reported at the lower of the carrying amountor fair value, less estimated costs to sell.
We make various assumptions, including assumptions regarding future cash flows, market multiples, growth rates and discount rates, in ourassessments of the impairment of goodwill, other indefinite-lived intangible assets and long-lived assets. The assumptions about future cash flows and growthrates are based on the current and long-term business plans of the reporting unit or related to the long-lived assets. Discount rate assumptions are based on anassessment of the risk inherent in the future cash flows of the reporting unit or long-lived assets. These assumptions require significant judgments on our part,and the conclusions that we reach could vary significantly based upon these judgments.
Our goodwill impairment analysis conducted as of October 1, 2019 indicated that the carrying value of the net assets of our grain storage and proteinproduction systems business in Europe/Middle East was in excess of the fair value of the reporting unit, and therefore, we recorded a non-cash impairmentcharge of approximately $173.6 million within “Impairment charges” in our Consolidated Statements of Operations. In response to weakening marketconditions and resulting operating results, new management was put in place over the grain storage and protein productions systems business, tasked withconducting a full strategic review of the business, including that of the Europe/Middle East reporting unit. That full strategic review was completed in thefourth quarter of 2019, along with revised forecasts to include updated market conditions and strategic operating decisions. This impairment charge was asubstantial portion of the reporting unit's goodwill balance as of October 1, 2019.
During the three months ended December 31, 2019, we also recorded a non-cash impairment charge of approximately $3.0 million within“Impairment charges” in our Consolidated Statements of Operations. The impairment charge related to certain long-lived intangible assets associated with ourgrain storage and protein production systems operations within North America due to the discontinuation of a certain brand name and related products andcustomers.
Finally, our goodwill impairment analysis conducted as of October 1, 2019 also indicated that the fair value in excess of the carrying value of one ofour smaller reporting units was less than 10%, due to deteriorating market conditions for the products it sells. If market conditions and our overall results donot improve, we may incur an impairment charge related to this reporting unit in the future under the one-step process described above. The goodwillassociated with this reporting unit as of December 31, 2019 was approximately $20.0 million.
34

Table of Contents
The results of our goodwill and long-lived assets impairment analyses conducted as of October 1, 2018 and 2017 indicated that no reduction in thecarrying amount of goodwill and long-lived assets was required.
Numerous facts and circumstances are considered when evaluating the carrying amount of our goodwill. The fair value of a reporting unit isimpacted by the reporting unit’s expected financial performance, which is dependent upon the agricultural industry and other factors that could adverselyaffect the agricultural industry, including but not limited to, declines in the general economy, increases in farm input costs, weather conditions, lowercommodity prices and changes in the availability of credit. The estimated fair value of the individual reporting units is assessed for reasonableness byreviewing a variety of indicators evaluated over a reasonable period of time.
As of December 31, 2019, we had approximately $1,298.3 million of goodwill, after the goodwill impairment charge we recorded during the threemonths ended December 31, 2019. While our annual impairment testing in 2019 supported the carrying amount of this goodwill, we may be required to re-evaluate the carrying amount in future periods, thus utilizing different assumptions that reflect the then current market conditions and expectations, and,therefore, we could conclude that an impairment has occurred.
Recoverable Indirect Taxes
Our Brazilian operations incur value added taxes (“VAT”) on certain purchases of raw materials, components and services. These taxes areaccumulated as tax credits and create assets that are reduced by the VAT collected from our sales in the Brazilian market. We regularly assesses therecoverability of these tax credits, and establishes reserves when necessary against them, through analyses that include, amongst others, the history ofrealization, the transfer of tax credits to third parties as authorized by the government, anticipated changes in the supply chain and the future expectation oftax debits from our ongoing operations. We believe that these tax credits, net of established reserves are realizable. Our assessment of realization of these taxassets involves significant judgments on our part, and the conclusions that we reach could vary significantly based upon these judgments. We recordedapproximately $142.3 million and $156.0 million, respectively, of VAT tax credits, net of reserves, as of December 31, 2019 and 2018.
Item 7A. Quantitative and Qualitative Disclosures About Market Risk
The Quantitative and Qualitative Disclosures about Market Risk information required by this Item set forth under the captions “Management’sDiscussion and Analysis of Financial Condition and Results of Operations - Foreign Currency Risk Management” and “Interest Rate Risk” under Item 7 ofthis Form 10-K are incorporated herein by reference.
35

Table of Contents
Item 8. Financial Statements and Supplementary Data
The following Consolidated Financial Statements of AGCO and its subsidiaries for each of the years in the three-year period ended December 31,2019 are included in this Item:
PageReport of Independent Registered Public Accounting Firm 37Consolidated Statements of Operations for the years ended December 31, 2019, 2018 and 2017 40Consolidated Statements of Comprehensive Income (Loss) for the years ended December 31, 2019, 2018 and 2017 41Consolidated Balance Sheets as of December 31, 2019 and 2018 42Consolidated Statements of Stockholders’ Equity for the years ended December 31, 2019, 2018 and 2017 43Consolidated Statements of Cash Flows for the years ended December 31, 2019, 2018 and 2017 44Notes to Consolidated Financial Statements 45
The information under the heading “Quarterly Results” of Item 7 of this Form 10-K is incorporated herein by reference.
36

Table of Contents
Report of Independent Registered Public Accounting Firm
To the Stockholders and Board of DirectorsAGCO Corporation:
Opinion on the Consolidated Financial Statements
We have audited the accompanying consolidated balance sheets of AGCO Corporation and subsidiaries (the Company) as of December 31, 2019 and2018, the related consolidated statements of operations, comprehensive income (loss), stockholders’ equity, and cash flows for each of the years in the three-year period ended December 31, 2019, and the related notes and financial statement schedule II — Valuation and Qualifying Accounts (collectively, theconsolidated financial statements). In our opinion, the consolidated financial statements present fairly, in all material respects, the financial position of theCompany as of December 31, 2019 and 2018, and the results of its operations and its cash flows for each of the years in the three-year period endedDecember 31, 2019, in conformity with U.S. generally accepted accounting principles.
We also have audited, in accordance with the standards of the Public Company Accounting Oversight Board (United States) (PCAOB), theCompany’s internal control over financial reporting as of December 31, 2019, based on criteria established in Internal Control — Integrated Framework(2013) issued by the Committee of Sponsoring Organizations of the Treadway Commission, and our report dated February 28, 2020 expressed an unqualifiedopinion on the effectiveness of the Company’s internal control over financial reporting.
Changes in Accounting Principles
As discussed in Note 1 to the consolidated financial statements, the Company has changed its method of accounting for revenue recognition in 2018due to the adoption of Accounting Standards Codification 606, Revenue from Contracts with Customers.
As discussed in Note 1 to the consolidated financial statements, the Company has changed its method of accounting for leases in 2019 due to theadoption of Accounting Standards Codification 842, Leases.
Basis for Opinion
These consolidated financial statements are the responsibility of the Company’s management. Our responsibility is to express an opinion on theseconsolidated financial statements based on our audits. We are a public accounting firm registered with the PCAOB and are required to be independent withrespect to the Company in accordance with the U.S. federal securities laws and the applicable rules and regulations of the Securities and ExchangeCommission and the PCAOB.
We conducted our audits in accordance with the standards of the PCAOB. Those standards require that we plan and perform the audit to obtainreasonable assurance about whether the consolidated financial statements are free of material misstatement, whether due to error or fraud. Our audits includedperforming procedures to assess the risks of material misstatement of the consolidated financial statements, whether due to error or fraud, and performingprocedures that respond to those risks. Such procedures included examining, on a test basis, evidence regarding the amounts and disclosures in theconsolidated financial statements. Our audits also included evaluating the accounting principles used and significant estimates made by management, as wellas evaluating the overall presentation of the consolidated financial statements. We believe that our audits provide a reasonable basis for our opinion.
Critical Audit Matters
The critical audit matters communicated below are matters arising from the current period audit of the consolidated financial statements that werecommunicated or required to be communicated to the audit committee and that: (1) relate to accounts or disclosures that are material to the consolidatedfinancial statements and (2) involved our especially challenging, subjective, or complex judgments. The communication of critical audit matters does not alterin any way our opinion on the consolidated financial statements, taken as a whole, and we are not, by communicating the critical audit matters below,providing separate opinions on the critical audit matters or on the accounts or disclosures to which they relate.
37

Table of Contents
Assessment of the reserve and allowance for volume discounts and sales incentive programs in certain geographic regions
As discussed in Note 1 to the consolidated financial statements, the Company provides various volume discount and sales incentiveprograms with respect to its products. Sales incentive programs include reductions in invoice prices, reduction in retail financial rates, dealercommissions and dealer incentive allowances. Volume discounts and sales incentives are recorded at the time of sale as a reduction of revenue usingthe expected value method. As of December 31, 2019, the Company had accrued volume discounts and sales incentives of approximately $580.4million and an allowance for sales incentive discounts of approximately $25.7 million.
We identified the assessment of the reserve and allowance for volume discounts and sales incentive programs in certain geographicregions as a critical audit matter. Auditor judgment was required to evaluate certain assumptions which had a higher degree of measurementuncertainty. Key assumptions included estimated incentive rates, which were the estimated rates at which programs were applied to eligible products,and estimated achievement by dealers of specified cumulative target levels.
The primary procedures we performed to address this critical audit matter included the following. We tested certain internal controls overthe Company’s reserve and allowance for volume discounts and sales incentive process, including controls related to the development of the keyassumptions. For certain volume discounts and sales incentive programs, we compared the program details to dealer communications and the keyassumptions to historical results for similar programs. We assessed the Company’s historical ability to estimate key assumptions by comparing theprior year estimated amounts to actual discounts and sales incentives realized by the customers. We evaluated the Company’s key assumptions bycomparing them to actual results, including results of transactions occurring after year-end.
Assessment of gross unrecognized income tax benefits in certain jurisdictions
As discussed in Note 6 to the consolidated financial statements, the Company has recorded a liability for gross unrecognized income taxbenefits of approximately $210.7 million as of December 31, 2019. The Company recognizes income tax benefits from uncertain tax positions onlywhen there is a more than 50% likelihood that the tax positions will be sustained upon examination by the taxing authorities based on the technicalmerits of the positions.
We identified the assessment of gross unrecognized income tax benefits in certain jurisdictions as a critical audit matter. Complex auditorjudgment and specialized skills were required in evaluating the Company’s interpretation and application of tax law and the estimate of the amount oftax benefits expected to be realized.
The primary procedures we performed to address this critical audit matter included the following. We tested certain internal controls overthe Company’s gross unrecognized income tax benefit process. This included controls related to the Company’s consideration of information that couldaffect the recognition or measurement of income tax benefits from uncertain tax positions and the interpretation and application of tax laws. Weinvolved tax professionals with specialized skills and knowledge, who assisted in:
• inspecting correspondence and assessments from the taxing authorities;• evaluating the Company’s interpretation and application of tax laws; and• performing an independent assessment of the Company’s tax positions and comparing the results to the Company’s assessment.
Assessment of goodwill impairment for the grain storage and protein production systems Europe/Middle East reporting unit
As discussed in Note 1 to the consolidated financial statements, the Company evaluates goodwill for impairment as of October 1 andwhen events or circumstances indicate that fair value of a reporting unit may be below its carrying value. The Company performs its goodwillimpairment analysis using either a qualitative or a quantitative assessment. Based on the Company’s quantitative analysis of its grain storage andprotein production systems Europe/Middle East reporting unit, the Company determined that the carrying value of the reporting unit exceeded its fairvalue. As a result, the Company recorded the excess as a goodwill impairment charge of approximately $173.6 million.
We identified the assessment of goodwill impairment for the grain storage and protein production systems Europe/Middle East reportingunit as a critical audit matter because a high degree of subjective auditor judgment was required to evaluate the fair value of the reporting unit. The fairvalue estimation methodology used the following key
38

Table of Contents
assumptions for which there was limited observable market information: future cash flows, market multiples, revenue growth rates and discount rate.The determined fair value, which directly impacted the goodwill impairment charge, was sensitive to changes in these key assumptions.
The primary procedures we performed to address this critical audit matter included the following. We tested certain internal controls overthe Company’s goodwill impairment process, including controls over the key assumptions. We performed sensitivity analyses over the key assumptionsto assess their impact on the Company’s determination that the carrying value of the grain storage and protein production systems Europe/Middle Eastreporting unit exceeded its fair value. We compared the Company’s future cash flows and revenue growth rates used in the valuation model againstunderlying business strategies and growth plans. We compared the Company’s historical revenue forecasts to actual results to assess the Company’sability to forecast. In addition, we involved valuation professionals with specialized skills and knowledge who assisted in:
• comparing the Company’s discount rate inputs and market multiples to market data and publicly available information for comparable entities totest the selected discount rate and market multiples, and
• testing the estimate of fair value for the grain storage and protein production systems Europe/Middle East reporting unit using the Company’s cashflow forecast and discount rate, and comparing the results to the Company’s fair value estimate.
/s/ KPMG LLP
We have served as the Company’s auditor since 2002.
Atlanta, GeorgiaFebruary 28, 2020
39

Table of Contents
AGCO CORPORATION
CONSOLIDATED STATEMENTS OF OPERATIONS(in millions, except per share data)
Years Ended December 31, 2019 2018 2017Net sales $ 9,041.4 $ 9,352.0 $ 8,306.5Cost of goods sold 7,057.1 7,355.3 6,541.2
Gross profit 1,984.3 1,996.7 1,765.3Operating expenses:
Selling, general and administrative expenses 1,040.3 1,069.4 964.7Engineering expenses 343.4 355.2 323.4Impairment charges 176.6 — —Amortization of intangibles 61.1 64.7 57.0Restructuring expenses 9.0 12.0 11.2Bad debt expense 5.8 6.4 4.6
Income from operations 348.1 489.0 404.4Interest expense, net 19.9 53.8 45.1Other expense, net 67.1 74.9 75.5
Income before income taxes and equity in net earnings of affiliates 261.1 360.3 283.8Income tax provision 180.8 110.9 133.6
Income before equity in net earnings of affiliates 80.3 249.4 150.2Equity in net earnings of affiliates 42.5 34.3 39.1
Net income 122.8 283.7 189.3Net loss (income) attributable to noncontrolling interests 2.4 1.8 (2.9)
Net income attributable to AGCO Corporation and subsidiaries $ 125.2 $ 285.5 $ 186.4
Net income per common share attributable to AGCO Corporation and subsidiaries: Basic $ 1.64 $ 3.62 $ 2.34
Diluted $ 1.63 $ 3.58 $ 2.32
Cash dividends declared and paid per common share $ 0.63 $ 0.60 $ 0.56
Weighted average number of common and common equivalent shares outstanding: Basic 76.2 78.8 79.5
Diluted 77.0 79.7 80.2
See accompanying notes to Consolidated Financial Statements.
40

Table of Contents
AGCO CORPORATION
CONSOLIDATED STATEMENTS OF COMPREHENSIVE INCOME (LOSS)(in millions)
Years Ended December 31, 2019 2018 2017Net income $ 122.8 $ 283.7 $ 189.3Other comprehensive (loss) income, net of reclassification adjustments:
Defined benefit pension plans, net of taxes: Prior service cost arising during the year (4.7) (7.0) —Net loss recognized due to settlement 0.6 0.9 0.2Net actuarial (loss) gain arising during the year (23.3) (4.2) 6.6Amortization of prior service cost included in net periodic pension cost 1.6 1.3 1.3Amortization of net actuarial losses included in net periodic pension cost 11.8 11.7 11.3
Derivative adjustments: Net changes in fair value of derivatives (2.6) (1.1) 2.0Net (gains) losses reclassified from accumulated other comprehensive loss into income (0.1) 7.2 2.0
Foreign currency translation adjustments (20.6) (206.8) 57.8Other comprehensive (loss) income, net of reclassification adjustments (37.3) (198.0) 81.2Comprehensive income 85.5 85.7 270.5Comprehensive (income) loss attributable to noncontrolling interests (0.1) 6.0 (4.1)
Comprehensive income attributable to AGCO Corporation and subsidiaries $ 85.4 $ 91.7 $ 266.4
See accompanying notes to Consolidated Financial Statements.
41

Table of Contents
AGCO CORPORATION
CONSOLIDATED BALANCE SHEETS(in millions, except share amounts)
December 31,
2019 December 31,
2018ASSETS
Current Assets: Cash and cash equivalents $ 432.8 $ 326.1Accounts and notes receivable, net 800.5 880.3Inventories, net 2,078.7 1,908.7Other current assets 417.1 422.3
Total current assets 3,729.1 3,537.4Property, plant and equipment, net 1,416.3 1,373.1Right-of-use lease assets 187.3 —Investment in affiliates 380.2 400.0Deferred tax assets 93.8 104.9Other assets 153.0 142.4Intangible assets, net 501.7 573.1Goodwill 1,298.3 1,495.5
Total assets $ 7,759.7 $ 7,626.4LIABILITIES AND STOCKHOLDERS’ EQUITY
Current Liabilities: Current portion of long-term debt $ 2.9 $ 72.6Short-term borrowings 150.5 138.0Accounts payable 914.8 865.9Accrued expenses 1,654.2 1,522.4Other current liabilities 162.1 167.8
Total current liabilities 2,884.5 2,766.7Long-term debt, less current portion and debt issuance costs 1,191.8 1,275.3Operating lease liabilities 148.6 —Pensions and postretirement health care benefits 232.1 223.2Deferred tax liabilities 107.0 116.3Other noncurrent liabilities 288.7 251.4
Total liabilities 4,852.7 4,632.9Commitments and contingencies (Note 12) Stockholders’ Equity: AGCO Corporation stockholders’ equity:
Preferred stock; $0.01 par value, 1,000,000 shares authorized, no shares issued or outstanding in 2019 and 2018 — —Common stock; $0.01 par value, 150,000,000 shares authorized, 75,471,562 and 76,536,755 shares issued and
outstanding at December 31, 2019 and 2018, respectively 0.8 0.8Additional paid-in capital 4.7 10.2Retained earnings 4,443.5 4,477.3Accumulated other comprehensive loss (1,595.2) (1,555.4)
Total AGCO Corporation stockholders’ equity 2,853.8 2,932.9Noncontrolling interests 53.2 60.6
Total stockholders’ equity 2,907.0 2,993.5
Total liabilities and stockholders’ equity $ 7,759.7 $ 7,626.4
See accompanying notes to Consolidated Financial Statements.
42

Table of Contents
AGCO CORPORATION
CONSOLIDATED STATEMENTS OF STOCKHOLDERS’ EQUITY(in millions, except share amounts)
AdditionalPaid-inCapital
RetainedEarnings
Accumulated Other Comprehensive Loss
NoncontrollingInterests
TotalStockholders’
Equity
Common Stock DefinedBenefitPension
Plans
CumulativeTranslationAdjustment
Deferred(Losses)Gains on
Derivatives
AccumulatedOther
ComprehensiveLoss
Shares Amount
Balance, December 31, 2016 79,465,393 $ 0.8 $ 103.3 $ 4,113.6 $ (304.5) $ (1,128.4) $ (8.7) $ (1,441.6) $ 61.1 $ 2,837.2
Net income — — — 186.4 — — — — 2.9 189.3
Payment of dividends to shareholders — — — (44.5) — — — — — (44.5)
Issuance of restricted stock 12,066 — 0.8 — — — — — — 0.8
Issuance of stock awards 54,309 — (2.2) — — — — — — (2.2)
SSARs exercised 92,521 — (4.4) — — — — — — (4.4)
Stock compensation — — 39.1 — — — — — — 39.1
Investment by noncontrolling interest — — — — — — — — 0.5 0.5
Purchases and retirement of common stock (70,464) — — — — — — — — —
Adjustment related to the adoption of ASU 2016-09 — — — (1.7) — — — — — (1.7)
Defined benefit pension plans, net of taxes:
Net loss recognized due to settlement — — — — 0.2 — — 0.2 — 0.2
Net actuarial gain arising during year — — — — 6.6 — — 6.6 — 6.6
Amortization of prior service cost included in net periodic pensioncost — — — — 1.3 — — 1.3 — 1.3
Amortization of net actuarial losses included in net periodicpension cost — — — — 11.3 — — 11.3 — 11.3
Deferred gains and losses on derivatives, net — — — — — — 4.0 4.0 — 4.0
Change in cumulative translation adjustment — — — — — 56.6 — 56.6 1.2 57.8
Balance, December 31, 2017 79,553,825 0.8 136.6 4,253.8 (285.1) (1,071.8) (4.7) (1,361.6) 65.7 3,095.3
Net income (loss) — — — 285.5 — — — — (1.8) 283.7
Payment of dividends to shareholders — — — (47.1) — — — — — (47.1)
Issuance of restricted stock 12,629 — 0.8 — — — — — — 0.8
Issuance of stock awards 75,604 — (3.1) — — — — — — (3.1)
SSARs exercised 14,881 — (0.6) — — — — — — (0.6)
Stock compensation — — 45.5 — — — — — — 45.5
Investment by noncontrolling interests — — — — — — — — 1.0 1.0
Distribution to noncontrolling interest — — — — — — — — (0.1) (0.1)
Purchases and retirement of common stock (3,120,184) — (169.0) (15.3) — — — — — (184.3)
Adjustment related to the adoption of ASU 2014-09 — — — 0.4 — — — — — 0.4
Defined benefit pension plans, net of taxes:
Prior service cost arising during year — — — — (7.0) — — (7.0) — (7.0)
Net loss recognized due to settlement — — — — 0.9 — — 0.9 — 0.9
Net actuarial loss arising during year — — — — (4.2) — — (4.2) — (4.2)
Amortization of prior service cost included in net periodic pensioncost — — — — 1.3 — — 1.3 — 1.3
Amortization of net actuarial losses included in net periodicpension cost — — — — 11.7 — — 11.7 — 11.7
Deferred gains and losses on derivatives, net — — — — — — 6.1 6.1 — 6.1
Change in cumulative translation adjustment — — — — — (202.6) — (202.6) (4.2) (206.8)
Balance, December 31, 2018 76,536,755 0.8 10.2 4,477.3 (282.4) (1,274.4) 1.4 (1,555.4) 60.6 2,993.5
Net income (loss) — — — 125.2 — — — — (2.4) 122.8
Payment of dividends to shareholders — — — (48.0) — — — — — (48.0)
Issuance of restricted stock 14,105 — 1.0 — — — — — — 1.0
Issuance of stock awards 608,444 — (13.3) (9.7) — — — — — (23.0)
SSARs exercised 106,514 — (3.1) (1.7) — — — — — (4.8)
Stock compensation — — 40.3 — — — — — — 40.3
Investment by noncontrolling interests — — — — — — — — 2.0 2.0
Distribution to noncontrolling interest — — — — — — — — (0.4) (0.4)
Changes in noncontrolling interest — — — — — — — — (9.1) (9.1)
Purchases and retirement of common stock (1,794,256) — (30.4) (99.6) — — — — — (130.0)
Defined benefit pension plans, net of taxes:
Prior service cost arising during year — — — — (4.7) — — (4.7) — (4.7)
Net loss recognized due to settlement — — — — 0.6 — — 0.6 — 0.6
Net actuarial loss arising during year — — — — (23.3) — — (23.3) — (23.3)
Amortization of prior service cost included in net periodic pension — — — — 1.6 — — 1.6 — 1.6
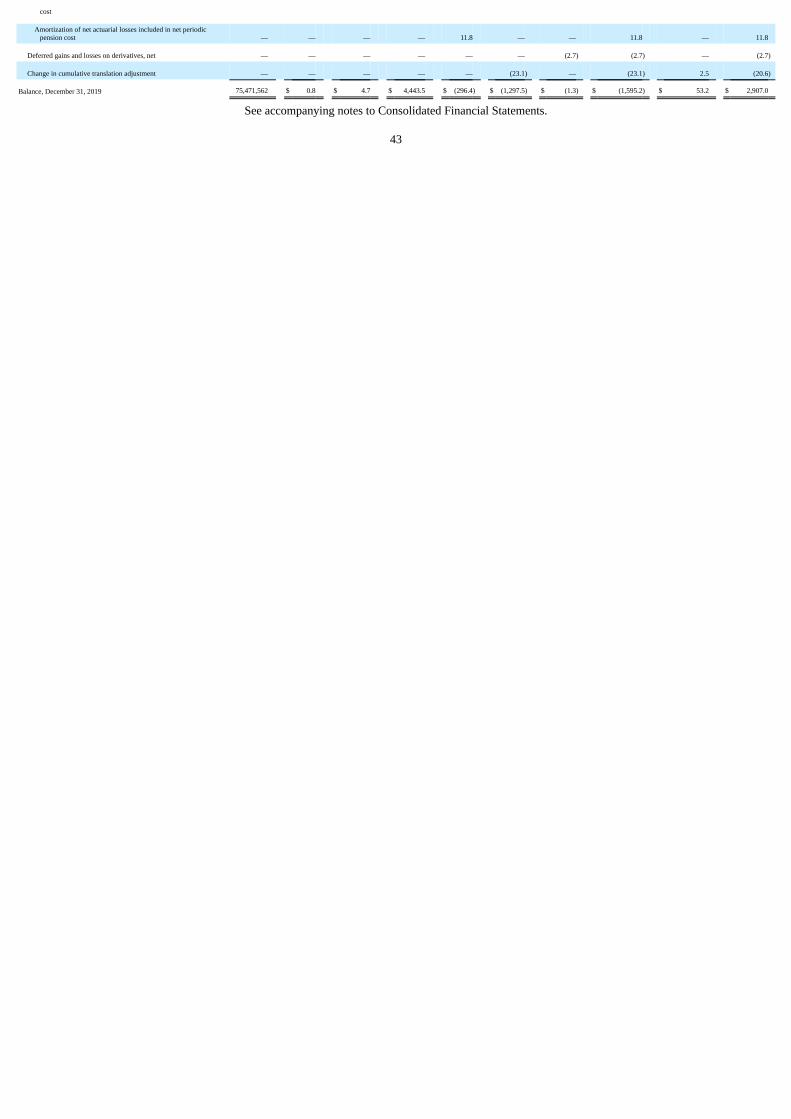
cost Amortization of net actuarial losses included in net periodic
pension cost — — — — 11.8 — — 11.8 — 11.8
Deferred gains and losses on derivatives, net — — — — — — (2.7) (2.7) — (2.7)
Change in cumulative translation adjustment — — — — — (23.1) — (23.1) 2.5 (20.6)
Balance, December 31, 2019 75,471,562 $ 0.8 $ 4.7 $ 4,443.5 $ (296.4) $ (1,297.5) $ (1.3) $ (1,595.2) $ 53.2 $ 2,907.0
See accompanying notes to Consolidated Financial Statements.
43

Table of Contents
AGCO CORPORATION
CONSOLIDATED STATEMENTS OF CASH FLOWS(in millions)
Years Ended December 31, 2019 2018 2017Cash flows from operating activities:
Net income $ 122.8 $ 283.7 $ 189.3Adjustments to reconcile net income to net cash provided by operating activities:
Depreciation 210.9 225.2 222.8Impairment charges 176.6 — —Amortization of intangibles 61.1 64.7 57.0Stock compensation expense 41.3 46.3 38.2Equity in net earnings of affiliates, net of cash received — (3.2) 41.2Deferred income tax provision (benefit) 15.1 (14.7) (14.1)Loss on extinguishment of debt — 24.5 —Other 6.9 2.6 3.0Changes in operating assets and liabilities, net of effects from purchase of businesses:
Accounts and notes receivable, net 63.8 63.3 (34.7)Inventories, net (216.3) (214.3) (196.0)Other current and noncurrent assets (14.4) (85.6) (36.6)Accounts payable 35.7 (24.3) 123.5Accrued expenses 114.5 161.3 149.0Other current and noncurrent liabilities 77.9 66.4 35.0
Total adjustments 573.1 312.2 388.3Net cash provided by operating activities 695.9 595.9 577.6
Cash flows from investing activities: Purchases of property, plant and equipment (273.4) (203.3) (203.9)Proceeds from sale of property, plant and equipment 4.9 3.2 4.1Purchase of businesses, net of cash acquired — — (293.1)Investments in unconsolidated affiliates (3.1) (5.8) (0.8)Other — 0.4 —
Net cash used in investing activities (271.6) (205.5) (493.7)Cash flows from financing activities:
Proceeds from indebtedness 2,082.7 5,257.5 3,513.9Repayments of indebtedness (2,191.1) (5,433.6) (3,639.7)Purchases and retirement of common stock (130.0) (184.3) —Payment of dividends to stockholders (48.0) (47.1) (44.5)Payment of minimum tax withholdings on stock compensation (28.1) (4.0) (6.9)Payment of debt issuance costs (0.5) (2.7) —Investments by noncontrolling interests, net 1.6 0.9 0.5
Net cash used in financing activities (313.4) (413.3) (176.7)Effect of exchange rate changes on cash, cash equivalents and restricted cash (4.2) (18.7) 30.8Increase (decrease) in cash, cash equivalents and restricted cash 106.7 (41.6) (62.0)Cash, cash equivalents and restricted cash, beginning of year 326.1 367.7 429.7
Cash, cash equivalents and restricted cash, end of year $ 432.8 $ 326.1 $ 367.7
See accompanying notes to Consolidated Financial Statements.
44

Table of ContentsAGCO CORPORATION
NOTES TO CONSOLIDATED FINANCIAL STATEMENTS
1. Operations and Summary of Significant Accounting Policies
Business
AGCO Corporation and subsidiaries (“AGCO” or the “Company”) is a leading manufacturer and distributor of agricultural equipment and relatedreplacement parts throughout the world. The Company sells a full range of agricultural equipment, including tractors, combines, hay tools, sprayers, forageequipment, seeding and tillage equipment, implements, and grain storage and protein production systems. The Company’s products are widely recognized inthe agricultural equipment industry and are marketed under a number of well-known brand names including: Challenger®, Fendt®, GSI®, Massey Ferguson®
and Valtra®. The Company distributes most of its products through a combination of approximately 3,275 independent dealers and distributors as well as theCompany utilizes associates and licensees to provide a distribution channel for its products. In addition, the Company provides retail financing through itsfinance joint ventures with Coöperatieve Centrale Raiffeisen-Boerenleenbank B.A., or “Rabobank.”
Basis of Presentation and Consolidation
The Company’s Consolidated Financial Statements represent the consolidation of all wholly-owned companies, majority-owned companies and jointventures in which the Company has been determined to be the primary beneficiary. The Company consolidates a variable interest entity (“VIE”) if theCompany determines it is the primary beneficiary. The primary beneficiary of a VIE is the party that has both the power to direct the activities that mostsignificantly impact the entity’s economic performance and the obligation to absorb losses or the right to receive benefits that potentially could be significantto the VIE. The Company also consolidates all entities that are not considered VIEs if it is determined that the Company has a controlling voting interest todirect the activities that most significantly impact the joint venture or entity. The Company records investments in all other affiliate companies using theequity method of accounting when it has significant influence. Other investments, including those representing an ownership interest of less than 20%, arerecorded at cost. All significant intercompany balances and transactions have been eliminated in the Consolidated Financial Statements. Certain prior periodamounts have been reclassified to conform to the current period presentation.
Use of Estimates
The preparation of financial statements in conformity with U.S. generally accepted accounting principles (“GAAP”) requires management to makeestimates and assumptions that affect the reported amounts of assets and liabilities and disclosure of contingent assets and liabilities at the date of the financialstatements and the reported amounts of revenues and expenses during the reporting period. Actual results could differ from those estimates. The estimatesmade by management primarily relate to accounts and notes receivable, inventories, deferred income tax valuation allowances, uncertain tax positions,goodwill and other identifiable intangible assets, and certain accrued liabilities, principally relating to reserves for volume discounts and sales incentives,warranty obligations, product liability and workers’ compensation obligations, and pensions and postretirement benefits.
Foreign Currency Translation
The financial statements of the Company’s foreign subsidiaries are translated into United States currency in accordance with Accounting StandardsCodification (“ASC”) 830, “Foreign Currency Matters.” Assets and liabilities are translated to United States dollars at period-end exchange rates. Income andexpense items are translated at average rates of exchange prevailing during the period. Translation adjustments are included in “Accumulated othercomprehensive loss” in stockholders’ equity within the Company’s Consolidated Balance Sheets. Gains and losses, which result from foreign currencytransactions, are included in the accompanying Consolidated Statements of Operations. The Company changed the functional currency of its wholly-ownedsubsidiary from the Argentinian peso to the U.S. dollar effective July 1, 2018.
45

Table of ContentsAGCO CORPORATION
NOTES TO CONSOLIDATED FINANCIAL STATEMENTS - (Continued)
Cash, Cash Equivalents and Restricted Cash
Cash and cash equivalents reported in the Consolidated Balance Sheets as of December 31, 2019, 2018 and 2017 and cash, cash equivalents andrestricted cash shown in the Consolidated Statements of Cash Flows for the years ended December 31, 2019, 2018 and 2017 are as follows (in millions):
December 31, 2019 December 31, 2018 December 31, 2017Cash(1) $ 412.3 $ 290.5 $ 317.0Cash equivalents(2) 17.3 35.6 50.7Restricted cash(3) 3.2 — —
Total $ 432.8 $ 326.1 $ 367.7____________________________________(1) Consisted primarily of cash on hand and bank deposits.(2) Consisted primarily of money market deposits, certificates of deposits and overnight investments. The Company considers all investments with an original maturity of three months or less to becash equivalents.(3) Consisted primarily of cash in escrow or held as guarantee to support specific requirements.
Accounts and Notes Receivable
Accounts and notes receivable arise from the sale of equipment and replacement parts to independent dealers, distributors or other customers. In theUnited States and Canada, amounts due from sales to dealers are immediately due upon a retail sale of the underlying equipment by the dealer with theexception of sales of grain storage and protein production systems as discussed further below. If not previously paid by the dealer in the United States andCanada, installment payments are required generally beginning after the interest-free period with the remaining outstanding equipment balance generally duewithin 12 months after shipment or delivery. These interest-free periods vary by product and generally range from one to 12 months. In limited circumstances,the Company provides sales terms, and in some cases, interest-free periods that are longer than 12 months for certain products. These are typically specifiedprograms predominately in the United States and Canada, that allow for interest-free periods and due dates of up to 24 months for certain products dependingon the year of the sale and the dealer or distributor’s ordering or sales volume during the preceding year. Interest generally is charged at or above primelending rates on the outstanding receivable balances after shipment or delivery and after interest-free periods. Sales terms of some highly seasonal productsprovide for payment and due dates based on a specified date during the year regardless of the shipment date. Equipment sold to dealers in the United Statesand Canada is paid in full on average within 12 months of shipment. Sales of replacement parts generally are payable within 30 days of shipment, with termsfor some larger, seasonal stock orders generally requiring payment within six months of shipment. Under normal circumstances, equipment may not bereturned. In certain regions, with respect to most equipment sales, including the United States and Canada, the Company is obligated to repurchase equipmentand replacement parts upon cancellation of a dealer or distributor contract. These obligations are required by national, state or provincial laws and require theCompany to repurchase a dealer or distributor’s unsold inventory, including inventories for which the receivable already has been paid. Actual interest-freeperiods are shorter than described above because the equipment receivable from dealers or distributors in some countries, such as in the United States andCanada, is generally due immediately upon sale of the equipment to a retail customer as discussed above. Receivables can also be paid prior to termsspecified in sales agreements. Under normal circumstances, interest is not forgiven and interest-free periods are not extended.
In other international markets, equipment sales generally are payable in full within 30 days to 180 days of shipment or delivery. Payment terms forsome highly seasonal products have a specified due date during the year regardless of the shipment or delivery date. For sales in most markets outside of theUnited States and Canada, the Company generally does not charge interest on outstanding receivables with its dealers and distributors. Sales of replacementparts generally are payable within 30 days to 90 days of shipment, with terms for some larger, seasonal stock orders generally payable within six months ofshipment.
In certain markets, there is a time lag, which varies based on the timing and level of retail demand, between the date the Company records a sale andwhen the dealer sells the equipment to a retail customer.
Sales of grain storage and protein production systems generally are payable within 30 days of shipment. In certain countries, sales of such systems inwhich the Company is responsible for construction or installation may be contingent upon customer acceptance, payment terms vary by market and product,with fixed payment schedules on all sales.
46

Table of ContentsAGCO CORPORATION
NOTES TO CONSOLIDATED FINANCIAL STATEMENTS - (Continued)
The following summarizes by geographic region, as a percentage of our consolidated net sales, amounts with maximum interest-free periods aspresented below (in millions):
Year Ended December 31, 2019 North
America South
America Europe/Middle
East Asia/Pacific/Africa Consolidated0 to 6 months $ 1,535.0 $ 802.2 $ 5,317.8 $ 718.5 $ 8,373.5 92.6%7 to 12 months 645.0 — 11.1 — 656.1 7.3%13 to 24 months 11.8 — — — 11.8 0.1%
$ 2,191.8 $ 802.2 $ 5,328.9 $ 718.5 $ 9,041.4 100.0%
The Company has an agreement to permit transferring, on an ongoing basis, a majority of its wholesale interest-bearing and non-interest bearingaccounts receivable in North America, Europe and Brazil to its U.S., Canadian, European and Brazilian finance joint ventures. Qualified dealers may obtainadditional financing through the Company’s U.S., Canadian, European and Brazilian finance joint ventures at the joint ventures’ discretion.
The Company provides various volume bonus and sales incentive programs with respect to its products. These sales incentive programs includereductions in invoice prices, reductions in retail financing rates, dealer commissions and dealer incentive allowances. In most cases, incentive programs areestablished and communicated to the Company’s dealers on a quarterly basis. The incentives are paid either at the time of the cash settlement of the receivable(which is generally at the time of retail sale), at the time of retail financing, at the time of warranty registration, or at a subsequent time based on dealerpurchase volumes. The incentive programs are product-line specific and generally do not vary by dealer. The cost of sales incentives associated with dealercommissions and dealer incentive allowances is estimated based upon the terms of the programs and historical experience, is based on a percentage of thesales price, and estimates for sales incentives are made and recorded at the time of sale for expected incentive programs using the expected value method.These estimates are reassessed each reporting period and are revised in the event of subsequent modifications to incentive programs, as they arecommunicated to dealers. The related provisions and accruals are made on a product or product-line basis and are monitored for adequacy and revised at leastquarterly in the event of subsequent modifications to the programs. Interest rate subsidy payments, which are a reduction in retail finance rates, are recordedin the same manner as dealer commissions and dealer incentive allowances. Volume discounts are estimated and recognized based on historical experience,and related reserves are monitored and adjusted based on actual dealer purchase volumes and the dealer’s progress towards achieving specified cumulativetarget levels. All incentive programs are recorded and presented as a reduction of revenue, due to the fact that the Company does not receive a distinct good orservice in exchange for the consideration provided. In the United States and Canada, reserves for incentive programs related to accounts receivable not sold toCompany’s U.S. and Canadian finance joint ventures are recorded as “accounts receivable allowances” within the Company’s Consolidated Balance Sheetsdue to the fact that the incentives are paid through a reduction of future cash settlement of the receivable. Globally, reserves for incentive programs that willbe paid in cash or credit memos, as is the case with most of the Company’s volume discount programs, as well as sales with incentives associated withaccounts receivable sold to its finance joint ventures, are recorded within “Accrued expenses” within the Company’s Consolidated Balance Sheets.
Accounts and notes receivable are shown net of allowances for sales incentive discounts available to dealers and for doubtful accounts. Cash flowsrelated to the collection of receivables are reported within “Cash flows from operating activities” within the Company’s Consolidated Statements of CashFlows. Accounts and notes receivable allowances at December 31, 2019 and 2018 were as follows (in millions):
2019 2018Sales incentive discounts $ 25.7 $ 24.2Doubtful accounts 28.8 31.7
$ 54.5 $ 55.9
In the United States and Canada, sales incentives can be paid through future cash settlements of receivables and through credit memos to Company’sdealers or through reductions in retail financing rates paid to the Company’s finance joint ventures. Outside of the United States and Canada, sales incentivescan be paid through cash or credit memos to the Company’s dealers or through reductions in retail financing rates paid to the Company’s finance jointventures. The Company transfers certain accounts receivable under its accounts receivable sales agreements with its finance joint ventures (see Note 4). TheCompany records such transfers as sales of accounts receivable when it is considered to have surrendered control of such
47

Table of ContentsAGCO CORPORATION
NOTES TO CONSOLIDATED FINANCIAL STATEMENTS - (Continued)
receivables under the provisions of Accounting Standards Update (“ASU”) 2009-16, “Transfers and Servicing (Topic 860): Accounting for Transfers ofFinancial Assets.” Cash payments made to the Company’s finance joint ventures for sales incentive discounts provided to dealers related to outstandingaccounts receivables sold are recorded within “Accrued expenses.”
Inventories
Inventories are valued at the lower of cost or net realizable value, using the first-in, first-out method. Net realizable value is the estimated sellingprice in the ordinary course of business, less reasonably predictable costs of completion, disposal and transportation. At December 31, 2019 and 2018, theCompany had recorded $178.6 million and $156.6 million, respectively, as an adjustment for surplus and obsolete inventories. These adjustments are reflectedwithin “Inventories, net” within the Company’s Consolidated Balance Sheets.
Inventories, net at December 31, 2019 and 2018 were as follows (in millions):
2019 2018Finished goods $ 780.1 $ 660.4Repair and replacement parts 611.5 587.3Work in process 213.4 217.5Raw materials 473.7 443.5
Inventories, net $ 2,078.7 $ 1,908.7
Cash flows related to the sale of inventories are reported within “Cash flows from operating activities” within the Company’s ConsolidatedStatements of Cash Flows.
Recoverable Indirect Taxes
The Company’s Brazilian operations incur value added taxes (“VAT”) on certain purchases of raw materials, components and services. These taxesare accumulated as tax credits and create assets that are reduced by the VAT collected from the Company’s sales in the Brazilian market. The Companyregularly assesses the recoverability of these tax credits, and establishes reserves when necessary against them, through analyses that include, amongst others,the history of realization, the transfer of tax credits to third parties as authorized by the government, anticipated changes in the supply chain and the futureexpectation of tax debits from the Company’s ongoing operations. The Company believes that these tax credits, net of established reserves, are realizable. TheCompany had recorded approximately $142.3 million and $156.0 million, respectively, of VAT tax credits, net of reserves, as of December 31, 2019 and2018.
Property, Plant and Equipment
Property, plant and equipment are recorded at cost, less accumulated depreciation and amortization. Depreciation is provided on a straight-line basisover the estimated useful lives of ten to 40 years for buildings and improvements, three to 15 years for machinery and equipment and three to ten years forfurniture and fixtures. Expenditures for maintenance and repairs are charged to expense as incurred.
Property, plant and equipment, net at December 31, 2019 and 2018 consisted of the following (in millions):
2019 2018Land $ 142.5 $ 125.3Buildings and improvements 808.1 769.1Machinery and equipment 2,522.0 2,391.8Furniture and fixtures 153.4 148.6Gross property, plant and equipment 3,626.0 3,434.8Accumulated depreciation and amortization (2,209.7) (2,061.7)
Property, plant and equipment, net $ 1,416.3 $ 1,373.1
48

Table of ContentsAGCO CORPORATION
NOTES TO CONSOLIDATED FINANCIAL STATEMENTS - (Continued)
Goodwill, Other Intangible Assets and Long-Lived Assets
The Company tests goodwill for impairment, at the reporting unit level, annually and when events or circumstances indicate that fair value of areporting unit may be below its carrying value. A reporting unit is an operating segment or one level below an operating segment, for example, a component.The Company combines and aggregates two or more components of an operating segment as a single reporting unit if the components have similar economiccharacteristics. The Company’s reportable segments are not its reporting units.
Goodwill is evaluated annually as of October 1 for impairment using a qualitative assessment or a quantitative one-step assessment. If the Companyelects to perform a qualitative assessment and determines the fair value of its reporting units more likely than not exceed the carrying value of their net assets,no further evaluation is necessary. For reporting units where the Company performs a one-step quantitative assessment, the Company compares the fair valueof each reporting unit, which is determined based on a combination of a discounted cash flow valuation approach and a market multiple valuation approach,to its respective carrying value of net assets, including goodwill. If the fair value of the reporting unit exceeds its carrying value of net assets, the goodwill isnot considered impaired. If the carrying value of net assets is higher than the fair value of the reporting unit, the impairment charge is the amount by whichthe carrying value exceeds the reporting unit’s fair value in accordance with ASU 2017-04.
The Company reviews its long-lived assets, which include intangible assets subject to amortization, for impairment whenever events or changes incircumstances indicate that the carrying amount of an asset may not be recoverable. The evaluation for recoverability is performed at a level whereindependent cash flows may be attributed to either an asset or asset group. If the Company determines that the carrying amount of an asset or asset group isnot recoverable based on the expected undiscounted future cash flows of the asset or asset group, an impairment loss is recorded equal to the excess of thecarrying amounts over the estimated fair value of the long-lived assets. Estimates of future cash flows are based on many factors, including current operatingresults, expected market trends and competitive influences. The Company also evaluates the amortization periods assigned to its intangible assets todetermine whether events or changes in circumstances warrant revised estimates of useful lives. Assets to be disposed of by sale are reported at the lower ofthe carrying amount or fair value, less estimated costs to sell.
The Company’s goodwill impairment analysis conducted as of October 1, 2019 indicated that the carrying value of the net assets of the Company’sgrain storage and protein production systems operations in Europe/Middle East was in excess of the fair value of the reporting unit, and therefore, theCompany recorded a non-cash impairment charge of approximately $173.6 million within “Impairment charges” in the Company’s Consolidated Statementsof Operations. In response to weakening market conditions and resulting operating results, new management was put in place over the grain storage andprotein productions systems business, tasked with conducting a full strategic review of the business, including that of the Europe/Middle East reportingunit. That full strategic review was completed in the fourth quarter of 2019, along with revised forecasts to include updated market conditions and strategicoperating decisions.
During the three months ended December 31, 2019, the Company also recorded a non-cash impairment charge of approximately $3.0 million within“Impairment charges” in the Company’s Consolidated Statements of Operations. The impairment charge related to certain long-lived intangible assetsassociated with the Company’s grain storage and protein production systems operations within North America, due to the discontinuation of a certain brandname and related product, and customers.
The results of the Company’s goodwill and long-lived assets impairment analyses conducted as of October 1, 2018 and 2017 indicated that noreduction in the carrying amount of the Company’s goodwill and long-lived assets was required.
The Company’s accumulated goodwill impairment is approximately $354.1 million related to impairment charges the Company recorded during2019, 2012 and 2006 pertaining to its grain storage and protein production systems business in Europe/Middle East, its Chinese harvesting reporting unit andits former sprayer reporting unit, respectively. The Company’s grain storage and protein production systems Europe/Middle East reporting unit operateswithin the Europe/Middle East geographical reportable segment. The Chinese harvesting business operates within the Asia/Pacific/Africa geographicalreportable segment and the former sprayer reporting unit operates within the North American geographical reportable segment.
49

Table of ContentsAGCO CORPORATION
NOTES TO CONSOLIDATED FINANCIAL STATEMENTS - (Continued)
Changes in the carrying amount of goodwill during the years ended December 31, 2019, 2018 and 2017 are summarized as follows (in millions):
North America South America Europe/Middle
East Asia/Pacific/Africa ConsolidatedBalance as of December 31, 2016 $ 543.9 $ 138.8 $ 581.9 $ 111.8 $ 1,376.4Acquisitions 67.2 — 17.4 — 84.6Foreign currency translation — (2.4) 71.7 11.1 80.4Balance as of December 31, 2017 611.1 136.4 671.0 122.9 1,541.4Adjustments — — 8.4 — 8.4Foreign currency translation — (19.7) (29.8) (4.8) (54.3)Balance as of December 31, 2018 611.1 116.7 649.6 118.1 1,495.5Impairment charge — — (173.6) — (173.6)Sale of a joint venture (5.1) — — — (5.1)Foreign currency translation — (4.5) (12.7) (1.3) (18.5)
Balance as of December 31, 2019 $ 606.0 $ 112.2 $ 463.3 $ 116.8 $ 1,298.3
The Company amortizes certain acquired identifiable intangible assets primarily on a straight-line basis over their estimated useful lives, whichrange from five to 50 years. The acquired intangible assets have a weighted average useful life as follows:
Intangible Assets Weighted-Average
Useful LifePatents and technology 12 yearsCustomer relationships 13 yearsTrademarks and trade names 20 yearsLand use rights 45 years
For the years ended December 31, 2019, 2018 and 2017, acquired intangible asset amortization was $61.1 million, $64.7 million and $57.0 million,respectively. The Company estimates amortization of existing intangible assets will be $59.6 million in 2020, $56.8 million in 2021, $56.3 million in 2022,$53.8 million in 2023, and $52.3 million in 2024.
The Company has previously determined that two of its trademarks have an indefinite useful life. The Massey Ferguson trademark has been inexistence since 1952 and was formed from the merger of Massey-Harris (established in the 1890’s) and Ferguson (established in the 1930’s). The MasseyFerguson brand is currently sold in approximately 110 countries worldwide, making it one of the most widely sold tractor brands in the world. The Companyalso has identified the Valtra trademark as an indefinite-lived asset. The Valtra trademark has been in existence since the late 1990’s, but is a derivative of theValmet trademark which has been in existence since 1951. The Valmet name transitioned to the Valtra name over a period of time in the marketplace. TheValtra brand is currently sold in over 75 countries around the world. Both the Massey Ferguson brand and the Valtra brand are primary product lines of theCompany’s business, and the Company plans to use these trademarks for an indefinite period of time. The Company plans to continue to make investments inproduct development to enhance the value of these brands into the future. There are no legal, regulatory, contractual, competitive, economic or other factorsthat the Company is aware of or that the Company believes would limit the useful lives of the trademarks. The Massey Ferguson and Valtra trademarkregistrations can be renewed at a nominal cost in the countries in which the Company operates.
50

Table of ContentsAGCO CORPORATION
NOTES TO CONSOLIDATED FINANCIAL STATEMENTS - (Continued)
Changes in the carrying amount of acquired intangible assets during 2019 and 2018 are summarized as follows (in millions):
Trademarks and
Trade Names Customer
Relationships Patents andTechnology Land Use Rights Total
Gross carrying amounts: Balance as of December 31, 2017 $ 208.4 $ 600.4 $ 160.0 $ 9.1 $ 977.9Foreign currency translation (5.0) (14.1) (4.2) (0.5) (23.8)Balance as of December 31, 2018 203.4 586.3 155.8 8.6 954.1Sale of a joint venture (1.3) (2.9) (1.9) — (6.1)Impairment charge (1.1) (0.8) (1.1) — (3.0)Foreign currency translation (1.7) (3.6) (1.7) (0.1) (7.1)
Balance as of December 31, 2019 $ 199.3 $ 579.0 $ 151.1 $ 8.5 $ 937.9
Trademarks and
Trade Names Customer
Relationships Patents andTechnology
Land UseRights Total
Accumulated amortization: Balance as of December 31, 2017 $ 61.4 $ 279.7 $ 73.4 $ 3.0 $ 417.5Amortization expense 13.7 40.7 10.1 0.2 64.7Foreign currency translation (1.7) (9.6) (2.8) (0.2) (14.3)Balance as of December 31, 2018 73.4 310.8 80.7 3.0 467.9Amortization expense 11.0 40.1 9.9 0.1 61.1Sale of a joint venture (0.5) (1.2) (0.7) — (2.4)Foreign currency translation (0.6) (2.3) (1.2) — (4.1)
Balance as of December 31, 2019 $ 83.3 $ 347.4 $ 88.7 $ 3.1 $ 522.5
Trademarks and
Trade NamesIndefinite-lived intangible assets: Balance as of December 31, 2017 $ 88.6Foreign currency translation (1.7)Balance as of December 31, 2018 86.9Foreign currency translation (0.6)
Balance as of December 31, 2019 $ 86.3
Accrued Expenses
Accrued expenses at December 31, 2019 and 2018 consisted of the following (in millions):
2019 2018Reserve for volume discounts and sales incentives $ 580.4 $ 537.7Warranty reserves 331.9 308.6Accrued employee compensation and benefits 290.8 286.2Accrued taxes 170.3 137.8Other 280.8 252.1
$ 1,654.2 $ 1,522.4
51

Table of ContentsAGCO CORPORATION
NOTES TO CONSOLIDATED FINANCIAL STATEMENTS - (Continued)
Warranty Reserves
The warranty reserve activity for the years ended December 31, 2019, 2018 and 2017 consisted of the following (in millions):
2019 2018 2017Balance at beginning of the year $ 360.9 $ 316.0 $ 255.6Acquisitions — — 5.1Accruals for warranties issued during the year 234.1 230.5 215.9Settlements made (in cash or in kind) during the year (198.7) (174.7) (183.1)Foreign currency translation (3.5) (10.9) 22.5
Balance at the end of the year $ 392.8 $ 360.9 $ 316.0
The Company’s agricultural equipment products generally are under warranty against defects in materials and workmanship for a period of one tofour years. The Company accrues for future warranty costs at the time of sale based on historical warranty experience. Approximately $60.9 million and$52.3 million of warranty reserves are included in “Other noncurrent liabilities” in the Company’s Consolidated Balance Sheets as of December 31, 2019 and2018, respectively.
The Company recognizes recoveries of the costs associated with warranties it provides when the collection is probable. When specifics of therecovery have been agreed upon with the Company’s suppliers through confirmation of liability for the recovery, the Company records the recovery within“Accounts and notes receivable, net.” Estimates of the amount of warranty claim recoveries to be received from the Company’s suppliers based uponcontractual supplier arrangements are recorded within “Other current assets.”
Insurance Reserves
Under the Company’s insurance programs, coverage is obtained for significant liability limits as well as those risks required to be insured by law orcontract. It is the policy of the Company to self-insure a portion of certain expected losses primarily related to workers’ compensation and comprehensivegeneral liability, product and vehicle liability. Provisions for losses expected under these programs are recorded based on the Company’s estimates of theaggregate liabilities for the claims incurred.
Revenue
The Company adopted ASU 2014-09, “Revenue from Contracts with Customers,” effective January 1, 2018 using the modified retrospectiveapproach.
Revenue is recognized when the Company satisfies the performance obligation by transferring control over goods or services to a dealer, distributoror other customer. The amount of revenue recognized is measured as the consideration the Company expects to receive in exchange for those goods orservices pursuant to a contract with the customer. A contract exists once the Company receives and accepts a purchase order under a dealer sales agreement,or once the Company enters into a contract with an end user. The Company does not recognize revenue in cases where collectability is not probable, anddefers the recognition until collection is probable or payment is received.
The Company generates revenue from the manufacture and distribution of agricultural equipment and replacement parts. Sales of equipment andreplacement parts, which represents a majority of the Company’s net sales, are recorded by the Company at the point in time when title and control have beentransferred to an independent dealer, distributor or other customer. Title generally passes to the dealer or distributor upon shipment or specified delivery, andthe risk of loss upon damage, theft or destruction of the equipment is the responsibility of the dealer, distributor or designated third-party carrier. TheCompany believes control passes and the performance obligation is satisfied at the point of the stated shipping or delivery term with respect to such sales.
As previously discussed, the amount of consideration the Company receives and the revenue recognized varies with certain sales incentives theCompany offers to dealers and distributors. Estimates for sales incentives are made at the time of sale for expected incentive programs using the expectedvalue method. These estimates are revised in the event of subsequent
52

Table of ContentsAGCO CORPORATION
NOTES TO CONSOLIDATED FINANCIAL STATEMENTS - (Continued)
modification to the incentive program. All incentive programs are recorded and presented as a reduction of revenue, due to the fact that the Company does notreceive a distinct good or service in exchange for the consideration provided.
Dealers or distributors may not return equipment or replacement parts while its contract with the Company is in force, except for under establishedpromotional and annual replacement parts return programs. At the time of sale, the Company estimates the amount of returns based on the terms ofpromotional and annual return programs and anticipated returns in the future.
Sales and other related taxes are excluded from the transaction price. Shipping and handling costs associated with freight activities after the customerhas obtained control are accounted for as fulfillment costs and are expensed and accrued at the time revenue is recognized in “Cost of goods sold” and“Selling, general and administrative expenses” in the Company’s Consolidated Statements of Operations.
The Company applied the practical expedient in ASU 2014-09 to not adjust the amount of revenue to be recognized under a contract with a dealer,distributor or other customer for the time value of money when the difference between the receipt of payment and the recognition of revenue is less than oneyear.
Although, substantially all revenue is recognized at a point in time, a relatively insignificant amount of installation revenue associated with the saleof grain storage and protein production systems is recognized on an “over time” basis as discussed below. The Company also recognizes revenue “over time”with respect to extended warranty or maintenance contracts and certain technology services. Generally, all of the contracts with customers that relate to “overtime” revenue recognition have contract durations of less than 12 months.
Grain Storage and Protein Production Systems Installation Revenue. In certain countries, the Company sells grain storage and protein productionsystems where the Company is responsible for construction and installation, and the sale is contingent upon customer acceptance. Under these conditions, therevenues are recognized over the term of the contract when the Company can objectively determine control has been transferred to the customer inaccordance with agreed-upon specifications in the contract. For these contracts, the Company may be entitled to receive an advance payment, which isrecognized as a contract liability for the amount in excess of the revenue recognized. The Company uses the input method using costs incurred to date relativeto total estimated costs at completion to measure the progress toward satisfaction of the performance obligation. Revenues are recorded proportionally ascosts are incurred. Costs include labor, material and overhead. The estimation of the progress toward completion is subject to various assumptions. As part ofthe estimation process, the Company reviews the length of time to complete the performance obligation, the cost of materials and labor productivity. If asignificant change in one of the assumptions occurs, then the Company will recognize an adjustment under the cumulative catch-up method and the impact ofthe adjustment on the revenue recorded to date is recognized in the period the adjustment is identified.
Extended Warranty Contracts. The Company sells separately priced extended warranty contracts, which extends coverage beyond the base warrantyperiod. Revenue is recognized for the extended warranty contract on a straight-line basis, which the Company believes approximates the costs expected to beincurred in satisfying the obligations, over the extended warranty period. The extended warranty period ranges from one to five years. Payment is received atthe inception of the extended warranty contract, which is recognized as a contract liability for the amount in excess of the revenue recognized. The revenueassociated with the sale of extended warranty contracts is insignificant.
Technology Services Revenue. The Company sells a combination of technology products and services. When the bundled package of technologyproducts and services is sold, the portion of the consideration received related to the services component is recognized over time as the Company satisfies thefuture performance obligation. Revenue is recognized for the hardware component when control is transferred to the dealer or distributor. The revenueassociated with the sale of technology services is insignificant.
53
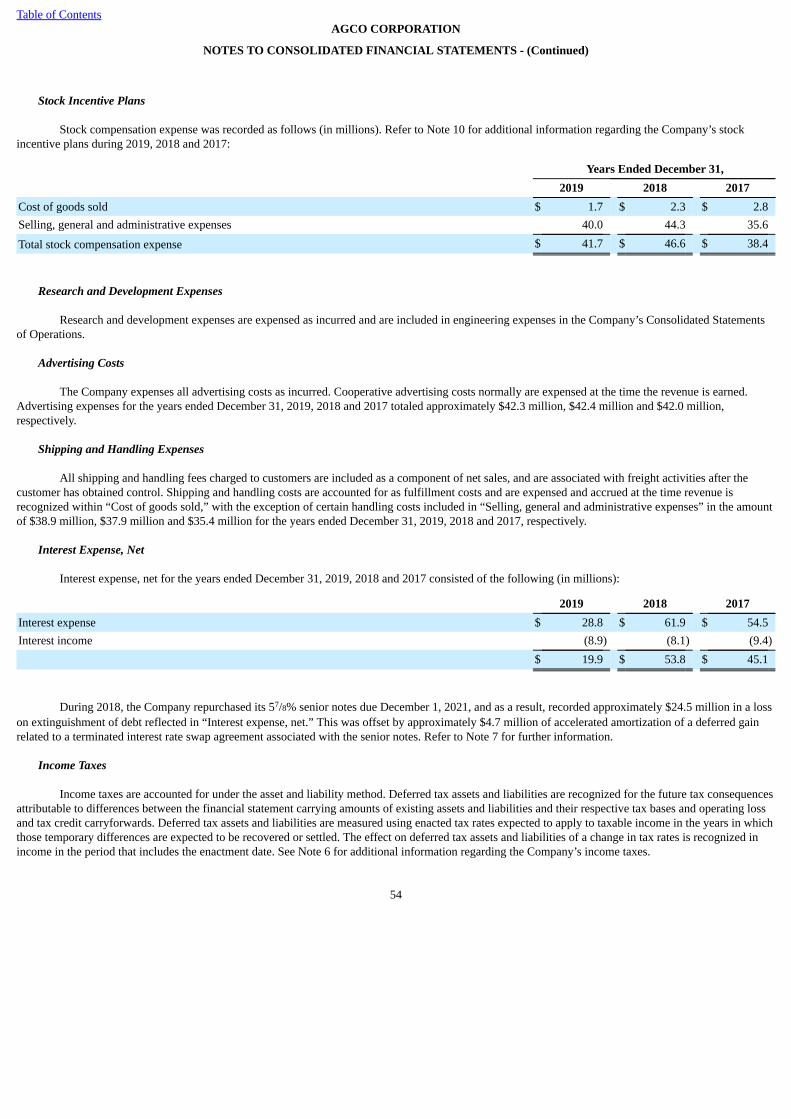
Table of ContentsAGCO CORPORATION
NOTES TO CONSOLIDATED FINANCIAL STATEMENTS - (Continued)
Stock Incentive Plans
Stock compensation expense was recorded as follows (in millions). Refer to Note 10 for additional information regarding the Company’s stockincentive plans during 2019, 2018 and 2017:
Years Ended December 31, 2019 2018 2017Cost of goods sold $ 1.7 $ 2.3 $ 2.8Selling, general and administrative expenses 40.0 44.3 35.6
Total stock compensation expense $ 41.7 $ 46.6 $ 38.4
Research and Development Expenses
Research and development expenses are expensed as incurred and are included in engineering expenses in the Company’s Consolidated Statementsof Operations.
Advertising Costs
The Company expenses all advertising costs as incurred. Cooperative advertising costs normally are expensed at the time the revenue is earned.Advertising expenses for the years ended December 31, 2019, 2018 and 2017 totaled approximately $42.3 million, $42.4 million and $42.0 million,respectively.
Shipping and Handling Expenses
All shipping and handling fees charged to customers are included as a component of net sales, and are associated with freight activities after thecustomer has obtained control. Shipping and handling costs are accounted for as fulfillment costs and are expensed and accrued at the time revenue isrecognized within “Cost of goods sold,” with the exception of certain handling costs included in “Selling, general and administrative expenses” in the amountof $38.9 million, $37.9 million and $35.4 million for the years ended December 31, 2019, 2018 and 2017, respectively.
Interest Expense, Net
Interest expense, net for the years ended December 31, 2019, 2018 and 2017 consisted of the following (in millions):
2019 2018 2017Interest expense $ 28.8 $ 61.9 $ 54.5Interest income (8.9) (8.1) (9.4)
$ 19.9 $ 53.8 $ 45.1
During 2018, the Company repurchased its 57/8% senior notes due December 1, 2021, and as a result, recorded approximately $24.5 million in a losson extinguishment of debt reflected in “Interest expense, net.” This was offset by approximately $4.7 million of accelerated amortization of a deferred gainrelated to a terminated interest rate swap agreement associated with the senior notes. Refer to Note 7 for further information.
Income Taxes
Income taxes are accounted for under the asset and liability method. Deferred tax assets and liabilities are recognized for the future tax consequencesattributable to differences between the financial statement carrying amounts of existing assets and liabilities and their respective tax bases and operating lossand tax credit carryforwards. Deferred tax assets and liabilities are measured using enacted tax rates expected to apply to taxable income in the years in whichthose temporary differences are expected to be recovered or settled. The effect on deferred tax assets and liabilities of a change in tax rates is recognized inincome in the period that includes the enactment date. See Note 6 for additional information regarding the Company’s income taxes.
54

Table of ContentsAGCO CORPORATION
NOTES TO CONSOLIDATED FINANCIAL STATEMENTS - (Continued)
Net Income Per Common Share
Basic net income per common share is computed by dividing net income by the weighted average number of common shares outstanding duringeach period. Diluted net income per common share assumes the exercise of outstanding stock-settled stock appreciation rights (“SSARs”) and the vesting ofperformance share awards and restricted stock units using the treasury stock method when the effects of such assumptions are dilutive.
A reconciliation of net income attributable to AGCO Corporation and subsidiaries and weighted average common shares outstanding for purposes ofcalculating basic and diluted net income per share during the years ended December 31, 2019, 2018 and 2017 is as follows (in millions, except per sharedata):
2019 2018 2017Basic net income per share: Net income attributable to AGCO Corporation and subsidiaries $ 125.2 $ 285.5 $ 186.4
Weighted average number of common shares outstanding 76.2 78.8 79.5
Basic net income per share attributable to AGCO Corporation and subsidiaries $ 1.64 $ 3.62 $ 2.34
Diluted net income per share: Net income attributable to AGCO Corporation and subsidiaries $ 125.2 $ 285.5 $ 186.4
Weighted average number of common shares outstanding 76.2 78.8 79.5Dilutive SSARs, performance share awards and restricted stock units 0.8 0.9 0.7Weighted average number of common shares and common share equivalents outstanding for purposes of
computing diluted net income per share 77.0 79.7 80.2
Diluted net income per share attributable to AGCO Corporation and subsidiaries $ 1.63 $ 3.58 $ 2.32
SSARs to purchase approximately 0.2 million shares, 0.5 million shares and 0.3 million shares of the Company’s common stock for the years endedDecember 31, 2019, 2018 and 2017, respectively, were outstanding but not included in the calculation of weighted average common and common equivalentshares outstanding because they had an antidilutive impact.
Comprehensive Income (Loss)
The Company reports comprehensive income (loss), defined as the total of net income (loss) and all other non-owner changes in equity, and thecomponents thereof in its Consolidated Statements of Stockholders’ Equity and Consolidated Statements of Comprehensive Income (Loss). The componentsof other comprehensive (loss) income and the related tax effects for the years ended December 31, 2019, 2018 and 2017 are as follows (in millions):
AGCO Corporation and Subsidiaries Noncontrolling
Interests 2019 2019
Before-taxAmount
IncomeTaxes
After-taxAmount
After-taxAmount
Defined benefit pension plans $ (13.4) $ (0.6) $ (14.0) $ —Net loss on derivatives (3.1) 0.4 (2.7) —Foreign currency translation adjustments (23.1) — (23.1) 2.5
Total components of other comprehensive loss $ (39.6) $ (0.2) $ (39.8) $ 2.5
55

Table of ContentsAGCO CORPORATION
NOTES TO CONSOLIDATED FINANCIAL STATEMENTS - (Continued)
AGCO Corporation and Subsidiaries Noncontrolling
Interests 2018 2018
Before-taxAmount
IncomeTaxes
After-taxAmount
After-taxAmount
Defined benefit pension plans $ 0.8 $ 1.9 $ 2.7 $ —Net gain on derivatives 7.6 (1.5) 6.1 —Foreign currency translation adjustments (202.6) — (202.6) (4.2)
Total components of other comprehensive loss $ (194.2) $ 0.4 $ (193.8) $ (4.2)
AGCO Corporation and Subsidiaries Noncontrolling
Interests 2017 2017
Before-taxAmount
IncomeTaxes
After-taxAmount
After-taxAmount
Defined benefit pension plans $ 24.2 $ (4.8) $ 19.4 $ —Net gain on derivatives 4.1 (0.1) 4.0 —Foreign currency translation adjustments 56.6 — 56.6 1.2
Total components of other comprehensive income $ 84.9 $ (4.9) $ 80.0 $ 1.2
Derivatives
The Company uses foreign currency contracts to hedge the foreign currency exposure of certain receivables and payables. The contracts are forperiods consistent with the exposure being hedged and generally have maturities of one year or less. These contracts are classified as non-designatedderivative instruments. The Company also enters into foreign currency contracts designated as cash flow hedges of expected sales. The Company’s foreigncurrency contracts mitigate risk due to exchange rate fluctuations because gains and losses on these contracts generally offset losses and gains on the exposurebeing hedged. The notional amounts of the foreign currency contracts do not represent amounts exchanged by the parties and, therefore, are not a measure ofthe Company’s risk. The amounts exchanged are calculated on the basis of the notional amounts and other terms of the contracts. The credit and market risksunder these contracts are not considered to be significant.
The Company’s interest expense is, in part, sensitive to the general level of interest rates, and the Company manages its exposure to interest rate riskthrough the mix of floating rate and fixed rate debt. From time to time, the Company enters into interest rate swap agreements in order to manage theCompany’s exposure to interest rate fluctuations.
The Company uses non-derivative and, periodically, derivative instruments to hedge a portion of the Company’s net investment in foreign operationsagainst adverse movements in exchange rates.
The Company’s hedging policy prohibits it from entering into any foreign currency contracts for speculative trading purposes. See Note 11 foradditional information regarding the Company’s derivative instruments and hedging activities.
Recent Accounting Pronouncements
In January 2017, the FASB issued ASU 2017-04, “Simplifying the Test for Goodwill Impairment” (“ASU 2017-04”), which eliminates Step 2 fromthe goodwill impairment test. Under the standard, an entity should perform its goodwill impairment test by comparing the fair value of a reporting unit withits carrying amount, resulting in an impairment charge that is the amount by which the carrying amount exceeds the reporting unit’s fair value. Theimpairment charge, however, should not exceed the total amount of goodwill allocated to a reporting unit. The impairment assessment under ASU 2017-04applies to all reporting units, including those with a zero or negative carrying amount. ASU 2017-04 is effective for annual periods beginning after December15, 2019, and interim periods within those annual periods using a prospective approach. Early adoption is permitted for any interim or annual goodwillimpairment test performed on testing dates after January 1, 2017. The Company adopted ASU 2017-04 during the fourth quarter of 2019 and applied thestandard to its annual impairment test performed as of October 1, 2019.
56

Table of ContentsAGCO CORPORATION
NOTES TO CONSOLIDATED FINANCIAL STATEMENTS - (Continued)
In February 2016, the FASB issued ASU 2016-02, “Leases” (“ASU 2016-02”), which superseded the existing lease guidance under current U.S.GAAP. ASU 2016-02 is based on the principle that entities should recognize assets and liabilities arising from leases. The new standard does not significantlychange the lessees’ recognition, measurement and presentation of expenses and cash flows from the previous accounting standard and leases continue to beclassified as finance or operating. The primary change under ASU 2016-02 is the requirement for entities to recognize a lease liability for payments and aright-of-use (“ROU”) asset representing the right to use the leased asset during the term of an operating lease arrangement. Lessees were permitted to make anaccounting policy election to not recognize the asset and liability for leases with a term of 12 months or less. Lessors’ accounting under the new standard waslargely unchanged from the previous accounting standard. In addition, ASU 2016-02 expanded the disclosure requirements of lease arrangements. Uponadoption, lessees and lessors were required to recognize and measure leases at the beginning of the earliest period presented using a modified retrospectiveapproach. In July 2018, the FASB issued ASU 2018-11, “Targeted Improvements,” which allowed for a new, optional transition method that provided theoption to use the effective date as the date of initial application on transition. Under this option, the comparative periods continued to apply the legacyguidance in ASC 840, including the disclosure requirements, and a cumulative effect adjustment was recognized in the period of adoption rather than theearliest period presented. Under this transition option, comparative reporting was not required and the provisions of the standard was applied prospectively toleases in effect at the date of adoption.
The Company adopted the new guidance effective January 1, 2019 using a modified retrospective approach and no cumulative effect adjustment wasrecorded upon adoption. Based on the Company’s current lease portfolio, the adoption of the standard as of January 1, 2019 resulted in the recognition on thatdate of ROU assets and operating lease liabilities in the amount of approximately $194.2 million and $196.4 million, respectively, in the Company’sConsolidated Balance Sheets. The adoption of the new standard did not materially impact the Company’s Consolidated Statements of Operations orConsolidated Statements of Cash Flows.
ASU 2016-02 provided a number of optional practical expedients in transition. The Company elected the “package of practical expedients” whichpermitted the Company not to reassess its prior conclusions about lease identification, lease classification and initial direct costs. The Company elected theshort-term lease exemption for all leases with a term of 12 months or less for both existing and ongoing operating leases. The Company elected the practicalexpedient to separate lease and non-lease components for a majority of its operating leases, other than real estate and office equipment leases.
In connection with the adoption of ASU 2016-02 on January 1, 2019, the Company completed the design of new processes and internal controls,which included the implementation of a software solution and the cataloging of the Company’s existing and ongoing population of leased assets. See Note 17for additional information and related disclosures.
In June 2016, the FASB issued ASU 2016-13, “Measurement of Credit Losses on Financial Instruments” (“ASU 2016-13”), which requiresmeasurement and recognition of expected versus incurred credit losses for financial assets held. ASU 2016-13 is effective for annual periods beginning afterDecember 15, 2019, and interim periods within those annual periods as the adoption of the standard relates to the Company. In April 2019, the FASB issuedASU 2019-04, “Codification Improvements to Topic 326, Financial Instruments - Credit Losses, Topic 815, Derivatives and Hedging, and Topic 825,Financial Instruments” (“ASU 2019-04”), which provides, among other things, targeted improvements to certain aspects of accounting for credit lossesaddressed by ASU 2016-13. In November 2019, the FASB issued ASU 2019-11, “Codification Improvements to Topic 326), Financial Instruments - CreditLosses,” which clarifies the treatment of expected recoveries for amounts previously written-off on purchased receivables, provides transition relief fortroubled debt restructurings and allows for certain disclosure simplifications of accrued interest. The effective dates for both ASU 2019-04 and ASU 2019-11are the same as the effective dates for ASU 2016-13. The Company adopted this standard, and its subsequent modifications, as of January 1, 2020. Theadoption did not have a material impact to the Company’s results of operations, financial condition and cash flows.
The Company also adopted the following pronouncements in 2019, none of which had a material effect on its results of operations, financialcondition and cash flows:
• ASU 2018-02 - “Reclassification of Certain Tax Effects from Accumulated Other Comprehensive Income”• ASU 2018-13 - “Disclosure Framework - Changes to the Disclosure Requirements for Fair Value Measurement”
57

Table of ContentsAGCO CORPORATION
NOTES TO CONSOLIDATED FINANCIAL STATEMENTS - (Continued)
New Accounting Pronouncements to be Adopted
In December 2019, the FASB issued ASU 2019-12, “Simplifying the Accounting for Income Taxes,” which simplifies various aspects related toaccounting for income taxes by removing certain exceptions for investments, intraperiod allocations and interim calculations, and adding guidance to reducecomplexity in accounting for income taxes. ASU 2019-12 is effective for annual periods beginning after December 15, 2020, and interim periods within thoseannual periods using a prospective approach. Early adoption is permitted. Depending on the amendment, adoption may be applied on the retrospective,modified retrospective or prospective basis. The standard will not have a material impact on the Company's results of operations, financial condition and cashflows.
As discussed above, in June 2016, the FASB issued ASU 2016-13, which requires measurement and recognition of expected versus incurred creditlosses for financial assets held. In November 2019, the FASB issued ASU 2019-10, “Financial Instruments - Credit Losses (Topic 326), Derivatives andHedging (Topic 815), and Leases (Topic 842): Effective Dates,” which delays the effective date of ASU 2016-13 for smaller reporting companies and othernon-SEC reporting entities. This applies to the Company’s equity method finance joint ventures who are now required to adopt ASU 2016-13 for annualperiods beginning after December 15, 2022 and interim periods within those annual periods. The standard, and its subsequent modification, will likely impactthe results of operations and financial condition of the Company’s finance joint ventures. Therefore, adoption of the standard by the Company’s finance jointventures will likely impact the Company’s “Investment in affiliates” and “Equity in net earnings of affiliates.” The Company’s finance joint ventures arecurrently evaluating the impact of ASU 2016-13 to their results of operations and financial condition.
2. Acquisitions
On October 2, 2017, the Company acquired the hay and forage division of the Lely Group (“Lely”) for approximately €80.2 million (orapproximately $94.6 million), net of cash acquired of approximately €10.1 million (or approximately $11.9 million). The Lely acquisition, withmanufacturing locations in northern Germany, has allowed the Company to expand its product offering of hay and forage equipment, including balers andloader wagons. The acquisition was financed by the Company’s credit facility (see Note 7).
The fair values of the assets acquired and liabilities assumed as of the acquisition date are presented in the following table (in millions):
Current assets $ 87.0Property, plant and equipment 17.8Intangible assets 7.6Goodwill 25.8
Total assets acquired 138.2 Current liabilities 23.5Long-term liabilities 8.2
Total liabilities assumed 31.7
Net assets acquired $ 106.5
The acquired identifiable intangible assets of Lely as of the date of the acquisition are summarized in the following table (in millions):
Intangible Assets Amount
Weighted-Average Useful
LifeCustomer relationships $ 3.0 5 yearsTechnology 3.0 12 yearsTrademarks 1.6 10 years
$ 7.6
58
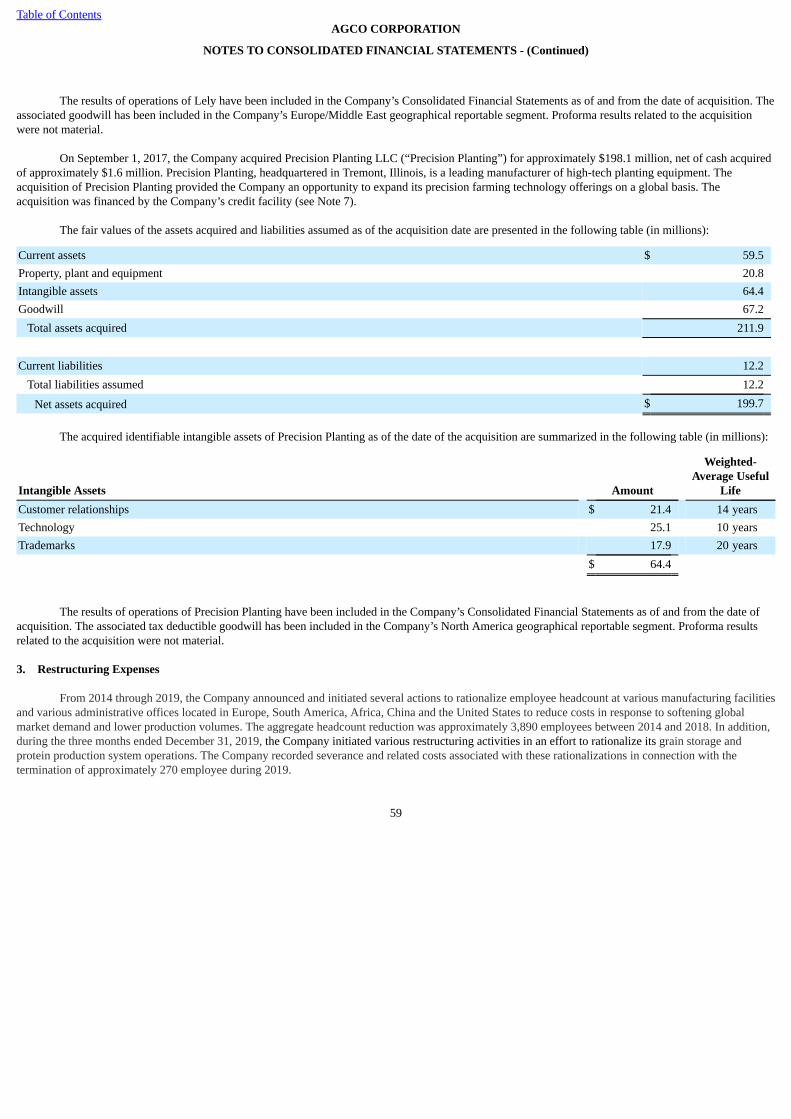
Table of ContentsAGCO CORPORATION
NOTES TO CONSOLIDATED FINANCIAL STATEMENTS - (Continued)
The results of operations of Lely have been included in the Company’s Consolidated Financial Statements as of and from the date of acquisition. Theassociated goodwill has been included in the Company’s Europe/Middle East geographical reportable segment. Proforma results related to the acquisitionwere not material.
On September 1, 2017, the Company acquired Precision Planting LLC (“Precision Planting”) for approximately $198.1 million, net of cash acquiredof approximately $1.6 million. Precision Planting, headquartered in Tremont, Illinois, is a leading manufacturer of high-tech planting equipment. Theacquisition of Precision Planting provided the Company an opportunity to expand its precision farming technology offerings on a global basis. Theacquisition was financed by the Company’s credit facility (see Note 7).
The fair values of the assets acquired and liabilities assumed as of the acquisition date are presented in the following table (in millions):
Current assets $ 59.5Property, plant and equipment 20.8Intangible assets 64.4Goodwill 67.2
Total assets acquired 211.9 Current liabilities 12.2
Total liabilities assumed 12.2
Net assets acquired $ 199.7
The acquired identifiable intangible assets of Precision Planting as of the date of the acquisition are summarized in the following table (in millions):
Intangible Assets Amount
Weighted-Average Useful
LifeCustomer relationships $ 21.4 14 yearsTechnology 25.1 10 yearsTrademarks 17.9 20 years
$ 64.4
The results of operations of Precision Planting have been included in the Company’s Consolidated Financial Statements as of and from the date ofacquisition. The associated tax deductible goodwill has been included in the Company’s North America geographical reportable segment. Proforma resultsrelated to the acquisition were not material.
3. Restructuring Expenses
From 2014 through 2019, the Company announced and initiated several actions to rationalize employee headcount at various manufacturing facilitiesand various administrative offices located in Europe, South America, Africa, China and the United States to reduce costs in response to softening globalmarket demand and lower production volumes. The aggregate headcount reduction was approximately 3,890 employees between 2014 and 2018. In addition,during the three months ended December 31, 2019, the Company initiated various restructuring activities in an effort to rationalize its grain storage andprotein production system operations. The Company recorded severance and related costs associated with these rationalizations in connection with thetermination of approximately 270 employee during 2019.
59

Table of ContentsAGCO CORPORATION
NOTES TO CONSOLIDATED FINANCIAL STATEMENTS - (Continued)
The components of the restructuring expenses are summarized as follows (in millions):
Loss on Sale ofJoint Venture
Write-down ofProperty, Plantand Equipment
EmployeeSeverance
Facility ClosureCosts Total
Balance as of December 31, 2016 $ — $ — $ 14.5 $ 0.8 $ 15.32017 provision — 0.2 12.4 — 12.6Less: Non-cash expense — (0.2) — — (0.2)Cash expense — — 12.4 — 12.42017 provision reversal — — (1.4) — (1.4)2017 cash activity — — (16.0) (0.8) (16.8)Foreign currency translation — — 1.4 — 1.4Balance as of December 31, 2017 — — 10.9 — 10.92018 provision — 0.3 13.8 — 14.1Less: Non-cash expense — (0.3) — — (0.3)Cash expense — — 13.8 — 13.82018 provision reversal — — (2.1) — (2.1)2018 cash activity — — (14.4) — (14.4)Foreign currency translation — — (1.1) — (1.1)Balance as of December 31, 2018 — — 7.1 — 7.12019 provision 2.1 1.5 5.6 0.5 9.7Less: Non-cash expense (2.1) (1.5) — — (3.6)Cash expense — — 5.6 0.5 6.12019 provision reversal — — (0.7) — (0.7)2019 cash activity — — (6.8) (0.5) (7.3)Foreign currency translation — — (0.4) — (0.4)
Balance as of December 31, 2019 $ — $ — $ 4.8 $ — $ 4.8
In addition, during the three months ended December 31, 2019, the Company exited and sold its 50% interest in its USC, LLC joint venture to its jointventure partner for approximately $5.1 million. The Company recorded a loss of approximately $2.1 million associated with the sale, which was reflectedwithin “Restructuring expenses” in the Company’s Consolidated Statements of Operations.
60

Table of ContentsAGCO CORPORATION
NOTES TO CONSOLIDATED FINANCIAL STATEMENTS - (Continued)
4. Accounts Receivable Sales Agreements
The Company has accounts receivable sales agreements that permit the sale, on an ongoing basis, of a majority of its wholesale receivables in NorthAmerica, Europe and Brazil to its U.S., Canadian, European and Brazilian finance joint ventures. As of December 31, 2019 and 2018, the cash received fromreceivables sold under the U.S., Canadian, European and Brazilian accounts receivable sales agreements was approximately $1.6 billion and $1.4 billion,respectively.
Under the terms of the accounts receivable sales agreements in North America, Europe and Brazil, the Company pays an annual fee related to theservicing of the receivables sold. The Company also pays the respective AGCO Finance entities a subsidized interest payment with respect to the accountsreceivable sales agreements, calculated based upon LIBOR plus a margin on any non-interest bearing accounts receivable outstanding and sold under theaccounts receivables sales agreements. These fees are reflected within losses on the sales of receivables included within “Other expense, net” in theCompany’s Consolidated Statements of Operations. The Company does not service the receivables after the sale occurs and does not maintain any directretained interest in the receivables. The Company reviewed its accounting for the accounts receivable sales agreements and determined that these facilitiesshould be accounted for as off-balance sheet transactions.
Losses on sales of receivables associated with the accounts receivable financing facilities discussed above, reflected within “Other expense, net” inthe Company’s Consolidated Statements of Operations, were approximately $42.4 million, $36.0 million and $39.2 million during 2019, 2018 and 2017,respectively.
The Company’s finance joint ventures in Europe, Brazil and Australia also provide wholesale financing directly to the Company’s dealers. Thereceivables associated with these arrangements are without recourse to the Company. The Company does not service the receivables after the sale occurs anddoes not maintain any direct retained interest in the receivables. As of December 31, 2019 and 2018, these finance joint ventures had approximately $104.3million and $82.5 million, respectively, of outstanding accounts receivable associated with these arrangements. The Company reviewed its accounting forthese arrangements and determined that these arrangements should be accounted for as off-balance sheet transactions.
In addition, the Company sells certain trade receivables under factoring arrangements to other financial institutions around the world. The Companyreviewed the sale of such receivables and determined that these arrangements should be accounted for as off-balance sheet transactions.
5. Investments in Affiliates
Investments in affiliates as of December 31, 2019 and 2018 were as follows (in millions):
2019 2018Finance joint ventures $ 339.0 $ 358.7Manufacturing joint ventures 26.8 26.3Other affiliates 14.4 15.0
$ 380.2 $ 400.0
The Company’s finance joint ventures are located in the United States, Canada, Europe, Brazil, Argentina and Australia, and provide retail financingand wholesale financing to the Company’s retail customers and dealers, respectively. See Note 14 for further information on the Company’s finance jointventures. The Company’s manufacturing joint ventures consist of Groupement International De Mecanique Agricole SA (“GIMA”) (a joint venture with athird-party manufacturer to purchase, design and manufacture components for agricultural equipment in France) and a joint venture with a third-partymanufacturer to manufacture protein production equipment in China. The other joint ventures represent investments in farm equipment manufacturers, anelectronic and software system manufacturer, distributors and licensees.
61

Table of ContentsAGCO CORPORATION
NOTES TO CONSOLIDATED FINANCIAL STATEMENTS - (Continued)
The Company’s equity in net earnings of affiliates for the years ended December 31, 2019, 2018 and 2017 were as follows (in millions):
2019 2018 2017Finance joint ventures $ 41.5 $ 34.7 $ 39.9Manufacturing and other joint ventures 1.0 (0.4) (0.8)
$ 42.5 $ 34.3 $ 39.1
Summarized combined financial information of the Company’s finance joint ventures as of December 31, 2019 and 2018 and for the years endedDecember 31, 2019, 2018 and 2017 were as follows (in millions):
As of December 31, 2019 2018Total assets $ 7,773.2 $ 7,649.2Total liabilities 7,082.4 6,917.2Partners’ equity 690.8 732.0
For the Years Ended December 31, 2019 2018 2017Revenues $ 417.6 $ 390.8 $ 366.0Costs 299.9 286.7 243.3
Income before income taxes $ 117.7 $ 104.1 $ 122.7
The majority of the assets of the Company’s finance joint ventures represent finance receivables. The majority of the liabilities represent notespayable and accrued interest. Under the various joint venture agreements, Rabobank or its affiliates provide financing to the joint venture companies. AGCOhas a 49% interest in the Company’s finance joint ventures (Note 14).
At December 31, 2019 and 2018, the Company’s receivables from affiliates were approximately $15.2 million and $12.9 million, respectively. Thereceivables from affiliates are reflected within “Accounts and notes receivable, net” within the Company’s Consolidated Balance Sheets.
The portion of the Company’s retained earnings balance that represents undistributed retained earnings of equity method investees wasapproximately $310.8 million and $326.9 million as of December 31, 2019 and 2018, respectively.
6. Income Taxes
The sources of income before income taxes and equity in net earnings of affiliates were as follows for the years ended December 31, 2019, 2018 and2017 (in millions):
2019 2018 2017United States $ (53.1) $ (126.0) $ (141.6)Foreign 314.2 486.3 425.4
Income before income taxes and equity in net earnings of affiliates $ 261.1 $ 360.3 $ 283.8
62

Table of ContentsAGCO CORPORATION
NOTES TO CONSOLIDATED FINANCIAL STATEMENTS - (Continued)
The provision for income taxes by location of the taxing jurisdiction for the years ended December 31, 2019, 2018 and 2017 consisted of thefollowing (in millions):
2019 2018 2017Current:
United States: Federal $ (6.5) $ (9.1) $ 20.3State 2.1 1.2 0.6
Foreign 170.1 133.5 126.8 165.7 125.6 147.7Deferred:
United States: Federal 1.3 — 0.9State — — —
Foreign 13.8 (14.7) (15.0) 15.1 (14.7) (14.1)
$ 180.8 $ 110.9 $ 133.6
Swiss tax reform was enacted during 2019 and eliminates certain preferential tax items as well as implements new tax rates at both the federal andcantonal levels. During the three months ended December 31, 2019, the Company recognized a one-time income tax gain of approximately $21.8 millionassociated with the changing of Swiss federal and cantonal tax rates as well as recognition of a deferred tax asset associated with the estimated value of a taxbasis step-up of the Company’s Swiss subsidiary’s assets.
On December 22, 2017, The Tax Cuts and Jobs Act (“the 2017 Tax Act”) was enacted in the United States. During the three months ended December31, 2017, the Company recorded a tax provision of approximately $42.0 million in accordance with Staff Accounting Bulletin No. 118, which provided SECStaff guidance for the application of ASC 740 “Income Taxes,” in the reporting period in which the 2017 Tax Act was enacted. The $42.0 million taxprovision included a provisional income tax charge related to a one-time transition tax associated with the mandatory deemed repatriation of unremittedforeign earnings. The tax provision also included a provisional income tax charge associated with the income tax consequences related to the expected futurerepatriation of certain underlying foreign earnings, as historically, the Company had considered them to be permanently reinvested. The remaining balance ofthe tax provision primarily related to the remeasurement of certain net deferred tax assets using the lower enacted U.S. Corporate tax rate, as well as othermiscellaneous related impacts. During the three months ended December 31, 2018, the Company finalized its calculations related to the 2017 Tax Act andrecorded an income tax benefit of approximately $8.4 million.
A reconciliation of income taxes computed at the United States federal statutory income tax rate (21% for 2019, 21% for 2018 (from 35% to 21%),and 35% for 2017) to the provision for income taxes reflected in the Company’s Consolidated Statements of Operations for the years ended December 31,2019, 2018 and 2017 is as follows (in millions):
2019 2018 2017Provision for income taxes at United States federal statutory rate $ 54.8 $ 75.7 $ 99.3State and local income taxes, net of federal income tax effects (2.5) (6.0) (5.7)Taxes on foreign income which differ from the United States statutory rate 6.7 (0.3) (57.7)Tax effect of permanent differences 63.9 26.7 60.6Change in valuation allowance 84.6 24.6 (1.4)Change in tax contingency reserves 3.2 8.5 3.8Research and development tax credits (7.1) (8.5) (5.0)Impacts related to changes in tax laws (21.8) (8.4) 42.0Other (1.0) (1.4) (2.3)
$ 180.8 $ 110.9 $ 133.6
63

Table of ContentsAGCO CORPORATION
NOTES TO CONSOLIDATED FINANCIAL STATEMENTS - (Continued)
The significant components of the deferred tax assets and liabilities at December 31, 2019 and 2018 were as follows (in millions):
2019 2018Deferred Tax Assets:
Net operating loss carryforwards $ 72.0 $ 74.5Sales incentive discounts 61.9 58.8Inventory valuation reserves 41.1 36.3Pensions and postretirement health care benefits 51.6 47.6Warranty and other reserves 128.5 98.6Research and development tax credits 17.3 3.1Foreign tax credits 6.4 9.7Other 17.2 21.6
Total gross deferred tax assets 396.0 350.2Valuation allowance (169.1) (83.9)
Total deferred tax assets 226.9 266.3Deferred Tax Liabilities:
Tax over book depreciation and amortization 164.3 214.3Investment in affiliates 50.3 42.8Other 25.5 20.6
Total deferred tax liabilities 240.1 277.7
Net deferred tax liabilities $ (13.2) $ (11.4)
Amounts recognized in Consolidated Balance Sheets: Deferred tax assets - noncurrent $ 93.8 $ 104.9Deferred tax liabilities - noncurrent (107.0) (116.3)
$ (13.2) $ (11.4)
As reflected in the preceding table, the Company recorded a net deferred tax liability of $13.2 million and $11.4 million as of December 31, 2019and December 31, 2018, respectively, and had a valuation allowance against its gross deferred tax assets of approximately $169.1 million and $83.9 million asof December 31, 2019 and 2018, respectively.
During the three months ended September 30, 2019, the Company recorded a non-cash deferred income tax charge of approximately $53.7 million toestablish a valuation allowance against its Brazilian net deferred income tax assets. In addition, the Company maintains a valuation allowance to fully reserveits net deferred tax assets in the United States and certain foreign jurisdictions. A valuation allowance is established when it is more likely than not that someportion or all of the deferred tax assets will not be realized. The Company assessed the likelihood that its deferred tax assets would be recovered fromestimated future taxable income and available tax planning strategies and determined that all adjustments to the valuation allowance were appropriate. Inmaking this assessment, all available evidence was considered including the current economic climate, as well as reasonable tax planning strategies. TheCompany believes it is more likely than not that it will realize its remaining net deferred tax assets, net of the valuation allowance, in future years.
The Company had net operating loss carryforwards of $236.4 million as of December 31, 2019, with expiration dates as follows: 2020 - $24.4million; 2021 - $21.3 million; 2022 - $14.3 million and thereafter or unlimited - $176.4 million. The net operating loss carryforwards of $236.4 million areentirely in tax jurisdictions outside of the United States. The Company does not have any material U.S. state net operating loss carryforwards.
The Company paid income taxes of $144.4 million, $101.6 million and $111.2 million for the years ended December 31, 2019, 2018 and 2017,respectively.
The Company recognizes income tax benefits from uncertain tax positions only when there is a more than 50% likelihood that the tax positions willbe sustained upon examination by the taxing authorities based on the technical merits of the positions. At December 31, 2019 and 2018, the Company had$210.7 million and $166.1 million, respectively, of
64

Table of ContentsAGCO CORPORATION
NOTES TO CONSOLIDATED FINANCIAL STATEMENTS - (Continued)
unrecognized income tax benefits, all of which would affect the Company’s effective tax rate if recognized. At December 31, 2019 and 2018, the Companyhad approximately $51.0 million and $58.5 million, respectively, of accrued or deferred taxes related to uncertain income tax positions connected withongoing income tax audits in various jurisdictions that it expects to settle or pay in the next 12 months. The Company accrued approximately $1.8 million and$5.6 million of interest and penalties related to unrecognized tax benefits in its provision for income taxes during 2019 and 2018, respectively. AtDecember 31, 2019 and 2018, the Company had accrued interest and penalties related to unrecognized tax benefits of $28.4 million and $27.2 million,respectively.
A reconciliation of the beginning and ending balances of the total amounts of gross unrecognized tax benefits as of and during the years endedDecember 31, 2019 and 2018 is as follows (in millions):
2019 2018Gross unrecognized income tax benefits at the beginning of the year $ 166.1 $ 163.4Additions for tax positions of the current year 32.8 3.8Additions for tax positions of prior years 20.7 13.1Reductions for tax positions of prior years for:
Changes in judgments (4.6) (1.6)Settlements during the year (0.7) (0.7)Lapses of applicable statute of limitations (0.8) (4.4)Foreign currency translation (2.8) (7.5)
Gross unrecognized income tax benefits at the end of the year $ 210.7 $ 166.1
The reconciliation of gross unrecognized tax benefits above for 2019 excludes certain indirect favorable effects that relate to other tax jurisdictionsof approximately $44.9 million.
The Company and its subsidiaries file income tax returns in the United States and in various state, local and foreign jurisdictions. The Company andits subsidiaries are routinely examined by tax authorities in these jurisdictions. As of December 31, 2019, a number of income tax examinations in foreignjurisdictions were ongoing. It is possible that certain of these ongoing examinations may be resolved within 12 months. Due to the potential for resolution offederal, state and foreign examinations, and the expiration of various statutes of limitation, it is reasonably possible that the Company’s gross unrecognizedincome tax benefits balance may materially change within the next 12 months. In certain foreign jurisdictions, there is either statutory expirations or oursettlement expectations such that approximately $51.0 million could be concluded within the next 12 months. Although there are ongoing examinations invarious federal and state jurisdictions, the 2016 through 2019 tax years generally remain subject to examination in the United States by applicable authorities.In the Company’s significant foreign jurisdictions, primarily the United Kingdom, France, Germany, Switzerland, Finland and Brazil, the 2014 through 2019tax years generally remain subject to examination by their respective tax authorities. In Brazil, the Company is contesting disallowed deductions related to theamortization of certain goodwill amounts (see Note 12).
65

Table of ContentsAGCO CORPORATION
NOTES TO CONSOLIDATED FINANCIAL STATEMENTS - (Continued)
7. Indebtedness
Long-term debt consisted of the following at December 31, 2019 and 2018 (in millions):
December 31, 2019 December 31, 2018Senior term loan due 2022(1) $ 168.1 $ 171.5Credit facility, expires 2023(1) — 114.41.002% Senior term loan due 2025 280.2 —Senior term loans due between 2021 and 2028(1) 736.2 815.31.056% Senior term loan due 2020(1) — 228.7Other long-term debt 12.5 20.6Debt issuance costs (2.3) (2.6) 1,194.7 1,347.9Less: Current portion of other long-term debt (2.9) (8.8) Senior term loans due 2019 — (63.8)
Total indebtedness, less current portion $ 1,191.8 $ 1,275.3
____________________________________(1) Maturity dates are reflected as of December 31, 2019.
At December 31, 2019, the aggregate scheduled maturities of long-term debt, excluding the current portion of long-term debt, are as follows (inmillions):
2021 $ 297.42022 170.22023 277.72024 2.3Thereafter 444.2
$ 1,191.8
Cash payments for interest were approximately $26.3 million, $35.2 million and $55.2 million for the years ended December 31, 2019, 2018 and2017, respectively.
Current Indebtedness
Senior Term Loan Due 2022
In October 2018, the Company entered in a term loan agreement with Rabobank in the amount of €150.0 million (or approximately $168.1 million asof December 31, 2019). The Company is permitted to prepay the term loan before its maturity date of October 28, 2022. Interest is payable on the term loanquarterly in arrears at an annual rate, equal to the EURIBOR plus a margin ranging from 0.875% to 1.875% based on the Company’s credit rating. TheCompany also has to fulfill financial covenants with respect to a total debt to EBITDA ratio and an interest coverage ratio.
Credit Facility
In October 2018, the Company entered into a multi-currency revolving credit facility of $800.0 million. The maturity date of the credit facility isOctober 17, 2023. Interest accrues on amounts outstanding under the credit facility, at the Company’s option, at either (1) LIBOR plus a margin ranging from0.875% to 1.875% based on the Company’s credit rating, or (2) the base rate, which is equal to the higher of (i) the administrative agent’s base lending ratefor the applicable currency, (ii) the federal funds rate plus 0.5%, and (iii) one-month LIBOR for loans denominated in U.S. dollars plus 1.0%, plus a marginranging from 0.0% to 0.875% based on the Company’s credit rating. The credit facility contains covenants restricting, among other things, the incurrence ofindebtedness and the making of certain payments, including dividends. The Company also has to fulfill financial covenants with respect to a total debt toEBITDA ratio and an interest coverage ratio. As of December 31, 2019, the Company had no outstanding borrowings under the credit facility and the abilityto borrow approximately $800.0 million
66

Table of ContentsAGCO CORPORATION
NOTES TO CONSOLIDATED FINANCIAL STATEMENTS - (Continued)
under the facility. As of December 31, 2018, the Company had approximately $114.4 million of outstanding borrowings under the credit facility and theability to borrow approximately $685.6 million under the facility. Interest on U.S. dollar borrowings under the Company's credit facility is calculated basedupon LIBOR. In the event that LIBOR is no longer published, interest will be calculated upon a base rate. The credit facility also provides for an expeditedamendment process once a replacement for LIBOR is established.
The Company’s former revolving credit and term loan facility consisted of an $800.0 million multi-currency revolving credit facility and a €312.0million term loan facility. The maturity date of the former credit facility was June 26, 2020. Under the former credit facility agreement, interest accrued onamounts outstanding, at the Company’s option, depending on the currency borrowed, at either (1) LIBOR or EURIBOR plus a margin ranging from 1.0% to1.75% based on the Company’s leverage ratio, or (2) the base rate, which is equal to the higher of (i) the administrative agent’s base lending rate for theapplicable currency, (ii) the federal funds rate plus 0.5%, and (iii) one-month LIBOR for loans denominated in U.S. dollars plus 1.0% plus a margin rangingfrom 0.0% to 0.25% based on the Company’s leverage ratio. The credit facility contained covenants restricting, among other things, the incurrence ofindebtedness and the making of certain payments, including dividends, and was subject to acceleration in the event of a default. The Company also had tofulfill financial covenants with respect to a total debt to EBITDA ratio and an interest coverage ratio. As is more fully described in Note 11, the Companyentered into an interest rate swap in 2015 to convert the term loan facility’s floating interest rate to a fixed interest rate of 0.33% plus the applicable marginover the remaining life of the term loan facility. In connection with the closing of new credit facility in October 2018, the Company repaid its outstanding€312.0 million (or approximately $360.8 million) term loan under the former revolving credit and term loan facility. The Company recorded approximately$0.9 million in “Interest expense, net,” associated with the write-off of deferred debt issuance costs associated with the repayment. The Company alsorecorded a loss of approximately $3.9 million which was recorded in “Interest expense, net” for the year ended December 31, 2018 associated with thetermination of the interest rate swap instrument.
1.002% Senior Term Loan
In December 2018, the Company entered into a term loan with the European Investment Bank (“EIB”), which provided the Company with the abilityto borrow up to €250.0 million. The €250.0 million (or approximately $280.2 million as of December 31, 2019) of funding was received on January 25, 2019with a maturity date of January 24, 2025. The Company is permitted to prepay the term loan before its maturity date. Interest is payable on the term loan at1.002% per annum, payable semi-annually in arrears. The term loan contains covenants regarding, among other things, the incurrence of indebtedness and themaking of certain payments, as well as commitments regarding amounts of future research and development expenses in Europe, and is subject toacceleration in the events of default. The Company also has to fulfill financial covenants with respect to a net leverage ratio and interest coverage ratio.
Senior Term Loans Due Between 2021 and 2028
In October 2016, the Company borrowed an aggregate amount of €375.0 million through a group of seven related term loan agreements, and inAugust 2018, the Company borrowed an additional aggregate amount of €338.0 million through a group of another seven related term loan agreements. Ofthe 2016 term loans, an aggregate amount of €56.0 million (or approximately $61.1 million) was repaid upon maturity in October 2019.
In aggregate, the Company has indebtedness of €657.0 million (or approximately $736.2 million as of December 31, 2019) through a group oftwelve related term loan agreements. The provisions of the term loan agreements are substantially identical, with the exception of interest rate terms andmaturities. The Company is permitted to prepay the term loans before their maturity dates. For the term loans with a fixed interest rate, interest is payable inarrears on an annual basis, with interest rates ranging from 0.70% to 2.26% and a maturity date between August 2021 and August 2028. For the term loanswith a floating interest rate, interest is payable in arrears on a semi-annual basis, with interest rates based on the EURIBOR plus a margin ranging from 0.70%to 1.25% and a maturity date between August 2021 and August 2025. The term loans contain covenants restricting, among other things, the incurrence ofindebtedness and the making of certain payments, including dividends, and is subject to acceleration in the event of default.
67

Table of ContentsAGCO CORPORATION
NOTES TO CONSOLIDATED FINANCIAL STATEMENTS - (Continued)
Former Indebtedness
1.056% Senior Term Loan
In December 2014, the Company entered into a term loan with the EIB, which provided the Company with the ability to borrow up to €200.0million. The €200.0 million of funding was received on January 15, 2015 and had a maturity date of January 15, 2020. The Company repaid the €200.0million (or approximately $220.0 million) term loan in December 2019. Interest was payable on the term loan at 1.056% per annum, payable quarterly inarrears. The term loan contained covenants regarding, among other things, the incurrence of indebtedness and the making of certain payments, as well ascommitments regarding amounts of future research and development expenses in Europe, and was subject to acceleration in the events of default. TheCompany also had to fulfill financial covenants with respect to a net leverage ratio and interest coverage ratio.
Senior Term Loans Due 2021
In April 2016, the Company entered into two term loan agreements with Rabobank, in the amount of €100.0 million and €200.0 million,respectively. The provisions of the two term loans were identical in nature. In December 2017, the Company repaid its €200.0 million (or approximately$239.8 million) term loan and in October 2018, in connection with the term loan agreement due 2022 with Rabobank discussed above, the Company repaidits €100.0 million (or approximately $113.2 million) term loan. The Company had the ability to prepay the term loans before their maturity date on April 26,2021. Interest was payable on the term loans per annum, paid quarterly in arrears, equal to the EURIBOR plus a margin ranging from 1.0% to 1.75% based onthe Company’s net leverage ratio. The Company also had to fulfill financial covenants with respect to a total debt to EBITDA ratio and an interest coverageratio.
57/8% Senior Notes
The Company’s 57/8% senior notes due December 1, 2021 constituted senior unsecured indebtedness. Interest was payable on the notes semi-annually in arrears. At any time prior to September 1, 2021, the Company could redeem the notes, in whole or in part from time to time, at its option, at aredemption price equal to the greater of (i) 100% of the principal amount plus accrued and unpaid interest, including additional interest, if any, to, butexcluding, the redemption date, or (ii) the sum of the present values of the remaining scheduled payments of principal and interest (exclusive of interestaccrued to the date of redemption) discounted to the redemption date at the treasury rate plus 0.5%, plus accrued and unpaid interest, including additionalinterest, if any. Beginning September 1, 2021, the Company could redeem the notes, in whole or in part from time to time, at its option, at a redemption priceequal to 100% of the principal amount plus accrued and unpaid interest, including additional interest, if any.
In May 2018, the Company completed a cash tender offer to purchase any and all of its outstanding 57/8% senior notes at a cash purchase price of$1,077.50 per $1,000.00 of senior notes. As a result of the tender offer, the Company repurchased approximately $185.9 million of principal amount of thesenior notes for approximately $200.3 million, plus accrued interest. In October 2018, the Company repurchased the remaining principal amount of the seniornotes of approximately $114.1 million for approximately $122.5 million, plus accrued interest. Both repurchases resulted in total losses on extinguishment ofdebt of approximately $24.5 million, including associated fees. As a result of the repurchase of the 57/8% senior notes, the Company recorded a cumulativeamount of approximately $4.7 million of accelerated amortization of a deferred gain related to a terminated interest rate swap instrument associated with thesenior notes. The losses on extinguishment as well as the accelerated amortization were reflected in “Interest expense, net,” for the year ended December 31,2018.
Short-Term Borrowings
As of December 31, 2019 and 2018, the Company had short-term borrowings due within one year of approximately $150.5 million and $138.0million, respectively.
Standby Letters of Credit and Similar Instruments
The Company has arrangements with various banks to issue standby letters of credit or similar instruments, which guarantee the Company’sobligations for the purchase or sale of certain inventories and for potential claims exposure for insurance coverage. At December 31, 2019 and 2018,outstanding letters of credit totaled $13.9 million and $14.1 million, respectively.
68

Table of ContentsAGCO CORPORATION
NOTES TO CONSOLIDATED FINANCIAL STATEMENTS - (Continued)
8. Employee Benefit Plans
The Company sponsors defined benefit pension plans covering certain employees, principally in the United Kingdom, the United States, Germany,Switzerland, Finland, France, Norway and Argentina. The Company also provides certain postretirement health care and life insurance benefits for certainemployees, principally in the United States and Brazil.
The Company also maintains an Executive Nonqualified Pension Plan (“ENPP”) that provides certain senior executives with retirement income for aperiod of 15 years or up to a lifetime annuity, if certain requirements are met. Benefits under the ENPP vest if the participant has attained age 50 and has atleast ten years of service (including five years as a participant in the ENPP), but are not payable until the participant reaches age 65. The lifetime annuitybenefit generally is available only to vested participants who retire on or after reaching age 65. The ENPP is an unfunded, nonqualified defined benefitpension plan.
Net annual pension costs for the years ended December 31, 2019, 2018 and 2017 for the Company’s defined benefit pension plans and ENPP are setforth below (in millions):
Pension benefits 2019 2018 2017Service cost $ 15.5 $ 16.6 $ 17.1Interest cost 20.7 19.9 20.6Expected return on plan assets (28.1) (34.0) (35.9)Amortization of net actuarial losses 14.3 13.8 13.4Amortization of prior service cost 1.6 1.2 1.2Net loss recognized due to settlement 0.5 0.9 0.2
Net annual pension cost $ 24.5 $ 18.4 $ 16.6
The components of net periodic pension and postretirement benefits cost, other than the service cost component, are included in “Other expense, net”in the Company’s Consolidated Statements of Operations.
The weighted average assumptions used to determine the net annual pension costs for the Company’s defined benefit pension plans and ENPP forthe years ended December 31, 2019, 2018 and 2017 are as follows:
2019 2018 2017All plans:
Weighted average discount rate 2.8% 2.5% 2.7%Weighted average expected long-term rate of return on plan assets 4.6% 5.4% 5.8%Rate of increase in future compensation 1.8%-5.0% 1.8%-5.0% 1.5%-5.0%
U.S.-based plans: Weighted average discount rate 4.35% 3.70% 4.25%Weighted average expected long-term rate of return on plan assets(1) 5.5% 6.0% 6.0%Rate of increase in future compensation(2) 5.0% 5.0% 5.0%
___________________________________(1) Applicable for U.S. funded, qualified plans.(2) Applicable for U.S. unfunded, nonqualified plan.
For the Company’s Swiss cash balance plan, the interest crediting rate of 1.0% for both 2019 and 2018 was set equal to the current annual minimumrate set by the government for the mandatory portion of the account balance. Amounts above that have an interest crediting rate of 0.25%.
69

Table of ContentsAGCO CORPORATION
NOTES TO CONSOLIDATED FINANCIAL STATEMENTS - (Continued)
Net annual postretirement benefit costs, and the weighted average discount rate used to determine them, for the years ended December 31, 2019,2018 and 2017 are set forth below (in millions, except percentages):
Postretirement benefits 2019 2018 2017Service cost $ 0.1 $ 0.1 $ 0.1Interest cost 1.3 1.4 1.4Amortization of net actuarial losses — 0.1 0.1Amortization of prior service cost 0.1 0.2 0.2
Net annual postretirement benefit cost $ 1.5 $ 1.8 $ 1.8
Weighted average discount rate 5.2% 4.9% 5.3%
70

Table of ContentsAGCO CORPORATION
NOTES TO CONSOLIDATED FINANCIAL STATEMENTS - (Continued)
The following tables set forth reconciliations of the changes in benefit obligation, plan assets and funded status as of December 31, 2019 and 2018(in millions):
Pension and ENPP Benefits Postretirement BenefitsChange in benefit obligation 2019 2018 2019 2018Benefit obligation at beginning of year $ 823.1 $ 916.7 $ 25.3 $ 30.2Service cost 15.5 16.6 0.1 0.1Interest cost 20.7 19.9 1.3 1.4Plan participants’ contributions 1.2 1.2 — —Actuarial losses (gains) 83.3 (55.2) 4.5 (4.2)Amendments 4.7 8.5 — —Settlements (0.8) (1.5) — —Benefits paid (44.8) (45.9) (1.5) (1.4)Other — 1.9 — —Foreign currency exchange rate changes 14.4 (39.1) (0.3) (0.8)
Benefit obligation at end of year $ 917.3 $ 823.1 $ 29.4 $ 25.3
Pension and ENPP Benefits Postretirement BenefitsChange in plan assets 2019 2018 2019 2018Fair value of plan assets at beginning of year $ 617.1 $ 691.8 $ — $ —Actual return on plan assets 91.2 (32.4) — —Employer contributions 30.6 36.8 1.5 1.4Plan participants’ contributions 1.2 1.2 — —Benefits paid (44.8) (45.9) (1.5) (1.4)Settlements (0.8) (1.5) — —Foreign currency exchange rate changes 16.5 (32.9) — —
Fair value of plan assets at end of year $ 711.0 $ 617.1 $ — $ —
Funded status $ (206.3) $ (206.0) $ (29.4) $ (25.3)Unrecognized net actuarial losses (gains) 362.2 356.7 3.9 (0.6)Unrecognized prior service cost 22.5 19.5 3.0 3.1Accumulated other comprehensive loss (384.7) (376.2) (6.9) (2.5)
Net amount recognized $ (206.3) $ (206.0) $ (29.4) $ (25.3)
Amounts recognized in ConsolidatedBalance Sheets: Other long-term asset $ 6.2 $ 0.1 $ — $ —Other current liabilities (4.9) (3.8) (1.6) (1.5)Accrued expenses (3.3) (2.9) — —Pensions and postretirement health care benefits (noncurrent) (204.3) (199.4) (27.8) (23.8)
Net amount recognized $ (206.3) $ (206.0) $ (29.4) $ (25.3)
71

Table of ContentsAGCO CORPORATION
NOTES TO CONSOLIDATED FINANCIAL STATEMENTS - (Continued)
The following table summarizes the activity in accumulated other comprehensive loss related to the Company’s ENPP and defined pension andpostretirement benefit plans during the years ended December 31, 2019 and 2018 (in millions):
Before-Tax
Amount Income
Tax After-TaxAmount
Accumulated other comprehensive loss as of December 31, 2017 $ (380.6) $ (95.5) $ (285.1)Prior service cost arising during the year (8.5) (1.5) (7.0)Net loss recognized due to settlement 1.0 0.1 0.9Net actuarial loss arising during the year (7.0) (2.8) (4.2)Amortization of prior service cost 1.4 0.1 1.3Amortization of net actuarial losses 13.9 2.2 11.7Accumulated other comprehensive loss as of December 31, 2018 $ (379.8) $ (97.4) $ (282.4)Prior service cost arising during the year (4.7) — (4.7)Net loss recognized due to settlement 0.6 — 0.6Net actuarial loss arising during the year (25.3) (2.0) (23.3)Amortization of prior service cost 1.7 0.1 1.6Amortization of net actuarial losses 14.3 2.5 11.8
Accumulated other comprehensive loss as of December 31, 2019 $ (393.2) $ (96.8) $ (296.4)
The unrecognized net actuarial losses included in accumulated other comprehensive loss related to the Company’s defined benefit pension plans andENPP as of December 31, 2019 and 2018 are set forth below (in millions):
2019 2018Unrecognized net actuarial losses $ 362.2 $ 356.7
The increase in unrecognized net actuarial losses between years primarily resulted from lower discount rates at December 31, 2019 compared toDecember 31, 2018. The unrecognized net actuarial losses will be impacted in future periods by actual asset returns, discount rate changes, currency exchangerate fluctuations, actual demographic experience and certain other factors. For some of the Company’s defined benefit pension plans, these losses, to theextent they exceed 10% of the greater of the plan’s liabilities or the fair value of assets (“the gain/loss corridor”), will be amortized on a straight-line basisover the periods discussed as follows. For the Company’s U.S. salaried, U.S. hourly and U.K. defined benefit pension plans, the population covered ispredominantly inactive participants, and losses related to those plans, to the extent they exceed the gain/loss corridor, will be amortized over the averageremaining lives of those participants while covered by the respective plan. For the Company’s ENPP, the population is predominantly active participants, andlosses related to the plan will be amortized over the average future working lifetime of the active participants expected to receive benefits. As ofDecember 31, 2019, the average amortization periods were as follows:
ENPP U.S. Plans U.K. PlanAverage amortization period of losses related to defined benefit pension plans 7 years 15 years 19 years
The following table summarizes the unrecognized prior service cost related to the Company's defined benefit pension plans as of December 31, 2019and 2018 (in millions):
2019 2018Unrecognized prior service cost $ 22.5 $ 19.5
The increase in the unrecognized prior service cost between years is due primarily to a plan amendment related to the Company's ENPP.
72

Table of ContentsAGCO CORPORATION
NOTES TO CONSOLIDATED FINANCIAL STATEMENTS - (Continued)
The following table summarizes the unrecognized net actuarial losses (gains) included in the Company's accumulated other comprehensive lossrelated to the Company’s U.S. and Brazilian postretirement health care benefit plans as of December 31, 2019 and 2018 (in millions):
2019 2018Unrecognized net actuarial losses (gains)(1) $ 3.9 $ (0.6)___________________________________(1) Includes a loss of approximately $1.6 million and $0.3 million, respectively, related to the Company’s U.S. postretirement benefit plans.
The increase in unrecognized net actuarial losses related to the Company’s U.S. and Brazilian postretirement benefit plans was primarily due tolower discount rates as of December 31, 2019 as compared to December 31, 2018. The unrecognized net actuarial gains or losses will be impacted in futureperiods by discount rate changes, actual demographic experience, actual health care inflation and certain other factors. These gains or losses, to the extentthey exceed the gain/loss corridor, will be amortized on a straight-line basis over the average remaining service period of active employees expected toreceive benefits, or the average remaining lives of inactive participants, covered under the postretirement benefit plans. As of December 31, 2019, the averageamortization period was 12 years for the Company’s U.S. postretirement benefit plans.
As of December 31, 2019 and 2018, the net prior service cost related to the Company’s U.S. and Brazilian postretirement health care benefit planswas as follows (in millions):
2019 2018Net prior service cost $ 3.0 $ 3.1
The following table summarizes the fair value of plan assets, aggregate projected benefit obligation and accumulated benefit obligation as of
December 31, 2019 and 2018 for defined benefit pension plans, ENPP and other postretirement plans with accumulated benefit obligations in excess of planassets (in millions):
2019 2018All plans:
Fair value of plan assets $ 67.8 $ 616.0Projected benefit obligation 309.3 847.3Accumulated benefit obligation 275.2 798.5
U.S.-based plans and ENPP: Fair value of plan assets $ 38.3 $ 36.8Projected benefit obligation 172.5 145.6Accumulated benefit obligation 151.9 128.7
The amounts for 2019 disclosed above do not include the fair value of plan assets, the projected benefit obligation or the accumulated benefitobligation related to the Company's U.K. plan. The 2018 amounts disclosed above do include balances related to the Company's U.K. plan. The Company’sU.K. plan's fair value of plan assets was in excess of the plan’s accumulated benefit obligation as of December 31, 2019.
73

Table of ContentsAGCO CORPORATION
NOTES TO CONSOLIDATED FINANCIAL STATEMENTS - (Continued)
The Company’s accumulated comprehensive loss as of December 31, 2019 and 2018 reflects a reduction in equity related to the following items (inmillions):
2019 2018All plans(1):
Reduction in equity, net of taxes of $96.3 and $97.0 at December 31, 2019 and 2018, respectively $ 391.6 $ 378.7GIMA joint venture(2):
Reduction in equity, net of taxes of $0.5 and $0.4 at December 31, 2019 and 2018, respectively 1.6 1.1______________________________________(1) Primarily related to the Company’s U.K. pension plan.(2) These amounts represented 50% of GIMA’s unrecognized net actuarial losses and unrecognized prior service cost associated with its pension plan. In addition, GIMA recognized a net actuarial
loss due to settlements of approximately $0.1 million during both 2019 and 2018.
The Company’s defined benefit pension obligation has been reflected based on the manner in which its defined benefit plans are being administered.The obligation and resulting liability is calculated employing both actuarial and legal assumptions. These assumptions include, but are not limited to, futureinflation, the return on pension assets, discount rates, life expectancy and potential salary increases. There are also assumptions related to the manner in whichindividual benefit plan benefits are calculated, some of which are legal in nature and include, but are not limited to, member eligibility, years of service andthe uniformity of both guaranteed minimum pension benefits and member normal retirement ages for men and women. Some of these assumptions also aresubject to the outcome of certain legal cases, which are currently unknown. In the event that any of these assumptions or the administration approach areproven to be different from the Company’s current interpretations and approach, there could be material increases in the Company’s defined benefit pensionobligation and the related amounts and timing of future contributions to be paid by the Company.
The weighted average assumptions used to determine the benefit obligation for the Company’s defined benefit pension plans and ENPP as ofDecember 31, 2019 and 2018 are as follows:
2019 2018All plans:
Weighted average discount rate 2.0% 2.8%Rate of increase in future compensation 1.75%-5.0% 1.75%-5.0%
U.S.-based plans: Weighted average discount rate 3.45% 4.35%Rate of increase in future compensation(1) 5.0% 5.0%
____________________________________(1) Applicable for U.S. unfunded, nonqualified plan.
The weighted average discount rate used to determine the benefit obligation for the Company’s postretirement benefit plans for the years endedDecember 31, 2019 and 2018 was 4.5% and 5.2%, respectively.
For the years ended December 31, 2019, 2018 and 2017, the Company used a globally consistent methodology to set the discount rate in thecountries where its largest benefit obligations exist. In the United States, the United Kingdom and the Euro Zone, the Company constructed a hypotheticalbond portfolio of high-quality corporate bonds and then applied the cash flows of the Company’s benefit plans to those bond yields to derive a discount rate.The bond portfolio and plan-specific cash flows vary by country, but the methodology in which the portfolio is constructed is consistent. In the United States,the bond portfolio is large enough to result in taking a “settlement approach” to derive the discount rate, in which high-quality corporate bonds are assumed tobe purchased and the resulting coupon payments and maturities are used to satisfy the Company’s U.S. pension plans’ projected benefit payments. In theUnited Kingdom and the Euro Zone, the discount rate is derived using a “yield curve approach,” in which an individual spot rate, or zero coupon bond yield,for each future annual period is developed to discount each future benefit payment and, thereby, determine the present value of all future payments. TheCompany uses a spot yield curve to determine the discount rate applicable in the United Kingdom to measure the U.K. pension plan’s service cost and interestcost. Under the settlement and yield curve approaches, the discount rate is set to equal the single discount rate that produces the same present value of allfuture payments.
For measuring the expected U.S. postretirement benefit obligation at December 31, 2019, the Company assumed a 6.25% health care cost trend ratefor 2020 decreasing to 5.0% by 2025. For measuring the expected U.S. postretirement benefit
74

Table of ContentsAGCO CORPORATION
NOTES TO CONSOLIDATED FINANCIAL STATEMENTS - (Continued)
obligation at December 31, 2018, the Company assumed a 6.50% health care cost trend rate for 2019 decreasing to 5.0% by 2025. For measuring theBrazilian postretirement benefit plan obligation at December 31, 2019, the Company assumed a 10.55% health care cost trend rate for 2020, decreasing to4.8% by 2031. For measuring the Brazilian postretirement benefit plan obligation at December 31, 2018, the Company assumed a 10.8% health care costtrend rate for 2019, decreasing to 5.0% by 2030.
The Company currently estimates its minimum contributions and benefit payments to its U.S.-based underfunded defined benefit pension plans andunfunded ENPP for 2020 will aggregate approximately $3.6 million. The Company currently estimates its minimum contributions for underfunded plans andbenefit payments for unfunded plans for 2020 to its non-U.S.-based defined benefit pension plans will aggregate approximately $30.0 million, of whichapproximately $20.2 million relates to its U.K. pension plan. The Company currently estimates its benefit payments for 2020 to its U.S.-based postretirementhealth care and life insurance benefit plans will aggregate approximately $1.6 million and its benefit payments for 2020 to its Brazilian postretirement healthcare benefit plans will aggregate less than $0.1 million.
During 2019, approximately $45.6 million of benefit payments were made related to the Company’s defined benefit pension plans and ENPP. AtDecember 31, 2019, the aggregate expected benefit payments for the Company’s defined benefit pension plans and ENPP are as follows (in millions):
2020 $ 47.02021 49.72022 50.32023 50.32024 51.02025 through 2029 278.3
$ 526.6
During 2019, approximately $1.5 million of benefit payments were made related to the Company’s U.S. and Brazilian postretirement benefit plans.At December 31, 2019, the aggregate expected benefit payments for the Company’s U.S. and Brazilian postretirement benefit plans are as follows (inmillions):
2020 $ 1.62021 1.72022 1.72023 1.72024 1.72025 through 2029 8.6
$ 17.0
Investment Strategy and Concentration of Risk
The weighted average asset allocation of the Company’s U.S. pension benefit plans as of December 31, 2019 and 2018 are as follows:
Asset Category 2019 2018Equity securities 34% 27%Fixed income securities 59% 57%Other investments 7% 16%
Total 100% 100%
75

Table of ContentsAGCO CORPORATION
NOTES TO CONSOLIDATED FINANCIAL STATEMENTS - (Continued)
The weighted average asset allocation of the Company’s non-U.S. pension benefit plans as of December 31, 2019 and 2018 are as follows:
Asset Category 2019 2018Equity securities 39% 39%Fixed income securities 54% 54%Other investments 7% 7%
Total 100% 100%
The Company categorizes its pension plan assets into one of three levels based on the assumptions used in valuing the asset. See Note 13 for adiscussion of the fair value hierarchy as per the guidance in ASC 820, “Fair Value Measurements” (“ASC 820”). The Company’s valuation techniques aredesigned to maximize the use of observable inputs and minimize the use of unobservable inputs. The Company uses the following valuation methodologies tomeasure the fair value of its pension plan assets:
• Equity Securities: Equity securities are valued on the basis of the closing price per unit on each business day as reported on the applicable exchange.Equity funds are valued using the net asset value of the fund, which is based on the fair value of the underlying securities.
• Fixed Income: Fixed income securities are valued using the closing prices in the active market in which the fixed income investment trades. Fixedincome funds are valued using the net asset value of the fund, which is based on the fair value of the underlying securities.
• Cash: These investments primarily consist of short-term investment funds which are valued using the net asset value.• Alternative Investments: These investments are reported at fair value as determined by the general partner of the alternative investment. The “market
approach” valuation technique is used to value investments in these funds. The funds typically are open-end funds as they generally offersubscription and redemption options to investors. The frequency of such subscriptions or redemptions is dictated by each fund’s governingdocuments. The amount of liquidity provided to investors in a particular fund generally is consistent with the liquidity and risk associated with theunderlying portfolio (i.e., the more liquid the investments in the portfolio, the greater the liquidity provided to investors). Liquidity of individualfunds varies based on various factors and may include “gates,” “holdbacks” and “side pockets” imposed by the manager of the fund, as well asredemption fees that may also apply. Investments in these funds typically are valued utilizing the net asset valuations provided by their underlyinginvestment managers, general partners or administrators. The funds consider subscription and redemption rights, including any restrictions on thedisposition of the interest, in its determination of the fair value.
• Insurance Contracts: Insurance contracts are valued using current prevailing interest rates.
76

Table of ContentsAGCO CORPORATION
NOTES TO CONSOLIDATED FINANCIAL STATEMENTS - (Continued)
The fair value of the Company’s pension assets as of December 31, 2019 is as follows (in millions):
Total Level 1 Level 2 Level 3Equity securities:
Global equities $ 183.4 $ 116.5 $ 66.9 $ —Non-U.S. equities 3.8 3.8 — —U.K. equities 65.2 65.2 — —U.S. large cap equities 5.9 5.9 — —U.S. small cap equities 3.4 3.4 — —
Total equity securities 261.7 194.8 66.9 —Fixed income:
Aggregate fixed income 150.1 150.1 — —International fixed income 220.0 220.0 — —
Total fixed income share(1) 370.1 370.1 — —Alternative investments:
Private equity fund 2.3 — — 2.3Hedge funds measured at net asset value(4) 33.3 — — —
Total alternative investments(2) 35.6 — — 2.3Miscellaneous funds(3) 30.8 — — 30.8Cash and equivalents measured at net asset value(4) 12.8 — — —
Total assets $ 711.0 $ 564.9 $ 66.9 $ 33.1______________________________________(1) 43% of “fixed income” securities are in investment-grade corporate bonds; 18% are in government treasuries; 14% are in high-yield securities; 10% are in foreign securities; 9% are in asset-
backed and mortgage-backed securities; and 6% are in other various fixed income securities.(2) 42% of “alternative investments” are in relative value funds; 24% are in long-short equity funds; 21% are in event-driven funds; 7% are distributed in hedged and non-hedged funds; and 6%
are in credit funds.(3) “Miscellaneous funds” is comprised of insurance contracts in Finland, Norway and Switzerland.(4) Certain investments that are measured at fair value using the net asset value per share (or its equivalent) practical expedient have not been categorized in the fair value hierarchy.
The following is a reconciliation of Level 3 assets as of December 31, 2019 (in millions):
Total AlternativeInvestments
MiscellaneousFunds
Beginning balance as of December 31, 2018 $ 30.5 $ 2.3 $ 28.2Actual return on plan assets:
(a) Relating to assets still held at reporting date 1.9 (0.1) 2.0(b) Relating to assets sold during period — — —
Purchases, sales and /or settlements 1.3 0.1 1.2Foreign currency exchange rate changes (0.6) — (0.6)
Ending balance as of December 31, 2019 $ 33.1 $ 2.3 $ 30.8
77

Table of ContentsAGCO CORPORATION
NOTES TO CONSOLIDATED FINANCIAL STATEMENTS - (Continued)
The fair value of the Company’s pension assets as of December 31, 2018 is as follows (in millions):
Total Level 1 Level 2 Level 3Equity securities:
Global equities $ 104.4 $ 104.4 $ — $ —Non-U.S. equities 3.0 3.0 — —U.K. equities 112.4 112.4 — —U.S. large cap equities 4.5 4.5 — —U.S. small cap equities 2.4 2.4 — —Preferred securities 0.2 0.2
Total equity securities 226.9 226.9 — —Fixed income:
Aggregate fixed income 131.5 131.5 — —International fixed income 189.3 189.3 — —
Total fixed income share(1) 320.8 320.8 — —Alternative investments:
Private equity fund 2.3 — — 2.3Hedge funds measured at net asset value(4) 31.8 — — —
Total alternative investments(2) 34.1 — — 2.3Miscellaneous funds(3) 28.2 — — 28.2Cash and equivalents measured at net asset value(4) 7.1 — — —
Total assets $ 617.1 $ 547.7 $ — $ 30.5_______________________________________(1) 36% of “fixed income” securities are in investment-grade corporate bonds; 27% are in government treasuries; 17% are in foreign securities; 13% are in high-yield securities; and 7% are in
other various fixed income securities.(2) 44% of “alternative investments” are in relative value funds; 22% are in long-short equity funds; 22% are in event-driven funds; 7% are distributed in hedged and non-hedged funds; and 5%
are in credit funds.(3) “Miscellaneous funds” is comprised of insurance contracts in Finland, Norway and Switzerland.(4) Certain investments that are measured at fair value using the net asset value per share (or its equivalent) practical expedient have not been categorized in the fair value hierarchy.
The following is a reconciliation of Level 3 assets as of December 31, 2018 (in millions):
Total AlternativeInvestments
MiscellaneousFunds
Beginning balance as of December 31, 2017 $ 27.8 $ 2.4 $ 25.4Actual return on plan assets:
(a) Relating to assets still held at reporting date 0.8 (0.2) 1.0(b) Relating to assets sold during period — — —
Purchases, sales and /or settlements 3.2 0.1 3.1Foreign currency exchange rate changes (1.3) — (1.3)
Ending balance as of December 31, 2018 $ 30.5 $ 2.3 $ 28.2
All tax-qualified pension fund investments in the United States are held in the AGCO Corporation Master Pension Trust. The Company’s globalpension fund strategy is to diversify investments across broad categories of equity and fixed income securities with appropriate use of alternative investmentcategories to minimize risk and volatility. The primary investment objective of the Company’s pension plans is to secure participant retirement benefits. Assuch, the key objective in the pension plans’ financial management is to promote stability and, to the extent appropriate, growth in funded status.
The investment strategy for the plans’ portfolio of assets balances the requirement to generate returns with the need to control risk. The asset mix isrecognized as the primary mechanism to influence the reward and risk structure of the pension fund investments in an effort to accomplish the plans’ fundingobjectives. The overall investment strategies and target
78

Table of ContentsAGCO CORPORATION
NOTES TO CONSOLIDATED FINANCIAL STATEMENTS - (Continued)
allocations of retirement fund investments for the Company’s U.S.-based pension plans and the non-U.S. based pension plans are as follow:
U.S. Pension Plans Non-U.S. Pension
Plans(1)
Overall investment strategies(2): Assets for the near-term benefit payments 60.0% 55.0%Assets for longer-term growth 40.0% 45.0%
Total 100.0% 100.0%
Target allocations: Equity securities 30.0% 40.0%Fixed income securities 55.0% 55.0%Alternative investments 10.0% 5.0%Cash and cash equivalents 5.0% —%
Total 100.0% 100.0%_______________________________________(1) The majority of the Company’s non-U.S. pension fund investments are related to the Company’s pension plan in the United Kingdom.(2) The overall U.S. and non-U.S. pension funds invest in a broad diversification of assets types.
The Company has noted that over very long periods, this mix of investments would achieve an average return on its U.S.-based pension plans ofapproximately 5.50%. In arriving at the choice of an expected return assumption of 5.0% for its U.S. plans for the year ended December 31, 2020, theCompany has tempered this historical indicator with lower expectations for returns and changes to investments in the future as well as the administrative costsof the plans. The Company has noted that over very long periods, this mix of investments would achieve an average return on its non-U.S. based pensionplans of approximately 4.75%. In arriving at the choice of an expected return assumption of 4.25% for its U.K.-based plans for the year ended December 31,2020, the Company has tempered this historical indicator with lower expectations for returns and changes to investments in the future as well as theadministrative costs of the plans.
Equity securities primarily include investments in large-cap and small-cap companies located across the globe. Fixed income securities includecorporate bonds of companies from diversified industries, mortgage-backed securities, agency mortgages, asset-backed securities and government securities.Alternative and other assets include investments in hedge fund of funds that follow diversified investment strategies. To date, the Company has not investedpension funds in its own stock and has no intention of doing so in the future.
Within each asset class, careful consideration is given to balancing the portfolio among industry sectors, geographies, interest rate sensitivity,dependence on economic growth, currency and other factors affecting investment returns. The assets are managed by professional investment firms, who arebound by precise mandates and are measured against specific benchmarks. Among asset managers, consideration is given, among others, to balancingsecurity concentration, issuer concentration, investment style and reliance on particular active investment strategies.
The Company participates in a small number of multiemployer plans in the Netherlands and Sweden. The Company has assessed and determinedthat none of the multiemployer plans which it participates in are individually, or in the aggregate, significant to the Company’s Consolidated FinancialStatements. The Company does not expect to incur a withdrawal liability or expect to significantly increase its contributions over the remainder of themultiemployer plans’ contract periods.
The Company maintains separate defined contribution plans covering certain employees, primarily in the United States, the United Kingdom andBrazil. Under the plans, the Company contributes a specified percentage of each eligible employee’s compensation. The Company contributed approximately$15.8 million for both the years ended December 31, 2019 and 2018, and approximately $15.1 million for the year ended December 31, 2017.
79

Table of ContentsAGCO CORPORATION
NOTES TO CONSOLIDATED FINANCIAL STATEMENTS - (Continued)
9. Stockholders’ Equity
Common Stock
At December 31, 2019, the Company had 150,000,000 authorized shares of common stock with a par value of $0.01 per share, with approximately75,471,562 shares of common stock outstanding and approximately 3,581,614 shares reserved for issuance under the Company’s 2006 Long-Term IncentivePlan (the “Plan”) (See Note 10).
Share Repurchase Program
During 2019 and 2018, the Company repurchased 1,794,256 and 3,120,184 shares of its common stock, respectively, for approximately $130.0million and $184.3 million, respectively, either through Accelerated Share Repurchase (“ASR”) agreements with financial institutions or through open markettransactions. All shares received were retired upon receipt, and the excess of the purchase price over par value per share was recorded to a combination of“Additional paid-in capital” and “Retained earnings” within the Company’s Consolidated Balance Sheets.
As of December 31, 2019, the remaining amount authorized to be repurchased under board-approved share repurchase authorizations wasapproximately $300.0 million, which has no expiration date.
In February 2020, the Company entered into an ASR agreement with a financial institution to repurchase an aggregate of $25.0 million of shares ofits common stock. The Company received approximately 297,000 shares to date in this transaction. Upon settlement of the ASR, the Company may beentitled to receive additional shares of common stock or, under certain circumstances, be required to remit a settlement amount. The Company expects thatthe additional shares will be received by the Company upon final settlement of its current ASR agreement, which expires during the second quarter of 2020.
Dividends
The Company’s Board of Directors has declared and the Company has paid quarterly cash dividends per common share generally beginning in thefirst quarter of the following years:
2019(1) 2018 2017Dividends declared and paid per common share $ 0.15 $ 0.15 $ 0.14____________________________________(1) The Company's Board of Directors has declared and the Company has paid quarterly cash dividends of $0.16 per common share beginning in the second quarter of 2019, from $0.15 per
common share in the first quarter of 2019.
On January 23, 2020, the Company’s Board of Directors approved a quarterly dividend of $0.16 per common share beginning in the first quarter of2020.
80

Table of ContentsAGCO CORPORATION
NOTES TO CONSOLIDATED FINANCIAL STATEMENTS - (Continued)
Accumulated Other Comprehensive Loss
The following table sets forth changes in accumulated other comprehensive loss by component, net of tax, attributed to AGCO Corporation and itssubsidiaries for the years ended December 31, 2019 and 2018 (in millions):
Defined BenefitPension Plans
CumulativeTranslationAdjustment
Deferred Net Gains(Losses) onDerivatives Total
Accumulated other comprehensive loss, December 31,2017 $ (285.1) $ (1,071.8) $ (4.7) $ (1,361.6)
Other comprehensive loss before reclassifications (10.3) (202.6) (1.1) (214.0)Net losses reclassified from accumulated other
comprehensive loss 13.0 — 7.2 20.2Other comprehensive income (loss), net of
reclassification adjustments 2.7 (202.6) 6.1 (193.8)Accumulated other comprehensive loss, December 31,
2018 (282.4) (1,274.4) 1.4 (1,555.4)Other comprehensive loss before reclassifications (27.4) (23.1) (2.6) (53.1)Net losses (gains) reclassified from accumulated
other comprehensive loss 13.4 — (0.1) 13.3Other comprehensive loss, net of reclassification
adjustments (14.0) (23.1) (2.7) (39.8)Accumulated other comprehensive loss, December 31,
2019 $ (296.4) $ (1,297.5) $ (1.3) $ (1,595.2)
81
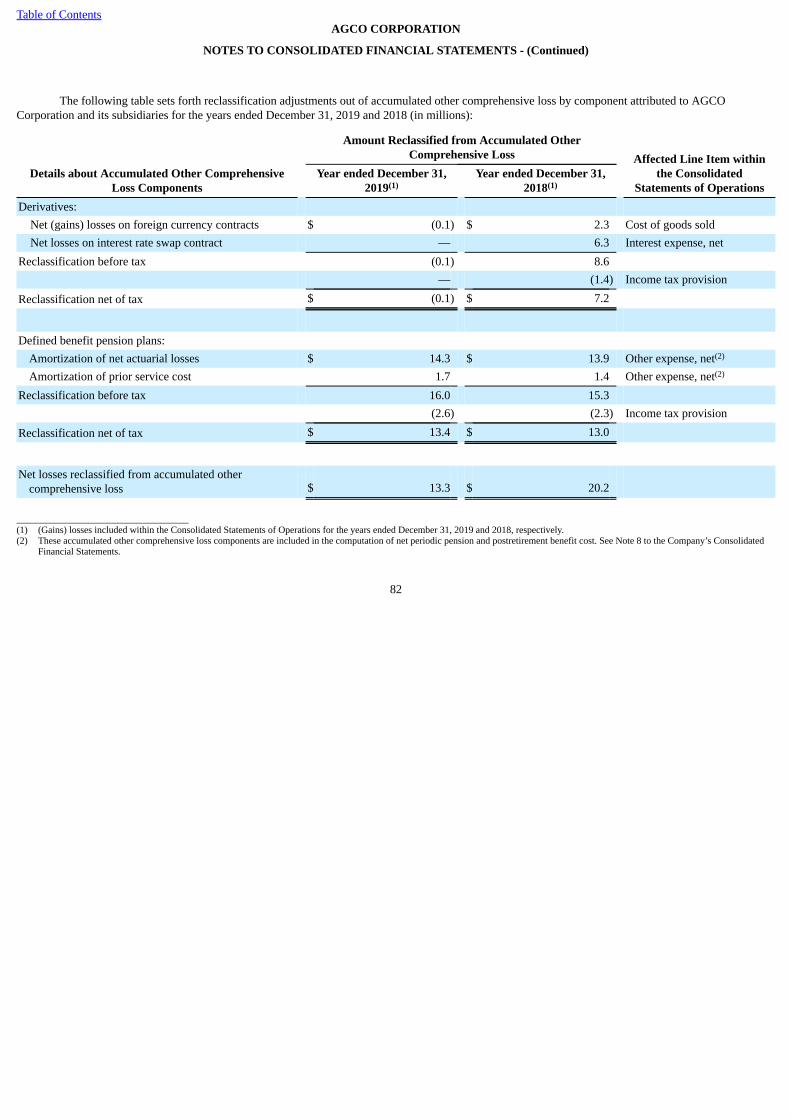
Table of ContentsAGCO CORPORATION
NOTES TO CONSOLIDATED FINANCIAL STATEMENTS - (Continued)
The following table sets forth reclassification adjustments out of accumulated other comprehensive loss by component attributed to AGCOCorporation and its subsidiaries for the years ended December 31, 2019 and 2018 (in millions):
Details about Accumulated Other ComprehensiveLoss Components
Amount Reclassified from Accumulated Other
Comprehensive Loss Affected Line Item withinthe Consolidated
Statements of Operations Year ended December 31,
2019(1) Year ended December 31,
2018(1) Derivatives: Net (gains) losses on foreign currency contracts $ (0.1) $ 2.3 Cost of goods sold Net losses on interest rate swap contract — 6.3 Interest expense, netReclassification before tax (0.1) 8.6 — (1.4) Income tax provision
Reclassification net of tax $ (0.1) $ 7.2
Defined benefit pension plans: Amortization of net actuarial losses $ 14.3 $ 13.9 Other expense, net(2)
Amortization of prior service cost 1.7 1.4 Other expense, net(2)
Reclassification before tax 16.0 15.3 (2.6) (2.3) Income tax provision
Reclassification net of tax $ 13.4 $ 13.0
Net losses reclassified from accumulated othercomprehensive loss $ 13.3 $ 20.2
____________________________________(1) (Gains) losses included within the Consolidated Statements of Operations for the years ended December 31, 2019 and 2018, respectively.(2) These accumulated other comprehensive loss components are included in the computation of net periodic pension and postretirement benefit cost. See Note 8 to the Company’s Consolidated
Financial Statements.
82

Table of ContentsAGCO CORPORATION
NOTES TO CONSOLIDATED FINANCIAL STATEMENTS - (Continued)
10. Stock Incentive Plan
Under the Plan, up to 10,000,000 shares of AGCO common stock may be issued. As of December 31, 2019, approximately 3,581,614 sharesremained available for grant, assuming the maximum number of shares are earned related to the performance award grants discussed below. The Plan allowsthe Company, under the direction of the Board of Directors’ Compensation Committee, to make grants of performance shares, stock appreciation rights,restricted stock units and restricted stock awards to employees, officers and non-employee directors of the Company.
Long-Term Incentive Plan and Related Performance Awards
The Company’s primary long-term incentive plan is a performance share plan that provides for awards of shares of the Company’s common stockbased on achieving financial targets, such as targets for earnings per share, return on invested capital and operating margins, as determined by the Company’sBoard of Directors. The stock awards under the Plan are earned over a performance period, and the number of shares earned is determined based on annualcumulative or average results for the specified period, depending on the measurement. Performance periods for the Company’s primary long-term incentiveplan are consecutive and overlapping three-year cycles, and performance targets are set at the beginning of each cycle. The primary long-term incentive planprovides for participants to earn 33% to 200% of the target awards depending on the actual performance achieved, with no shares earned if performance isbelow the established minimum target. Awards earned under the Plan are paid in shares of common stock at the end of each three-year performance period.The percentage level achievement is determined annually, with the ultimate award that is earned determined based upon the average of the three annualpercentages. The compensation expense associated with these awards is amortized ratably over the vesting or performance period based on the Company’sprojected assessment of the level of performance that will be achieved and earned.
Compensation expense recorded during 2019, 2018 and 2017 with respect to awards granted was based upon the stock price as of the grant date. Theweighted average grant-date fair value of performance awards granted under the Plan during 2019, 2018 and 2017 was as follows:
Years Ended December 31, 2019 2018 2017Weighted average grant-date fair value $ 61.01 $ 71.40 $ 61.94
During 2019, the Company granted 542,180 performance awards related to varying performance periods. The awards granted assume the maximumtarget levels of performance are achieved. The compensation expense associated with all awards granted under the Plan is amortized ratably over the vestingor performance period based on the Company’s projected assessment of the level of performance that will be achieved.
Performance award transactions during 2019 were as follows and are presented as if the Company were to achieve its maximum levels ofperformance under the plan:
Shares awarded but not earned at January 1 938,862Shares awarded 542,180Shares forfeited (45,346)Shares earned (503,514)
Shares awarded but not earned at December 31 932,182
Based on the level of performance achieved as of December 31, 2019, 492,314 shares were earned under the related performance period and 302,009shares were issued in February 2020, net of 190,305 shares that were withheld for taxes related to the earned awards. The Plan allows for the participant tohave the option of forfeiting a portion of the shares awarded in lieu of a cash payment contributed to the participant’s tax withholding to satisfy theparticipant’s statutory minimum federal, state and employment taxes which would be payable at the time of grant.
During 2017, the Company recorded approximately $4.8 million of accelerated stock compensation expense associated with a stock award declinedby the Company’s Chief Executive Officer.
83

Table of ContentsAGCO CORPORATION
NOTES TO CONSOLIDATED FINANCIAL STATEMENTS - (Continued)
As of December 31, 2019, the total compensation cost related to unearned performance awards not yet recognized, assuming the Company’s currentprojected assessment of the level of performance that will be achieved, was approximately $24.0 million, and the weighted average period over which it isexpected to be recognized is approximately one and one-half years. This estimate is based on the current projected levels of performance of outstandingawards. The compensation cost not yet recognized could be higher or lower based on actual achieved levels of performance.
Restricted Stock Units
During the year ended December 31, 2019, the Company granted 165,160 restricted stock unit (“RSU”) awards. These awards entitle the participantto receive one share of the Company’s common stock for each RSU granted and vest one-third per year over a three-year requisite service period, subject toadjustment in certain cases based on performance metric relative to the Company's peer group, commencing in 2020. The compensation expense associatedwith these awards is being amortized ratably over the requisite service period for the awards that are expected to vest. The weighted average grant-date fairvalue of the RSUs granted under the Plan during the years ended December 31, 2019, 2018 and 2017 were $61.01, $63.99 and $61.99, respectively. RSUtransactions during the year ended December 31, 2019 were as follows:
Shares awarded but not vested at January 1 352,975Shares awarded 165,160Shares forfeited (8,424)Shares vested (113,182)
Shares awarded but not vested at December 31 396,529
As of December 31, 2019, the total compensation cost related to the unvested RSUs not yet recognized was approximately $12.6 million, and theweighted average period over which it is expected to be recognized is approximately one and one-half years.
Stock-settled Appreciation Rights
Certain executives and key managers are eligible to receive grants of SSARs. The SSARs provide a participant with the right to receive theaggregate appreciation in stock price over the market price of the Company’s common stock at the date of grant, payable in shares of the Company’s commonstock. The participant may exercise his or her SSARs at any time after the grant is vested but no later than seven years after the date of grant. The SSARs vestratably over a four-year period from the date of grant. SSAR awards made to certain executives and key managers under the Plan are made with the base priceequal to the price of the Company’s common stock on the date of grant. The Company recorded stock compensation expense of approximately $2.4 million,$2.4 million and $3.0 million associated with SSAR awards during 2019, 2018 and 2017, respectively. The compensation expense associated with theseawards is being amortized ratably over the vesting period. The Company estimated the fair value of the grants using the Black-Scholes option pricing model.
The weighted average grant-date fair value of SSAR awards granted under the Plan and the weighted average assumptions under the Black-Scholesoption model were as follows for the years ended December 31, 2019, 2018 and 2017:
Years Ended December 31, 2019 2018 2017Weighted average grant-date fair value $ 11.34 $ 12.88 $ 11.45Weighted average assumptions under Black-Scholes option model: Expected life of awards (years) 3.0 3.0 3.0Risk-free interest rate 2.6% 2.2% 1.5%Expected volatility 24.2% 23.7% 25.9%Expected dividend yield 1.0% 0.8% 0.9%
84
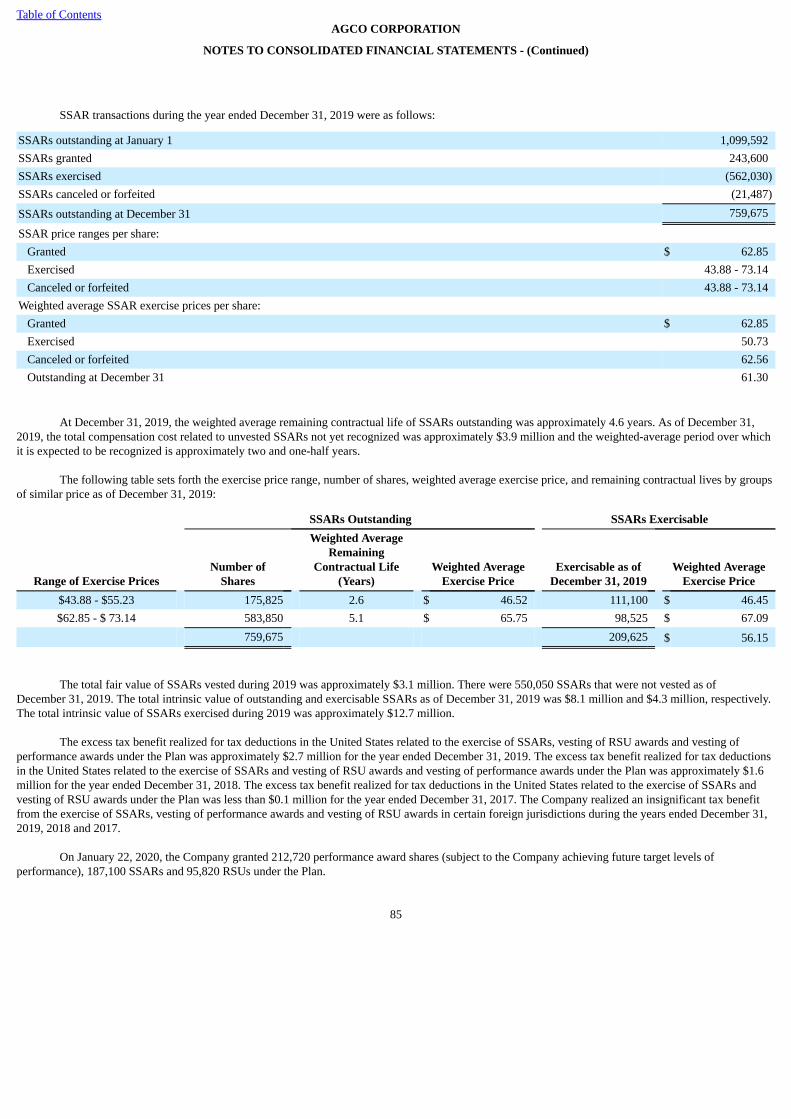
Table of ContentsAGCO CORPORATION
NOTES TO CONSOLIDATED FINANCIAL STATEMENTS - (Continued)
SSAR transactions during the year ended December 31, 2019 were as follows:
SSARs outstanding at January 1 1,099,592SSARs granted 243,600SSARs exercised (562,030)SSARs canceled or forfeited (21,487)
SSARs outstanding at December 31 759,675
SSAR price ranges per share: Granted $ 62.85Exercised 43.88 - 73.14Canceled or forfeited 43.88 - 73.14
Weighted average SSAR exercise prices per share: Granted $ 62.85Exercised 50.73Canceled or forfeited 62.56Outstanding at December 31 61.30
At December 31, 2019, the weighted average remaining contractual life of SSARs outstanding was approximately 4.6 years. As of December 31,2019, the total compensation cost related to unvested SSARs not yet recognized was approximately $3.9 million and the weighted-average period over whichit is expected to be recognized is approximately two and one-half years.
The following table sets forth the exercise price range, number of shares, weighted average exercise price, and remaining contractual lives by groupsof similar price as of December 31, 2019:
SSARs Outstanding SSARs Exercisable
Range of Exercise Prices Number of
Shares
Weighted AverageRemaining
Contractual Life(Years)
Weighted AverageExercise Price
Exercisable as ofDecember 31, 2019
Weighted AverageExercise Price
$43.88 - $55.23 175,825 2.6 $ 46.52 111,100 $ 46.45$62.85 - $ 73.14 583,850 5.1 $ 65.75 98,525 $ 67.09
759,675 209,625 $ 56.15
The total fair value of SSARs vested during 2019 was approximately $3.1 million. There were 550,050 SSARs that were not vested as ofDecember 31, 2019. The total intrinsic value of outstanding and exercisable SSARs as of December 31, 2019 was $8.1 million and $4.3 million, respectively.The total intrinsic value of SSARs exercised during 2019 was approximately $12.7 million.
The excess tax benefit realized for tax deductions in the United States related to the exercise of SSARs, vesting of RSU awards and vesting ofperformance awards under the Plan was approximately $2.7 million for the year ended December 31, 2019. The excess tax benefit realized for tax deductionsin the United States related to the exercise of SSARs and vesting of RSU awards and vesting of performance awards under the Plan was approximately $1.6million for the year ended December 31, 2018. The excess tax benefit realized for tax deductions in the United States related to the exercise of SSARs andvesting of RSU awards under the Plan was less than $0.1 million for the year ended December 31, 2017. The Company realized an insignificant tax benefitfrom the exercise of SSARs, vesting of performance awards and vesting of RSU awards in certain foreign jurisdictions during the years ended December 31,2019, 2018 and 2017.
On January 22, 2020, the Company granted 212,720 performance award shares (subject to the Company achieving future target levels ofperformance), 187,100 SSARs and 95,820 RSUs under the Plan.
85

Table of ContentsAGCO CORPORATION
NOTES TO CONSOLIDATED FINANCIAL STATEMENTS - (Continued)
Director Restricted Stock Grants
Pursuant to the Plan, all non-employee directors receive annual restricted stock grants of the Company’s common stock. All restricted stock grantsmade to the Company’s directors are restricted as to transferability for a period of one year. In the event a director departs from the Company’s Board ofDirectors, the non-transferability period expires immediately. The plan allows each director to have the option of forfeiting a portion of the shares awarded inlieu of a cash payment contributed to the participant’s tax withholding to satisfy the statutory minimum federal, state and employment taxes that would bepayable at the time of grant. The 2019 grant was made on April 25, 2019 and equated to 19,386 shares of common stock, of which 14,105 shares of commonstock were issued, after shares were withheld for taxes. The Company recorded stock compensation expense of approximately $1.4 million during 2019associated with these grants.
11. Derivative Instruments and Hedging Activities
The Company attempts to manage its transactional foreign exchange exposure by hedging foreign currency cash flow forecasts and commitmentsarising from the anticipated settlement of receivables and payables and from future purchases and sales. Where naturally offsetting currency positions do notoccur, the Company hedges certain, but not all, of its exposures through the use of foreign currency contracts. The Company’s translation exposure resultingfrom translating the financial statements of foreign subsidiaries into United States dollars may be partially hedged from time to time. When practical, thetranslation impact is reduced by financing local operations with local borrowings.
The Company uses floating rate and fixed rate debt to finance its operations. The floating rate debt obligations expose the Company to variability ininterest payments due to changes in the EURIBOR and LIBOR benchmark interest rates. The Company believes it is prudent to limit the variability of aportion of its interest payments, and to meet that objective, the Company periodically enters into interest rate swaps to manage the interest rate risk associatedwith the Company’s borrowings. The Company designates interest rate contracts used to convert the interest rate exposure on a portion of the Company’s debtportfolio from a floating rate to a fixed rate as cash flow hedges, while those contracts converting the Company’s interest rate exposure from a fixed rate to afloating rate are designated as fair value hedges.
To protect the value of the Company’s investment in foreign operations against adverse changes in foreign currency exchange rates, the Companyfrom time to time, may hedge a portion of the Company’s net investment in the foreign subsidiaries by using a cross currency swap. The component of thegains and losses on the Company’s net investment in the designated foreign operations driven by changes in foreign exchange rates are economically offset bymovements in the fair value of the cross currency swap contracts.
The Company’s senior management establishes the Company’s foreign currency and interest rate risk management policies. These policies arereviewed periodically by the Finance Committee of the Company’s Board of Directors. The policies allow for the use of derivative instruments to hedgeexposures to movements in foreign currency and interest rates. The Company’s policies prohibit the use of derivative instruments for speculative purposes.
All derivatives are recognized on the Company’s Consolidated Balance Sheets at fair value. On the date the derivative contract is entered into, theCompany designates the derivative as either (1) a cash flow hedge of a forecasted transaction, (2) a fair value hedge of a recognized liability, (3) a hedge of anet investment in a foreign operation, or (4) a non-designated derivative instrument.
The Company categorizes its derivative assets and liabilities into one of three levels based on the assumptions used in valuing the asset or liability.See Note 13 for a discussion of the fair value hierarchy as per the guidance in ASC 820. The Company’s valuation techniques are designed to maximize theuse of observable inputs and minimize the use of unobservable inputs.
Counterparty Risk
The Company regularly monitors the counterparty risk and credit ratings of all the counterparties to the derivative instruments. The Companybelieves that its exposures are appropriately diversified across counterparties and that these counterparties are creditworthy financial institutions. If theCompany perceives any risk with a counterparty, then the Company would cease to do business with that counterparty. There have been no negative impactsto the Company from any non-performance of any counterparties.
86

Table of ContentsAGCO CORPORATION
NOTES TO CONSOLIDATED FINANCIAL STATEMENTS - (Continued)
Derivative Transactions Designated as Hedging Instruments
Cash Flow Hedges
Foreign Currency Contracts
The Company uses cash flow hedges to minimize the variability in cash flows of assets or liabilities or forecasted transactions caused by fluctuationsin foreign currency exchange rates. The changes in the fair values of these cash flow hedges are recorded in accumulated other comprehensive loss and aresubsequently reclassified into “Cost of goods sold” during the period the sales and purchases are recognized. These amounts offset the effect of the changes inforeign currency rates on the related sale and purchase transactions.
During 2019, 2018 and 2017, the Company designated certain foreign currency contracts as cash flow hedges of expected future sales and purchases.The total notional value of derivatives that were designated as cash flow hedges was $332.7 million and $127.0 million as of December 31, 2019 and 2018,respectively.
The following table summarizes the after-tax impact that changes in the fair value of derivatives designated as cash flow hedges had on accumulatedother comprehensive loss and net income during 2019, 2018 and 2017 (in millions):
Recognized in Net Income
(Loss) GainRecognized inAccumulated
OtherComprehensive Loss
Classification of Gain(Loss)
Gain (Loss)Reclassified from
AccumulatedOther
ComprehensiveLoss into Income
Total Amount ofthe Line Item in the
ConsolidatedStatements of
OperationsContaining Hedge
Gains (Losses)2019 Foreign currency contracts(1) $ (2.6) Cost of goods sold $ 0.1 $ 7,057.12018 Foreign currency contracts $ 0.4 Cost of goods sold $ (2.2) $ 7,355.3Interest rate swap contract (1.5) Interest expense, net (5.0) 53.8
Total $ (1.1) $ (7.2)
2017 Foreign currency contracts $ 2.7 Cost of goods sold $ 0.4 $ 6,541.2Interest rate swap contract (0.7) Interest expense, net (2.4) 45.1
Total $ 2.0 $ (2.0)
(1) The outstanding contracts as of December 31, 2019 range in maturity through December 2020.
87

Table of ContentsAGCO CORPORATION
NOTES TO CONSOLIDATED FINANCIAL STATEMENTS - (Continued)
The following table summarizes the activity in accumulated other comprehensive loss related to the derivatives held by the Company during theyears ended December 31, 2019, 2018 and 2017 (in millions):
Before-Tax
Amount Income
Tax After-TaxAmount
Accumulated derivative net losses as of December 31, 2016 $ (10.1) $ (1.4) $ (8.7)Net changes in fair value of derivatives 1.9 (0.1) 2.0Net losses reclassified from accumulated other comprehensive loss into income 2.2 0.2 2.0Accumulated derivative net losses as of December 31, 2017 $ (6.0) $ (1.3) $ (4.7)Net changes in fair value of derivatives (1.0) 0.1 (1.1)Net losses reclassified from accumulated other comprehensive loss into income 8.6 1.4 7.2Accumulated derivative net gains as of December 31, 2018 1.6 0.2 1.4Net changes in fair value of derivatives (3.0) (0.4) (2.6)Net gains reclassified from accumulated other comprehensive loss into income (0.1) — (0.1)
Accumulated derivative net losses as of December 31, 2019 $ (1.5) $ (0.2) $ (1.3)
Net Investment Hedges
The Company uses non-derivative and derivative instruments, to hedge a portion of its net investment in foreign operations against adversemovements in exchange rates. For instruments that are designated as hedges of net investments in foreign operations, changes in the fair value of thederivative instruments are recorded in foreign currency translation adjustments, a component of accumulated other comprehensive loss, to offset changes inthe value of the net investments being hedged. When the net investment in foreign operations is sold or substantially liquidates, the amounts recorded inaccumulated other comprehensive loss are reclassified to earnings. To the extent foreign currency denominated debt is de-designated from a net investmenthedge relationship, changes in the value of the foreign currency denominated debt are recorded in earnings through the maturity date.
In January 2018, the Company entered into a cross currency swap contract as a hedge of its net investment in foreign operations to offset foreigncurrency translation gains or losses on the net investment. The cross currency swap has an expiration date of January 19, 2021. At maturity of the crosscurrency swap contract, the Company will deliver the notional amount of approximately €245.7 million (or approximately $275.3 million as of December 31,2019) and will receive $300.0 million from the counterparties. The Company will receive quarterly interest payments from the counterparties based on a fixedinterest rate until maturity of the cross currency swap.
In January 2019 and September 2019, the Company designated €160.0 million and €30.0 million, respectively, of its multi-currency revolving creditfacility with a maturity date of October 17, 2023 as a hedge of its net investment in foreign operations to offset foreign currency translation gains or losses onthe net investment. During September 2019, the Company repaid the designated amount outstanding under its multi-currency revolving credit facility and theforeign currency denominated debt was de-designated as a net investment hedge.
The following table summarizes the notional values of the instrument designated as a net investment hedge (in millions):
Notional Amount as of December 31, 2019 December 31, 2018Cross currency swap contract $ 300.0 $ 300.0
88

Table of ContentsAGCO CORPORATION
NOTES TO CONSOLIDATED FINANCIAL STATEMENTS - (Continued)
The following table summarizes the after-tax impact of changes in the fair value of the instrument designated as a net investment hedge (in millions):
Gain (Loss) Recognized in Accumulated Other Comprehensive
Loss for the Years Ended December 31, 2019 December 31, 2018 December 31, 2017Foreign currency denominated debt $ 2.5 $ (14.4) $ (45.0)Cross currency swap contract 9.3 17.7 —
Derivative Transactions Not Designated as Hedging Instruments
During 2019, 2018 and 2017, the Company entered into foreign currency contracts to economically hedge receivables and payables on the Companyand its subsidiaries’ balance sheets that are denominated in foreign currencies other than the functional currency. These contracts were classified as non-designated derivative instruments. Gains and losses on such contracts are substantially offset by losses and gains on the remeasurement of the underlyingasset or liability being hedged and are immediately recognized into earnings. As of December 31, 2019 and 2018, the Company had outstanding foreigncurrency contracts with a notional amount of approximately $2,800.3 million and $1,335.8 million, respectively.
The following table summarizes the impact that changes in the fair value of derivatives not designated as hedging instruments had on net income (inmillions):
For the Years Ended
Classification of
Gain (Loss) December 31,
2019 December 31,
2018 December 31,
2017Foreign currency contracts Other expense, net $ 20.4 $ (1.4) $ 38.3
The table below sets forth the fair value of derivative instruments as of December 31, 2019 (in millions):
Asset Derivatives as of December 31, 2019 Liability Derivatives as of December 31, 2019
Balance Sheet
Location Fair
Value Balance Sheet
Location Fair
ValueDerivative instruments designated as hedginginstruments:
Foreign currency contracts Other current assets $ 0.6 Other current liabilities $ 1.9Cross currency swap contract Other noncurrent assets 27.0 Other noncurrent liabilities —
Derivative instruments not designated as hedginginstruments:
Foreign currency contracts Other current assets 11.7 Other current liabilities 13.1
Total derivative instruments $ 39.3 $ 15.0
89

Table of ContentsAGCO CORPORATION
NOTES TO CONSOLIDATED FINANCIAL STATEMENTS - (Continued)
The table below sets forth the fair value of derivative instruments as of December 31, 2018 (in millions):
Asset Derivatives as of December 31, 2018 Liability Derivatives as of December 31, 2018
Balance Sheet
Location Fair
Value Balance Sheet
Location Fair
ValueDerivative instruments designated as hedginginstruments:
Foreign currency contracts Other current assets $ 1.9 Other current liabilities $ 0.4Cross currency swap contract Other noncurrent assets 17.7 Other noncurrent liabilities —
Derivative instruments not designated as hedginginstruments:
Foreign currency contracts Other current assets 5.1 Other current liabilities 6.2
Total derivative instruments $ 24.7 $ 6.6
Former Interest Rate Swap Contract
The Company monitors the mix of short-term and long-term debt regularly. From time to time, the Company manages the risk to interest ratefluctuations through the use of derivative financial instruments. During 2015, the Company entered into an interest rate swap instrument with a notionalamount of €312.0 million and an expiration date of June 26, 2020. The swap was designated and accounted for as a cash flow hedge. Under the swapagreement, the Company paid a fixed interest rate of 0.33% plus the applicable margin, and the counterparty to the agreement paid a floating interest ratebased on the three-month EURIBOR. Changes in the fair value of the interest rate swap were recorded in accumulated other comprehensive loss and weresubsequently reclassified into “Interest expense, net” as a rate adjustment in the same period in which the related interest on the Company’s floating rate termloan facility affected earnings. As a result of the Company’s new credit facility agreement entered into in October 2018 and the repayment of the €312.0million (or approximately $360.8 million) term loan under the Company’s former revolving credit facility, as well as the change in the mix of the Company’sshort-term and long-term debt, the Company terminated the interest rate swap instrument and recorded a loss of approximately $3.9 million which wasrecorded in “Interest expense, net” for the year ended December 31, 2018. Refer to Note 7 for further information.
90

Table of ContentsAGCO CORPORATION
NOTES TO CONSOLIDATED FINANCIAL STATEMENTS - (Continued)
12. Commitments and Contingencies
The future payments required under the Company’s significant commitments, excluding indebtedness, as of December 31, 2019 are as follows (inmillions):
Payments Due By Period 2020 2021 2022 2023 2024 Thereafter TotalInterest payments related to indebtedness(1)(2) $ 13.9 $ 13.2 $ 10.8 $ 8.0 $ 5.8 $ 5.7 $ 57.4Unconditional purchase obligations(3) 102.1 20.9 4.5 0.2 — — 127.7Other short-term and long-term obligations(4) 91.7 67.3 38.5 32.4 18.5 47.6 296.0
Total contractual cash obligations $ 207.7 $ 101.4 $ 53.8 $ 40.6 $ 24.3 $ 53.3 $ 481.1____________________________________(1) Estimated interest payments are calculated assuming current interest rates over minimum maturity periods specified in debt agreements. Debt may be repaid sooner or later than such minimum
maturity periods (unaudited).(2) Refer to Note 7 for more information on the Company's commitments with respect to indebtedness.(3) Unconditional purchase obligations exclude routine purchase orders entered into in the normal course of business.(4) Other short-term and long-term obligations include estimates of future minimum contribution requirements under the Company’s U.S. and non-U.S. defined benefit pension and postretirement
plans. These estimates are based on current legislation in the countries the Company operates within and are subject to change. Other short-term and long-term obligations also include incometax liabilities related to uncertain income tax positions connected with ongoing income tax audits in various jurisdictions (unaudited).
Amount of Commitment Expiration Per Period 2020 2021 2022 2023 2024 Thereafter Total
Guarantees $ 44.7 $ 6.1 $ 6.9 $ 5.2 $ 3.2 $ 0.5 $ 66.6
Off-Balance Sheet Arrangements
Guarantees
The Company maintains a remarketing agreement with its U.S. finance joint venture, AGCO Finance LLC, whereby the Company is obligated torepurchase up to $6.0 million of repossessed equipment each calendar year. The Company believes that any losses that might be incurred on the resale of thisequipment will not materially impact the Company’s financial position or results of operations, due to the fair value of the underlying equipment.
At December 31, 2019, the Company has outstanding guarantees of indebtedness owed to third parties of approximately $47.6 million, primarilyrelated to dealer and end-user financing of equipment. Such guarantees generally obligate the Company to repay outstanding finance obligations owed tofinancial institutions if dealers or end users default on such loans through 2025. Losses under such guarantees historically have been insignificant. In addition,the Company generally would expect to be able to recover a significant portion of the amounts paid under such guarantees from the sale of the underlyingfinanced farm equipment, as the fair value of such equipment is expected to be sufficient to offset a substantial portion of the amounts paid. The Companyalso has obligations to guarantee indebtedness owed to certain of its finance joint ventures if dealers or end users default on loans. Losses under suchguarantees historically have been insignificant and the guarantees are not material. The Company believes the credit risk associated with all of theseguarantees is not material to its financial position or results of operations.
In addition, at December 31, 2019, the Company had accrued approximately $18.9 million of outstanding guarantees of minimum residual valuesthat may be owed to its finance joint ventures in the United States and Canada due upon expiration of certain eligible operating leases between the financejoint ventures and end users. The maximum potential amount of future payments under the guarantee is approximately $26.7 million.
Other
At December 31, 2019, the Company had outstanding designated and non-designated foreign exchange contracts with a gross notional amount ofapproximately $3,133.0 million. The outstanding contracts as of December 31, 2019 range in maturity through December 2020 (see Note 11).
91

Table of ContentsAGCO CORPORATION
NOTES TO CONSOLIDATED FINANCIAL STATEMENTS - (Continued)
The Company sells a majority of its wholesale receivables in North America, Europe and Brazil to its U.S., Canadian, European and Brazilianfinance joint ventures. The Company also sells certain accounts receivable under factoring arrangements to financial institutions around the world. TheCompany reviewed the sale of such receivables and determined that these facilities should be accounted for as off-balance sheet transactions.
Contingencies
In August 2008, as part of routine audits, the Brazilian taxing authorities disallowed deductions relating to the amortization of certain goodwillrecognized in connection with a reorganization of the Company’s Brazilian operations and the related transfer of certain assets to the Company’s Braziliansubsidiaries. The amount of the tax disallowance through December 31, 2019, not including interest and penalties, was approximately 131.5 million Brazilianreais (or approximately $32.6 million). The amount ultimately in dispute will be significantly greater because of interest and penalties. The Company hasbeen advised by its legal and tax advisors that its position with respect to the deductions is allowable under the tax laws of Brazil. The Company is contestingthe disallowance and believes that it is not likely that the assessment, interest or penalties will be required to be paid. However, the ultimate outcome will notbe determined until the Brazilian tax appeal process is complete, which could take several years.
The Company is a party to various other legal claims and actions incidental to its business. The Company believes that none of these claims oractions, either individually or in the aggregate, is material to its business or financial statements as a whole, including its results of operations and financialcondition.
13. Fair Value of Financial Instruments
The Company categorizes its assets and liabilities into one of three levels based on the assumptions used in valuing the asset or liability. Estimates offair value for financial assets and liabilities are based on a fair value hierarchy that prioritizes the inputs to valuation techniques used to measure fair value.Observable inputs (highest level) reflect market data obtained from independent sources, while unobservable inputs (lowest level) reflect internally developedmarket assumptions. In accordance with this guidance, fair value measurements are classified under the following hierarchy:
• Level 1 - Quoted prices in active markets for identical assets or liabilities.• Level 2 - Quoted prices for similar assets or liabilities in active markets; quoted prices for identical or similar assets or liabilities in markets that are
not active; and model-derived valuations in which all significant inputs are observable or can be corroborated by observable market data forsubstantially the full term of the assets or liabilities.
• Level 3 - Model-derived valuations in which one or more significant inputs are unobservable.
The Company categorizes its pension plan assets into one of the three levels of the fair value hierarchy. See Note 8 for a discussion of the valuationmethods used to measure the fair value of the Company’s pension plan assets.
The Company enters into foreign currency and interest rate swap contracts. The fair values of the Company’s derivative instruments are determinedusing discounted cash flow valuation models. The significant inputs used in these models are readily available in public markets, or can be derived fromobservable market transactions, and therefore have been classified as Level 2. Inputs used in these discounted cash flow valuation models for derivativeinstruments include the applicable exchange rates, forward rates or interest rates. Such models used for option contracts also use implied volatility. See Note11 for a discussion of the Company’s derivative instruments and hedging activities.
92

Table of ContentsAGCO CORPORATION
NOTES TO CONSOLIDATED FINANCIAL STATEMENTS - (Continued)
Assets and liabilities measured at fair value on a recurring basis as of December 31, 2019 and 2018 are summarized below (in millions):
As of December 31, 2019 Level 1 Level 2 Level 3 TotalDerivative assets $ — $ 39.3 $ — $ 39.3Derivative liabilities — 15.0 — 15.0
As of December 31, 2018 Level 1 Level 2 Level 3 TotalDerivative assets $ — $ 24.7 $ — $ 24.7Derivative liabilities — 6.6 — 6.6
Cash and cash equivalents, accounts and notes receivable, net and accounts payable are valued at their carrying amounts in the Company’sConsolidated Balance Sheets, due to the immediate or short-term maturity of these financial instruments.
The carrying amounts of long-term debt under the Company’s senior term loan due 2022, 1.002% senior term loan due 2025 and senior term loansdue between 2021 and 2028 approximate fair value based on the borrowing rates currently available to the Company for loans with similar terms and averagematurities. See Note 7 for additional information on the Company’s long-term debt.
14. Related Party Transactions
Rabobank, a financial institution based in the Netherlands, is a 51% owner in the Company’s finance joint ventures, which are located in the UnitedStates, Canada, Europe, Brazil, Argentina and Australia. Rabobank is also the principal agent and participant in the Company’s revolving credit facility (seeNote 7). The majority of the assets of the Company’s finance joint ventures represents finance receivables. The majority of the liabilities represents notespayable and accrued interest. Under the various joint venture agreements, Rabobank or its affiliates provide financing to the joint venture companies,primarily through lines of credit. During 2019, 2018 and 2017, the Company did not make additional investments in its finance joint ventures. During 2019and 2018, the Company received dividends of approximately $40.5 million and $29.4 million, respectively, from certain of the Company’s finance jointventures.
The Company’s finance joint ventures provide retail financing and wholesale financing to its dealers. The terms of the financing arrangementsoffered to the Company’s dealers are similar to arrangements the finance joint ventures provide to unaffiliated third parties. In addition, the Companytransfers, on an ongoing basis, a majority of its wholesale receivables in North America, Europe and Brazil to its U.S., Canadian, European and Brazilianfinance joint ventures (see Note 4). The Company maintains a remarketing agreement with its U.S. finance joint venture and has other guarantees with itsother finance joint ventures which were not material (see Note 12). In addition, as part of sales incentives provided to end users, the Company may from timeto time subsidize interest rates of retail financing provided by its finance joint ventures. The cost of those programs is recognized at the time of sale to theCompany’s dealers (See Note 1).
Tractors and Farm Equipment Limited (“TAFE”), in which the Company holds a 23.75% interest, manufactures and sells Massey Ferguson-brandedequipment primarily in India, and also supplies tractors and components to the Company for sale in other markets. Mallika Srinivasan, who is the Chairmanand Chief Executive Officer of TAFE, is currently a member of the Company’s Board of Directors. As of December 31, 2019, TAFE beneficially owned12,150,152 shares of the Company’s common stock, not including shares of the Company's common stock received by Ms. Srinivasan for service as adirector. The Company and TAFE are parties to an agreement pursuant to which, among other things, TAFE has agreed not to purchase in excess of12,150,152 shares of the Company’s common stock, subject to certain adjustments, and the Company has agreed to annually nominate a TAFE representativeto its Board of Directors. During 2019, 2018 and 2017, the Company purchased approximately $92.7 million, $109.6 million and $102.0 million, respectively,of tractors and components from TAFE. During 2019, 2018 and 2017, the Company sold approximately $1.5 million, $1.8 million and $1.2 million,respectively, of parts to TAFE. The Company received dividends from TAFE of approximately $2.0 million during 2019 and $1.8 million during both 2018and 2017.
93

Table of ContentsAGCO CORPORATION
NOTES TO CONSOLIDATED FINANCIAL STATEMENTS - (Continued)
During 2019, 2018 and 2017, the Company paid approximately $4.4 million, $3.5 million and $7.2 million, respectively, to PPG Industries, Inc. forpainting materials used in the Company’s manufacturing processes. The Company’s Chairman, President and Chief Executive Officer is currently a memberof the board of directors of PPG Industries, Inc.
During 2019, 2018 and 2017, the Company paid approximately $6.2 million, $1.6 million and $1.5 million, respectively, to Linde PLC (the parentcompany of Praxair, Inc.) for propane, gas and welding, and laser consumables used in the Company’s manufacturing processes. The Company’s Chairman,President and Chief Executive Officer served as a member of the board of directors of Praxair, Inc. until the business combination of Praxair, Inc. and LindeAG, and is currently a member of the board of directors of Linde PLC, the holding company for the combined business.
15. Segment Reporting
The Company’s four reportable segments distribute a full range of agricultural equipment and related replacement parts. The Company evaluatessegment performance primarily based on income from operations. Sales for each segment are based on the location of the third-party customer. TheCompany’s selling, general and administrative expenses and engineering expenses are generally charged to each segment based on the region and divisionwhere the expenses are incurred. As a result, the components of income from operations for one segment may not be comparable to another segment.Segment results for the years ended December 31, 2019, 2018 and 2017 based on the Company’s reportable segments are as follows (in millions):
Years Ended December 31, North
America South
America Europe/Middle
East Asia/Pacific/Africa Consolidated2019 Net sales $ 2,191.8 $ 802.2 $ 5,328.8 $ 718.6 $ 9,041.4Income (loss) from operations 121.6 (39.4) 638.2 43.4 763.8Depreciation 61.6 32.4 102.7 14.2 210.9Assets 1,125.6 758.0 2,187.7 430.2 4,501.5Capital expenditures 52.1 32.9 173.5 14.9 273.42018 Net sales $ 2,180.1 $ 959.0 $ 5,385.1 $ 827.8 $ 9,352.0Income (loss) from operations 103.1 (10.1) 601.1 49.6 743.7Depreciation 67.6 30.5 111.3 15.8 225.2Assets 1,032.1 736.1 1,905.8 501.1 4,175.1Capital expenditures 43.3 30.4 120.3 9.3 203.32017 Net sales $ 1,876.7 $ 1,063.5 $ 4,614.3 $ 752.0 $ 8,306.5Income from operations 66.9 15.4 493.3 48.8 624.4Depreciation 61.5 30.5 113.0 17.8 222.8Assets 1,064.1 752.1 2,074.4 499.4 4,390.0Capital expenditures 59.1 43.0 92.9 8.9 203.9
94

Table of ContentsAGCO CORPORATION
NOTES TO CONSOLIDATED FINANCIAL STATEMENTS - (Continued)
A reconciliation from the segment information to the consolidated balances for income from operations and total assets is set forth below (inmillions):
2019 2018 2017Segment income from operations $ 763.8 $ 743.7 $ 624.4Corporate expenses (129.0) (133.7) (116.2)Impairment charges (176.6) — —Amortization of intangibles (61.1) (64.7) (57.0)Stock compensation expense (40.0) (44.3) (35.6)Restructuring expenses (9.0) (12.0) (11.2)
Consolidated income from operations $ 348.1 $ 489.0 $ 404.4
Segment assets $ 4,501.5 $ 4,175.1 $ 4,390.0Cash and cash equivalents 432.8 326.1 367.7Investments in affiliates 380.2 400.0 409.0Deferred tax assets, other current and noncurrent assets 645.2 656.6 614.6Intangible assets, net 501.7 573.1 649.0Goodwill 1,298.3 1,495.5 1,541.4
Consolidated total assets $ 7,759.7 $ 7,626.4 $ 7,971.7
Property, plant and equipment and amortizable intangible assets by country as of December 31, 2019 and 2018 was as follows (in millions):
2019 2018United States $ 550.2 $ 593.6Germany 384.5 371.5Brazil 184.3 187.7Finland 142.5 130.0China 98.1 109.4Denmark 97.2 108.7Italy 109.7 115.1France 92.5 75.6Other 172.8 167.7
$ 1,831.8 $ 1,859.3
95

Table of ContentsAGCO CORPORATION
NOTES TO CONSOLIDATED FINANCIAL STATEMENTS - (Continued)
16. REVENUE
Contract Liabilities
Contract liabilities relate to the following: (1) unrecognized revenues where advance payment of consideration precedes the Company’s performancewith respect to extended warranty contracts and where the performance obligation is satisfied over time, (2) unrecognized revenues where advance paymentof consideration precedes the Company’s performance with respect to certain grain storage and protein production systems and where the performanceobligation is satisfied over time and (3) unrecognized revenues where advance payment consideration precedes the Company’s performance with respect totechnology services and where the performance obligation is satisfied over time.
Significant changes in the balance of contract liabilities for the years ended December 31, 2019 and 2018 were as follows (in millions):
Year Ended
December 31, 2019Year Ended
December 31, 2018(1)
Balance at beginning of period $ 76.8 $ 82.6Advance consideration received 147.7 124.9Revenue recognized during the period for extended warranty contracts (33.8) (29.0)Revenue recognized during the period related to installation of grain storage and protein production systems (87.4) (100.9)Foreign currency translation 0.7 (0.8)
Balance as of December 31, 2019 $ 104.0 $ 76.8____________________________________(1) The beginning of the period is from the date of adoption of ASU 2014-09 or January 1, 2018.
The contract liabilities are classified as either “Other current liabilities” and "Other noncurrent liabilities" or “Accrued expenses” in the Company’sConsolidated Balance Sheets.
Remaining Performance Obligations
The estimated revenues expected to be recognized in the future related to performance obligations that are unsatisfied (or partially unsatisfied) as ofDecember 31, 2019 are $37.7 million in 2020, $27.4 million in 2021, $16.2 million in 2022, $8.2 million in 2023 and $2.2 million thereafter, and relateprimarily to extended warranty contracts. The Company applied the practical expedient in ASU 2014-09 and has not disclosed information about remainingperformance obligations that have original expected durations of 12 months or less.
96

Table of ContentsAGCO CORPORATION
NOTES TO CONSOLIDATED FINANCIAL STATEMENTS - (Continued)
Disaggregated Revenue
Net sales for the year ended December 31, 2019 disaggregated by primary geographical markets and major products consisted of the following (inmillions):
North America South America Europe/Middle
East Asia/Pacific/Africa ConsolidatedPrimary geographical markets:
United States $ 1,799.7 $ — $ — $ — $ 1,799.7Canada 289.7 — — — 289.7Germany — — 1,194.3 — 1,194.3France — — 1,097.6 — 1,097.6United Kingdom and Ireland — — 561.9 — 561.9Finland and Scandinavia — — 772.8 — 772.8Other Europe — — 1,629.0 — 1,629.0South America — 789.7 — — 789.7Middle East and Algeria — — 73.2 — 73.2Africa — — — 116.2 116.2Asia — — — 344.7 344.7Australia and New Zealand — — — 257.7 257.7Mexico, Central America and Caribbean 102.4 12.5 — — 114.9
$ 2,191.8 $ 802.2 $ 5,328.8 $ 718.6 $ 9,041.4
Major products: Tractors $ 662.4 $ 447.7 $ 3,772.0 $ 300.6 $ 5,182.7Replacement parts 310.2 88.2 874.8 74.6 1,347.8Grain storage and protein production systems 547.9 79.5 172.8 234.6 $ 1,034.8Other machinery 671.3 186.8 509.2 108.8 1,476.1
$ 2,191.8 $ 802.2 $ 5,328.8 $ 718.6 $ 9,041.4
97

Table of ContentsAGCO CORPORATION
NOTES TO CONSOLIDATED FINANCIAL STATEMENTS - (Continued)
Net sales for the year ended December 31, 2018 disaggregated by primary geographical markets and major products consisted of the following (inmillions):
North America South America Europe/Middle
East(1) Asia/Pacific/Africa Consolidated(1)
Primary geographical markets: United States $ 1,723.6 $ — $ — $ — $ 1,723.6Canada 329.0 — — — 329.0Germany — — 1,213.6 — 1,213.6France — — 1,002.9 — 1,002.9United Kingdom and Ireland — — 614.4 — 614.4Finland and Scandinavia — — 826.5 — 826.5Other Europe — — 1,627.8 — 1,627.8South America — 943.1 — — 943.1Middle East and Algeria — — 100.0 — 100.0Africa — — — 135.5 135.5Asia — — — 414.5 414.5Australia and New Zealand — — — 277.8 277.8Mexico, Central America and Caribbean 127.5 15.9 — — 143.4
$ 2,180.1 $ 959.0 $ 5,385.1 $ 827.8 $ 9,352.0
Major products: Tractors $ 665.8 $ 599.1 $ 3,743.0 $ 353.2 $ 5,361.1Replacement parts 298.7 91.0 880.3 76.0 1,346.0Grain storage and protein production systems 570.3 70.1 187.6 285.5 1,113.5Other machinery 645.3 198.8 574.3 113.1 1,531.5
$ 2,180.1 $ 959.0 $ 5,385.1 $ 827.8 $ 9,352.0
___________________________________(1) Rounding may impact summation of amounts.
98

Table of ContentsAGCO CORPORATION
NOTES TO CONSOLIDATED FINANCIAL STATEMENTS - (Continued)
Net sales for the year ended December 31, 2017 disaggregated by primary geographical markets and major products consisted of the following (inmillions):
North
America(1) South America Europe/Middle
East Asia/Pacific/Africa(1) ConsolidatedPrimary geographical markets:
United States $ 1,445.7 $ — $ — $ — $ 1,445.7Canada 296.9 — — — 296.9Germany — — 997.4 — 997.4France — — 815.7 — 815.7United Kingdom and Ireland — — 512.6 — 512.6Finland and Scandinavia — — 721.3 — 721.3Other Europe — — 1,396.0 — 1,396.0South America — 1,039.2 — — 1,039.2Middle East and Algeria — — 171.3 — 171.3Africa — — — 138.1 138.1Asia — — — 366.4 366.4Australia and New Zealand — — — 247.4 247.4Mexico, Central America and Caribbean 134.2 24.3 — — 158.5
$ 1,876.7 $ 1,063.5 $ 4,614.3 $ 752.0 $ 8,306.5
Major products: Tractors $ 624.8 $ 673.5 $ 3,149.7 $ 337.2 $ 4,785.2Replacement parts 287.0 108.4 835.3 74.3 1,305.0Grain storage and protein production systems 537.2 72.9 182.9 256.6 1,049.6Other machinery 427.7 208.7 446.4 83.9 1,166.7
$ 1,876.7 $ 1,063.5 $ 4,614.3 $ 752.0 $ 8,306.5___________________________________(1) Rounding may impact summation of amounts.
99

Table of ContentsAGCO CORPORATION
NOTES TO CONSOLIDATED FINANCIAL STATEMENTS - (Continued)
17. LEASES
The Company leases certain land, buildings, machinery, equipment, vehicles and office and computer equipment under finance and operating leases.As previously discussed in Note 1, the Company adopted ASU 2016-02 effective January 1, 2019. Under the new standard, lessees are required to record anasset (ROU asset or finance lease asset) and a lease liability. The new standard continues to allow for two types of leases for income statement recognitionpurposes: operating leases and finance leases. Operating leases result in the recognition of a single lease expense on a straight-line basis over the lease term,similar to the treatment for operating leases under previous U.S. GAAP. Finance leases result in an accelerated expense also similar to previous U.S. GAAP.ASU 2016-02 also contains amended guidance regarding the identification of embedded leases in service and supply contracts, as well as the identification oflease and nonlease components of an arrangement. ROU assets represent the Company’s right to use an underlying asset for the lease term while leaseliabilities represent the Company’s obligation to make lease payments for the lease term. All leases greater than 12 months result in the recognition of anROU asset and liability at the lease commencement date based on the present value of the lease payments over the lease term. The present value of the leasepayments is calculated using the applicable weighted-average discount rate. The weighted-average discount rate is based on the discount rate implicit in thelease, or if the implicit rate is not readily determinable from the lease, then the Company estimates an applicable incremental borrowing rate. The incrementalborrowing rate is estimated using the currency denomination of the lease, the contractual lease term and the Company’s applicable borrowing rate.
The Company does not recognize a ROU asset or lease liability with respect to operating leases with an initial term of 12 months or less andrecognizes expense on such leases on a straight-line basis over the lease term. The Company accounts for lease components separately from nonleasecomponents other than for real estate and office equipment. The Company evaluated its supplier agreements for the existence of leases and determined theseleases comprised an insignificant portion of its supplier agreements. As such, these leases were not material to the Company’s Consolidated Balance Sheets.The Company has certain leases that include one or more options to renew, with renewal terms that can extend the lease term from six months to 10 years.The exercise of the lease renewal options is at the Company’s discretion and are included in the determination of the ROU asset and lease liability when theoption is reasonably certain of being exercised. The depreciable life of ROU assets and leasehold improvements are limited by the expected lease term. TheCompany has certain lease agreements that include variable rental payments that are adjusted periodically for inflation based on the index rate as defined bythe applicable government authority. Generally, the Company’s lease agreements do not contain any residual value guarantees or restrictive covenants.
Total lease assets and liabilities at December 31, 2019 were as follows (in millions):
Lease Assets Classification As of December 31, 2019Operating ROU assets Right-of-use lease assets $ 187.3Finance lease assets Property, plant and equipment, net(1) 19.1
Total leased assets $ 206.4
Lease Liabilities Classification As of December 31, 2019Current:
Operating Accrued expenses $ 42.3Finance Other current liabilities 4.5
Noncurrent: Operating Operating lease liabilities 148.6Finance Other noncurrent liabilities 12.0
Total leased liabilities $ 207.4____________________________________(1) Finance lease assets are recorded net of accumulated depreciation of $15.2 million as of December 31, 2019.
100

Table of ContentsAGCO CORPORATION
NOTES TO CONSOLIDATED FINANCIAL STATEMENTS - (Continued)
Total lease cost for 2019 is set forth below (in millions):
Classification Year Ended
December 31, 2019
Operating lease cost Selling, general and administrativeexpenses $ 55.0
Variable lease cost Selling, general and administrativeexpenses 0.6
Short-term lease cost Selling, general and administrativeexpenses 8.1
Finance lease cost: Amortization of leased assets Depreciation expense(1) 4.7Interest on leased liabilities Interest expense, net 0.7
Total lease cost $ 69.1____________________________________
(1) Depreciation expense was included in both cost of sales and selling, general and administrative expenses.
The total lease expense under noncancelable operating leases was approximately $72.1 million for the year ended December 31, 2018.
The aggregate future minimum lease payments under noncancelable operating and finance leases with remaining terms greater than one year as ofDecember 31, 2019 were as follows (in millions):
December 31, 2019 Operating Leases(1) Finance Leases2020 $ 48.3 $ 4.82021 40.8 2.72022 31.5 1.22023 24.1 0.92024 16.7 0.6Thereafter 61.6 8.7Total lease payments 223.0 18.9
Less: imputed interest(2) (32.1) (2.4)
Present value of leased liabilities $ 190.9 $ 16.5____________________________________
(1) Operating lease payments include $11.4 million related to options to extend leases that are reasonably certain of being exercised.(2) Calculated using the implicit interest rate for each lease.
101

Table of ContentsAGCO CORPORATION
NOTES TO CONSOLIDATED FINANCIAL STATEMENTS - (Continued)
The aggregate future minimum lease payments under noncancelable operating and finance leases with remaining terms greater than one year as ofDecember 31, 2018 were as follows (in millions):
December 31, 2018 Operating Leases(2) Finance Leases(2)
2019 $ 46.7 $ 4.52020 39.5 4.42021 32.6 2.22022 26.0 0.92023 21.7 0.6Thereafter 85.5 5.0Total lease payments 252.0 17.6
Less: imputed interest(1) — (2.1)
Present value of leased liabilities $ 252.0 $ 15.5____________________________________
(1) Imputed interest for operating leases as of December 31, 2018 is not applicable as the Company adopted ASC 842 on January 1, 2019.(2) As determined under ASC 840, “Leases.”
The following table summarizes the weighted-average remaining lease term and weighted-average discount rate:
As of December 31, 2019Weighted-average remaining lease term:
Operating leases 14 years Finance leases 7 years
Weighted-average discount rate: Operating leases 4.1%Finance leases 2.9%
The following table summarizes the supplemental cash flow information for 2019 (in millions):
Year Ended December 31, 2019Cash paid for amounts included in the measurement of lease liabilities:
Operating cash flows from operating leases $ 51.9Operating cash flows from finance leases 0.6Financing cash flows from finance leases 5.3
Leased assets obtained in exchange for lease obligations: Operating leases $ 34.8Finance leases 1.5
Item 9. Changes in and Disagreements with Accountants on Accounting and Financial Disclosure
None.
102

Table of Contents
Item 9A. Controls and Procedures
The Company’s management, including the Chief Executive Officer and the Chief Financial Officer, does not expect that the Company’s disclosurecontrols or the Company’s internal controls will prevent all errors and all fraud. However, our principal executive officer and principal financial officer haveconcluded the Company’s disclosure controls and procedures are effective at the reasonable assurance level. A control system, no matter how well conceivedand operated, can provide only reasonable, not absolute, assurance that the objectives of the control system are met. Further, the design of a control systemmust reflect the fact that there are resource constraints, and the benefits of controls must be considered relative to their costs. Because of the inherentlimitations in all control systems, no evaluation of controls can provide absolute assurance that all control issues and instances of fraud, if any, have beendetected. Because of the inherent limitations in a cost effective control system, misstatements due to error or fraud may occur and not be detected. We willconduct periodic evaluations of our internal controls to enhance, where necessary, our procedures and controls.
Evaluation of Disclosure Controls and Procedures
Our Chief Executive Officer and Chief Financial Officer, after evaluating the effectiveness of our disclosure controls and procedures (as defined inRule 13a-15(e) under the Securities Exchange Act of 1934, as amended) as of December 31, 2019, have concluded that, as of such date, our disclosurecontrols and procedures were effective at the reasonable assurance level. Disclosure controls and procedures include, without limitation, controls andprocedures designed to ensure that information required to be disclosed by an issuer in the reports that it files or submits under the Exchange Act isaccumulated and communicated to the issuer’s management, including its principal executive and principal financial officers, or persons performing similarfunctions, as appropriate to allow timely decisions regarding required disclosure.
Management’s Annual Report on Internal Control over Financial Reporting
Management of the Company is responsible for establishing and maintaining effective internal control over financial reporting as defined inRule 13a-15(f) under the Securities Exchange Act of 1934. The Company’s internal control over financial reporting is designed to provide reasonableassurance to the Company’s management and Board of Directors regarding the preparation and fair presentation of published financial statements for externalpurposes in accordance with generally accepted accounting principles. In assessing the effectiveness of the Company’s internal control over financialreporting, management used the criteria set forth by the Committee of Sponsoring Organizations of the Treadway Commission (COSO) in “InternalControl — Integrated Framework (2013).”
Management assessed the effectiveness of the Company’s internal control over financial reporting as of December 31, 2019. Based on thisassessment, management believes that, as of December 31, 2019, the Company’s internal control over financial reporting is effective based on the criteriareferred to above.
The effectiveness of the Company’s internal control over financial reporting as of December 31, 2019 has been audited by KPMG LLP, anindependent registered public accounting firm, which also audited the Company’s Consolidated Financial Statements as of and for the year endedDecember 31, 2019. KPMG LLP’s report on internal control over financial reporting is set forth below.
Changes in Internal Control over Financial Reporting
There were no changes in our internal control over financial reporting that occurred during our last fiscal quarter that have materially affected, or arereasonably likely to materially affect, our internal control over financial reporting. However, as a result of the Company’s processes to comply with theSarbanes-Oxley Act of 2002, enhancements to the Company’s internal control over financial reporting were implemented as management addressed andremediated deficiencies that had been identified.
103

Table of Contents
Report of Independent Registered Public Accounting Firm
To the Stockholders and Board of DirectorsAGCO Corporation:
Opinion on Internal Control Over Financial Reporting
We have audited AGCO Corporation and subsidiaries’ (the Company) internal control over financial reporting as of December 31, 2019, based oncriteria established in Internal Control — Integrated Framework (2013) issued by the Committee of Sponsoring Organizations of the Treadway Commission.In our opinion, the Company maintained, in all material respects, effective internal control over financial reporting as of December 31, 2019, based on criteriaestablished in Internal Control — Integrated Framework (2013) issued by the Committee of Sponsoring Organizations of the Treadway Commission.
We also have audited, in accordance with the standards of the Public Company Accounting Oversight Board (United States) (PCAOB), theconsolidated balance sheets of the Company as of December 31, 2019 and 2018, the related consolidated statements of operations, comprehensive income(loss), stockholders’ equity, and cash flows for each of the years in the three-year period ended December 31, 2019, and the related notes and financialstatement schedule II — Valuation and Qualifying Accounts (collectively, the consolidated financial statements), and our report dated February 28, 2020expressed an unqualified opinion on those consolidated financial statements.
Basis for Opinion
The Company’s management is responsible for maintaining effective internal control over financial reporting and for its assessment of theeffectiveness of internal control over financial reporting, included in the accompanying Management’s Annual Report on Internal Control over FinancialReporting. Our responsibility is to express an opinion on the Company’s internal control over financial reporting based on our audit. We are a publicaccounting firm registered with the PCAOB and are required to be independent with respect to the Company in accordance with the U.S. federal securitieslaws and the applicable rules and regulations of the Securities and Exchange Commission and the PCAOB.
We conducted our audit in accordance with the standards of the PCAOB. Those standards require that we plan and perform the audit to obtainreasonable assurance about whether effective internal control over financial reporting was maintained in all material respects. Our audit of internal controlover financial reporting included obtaining an understanding of internal control over financial reporting, assessing the risk that a material weakness exists, andtesting and evaluating the design and operating effectiveness of internal control based on the assessed risk. Our audit also included performing such otherprocedures as we considered necessary in the circumstances. We believe that our audit provides a reasonable basis for our opinion.
Definition and Limitations of Internal Control Over Financial Reporting
A company’s internal control over financial reporting is a process designed to provide reasonable assurance regarding the reliability of financialreporting and the preparation of financial statements for external purposes in accordance with generally accepted accounting principles. A company’s internalcontrol over financial reporting includes those policies and procedures that (1) pertain to the maintenance of records that, in reasonable detail, accurately andfairly reflect the transactions and dispositions of the assets of the company; (2) provide reasonable assurance that transactions are recorded as necessary topermit preparation of financial statements in accordance with generally accepted accounting principles, and that receipts and expenditures of the company arebeing made only in accordance with authorizations of management and directors of the company; and (3) provide reasonable assurance regarding preventionor timely detection of unauthorized acquisition, use, or disposition of the company’s assets that could have a material effect on the financial statements.
Because of its inherent limitations, internal control over financial reporting may not prevent or detect misstatements. Also, projections of anyevaluation of effectiveness to future periods are subject to the risk that controls may become inadequate because of changes in conditions, or that the degreeof compliance with the policies or procedures may deteriorate.
/s/ KPMG LLP
Atlanta, GeorgiaFebruary 28, 2020
104

Table of Contents
Item 9B. Other Information
None.
PART III
The information called for by Items 10, 11, 12, 13 and 14, if any, will be contained in our Proxy Statement for the 2020 Annual Meeting ofStockholders, which we intend to file in March 2020.
Item 10 Directors, Executive Officers and Corporate Governance
The information with respect to directors and committees required by this Item set forth in our Proxy Statement for the 2020 Annual Meeting ofStockholders in the sections entitled Proposal Number 1 “Election of Directors” and “Board of Directors and Corporate Governance” is incorporated hereinby reference. The information with respect to executive officers required by this Item set forth in our Proxy Statement for the 2020 Annual Meeting ofStockholders in the section entitled “Executive Compensation” is incorporated herein by reference.
See the information under the heading “Available Information” set forth in Part I of this Form 10-K. The code of conduct referenced therein appliesto our principal executive officer, principal financial officer, principal accounting officer and controller and the persons performing similar functions.
Item 11. Executive Compensation
The information with respect to executive compensation and its establishment required by this Item set forth in our Proxy Statement for the 2020Annual Meeting of Stockholders in the sections entitled “Board of Directors and Corporate Governance,” “2019 CEO Pay Ratio,” “Executive Compensation”and “Compensation Committee Report” is incorporated herein by reference.
Item 12. Security Ownership of Certain Beneficial Owners and Management and Related Stockholder Matters
(a) Securities Authorized for Issuance Under Equity Compensation Plans
AGCO maintains its Plan pursuant to which we may grant equity awards to eligible persons. For additional information, see Note 10, “StockIncentive Plan,” in the Notes to Consolidated Financial Statements included in this filing. The following table gives information about equity awards underour Plan.
(a) (b) (c)
Plan Category
Number of Securitiesto be Issued
upon Exerciseof Outstanding
Awards Under the Plans
Weighted-AverageExercise Priceof OutstandingAwards Under
the Plans
Number of SecuritiesRemaining Available for Future
Issuance Under EquityCompensation Plans
(Excluding Securities Reflectedin Column (a)
Equity compensation plans approved by securityholders 2,088,386 $ 63.29 3,581,614
Equity compensation plans not approved by securityholders — — —
Total 2,088,386 $ 63.29 3,581,614
(b) Security Ownership of Certain Beneficial Owners and Management
The information required by this Item set forth in our Proxy Statement for the 2020 Annual Meeting of Stockholders in the section entitled “PrincipalHolders of Common Stock” is incorporated herein by reference.
Item 13. Certain Relationships and Related Party Transactions, and Director Independence
The information required by this Item set forth in our Proxy Statement for the 2020 Annual Meeting of Stockholders in the section entitled “CertainRelationships and Related Party Transactions” is incorporated herein by reference.
105

Table of Contents
Item 14. Principal Accounting Fees and Services
The information required by this Item set forth in our 2020 Proxy Statement for the Annual Meeting of Stockholders in the sections entitled “AuditCommittee Report” and “Board of Directors and Corporate Governance” is incorporated herein by reference.
PART IV
Item 15. Exhibits and Financial Statement Schedules
(a) The following documents are filed as part of this Form 10-K:
(1) The Consolidated Financial Statements, Notes to Consolidated Financial Statements, Report of Independent Registered Public Accounting Firm forAGCO Corporation and its subsidiaries are presented under Item 8 of this Form 10-K.
(2) Financial Statement Schedules:
The following Consolidated Financial Statement Schedule of AGCO Corporation and its subsidiaries is included herein and follows this report.
Schedule DescriptionSchedule II Valuation and Qualifying Accounts
Schedules other than that listed above have been omitted because the required information is contained in Notes to the Consolidated FinancialStatements or because such schedules are not required or are not applicable.
(3) The following exhibits are filed or incorporated by reference as part of this report. Each management contract or compensation plan required to befiled as an exhibit is identified by an asterisk (*). The exhibits below may not include all instruments defining the rights of holders of long-term debt wherethe debt does not exceed 10% of the Company’s total assets. The Company agrees to furnish copies of those instruments to the Commission upon request.
ExhibitNumber Description of Exhibit
The Filings Referenced forIncorporation by Reference are
AGCO Corporation3.1 Certificate of Incorporation June 30, 2002, Form 10-Q, Exhibit 3.13.2 Amended and Restated By-Laws April 26, 2019, Form 8-K, Exhibit 3.14.1 Description of Securities Filed herewith10.1 2006 Long-Term Incentive Plan* September 30, 2017, Form 10-Q, Exhibit 10.510.2 2006 Form of Non-Qualified Stock Option Award Agreement* March 31, 2006, Form 10-Q, Exhibit 10.210.3 2006 Form of Incentive Stock Option Award Agreement* March 31, 2006, Form 10-Q, Exhibit 10.310.4 2006 Form of Stock Appreciation Rights Agreement* March 31, 2006, Form 10-Q, Exhibit 10.410.5 2019 Form of Stock Appreciation Rights Agreement* January 22, 2019, Form 8-K, Exhibit 10.210.6 2016 Form of Restricted Stock Units Agreement* January 27, 2016, Form 8-K, Exhibit 10.110.7 2018 Form of Restricted Stock Units Agreement* June 30, 2018, Form 10-Q, Exhibit 10.110.8 2019 Form of Restricted Stock Units Agreement* January 22, 2019, Form 8-K, Exhibit 10.110.9 2006 Form of Performance Share Award* March 31, 2006, Form 10-Q, Exhibit 10.6
10.10 2019 Form of Performance Share Agreement* January 22, 2019, Form 8-K, Exhibit 10.310.11 Amended and Restated Management Incentive Program* June 30, 2019, Form 10-Q, Exhibit 10.310.12 Amended and Restated Executive Nonqualified Pension Plan* June 30, 2019, Form 10-Q, Exhibit 10.210.13 Executive Nonqualified Defined Contribution Plan* December 31, 2015, Form 10-K, Exhibit 10.910.14 Employment and Severance Agreement with Martin Richenhagen* December 31, 2009, Form 10-K, Exhibit 10.12
106

Table of Contents
ExhibitNumber Description of Exhibit
The Filings Referenced forIncorporation by Reference are
AGCO Corporation10.15 Employment and Severance Agreement with Andrew H. Beck* March 31, 2010, Form 10-Q, Exhibit 10.210.16 Employment and Severance Agreement with Eric P. Hansotia* December 31, 2018, Form 10-K, Exhibit 10.1610.17 Employment and Severance Agreement with Robert B. Crain* December 31, 2017, Form 10-K, Exhibit 10.1310.18 Employment and Severance Agreement with Rob Smith* December 31, 2015, Form 10-K, Exhibit 10.1310.19 Employment and Severance Agreement with Hans-Bernd Veltmaat* December 31, 2009, Form 10-K, Exhibit 10.1710.20 Debt Agreement dated December 18, 2014 December 31, 2014, Form 10-K, Exhibit 10.1510.21 Credit Agreement dated as of October 17, 2018 September 30, 2018, Form 10-Q, Exhibit 10.110.22
Letter Agreement, dated November 5, 2015, between AGCOInternational GmbH and TAFE International LLC, Turkey and Tractorsand Farm Equipment Limited
September 30, 2015, Form 10-Q, Exhibit 10.1
10.23
Amended and Restated Letter Agreement, dated April 24, 2019,between AGCO Corporation and Tractors and Farm Equipment Limited
March 31, 2019, Form 10-Q, Exhibit 10.1
10.24
Farm and Machinery Distributor Agreement, dated January 1, 2012,between AGCO International GmbH and Tractors and Farm EquipmentLimited
September 4, 2014, Form 8-K, Exhibit 10.2
10.25
Letter Agreement, dated August 3, 2007, between AGCO Corporationand Tractors and Farm Equipment Limited
September 4, 2014, Form 8-K, Exhibit 10.3
10.26
Letter Agreement for Far East Markets, dated July 24, 2017, betweenAGCO International GmbH and Tractors and Farm Equipment Limited
July 27, 2017, Form 8-K, Exhibit 10.1
10.27
Letter Agreement for Mexico, dated July 24, 2017, between AGCOInternational GmbH and Tractors and Farm Equipment Limited
July 27, 2017, Form 8-K, Exhibit 10.2
10.28
Letter Agreement for Australia/New Zealand, dated July 24, 2017,between AGCO International GmbH and Tractors and Farm EquipmentLimited
July 27, 2017, Form 8-K, Exhibit 10.3
10.29
Amendment to the Letter Agreement for Africa, dated July 24, 2017,between AGCO International GmbH and Tractors and Farm EquipmentLimited
July 27, 2017, Form 8-K, Exhibit 10.4
10.30 Current Director Compensation* Filed herewith21.1 Subsidiaries of the Registrant Filed herewith23.1 Consent of KPMG LLP Filed herewith24.1 Powers of Attorney Filed herewith31.1 Certification of Martin Richenhagen Filed herewith31.2 Certification of Andrew H. Beck Filed herewith32.1 Certification of Martin Richenhagen and Andrew H. Beck Filed herewith
107

Table of Contents
ExhibitNumber Description of Exhibit
The Filings Referenced forIncorporation by Reference are
AGCO Corporation101
The following audited financial information from this Annual Reporton Form 10-K for the year ended December 31, 2019, are formatted inInline XBRL:(i) Consolidated Statements of Operations,(ii) Consolidated Statements of Comprehensive Income,(iii) Consolidated Balance Sheets,(iv) Consolidated Statements of Stockholders' Equity,(v) Consolidated Statements of Cash Flows and(vi) Notes to Consolidated Financial Statements.
Filed herewith
104
Cover Page Interactive Data File - the cover page from this AnnualReport on Form 10-K for the year ended December 31, 2019 isformatted in Inline XBRL
Filed herewith
Item 16. Form 10-K Summary
None.
108

Table of Contents
SIGNATURES
Pursuant to the requirements of Section 13 or 15(d) of the Securities Exchange Act of 1934, the registrant has duly caused this report to be signed on itsbehalf by the undersigned, thereunto duly authorized.
AGCO Corporation
By: /s/ MARTIN RICHENHAGEN Martin Richenhagen
Chairman of the Board, President
and Chief Executive OfficerDated: February 28, 2020
Pursuant to the requirements of the Securities Exchange Act of 1934, this report has been signed below by the following persons on behalf of theregistrant in the capacities and on the date indicated.
Signature Title Date
/s/ MARTIN RICHENHAGEN Chairman of the Board, President and Chief
Executive Officer February 28, 2020
Martin Richenhagen
/s/ ANDREW H. BECK Senior Vice President and Chief Financial Officer
(Principal Financial Officer) February 28, 2020
Andrew H. Beck
/s/ LARA T. LONG Vice President, Chief Accounting Officer
(Principal Accounting Officer) February 28, 2020
Lara T. Long /s/ ROY V. ARMES * Director February 28, 2020 Roy V. Armes /s/ MICHAEL C. ARNOLD * Director February 28, 2020 Michael C. Arnold /s/ SONDRA L. BARBOUR * Director February 28, 2020 Sondra L. Barbour /s/ P. GEORGE BENSON * Director February 28, 2020 P. George Benson /s/ SUZANNE P. CLARK * Director February 28, 2020 Suzanne P. Clark /s/ WOLFGANG DEML * Director February 28, 2020 Wolfgang Deml /s/ GEORGE E. MINNICH * Director February 28, 2020 George E. Minnich /s/ GERALD L. SHAHEEN * Director February 28, 2020 Gerald L. Shaheen /s/ MALLIKA SRINIVASAN * Director February 28, 2020 Mallika Srinivasan /s/ HENDRIKUS VISSER * Director February 28, 2020 Hendrikus Visser *By: /s/ ANDREW H. BECK February 28, 2020
Andrew H. Beck Attorney-in-Fact
109

Table of Contents
ANNUAL REPORT ON FORM 10-KITEM 15 (A)(2)
FINANCIAL STATEMENT SCHEDULEYEAR ENDED DECEMBER 31, 2019
II-1

Table of Contents
SCHEDULE II
AGCO CORPORATION AND SUBSIDIARIES
SCHEDULE II — VALUATION AND QUALIFYING ACCOUNTS(in millions)
Additions
Description
Balance atBeginningof Period
AcquiredBusinesses
Charged toCosts andExpenses Deductions
ForeignCurrency
Translation Balance at
End of Period
Year ended December 31, 2019
Allowances for doubtful accounts $ 31.7 $ — $ 5.8 $ (8.3) $ (0.4) $ 28.8
Year ended December 31, 2018
Allowances for doubtful accounts $ 38.7 $ — $ 6.4 $ (11.4) $ (2.0) $ 31.7
Year ended December 31, 2017
Allowances for doubtful accounts $ 33.7 $ 2.2 $ 4.6 $ (3.8) $ 2.0 $ 38.7
Additions
Description
Balance atBeginningof Period
Charged toCosts andExpenses
Reversal ofAccrual Deductions
ForeignCurrency
Translation Balance at
End of Period
Year ended December 31, 2019 Accruals of severance, relocation and otherintegration costs $ 7.1 $ 6.1 $ (0.7) $ (7.3) $ (0.4) $ 4.8
Year ended December 31, 2018 Accruals of severance, relocation and otherintegration costs $ 10.9 $ 13.8 $ (2.1) $ (14.4) $ (1.1) $ 7.1
Year ended December 31, 2017 Accruals of severance, relocation and otherintegration costs $ 15.3 $ 12.4 $ (1.4) $ (16.8) $ 1.4 $ 10.9
Additions
Description
Balance atBeginningof Period
AcquiredBusinesses
Charged(Credited) to
Costs andExpenses(1) Deductions
ForeignCurrency
Translation Balance at
End of Period
Year ended December 31, 2019
Deferred tax valuation allowance $ 83.9 $ — $ 87.1 $ — $ (1.9) $ 169.1
Year ended December 31, 2018
Deferred tax valuation allowance $ 81.9 $ — $ 6.3 $ — $ (4.3) $ 83.9
Year ended December 31, 2017
Deferred tax valuation allowance $ 116.0 $ — $ (38.4) $ — $ 4.3 $ 81.9
(1) Amounts (credited) charged through other comprehensive income during the years ended December 31, 2019 and 2018 were $(2.5) million and $18.3 million, respectively.
II-2

Table of Contents
II-3

Exhibit 4.1
DESCRIPTION OF SECURITIES Ex
REGISTERED PURSUANT TO SECTION 12 OF
THE SECURITIES EXCHANGE ACT OF 1934, AS AMENDED
The following summary describes the securities of AGCO Corporation (“AGCO”) registered pursuant to Section 12 of the Securities Exchange Act of 1934,as amended.
DESCRIPTION OF COMMON STOCK
The following description of our common stock is based on our Amended and Restated Certificate of Incorporation (“Certificate of Incorporation”) andAmended and Restated By-Laws (“By-Laws”), and applicable provisions of law. We have summarized certain portions of our Certificate of Incorporation andBy-Laws below. The summary is not complete and is subject to, and is qualified in its entirety by, our Certificate of Incorporation and our By-laws, each ofwhich is filed as an exhibit to our Annual Report on Form 10-K, and the applicable provisions of the Delaware General Corporation Law (“DGCL”). Youshould read our Certificate of Incorporation, By-Laws, and the applicable provision of the DGCL for additional information. For purposes of this description,references to “AGCO,” “we,” “our,” and “us” refer to AGCO and its subsidiaries.
Authorized Capitalization
Our authorized capitalization consists of 150,000,000 shares of common stock, having a par value of $.01 per share, and 1,000,000 shares of preferred stock,having a par value of $.01 per share.
As of February 24, 2020, there were 75,465,353 shares of common stock issued and outstanding and no shares of preferred stock issued and outstanding.
Common Stock
Voting Rights. Each share of common stock entitles its holder to one vote per share. Cumulative voting is not permitted. Our By-Laws provide for a majorityvote standard for uncontested elections of directors, and a plurality of votes standard for contested elections of directors. For other matters, our By-Lawsprovide when a quorum is present at any meeting, a majority of the votes cast, excluding abstentions and broker (and similar) non-votes, shall decide anyquestion brought before such meeting unless the question is one upon which a different vote is required by express provision of the DGCL, federal law, theCertificate of Incorporation or the By-Laws, or, to the extent permitted by DGCL, our board of directors (our “Board”) has expressly provided that some othervote shall be required, in which case such express provisions shall govern.
Dividend Rights. Subject to any preferential dividend rights of outstanding preferred stock, holders of common stock are entitled to receive ratably suchdividends, if any, as may declared by our Board out of funds legally available therefor.
Liquidation Rights. In the event of a liquidations, dissolution of winding up of AGCO, the holders of common stock are entitled to receive ratably the netassets of AGCO available for distribution after the payment of all debts and other liabilities and subject to the prior rights of any outstanding preferred stock.
Fully Paid and Nonassessable. The outstanding shares of our common stock are fully paid and nonassessable.
Other Matters. Holders of our common stock have no preemptive, subscription, redemption or conversion rights and there is no sinking fund provisionsapplicable to our common stock.
Listing and Transfer Agent. Our common stock is listed for trading on the New York Stock Exchange under the symbol “AGCO.” The transfer agent andregistrar for our common stock is Computershare Trust Company, N.A.
Anti-Takeover Provisions. Certain provisions in our Certificate of Incorporation, By-Laws and the DGCL may have the effect of delaying, deferring ordiscouraging another party from acquiring us. These provisions, which are summarized below, are expected to discourage coercive takeover practices andinadequate takeover bids. These provisions are also designed to encourage persons seeking to acquire control of us to first negotiate with our Board.

Advance Notice of Stockholder Proposals or Nominations. Company stockholders wishing to nominate a director or propose other action at anannual meeting must give advance written notice of such nomination or proposal not less than 60 days nor more than 90 days prior to the anniversary date ofthe immediately preceding annual meeting of stockholders; provided, however, that in the event that the annual meeting is called for date that is not within 30days before or after such anniversary date, notice by the stockholder in order to be timely must be so received not later than the close of business on the 10th
day following the day on which such notice of the date of the annual meeting was mailed or such public disclosure of the date of the annual meeting wasmade, whichever first occurs.
Delaware General Corporation Law. As a Delaware corporation, we are subject to certain anti-takeover provisions of the DGCL. Subject to certainexceptions, Section 203 of the DGCL prevents a publicly held Delaware corporation from engaging in a “business combination” with any “interestedstockholder” for three years following the date that the person became an interested stockholder, unless the interested stockholder attained such status with theapproval of our Board or unless the business combination is approved in a prescribed manner. A “business combination” includes, among other things, amerger or consolidation involving us and the “interested stockholder” and the sale of more than 10% of our assets. In general, an “interested stockholder” isany entity or person beneficially owning 15% or more of our outstanding voting stock and any entity or person affiliated with or controlling or controlled bysuch entity or person. Section 203 of the DGCL makes it more difficult for an interested stockholder to effect various business combinations with acorporation for a three-year period. This statute could prohibit or delay mergers or other takeover or change in control attempts not approved in advance byour Board and as a result could discourage attempts to acquire us, which could depress the market price of our common stock.
No Action in Writing. Any action required or permitted to be taken by the stockholders of AGCO must be effect at an annual or special meeting ofstockholders of AGCO and may not be effected by any consent in writing by such stockholders.
Preferred Stock. Our Certificate of Incorporation authorizes our Board to issue preferred stock in one or more classes or series and to fix for eachsuch class or series such voting powers, full or limited, or no voting powers, and such distinctive designations, preferences and relative, participating, optionalor other special rights, and such qualifications, limitations or restrictions thereof, as shall be stated and expressed in the resolution or resolutions adopted bythe Board providing for the issuance of such class or series and as may be permitted by the DGCL, including, without limitation, the authority to provide thatany such class or series may be (i) subject to redemption at any such time or times and at such price or prices; (ii) entitled to receive dividends (which may becumulative or non-cumulative) at such rates, on such conditions, and at such time, and payable in preference to, or in such relation to, the dividends payableon any other class or classes or any other series; (iii) entitled to such rights upon the dissolution of, or upon any distribution of the assets of, the corporation;or (iv) convertible into, or exchangeable for, shares of any other class or classes of stock, or of any other series of the same or any other class or classes ofstock, of AGCO at such price or prices or at such rates of exchange and with such adjustments, all as may be stated in such resolution or resolutions. Ourauthorized preferred stock consists of 1,000,000 shares of preferred stock, par value $.01 per share, with 300,000 shares designed as a series of juniorpreferred stock, par value $.01 per share. Issuance of preferred stock in the future could discourage bids for the common stock at a premium as well as createa depressive effect on the market price of the common stock.
Special Meetings. A special meeting of stockholders may be called at any time only by order of our Board or the executive committee.

Exhibit 10.30
A G C O C O R P O R A T I O N
DIRECTOR COMPENSATIONfor
NON - EMPLOYEE DIRECTORS(as of January 1, 2019)
Retainers (1) USD
Annual Lead Director Retainer (paid only to Lead Director): 30,000
Annual Director Base Retainer (applies to all Directors): 120,000
Annual Committee Chairperson Retainer:(except Audit Committee and Compensation Committee Chair)
15,000
Annual Audit Committee Chairperson Retainer: 25,000
Annual Compensation Committee Chairperson Retainer: 20,000
Additional Annual Retainer for Board Members serving on three committees: 6,000
Additional Compensation
Annual AGCO Stock Grant Award (2) 150,000
In addition, the Company will reimburse directors for the reasonable out-of-pocket expense incurred in the attendanceof the meeting.
Page 1 of 2
A G C O C O R P O R A T I O N
DIRECTOR COMPENSATIONfor
NON - EMPLOYEE DIRECTORS(as of January 1, 2019)
Notes:
1) Payments of annual retainers are made in accordance with the following provisions:
I) Annual Retainers are paid quarterly in four installments (for ease of calculation purposes quarters aredivided into 90 days with a 360 day year).
II) Annual Retainers accrue as of the first day of each calendar quarter based on the Board andCommittee Membership Roster in effect on that date.
III) Annual Retainers are paid in advance during the first month of the given calendar quarter (e.g.,January for the first quarter).
IV) Changes to Board and Committee Memberships (including Chairpersons) will be reviewed andadjustments made to current quarter’s retainer amounts (up or down).
V) Any changes in the Retainer amounts due for the current quarter will be reflected in the ensuingquarter’s retainer payment.
2) Terms applicable to the Stock Grant Award are defined in the Plan Document. The stock grant equivalent to USD150,000 is based on closing price on the day of the Annual Shareholders’ meeting.
Page 2 of 2

AGCO CORP /DE Exhibit 21.1
12/31/2019
Wholly Owned Subsidiaries of AGCO CorporationCountry of
Jurisdiction
AGCO Argentina SA Argentina
Indamo SA Argentina
AGCO Australia Ltd Australia
Sparex Australia PTY Ltd Australia
Western District Agricentre Pty Limited Australia
AGCO Austria GmbH Austria
Cimbria Heid GmbH Austria
Sparex Maschinensubehor Handelsgesellschaft m.b.H Austria
Sparex Belgium BVBA Belgium
AGCO do Brasil Soluções Agrícolas Ltda Brazil
GSI Brasil Industria e Comercio de Equipamentos Agropecuarios Ltd Brazil
Tecnoagro Maquinas Agrícolas Ltda Brazil
AGCO Canada Ltd Canada
GSI Electronique Inc Canada
Sparex Canada Ltd Canada
Cimbria HMD SRO Czech Republic
AGCO (Changzhou) Agricultural Machinery Co. Ltd China
AGCO (Jining) Agricultural Machinery Co., Ltd China
AGCO GSI (Changzhou) Agriculture Equipment Co., Ltd China
AGCO (China) Investment Co., Ltd China
The GSI Group (Shanghai) Co. Ltd China
AGCO A/S Denmark
AGCO Danmark A/S Denmark
A/S Cimbria Denmark
Cimbria Unigrain A/S Denmark
Cimbria Manufacturing A/S Denmark
Sparex Limited ApS Denmark
XBA BidCo ApS Denmark
XBA FinCo ApS Denmark
XBA MidCo ApS Denmark
AGCO Power Oy Finland
AGCO Suomi Oy Finland
Valtra OY AB Finland
AGCO Distribution SAS France
AGCO France SAS France
AGCO SAS France
C-Lines International SAS France
Sparex S.A.R.L. France
AGCO Deutschland GmbH Germany
AGCO GmbH Germany
AGCO Hohenmölsen GmbH Germany
Farmer Automatic GmbH & Co. KG Germany
Farmer Automatic Management GmbH Germany
Fendt GmbH Germany
Fendt Immobilien GmbH Germany

Sparex Handels-Und Vertriebs GmbH Germany
Unterstutzungskasse der Fella-Werke Gesellschaft mit beschankter Haftung Germany
Valtra Deutschland GmbH Germany
AGCO Holdings (Hong Kong) Ltd Hong Kong
C-Lines Asia Limited Hong Kong
AGCO Hungary Kft Hungary
GSI Hungary Kft Hungary
AGCO Trading (India) Private Ltd India
AGCO Ireland Limited Ireland
Sparex (Tractor Accessories) Ltd Ireland
AGCO Italia SpA Italy
Cimbria Heid Italia SRL Italy
Cimbria SRL Italy
Farmec Srl Italy
Laverda AGCO SPA Italy
Tecno Poultry Equipment S.P.A. Italy
Cimbria East Africa Limited Kenya
AGCO GSI Asia Sdn Bhd Malaysia
AGCO GSI (Malaysia) Sdn. Bhd. Malaysia
Cimbria Far East SDN. BHD Malaysia
AGCO Sales & Services Sdn Bhd Malaysia
MY C-Lines SDN BHD Malaysia
AGCO Mexico S de RL de CV Mexico
GSI Cumberland De Mexico, S. De RL De CV Mexico
GSI Cumberland De Mexico Servicios, SA De CV Mexico
Impulsora Inqro S.A. de C.V. Mexico
Prestadora de Servicios Mexicana del Bajio, SA de CV Mexico
Sparex Mexicana S.A. de CV Mexico
Agri Park Distribution Co., Ltd Morocco
Ag-Chem Europe Fertilizer Equipment BV Netherlands
Ag-Chem Europe Industrial Equipment BV Netherlands
AGCO Holding BV Netherlands
AGCO International Holdings BV Netherlands
AGCO Netherlands BV Netherlands
Forage Company BV Netherlands
Sparex Limited Vestiging Holland BV Netherlands
Valtra International BV Netherlands
AGCO New Zealand Limited New Zealand
Sparex New Zealand Ltd New Zealand
Eikmaskin AS Norway
AGCO Sp Z.o.o Poland
Sparex Polska Sp. Z.o.o. Poland
Sparex Portugal Importacao e Comercio de Pecas Lda Portugal
Valtractor Comercio de Tractores e Maquinas Agricolas SA Portugal
AGCO LLC Russia
Cimbria LLC Russia
AGCO Holdings (Singapore) Pte. Ltd Singapore
AGCO Holdings South Africa South Africa
AGCO South Africa Pty Ltd South Africa
C-Lines South Africa (Proprietary) Limited South Africa
Sparex (Proprietary) Ltd South Africa

AGCO Iberia SA Spain
Sparex Agrirepuestos SL Spain
AGCO AB Sweden
AGCO International GmbH Switzerland
AGCO Tarim Makineleri Ticaret Ltd Sirketi Turkey
Sparex Tarim Parca Sanayi Ve Ticaret Limited Sirketi Turkey
AGCO Funding Company United Kingdom
AGCO International Ltd United Kingdom
AGCO Ltd United Kingdom
AGCO Manufacturing Ltd United Kingdom
AGCO Pension Trust Ltd United Kingdom
AGCO Services Ltd United Kingdom
Cimbria Holdings Limited United Kingdom
Cimbria (UK) Limited United Kingdom
Massey Ferguson Staff Pension Trust Ltd United Kingdom
Massey Ferguson Works Pension Trust Ltd United Kingdom
Sparex Holdings Ltd United Kingdom
Sparex International Ltd United Kingdom
Sparex Ltd United Kingdom
Spenco Engineering Company Ltd United Kingdom
Assumption Leasing Company, Inc. United States
Export Market Services LLC United States
Intersystems Holdings, Inc. United States
Intersystems International LLC United States
Massey Ferguson Corp. United States
Precision Planting LLC United States
Sparex, Inc. United States
The GSI Group, LLC United States
AGCO Zambia Ltd Zambia
50% or Greater Joint Venture Interests of the Registrant
Deutz AGCO Motores SA ArgentinaCP GSI Machinery Co Ltd ChinaGroupement International De Mecanique Agricole SA FranceAGCO-RM (Distribution) Holding BV NetherlandsAGCO Machinery LLC RussiaAGCO - Amity JV, LLC United States
Intelligent Agricultural Solutions, LLC United States
Less Than 50% Joint Venture Interests of the Registrant
Algerian Tractor Company Spa AlgeriaAGCO Capital Argentina SA ArgentinaAGCO Finance PTY Ltd AustraliaAGCO Finance GmbH, Landmaschinen Leasing Austria
AGCO Finance NV Belgium
Banco De Lage Landen Brasil S.A Brazil
De Lage Landen Participacoes Ltda (dba Agricredit do Brasil Ltda) Brazil
Massey Ferguson Administradora de Consorcios Ltda Brazil
AGCO Finance Canada Ltd Canada
AGCO Finance SAS FranceAGCO Finance GmbH GermanyAAG Agriculture Application Group GmbH & Co KG Germany

AAG Agriculture Application Verwaltungs GmbH Germany
DKE-Data GmbH & Co. KG Germany
DKE-Data Verwaltungs GmbH Germany
Tractors and Farm Equipment Ltd India
AGCO Finance DAC Ireland
Libyan Tractor and Agricultural Commodities Company Libya
Compagnie Maghebine de Materials Agricoles et Industriels SA Morocco
AGCO Finance B.V Netherlands
AGCO RM (Manufacturing) Holding BV Netherlands
AGCO Finance Ltd New Zealand
AGCO Finance Sp.z.o.o Poland
AGCO Finance LLC Russia
GolAZ OJSC Russia
AGCO Finance AG Switzerland
AGCO Finance Ltd United Kingdom
AGCO Finance LLC United States

Exhibit 23.1
Consent of Independent Registered Public Accounting Firm
The Board of DirectorsAGCO Corporation:
We consent to the incorporation by reference in the registration statements (No. 333‑178399 and No. 333-142711) on Form S-8 of AGCO Corporation andsubsidiaries (the “Company”) of our reports dated February 28, 2020, with respect to the consolidated balance sheets of the Company as of December 31,2019 and 2018, and the related consolidated statements of operations, comprehensive income (loss), stockholders’ equity, and cash flows for each of the yearsin the three-year period ended December 31, 2019, and the related notes and financial statement schedule (collectively, the consolidated financial statements),and the effectiveness of internal control over financial reporting as of December 31, 2019, which reports appear in the December 31, 2019 annual report onForm 10‑K of the Company.
Our report on the consolidated financial statements refers to a change in the method of accounting for revenue recognition in 2018 due to the adoption ofAccounting Standards Codification 606, Revenue from Contracts with Customers, and a change in the method of accounting for leases in 2019 due to theadoption of Accounting Standards Codification 842, Leases.
/s/ KPMG LLP
Atlanta, GeorgiaFebruary 28, 2020

Exhibit 24.1
Power of Attorney
Know all men and women by these presents, that each person whose signature appears below, hereby constitutes and appoints Andrew H. Beck,Roger N. Batkin and Lara T. Long his/her true and lawful attorneys-in-fact and agents, with full power of substitution and resubstitution, for him/her and inhis/her name, place and stead, in any and all capacities, to sign the annual report on Form 10-K of AGCO Corporation for the fiscal year ended December 31,2019 and any or all amendments or supplements thereto, and to file the same with all exhibits thereto and other documents in connection therewith, with theSecurities and Exchange Commission, granting unto said attorneys-in-fact and agents full power and authority to do and perform each and every act and thingnecessary or appropriate to be done with respect to the Form 10-K or any amendments or supplements thereto in and about the premises, as fully to all intentsand purposes as he might or could do in person, hereby ratifying and confirming all that said attorneys-in-fact and agents or his substitute or substitutes, maylawfully do or cause to be done by virtue hereof.
Signature Date /s/ Martin Richenhagen February 28, 2020Martin Richenhagen /s/ Roy V. Armes February 28, 2020Roy V. Armes /s/ Michael C. Arnold February 28, 2020Michael C. Arnold /s/ Sondra L. Barbour February 28, 2020Sondra L. Barbour /s/ P. George Benson February 28, 2020P. George Benson /s/ Suzanne P. Clark February 28, 2020Suzanne P. Clark /s/ Wolfgang Deml February 28, 2020Wolfgang Deml /s/ George E. Minnich February 28, 2020George E. Minnich /s/ Gerald L. Shaheen February 28, 2020Gerald L. Shaheen /s/ Mallika Srinivasan February 28, 2020Mallika Srinivasan /s/ Hendrikus Visser February 28, 2020Hendrikus Visser
Exhibit 31.1
Certification Pursuant to § 302 of the Sarbanes-Oxley Act of 2002
I, Martin Richenhagen, certify that:
1. I have reviewed this Annual Report on Form 10-K of AGCO Corporation;
2. Based on my knowledge, this report does not contain any untrue statement of a material fact or omit to state a material fact necessary tomake the statements made, in light of the circumstances under which such statements were made, not misleading with respect to the periodcovered by this report;
3. Based on my knowledge, the financial statements, and other financial information included in this report, fairly present in all materialrespects the financial condition, results of operations and cash flows of the registrant as of, and for, the periods presented in this report;
4. The registrant’s other certifying officer(s) and I are responsible for establishing and maintaining disclosure controls and procedures (asdefined in Exchange Act Rules 13a-15(e) and 15d-15(e)) and internal control over financial reporting (as defined in Exchange ActRules 13a-15(f) and 15d-15(f)) for the registrant and have:
(a) Designed such disclosure controls and procedures, or caused such disclosure controls and procedures to be designed under oursupervision, to ensure that material information relating to the registrant, including its consolidated subsidiaries, is made known tous by others within those entities, particularly during the period in which this report is being prepared;
(b) Designed such internal control over financial reporting, or caused such internal control over financial reporting to be designedunder our supervision, to provide reasonable assurance regarding the reliability of financial reporting and the preparation offinancial statements for external purposes in accordance with generally accepted accounting principles;
(c) Evaluated the effectiveness of the registrant’s disclosure controls and procedures and presented in this report our conclusions aboutthe effectiveness of the disclosure controls and procedures, as of the end of the period covered by this report based on suchevaluation; and
(d) Disclosed in this report any change in the registrant’s internal control over financial reporting that occurred during the registrant’smost recent fiscal quarter (the registrant’s fourth fiscal quarter in the case of an annual report) that materially affected, or isreasonably likely to materially affect, the registrant’s internal control over financial reporting; and
5. The registrant’s other certifying officer(s) and I have disclosed, based on our most recent evaluation of internal control over financialreporting, to the registrant’s auditors and the audit committee of registrant’s board of directors (or persons performing the equivalentfunctions):
(a) All significant deficiencies and material weakness in the design or operation of internal control over financial reporting which arereasonably likely to adversely affect the registrant’s ability to record, process, summarize and report financial information; and
(b) Any fraud, whether or not material, that involves management or other employees who have a significant role in the registrant’sinternal control over financial reporting.
Dated: February 28, 2020
/s/ Martin Richenhagen Martin Richenhagen Chairman of the Board, President and Chief Executive Officer

Exhibit 31.2
Certification Pursuant to § 302 of the Sarbanes-Oxley Act of 2002
I, Andrew H. Beck, certify that:
1. I have reviewed this Annual Report on Form 10-K of AGCO Corporation;
2. Based on my knowledge, this report does not contain any untrue statement of a material fact or omit to state a material fact necessary tomake the statements made, in light of the circumstances under which such statements were made, not misleading with respect to the periodcovered by this report;
3. Based on my knowledge, the financial statements, and other financial information included in this report, fairly present in all materialrespects the financial condition, results of operations and cash flows of the registrant as of, and for, the periods presented in this report;
4. The registrant’s other certifying officer(s) and I are responsible for establishing and maintaining disclosure controls and procedures (asdefined in Exchange Act Rules 13a-15(e) and 15d-15(e)) and internal control over financial reporting (as defined in Exchange ActRules 13a-15(f) and 15d-15(f)) for the registrant and have:
(a) Designed such disclosure controls and procedures, or caused such disclosure controls and procedures to be designed under oursupervision, to ensure that material information relating to the registrant, including its consolidated subsidiaries, is made known tous by others within those entities, particularly during the period in which this report is being prepared;
(b) Designed such internal control over financial reporting, or caused such internal control over financial reporting to be designedunder our supervision, to provide reasonable assurance regarding the reliability of financial reporting and the preparation offinancial statements for external purposes in accordance with generally accepted accounting principles;
(c) Evaluated the effectiveness of the registrant’s disclosure controls and procedures and presented in this report our conclusions aboutthe effectiveness of the disclosure controls and procedures, as of the end of the period covered by this report based on suchevaluation; and
(d) Disclosed in this report any change in the registrant’s internal control over financial reporting that occurred during the registrant’smost recent fiscal quarter (the registrant’s fourth fiscal quarter in the case of an annual report) that materially affected, or isreasonably likely to materially affect, the registrant’s internal control over financial reporting; and
5. The registrant’s other certifying officer(s) and I have disclosed, based on our most recent evaluation of internal control over financialreporting, to the registrant’s auditors and the audit committee of registrant’s board of directors (or persons performing the equivalentfunctions):
(a) All significant deficiencies and material weakness in the design or operation of internal control over financial reporting which arereasonably likely to adversely affect the registrant’s ability to record, process, summarize and report financial information; and
(b) Any fraud, whether or not material, that involves management or other employees who have a significant role in the registrant’sinternal control over financial reporting.
Dated: February 28, 2020
/s/ Andrew H. Beck Andrew H. Beck Senior Vice President and Chief Financial Officer

Exhibit 32.1
CERTIFICATION PURSUANT TO18 U.S.C. SECTION 1350,
AS ADOPTED PURSUANT TOSECTION 906 OF THE SARBANES-OXLEY ACT OF 2002
The undersigned, as the Chairman of the Board, President and Chief Executive Officer and as the Senior Vice President and Chief Financial Officerof AGCO Corporation, respectively, certify that, to the best of their knowledge and belief, the Annual Report on Form 10-K for the year ended December 31,2019 that accompanies this certification fully complies with the requirements of Section 13(a) of the Securities Exchange Act of 1934 and the informationcontained in the annual report fairly presents, in all material respects, the financial condition and results of operations of AGCO Corporation at the dates andfor the periods indicated. The foregoing certifications are made pursuant to 906 of the Sarbanes-Oxley Act of 2002 (18 U.S.C. 1350) and shall not be reliedupon for any other purpose.
/s/ Martin Richenhagen Martin Richenhagen Chairman of the Board, President and Chief Executive Officer February 28, 2020 /s/Andrew H. Beck Andrew H. Beck Senior Vice President and Chief Financial Officer February 28, 2020
A signed original of this written statement required by Section 906, or other document authenticating, acknowledging, or otherwise adopting thesignature that appears in typed form within the electronic version of this written statement required by Section 906, has been provided to AGCO Corporationand will be retained by AGCO Corporation and furnished to the Securities and Exchange Commission or its staff upon request.