against the tide—currency use among latin american .../media/publications/economic... · against...
TRANSCRIPT

� �Q/�007, Economic Perspectives
Against the tide—Currency use among Latin American immigrants in Chicago
Carrie Jankowski, Richard D. Porter, and Tara Rice
Carrie Jankowski is a business economist; Richard D. Porter is a vice president, senior policy advisor, and the director of the payments studies group; and Tara Rice is a financial economist in the Economic Research Department at the Federal Reserve Bank of Chicago. The authors thank Luis Alberro for his contributions to an earlier version of this article and Katy Jacob and Ruth Judson for their comments, suggestions, and assistance.
Introduction and summary
Like many other industrialized countries, the United States continues to transition from paper-based pay-ments (cash and checks) to electronic payments. For society as a whole, the benefits of this shift may be sub-stantial, since the marginal cost of an additional trans-action on an electronic payment network is almost always considerably less than it would be on a paper-based network. For most households in the U.S. today, currency (cash) still represents a transactions vehicle, but one that is increasingly being upstaged by a variety of substitutes, such as debit cards. However, as we de-tail in this article, for many Latin American immigrants, currency represents not only their primary transactions vehicle, but may also represent their only savings vehi-cle. Indeed, in our study of Latin American immigrants in Chicago, we find evidence that the dramatic increase in the number of immigrants is supporting a growing demand for currency, notably in the $100 denomination. We argue that this trend has quite possibly contributed to the increase in domestic demand for currency since the late 1990s—an increase that is at odds with the generally accepted view that cash is on the way out.
For some time, underlying economic forces have suggested to a number of observers that electronic money was poised to replace cash. James Gleick, the author of Chaos: Making a New Science, declared over a decade ago:
Cash is quaint, technologically speaking—un-less you’re impressed by intaglio-steel-plate-printed paper with embedded polyester strips (meant to inconvenience counterfeiters). Cash is expensive—tens of billions of dollars drain from the economy each year merely to pay for the printing, trucking, safekeeping, vending, collecting, counting, armored-guarding, and general care and feeding of our currency. Cash is obsolete.1
As the Economist magazine put it recently, “The economics of handling cash … is suddenly subsumed by Moore’s law,” which speaks to the ongoing tech-nological advances in computing capability that can be expected over time.2 In some fashion, these tech-nological improvements will be echoed in lower ef-fective costs of creating and operating digital networks, including digital payment networks. These develop-ments, in turn, will make cash substitutes more attrac-tive to payment providers and users. As the digital networks garner greater shares of payments, cash usage will decline. This development will then raise the cost of handling cash (as the current scale econo-mies in cash-handling networks diminish), leading to a further decline in cash usage.3
Against the tide of this trend toward replacing cash with electronic payment instruments is the fact that, over the past decade, the amount of U.S. curren-cy held domestically has increased, particularly notes in the largest denomination in circulation, $100 bills. Since 1995, the aggregate value of $100 bills in cir-culation has more than doubled, yet the share of $100 bills held abroad has decreased from its peak of 70 percent, and, more recently, held steady at about 65 percent. How does the rising Latin American immi-grant population in the United States factor into recent trends in currency use? Our research suggests that barriers to participation in the mainstream financial system and other factors continue to make cash more
�Federal Reserve Bank of Chicago
attractive than alternative payment instruments among this growing immigrant population. For example, a 2002 survey of 302 Latin American immigrants found that about 59 percent of payments were made using cash. The second most popular method was check, used for about 20 percent of payments. 4
In the next section, we examine recent trends in the use of cash, particularly the recent upswing in domes-tic currency use. Next, we analyze factors underlying currency demand. We discuss the financial participa-tion of immigrants and the reasons why a large number of immigrants do not make use of mainstream finan-cial institutions. Then, we use the 2000 U.S. Census and Federal Reserve data to analyze currency use among the Latin American population in Chicago, and assess the economic implications of these developments. Though limited to a relatively small geographic area, metropolitan Chicago provides an initial testing ground for our hypotheses, helping us to assess whether they warrant examination on a broader scale.
We find that the demand for $100 bills is greater in Chicago neighborhoods with higher concentrations of foreign-born Latin Americans than in other immi-grant neighborhoods or other Chicago neighborhoods in general. Our results suggest that Latin American immigrants hold these bills as a store of value, since the convenience of this denomination in most day-to-day transactions is quite limited. Although the timing is suggestive, additional research is needed to deter-mine whether this immigrant group (and, in particular, the growing number of undocumented workers from Mexico and Central America) represents the source of the recent upward trend in real per capita domestic currency holdings.
Trends in domestic currency use
The economic tide now running against currency is many-sided. In most circumstances, the competitors to currency, for example, credit cards, offer more: Some have higher yields, better record-keeping mechanisms, points/benefits (such as airline miles or “cash back” offers), and/or resolution mechanisms for transactions that turn sour. And while using currency at the check-out used to be more convenient than using checks, credit cards, or debit cards (mainly because currency transactions were quicker), electronic networks have reversed that in many venues. Today, drivers with transponders pay tolls electronically as their vehicles speed through Illinois Tollway plazas, while drivers without transponders wait in lines to hand over cash to toll collectors or to throw coins into 1950s-era coin hoppers. Radio frequency identification (RFID) technology similar to that embedded in the Illinois
Tollway transponders is now also available on con-tactless cards marketed by the major card networks. Contactless cards allow time-constrained customers to pay more quickly at the retail checkout or the auto-mated gas pump with a quick swipe of the hand. Finally, the storage technology embedded in currency has shrunk drastically. Fifty years ago, the highest denomination note in real terms was approximately equal to one full year of disposable income for the average household, whereas now it is closer to only 1.3 days of salary.5
A recent survey by the American Bankers Asso-ciation and Dove Consulting bears out many of these suppositions about the emergence of cash substitutes in the retail marketplace. This survey of consumer payment preferences found that over the last two years respondents reported using cash less often (versus more often) by a margin of nearly three to one.6 More-over, the growing use of cash substitutes was widely dispersed over a variety of retail outlets: grocery stores (94.5 percent reported using cash less frequently), gas stations or convenience stores (90.9 percent), depart-ment stores (96.0 percent), discount stores (88.3 percent), drug stores (88.5 percent), and restaurants (83.9 per-cent).7 A variety of reasons were offered for this change in behavior: Respondents were more comfortable us-ing noncash payment methods; they gained access to other payment methods besides cash; they found non-cash payment methods faster to use; they noted that more merchants accepted noncash payments; they en-joyed the rewards for making noncash payments; and they found noncash payment methods easier to use.8
So it appears that in many venues the rewards for using electronic payment methods outweigh those for using cash. But is cash truly becoming outmoded? Not necessarily. Some categories of transactions, in-cluding many illegal or “off-the-books” ones, are likely to remain “cash and carry.” Another area of growth in demand for U.S. currency has been overseas markets, such as Argentina and Russia. Residents of such countries have become accustomed to holding U.S. bank notes as a hedge against banking sector in-stability and/or hyperinflation in their home currencies. Indeed, as a result of strong growth in overseas de-mand for U.S. currency in the 1990s, Federal Reserve Board Governor Lawrence Lindsey called the dollar America’s most ignored export.9
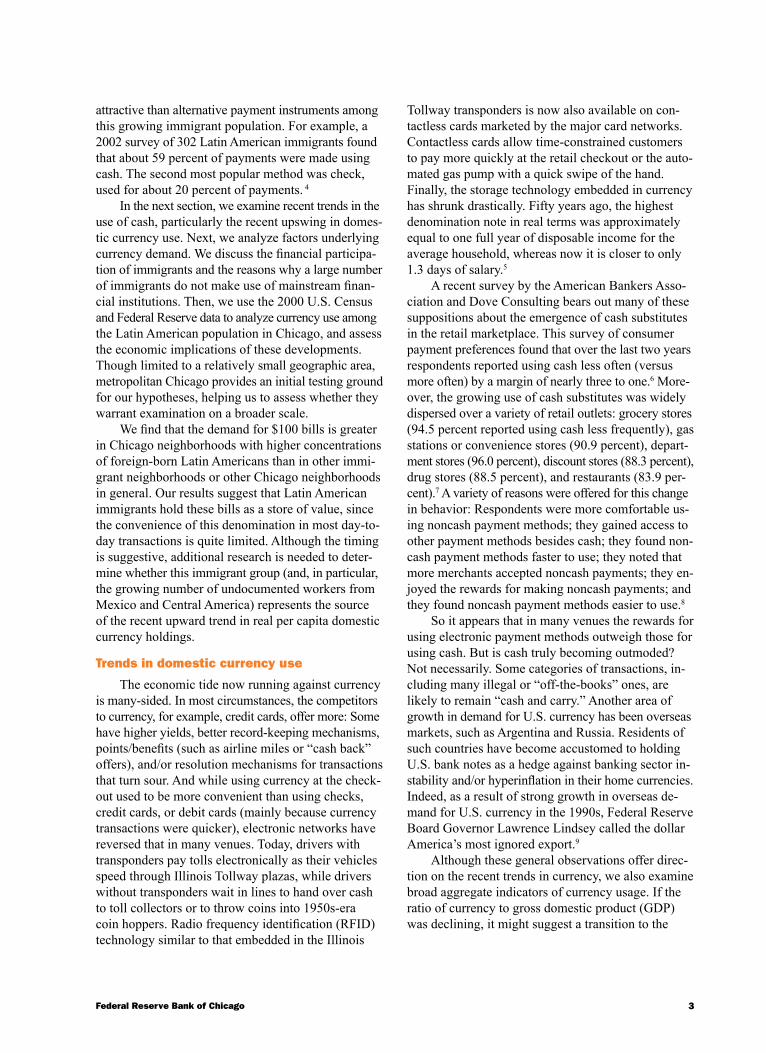
Although these general observations offer direc-tion on the recent trends in currency, we also examine broad aggregate indicators of currency usage. If the ratio of currency to gross domestic product (GDP) was declining, it might suggest a transition to the
� 2Q/2007, Economic Perspectives
figurE 1
Ratio of total currency to gross domestic product
percent
Source: Board of Governors of the Federal Reserve System from Haver Analytics.
1965 ’69 ’73 ’77 ’81 ’85 ’89 ’93 ’97 2001 ’053
4
5
6
7
figurE 2
Ratio of domestic currency to gross domestic product
percent
Source: Board of Governors of the Federal Reserve System from Haver Analytics.
1965 ’69 ’73 ’77 ’81 ’85 ’89 ’93 ’97 2001 ’052.0
2.5
3.0
3.5
4.0
4.5
5.0
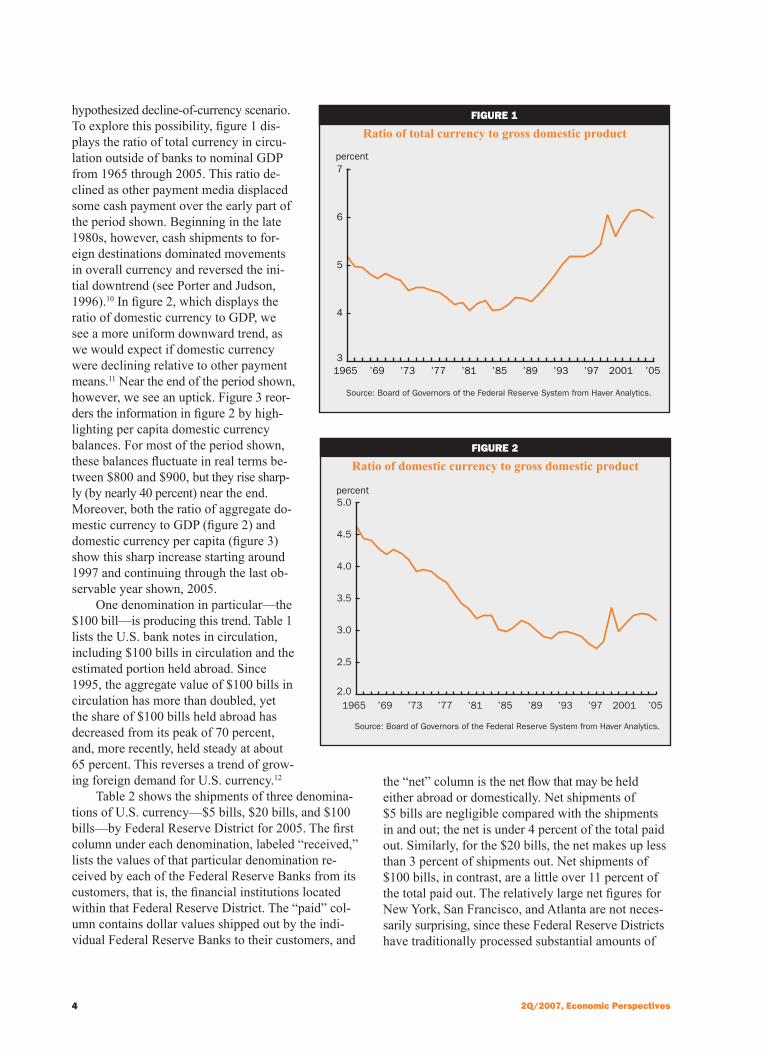
hypothesized decline-of-currency scenario. To explore this possibility, figure 1 dis-plays the ratio of total currency in circu-lation outside of banks to nominal GDP from 1965 through 2005. This ratio de-clined as other payment media displaced some cash payment over the early part of the period shown. Beginning in the late 1980s, however, cash shipments to for-eign destinations dominated movements in overall currency and reversed the ini-tial downtrend (see Porter and Judson, 1996).10 In figure 2, which displays the ratio of domestic currency to GDP, we see a more uniform downward trend, as we would expect if domestic currency were declining relative to other payment means.11 Near the end of the period shown, however, we see an uptick. Figure 3 reor-ders the information in figure 2 by high-lighting per capita domestic currency balances. For most of the period shown, these balances fluctuate in real terms be-tween $800 and $900, but they rise sharp-ly (by nearly 40 percent) near the end. Moreover, both the ratio of aggregate do-mestic currency to GDP (figure 2) and domestic currency per capita (figure 3) show this sharp increase starting around 1997 and continuing through the last ob-servable year shown, 2005.
One denomination in particular—the $100 bill—is producing this trend. Table 1 lists the U.S. bank notes in circulation, including $100 bills in circulation and the estimated portion held abroad. Since 1995, the aggregate value of $100 bills in circulation has more than doubled, yet the share of $100 bills held abroad has decreased from its peak of 70 percent, and, more recently, held steady at about 65 percent. This reverses a trend of grow-ing foreign demand for U.S. currency.12
Table 2 shows the shipments of three denomina-tions of U.S. currency—$5 bills, $20 bills, and $100 bills—by Federal Reserve District for 2005. The first column under each denomination, labeled “received,” lists the values of that particular denomination re-ceived by each of the Federal Reserve Banks from its customers, that is, the financial institutions located within that Federal Reserve District. The “paid” col-umn contains dollar values shipped out by the indi-vidual Federal Reserve Banks to their customers, and
the “net” column is the net flow that may be held either abroad or domestically. Net shipments of $5 bills are negligible compared with the shipments in and out; the net is under 4 percent of the total paid out. Similarly, for the $20 bills, the net makes up less than 3 percent of shipments out. Net shipments of $100 bills, in contrast, are a little over 11 percent of the total paid out. The relatively large net figures for New York, San Francisco, and Atlanta are not neces-sarily surprising, since these Federal Reserve Districts have traditionally processed substantial amounts of

�Federal Reserve Bank of Chicago
FIguRE �
Currency per capita and Treasury note yield
dollars
Notes: LHS means left-hand scale. RHS means right-hand scale. Real domestic currency per capita was deflated by the Consumer Price Index and is in end-of-year 2005 dollars.Sources: Authors’ calculations based on data from the Board of Governors of the Federal Reserve System, U.S. Bureau of Labor Statistics, and U.S. Census Bureau from Haver Analytics.
1965 ’69 ’73 ’77 ’81 ’85 ’89 ’93 ’97 2001 ’050
2
4
6
8
10
12
14
16
0
200
400
600
800
1,000
1,200
1,400
1,600
Real domestic currencyper capita (LHS)
Five-year Treasury noteyield at constantmaturity (RHS)
percent
TaBlE 1
U.S. bank notes in circulation Shareof Estimatesof $100bills Estimatesof$100bills shareof$100billsYear Total $100bills intotal heldabroad,wholesale heldabroad,wholesale (percent) (percent)
1965 38.0 8.1 21.4 3.9 48.31970 50.8 12.1 23.8 5.7 47.51975 77.6 23.1 29.8 10.0 43.21980 124.8 49.3 39.5 23.8 48.41985 182.0 81.2 44.6 45.8 56.41990 268.2 140.2 52.3 85.7 61.11995 401.5 241.5 60.2 169.2 70.11999 601.2 386.2 64.2 254.6 65.92000 563.9 377.7 67.0 256.0 67.72001 611.7 421.0 68.8 279.8 66.42002 654.8 458.7 70.1 301.3 65.72003 690.2 487.8 70.7 317.9 65.22004 719.9 516.7 71.8 332.7 64.42005 758.8 545.0 71.8 352.0 64.6
Note: All values are in billions of dollars except as noted.Source: U.S. Department of the Treasury, Board of Governors of the Federal Reserve System, and U.S. Secret Service (2006).
currency from, or to, foreign endpoints. The larger positive flows for Richmond and Chicago, however, are more surprising. This increase may reflect the surge in Latin American immigration (which is described in de-tail later) in these two Federal Reserve Districts. To-gether, tables 1 and 2 suggest that $100 bills are being held, and increasingly so at home rather than abroad.
Explaining currency demand
What reasons could help to explain the increase in domestic demand for cur-rency? Traditionally, an individual’s de-mand for currency is viewed along inventory theoretic lines, in which money demand depends positively on income re-ceived in a period and a brokerage (or transaction) fee for getting into and out of an interest-bearing instrument and nega-tively on a short-term nominal interest rate.13 The traditional transaction demand for money depicts money holdings as fol-lowing a saw-tooth pattern over income periods; that is, money holdings (whether in currency or in a bank account) rise rapidly with receipt of income or other source of payment, and then fall slowly as the money is spent continuously over time.14 When nominal interest rates are low or the brokerage fee is high relative to income, it may not pay to have an in-terest-bearing account at all. In this case, the individual only holds one financial
instrument, currency.In addition to interest rates and brokerage fees,
Cagan’s classic analysis of the demand for currency, considers three additional candidates that could ex-plain this trend: crime, tax evasion, and travel.15 A downward movement in nominal interest rates will lower the opportunity cost of holding currency and

� �Q/�007, Economic Perspectives
FIguRE �
Historical crime rates
rate per 100,000, ratio scale
Source: Federal Bureau of Investigation, Uniform Crime Reports.
10,000
100,000
1,000,000
10,000,000
1970 ’74 ’78 ’82 ’86 ’90 ’94 ’98 2002
100,000,000
All ages, total crimes
Adult drug crimes
Juvenile drug crimes
raise desired currency balances. Interest rates have been very low over the past several years; the federal funds rate averaged only 3.2 percent in 2005, while interest-bearing checking accounts paid depositors about 0.31 percent in interest per year over this period. Thus, it is conceivable that the low level of interest rates generally prevailing after the events of Septem-ber 11, 2001, might account for the recent increase in domestic currency demand. However, figure 3 (p. 5) shows that nominal interest rates do not appear to have had a powerful enough influence on real domes-tic currency per capita to explain the changes in levels. This result is in line with estimates that suggest that currency demand is not that elastic with respect to nominal interest rates.
What about crime and tax evasion? Our earlier work has cast doubt on the crime explanation for currency demand, and current crime statistics support our prior assessment.16 Evidence using either the overall variation in crime or in drug arrests (figure 4) suggests that crime is not the missing link in currency de-mand.17 Moreover, the movements of av-erage marginal tax rates in the United States do not indicate that there has been an increase in the incentive to evade fed-eral taxes (and therefore hold more cash), as displayed by the tax rate series com-piled by the National Bureau of Economic Research in figure 5.
TaBlE �
Shipments of $5 bills, $20 bills, and $100 bills, by Federal Reserve District, 2005
$5bills,billions $20bills,billions $100bills,billionsDistrict Received Paid Net Received Paid Net Received Paid Net
Boston 0.6 0.7 0.0 18.8 19.0 0.3 4.7 5.7 1.0New York 1.7 1.6 –0.1 48.4 49.4 1.0 70.9 88.0 17.1Philadelphia 0.6 0.8 0.1 20.9 22.7 1.8 9.2 7.2 –2.0Cleveland 0.8 0.8 0.0 16.6 18.1 1.4 5.8 7.3 1.4Richmond 1.1 1.2 0.1 33.6 36.2 2.6 14.1 17.9 3.7Atlanta 2.5 2.4 0.0 47.6 45.4 –2.2 44.3 36.9 –7.5Chicago 1.4 1.5 0.1 30.6 34.3 3.8 11.1 15.0 4.0St. Louis 0.5 0.5 0.0 9.5 9.8 0.3 6.5 7.9 1.4Minneapolis 0.3 0.3 0.0 5.9 6.4 0.5 2.4 3.1 0.7Kansas City 0.6 0.7 0.0 12.5 13.5 1.0 6.4 8.1 1.7Dallas 1.1 1.1 0.0 21.4 21.3 0.0 16.5 17.7 1.2San Francisco 2.5 2.6 0.1 50.6 47.9 –2.7 37.4 43.1 5.7Total 13.7 14.1 0.5 316.4 324.1 7.7 229.2 257.7 28.5
Notes: For a map of the 12 Federal Reserve Districts, see www.federalreserve.gov/otherfrb.htm. Columns and rows may not total because of rounding.Source: Federal Reserve System.
Finally, Cagan argues that the volume of curren-cy used to transact a given volume of retail trade may vary with the volume of travel per capita. Writing near the end of the 1950s, he reasoned that payments by check or credit require that the parties making the exchange know each other. When travel increases, currency is likely to supplant checks. Why? Simply because the traveler will be buying where he or she is not known or has not had an opportunity to establish a line of credit.
Consider, in particular, workers who move from Mexico and other Latin American countries to Chicago.18 Like other immigrants, they are travelers and make

7Federal Reserve Bank of Chicago
FIguRE �
U.S. federal average marginal income tax rate
percent
Source: National Bureau of Economic Research, TAXSIM model.
1965 ’69 ’73 ’77 ’81 ’85 ’89 ’93 ’97 2001 ’050
5
10
15
20
25
30
35
relatively frequent return visits to their hometowns where they maintain family ties.19 Even if they have been settled in Chicago for some time, they remain less likely to participate in the formal banking sector here. For a variety of reasons, such as language barriers, lack of documentation, and distrust of banks, these immigrants tend to use checks, credit cards, and debit cards much less often than the general population does. Using Cagan’s framework, one might classify them as being perpetual travelers.
Unlike the other explanations we have consid-ered—interest rates, crime, and tax evasion—travel (specifically, immigration) provides the most viable explanation. Immigration from Mexico and other Latin American countries has grown at astonishing rates in recent years. Moreover, the brokerage fees (discussed earlier) may not be similar for all residents. If an indi-vidual is familiar with banking and can readily open and use a checking account or other bank account, then the brokerage fee in getting to a bank or automatic teller machine (ATM) to deposit or withdraw funds may represent only the classic “shoe leather” costs.20 On the other hand, for immigrants there are often other impediments that stand in the way of their establish-ing a banking relationship. As a result, they may choose not to bank with depository institutions and instead hold their wealth entirely in cash. Because of these impediments (leading to higher transaction costs),21 the optimal deposit holdings for many of these immi-grants might be negligible.
Immigration to the united States
While the deposit holdings of a small group of residents might not affect domes-tic demand for currency on a larger scale, Latin American immigrants make up a rapidly growing proportion of U.S. resi-dents. Since 1980, immigration to the United States from Latin American coun-tries has increased considerably. In 1980, foreign-born Latin Americans represented 1.9 percent of the total U.S. population. By 2005, that share grew to 6.6 percent, of whom 56.8 percent were from Mexico.22 Mexican immigrants alone represented a greater share of the U.S. foreign-born population (29.5 percent) at the end of the twentieth century than German and Ital-ian immigrants (23.7 percent) collectively did at the end of the first great immigra-tion wave to the United States in 1920.23 Table 3 summarizes immigration to the
United States from 1850 through 2000. The rise in immigration from Latin America from the 1980s on-ward is dramatic, with Mexican immigrants making up a growing proportion of the total amount of Latin American immigrants. In 1980, immigrants from Mexico made up 74 percent of total Latin American immigrants; by 2000 that proportion had grown to 84 percent. Figure 6 shows the cumulative influx from Mexico to the United States over the past 150 years, and table 4 highlights recent patterns of Mexican immigration.24
Immigration from Mexico gained traction as the Mexican debt crisis of the early 1980s unfolded. It ac-celerated sharply in the latter part of the 1990s, partly spurred by the economic boom (and higher employment rates) in the United States. Importantly, too, the esti-mated number of undocumented immigrants entering this country now exceeds that of legal immigrants. This has implications for financial participation because, as we discuss in more detail in the next section, undoc-umented immigrants often face higher barriers to par-ticipation in the financial system than do legal residents.
By and large, immigrants tend to migrate to areas in the United States where other residents from their hometowns or countries now live. Chicago is among the oldest and most established Latino immigrant gateways in the country (Singer, 2004), and Chicago’s Latin American population has swelled along with the national trend. Between 1990 and 2000, the Latino population (both native-born and foreign-born mem-bers) in the Chicago metropolitan area increased by

� �Q/�007, Economic Perspectives
FIguRE �
Mexican-born population in the U.S.
thousands
Source: Passel (2005).
1850 ’70 ’90 1910 ’30 ’50 ’70 ’900
1,000
2,000
3,000
4,000
5,000
6,000
7,000
8,000
9,000
10,000
TaBlE �
Region of birth of the foreign-born population
Census Latin Northern year Total Europe Asia Africa Oceania America America 1850 2,202,625 2,031,867 1,135 551 588 20,773 147,7111860 4,134,809 3,807,062 36,796 526 2,140 38,315 249,9701870 5,563,637 4,941,049 64,565 2,657 4,028 57,871 493,4671880 6,675,875 5,751,823 107,630 2,204 6,859 90,073 717,2861890 9,243,535 8,030,347 113,383 2,207 9,353 107,307 980,9381900 10,330,534 8,881,548 120,248 2,538 8,820 137,458 1,179,9221910 13,506,272 11,810,115 191,484 3,992 11,450 279,514 1,209,7171920 13,911,767 11,916,048 237,950 16,126 14,626 588,843 1,138,1741930 14,197,553 11,784,010 275,665 18,326 17,343 791,840 1,310,3691960 9,678,201 7,256,311 490,996 35,355 34,730 908,309 952,5001970 9,303,570 5,740,891 824,887 80,143 41,258 1,803,970 812,4211980 13,192,563 5,149,572 2,539,777 199,723 77,577 4,372,487 853,4271990 18,959,158 4,350,403 4,979,037 363,819 104,145 8,407,837 753,9172000 31,107,573 4,915,557 8,226,254 881,300 168,046 16,086,974 829,442
Notes: This table excludes immigrants whose region of birth was not reported. The U.S. Census Bureau does not have data on the region of birth of the foreign-born population for the census years 1940 and 1950. Source: U.S. Census Bureau.
73 percent.25 Over half of that increase (56 percent) was due to immigration; the rest was due to popula-tion growth among existing Latin American residents. An estimated 421,000 thousand immigrants arrived in the Chicago area directly from Mexico between 1980 and 2000,26 and as of 2000, more than 586,000 Mexicans were living in the Chicago metropolitan area.27
Financial participation of immigrants While an estimated 8 percent to 9 percent of all
U.S. households do not have a transaction account, a much higher proportion of the immigrant population has no banking re-lationship (or is unbanked) compared with their native-born counterparts.28 The U.S. Census Bureau’s Survey of Income Participation (SIPP) puts the number of unbanked Mexican immigrants at 53 per-cent and other Latin American immi-grants at 37 percent over the period 1996–2000 (see table 5).29
The most commonly reported reasons given by U.S. households for not having a transaction account are they write too few checks to make it worthwhile (28 percent), do not like dealing with banks (23 percent), have insufficient funds (14 percent), or find service charges too high (12 percent).30
Immigrants have additional reasons for not opening a transaction account. In many cases, undocumented immigrants are unable to open savings or checking
accounts at banks because they lack the required offi-cial identification (such as a Social Security number, driver’s license, or tax identification number). More-over, undocumented immigrants may feel they risk their livelihood in the United States by revealing their immigrant status to a bank. To close these gaps, the U.S. Department of the Treasury now allows banks to decide what forms of identification they will accept from individuals who want to open a bank account. As a result, Mexican immigrants with Matricula cards

�Federal Reserve Bank of Chicago
TaBlE �
Recent patterns of Mexican immigration
MexicanimmigrantstoU.S. 1980–89 1990–94 1995–99 2000–04 (thousandsperyear)
Undocumented 140 450 750 700Legal 650 670 660 610Total 790 1,120 1,410 1,310
Source: Passel (2005).
(identification cards issued by Mexican consular of-fices in the United States) are now permitted to open bank accounts in some states, including Illinois.
Many Latin American immigrants may have had little financial education or direct experience in deal-ing with financial institutions. In addition, many Latin American immigrants also have historical reasons to view banks as risky institutions. Many have experi-enced banking crises in their home countries with outright banking failures and liquidity disruptions that have often harmed depositors. As a result, they may view banks with suspicion.
Language barriers present further obstacles for immigrants. In most cases, it is necessary for bank customers to learn how to manage their accounts in English; for example, they need to learn how to fill out the proper dollar amount in English on a check. Though some banks now offer services to cater to cus-tomers who speak Spanish, language barriers can still remain an obstacle at these venues. Since as many as 10 percent of Mexicans speak a language other than Spanish, this customization may not be valuable to all Mexican immigrants.31
Several other factors push immigrants into cash. Some workers are paid in cash for work that is not documented, and must pay bills and other expenses (such as rent) in cash. Also, some immigrants do not expect to stay very long in the United States and, therefore, may feel they would not benefit from learning how to open and operate a bank account.32 Furthermore, newly arriving immigrants tend to locate in areas inhabited by other immigrants from the same countries or regions. Once settled, new immigrants often learn about U.S. customs and procedures from their local social network. If their neighbors or coworkers do not tend to make use of banks, the new immigrants will not either.33 Many Mexicans living in Mexico
choose to hold some U.S. dollars. Mexicans living in Mexico are estimated to have av-erage dollar holdings of U.S. bank notes about equal to half of the average bank note holdings for U.S. residents living in the United States.34 For undocumented im-migrants, payments to so-called coyotes, who help them to enter or reenter the United States undetected, may require substantial amounts of dollars—often several thousand dollars per person.35 Finally, many immi-grants send remittances to their families
living in their home country. Because the role of re-mittances in the demand for cash is significant, we discuss this topic in detail next.
Role of remittances Workers in the United States transferred more
than $40 billion to Latin America and the Caribbean in 2005.36 This represents about 75 percent of the total remittances sent to Latin America and the Caribbean in 2005 from all countries. About half of the total re-mittances (approximately $27 billion) went directly to Mexico—an amount greater than Mexico’s revenues from tourism and about equal to Mexico’s annual in-come from oil exports in recent years.
Remittance transfers are primarily a cash-to-cash process: Remitters pay cash to a money transmitter or financial institution, and the recipient of the remittance in the home country picks up the funds in cash. In re-cent years, banks have begun to offer cash checking or money transfer services as a way to capture a larg-er share of this growing market, although they have not made large inroads to date.37 As of 2004, less than 5 percent of transfers were done via direct deposit into bank accounts.38
A large portion of these remittances are paid in cash to money transmitting institutions (wire transfer ser-vices), such as Western Union and MoneyGram, that primarily accept cash. What is not captured in this
TaBlE �
Percent of unbanked in the U.S., 2000
U.S.-bornandforeign-bornpopulations(asapercentageofeachgroup)
U.S.-born Foreign-bornWhite 14 Mexican 53Black 46 Other Latin American 37Hispanic 34 Asian 20Other race 34 European 17 Total 17 Total 32
Source: U.S. Census Bureau, 2000 SurveyofIncomeandProgramParticipation.

10 �Q/�007, Economic Perspectives
TaBlE �
Bivariate correlations between currency measures and selected demographic variables, by zip code, 2005
Proportionof All Proportionof Proportionof immigrants $5bills $20bills $100bills denominations native-born LatinAmerican notfrom percapita percapita percapita percapita residents immigrants LatinAmerica $5 bills per capita $20 bills –0.0148per capita 0.8454 $100 bills 0.4110 –0.0150per capita 0.0000 0.8434 All denominations 0.0216 0.9979 0.0473per capita 0.7764 0.0000 0.5329
Proportion ofnative-born 0.1127 0.0098 –0.0165 0.0106residents 0.1363 0.8972 0.8283 0.8893
Proportion ofLatin American 0.0180 –0.0570 0.1454 –0.0471 –0.7348immigrants 0.8129 0.4527 0.0541 0.5347 0.0000
Proportion of immigrantsnot from –0.1854 0.0464 –0.1311 0.0348 –0.6889 0.0145Latin America 0.0138 0.5407 0.0828 0.6470 0.0000 0.8488
Note: The first (top) number in each row is the correlation, and the second (bottom) number is the p value. Sources: Authors’ calculations based on data from the Federal Reserve Bank of Chicago and U.S. Census Bureau.
estimate of total remittances is the amount that immi-grants remit to their home countries by carrying cash in their (often annual) return visits or by entrusting money to family members or friends who are traveling home.
The average size of recorded remittances to Latin America was between $200 and $300 per transaction in 2005, with 20 percent of participants sending less than $100, 36 percent sending between $100 and $200, 26 percent sending between $200 and $300, and 18 percent sending more than $300. The average size of remittances increased significantly in 2006 to approximately $315 per month.39 On average, Mexican immigrants remit more than their counterparts from other Latin American countries—about $450 a month in 2002. They also bring a considerable sum of cash back to Mexico when they visit—almost $3,000 per visit.40
Linking immigration and currency demandTo establish a link between the surge in immigra-
tion and the increased demand for currency in the U.S., we correlate currency disbursements with the propor-tion of immigrants (both from Latin America and from all other regions) by five-digit zip code, using U.S. Census data for metropolitan Chicago, where Latin
Americans are the largest immigrant group. Table 6 shows that metropolitan Chicago neighborhoods (mea-sured at the zip code level) with larger proportions of Latin American immigrants are positively correlated with the number of $100 bills per capita. For immi-grants from regions other than Latin America, this correlation becomes negative.
This difference suggests that Latin American im-migrants’ currency demand may be larger than that of other immigrant groups simply because they will be more likely to be unbanked, as shown in table 5 (p. 9). A number of other factors could explain this finding. Table 7, which contains the summary statis-tics for neighborhoods in our data sample (discussed in the next section), highlights some differences be-tween Latin American immigrants and immigrants from other regions. The concentration of Latin American immigrants ranges from less than 1 percent to 49 per-cent per zip code (with a mean of 6 percent), while the concentration of immigrants from all other regions ranges between less than 1 percent to 41 percent.41
Polish immigrants are the second largest immigrant group in the Chicago area. As of 2000, the largest
11Federal Reserve Bank of Chicago
population of Polish immigrants in the United States lived in Illinois (almost 140,000), and this Illinois contingent represented almost 30 percent of the nation’s total foreign-born Polish population. Thus, examining the currency demand for foreign-born Polish residents provides a contrast by which to gauge the results from Latin American immigrants. In our sample, the pro-portion of foreign-born Polish residents per neighbor-hood ranges between zero percent and 21 percent of the population per zip code (with a mean of 2 percent). The lower mean and standard deviation for the pro-portion of all other immigrants combined and for the Polish immigrants (compared with the Latin American immigrants) illustrates that Latin American immi-grants tend to be more concentrated in some neigh-borhoods than other immigrant groups.
A comparison of neighborhoods with a high con-centration of foreign-born Latino residents (those with foreign-born Latinos accounting for at least 30 percent of the resident population) versus neighbor-hoods with a high concentration of foreign-born non-Latino residents (those with foreign-born non-Latinos accounting for at least 30 percent of the resident pop-ulation) reveals the following: Foreign-born Latino residents are younger, are less educated, earn a lower income on average, and have immigrated to the U.S. more recently. It is likely that linguistic barriers to banking are larger in the Latin American immigrant communities. Both groups tend to be more likely to live in neighborhoods with higher proportions of renters, but this effect is somewhat more pronounced for Latin American immigrants.
Data and empirical analysis
As table 6 suggests and research finds, Latin American immigrants tend to establish themselves in neighborhoods having relatively high densities of their fellow immigrants.42 Since most Mexican immi-grants in the United States come from the central and southern parts of Mexico, “migration networks may be developed in this area to the point that migration costs are generally low for most families and migration de-cisions largely reflect wage differences.”43 As a result of these forces, Mexican immigrants in the Chicago area have tended to locate in neighborhoods such as Pilson and Little Village, which already have a high proportion of Mexican and other Latin American im-migrants. Using U.S. Census data, we can study these clusters at the five-digit zip code level, enabling us to use a rich mix of socioeconomic and demographic factors that are available at this geographic level.
Our data consist of annual cash orders from the Federal Reserve Bank of Chicago to bank branch
offices in the Chicago area in 2005, aggregated by zip code. The aggregated data allow us to measure the aggregate flows of currency to a cross-section of zip codes in the Chicago area. Note that these orders represent flows (rather than stocks) of currency from the Federal Reserve Bank of Chicago to depository institutions in various zip codes.
Because of data limitations, we cannot use all of the cash orders we have. Since some larger banks oper-ate as correspondent banks to smaller (community) banks in the Chicago area, it is not possible to determine what proportion of ordered currency stays with each correspondent bank and what proportion ends up at the smaller respondent banks.44 Therefore, we remove the large correspondent banks from our sample. Our restricted data set contains 543 banks dispersed over 175 zip codes. Because we aggregate the data to the zip codes in which the community banks operate, our results implicitly reflect the behavior of an assortment of community banks.45
To this aggregated cash data, we add socioeco-nomic and demographic data on the native-born and foreign-born population at the zip code level from the 2000 U.S. Census. This includes data on income, age, and education of residents at the zip code level. These three factors influence bank account ownership for both immigrants and native-born residents. Higher levels of education are generally reflected in more sophisti-cated financial decision-making. Individuals with bachelor’s or advanced degrees are 21 percent more likely to have a checking account than those who have not completed high school.46 Age may affect a resident’s choice of payment method, with younger residents more likely to embrace newer payment methods, such as debit cards, and older residents more likely to stick with traditional payment instruments, such as checks, cash, and, to some degree, credit cards.47 Income will also affect a resident’s decision (and perhaps ability) to maintain a bank account.48
The type of housing in which immigrants live may have a bearing on their currency usage. Residents in low-income neighborhoods who rent are more likely to pay that rent in cash than residents in middle- to high-income neighborhoods.49 We therefore include the proportion of renters per neighborhood to capture this fact. We then interact this variable with our mea-sure of income, because low-income neighborhoods are the ones where property owners tend to demand cash payments. This tendency might be more pronounced in neighborhoods with higher concentrations of more transient groups, such as immigrants.
We also consider a number of factors that likely affect transaction costs (shoe leather costs) for getting
1� �Q/�007, Economic Perspectives
FIguRE 7
Zip codes in the Chicago area included in study
COOKDUPAGE
WILL
KANE
MCHENRY
KENDALL
GRUNDY
Zip codes in data set
Included Excluded
LAKE
into and out of an interest-bearing instrument (a bank account). As stated earlier, it is reasonable to assume that these transaction costs differ across demographic segments of the population. Specifically, immigrants may face higher implicit transaction costs to obtain an interest-bearing instrument, such as a checking or savings account, because of language barriers, lack of documentation, and distrust of the banking system.
While we tend to think of traditional depository institutions (that is, banks) as representing the finan-cial sector, immigrants often make use of financial institutions that are more on the “fringe,” such as pay-day lenders, check cashers, and money transmitters, which provide a number of important services and are often conveniently located. We include (per zip code) the number of money transmitters per capita, as well as the number of payday lenders per capita to repre-sent the relative size of the fringe banking sector. Mi-grants predominantly use money transmitters to remit money to their home country—70 percent of Mexi-can immigrants use them to remit money home. These institutions often charge hefty fees.50
Payday lenders, on the other hand, provide cash to residents, and the number of these institutions has been on the rise in lower-income and immigrant neighbor-hoods. We separate these two types of fringe institutions because we expect de-mand for currency to vary across neigh-borhoods based on the concentration of each of these types of institutions. If resi-dents are hoarding currency to remit it through a money transmitter, then we would expect demand for currency to be positively associated with the number of money transmitters per 1,000 residents. However, residents receiving a loan from payday lenders are most likely to be in lower-income neighborhoods, where it is more common to live from paycheck to paycheck. These residents would tend to demand less currency. Under payday lending arrangements, they are required to give the lender a post-dated check (not cash), and if they are living from paycheck to paycheck, they are likely to be liquidi-ty constrained. We anticipate, therefore, that the number of payday lenders per cap-ita will be negatively associated with the demand for currency.
We also add two variables to repre-sent local (geographic) demand for
currency. The first variable proxies the demand by tourists and consists of total 2005 attendance at large tourist attractions in the Chicago area.51 The econom-ic activity surrounding these highly visited spots should tend to increase the local demand for curren-cy in the surrounding neighborhoods. The second geographic variable is the ratio of workers to resi-dents in each zip code. We include this variable to account for the increase in the demand for currency by people commuting into a neighborhood to work. In addition, places of larger-scale employment in Chicago are often surrounded by restaurants and bars that cater to the workers and whose employees are of-ten paid in cash.52
Criminal activity, such as drug sales and book-making, might result in increased demand for cash, in that these activities ordinarily entail anonymity be-tween parties involved in a transaction. We therefore include a measure of overall criminal activity per neighborhood. Specifically, we use an index of risk

1�Federal Reserve Bank of Chicago
TaBlE 7
Summary statistics
Numberof StandardVariable observations Mean deviation Minimum Maximum Log of $5 bills per capita 158 1.42 1.61 –3.54 4.82Log of $20 bills per capita 173 4.11 1.97 –0.81 11.01Log of $100 bills per capita 169 4.22 1.53 –0.28 7.69Log of all denominations per capita 175 5.42 1.48 1.81 11.18 $5 bills per capita 175 10.32 16.86 0.00 123.86$20 bills per capita 175 539.16 4,582.48 0.00 60,677.80$100 bills per capita 175 168.68 270.64 0.00 2,193.73All denominations per capita 175 891.95 5,440.23 6.14 71,974.94 Ratio of workers/residents 175 0.79 1.54 0.00 18.10Automatic teller machines per capita 175 0.00 0.00 0.00 0.01Money transmitters per capita 175 0.00 0.02 0.00 0.19Payday lenders per capita 175 0.04 0.07 0.00 0.59Median age (years) 175 35.20 4.33 23.80 47.00Median income (dollars) 175 58,475 18,996 14,205 138,525Log of median household income 175 10.92 0.33 9.56 11.84Proportion of Latin American immigrants 175 0.06 0.09 0.00 0.49Proportion of immigrants not from Latin America 175 0.09 0.08 0.00 0.41Attendance at tourist attractions per capita 175 11.74 80.09 0.00 971.10Proportion of college educated (≥ 25 years old) 175 0.31 0.18 0.04 0.78Crime index 175 4.01 2.13 1.00 8.30Proportion of rented housing units 175 0.35 0.25 0.02 0.98Proportion of rented housing units × Log of median household income 175 3.77 2.64 0.26 10.95Proportion of Polish immigrants 175 0.02 0.03 0.00 0.21Proportion of African Americans 175 0.13 0.23 0.00 0.99
of violent or property crime developed by the Federal Bureau of Investigation (FBI), where ten represents the highest risk and one the lowest.53
Finally, we include two variables to test our hypothe-ses that the demand for currency differs between im-migrant and native-born residents. We include the percentage of Latin American immigrants and the percentage of foreign-born residents that are not of Latin American descent to assess the effect of immi-gration on cash acquisition.54
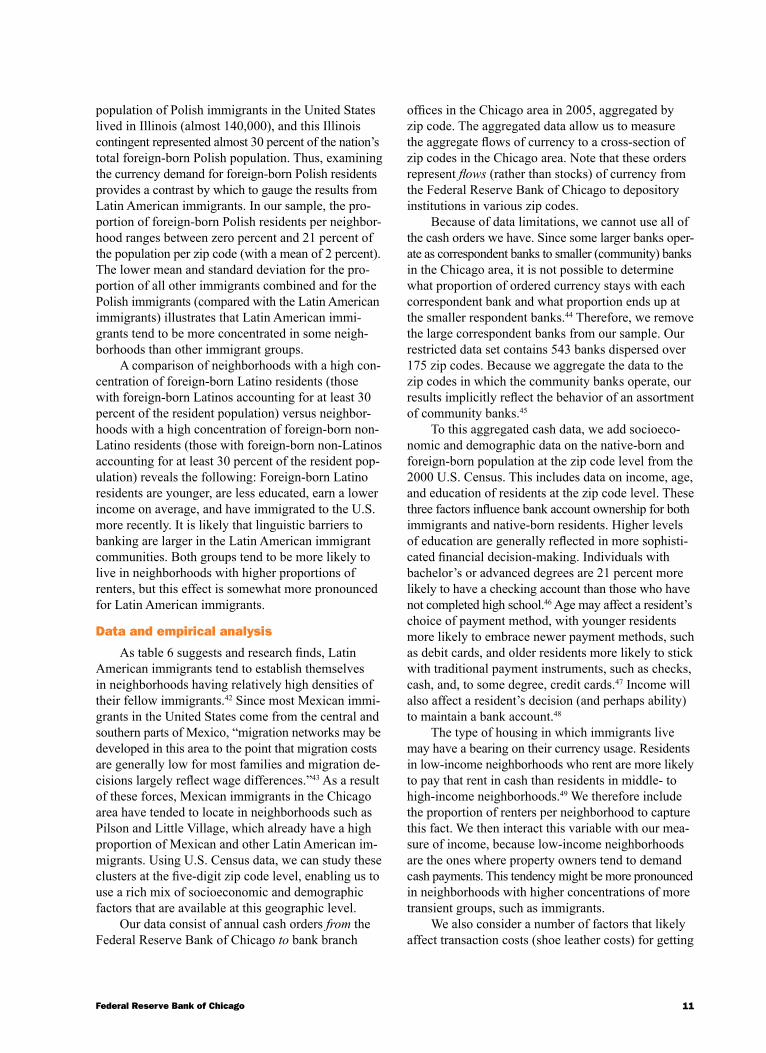
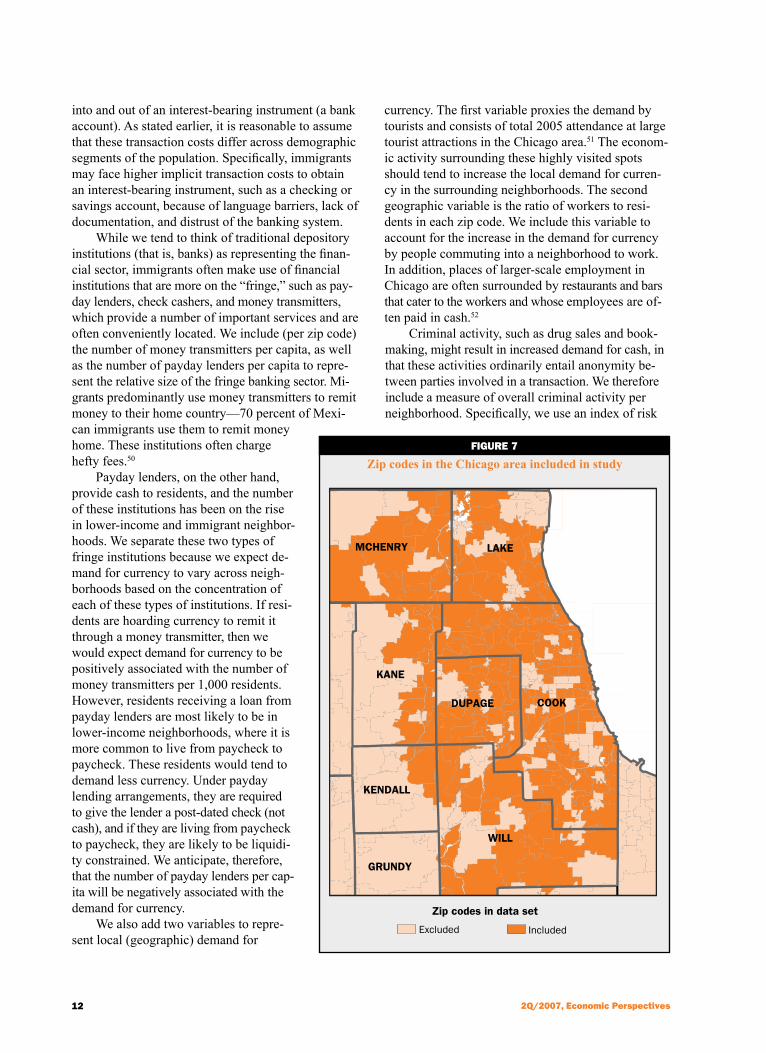
Figure 7 illustrates the 175 zip codes with orders available for $5, $20, $100, and all denominations; these zip codes are shaded in dark orange to distin-guish them from the other zip codes. In our restricted sample, some of the zip codes did not receive any shipments of particular denominations during 2005, and so our sample size for the different denomina-tions ranges from 158 to 175 zip codes.
Table 7 illustrates that, on average, residents of our sampled zip codes are about 35 years old, 31 per-cent of them have a college degree, and they earn an average annual income of $58,475 per household. On average, gross payments to residents per zip code in 2005 were $10.32 in $5 bills (log 1.42), $539.16 in
$20 bills (log 4.11), $168.68 in $100 bills (log 4.22), and $891.95 in all denominations (log 5.42).
The maps in figures 8 and 9 highlight the two most important components of our data set. Figure 8 depicts the spatial demand for $100 bills by zip code; zip codes exhibiting demand for $100 bills above the 75th percentile are shaded in dark orange, while those exhibiting demand below the 75th percentile are in light orange. Figure 9 displays where foreign-born Latin American communities reside by zip code; zip codes that have more than 6 percent foreign-born Latin American residents—the state’s average—are in dark orange, while those that have less than 6 percent are in light orange.55 While the maps do not match per-fectly, we see some striking similarities between them; many zip codes in both figures are either light orange or dark orange. Like our bivariate correlation table (table 6, p. 10), these two maps together suggest that the areas that demand more $100 bills tend to be areas with a higher proportion of Latin American immigrants.
Given our observations, the visual and statistical ar-guments, and the facts presented earlier, we introduce four hypotheses to test empirically.

1� �Q/�007, Economic Perspectives
FIguRE �
Aggregate orders at community banks for $100 bills,by zip code in the Chicago area, 2005
Orders for $100 billsBelow 75th percentile Above 75th percentile
LAKEMCHENRY
KANE
DUPAGECOOK
KENDALL
WILL
GRUNDY
Source: Authors’ calculations based on data from the Federal Reserve Bankof Chicago.
n Neighborhoods (measured at the zip code level) having a greater share of Latin American immigrants will de-mand more $100 bills, all else being equal. These neighborhoods are like-ly to have a large share of residents who do not have bank accounts and who use cash to pay bills, accumu-late cash, and remit funds to their home countries.
n Immigrants from other regions of the world may or may not demand more $100 bills. These immigrants are, on average, more educated and earn more. They speak English more competently than Latin American immigrants, though by a very slim margin. Thus, it is difficult to predict whether they might demand less, more, or the same amount and de-nomination of currency as Latin American immigrants.
n The demand for other denominations ($5 bills and $20 bills) will be lower for Latin American immigrants than the demand for $100 bills. Twenty dollar bills (dispensed by about 94 percent of ATMs in the U.S. in 2006) will be received by virtually all resi-dents who obtain cash from ATMs; $5 bills, the third smallest denomina-tion available in U.S. bank notes, will not likely be used as a store of value or to pay large bills in cash (such as rent).56
n Residents in low-income neighbor-hoods who rent are more likely to pay that rent in cash than residents in middle- to high-income neighborhoods. Therefore, the demand for cash will be greater in lower-income neighborhood with a higher proportion of renters.
Regression analysisTo empirically test our hypotheses, we estimate a
model of cash orders (flows) as a function of the for-eign-born Latin American population and the control variables listed previously.
The regression equation is as follows:
1 1
2 3
)
,
CashOrders LA
NonLA X Bid
i
i i i
= + ++ +
α ββ ε
where CashOrders are, alternatively, either the amount per capita (in logs) of $5 bills, $20 bills, $100 bills, or all denominations of currency in the Chicago area; i indexes zip codes; d represents the alternative de-nomination ($5 bills, $20 bills, $100 bills, or all denomi-nations) used in our analysis; and e is an unobserved error term. The variable LA is the proportion of Latin American immigrants to total residents per zip code, and the variable NonLA is the proportion of immigrants not from Latin America to total residents per zip code. Finally, X is a vector of variables (discussed earlier) that accounts for differential transaction costs of hold-ing currency and local demand for currency. It includes the following: ratio of workers to residents, money transmitters per capita, payday lenders per capita, median age of residents, log of median household

1�Federal Reserve Bank of Chicago
FIguRE �
Proportion of foreign-born Latin Americans,by zip code in the Chicago area, 2000
Proportion of foreign-born Latin Americans
Below state average Above state average
LAKEMCHENRY
KANE
DUPAGE COOK
KENDALL
WILL
GRUNDY
Note: Illinois has a state average of 6 percent foreign-born Latin Americans.Source: Authors’ calculations based on data from the U.S. Census Bureau.
the dependant variable (CashOrders). The R-squared is 0.2900. The only coef-ficients that are statistically significant at the 1 percent level are the proportion of immigrants not from Latin America (with a coefficient estimate of –10.9114) and median age (0.1413). This suggests that areas with a higher proportion of immi-grants from regions other than Latin America tend to use fewer $5 bills, and neighborhoods with older populations tend to hold more cash.
The second column contains regres-sion results using the log of $20 bills per capita. In this regression, the following coefficients are statistically significant: the log of median household income at the 10 percent level (with a coefficient estimate of 3.2890), the proportion of foreign-born residents not from Latin America at the 1 percent level (–7.0775), and the crime index at the 5 percent level (0.2261).
The third column, the focus of our regression analysis, contains results us-ing CashOrders equal to the log of $100 bills per capita as the dependant variable. These results are strikingly different from those using the log of $5 bills per capita and the log of $20 bills per capi-ta. The coefficient on Latin American immigrants is positive and significant for $100 bills—a result that supports our hypothesis that this group demands more $100 bills than both native-born residents and immigrants from regions other than Latin America. The coeffi-
cient is 3.9110 and is significant at the 5 percent level. Moreover, the economic implication of this finding is significant; a one standard deviation increase in the percentage of Latin American immigrants increases the demand for $100 bills by 42 percent. Converting these semi-elasticity results to dollars, the coefficient repre-sents an average holding of $266 per capita per year for Latin American immigrants. A similar result (not shown in the table) for 2004 of $329 gives us an aver-age holding of about three extra $100 bills for each Latin American immigrant.
Several other coefficients are statistically signifi-cant in this regression as well. The number of money transmitting firms is positive and statistically signifi-cant (8.3612) at the 10 percent level, suggesting that in neighborhoods with a greater number of money
income, attendance at tourist attractions per capita, proportion of residents with college education (of those 25 years and older), crime index, and propor-tion of residents who rent, which is also interacted with the log of median income. The regression coeffi-cients are represented by a, ß1, and ß2 and the vector, B3, in the equation.
Empirical resultsTable 8 contains our regression results. We find
highly statistically significant results for the regressions using the log of $100 bills per capita, but less signifi-cant results for the other currency breakdowns (statis-tical significance levels are noted in the table). The first column of results in table 8 lists our results for the regression using the log of $5 bills per capita as

1� �Q/�007, Economic Perspectives
TaBlE �
Regression results from equation 1
Logof Logof Logof Logofall $5bills $20bills $100bills denominations percapita percapita percapita percapita Ratio of workers/residents –0.0941 0.2742 –0.0538 0.3605 (0.1413) (0.3517) (0.1936) (0.2300) Automatic teller machines per capita 168.4424 336.9934 144.7178 54.6092 (132.5731) (269.1874) (173.6580) (178.5395)
Money transmitters per capita –6.0245 –7.9953 8.3612* 5.5580 (4.0282) (5.6453) (4.5289) (3.9914)
Payday lenders per capita 0.4495 0.2100 0.1198 –0.7994 (2.4617) (3.2977) (2.7129) (2.0543)
Median age 0.1413*** 0.0351 0.1473*** 0.0868** (0.0391) (0.0516) (0.0478) (0.0400)
Log of median household income 2.3523 3.2890* 3.7920*** 3.0254** (1.5101) (1.8717) (1.3639) (1.2223)
Proportion of Latin American immigrants 0.7273 –0.4011 3.9110** 1.2131 (1.9928) (1.9181) (1.7138) (1.5443)
Proportion of immigrants not from Latin America –10.9114*** –7.0775*** –6.2651*** –7.4823*** (1.6754) (2.1212) (1.6547) (1.5580)
Attendance at tourist attractions per capita 0.0017 –0.0073 0.0009 –0.0053* (0.0022) (0.0045) (0.0022) (0.0029)
Proportion of college educated (≥ 25 years old) –2.2807 –3.6899 –4.3087** –3.0888* (1.7597) (2.2636) (1.7944) (1.6041)
Crime index 0.1102 0.2261** –0.0425 0.1133 (0.0848) (0.1085) (0.0789) (0.0823)
Proportion of rented housing units 2.6449 –7.2145 38.6101*** 11.0544 (13.6320) (17.7830) (13.4560) (11.3529)
Proportion of rented housing units × Log of median household income 0.0661 0.8600 –3.2647*** –0.7287 (1.2253) (1.5971) (1.2019) (1.0167)
Constant –29.2618* –33.1942 –41.8754*** –30.9275** (16.7418) (20.9298) (15.3209) (13.7003) Number of observations 158 173 169 175
R-squared 0.2900 0.1945 0.1953 0.2059
* Significant at the 10 percent level. ** Significant at the 5 percent level.*** Significant at the 1 percent level.Notes: Standard errors are in parentheses. The dependent variables ($5 bills, $20 bills, $100 bills, and all denominations) are logged values per capita. We use ordinary least squares with robust errors (White-corrected standard errors).
transmitting firms, residents tend to demand more $100 bills. Presumably this behavior reflects the ac-cumulation of cash to make periodic remittances to the home country.
Median age is positive and significant (0.1473) at the 1 percent level, a result that implies that older
residents tend to hold more $100 bills. This could re-flect a legacy of distrust of the banking system, because the residents themselves or their immediate family members experienced losses at banks in the past.
The log of the median household income is posi-tive and significant (3.7920) at the 1 percent level,

17Federal Reserve Bank of Chicago
implying that higher income earners tend to hold more $100 bills. The proportion of college educated, however, is negative and significant (–4.3087) at the 5 percent level, which we interpret as meaning that more education leads them to utilize other payment methods. The coefficient on rented housing units is positive and significant, while the coefficient on the interaction term between rented housing units and the log of median household income is negative and sig-nificant (both at the 1 percent level), with the overall net effect of the two terms being positive. We infer from this result that the demand for $100 bills in neighbor-hoods with a greater proportion of rental units is higher because some proportion of those tenants will pay their rent in cash, especially in lower-income neighborhoods. This result is consistent with our hypothesis that demand for cash will be greater in neighborhoods with higher proportions of lower-income residents and rental units.
The fourth column contains results similar to those using the log of $100 bills per capita; it lists the re-gression coefficients using the log of the value of all denominations of currency per capita as the depen-dent variable. Since $100 bills tend to make up the largest proportion of the “all denominations” variable, it is no surprise that the results for this variable parallel those for the log of $100 bills per capita. The R-squared statistic of this regression is 0.2059. The following variables are statistically significant: median age (with a positive coefficient), log of median household in-come (positive), the proportion of immigrants from regions other than Latin America (negative), atten-dance at tourist attractions (negative), and the propor-tion of college educated (negative).
The proportion of foreign-born residents not from Latin America is negative and significant in all four regressions, which implies, generally, that neighbor-hoods with a greater percentage of foreign-born resi-dents who are not from Latin America demand less currency, all else being equal. There are a number of possible explanations. It could be that such foreign-born residents are more likely to have bank accounts and conduct transactions using electronic payment methods and less currency. We will explore this issue in future research.
To check for robustness, we also explore the de-mand for currency among two other groups, African Americans and Polish immigrants. Currency demand may be different for African Americans than other na-tive-born residents because many African Americans remain unbanked—an estimated 46 percent of them, according to the SIPP (see table 5, p. 9). Moreover, a recent study finds that both Latin Americans and
African Americans perceive that they do not have sufficient income to justify having a bank account.57 If this is true, African Americans should hold more cash. We test this hypothesis. We find that African Americans demand slightly more $20 bills than other residents, though this result is relatively weak (signif-icant at only the 10 percent level). We find no difference in the demand for currency for any other denomination for African Americans relative to other native-born residents. Next, we examine currency demand among Polish immigrants. We find that the demand for cur-rency among Polish immigrants is similar to that of other foreign-born non-Latino residents and has the opposite sign to that for Latin American immigrants. This result might suggest that Polish immigrants have a faster rate of assimilation than Latin American im-migrants do with regard to banking activities.
We interpret our regression results, specifically those using $100 bills, as directly bearing on the ob-stacles to financial access that Latin American immi-grants face and/or their reluctance to open and maintain bank accounts. Moreover, these results may tell us more about portfolio holdings than the traditional transac-tion demand for money. Presumably the $5 and $20 denominations matter more than the $100 denomina-tion for many day-to-day smaller-scale transactions, while the $100 bills are primarily used as a store of wealth, in part because some retail outlets will not ac-cept them in exchange for goods or services. Thus, the significant statistical finding for the $100 denomina-tion for immigrants is suggestive of wealth accumula-tion in this denomination. For recent immigrants, the two important uses for $100 bills are for wired remit-tances (through such vehicles as Western Union), which are often done monthly, and for in-person cash remit-tances, which are often done on a yearly basis. Other important uses include paying rent and large bills.
Conclusion
In this article, we examine the demand for cash (namely, $5 bills, $20 bills, and $100 bills) among Latin American immigrants. As a result of their back-ground and obstacles to obtaining and using deposit accounts at financial institutions, a larger portion of Latin American immigrants (compared with native-born residents and foreign-born non-Latino residents) appear to hold the cash they acquire rather than de-positing it in a transaction account. We investigate to what degree Latin American immigrants hold more cash than other population groups by examining neigh-borhoods (by zip codes) with high densities of Latin American immigrants and testing whether there is a significant increase in cash usage in those locations.

1� �Q/�007, Economic Perspectives
We find that the demand for $100 bills is greater in areas with high concentrations of foreign-born Latin Americans. Our results suggest that Latin American immigrants are holding these bills as a store of value, since the convenience of this large denomination in day-to-day transactions is limited.
Our study adds to the sizable literature on the un-banked population in the United States. Generally, these studies describe characteristics of those who are unbanked. They are, on average, more likely to have a lower income, lower net worth, and lower level of education than the general population; also, the un-banked are less likely to own a home and are more likely to be a member of a minority race and be for-eign-born. Our study complements this literature; it provides some evidence that unbanked Latin Ameri-can immigrants may store their wealth in $100 bills. This behavior is not surprising. Many foreign-born residents from Latin America in the United States were familiar with the U.S. currency before arriving; they see U.S. bank notes as an attractive brand that holds its value (unlike some currencies that have experienced dramatic inflation).
Transaction costs associated with getting a bank account, language barriers, and general distrust of
banking systems all contribute to Latin American im-migrants’ predisposition to accumulate wealth in the form of cash. To move these immigrants into the for-mal financial sector requires overcoming these barriers and transaction costs. A sense of trust in banks must be instilled among Latin American immigrants. This might be achieved through banks providing a similar set of products and services to those offered by fringe institutions (and with which immigrants are familiar), at attractive prices. Banks are beginning to realize the importance of encouraging Latin American immi-grants to establish relationships with them, and some have established check-cashing or remittance (money transfer) services, though, as we noted earlier, they have not yet made significant inroads into this market.58
At the outset, we raised the question of whether the behavior of this immigrant group and, in particu-lar, the rapidly growing number of undocumented workers from Mexico and Central America might lie behind the recent increase in real per capita domestic holdings of currency in the U.S. With the data we an-alyze in this article, we cannot answer this question for the entire country. However, our study of the Chicago metro area suggests that this topic warrants deeper investigation.
1Gleick (1996).
2Economist Newspaper Limited (2007); Moore (1965); and Jovanovic and Rousseau (2002).
3The check infrastructure has already witnessed such disruptions.
4Suro et al. (2004).
5This shrinkage is less mysterious if one recognizes that in 1956 the largest denomination was a $10,000 note, while in 2006 it was a $100 note. For 2006, the calculation assumes that the average worker works 215 days a year.
6American Bankers Association and Dove Consulting (2005), table 1.11a. The survey reported 45.4 percent of respondents used cash less often, while just 16.2 percent of respondents used cash more often.
7American Bankers Association and Dove Consulting (2005), table 1.11c.
8Ibid., table 1.11b.
9Lindsey (1994–95).
10Currency demand rose in the year and a half preceding the date change. When no disruption occurred in financial systems across the globe around Y2K, households shed some of the additional precautionary cash balances they had acquired relatively quickly. This latter action reduced the ratio temporarily.
11For a discussion of these estimates, see Bach (1997) and Porter and Judson (1996).
NOTES
12See Porter and Judson (1996) and Judson and Porter (2004).
13See Baumol (1952) and Tobin (1956).
14If currency accumulates over longer periods until it is used for re-mittances or for precautionary expenditures, the pattern will also follow a saw-tooth pattern, but with higher peaks and sharper drop-offs.
15Cagan (1958).
16See, for example, Porter and Bayer (1989), Porter and Weinbach (1999), and Judson and Porter (2004).
17A basic difficulty is that the sign on crime in the demand for cur-rency regression is not obvious a priori. If criminals use currency to the exclusion of other payment methods, an increase in criminal activity may be associated with an increase in currency. The effect of such an increase on noncriminal elements depends on the nature of the crime. It is generally believed that in countries with relative-ly low rates of crime like Japan and Switzerland, cash holdings tend to be larger. However, one cannot rule out the possibility that an increase in violent crime might lead to some increase in curren-cy holdings held merely to placate erstwhile robbers.
18Chicago has been an important gateway for the Mexican commu-nity into the upper Midwest for over 125 years.
19Massey and Espinosa (1997).
20To minimize the negative effect of inflation on the purchasing power of money, individuals have to spend time and effort protect-ing the value of their nominal assets—wearing out their shoes on the way back and forth to the bank. Economists use the shorthand “shoe leather” costs to describe these “brokerage” fees.

1�Federal Reserve Bank of Chicago
21Mulligan and Sala-i-Martin (2000).
22See the U.S. Census Bureau’s 2005 American Community Survey.
23Borjas and Katz (2005), p. 3.
24These series are from Passel (2005) with his estimate shown for 2010.
25Suro and Singer (2002).
26Paral and Norkewicz (2003).
27The source of data is the 2000 U.S. Census. For this reason, we concentrate our study on the Chicago area. Of the 12 Federal Reserve Districts, five have a significant Latino presence: Atlanta, Chicago, Dallas, Richmond, and San Francisco. But several of the cash offices serving these Districts also represent significant trans-shipment locations for international shipments into and out of the United States. This international dimension confounds any analysis of local currency orders, particularly for cash offices in New York, Miami, and San Francisco and three Texas offices (El Paso, San Antonio, and Houston) in the Dallas Federal Reserve District. See Judson and Porter (2004) for panel data regression results that in-clude and exclude various offices from currency demand specifications.
28A transaction account is defined as a savings or checking account.
29The SIPP estimate of the unbanked among all U.S. born is 17 per-cent (about twice as high as the Federal Reserve Board’s 2000 Survey of Consumer Finances). This disparity arises because the SIPP pur-posely attempts to sample a higher proportion of respondents in lower-income categories.
30Bucks, Kennickell, Moore (2006). Other reasons cited (with less than 10 percent frequency) were as follows: cannot manage a checking account, find the minimum balance is too high, do not want an account, and have credit problems.
31As a result of the geographic isolation in Mexico, with innumera-ble mountain valleys separating native groups, a number of distinct dialects and/or languages emerged. It is estimated that around 10 percent of the Mexican population speaks one of these indigenous Indian languages. See, for example, www.houstonculture.org/ mexico/ling.html.
32Orozco (2004).
33Suro et al. (2004).
34See Porter and Judson (1996), table 1, and U.S. Department of the Treasury, Board of Governors of the Federal Reserve System, and U.S. Secret Service (2003), table 3.3.
35Massey and Espinosa (1997). Merriam-Webster’s online diction-ary defines a coyote as “one who smuggles immigrants into the United States.”
36Inter-American Development Bank and Multilateral Investment Fund (2005). Countries included are: Argentina, Belize, Bolivia, Brazil, Colombia, Costa Rica, Dominican Republic, Ecuador, El Salvador, Guatemala, Guyana, Haiti, Honduras, Jamaica, Mexico, Nicaragua, Panama, Paraguay, Peru, Suriname, Trinidad and Tobago, Uruguay, and Venezuela.
37Suro et al. (2004).
38Orozco (2004).
39Detailed remittance information is available from the Inter-American Development Bank; see www.iadb.org/mif/remittances/usa/INDEX.cfm?language=en&parid=2&item1id=2&item2id=2.
40Amuedo-Dorantes, Bansak, and Pozo (2004).
41The Mexican immigrant neighborhoods in Chicago also include some second- and third-generation Latin American residents, who may also tend to hold more currency as payment patterns change slowly over time.
42Ibarraran and Lubotsky (2007).
43Ibid., p. 32.
44Correspondent banks generally perform services for other banks (such as check clearing, currency, and courier services). The corre-spondents give these smaller banks access to financial markets to which they might not otherwise have entry (such as the foreign ex-change or derivatives markets).
45To test whether the elimination of these institutions creates any direct bias in our empirical tests, we check whether the location of the community banks in our sample is correlated with the share of Latin American immigrants. The two series are uncorrelated.
46Paulson et al. (2006).
47Ibid.
48Amuedo-Dorantes, Bansak, and Pozo (2004).
49See American Bankers Association and Dove Consulting (2005), table 3.6a, which shows that of those with an annual income of less than $40,000, 10.6 percent self-report paying their rent or mortgage with cash, compared with 4.1 percent of those with an annual in-come of $40,000 to $99,999 and 0.9 percent of those with an annual income of $100,000 or more.
50Suro et al. (2004).
51This information can be found at www.chicagotraveler.com/ chicagos-largest-attractions.htm.
52Judson and Porter (2004) find implicit evidence for this at the cash office level.
53See www.fbi.gov/ucr/05cius/. The crime index includes violent crimes (murder, forcible rape, robbery, and aggravated assault) and property crimes (burglary, larceny-theft, motor vehicle theft, and arson). This FBI index reflects actual crime. It is therefore only in-directly an index of the risk of falling victim to crime. We assume that currency holders gauge the risk that they will encounter crime by the past experience in the neighborhood. We obtained these data by zip code at http://realestate.yahoo.com/Neighborhoods.
54The Mexican immigrant neighborhoods in Chicago will also in-clude some second- and third-generation Latinos, who may also tend to hold more currency as payment patterns change slowly over time. These numbers are drawn from the 2000 U.S. Census, which was conducted in the midst of the most recent immigration boom from Mexico and Central America. As a result, it is quite possible that the next U.S. Census will reveal higher concentra-tions of Latinos than shown here.
55At 6 percent, Illinois ranks ninth in foreign-born Latin American residents, following California (15 percent), Florida (12 percent), Texas (10 percent), New York (10 percent), Nevada (10 percent), Arizona (9 percent), New Jersey (8 percent), and New Mexico (just over 6 percent). See the 2000 U.S. Census.56The $2 denomination still exists but is used very infrequently. There are about seven times as many $5 bills as $2 bills in circulation.
57Seidman, Hababou, and Kramer (2005).
58In particular, the substitution of prepaid cards for currency in the immigrant community may also hold some promise. Prepaid cards are cards that are purchased (say, with cash) and can be used on the existing card networks in the United States and elsewhere, just as debit cards and credit cards are used (Chakravorti and Lubasi, 2006).

�0 �Q/�007, Economic Perspectives
REFERENCES
American Bankers Association and Dove Consulting, 2005, 2005/2006 Study of Consumer Payment Prefer-ences, report, October, Washington, DC.
Amuedo-Dorantes, Cataline, Cynthia Bansak, and Susan Pozo, 2004, “On the remitting patterns of im-migrants: Evidence from Mexican survey data,” pre-sentation at the conference, Payments in the Americas, Federal Reserve Bank of Atlanta, October 7, avail-able at www.frbatlanta.org/news/CONFEREN/ payments04/Amuedo-Dorantes.pdf.
Bach, Christopher L., 1997, “U.S. international transactions, revised estimates for 1974–96,” Survey of Current Business, July, available at www.bea.gov/scb/pdf/internat/bpa/1997/0797bop.pdf.
Baumol, William J., 1952, “The transactions demand for cash: An inventory-theoretic approach,” Quarterly Journal of Economics, Vol. 66, No. 4, November, pp. 545–556.
Borjas, George J., and Lawrence F. Katz, 2005, “Evolution of the Mexican-born work force in the United States,” National Bureau of Economic Research, working paper, No. 11281, April.
Bucks, Brian K., Arthur B. Kennickell, and Kevin B. Moore, 2006, “Recent changes in U.S. family finances: Evidence from the 2001 and 2004 Survey of Consumer Finances,” Federal Reserve Bulletin, Board of Governors of the Federal Reserve System, Vol. 92, March 22, pp. A1–A38.
Cagan, Phillip, 1958, “The demand for currency rel-ative to the total money supply,” Journal of Political Economy, Vol. 66, No. 4, August, pp. 303–328.
Chakravorti, Sujit, and Victor Lubasi, 2006, “Payment instrument choice: The case of prepaid cards,” Economic Perspectives, Federal Reserve Bank of Chicago, Vol. 30, No. 2, Second Quarter, pp. 29–43.
Economist Newspaper Limited, 2007, “The end of the cash era,” Economist, Vol. 382, No. 8516, February 17–23, p. 13.
Gleick, James, 1996, “The end of cash,” New York Times Magazine, June 16.
Ibarraran, Pablo, and Darren Lubotsky, 2007, “Mexican immigration and self-selection: New evi-dence from the 2000 Mexican Census,” in Mexican Immigration to the United States, George Borjas (ed.), Chicago: University of Chicago Press, forthcoming.
Inter-American Development Bank and Multilateral Investment Fund, 2006, Remittances 2005: Promot-ing Financial Democracy, report, Washington, DC, March.
Jovanovic, Boyan, and Peter Rousseau, 2002, “Moore’s law and learning by doing,” Review of Economic Dynamics, Vol. 5, pp. 346–375.
Judson, Ruth A., and Richard D. Porter, 2004, “Currency demand by Federal Reserve cash office: What do we know?,” Journal of Economics and Business, Vol. 56, No. 4, July–August, pp. 273–285.
Lindsey, Lawrence B., 1994–95, “America’s most ignored export,” Durell Journal of Money and Banking, Vol. 6, Winter, pp. 2–5.
Massey, Douglas S., and Kristin E. Espinosa, 1997, “What’s driving Mexico–U.S. migration? A theoretical, empirical, and policy analysis,” American Journal of Sociology, Vol. 102, No. 4, January, pp. 939–999.
Moore, Gordon E., 1965, “Cramming more compo-nents onto integrated circuits,” Electronics Magazine, Vol. 38, No. 8, April 19.
Mulligan Casey B., and Xavier Sala-i-Martin, 2000, “Extensive margins and the demand for money at low interest rates,” Journal of Political Economy, Vol. 108, No. 5. October, pp. 961–991.
Orozco, Manuel, 2004, “The remittance market-place: Prices, policy, and financial institutions,” Pew Hispanic Center, report, June.
Paral, Rob, and Michael Norkewicz, 2003, The Metro Chicago Immigration Fact Book, Chicago: Roosevelt University, Institute for Metropolitan Affairs, June.
Passel, Jeffrey S., 2005, “Unauthorized migrants: Numbers and characteristics,” Pew Hispanic Center, report, June 14.

�1Federal Reserve Bank of Chicago
Paulson, Anna, Audrey Singer, Robin Newberger, and Jeremy Smith, 2006, Financial Access for Im-migrants: Lessons from Diverse Perspectives, Federal Reserve Bank of Chicago and Brookings Institution, report, May.
Porter, Richard D., and Amanda Bayer, 1989, “Monetary perspective on underground economic ac-tivity in the United States,” in The Underground Economies: Tax Evasion and Information Distortion, Edgar L. Feige (ed.), Cambridge, UK: Cambridge University Press.
Porter, Richard D., and Ruth Judson, 1996, “The location of U.S. currency: How much is abroad?” Federal Reserve Bulletin, Board of Governors of the Federal Reserve System, Vol. 82, October, pp. 883–903.
Porter, Richard D., and Gretchen Weinbach, 1999, “Currency ratios and U.S. underground economic activi-ty,” Economic Letters, Vol. 63, No. 3, June, pp. 355–361.
Seidman, Ellen, Moez Hababou, and Jennifer Kramer, 2005, A Financial Services Survey of Low- and Moderate-Income Households, Center for Financial Services Innovation, report, July.
Singer, Audrey, 2004, “The rise of new immigrant gateways,” Living Cities Census Series, Brookings Institution, Center on Urban and Metropolitan Policy, report, February.
Suro, Roberto, Sergio Bendixen, B. Lindsay Lowell, and Dulce C. Benavides, 2004, “Billions in motion: Latino immigrants, remittances, and bank-ing,” Pew Hispanic Center and Multilateral Investment Fund, report, November.
Suro, Roberto, and Audrey Singer, 2002, “Latino growth in metropolitan America: Changing patterns, new locations,” Survey Series, Census 2000, Brook-ings Institution, Center on Urban and Metropolitan Policy, and Pew Hispanic Center, report, July.
Tobin, James, 1956, “The interest elasticity of the transactions demand for cash,” Review of Economics and Statistics, Vol. 38, No. 3, August, pp. 241–247.
U.S. Department of the Treasury, Board of Governors of the Federal Reserve System, and U.S. Secret Service, 2006, The Use and Counterfeiting of United States Currency Abroad, Part 3, report, Washington, DC: U.S. Department of the Treasury, September.
__________, 2003, The Use and Counterfeiting of United States Currency Abroad, Part 2, report, Washington, DC: U.S. Department of the Treasury, March.