after the smart grid, what's...
TRANSCRIPT

After the Smart Grid,
What's Next?
January 20, 2016

Today’s Presenters
Eva BurenManaging Director
Accenture Energy
Consumer Services
Robert StewartMgr. Advanced Technology
& New Business
Pepco Holdings, Inc.
Nathan ShannonDeputy Director
Smart Grid Consumer
Collaborative

Agenda
3
Rob Stewart, Pepco Holdings
Question and Answer Session
Eva Buren, Accenture
Introduction and Audience Poll

What do Consumers Want from the Smart Grid?

Speaker #1
Name Background
Robert Stewart Manager of Advanced Technology & New Business at Pepco Holdings, Inc.
• Leads an effort that is responsible for further developing and managing PHI’s approach to evaluating and deploying advanced technologies and concepts for application on the electric system
• Recently given responsibility for PHI’s Emergency Preparedness organization responsible for all aspects of PHI’s emergency preparedness, including maintenance of emergency response plans, drill oversight, and the relationship with external emergency management agencies
• Graduate of the University of South Florida with a B.S. in Electrical Engineering and M.S. in Electrical Engineering (Power Systems)
• Holds several patents associated with the connection of an on-site power source to the electric meter
• Published several papers on electric vehicles and the analysis of electric vehicle data

After the Smart Grid, What’s Next?
PHI’s Plans for Smart Grid
Smart Grid Consumer Collaborative
Presented by: Rob Stewart
January 20, 2016

7
Pepco Holdings, Inc. Quick Facts
Incorporated in 2002
Service territory:
8,340 square miles
Customers served
• Atlantic City Electric:
– 545,000 – electric
• Delmarva Power:
– 506,000 – electric
– 126,000 – natural gas
• Pepco:
– 801,000 – electric
Total population served:
5.6 million
8
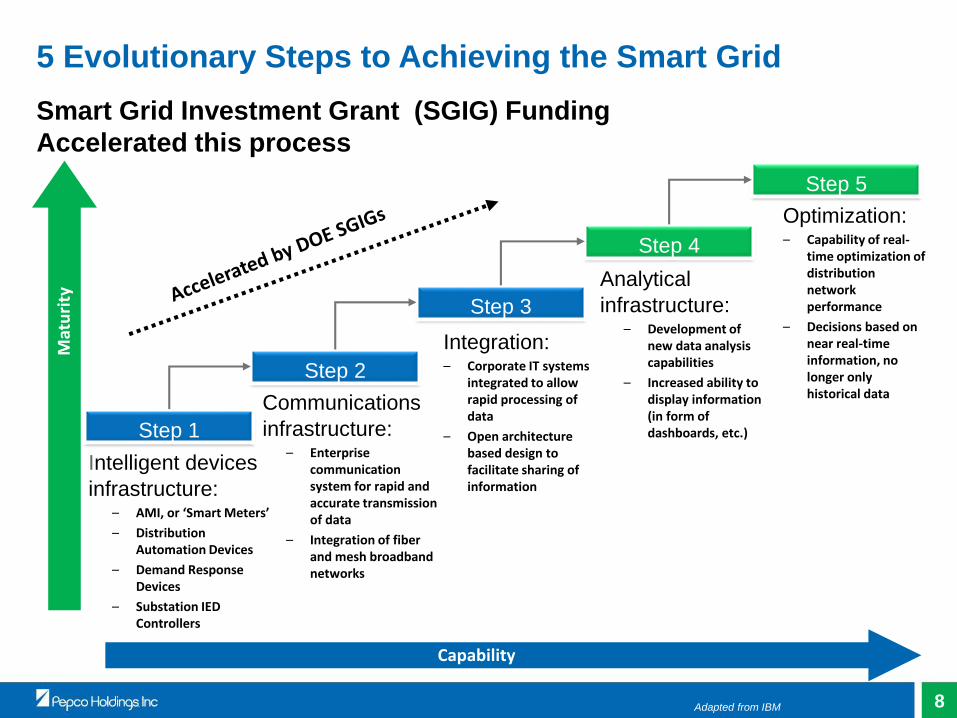
5 Evolutionary Steps to Achieving the Smart Grid
Smart Grid Investment Grant (SGIG) Funding
Accelerated this process
Mat
uri
ty
Capability
Step 1
Step 2
Step 3
Step 4
Step 5
Optimization:– Capability of real-
time optimization of distribution network performance
– Decisions based on near real-time information, no longer only historical data
Analytical
infrastructure:– Development of
new data analysis capabilities
– Increased ability to display information (in form of dashboards, etc.)
Integration:– Corporate IT systems
integrated to allow rapid processing of data
– Open architecture based design to facilitate sharing of information
Intelligent devices
infrastructure:– AMI, or ‘Smart Meters’
– Distribution Automation Devices
– Demand Response Devices
– Substation IED Controllers
Communications
infrastructure:– Enterprise
communication system for rapid and accurate transmission of data
– Integration of fiber and mesh broadband networks
Adapted from IBM

9
Current Status – By The Numbers
Region Installed Activated
DPL Electric >99% >99%
DPL Gas >97% >95%
Pepco DC >99% >99%
Pepco MD >99% >99%
DPL Maryland >99% >99%
Region Unresolved/Opt Outs
Delaware Electric* 0
Delaware Gas* 3.2 % (4369)
Pepco DC* 1 % (3951)
Pepco Maryland
Hard to access
.2 % (1070)
1268
DPL Maryland
Hard to access
.5 % (1346)
6
*Hard to access – no opt out

10
Smart Grid Roadmap
Q1 Q2 Q3
2014
1. Customer
Empowerment
4.. Distribution &
Transmission
Automation
Infrastructure
6. Data
Analytics
2015 2016 2017 2018 2019 2020
Dynamic Pricing
Physical and Cyber Security Requirements
Q4 Q1 Q2 Q3 Q4 Q1 Q2 Q3 Q4 Q1 Q2 Q3 Q4 Q1 Q2 Q3 Q4 Q1 Q2 Q3 Q4 Q1 Q2 Q3 Q4 Q1 Q2 Q3 Q4
3. Demand
Response
Infrastructure
5. Integrated
Systems
AMI meter Installation & Activation, Remote Connect / Disconnect, Conservation Voltage Reduction (CVR)
Development of enhanced Asset Based Analysis via Dynamic Control Software , Real Time Analysis in line with planned system integration
Demand Response Infrastructure
Solution One
Further sophistication of OMS / GIS /DMS/EMS/DR
Related Distributed Resource Energy Management Functionality
In Progress
Planned Not Started
Home area network and In Home Displays
Solar Tariff, Micro Grid Tech, Community Solar
Aggregated DR programsSpecific appliance targetingOptimizing charging for large variable loadsEnhanced Demand Response Forecasting and Optimization
2021
Priority Considerations
Pilot
Critical Peak Pricing
Expansion of NOC
2. Distributed
Energy Resource
Management
URD Fault Detection System (FDS), Network Remote Monitoring System (RMS)
On-line transformer dissolve gas analysis (DGA), Automatic Sectionalizing & Restoration (ASR)
Identifies Smart Inverter R&D
Long Term Potentials
Revenue Protection, Volt/Var Mgmt & Control. Reliability Analytics, Enhanced Outage Management, Enhanced DR, Renewable / DG Integration
Grid Analytics, System Performance, Customer& Load Analytics
See detailed roadmap in appendix
7. Security
Customer Focused
Operational
Medium Term Considerations
DR Control System
Med Term Analytics
Long Term AnalyticsPartial List of Activities

11
Critical Peak Rebate Programs
Customer feedback: 76% said they would participate in the future
Peak Energy Savings Credit
2013 and 2014 Results
Total Reduction (KWh) 7 million KWh
Bill Credits $10 million
Average Rebate $4.00
% of Customers Participating 65% - 85%
Pepco MD & DPL DE712,000 eligible customers

12
Smart Grid - Current Status
Step 1: Intelligent devices
infrastructure
Step 2: Communications
infrastructure
Step 3: Integration
Step 4: Analytical
infrastructure
Step 5: Optimization
Focus is shifting from installing the infrastructure to implementing new uses
for the customer and integrating into operations
Technology is working as envisioned, designed and executed
• Over the air reads, outage detection and restoration notification
• Automatic sectionalizing and restoration
• Remote disconnect and reconnection
• Usage data available to customers
• Peak Energy Savings Credit– critical peak rebates
System performance meeting our expectations
Step 4 in our ongoing smart grid system journey

13
PHI Smart Grid 2.0 Prioritization Update - All Use Cases
Implementation Effort
Va
lue
Low High
Low
Hig
h FMSR/OFISR
Asset EnterpriseCustomer GridLoad Reliability VoltageWorkAnalytics Type
Potentially Defer
DeployQuick Hit
DA (incl SCADA)
Phase Balancing
Storm Prediction -
Real Time
System Re-Configuration Analysis
VVC
Customer Service & Call
Centre Performance
Enterprise Analytics
Materials Management
Customer Reliability &
Safety
Customer
Segmentation
Demand Response Control,
Fuse Checker, PV Checker
Demand Response Planning
AMI Operations & Meter Data
ManagementDG Analysis
Line Impedance/Matching
Network Cyber Security
Analysis
Protection (Loadability,
Sensibility, Duty)
Revenue Protection/
Energy Theft
State Estimation (SE)
Switching Schedule
& Safety
Asset Load Analysis
Distribution Load
Forecasting
Load Balancing
Load Profiling (inc l. DER)
Power/Load Flow Analysis
ASR Scheme
Analysis
Optimal Switch/
Recloser Placement
Reliability Analysis
Reliability Optimization
Storm Analysis
Vegetation Management
Voltage
Monitoring
Voltage Opt
CVRCap Bank
Design
Field Force
Performance
Work
Management
Outage Location
Load Shedding (LS)
DER Planning/Screening
Network Connectivity
Analysis
Secondary
Impedance
Contingency Analysis
SL – Energy Reduction (P)
SL – Failure Detection (P)SL – Remote Output (P)
Street Lighting
Asset AnalyticsTransient
Voltage
(P) - Pilot

14
Smart Grid - Next Steps for Operations
Conservation Voltage Reduction
• Using smart meter data, we can lower voltage without violating operating
standards
• Net effect to customers - lower energy consumption and total cost
High temperature at the meter
• Dispatch crews as a precaution when temperature exceeds
Measuring transformer loading
• Anticipate when a transformer approaches its operating limits
• Replace a transformer as a “planned” outage, not an “unplanned” outage
Theft detection (planned)
Focus is shifting from installing the infrastructure to implementing new uses
for the customer and improving operational efficiency

15
Conservation Voltage Reduction – Pepco MD & DPL MD
Pepco MD
• Implemented CVR of 1.5% on 18 Pepco MD substations, 192
feeders affecting about 162,200 customers DPL MD
DPL MD
• Implemented CVR of 1.5% on 12 DPL MD substations, 21 feeders
effecting 23,200 customers
Analysis to identify additional substations in-progress
Pepco will report out on the savings by the end of January

16
Transformer Overload
Conditions Identified
Preliminary Analytics on Distribution Transformers
Transformer Loading
Approaching 90% of
Max Capacity
• Potential overload condition identified.
• Drill down data analytics may identify
potential source of overload.
• Field assessment required to assess
transformer loading conditions.
Local Distribution System Impact
• Possible overload condition identified.
• Continuous monitoring required to
assess probability of future overloads.
No Overload
Conditions Identified • No signs of transformer overloading
identified.
• Continuous monitoring but no
immediate need for preventative
assessment.

17
MD EV Pilot ProgramCompleted 12/31/15
Established through MD Legislation for Demand Response
Demonstrated Passive and Active control for EV Charging
Over 90% of the customers charged off-peak
Included installation of 50 smart chargers
Performed active EVSE control in concert with Demand Response events
EPRI compiling and publishing results
38%
16%
19%
12%
15%
154 Total Participants
EV Only
EV Only Green
EV Only / SmartEVSE
EV Only / SmartEVSE Green
Whole HouseTOU

18
Current Status of NEM Customers – 21,998 Customers
& 319 MW’s
2009 2010 2011 2012 2013 2014 2015
ACE 1,063 1,636 2,708 3,860 5,189 6,850 10,381
DPL DE 465 585 758 949 1,191 1,653 2,698
DPL MD 67 104 181 313 445 679 1,270
PEPCO DC 103 271 517 784 1,124 1,450 2,165
PEPCO MD 215 441 676 1,134 1,626 2,310 5,484
0
500
1,000
1,500
2,000
2,500
3,000
3,500
4,000
4,500
5,000
5,500
6,000
6,500
7,000
7,500
8,000
8,500
9,000
9,500
10,000
10,500
11,000
NE
M C
US
TO
ME
RS
PHI NEM CUSTOMER COUNT

19
Activities Underway to Help Accommodate Increased
DER
Engaging Regulators and Public Officials: Engaging FERC, State public officials, DOE and other industry groups to
better understand the issues and work collaboratively on solutions
Collaborative R & D: Inverter technology, advanced voltage regulation control, penetration studies with a variety of
different partners. • Hosting Tests based on modeling Advanced Volt/VAR Control, smart inverters and
• AMI to monitor and provide control for small size inverters
• Implementing Cellular telemetry for systems over 2 MWs
• Integrating PV output data into Distribution Automation schemes
• Reviewing feasibility of online application and approval process
Modelling & Analytics: Advanced load flow being implemented, Distributed Energy
Resources Planning and Analytics department formed, technical and financial analysis of
Micro grids
DOE Sunrise Project
• Model-Based Analysis to simulate the impact solar has on the grid.
• This project is testing advanced voltage regulation strategies to find the most cost effective way to use existing and new equipment as penetration rates of DERs increases.
• It will model both autonomous and central controlled approaches.
• PHI is partnering with:
• Electrical Distribution Design (DEW software development/technical)
• Clean Power Research (solar Irradiance data)
• Rutgers University (economic analysis)
Control can be run against simulator or real system through
connection to SCADA
Office of Naval Research Smart Grid
Inverter (SGI) Project• Pilot using AMI data and
an algorithm from Silver
Spring to dynamically set
the power factor and
overall watts for inverters.

20
DOE Sunshot / ONRL Smart Grid Inverter (SGI) Project
Project Lead
Co-Utility Lead
Inverter Technology Lead
Co-Services Lead
Co-Utility Lead
Co-Services Lead
Co-Utility Lead
Technology Lead
Inverter Technology Provider
Inverter Testing Lead
The main objective to this project is to field deploy Smart Inverters that will communicate through Pepco’s
AMI Network to a central control application in an effort to validate that effective visibility and control can
mitigate the impacts of high penetration Solar on the distribution System.

21
Smart Streetlights SSN Streetlight Vision
• Pilot – Rockville
Service Center
• WaterShed
Municipal Interest
Enhanced functionality
• Remote Control
• Dimmable
• Revenue Grade Meter
• Day Burner Notification
• Group Management
AMI Network Backhaul

22
22
• Pepco Purchase of UMD WaterShed, Winner of the 2011
Solar Decathlon: Pepco is planning to relocate WaterShed
to the Rockville Service Center where it will serve as an
exploration center for smart grid benefits as well as a living
lab to continue to educate the community on the importance
of sustainability and renewable energy
• Additonal module to serve as the Exploration Center for
Smart Grid Benefits demonstration.
• Smart Grid Benefits
• AMI
• Home Area Network Demonstration
• Smart Appliances Testing
• EV Charging Management
• Solar Energy Integration and Management of Renewables
• Battery Energy Storage / Microgrid Demonstration
• PHI is working with the University of Maryland and others to
develop new and innovative curricula for middle and high school
students using WaterShed as a focal point.
• It is anticipated that WaterShed will be available to students and
the public for ongoing research and education for the foreseeable
future.
WaterShed – PHI Technology Exploration Center

23
Building the Grid for Tomorrows Needs
Customer adoption and participation are key drivers and
enablers
Smart Grid will move at the speed of perceived value
Interoperability and standardization are not spectator activities
Utilities will become “technology” companies
No longer the “best solutions” but rather iterations of “better
solutions”
Distributed generation is here to stay and growing fast
• High penetration solar, DG and microgrids will present new
challenges and opportunities
The Grid adds value for distributed resource capabilities
How will utilities, regulators and customers work together to create a fully
integrated, efficient and affordable grid for the future?

Speaker #2
Name Background
Eva Buren Managing Director at Accenture Energy Consumer Services• Has served clients across financial services, telecom, high tech,
government, retail, healthcare, and media & entertainment• Over the years, the customer impacts of smart meter
implementations and resulting customer care transformation opportunities have represented strong themes in Eva’s work
• Since 2005, focus has been on the utilities industry working with clients in the US, Canada, UK, Australia, and Brazil
• Graduate of Stockholm School of Economics in Sweden with a M.S. in Marketing and International Business
• Active contributor to Accenture’s annual New Energy Consumer Research program
• Holds a patent for contact center agent-to-supervisor optimization

After the Smart Grid,
What’s Next?
Webinar
January 20, 2016

Accenture’s New Energy Consumer research programOver six years of comprehensive and continuous research focused on energy consumers,
our results offer actionable insights into the preferences and values shaping the energy
marketplace
>60,000 consumers
surveyed in 26 countries
Survey of market trends and
priorities for 25 leading
utilities customer executives
In-depth analysis of
technology adoption in
10 major markets
26
>2,000 small and medium
businesses in 9 countries
Market insights and leading practices
from more than 80 leading energy
providers and over 40 cross-industry
providers
Copyright © 2016 Accenture All rights reserved.
27
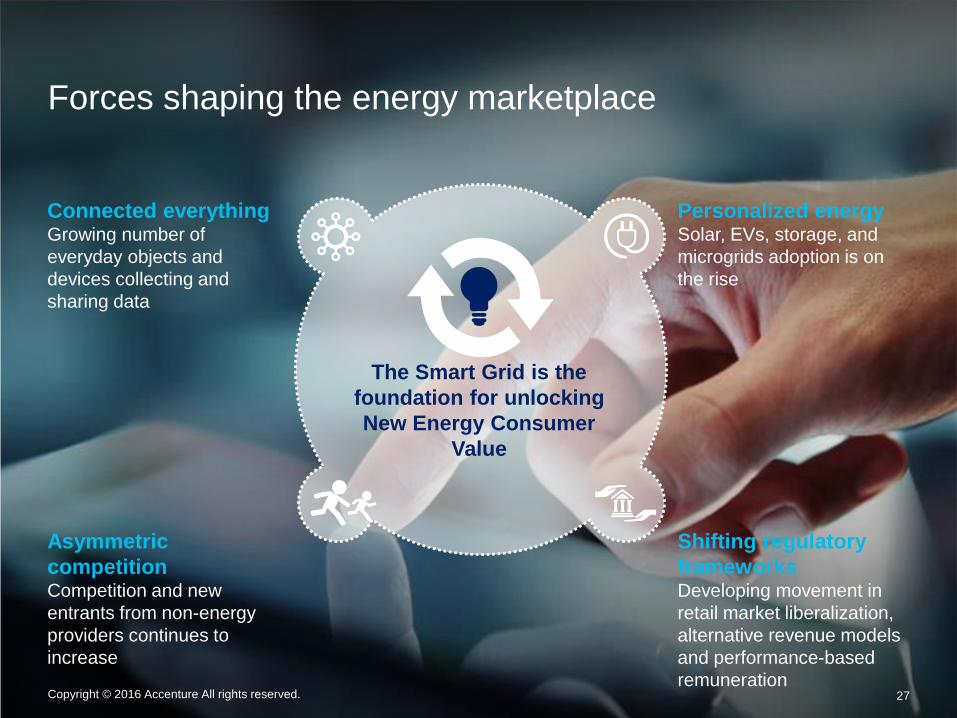
Forces shaping the energy marketplace
The Smart Grid is the
foundation for unlocking
New Energy Consumer
Value
Personalized energySolar, EVs, storage, and
microgrids adoption is on
the rise
Asymmetric
competitionCompetition and new
entrants from non-energy
providers continues to
increase
Connected everythingGrowing number of
everyday objects and
devices collecting and
sharing data
Shifting regulatory
frameworksDeveloping movement in
retail market liberalization,
alternative revenue models
and performance-based
remunerationCopyright © 2016 Accenture All rights reserved.

Three key themes of the New Energy Consumer
28Copyright © 2016 Accenture All rights reserved.
Unlock
Digital
Value
Extend
the Value
Proposition
Seize the
Digital
Energy
(R)evolution
72

29Copyright © 2016 Accenture All rights reserved.
Unlock digital value of new energy consumersDigitally engaged consumers offer more business value to energy providers. Energy providers have
much to gain by converting and retaining digital consumers.
more likely to sign up for automated home
energy management devices or services
more satisfied with
their energy provider
more trust in their
energy provider
more likely to
recommendtheir current energy provider
more likely to sign up for home energy
generation products
more likely to
participatein an energy management
program
more likely to sharetheir personal information
and energy usage
information
Non-digital channel users
Digital
channel users
6%
40%
45%
76%
69%
80%
35%
72%
41%
71%
37%
50%
37%67%
Digital channel users
Base: All US respondents

Consumers seek rewards and an effortless consumer experience
30Copyright © 2016 Accenture All rights reserved.
Which of the following would most encourage you to use digital channels (i.e., online
websites/mobile apps) for the majority of interactions with your energy provider?
Top three
None of these would encourage
you to use digital channels for
the majority of interactions with
your energy provider
Quick and convenient service from your energy
provider (e.g., responses to inquiries, outage
notifications)
Rewards such as points, coupons or
rebates
Access to exclusive offers from
your energy provider through
digital channels (e.g., free tickets
to a sporting event)
Recognition for your digital channel usage
from your energy provider (e.g., social media
or community mentions)
An online community with access to energy
experts19%
30%
48%49%
26%
15%
Base: All US respondents
74%

Home energy generation products Care for home energy devices
Warranty/financing for home energy devices Connected home products
31
Tipping Point - Expanding traditional customer valueEnergy providers have the opportunity to forge new paths to value by expanding their
product portfolio across home generation, battery storage, and connected home systems.
Copyright © 2016 Accenture All rights reserved.
55%
50%
55%
39%
51%
48%
2014 New Energy Consumer survey results2015 New Energy Consumer survey results
60%
46%
How interested are you in signing up for the following products and services if they were offered
by your energy provider?
Base: All US respondents

32
Offering convenience: The connected homeConsumers are seeking a single source for interconnected home services offerings that
address more aspects of their daily lives.
Copyright © 2016 Accenture All rights reserved.
A company specializing in connected
products and services
Energy
provider
Security
company74% 58% 45%
Consumers prefer the following providers when buying monitoring and control products and
services
of consumers are interested in bundles of
new products and services with electricity,
gas and/or water from their energy provider
*In the next 5 years
64%*
Source: Accenture, New Energy Consumer research program,
2014 consumer survey
Base: All US respondents

Type Examples
Data and Information
Services
Smart meter app
ENERGY VIKINGS
Home Management
Services
SmartHome solution
RWE
Energy Aggregator
Virtual power stations
FLEXITRICITY
Energy MarketplaceSharing economy platform
VANDEBRON
Customer Service
Platforms
Effortless digital experience
BRITISH GAS
Energy Optimizer
Energy trading platform
REPOSIT POWER
33
Energy platform of the futureAccenture sees a range of platform types emerging in energy consumer services.
Copyright © 2016 Accenture All rights reserved.
Sa
mp
le t
yp
es
of
en
erg
y p
latf
orm
s

Successfully building capabilities for the future requires
a staged approach to execution
34Copyright © 2016 Accenture All rights reserved.
Remove dissatisfiers and build a foundation of operational excellence
Create digital differentiation and drive self-service adoption
Build an insight driven customer experience
enabled through an ecosystem of partners
Build a customer and value focused
platform offering(s)
Get Lean
Go Digital
Be Connected
Grow Value

35Copyright © 2016 Accenture All rights reserved.
are Accenture clients
Accenture has approximately
373,000 people serving clients
in 120+ countries
Combining unmatched experience and specialized skills across more than 40 industries and all business functions –underpinned by the world’s largest delivery network – Accenture works at the intersection of business and technology to help clients improve their performance and create sustainable value for their stakeholders.
Accenture drives innovation to improve the way the world works and lives.
89of the Global
75%+of the Global
The company generated net revenues of
US$31.0 billion for the fiscal year ended Aug. 31, 2015
Accenture is a leading global professional services company, providing
a broad range of services and solutions in strategy, consulting, digital,
technology and operations.
Who is Accenture?

Thank you! You will receive a copy of todays slides to the email you
used to register
Eva BurenManaging Director
Accenture Energy
Consumer Services
Robert StewartMgr. Advanced Technology
& New Business
Pepco Holdings, Inc.
Nathan ShannonDeputy Director
Smart Grid Consumer
Collaborative