after mapping qc - github pages
TRANSCRIPT

After mapping QCRNA-seq data analysisJohan Reimegård | 13-May-2019

Reads
Reference
Mapping Mapped readsSTAR
genome.fa
mappedReads.bamreads.fastq.gz
Gene expression
Gene annotation:ref.bed / ref.gtf
Read QC- FastQC
Mapping statistics
Mapping QC- RseQC
Outlier detection,
sample swaps

Reads
Reference
Mapping Mapped readsSTAR
genome.fa
mappedReads.bamreads.fastq.gz
Gene expression
Gene annotation:ref.bed / ref.gtf
Mapping statistics

Mapping logs – mapping efficiency• Program specific how the output will be (STAR,
Bowtie, BWA, Tophat…)• Always gives: • % uniquely mapping – ideally around 90% for 100 bp
reads• % multi-mapping – will depend on read length• % unmapped – could indicate contaminations, adaptors
• Also statistics on:• Mismatches / indels• Splice junctions

Star log example• [johanr@rackham3 star]$ more sample12_Log.final.out
• Started job on | May 11 20:01:21
• Started mapping on | May 11 20:02:59
• Finished on | May 11 20:10:30
• Mapping speed, Million of reads per hour | 211.40
•
• Number of input reads | 26483380
• Average input read length | 202
• UNIQUE READS:
• Uniquely mapped reads number | 23584867
• Uniquely mapped reads % | 89.06%
• Average mapped length | 198.57
• Number of splices: Total | 15591437
• Number of splices: Annotated (sjdb) | 15442151
• Number of splices: GT/AG | 15453389
• Number of splices: GC/AG | 110331
• Number of splices: AT/AC | 13452
• Number of splices: Non-canonical | 14265
• Mismatch rate per base, % | 0.33%
• Deletion rate per base | 0.01%
• Deletion average length | 1.97
• Insertion rate per base | 0.01%
• Insertion average length | 1.36
• MULTI-MAPPING READS:
• Number of reads mapped to multiple loci | 838432
• % of reads mapped to multiple loci | 3.17%
• Number of reads mapped to too many loci | 5600
• % of reads mapped to too many loci | 0.02%
• UNMAPPED READS:
• % of reads unmapped: too many mismatches | 0.00%
• % of reads unmapped: too short | 7.73%
• % of reads unmapped: other | 0.03%
5

Hisat 2 log example• 13229276 reads; of these:• 13229276 (100.00%) were paired; of these:• 2258930 (17.08%) aligned concordantly 0 times• 10385753 (78.51%) aligned concordantly exactly 1 time• 584593 (4.42%) aligned concordantly >1 times• ----• 2258930 pairs aligned concordantly 0 times; of these:• 271241 (12.01%) aligned discordantly 1 time• ----• 1987689 pairs aligned 0 times concordantly or discordantly; of these:
• 3975378 mates make up the pairs; of these:• 2915792 (73.35%) aligned 0 times• 963693 (24.24%) aligned exactly 1 time• 95893 (2.41%) aligned >1 times• 88.98% overall alignment rate
6

Means that you can compare how welldifferent programs behaves on different samples
●
●
●●
●
●
●●
●
●
●
●
●
●
●
●●
● ●
●
●
●
●
●
●● ●
●
●
●
● ● ●
●
●
● ● ●●
●
●
● ● ●
●
● ●
● ●
●
●
● ● ●
●
●
●
● ● ●
●●
● ● ● ●●
●
● ● ●
●
● ●
●●
●
●
● ● ●
60
70
80
90
Cg4
a_KS
2C
g88_
14_K
S3C
g88_
44_K
S2C
g89_
16_K
S2C
g89_
3_KS
1C
g8c_
KS2
Cg8
f_KS
1C
g94_
6_KS
1C
r1G
R1_
2_KS
1C
r1G
R1_
2_KS
2C
r1G
R1_
2_KS
3C
r23_
9_KS
2C
r39_
1_TS
1_KS
1C
r75_
2_3_
KS1
Cr7
9_29
_ext
ra1
Cr8
4_21
_KS1
CrN
2256
1_KS
2In
ter3
_1In
ter4
_1_1
Inte
r4_1
_2In
ter4
_1_3
Inte
r4_1
_4In
ter5
_1In
tra6_
3In
tra7_
2_1
Intra
7_2_
2In
tra7_
2_3
Intra
8_2
species
Perc
ent p
rope
rly m
appe
d pa
ired
end
read
s
Colour●
●
●
StampySTARTophat2
Shape● Flower
Leaf
Compare mapping efficacy of different RNA−seq assemblers
C.rube
lla
hybrid
●
●
●●
●
●
●●
●
●
●
●
●
●
●
●●
● ●
●
●
●
●
●
●● ●
●
●
●
● ● ●
●
●
● ● ●●
●
●
● ● ●
●
● ●
● ●
●
●
● ● ●
●
●
●
● ● ●
●●
● ● ● ●●
●
● ● ●
●
● ●
●●
●
●
● ● ●
60
70
80
90
Cg4
a_KS
2C
g88_
14_K
S3C
g88_
44_K
S2C
g89_
16_K
S2C
g89_
3_KS
1C
g8c_
KS2
Cg8
f_KS
1C
g94_
6_KS
1C
r1G
R1_
2_KS
1C
r1G
R1_
2_KS
2C
r1G
R1_
2_KS
3C
r23_
9_KS
2C
r39_
1_TS
1_KS
1C
r75_
2_3_
KS1
Cr7
9_29
_ext
ra1
Cr8
4_21
_KS1
CrN
2256
1_KS
2In
ter3
_1In
ter4
_1_1
Inte
r4_1
_2In
ter4
_1_3
Inte
r4_1
_4In
ter5
_1In
tra6_
3In
tra7_
2_1
Intra
7_2_
2In
tra7_
2_3
Intra
8_2
species
Perc
ent p
rope
rly m
appe
d pa
ired
end
read
sColour
●
●
●
StampySTARTophat2
Shape● Flower
Leaf
Compare mapping efficacy of different RNA−seq assemblers
●
●
●●
●
●
●●
●
●
●
●
●
●
●
●●
● ●
●
●
●
●
●
●● ●
●
●
●
● ● ●
●
●
● ● ●●
●
●
● ● ●
●
● ●
● ●
●
●
● ● ●
●
●
●
● ● ●
●●
● ● ● ●●
●
● ● ●
●
● ●
●●
●
●
● ● ●
60
70
80
90
Cg4
a_KS
2C
g88_
14_K
S3C
g88_
44_K
S2C
g89_
16_K
S2C
g89_
3_KS
1C
g8c_
KS2
Cg8
f_KS
1C
g94_
6_KS
1C
r1G
R1_
2_KS
1C
r1G
R1_
2_KS
2C
r1G
R1_
2_KS
3C
r23_
9_KS
2C
r39_
1_TS
1_KS
1C
r75_
2_3_
KS1
Cr7
9_29
_ext
ra1
Cr8
4_21
_KS1
CrN
2256
1_KS
2In
ter3
_1In
ter4
_1_1
Inte
r4_1
_2In
ter4
_1_3
Inte
r4_1
_4In
ter5
_1In
tra6_
3In
tra7_
2_1
Intra
7_2_
2In
tra7_
2_3
Intra
8_2
species
Perc
ent p
rope
rly m
appe
d pa
ired
end
read
s
Colour●
●
●
StampySTARTophat2
Shape● Flower
Leaf
Compare mapping efficacy of different RNA−seq assemblers
●
●
●●
●
●
●●
●
●
●
●
●
●
●
●●
● ●
●
●
●
●
●
●● ●
●
●
●
● ● ●
●
●
● ● ●●
●
●
● ● ●
●
● ●
● ●
●
●
● ● ●
●
●
●
● ● ●
●●
● ● ● ●●
●
● ● ●
●
● ●
●●
●
●
● ● ●
60
70
80
90
Cg4
a_KS
2C
g88_
14_K
S3C
g88_
44_K
S2C
g89_
16_K
S2C
g89_
3_KS
1C
g8c_
KS2
Cg8
f_KS
1C
g94_
6_KS
1C
r1G
R1_
2_KS
1C
r1G
R1_
2_KS
2C
r1G
R1_
2_KS
3C
r23_
9_KS
2C
r39_
1_TS
1_KS
1C
r75_
2_3_
KS1
Cr7
9_29
_ext
ra1
Cr8
4_21
_KS1
CrN
2256
1_KS
2In
ter3
_1In
ter4
_1_1
Inte
r4_1
_2In
ter4
_1_3
Inte
r4_1
_4In
ter5
_1In
tra6_
3In
tra7_
2_1
Intra
7_2_
2In
tra7_
2_3
Intra
8_2
species
Perc
ent p
rope
rly m
appe
d pa
ired
end
read
s
Colour●
●
●
StampySTARTophat2
Shape● Flower
Leaf
Compare mapping efficacy of different RNA−seq assemblers
C.grandiflo
ra

More variation when using top hat 2 with default settings than when using STAR or Stampy with default setting
●
●
●●
●
●
●●
●
●
●
●
●
●
●
●●
● ●
●
●
●
●
●
●● ●
●
●
●
● ● ●
●
●
● ● ●●
●
●
● ● ●
●
● ●
● ●
●
●
● ● ●
●
●
●
● ● ●
●●
● ● ● ●●
●
● ● ●
●
● ●
●●
●
●
● ● ●
60
70
80
90
Cg4
a_KS
2C
g88_
14_K
S3C
g88_
44_K
S2C
g89_
16_K
S2C
g89_
3_KS
1C
g8c_
KS2
Cg8
f_KS
1C
g94_
6_KS
1C
r1G
R1_
2_KS
1C
r1G
R1_
2_KS
2C
r1G
R1_
2_KS
3C
r23_
9_KS
2C
r39_
1_TS
1_KS
1C
r75_
2_3_
KS1
Cr7
9_29
_ext
ra1
Cr8
4_21
_KS1
CrN
2256
1_KS
2In
ter3
_1In
ter4
_1_1
Inte
r4_1
_2In
ter4
_1_3
Inte
r4_1
_4In
ter5
_1In
tra6_
3In
tra7_
2_1
Intra
7_2_
2In
tra7_
2_3
Intra
8_2
species
Perc
ent p
rope
rly m
appe
d pa
ired
end
read
s
Colour●
●
●
StampySTARTophat2
Shape● Flower
Leaf
Compare mapping efficacy of different RNA−seq assemblers
C.rube
lla
hybrid
●
●
●●
●
●
●●
●
●
●
●
●
●
●
●●
● ●
●
●
●
●
●
●● ●
●
●
●
● ● ●
●
●
● ● ●●
●
●
● ● ●
●
● ●
● ●
●
●
● ● ●
●
●
●
● ● ●
●●
● ● ● ●●
●
● ● ●
●
● ●
●●
●
●
● ● ●
60
70
80
90
Cg4
a_KS
2C
g88_
14_K
S3C
g88_
44_K
S2C
g89_
16_K
S2C
g89_
3_KS
1C
g8c_
KS2
Cg8
f_KS
1C
g94_
6_KS
1C
r1G
R1_
2_KS
1C
r1G
R1_
2_KS
2C
r1G
R1_
2_KS
3C
r23_
9_KS
2C
r39_
1_TS
1_KS
1C
r75_
2_3_
KS1
Cr7
9_29
_ext
ra1
Cr8
4_21
_KS1
CrN
2256
1_KS
2In
ter3
_1In
ter4
_1_1
Inte
r4_1
_2In
ter4
_1_3
Inte
r4_1
_4In
ter5
_1In
tra6_
3In
tra7_
2_1
Intra
7_2_
2In
tra7_
2_3
Intra
8_2
species
Perc
ent p
rope
rly m
appe
d pa
ired
end
read
sColour
●
●
●
StampySTARTophat2
Shape● Flower
Leaf
Compare mapping efficacy of different RNA−seq assemblers
●
●
●●
●
●
●●
●
●
●
●
●
●
●
●●
● ●
●
●
●
●
●
●● ●
●
●
●
● ● ●
●
●
● ● ●●
●
●
● ● ●
●
● ●
● ●
●
●
● ● ●
●
●
●
● ● ●
●●
● ● ● ●●
●
● ● ●
●
● ●
●●
●
●
● ● ●
60
70
80
90
Cg4
a_KS
2C
g88_
14_K
S3C
g88_
44_K
S2C
g89_
16_K
S2C
g89_
3_KS
1C
g8c_
KS2
Cg8
f_KS
1C
g94_
6_KS
1C
r1G
R1_
2_KS
1C
r1G
R1_
2_KS
2C
r1G
R1_
2_KS
3C
r23_
9_KS
2C
r39_
1_TS
1_KS
1C
r75_
2_3_
KS1
Cr7
9_29
_ext
ra1
Cr8
4_21
_KS1
CrN
2256
1_KS
2In
ter3
_1In
ter4
_1_1
Inte
r4_1
_2In
ter4
_1_3
Inte
r4_1
_4In
ter5
_1In
tra6_
3In
tra7_
2_1
Intra
7_2_
2In
tra7_
2_3
Intra
8_2
species
Perc
ent p
rope
rly m
appe
d pa
ired
end
read
s
Colour●
●
●
StampySTARTophat2
Shape● Flower
Leaf
Compare mapping efficacy of different RNA−seq assemblers
●
●
●●
●
●
●●
●
●
●
●
●
●
●
●●
● ●
●
●
●
●
●
●● ●
●
●
●
● ● ●
●
●
● ● ●●
●
●
● ● ●
●
● ●
● ●
●
●
● ● ●
●
●
●
● ● ●
●●
● ● ● ●●
●
● ● ●
●
● ●
●●
●
●
● ● ●
60
70
80
90
Cg4
a_KS
2C
g88_
14_K
S3C
g88_
44_K
S2C
g89_
16_K
S2C
g89_
3_KS
1C
g8c_
KS2
Cg8
f_KS
1C
g94_
6_KS
1C
r1G
R1_
2_KS
1C
r1G
R1_
2_KS
2C
r1G
R1_
2_KS
3C
r23_
9_KS
2C
r39_
1_TS
1_KS
1C
r75_
2_3_
KS1
Cr7
9_29
_ext
ra1
Cr8
4_21
_KS1
CrN
2256
1_KS
2In
ter3
_1In
ter4
_1_1
Inte
r4_1
_2In
ter4
_1_3
Inte
r4_1
_4In
ter5
_1In
tra6_
3In
tra7_
2_1
Intra
7_2_
2In
tra7_
2_3
Intra
8_2
species
Perc
ent p
rope
rly m
appe
d pa
ired
end
read
s
Colour●
●
●
StampySTARTophat2
Shape● Flower
Leaf
Compare mapping efficacy of different RNA−seq assemblers
C.grandiflo
ra

Bad mapping – what to do?
• First step – try to figure out why it failed. With the use of FastQC/RseQC/Mapping logs.• Perhaps also look for contaminant species• Redo library prep controlling for possible errors
• Low mapping, but not completely failed.• Figure out why!• Is it equal for all samples?• Could it introduce any bias in the data?

Reads
Reference
Mapping Mapped readsSTAR
genome.fa
mappedReads.bamreads.fastq.gz
Gene expression
Gene annotation:ref.bed / ref.gtf
Mapping QC- RseQC

After mapping - RseQC package• General sequence QC:
• sequence quality• nucleotide composition bias• PCR bias and • GC bias
• RNA-seq specific QC:• evaluate sequencing saturation• mapped reads distribution• coverage uniformity• strand specificity• Etc..
• Some tools for file manipulations
http://rseqc.sourceforge.net/
Code$ module load bioinfo-tools$ module load rseqc/2.4
$ geneBody_coverage.py –r ref.bed12 –i mappedReads.bam -o genecoverage

Soft clipping - clipping_profile.py

Gene coverage -geneBody_coverage.py
Not degraded Degraded
0 20 40 60 80 100
1e+0
52e
+05
3e+0
54e
+05
5e+0
56e
+05
percentile of gene body (5'−>3')
read
num
ber
0 20 40 60 80 100
5000
0010
0000
015
0000
020
0000
025
0000
030
0000
035
0000
0
percentile of gene body (5'−>3')
read
num
ber

Distance between PE-reads -inner_distance.py

Where in the genome do your reads map? - read_distribution.py

Known and novel splice junctions –junction_saturation.py or junction_annotation.py
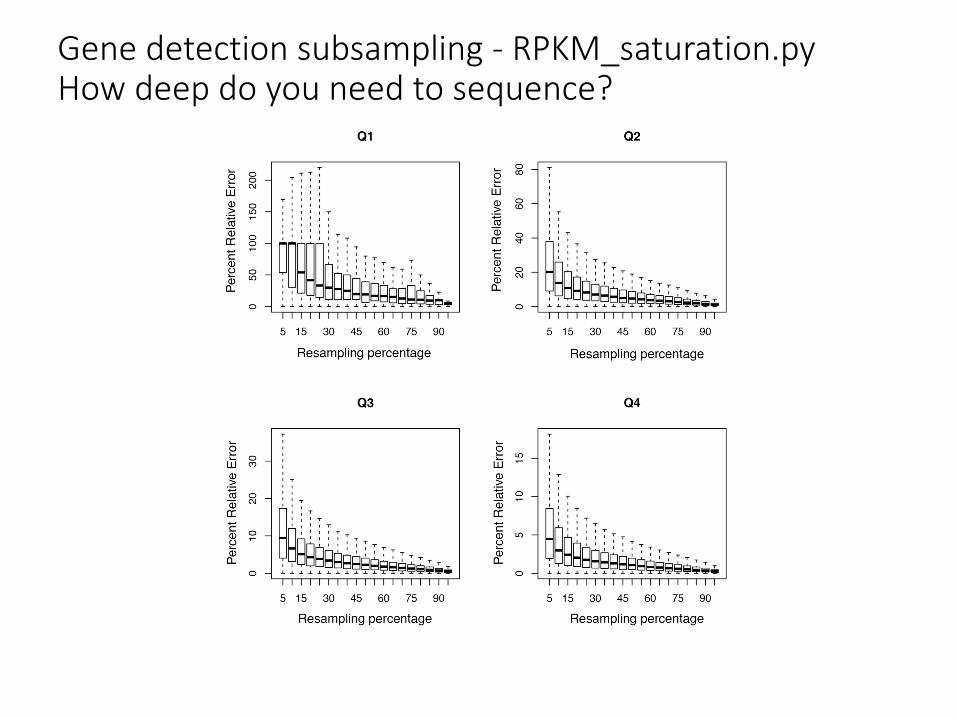
Gene detection subsampling - RPKM_saturation.pyHow deep do you need to sequence?

Bad RseQC output – what to do?
• Try to figure out what went wrong. • Redo library prep controlling for possible errors• Is it equal for all samples?• Could it introduce any bias in the data?
• RNA-degradation in some samples• Possible to use a region at 3’ end for expression
estimates.

MultiQC – summary of QC stats
( http://multiqc.info/ )
Code$ module load bioinfo-tools$ module load MultiQC$ multiqc .

Thank you. Questions?
Johan Reimegård | 13-May-2019