after it’s too late: estimating the policy impacts of...
TRANSCRIPT
Electronic copy available at: http://ssrn.com/abstract=1632390
After It’s Too Late:
Estimating the Policy Impacts of Black Mayors in U.S.
Cities
Daniel J. HopkinsGeorgetown University∗
Katherine T. McCabePrinceton University
September 1st, 2011
∗This paper was previously presented at the 2010 meeting of the Midwest Political Science Association. Theauthors are grateful for comments or advice from Richard Bensel, Paru Shah, Rafael Sonenshein, Thomas Strat-mann, Erik Voeten, and Hal Wolman, and for research assistance from Anton Strezhnev and William Tamplin.Brian Reaves at the Bureau of Justice Statistics kindly assisted with data, and Fernando Ferreira and JosephGyourko graciously made their data on mayoral elections available.
1

Electronic copy available at: http://ssrn.com/abstract=1632390
Abstract
Does a black mayor’s inauguration influence American cities’ policies? The heated rhetoric sur-
rounding some black-white elections suggests that it might. Past research is divided. Yet this
question has not been addressed in years or with many observations. This paper uses novel data
sets including 167 elections and 108 black mayors to examine their impact on fiscal and employ-
ment policies. Empirically, it uses multiple approaches including regression discontinuity design.
In most observable policy areas, the inauguration of a black mayor leads to policies that are
indistinguishable from cities where black mayors do not govern. Police hiring represents an ex-
ception, with black mayors hiring more black officers. These results suggest a disconnect between
the racially polarized elections that produce black mayors and the governance that follows. They
raise concerns about the potential of city elections to induce accountability, and they reinforce
the centrality of criminal justice as an urban political issue.
2
Introduction
In Los Angeles’s 1969 mayoral campaign, one memorable attack was about public safety, with
newspaper advertisements showing Tom Bradley’s picture and asking: “Will Your City Be Safe
with This Man?”(Sonenshein, 1993, pg. 91). The rhetoric in other cities was no less hysterical,
from the 1973 slogan that “Atlanta’s too young to die”(Stone, 1989, pg. 80) to a 1983 Chicago
candidate’s warning to support him, “Before It’s Too Late.” When big-city mayoral elections pit
black and white candidates against one another, the rhetoric is often alarmist, especially in cities
with no history of black mayors (Hajnal, 2007). This paper examines the fiscal and employment
policies that follow the contentious election. Do black mayors actually govern large U.S. cities in
ways that are observably different from white mayors?
Whether the answer is yes or no, it will challenge at least one prominent theoretical approach
to urban politics. Not long after the election of the first black, big-city mayors in 1967, observers
began to question whether control over cities was a “hollow prize” given their fiscal and economic
dependence (Friesema, 1969; Kraus and Swanstrom, 2001; Self, 2003). Building from Peterson’s
1981 claim that city policy is sharply constrained by economic competition, this research tradition
emphasizes the external limitations on autonomous urban policymaking (e.g. Morgan and Watson,
1995; Nivola, 2002; Rae, 2003). It expects that mayoral influence on local policymaking is highly
circumscribed, and that similar limitations apply irrespective of the mayor’s race or political
coalition.
Another strain of urban politics research leads to the opposite expectation. This work em-
phasizes the significant levels of ethnic and racial conflict underpinning political competition in
many cities (e.g. Mollenkopf, 1992; Sonenshein, 1993; Alesina, Baqir and Easterly, 1999; Self,
2003; Kaufmann, 2004; Kruse, 2005; Lassiter, 2006; Hajnal, 2007). Elections contested by black
and white1 candidates can produce voting that is highly polarized by race, and can also generate
either the inflammatory rhetoric that opened this paper or more coded racial appeals. At the
1Through this paper, “white” will indicate “non-Hispanic white.”
3
same time, the possibility of a black mayoralty can produce high levels of interest and heightened
expectations of city government in black communities (Nelson, 1978; Stone, 1989; Mollenkopf,
1992; Sonenshein, 1993; Thompson, 2006).2 In turn, those expectations could encourage black
mayors to attempt to challenge the status quo. If electoral cleavages have any relationship to
governing decisions, we should expect that black mayors’ policy choices will differ from those of
non-black mayors on average.
Research on black elected officials and descriptive representation has considered the difference
between black and non-black legislators in some depth, typically focusing on the U.S. House of
Representatives (e.g. Swain, 1995; Whitby, 1997). This research is primarily interested in whether
black representatives are more likely to advance legislation benefiting black communities than
their non-black counterparts. In federal politics, the focus on legislators rather than executives is
a necessary one: we have observed one black president in U.S. history. But at the local level, the
study of black mayors holds considerable promise as a way to understand the possibilities and
limits of descriptive representation. Scores of black candidates have been elected mayor of large
U.S. cities since 1967. Moreover, mayors are executives, a fact which facilitates identifying the
connection between policy changes and the responsible officials.
To be sure, past studies have already considered the impact of black mayors and the asso-
ciated political coalitions on cities’ fiscal policies and employment levels. More often than not,
past studies have found impacts, although the affected policy area varies by study, from social
welfare spending to police hiring or city employment (e.g. Keller, 1978; Karnig and Welch, 1980;
Saltzstein, 1989; Nye, Rainer and Stratmann, 2010). Still, these studies were understandably
limited by data availability, leading to sample sizes as small as six, ten, or twelve cities (e.g.
Keller, 1978; Browning, Marshall and Tabb, 1984; Pelissero, Holian and Tomaka, 2000). Even
the larger data set employed by Karnig and Welch (1980) includes only 17 cities that elected
black mayors before 1979. Here, we use extensive newspaper and record searches to create two
2These effects are not limited to the elections themselves: black mayoral victories can influence blacks andwhites’ assessments of local government, as shown by Gilliam (1996), Marschall and Ruhil (2007), and Hajnal(2007).
4
new data sets that allow us to observe the impact of many more black mayors. The first includes
56 “breakthrough” elections and 20 “breakthrough” appointments in large U.S. cities from 1972
to 2005, and the second includes 149 elections since 1989 in which a black candidate and a non-
black candidate competed for the mayoralty.3 The two data sets have minimal overlap, meaning
that they include 187 separate mayoral terms and 167 separate elections. Examined jointly, these
two data sets also allow us to consider whether the impact of black mayors has changed over
time. Observers commonly separate the first wave of Civil Rights Era black mayors from the
more technocratic black mayors of recent years (e.g. Thompson, 2006). Can we detect similar
distinctions in how cities allocate resources?
The manuscript seeks to make a methodological contribution as well. The challenge of identi-
fying comparable cities that happen to elect black or non-black mayors is a vexing one (Marschall
and Ruhil, 2006). We do not want to attribute to the mayor what is actually a feature of cities
that tend to elect black mayors. Given the sample size, we are able to employ a regression discon-
tinuity design (RDD) comparing those cities that narrowly elect a black mayor to those that do
not. This research design has grown increasingly popular in recent years (e.g. Lee, Moretti and
Butler, 2004; Leigh, 2007; Gerber, Kessler and Meredith, 2011; Ferreira and Gyourko, 2009; Folke,
N.d.; Meredith, 2009; Mullainathan and Washington, 2009; Trounstine, 2011; Rehavi, 2010; Fer-
reira and Gyourko, 2011), due in no small part to its ability to recover unbiased causal estimates
from observational data (Hahn, Todd and der Klauuw, 2001; Cook, Shaddish and Cook, 2005;
Imbens and Lemieux, 2008; Green et al., 2009). On account of the drawbacks of this approach
given the moderate sample size, the paper includes extensive robustness tests, and does not rely
on the RDD exclusively. It also draws on straightforward comparisons of city policy before and
after a “breakthrough” inauguration as well as “difference-in-difference” estimators. This latter
approach uses changes prior to the inauguration of a black mayor to control for any city-specific
policy trajectories.
We focus primarily on how fiscal and employment policies vary across cities. Such policies
3Both data sets are archived online at: (citation removed).
5
have been the focus of past work (e.g. Ferreira and Gyourko, 2011; Hopkins, 2011; Gerber and
Hopkins, 2011; Choi et al., 2010; Hajnal, 2010; Hajnal and Trounstine, 2010; Ferreira and Gyourko,
2009; Craw, 2006; Pelissero, Holian and Tomaka, 2000; Alesina, Baqir and Easterly, 1999; Karnig
and Welch, 1980), and for good reason: they force localities to declare their priorities in a way
that is publicly observable and comparable across both time and space (Jacoby and Schneider,
2001). Still, there are important limits to studying these dependent variables. It is plausible that
mayors’ policy influence is concentrated in precisely those areas that are not easily compared
across cities, such as the removal of a controversial police commissioner or the championing
of a sports stadium. Undoubtedly, black mayors could have significant distributional impacts
within cities (e.g. Mollenkopf, 1992) as well. But given the lack of neighborhood-level data on
cities’ resource allocation, those impacts are best pursued separately, and on a city-by-city basis.
Following past work, we focus here on comparable choices about budgeting and employment
facing many U.S. cities.
To preview the findings, in the wake of a “breakthrough” election or appointment, we detect
no strong changes in how cities raise or spend money or how they make employment decisions.
This is true both during the early period of black mayoral victories (1972-1989) and in more
recent years. It holds true as well if we exclude the 20 appointed mayors in the data. It is also
true that the changes in fiscal policy prior to the black mayor’s inauguration are little different
than the changes in the period following his or her inauguration.
The regression discontinuity-based results reinforce these findings by showing that narrow
black electoral victories do not induce many policy changes. Cities with black mayors spend
comparable amounts on housing and policing to cities with white mayors, for instance, and their
revenue streams are indistinguishable as well. The only areas where we sometimes detect impacts
are in police pay, staffing, and especially diversity in hiring. Cities that elect black mayors can
expect that three years later, a larger share of the police force will be black. Robustness tests
indicate that this result is not due to partisan differences between black and white mayors, and
that it is statistically significant using smaller bandwidths around the discontinuity. Consid-
6
ered jointly, the pattern of results suggests that criminal justice issues are unusual in showing a
potential connection between mayoral campaign issues and subsequent policy actions.
The next section establishes that black mayors typically come into office with the support of
liberal coalitions committed to a variety of policy goals. Thus the absence of many policy effects
indicates a systematic disconnect between the issues that structure mayoral elections and the
policies subject to mayoral authority. After election day, when the charged campaign rhetoric
subsides, we are left with a reality where the mayor’s race and its correlates rarely predict how the
city allocates resources. The conclusion considers what these results mean for our understanding
of urban elections, public policy, and representation.
Theorizing Black Mayors
We know what some of their challengers say. But what does past research suggest about the
likely policy impact of the election of a black mayor? Drawing on research into black political
incorporation and urban political coalitions, this section first outlines why we might expect marked
policy changes when black mayors are elected. Yet a second set of hypotheses, developed from
research on urban governance, points instead to the external constraints that limit black mayors’
impacts. After presenting both viewpoints, this section summarizes past research on black mayors’
impacts.
Political Coalitions and Black Mayors
We begin by considering the electoral coalitions that support black candidates, as those coalitions
will give some indication of the mayor’s likely policy goals once elected. In elections between
black and white candidates, the black candidate can count on very high levels of support from
the black community (Dawson, 1994; Kinder and Winter, 2001; Tate, 1993), especially at the
local level (Hajnal, 2007; McCrary, 1990; Hero and Beatty, 1989; Karnig and Welch, 1980).
Black voters are known to be quite liberal (Kinder and Sanders, 1996; Radcliff and Saiz, 1995),
7
irrespective of their own socioeconomic status (Dawson, 1994; Hochschild, 1995; Gay, 2004). So,
too, are the non-black groups that give substantial support to black candidates in black-white
elections (Mollenkopf, 1992; Sonenshein, 1993). Summarizing this political coalition’s goals, Self
(2003) writes that “liberals, including many African American-led coalitions, came to power
promising greater attention to neighborhoods, new approaches to poverty, and an expansion of
social services”(292). Given their main sources of political support, it is reasonable to assume
that black mayoral candidates will typically represent the left side of the local political spectrum.
It is not enough to characterize black mayors’ coalitions, though: studying their impact re-
quires us to compare them with white mayors who govern similar cities. And certainly, there
have been liberal white mayors, from New York’s John Lindsay to Atlanta’s Bill Hartsfield. Yet
many white mayors run with the support of more conservative political coalitions, including New
York’s Ed Koch, Los Angeles’s Sam Yorty, Chicago’s Richard J. Daley, and Philadelphia’s Frank
Rizzo (see respectively Mollenkopf 1992, Sonenshein 1993, Royko 1971, and Thompson 2006).
In fact, from the existing case studies, we were unable to identify any well-known instances in
which a black candidate consistently takes more conservative stances than his or her white com-
petitor.4 To the extent that mayors are able to pursue the policies favored by their supporters,
black mayors are more likely than white mayors to shift cities’ public policy in a liberal direction.
Such shifts may be especially pronounced for “breakthrough” black mayors, or for black mayors
assuming office from more conservative predecessors.
But what concrete policy actions do black mayors’ coalitions typically advocate? Certainly,
we might expect that black mayors will invest more city resources in welfare and public housing,
two of the most redistributive functions at the local level (Alesina, Baqir and Easterly, 1999;
Hajnal, 2010).5 Reinforcing this hypothesis, one study of black mayoralties in the 1970s finds an
increase in social welfare spending (Karnig and Welch, 1980), although another does not (Keller,
4There are two possible exceptions in our data set. The first is Elbert Henderson, a black and Republicancandidate for mayor of Baltimore in 2004 who garnered just 12% of the two-party vote. The second is MartinBarnes, a black Republican who lost the Paterson, New Jersey mayor’s race in 1994.
5This was a course of action taken by New York’s John Lindsay (Cannato, 2002), an archetypal urban liberal.
8
1978). On the revenue side, a more liberal mayor might attempt to increase taxes, and to focus
such increases (as Newark’s Kenneth Gibson did) on progressive revenue sources like business or
property taxes. However, local taxing authority is typically constrained by state law and state
politics (Nelson, 1978; Ladd and Yinger, 1989), a fact which might mute any differences in either
the amount or type of revenues.
If Alesina, Baqir and Easterly (2000) are correct in terming urban public employment “redis-
tributive,” we might expect growing city payrolls or employment targeted to blacks following the
election of a black mayor. We might also expect cities to devote a greater share of their spend-
ing to administration. Such impacts might be especially pronounced following “breakthrough”
elections, when the city’s first black mayor takes office. It is clear that during his first tenure as
Mayor of Washington, D.C., Marion Barry significantly expanded both city employment and city
contracting targeted to blacks (Jaffe and Sherwood, 1994). In that, he was not alone: black may-
ors have been shown to increase both the share of the municipal workforce that is black (Eisinger
1982; but see Kerr and Mladenka 1994) and the share of the city’s overall workforce that is black
(Nye, Rainer and Stratmann 2010).
At the same time, black mayors have commonly found themselves at odds with police de-
partments. Criminal justice policy has been a contentious and racially fraught issue in many
cities, from the STRESS crackdown in Detroit which preceded Coleman Young’s 1973 victory in
Detroit (Thompson, 2001) to the Rodney King incident in Los Angeles (Sonenshein, 1993) or the
bombing of MOVE members in Philadelphia (Thompson, 2006). One researcher, writing about
the early black mayors, notes: “One of the first things on these mayors’ agendas was to rein in
police departments that had been considered brutal and oppressive to blacks”(Thompson, 2006,
pg. 4). For decades, policing issues have put black mayors in the middle of the often contentious
relationship between the black communities that elected them and the police departments that
they oversee (Saltzstein, 1989). Here, one potential expectation is that black mayors will target
resources to other priorities, reducing the relative share of local resources devoted to policing.6
6It is worth noting that in a small-sample empirical study, Keller (1978) actually finds the opposite.
9
Alternatively, we might expect that black mayors’ impact will be on the composition of police
spending, as they try to increase black representation on the police force and emphasize com-
munity policing and strict oversight. Given the results of Gerber and Hopkins (2011), we might
expect the politics of fire spending to be similar.
Like the broader literature, the discussion above draws primarily on the “breakthrough” black
mayors of the 1960s, 1970s, and 1980s, mayors often elected in contested campaigns with clear
racial appeals. Yet the political situation of black mayors is likely to have changed in more recent
years. For one thing, the very success of black mayors can change whites’ attitudes towards black
elected officials (Hajnal, 2007). The opponents black candidates face are likely to have changed as
well, with the decline of the more reactionary urban politics of figures like Los Angeles’ Sam Yorty
(Sonenshein, 1993). Together, these observations lead to the expectation that the policy influence
of black mayors might have declined over time. Also, the invocation of race in political campaigns
has changed: recent decades have seen fewer overt racial appeals and more attention to racially
coded issues such as crime or welfare (e.g. Hurwitz and Peffley, 1997; Valentino, 1999; Mendelberg,
2001; Hurwitz and Peffley, 2005; Krebs and Holian, 2009). This shift might concentrate the effects
of black mayors on those racially coded policy areas.
Mayors’ Limits
For black mayors to systematically influence urban policy, it is not enough that they and their
supporters hold distinctive policy preferences. They must also be able to shift policies accordingly.
A significant body of research casts doubt on this prospect. For instance, Meier and England
(1984) argue that municipal expenditures are limited by “law and economics,” and beyond the
control of the mayor. This perspective is reinforced by many studies emphasizing how legal, fiscal,
economic, and political conditions combine to render mayors weak figures, even if their institu-
tional authority is nominally strong. Observing the 1960s mobilization to elect black mayors,
Martin Luther King Jr. concluded that “mayors are relatively unimportant figures in the scheme
10
of national politics”(Thompson, 2006, pg. 123).
There are several reasons why King’s statement resonates decades later. Legally, cities are
creatures of the states: their authorities are limited to those that states grant (Briffault, 1990).
They are subject to considerable mandates from both the federal and state levels (Nivola, 2002).
Politically, mayors commonly face hostile state legislatures and local political fragmentation
(Fuchs, 1992; Weir, 2000; Dreier, Mollenkopf and Swanstrom, 2001; Self, 2003; Weir, Wolman
and Swanstrom, 2005). Even at the local level, they often require the aid of other actors, be they
business leaders (Stone, 1989) or other elected officials (Browning, Marshall and Tabb, 1984). Eco-
nomically, cities must compete for residents, a fact which all but eliminates significant attempts
at redistribution (Peterson, 1981). And they must do so as deindustrialization and suburban-
ization erode their economic base (Sugrue, 1996; Wilson, 1996; Rae, 2003). Past scholarship has
also suggested that these fiscal and economic constraints are especially binding in the cities that
tend to elect black mayors (Friesema, 1969; Howard, 1978; Nelson, 1978; Kraus and Swanstrom,
2001). Irrespective of their preferences, the hypothesis that emerges is one of mayors unable to
challenge status quo policies. Perhaps for these reasons, Pelissero, Holian and Tomaka (2000)
do not find significant differences in fiscal policy over time between cities with black or Hispanic
mayors and those with white mayors from 1972 to 1992. Similarly, Ferreira and Gyourko (2011)
find no strong policy impacts for female mayors, and Ferreira and Gyourko (2009) find likewise
for Democratic mayors (but see Gerber and Hopkins, 2011).
Still, we should acknowledge an alternative literature suggesting that such claims about city
limits are themselves limited. Consider Wolman, Strate and Melchior (1996), who find that
cities that elect new mayors see significant changes in their expenditures despite these limitations
(see also Morgan and Watson 1995 and Levitt 1997).7 We might instead adopt an intermediate
hypothesis that constraint will vary by policy area (Gerber and Hopkins, 2011). It seems plausible
that these limitations influence taxing and spending, leaving mayors more discretion to influence
the city’s workforce or its priorities.
7Moreover, Sellers (2001) finds that local governments are gaining authority.
11
[Table 1 Here]
We have now developed theoretical expectations about why black mayors might influence local
policy or why they might not. But it is also valuable to summarize the findings from past research,
as Table 1 does. First, the table makes it clear that this area of research was most active in the
1970s and early 1980s, when the experience of “breakthrough” elections in cities like Cleveland,
Los Angeles, and Atlanta was more recent. As a result, sample sizes are typically small, with the
largest study observing only 24 separate black mayoralties. Empirically, past research has been
divided in its conclusions, with some research finding employment impacts (e.g. Eisinger, 1982;
Saltzstein, 1989; Nye, Rainer and Stratmann, 2010), some finding policy impacts (e.g. Browning,
Marshall and Tabb, 1984; Karnig and Welch, 1980), and some finding null impacts (e.g. Nelson,
1978; Pelissero, Holian and Tomaka, 2000). These inconsistent results make it plausible that
black mayors do have a significant impact on at least some municipal policies.
Data: “Breakthrough” Mayors
On January 1st, 1968, Carl Stokes took office in Cleveland, Ohio, and Richard Hatcher took
office in Gary, Indiana, making them the first black mayors of major U.S. cities. Since then,
the American racial landscape has changed considerably, although “breakthrough” elections have
remained highly contentious in many places (Hajnal, 2007). This paper’s empirical analyses
thus begin by considering the impact of a city’s first black mayor on its subsequent fiscal and
employment policies.
Studying fiscal and employment policies offers both conceptual and operational advantages.
Conceptually, budgets and hiring reflect the trade-offs that city leaders must make, allowing us to
measure cities’ evolving priorities (Clarke and Ferguson 1983; Fuchs 1992; at the state level, see
Jacoby and Schneider 2001). Also, taxing, spending, and employment data are reported annually,
which enables researchers to compare large numbers of cities across decades. For precisely those
reasons, past research on multiple cities has consistently focused on spending shares as measures
12
of local policy priorities (Peterson, 1981; Wolman, Strate and Melchior, 1996; Alesina, Baqir
and Easterly, 1999; Jacoby and Schneider, 2001; Craw, 2006; Ferreira and Gyourko, 2009; Choi
et al., 2010; Hajnal, 2010; Hajnal and Trounstine, 2010; Gerber and Hopkins, 2011; Ferreira and
Gyourko, 2011; Hopkins, 2011). Spending shares have already been shown to covary with many
factors, from urban political institutions (e.g. Hajnal and Trounstine, 2010) and voter turnout
(Hajnal, 2010) to mayoral partisanship (Gerber and Hopkins, 2011) and city demographics (e.g.
Alesina, Baqir and Easterly, 1999, 2000; Hopkins, 2011). Thus studying these policy priorities
allows for comparisons with past results and does not stack the deck in favor of null results.
To be sure, setting fiscal and employment levels across broad operational categories is not
the only function of city leaders. Another central issue that mayors must face is the question of
downtown development (e.g. Stone, 1989), a policy area which is commonly implemented through
tax breaks not visible in these fiscal data. Mayors also make appointments (Lowi, 1964) and make
decisions about policy implementation. Additionally, important elements of city policy are likely
to be carried out within these broad spending categories, as city leaders allocate resources to
specific neighborhoods or social groups. In part for those reasons, this research broadens the
usual set of dependent variables to consider employment and taxation as well. The focus here
is on subject-specific spending and employment (e.g. health, parks, and roads), rather than the
broader spending types employed in most past research (e.g. redistributive spending, distributive
spending). Still, budgets and hiring levels provide statements of how policy areas are prioritized,
and their comparability across time and space makes them an unparalleled starting point.
We examine the validity of the spending shares in multiple ways. First, we note that the
over-time changes in spending shares match our expectations, with declining spending on roads,
sanitation, and health, and increased spending on housing and criminal justice from the 1970s
to 2002 (Hopkins, 2011, pg. 357). As a second test of the spending shares’ construct validity,
we turn to a data set on “State of the City” addresses being compiled for a separate research
project. For all available speeches in the largest 60 U.S. cities from 1997 to 2008, this project
coded every sentence as coming from one of 15 major policy areas (author citation). In some cases,
13
the policy areas identified are quite comparable to city spending categories available through the
Annual Survey of Governments. For the 255 available speeches, we then estimated the correlation
between the 2002 spending share and the share of each speech devoted to the analogous subject.
The correlations are consistently positive, indicating that these spending shares are related to
the emphasis mayors in those cities place on specific policy areas. For example, the correlation
between cities’ spending on housing and their mayors’ emphasis on neighborhood development is
0.30 (Pearson’s), while the correlation between city spending on parks and rhetorical emphasis
on the environment is 0.23. For transit spending and transportation, the comparable correlation
is 0.17.8 As we detail in several instances below, we also used newspaper articles to confirm that
major policy shifts identified by the data were in fact politically salient at the time.9 In short, these
spending measures are not budgetary artifacts, but instead appear to be useful approximations
of city policy priorities. In this section, the variation discussed is within cities over time.
There is no existing database of mayoral election results across U.S. cities that indicates race.
We began by collecting information on “breakthrough” elections and appointments for the largest
170 cities in the U.S. as of 2011.10 Of these cities, 59 had been governed by a black mayor, so we
augmented the sample with smaller cities that are home to significant black populations. A city’s
black population size is among the strongest predictors of electing a black mayor (Marschall and
Ruhil, 2006). Specifically, we also collected data for the 200 largest cities that were more than
25% black and the 100 largest cities that were more than 20% black as of 2000.11 Among these
smaller cities, we identified another 48 individuals who were the first African American mayors
in their cities.
Our measurement approach is to identify changes in city spending patterns in the period
following the first election or appointment of a black mayor (see also Pelissero, Holian and Tomaka,
8For mayor’s emphasis on welfare and cities’ per capita welfare spending, the correlation is a striking 0.53.9See especially the discussions of Dwight Tillery, David Dinkins, and John Street. Additional research confirmed
other significant policy changes detected in the data set, including: Oceanside, California Mayor Terry Johnson’s2000 housing increases (Sherman, 2004); Richmond, California Mayor Irma Anderson’s 2004 police cuts (Johnson,2006); and Mobile, Alabama Mayor Sam Jones’ 2005 policing increases (Jones, 2009).
10The 170th largest city is Kansas City, Kansas, with approximately 143,000 people.11The largest of these cities is Dayton, Ohio, while the smallest is Petersburg, Virginia.
14
2000). To do so, we matched each breakthrough mayor to the city’s spending in the election or
appointment year and in the subsequent three fiscal years. We choose this length of time to give
the mayor’s policies time to influence outcomes, but also to limit censoring among the recent cases.
Our sources of urban fiscal data are the U.S. Census Bureau’s Annual Survey of Governments and
its Census of Governments, which provide detailed breakdowns of city revenues, expenditures, and
employment from 1970 to 2006 (for fiscal data) or 2008 (for employment data).12 We were able to
match 76 breakthrough elections or appointments to spending data, from the 1972 appointment
of James Ford in Tallahassee, Florida to the 2005 election of Jay Williams in Youngstown, Ohio.
Table 5 in the Appendix provides a full list. Simply put, these data gathering procedures ensure
that we have data on the vast majority of black big-city mayors during the period in question.
In fact, when comparing our listing with the 2002 listing of the Joint Center for Political and
Economic Studies, our sample had all but five of the mayors listed.13 Fifty six of these mayors
were elected by voters, while the remaining 20 were appointed by councils. It is important to note
that we reach the same conclusions by studying directly elected “breakthrough” mayors exclusively.
What’s more, the RDD analyses below include only black-white mayoral elections.
There is a challenge inherent in inferring the causal effects of mayoral elections, whether one is
looking at differences-in-differences or using RDD. Consider RDD, which aims to isolate the effects
of victory by the black candidates observed in our data, but does so without indicating which
aspects of black mayoralties are producing the effects. Put differently, RDDs hold constant the
conditions that are likely to give rise to a black mayor, but not the specific attributes associated
with black mayoral candidates. For instance, we know that black candidates are more likely
than their white opponents to be Democrats and liberals, and to have strong support from the
black community. For observed variables such as partisanship, we can address this problem in
a straightforward manner by conditioning on the would-be confounder (see also Card, Chetty
12For one core dependent variable, police spending, we extended the data set by two years using the 2007-8Census of Governments data available from the Census Bureau by special request.
13Those five missing mayors hailed from smaller cities, such as Eden Prairie, Minnesota and Sarasota, Florida.This research also made use of the data set developed in Ferreira and Gyourko (2009) to obtain or confirm ahandful of election results and candidate names.
15
and Weber 2007 and Rehavi 2010). However, as with other applications of RDD using election
outcomes (e.g. Ferreira and Gyourko, 2011; Gerber and Hopkins, 2011; Rehavi, 2010; Ferreira and
Gyourko, 2009), the models cannot hold unobserved factors constant, meaning that the results
could be produced by ideology or by other correlates of the candidate’s race.14 As with all past
research on black mayors (e.g. Pelissero, Holian and Tomaka, 2000), the results presented here
estimate the policy impacts when a black candidate prevails over a white candidate, but they
provide no guarantee the candidates are otherwise identical.
We considered whether there were any detectable changes in the revenues, spending, or em-
ployment in these 76 cities in the three fiscal years following the election or appointment of the
city’s first black mayor. Our focus is on the change in the share of police spending, but we also
estimate effects for 26 other dependent variables.15 Eleven of these variables indicate the share
of the city’s operating budget devoted to various spending priorities, such as roads, fire, parks,
and libraries. Two of the variables measure the composition of the city’s revenues that come
from property taxes or sales taxes; it is possible that black mayors supported by lower-income
populations would favor the less regressive property tax over the more regressive sales tax where
possible.16 Another revenue-related measure identifies the extent to which the city uses taxes of
any kind to finance its operations. To see whether black mayors impact cities’ overall revenues,
the analyses also consider the logged total taxes as well as the total taxes per capita.
Given the extensive discussions of “redistributive public employment” and black mayors’ im-
pact on city hiring (Eisinger, 1982), we also consider a variety of employment measures, including
the city’s share of employees in various sectors, its logged total payroll, and its number of employ-
14See Ferreira and Gyourko (2011) for a similar discussion.15This number of dependent variables immediately raises the issue of multiple inferences or multiple comparisons
(e.g. Anderson, 2008). The concern is that when conducting multiple significant tests, the probability of rejectinga null hypothesis rises with the number of tests conducted. We address that concern primarily by indicating ourcentral dependent variables—those related to policing—ex ante. We also note that any attempt to adjust thep-values reported below for multiple comparisons (such as the simulation-based technique outlined in Westfall andYoung 1993) will elevate them further, reinforcing the core conclusion of this paper.
16For research on the relative regressivity of the sales tax, see especially Suits (1977). The claim embedded inthis hypothesis is not that property taxes are necessarily progressive, but that they are less regressive than salestaxes. The relative incidence of these taxes will of course depend on specific aspects of local law, including anydifferential treatment of commercial property.
16
ees. Here, we concentrate on their impact on the size of the workforce overall and its distribution
across functions. In analyses below, we observe the share of the police force that is black as well.17
Policing appears to be an especially contentious and high-priority area for black mayors.
Saltzstein (1989) shows that black mayors induce higher levels of black representation on police
forces. At the same time, Browning, Marshall and Tabb (1984, pg. 168) show that minority
political incorporation encourages the creation of police review boards. For policing, we consider
the ratio of police payrolls to total payrolls. To address the possibility of out-migration, our final
dependent variable is the change in the logged population over the same three-year period.
To be as comparable to the older research as possible (e.g. Pelissero, Holian and Tomaka,
2000; Karnig and Welch, 1980; Keller, 1978; Nelson, 1978), we begin by considering only the 38
elections or appointments that took place prior to 1989. These were the decisions that generated
slogans such as “Atlanta’s too young to die” or “Before It’s Too Late.” Many were the contentious
“breakthrough” elections that saw high turnout and high polarization (Hajnal, 2007). They were
also the elections and appointments that generated the mixed findings of past research (Keller,
1978; Karnig and Welch, 1980; Pelissero, Holian and Tomaka, 2000). To start, we use two-sample
t-tests to detect any differences for any of the measures of city fiscal or employment policy in the
first three years of the new mayoral administration. The first column on the left side of Table
2 presents the mean for each spending category in the baseline year while the second presents
the mean three fiscal years later. From the first column, we see the major spending categories of
city government: policing (9.8% of city expenditures at baseline), fire (6.8%), and roads (5.9%).
We also see smaller categories, either because they are relatively inexpensive (e.g. libraries and
parks) or because they aren’t spending areas for most cities (e.g. health care and welfare). On the
revenue side, the table illustrates cities’ overall dependence on the property tax, which accounts
for 59.0% of tax revenues. It also shows their reliance on non-tax revenues such as user fees, since
17U.S. cities are required to file information with the Equal Employment Opportunity Commission about theracial composition of their workforce. However, such data are provided only in aggregated form, making it impos-sible to link specific mayors to specific workforce changes without additional data collection (Kerr and Mladenka,1994; McClain, 1993; Eisinger, 1982). For more, see http://www.eeoc.gov/eeoc/statistics/employment/
jobpat-eeo4/2005/jobs/Type3City.html
17
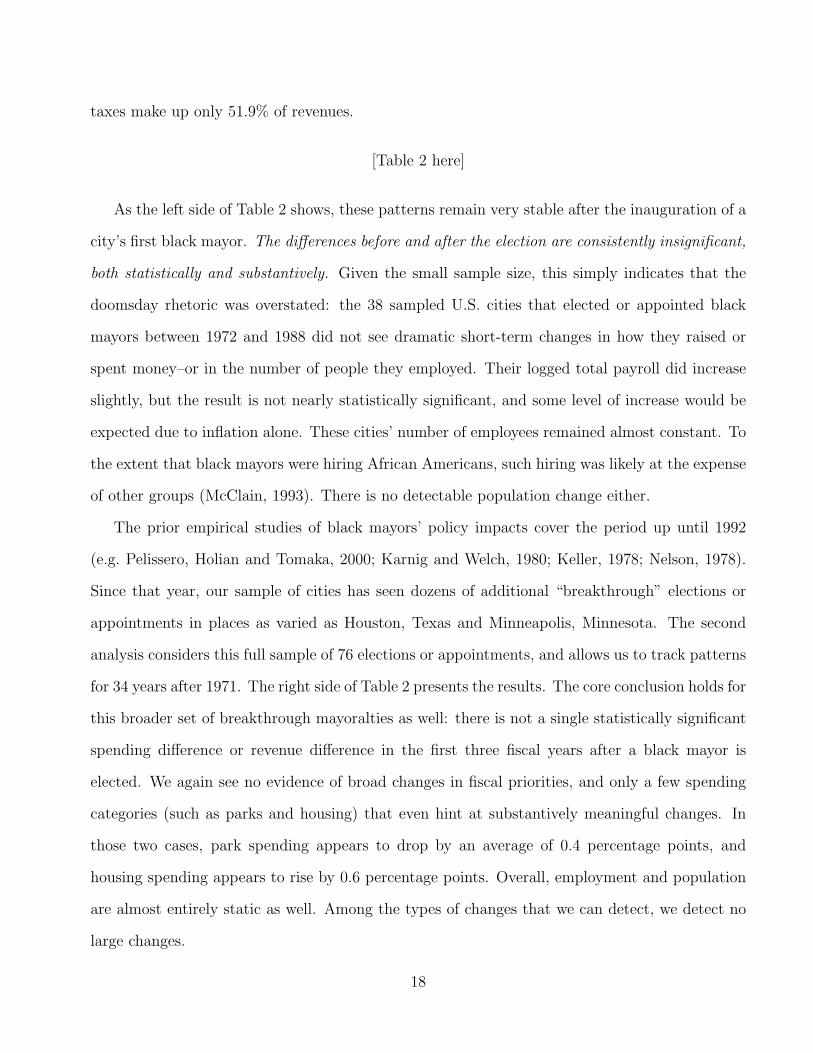
taxes make up only 51.9% of revenues.
[Table 2 here]
As the left side of Table 2 shows, these patterns remain very stable after the inauguration of a
city’s first black mayor. The differences before and after the election are consistently insignificant,
both statistically and substantively. Given the small sample size, this simply indicates that the
doomsday rhetoric was overstated: the 38 sampled U.S. cities that elected or appointed black
mayors between 1972 and 1988 did not see dramatic short-term changes in how they raised or
spent money–or in the number of people they employed. Their logged total payroll did increase
slightly, but the result is not nearly statistically significant, and some level of increase would be
expected due to inflation alone. These cities’ number of employees remained almost constant. To
the extent that black mayors were hiring African Americans, such hiring was likely at the expense
of other groups (McClain, 1993). There is no detectable population change either.
The prior empirical studies of black mayors’ policy impacts cover the period up until 1992
(e.g. Pelissero, Holian and Tomaka, 2000; Karnig and Welch, 1980; Keller, 1978; Nelson, 1978).
Since that year, our sample of cities has seen dozens of additional “breakthrough” elections or
appointments in places as varied as Houston, Texas and Minneapolis, Minnesota. The second
analysis considers this full sample of 76 elections or appointments, and allows us to track patterns
for 34 years after 1971. The right side of Table 2 presents the results. The core conclusion holds for
this broader set of breakthrough mayoralties as well: there is not a single statistically significant
spending difference or revenue difference in the first three fiscal years after a black mayor is
elected. We again see no evidence of broad changes in fiscal priorities, and only a few spending
categories (such as parks and housing) that even hint at substantively meaningful changes. In
those two cases, park spending appears to drop by an average of 0.4 percentage points, and
housing spending appears to rise by 0.6 percentage points. Overall, employment and population
are almost entirely static as well. Among the types of changes that we can detect, we detect no
large changes.
18
However, important alternative explanations remain plausible. If fiscal policies in all cities
were changing in response to broader shocks common to all cities, the null results above might
actually indicate that black mayors influenced policy by preserving the status quo. Put differently,
the analyses above have no control group. To address this potential liability, the analysis now
turns to a “difference-in-difference” estimator. Restricting the data set to the 67 observations for
which fiscal information is available for the four years prior to the inauguration, we compared the
change in the relevant policy for the three years after the first black mayor’s inauguration with
the same change four years prior. Doing so effectively holds city-level variables constant, and
enables us to separate out the potential impact of the black mayor from broad trends common
to cities that elect black mayors. As Table 6 in the Appendix shows, the differences are again
substantively small and for the most part statistically insignificant. The changes in city fiscal
policies under black mayors were little different from the changes in the three years just preceding
their election. Black mayors do little to modify pre-existing trends. The two potential exceptions
are in the allocation of the city’s workforce across functions. Black mayors appear to halt the
decline of workers moving into roads and libraries.
These generally null results are not unexpected. This period saw out-migration, deindustri-
alization (Sugrue, 1996), declining federal assistance (Mollenkopf, 1983; Dreier, Mollenkopf and
Swanstrom, 2001) and increasing legal and fiscal constraints on cities (Nivola, 2002; Rae, 2003),
meaning that winning the mayoralty might well have been a “hollow prize”(Kraus and Swanstrom,
2001; Friesema, 1969). Still, these results are based on relatively small sample sizes, and do not
incorporate information from cities where black mayors might have won but did not. The next
section thus uses RDD on a broader and more recent set of mayoral elections.
A Regression Discontinuity Design
This section employs the same target cities, but a different and more robust mode of analysis.
Instead of the over-time variation employed above, this section uses an RDD (Hahn, Todd and
19
der Klauuw, 2001; Lee, Moretti and Butler, 2004; Imbens and Lemieux, 2008; Green et al.,
2009) to compare fiscal policies in cities that narrowly elected black mayors with those in cities
where black candidates were narrowly defeated. Its focus is squarely on directly elected mayors.
This empirical strategy is known to be conservative, requiring more observations than would a
randomized experiment to offer the same level of precision (Schochet, 2009). Still, as detailed
below, this approach allows us to credibly attribute any observed differences to the mayor’s race,
since there is no reason to expect underlying differences between cities where the black mayor
narrowly wins and those where he or she narrowly loses. It thus solves the problem of non-
random selection that Marschall and Ruhil (2006, pg. 829) observe by focusing only on cities that
plausibly could have had a mayor of either race. Consider the example of Memphis, Tennessee:
its first black Mayor, Willie Herenton, was elected by a razor-thin margin of 172 votes out of
more than 240,000 cast. With such a small margin, the actual outcome can be treated as if it
were uncorrelated with city-level factors that might influence fiscal or employment policy. Our
research design exploits that and other close races to compare cases where black mayors actually
governed with cases where they might have but did not.18
Certainly, the canonical applications of RDD have much larger sample sizes (e.g. Lee, Moretti
and Butler 2004). Given the moderate sample size of 149 elections, the RDD analyses below
must confront the challenges that any statistical model of these data would face, including model
dependence (Green et al., 2009), multiple comparisons (Anderson, 2008), the clustering of ob-
servations within cities (Wooldridge, 2003), and potentially omitted variables. Still, the RDD
remains a valuable tool to separate causal effects from selection effects, especially if paired with
other analyses. The resulting 95% confidence intervals may prove wide, but there is no reason to
expect that they will be biased. Moreover, with several of these potential problems, we can reduce
the threat to validity through various robustness tests, including varying the bandwidth around
18RDD analyses focus on the closeness of the election for empirical, not theoretical, reasons: by conditioningon the underlying support for the black candidate, they isolate the variation in elections that is due to stochasticperturbations near the discontinuity.
20
the discontinuity and modifying the model specification.19
Data Set: 1989-2006
Having identified the target cities above, we use Lexis-Nexis and local government websites to
obtain all available general election results from 1989 to 2006. To conduct our analyses, we need to
know the racial background of the election’s winner and loser, and we also need to know the votes
cast for both candidates. These prove to be a demanding set of criteria: even with exhaustive
Lexis-Nexis searches using the relevant state’s newspapers, we recover the racial background of
both candidates in only 638 separate elections held in 165 different cities. In our research, we
uncover no pre-existing list of losing black mayoral candidates.
Our quantity of interest is defined only for the subset of cities where an identifiably black
candidate ran against an identifiably non-black candidate.20 This reduces the sample to 149
elections between 1989 and 2006.21 In these elections, the black candidate won 73 times and lost
76 times. Given the time-frame, the clustering of elections within cities is not pronounced: these
elections take place in 74 different cities, no city accounts for more than five elections, and 81%
of the elections come from cities that have fewer than four elections in the data set. Also, the
negative correlations of policy changes within cities means that clustering standard errors actually
deflates them slightly in this case. To err on the conservative side, non-clustered standard errors
are reported below, although the substantive results with standard errors clustered by city (e.g.
Wooldridge, 2003) are no different.
Table 3 describes this set of cities in more detail, and Table 7 in the Appendix compares
the selected cities with the 354 cities in the sampled population. The cities studied here have a
median population of 244,751, with a high average 1991 crime rate of 10,729 crimes per 100,000
people. Levels of poverty are high, averaging 20.6% as of 1990. These cities are on average 37%
19It is noteworthy that an RDD analysis by Gerber and Hopkins (2011) finds demonstrable impacts of mayors’party affiliation analyzing 134 cities.
20In every case but two, “non-black” means “white.” In Rochester, New York’s 2001 election, the losing candidatewas Latino, and in Oakland, California’s 1994 election, the losing candidate was Asian American.
21Here, 83% of the elections come from cities that are at least 20% black.
21
black in 1990. Yet only 19% of the elections come from cities that were majority black in 1990. In
61% of these elections, the winner is a Democrat. 67% percent of elections took place in a typical
Mayor-Council system. This is not a random subset of cities, but it is a subset of cities that
could plausibly elect either a black mayor or a white mayor. It is thus a subset where the causal
question of interest is well defined.22 We address the small amounts of missing data through
multiple imputation (Schafer, 1997; King et al., 2001), although the results are not sensitive to
this choice.23
[Table 3 Here]
Regression Discontinuity Results
RDDs isolate the variation in election outcomes that can be reasonably attributed to chance.24
They do so by conditioning on the underlying continuous variable (or the “forcing” variable) that
gives rise to the treatment deterministically. A city that backs a black mayoral candidate with
49.9% of its support is assumed to be little different from a city that offers 50.1% support, with
the critical exception that in the second case, the black candidate wins and becomes mayor.25 Our
models thus condition on several functions of the vote share for the black candidate, including
the raw percentage, the percentage squared, and the percentage cubed (see also Lee, Moretti
and Butler, 2004). If these continuous measures prove related to the dependent variable, those
correlations are evidence of potentially confounding relationships. The initial models use all
149 observations, as even races that are not that close can help us estimate the relationship
between the underlying forcing variable and the outcome. However, robustness tests remove the
observations that are further from the discontinuity.
22For more on the precursors of electing black mayors, see Marschall and Ruhil (2006).23Specifically, due to censoring, we are missing seven observations for the independent variables derived from
the Annual Survey of Governments. This includes the fiscal year end date.24For in-depth explanations of RDD, see Imbens and Lemieux (2008), Green et al. (2009), or Angrist and Pischke
(2009).25For critiques of this assumption when applied to elections, see (Caughey and Sekhon, 2010) and (Grimmer
et al., 2011).
22
Following past practice (e.g. Lee, Moretti and Butler, 2004), the models interact each of
these forcing variables with the indicator for whether the black candidate won, which allows the
functions to vary on either side of the discontinuity. The RDD significantly reduces the threat
from omitted variables, as any such omitted variables would themselves need to be discontinuous
at the point where the black mayor wins or loses. Figure 5 in the Appendix presents placebo
tests showing that they are not. It details the results of regressions using the discontinuity and
the forcing variables to predict 37 independent variables. If we detect a significant relationship–
that is, a z-score above 1.96 or below -1.96–that would indicate that the independent variable is
unbalanced at the point of the discontinuity. In actuality, a narrow black victory is significantly
correlated with only one of the independent variables considered, giving us increased confidence
that the “as if random” assumption after conditioning on the forcing variable is a plausible
one. The one independent variable that is unbalanced is entirely expected: when black mayoral
candidates win narrowly, Democratic mayoral candidates are more likely to win narrowly as well.
In the analyses below, the models always condition on whether the winner was a Democrat to
address this issue.
The estimates that result from RDDs are Local Average Treatment Effects, which means
that they apply only at the point of the discontinuity. We thus begin with a baseline RDD
model which includes the various functions of the percent supporting the black candidate and
the winner’s party as described above. It also includes a small number of covariates, including
an indicator variable for whether the fiscal year ends in December26 as well as measures of the
city’s intergovernmental revenue per capita in the year of the election, its logged population in
1990, its percent black in 1990, and its logged median household income. Past work indicates
that these measures of city size, wealth, and racial demographics are especially likely to be related
to city’s public spending (e.g. Peterson, 1981; Alesina, Baqir and Easterly, 1999; Hajnal, 2010;
Hajnal and Trounstine, 2010), although the results are not sensitive to their inclusion. To observe
26This covariate is important, as cities with fiscal years ending in December might differ in the number of budgetcycles the mayor can influence.
23
the impact of using the RDD approach, we also estimate similarly specified models without the
various functions of the percent supporting the black candidate.
[Table 4 Here]
Using the initial RDD model, we then estimate the impact of a narrow victory for the black
candidate on subsequent city spending and employment. Again, we focus on the change between
the fiscal year of the election (whose budget is determined prior to the election) and the third fiscal
year after the election. We fitted these models for each of the dependent variables, summarized
in Table 4, and then estimate the expected change in that dependent variable over the three
post-election fiscal years if the black candidate wins. Since this data set is drawn exclusively
from the period following 1988, we are able to use the triennial Law Enforcement Management
and Administrative Statistics to measure the share of police officers who are black.27 For one
important subset of the city workforce (Sharp, 2006), we can thus consider changes in workforce
composition as well as size. One example of a full, fitted model predicting the share of police
officers who are black is available in Table 8 in the Appendix.28
[Figure 1 Here]
Figure 1 depicts the results, with Table 9 in the Appendix providing exact numerical values.
For the central models using the regression discontinuity approach, the black dot indicates the
estimated impact, and the solid line spans the 95% confidence interval. To provide a comparison
and a means of understanding the impact of the RD estimation strategy, we use gray triangles
and dashed lines to indicate the corresponding estimates from models without the RDD. Such
models omit all functions of the forcing variable, and return average treatment effects rather than
27This measure is updated every three years, so we set each city’s share of black police officers to its observedlevel for that year and the two subsequent years. The data are available via the Bureau of Justice Statistics athttp://bjs.ojp.usdoj.gov. More generally, the small number of observations missing data on a given dependentvariable were dropped from the analysis.
28In interpreting Table 8, we should keep in mind that the model includes several functions of the same continuousvariable. The variables can reduce bias even without being individually statistically significant.
24
local average treatment effects. As expected, the RDD specifications are more conservative, with
much wider 95% confidence intervals.
The figure makes clear that overall, black mayors do not allocate resources in ways that
differ markedly from other mayors. This general conclusion holds true for two very different
estimation strategies of two different estimands. Given their typically liberal political coalitions
(Mollenkopf, 1992; Sonenshein, 1993; Thompson, 2006), we might expect a shift away from the
especially regressive sales tax. But we observe no such shifts. We might have expected increased
resources devoted to housing and health, which are among the most redistributive forms of city
spending (Hajnal, 2010; Peterson, 1981). But again, we observe no such shifts. We see no strong
impact when looking at employees per capita, the metric of municipal workforces used by past
research (e.g. Alesina, Baqir and Easterly, 2000). This null result suggests that the Washington
experience under Marion Barry was not a more general impact of black mayors.
[Figure 2 Here]
Of the 28 dependent variables considered, only 3 show significant impacts in either speci-
fication: the share of revenues devoted to policing, the share of city employees at the police
department, and the share of the police that are black. The cases where we observe detectable
impacts of black mayors are all related to policing and public safety. Given the earlier discussions
of the often heated disputes between black mayors and police departments and of the racially
coded language surrounding criminal justice policy, this is not surprising.
Based on the RDD model, we estimate that a city with a narrow black victory will reduce that
city’s share of employees at the police department by 2.9 percentage points, with a 95% confidence
interval from -5.8 percentage points to -0.03 percentage points. This impact is illustrated in the
top right panel of Figure 2. Sharp (2006) shows that police departments are larger in heavily
black cities, and attributes the effect to racial threat. Here, we see evidence in line with that
argument, as white mayors increase police hiring relative to black mayors in comparable cities.29
29Here, too, the data prove valid in identifying policy changes that were politically salient and widely discussed.
25
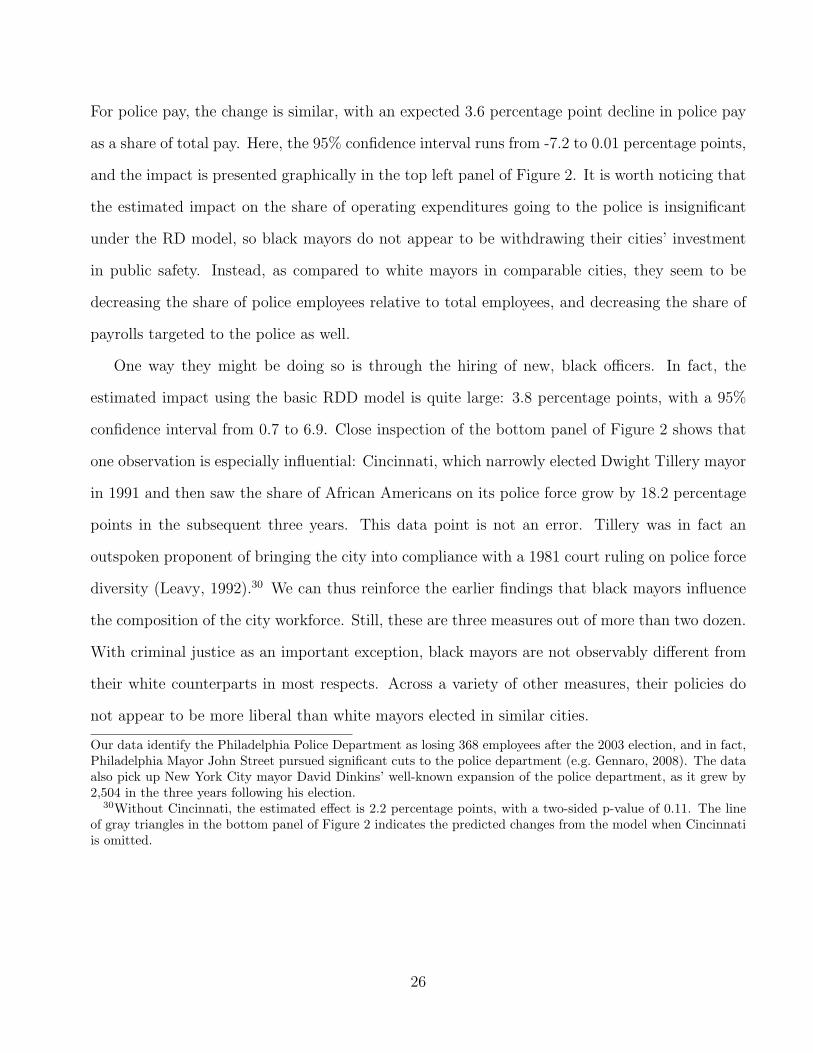
For police pay, the change is similar, with an expected 3.6 percentage point decline in police pay
as a share of total pay. Here, the 95% confidence interval runs from -7.2 to 0.01 percentage points,
and the impact is presented graphically in the top left panel of Figure 2. It is worth noticing that
the estimated impact on the share of operating expenditures going to the police is insignificant
under the RD model, so black mayors do not appear to be withdrawing their cities’ investment
in public safety. Instead, as compared to white mayors in comparable cities, they seem to be
decreasing the share of police employees relative to total employees, and decreasing the share of
payrolls targeted to the police as well.
One way they might be doing so is through the hiring of new, black officers. In fact, the
estimated impact using the basic RDD model is quite large: 3.8 percentage points, with a 95%
confidence interval from 0.7 to 6.9. Close inspection of the bottom panel of Figure 2 shows that
one observation is especially influential: Cincinnati, which narrowly elected Dwight Tillery mayor
in 1991 and then saw the share of African Americans on its police force grow by 18.2 percentage
points in the subsequent three years. This data point is not an error. Tillery was in fact an
outspoken proponent of bringing the city into compliance with a 1981 court ruling on police force
diversity (Leavy, 1992).30 We can thus reinforce the earlier findings that black mayors influence
the composition of the city workforce. Still, these are three measures out of more than two dozen.
With criminal justice as an important exception, black mayors are not observably different from
their white counterparts in most respects. Across a variety of other measures, their policies do
not appear to be more liberal than white mayors elected in similar cities.
Our data identify the Philadelphia Police Department as losing 368 employees after the 2003 election, and in fact,Philadelphia Mayor John Street pursued significant cuts to the police department (e.g. Gennaro, 2008). The dataalso pick up New York City mayor David Dinkins’ well-known expansion of the police department, as it grew by2,504 in the three years following his election.
30Without Cincinnati, the estimated effect is 2.2 percentage points, with a two-sided p-value of 0.11. The lineof gray triangles in the bottom panel of Figure 2 indicates the predicted changes from the model when Cincinnatiis omitted.
26
Robustness
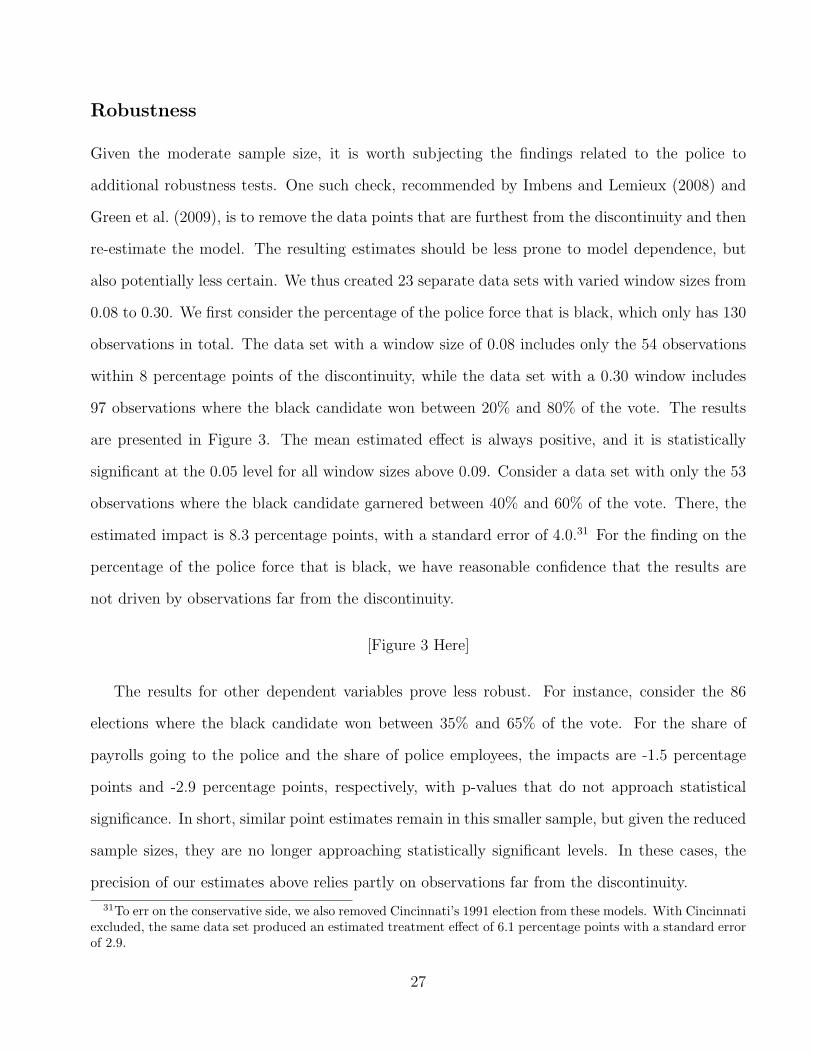
Given the moderate sample size, it is worth subjecting the findings related to the police to
additional robustness tests. One such check, recommended by Imbens and Lemieux (2008) and
Green et al. (2009), is to remove the data points that are furthest from the discontinuity and then
re-estimate the model. The resulting estimates should be less prone to model dependence, but
also potentially less certain. We thus created 23 separate data sets with varied window sizes from
0.08 to 0.30. We first consider the percentage of the police force that is black, which only has 130
observations in total. The data set with a window size of 0.08 includes only the 54 observations
within 8 percentage points of the discontinuity, while the data set with a 0.30 window includes
97 observations where the black candidate won between 20% and 80% of the vote. The results
are presented in Figure 3. The mean estimated effect is always positive, and it is statistically
significant at the 0.05 level for all window sizes above 0.09. Consider a data set with only the 53
observations where the black candidate garnered between 40% and 60% of the vote. There, the
estimated impact is 8.3 percentage points, with a standard error of 4.0.31 For the finding on the
percentage of the police force that is black, we have reasonable confidence that the results are
not driven by observations far from the discontinuity.
[Figure 3 Here]
The results for other dependent variables prove less robust. For instance, consider the 86
elections where the black candidate won between 35% and 65% of the vote. For the share of
payrolls going to the police and the share of police employees, the impacts are -1.5 percentage
points and -2.9 percentage points, respectively, with p-values that do not approach statistical
significance. In short, similar point estimates remain in this smaller sample, but given the reduced
sample sizes, they are no longer approaching statistically significant levels. In these cases, the
precision of our estimates above relies partly on observations far from the discontinuity.
31To err on the conservative side, we also removed Cincinnati’s 1991 election from these models. With Cincinnatiexcluded, the same data set produced an estimated treatment effect of 6.1 percentage points with a standard errorof 2.9.
27
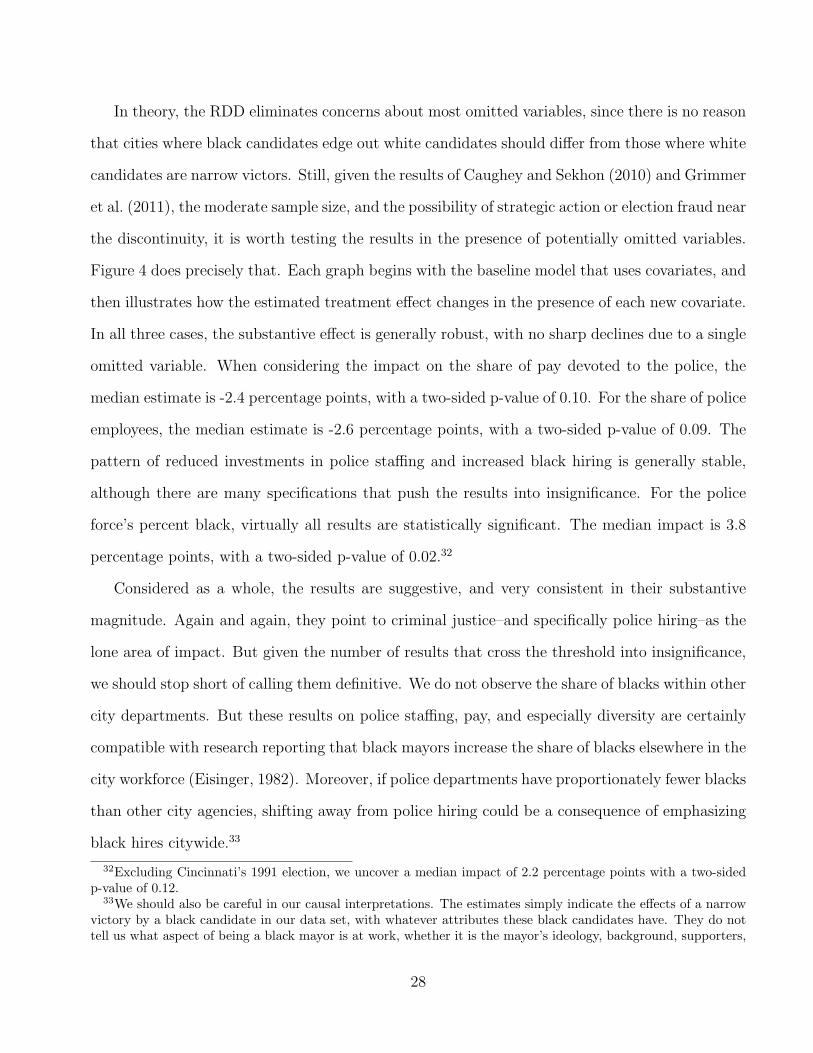
In theory, the RDD eliminates concerns about most omitted variables, since there is no reason
that cities where black candidates edge out white candidates should differ from those where white
candidates are narrow victors. Still, given the results of Caughey and Sekhon (2010) and Grimmer
et al. (2011), the moderate sample size, and the possibility of strategic action or election fraud near
the discontinuity, it is worth testing the results in the presence of potentially omitted variables.
Figure 4 does precisely that. Each graph begins with the baseline model that uses covariates, and
then illustrates how the estimated treatment effect changes in the presence of each new covariate.
In all three cases, the substantive effect is generally robust, with no sharp declines due to a single
omitted variable. When considering the impact on the share of pay devoted to the police, the
median estimate is -2.4 percentage points, with a two-sided p-value of 0.10. For the share of police
employees, the median estimate is -2.6 percentage points, with a two-sided p-value of 0.09. The
pattern of reduced investments in police staffing and increased black hiring is generally stable,
although there are many specifications that push the results into insignificance. For the police
force’s percent black, virtually all results are statistically significant. The median impact is 3.8
percentage points, with a two-sided p-value of 0.02.32
Considered as a whole, the results are suggestive, and very consistent in their substantive
magnitude. Again and again, they point to criminal justice–and specifically police hiring–as the
lone area of impact. But given the number of results that cross the threshold into insignificance,
we should stop short of calling them definitive. We do not observe the share of blacks within other
city departments. But these results on police staffing, pay, and especially diversity are certainly
compatible with research reporting that black mayors increase the share of blacks elsewhere in the
city workforce (Eisinger, 1982). Moreover, if police departments have proportionately fewer blacks
than other city agencies, shifting away from police hiring could be a consequence of emphasizing
black hires citywide.33
32Excluding Cincinnati’s 1991 election, we uncover a median impact of 2.2 percentage points with a two-sidedp-value of 0.12.
33We should also be careful in our causal interpretations. The estimates simply indicate the effects of a narrowvictory by a black candidate in our data set, with whatever attributes these black candidates have. They do nottell us what aspect of being a black mayor is at work, whether it is the mayor’s ideology, background, supporters,
28
[Figure 4 Here]
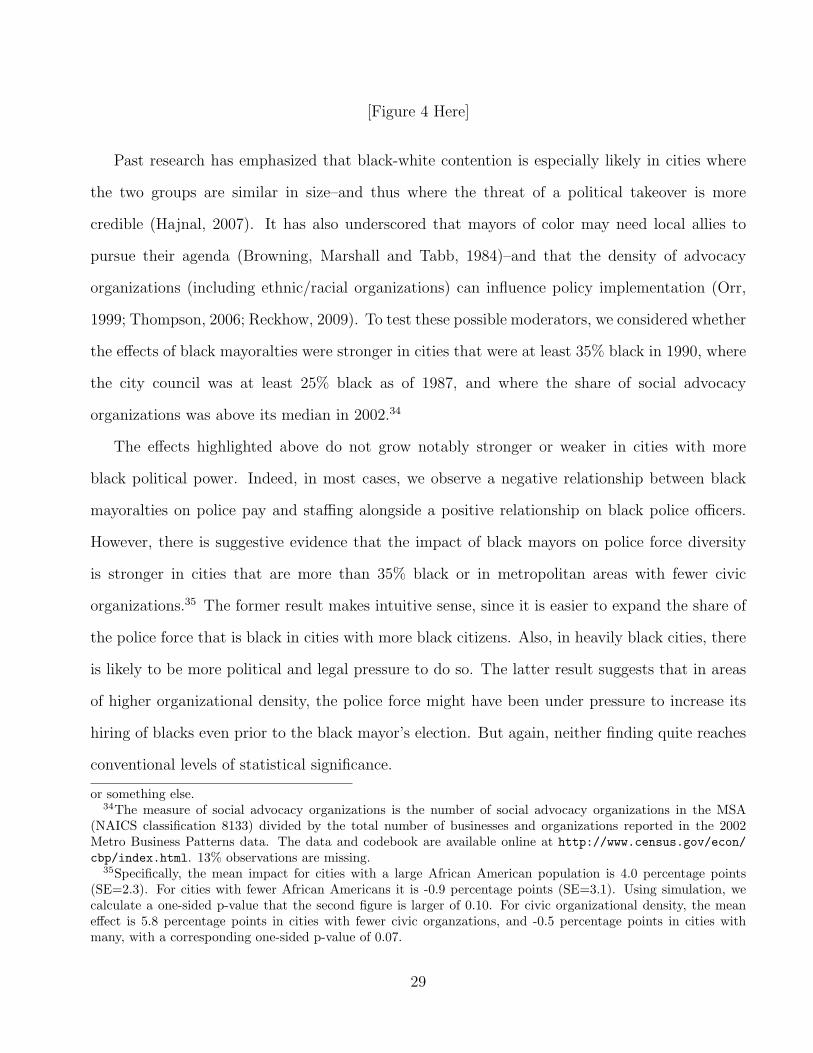
Past research has emphasized that black-white contention is especially likely in cities where
the two groups are similar in size–and thus where the threat of a political takeover is more
credible (Hajnal, 2007). It has also underscored that mayors of color may need local allies to
pursue their agenda (Browning, Marshall and Tabb, 1984)–and that the density of advocacy
organizations (including ethnic/racial organizations) can influence policy implementation (Orr,
1999; Thompson, 2006; Reckhow, 2009). To test these possible moderators, we considered whether
the effects of black mayoralties were stronger in cities that were at least 35% black in 1990, where
the city council was at least 25% black as of 1987, and where the share of social advocacy
organizations was above its median in 2002.34
The effects highlighted above do not grow notably stronger or weaker in cities with more
black political power. Indeed, in most cases, we observe a negative relationship between black
mayoralties on police pay and staffing alongside a positive relationship on black police officers.
However, there is suggestive evidence that the impact of black mayors on police force diversity
is stronger in cities that are more than 35% black or in metropolitan areas with fewer civic
organizations.35 The former result makes intuitive sense, since it is easier to expand the share of
the police force that is black in cities with more black citizens. Also, in heavily black cities, there
is likely to be more political and legal pressure to do so. The latter result suggests that in areas
of higher organizational density, the police force might have been under pressure to increase its
hiring of blacks even prior to the black mayor’s election. But again, neither finding quite reaches
conventional levels of statistical significance.
or something else.34The measure of social advocacy organizations is the number of social advocacy organizations in the MSA
(NAICS classification 8133) divided by the total number of businesses and organizations reported in the 2002Metro Business Patterns data. The data and codebook are available online at http://www.census.gov/econ/
cbp/index.html. 13% observations are missing.35Specifically, the mean impact for cities with a large African American population is 4.0 percentage points
(SE=2.3). For cities with fewer African Americans it is -0.9 percentage points (SE=3.1). Using simulation, wecalculate a one-sided p-value that the second figure is larger of 0.10. For civic organizational density, the meaneffect is 5.8 percentage points in cities with fewer civic organzations, and -0.5 percentage points in cities withmany, with a corresponding one-sided p-value of 0.07.
29
Conclusion
From past work, we know that the election of a black mayor can influence politics in various
ways. It can shape the views of both black and non-black residents, empowering the former
group while dispelling the fears of the latter (e.g. Gilliam, 1996; Marschall and Ruhil, 2007;
Hajnal, 2007). Black mayoral victories can potentially serve as a springboard to higher office. At
the same time, black mayors may be able to redirect resources within the city (Jaffe and Sherwood,
1994; Cannato, 2002), a possibility we are pursuing elsewhere. Still, the results presented here
underscore the fundamental limitations of big-city policymaking. Allocating local resources across
policy areas is a central decision that cities must make, so finding that black mayors have few
impacts on these decisions illustrates the fundamental constraints that they face.
Certainly, black mayors are not all alike. They differ in their coalitions, their political envi-
ronments, and their policy goals, such that we should not confuse a mayor like Los Angeles’s Tom
Bradley with a mayor like Detroit’s Coleman Young. The latter focused publicly on condemning
racism in a way that the former never did (Sonenshein, 1993; Thompson, 2001, 2006). Even so,
when running against white candidates, black mayors almost always build coalitions that are on
the left side of the local political spectrum, whether in Los Angeles, Detroit, or elsewhere. And
yet when governing, there is little evidence that such positions lead to systematic departures from
the status quo. Across a range of measures of taxing, spending, and hiring, we find few differences
between black mayors and their white counterparts. This conclusion holds using two different
data sets and estimation strategies.
Such results point to the limits of political representation in contemporary U.S. cities. There
is clearly a disjoint between the divisive, racialized campaigns that lead up to the election of black
mayors and the status quo-preserving policies that black-run cities adopt after the election. The
stark divisions that appear in black-white mayoral contests are largely muted when it comes to
the forms of governance observed here. Put differently, in black-white contests, voters are being
asked to choose between mayoral candidates based on charged rhetoric, as well as claims and
30
criteria that will have little bearing on observable policy outcomes. Certainly, black mayors could
be held accountable on other dimensions of their leadership, such as the distribution of resources
within the city or the more symbolic aspects of their leadership. In fact, their limitations in
policymaking might encourage them to emphasize other aspects of their role, a possibility worth
further study.
The potential exception to these findings is in the area of criminal justice, and specifically
in the diversity of the police. This research uncovers evidence that black mayors increase the
share of the police force that is black. More tentatively, it also identifies a tendency of black
mayors to reduce the share of city employees in the police department as well as the share of total
payrolls devoted to the police. Such findings reinforce what past case studies have suggested:
that policing is a uniquely politicized issue in American urban governance (see also Sonenshein
1993; Kirtzman 2000; Thompson 2001, 2006; Sharp 2006). It appears that among issues, criminal
justice alone combines the conditions necessary to allow for local politics to shape local policy.
Local authority over policing is clear (Gerber and Hopkins, 2011), unlike many other policy areas
that cities must address. Yet policing issues are sufficiently politicized nationally (Hopkins, 2011)
and racially charged that they can consistently influence voter decision-making (e.g. Hurwitz and
Peffley, 1997; Sharp, 2006; Krebs and Holian, 2009). When they highlight policing issues, mayoral
campaigns do focus on an issue that resonates with voters–and that they are both able and likely
to influence once elected.
31
References
Alesina, Alberto, Reza Baqir and William Easterly. 1999. “Public Goods and Ethnic Divisions.”
Quarterly Journal of Economics CXIV:1243–1284.
Alesina, Alberto, Reza Baqir and William Easterly. 2000. “Redistributive Public Employment.”
Journal of Urban Economics 48:219–241.
Anderson, Michael L. 2008. “Multiple Inference and Gender Differences in the Effects of Early In-
tervention: A Reevaluation of the Abecedarian, Perry Preschool, and Early Training Projects.”
Journal of the American Statistical Association 103(484):1481–1495.
Angrist, Joshua D. and Jorn-Steffen Pischke. 2009. Mostly Harmless Econometrics: An Empiri-
cist’s Companion. Princeton, NJ: Princeton University Press.
Briffault, Richard. 1990. “Our Localism, Part I–The Structure of Local Government Law.”
Columbia Law Review 90(1):1–115.
Browning, Rufus P., Dale Rogers Marshall and David H. Tabb. 1984. Protest is Not Enough.
Berkeley, CA: University of California Press.
Cannato, Vincent. 2002. The Ungovernable City: John Lindsay and his Struggle to Save New
York. New York, NY: Basic Books.
Card, David, Raj Chetty and Andrea Weber. 2007. “Cash-on-Hand and Competing Models of In-
tertemporal Behavior: New Evidence from the Labor Market.” Quarterly Journal of Economics
122(4):1511–1560.
Caughey, Devin and Jasjeet S. Sekhon. 2010. “Regression-Discontinuity Designs and Popular
Elections: Implications of Pro-Incumbent Bias in Close U.S. House Races.” Available online
at: http://sekhon.berkeley.edu.
Choi, Sang Ok, Sang-Seok Bae, Sung-Wook Kwon and Richard Feiock. 2010. “County Limits.”
The American Review of Public Administration 40(1):29—45.
Clarke, Terry Nichols and Lorna Crowley Ferguson. 1983. City Money: Political Processes, Fiscal
Strains and Retrenchment. New York, NY: Columbia University Press.
32
Cook, Thomas D., William R. Shaddish and Vivian C. Cook. 2005. “Within-Study Comparisons
of Experiments and Non-Experiments: What the Findings Imply for the Validity of Different
Kinds of Observational Study.” Paper presented at the French Econometric Society Meeting
on Program Evaluation, Paris, France.
Craw, Michael. 2006. “Overcoming City Limits: Vertical and Horizontal Models of Local Redis-
tributive Policy Making.” Social Science Quarterly 87(2):361—379.
Dawson, Michael C. 1994. Behind the Mule: Race and Class in African-American Politics.
Princeton, NJ: Princeton University Press.
Dreier, Peter, John Mollenkopf and Todd Swanstrom. 2001. Place Matters: Metropolitics for the
Twenty-first Century. Lawrence, KS: University of Kansas Press.
Eisinger, Peter K. 1982. “Black Employment in Municipal Jobs: The Impact of Black Political
Power.” American Political Science Review 76(2):380–392.
Ferreira, Fernando and Joseph Gyourko. 2009. “Do Political Parties Matter? Evidence from U.S.
Cities.” Quarterly Journal of Economics 124(1):349–397.
Ferreira, Fernando and Joseph Gyourko. 2011. “Does Gender Matter for Political Leadership?
The Case of U.S. Mayors.” Available online at: http://real.wharton.upenn.edu/ fferreir/.
Folke, Olle. N.d. “Shades of Brown and Green: Party Effects in Proportional Election Systems.”
Unpublished manuscript.
Friesema, H. Paul. 1969. “Black Control of Central Cities: The Hollow Prize.” Journal of the
American Planning Association 35(2):75–79.
Fuchs, Ester. 1992. Mayors and Money: Fiscal Policy in New York and Chicago. Chicago, IL:
University of Chicago Press.
Gay, Claudine. 2004. “Putting Race in Context: Identifying the Environmental Determinants of
Black Racial Attitudes.” American Political Science Review 98(4):547–581.
Gennaro, Lorrane. 2008. “Slash and Burn.” South Philly Review (November 20).
Gerber, Alan, Dan Kessler and Marc Meredith. 2011. “The Persuasive Effects of Direct Mail: A
Regression Discontinuity Approach.” Journal of Politics, Forthcoming.
33
Gerber, Elisabeth R. and Daniel J. Hopkins. 2011. “When Mayors Matter: Estimating the Impact
of Mayoral Partisanship on City Policy.” American Journal of Political Science .
Gilliam, Frank D. 1996. “Exploring Minority Empowerment: Symbolic Politics, Governing Coali-
tions, and Traces of Political Style in Los Angeles.” American Journal of Political Science
40(1):56–81.
Green, Donald P., Terence Y. Leong, Holger L. Kern, Alan S. Gerber and Christopher W. Larimer.
2009. “Testing the Accuracy of Regression Discontinuity Analysis Using Experimental Bench-
marks.” Political Analysis 17(4):400–417.
Grimmer, Justin, Eitan Hersh, Brian Feinstein and Daniel P. Carpenter. 2011. “Are Close Elec-
tions Random?” Available online at: http://stanford.edu/ jgrimmer/CEF.pdf [accessed Febru-
ary 25 2011].
Hahn, Jinyong, Petra Todd and Wilbert Van der Klauuw. 2001. “Identification and Estimation
of Treatment Effects with a Regression-Discontinuity Design.” Econometrica 69(1):201–209.
Hajnal, Zoltan. 2010. America’s Uneven Democracy: Race, Turnout, and Representation in City
Politics. New York, NY: Cambridge University Press.
Hajnal, Zoltan L. 2007. Changing White Attitudes toward Black Political Leadership. New York,
NY: Cambridge University Press.
Hajnal, Zoltan L. and Jessica Trounstine. 2010. “Who or What Governs?: The Effects of Eco-
nomics, Politics, Institutions, and Needs on Local Spending.” American Politics Research
38(6):1130.
Hero, Rodney E. and Kathleen M. Beatty. 1989. “The Election of Federico Pena as Mayor of
Denver: Analysis and Implications.” Social Science Quarterly 70(2):300–10.
Hochschild, Jennifer. 1995. Facing Up to the American Dream. Princeton, NJ: Princeton Univer-
sity Press.
Hopkins, Daniel J. 2011. “Flooded Communities: Explaining Local Reactions to the Post-Katrina
Migrants.” Political Research Quarterly Forthcoming.
Howard, John R. 1978. “Framework for the Analysis of Urban Black Politics.” Annals of the
34
American Academy of Political and Social Science 439(September):1–15.
Hurwitz, Jon and Mark Peffley. 1997. “Public Perceptions of Race and Crime: The Role of Racial
Stereotypes.” American Journal of Political Science 41(2):375–401.
Hurwitz, Jon and Mark Peffley. 2005. “Playing the Race Card in the Post-Willie Horton Era.”
Public Opinion Quarterly 69(1):99–112.
Imbens, Guido W. and Thomas Lemieux. 2008. “Regression discontinuity designs: A guide to
practice.” Journal of Econometrics 142(2):615–635.
Jacoby, William G. and Saundra K. Schneider. 2001. “Variability in State Policy Priorities: An
Empirical Analysis.” Journal of Politics 63(2):544–568.
Jaffe, Harry and Tom Sherwood. 1994. Dream City: Race, Power, and the Decline of Washington,
DC. New York, NY: Simon and Schuster.
Johnson, Jason. 2006. “Homicide Rate a Top Issue in Council, Mayoral Races: Challengers
Accuse Current Mayor of Lacking Leadership.” San Francisco Chronicle (October 26).
Jones, Sam. 2009. “2009 State of the City Address, Mobile, Alabama.” Available online at:
http://www.scribd.com/doc/15694454/State-of-the-City-Publication.
Karnig, Albert K. and Susan Welch. 1980. Black Representation and Urban Policy. Chicago, IL:
University of Chicago Press.
Kaufmann, Karen M. 2004. The Urban Voter: Group Conflict and Mayoral Voting Behavior in
American Cities. Ann Arbor, MI: University of Michigan Press.
Keller, Edmund J. 1978. “The Impact of Black Mayors on Urban Policy.” Annals of the American
Academy of Political and Social Science 439(September):40–52.
Kerr, Brinck and Kenneth R. Mladenka. 1994. “Does Politics Matter? A Time-Series Analysis of
Minority Employment Patterns.” American Journal of Political Science 38(4):918–43.
Kinder, Donald and Nicholas Winter. 2001. “Exploring the Racial Divide: Blacks, Whites, and
Opinion on National Policy.” American Journal of Political Science 45(April):439–56.
Kinder, Donald R. and Lynn M. Sanders. 1996. Divided by Color: Racial Politics and Democratic
Ideals. Chicago, IL: University of Chicago Press.
35
King, Gary, James Honaker, Anne Joseph and Kenneth Scheve. 2001. “Analyzing Incomplete
Political Science Data: An Alternative Algorithm for Multiple Imputation.” American Political
Science Review 95(1):49–69.
Kirtzman, Andrew. 2000. Rudy Giuliani: Emperor of the City. New York: William Morrow and
Company.
Kraus, Neil and Todd Swanstrom. 2001. “Minority Mayors and the Hollow-Prize Problem.” PS:
Political Science and Politics 34(1):99–105.
Krebs, Timothy and David Holian. 2009. “Television Advertising in Mayoral Campaigns.” Paper
presented at the Annual Meeting of the American Political Science Association, Toronto, ON.
Available online at: http://ssrn.com/abstract=1450987.
Kruse, Kevin M. 2005. White Flight: Atlanta and the Making of Modern Conservatism. Princeton,
NJ: Princeton University Press.
Ladd, Helen F. and John Yinger. 1989. America’s Ailing Cities: Fiscal Health and the Design of
Urban Policy. Baltimore, MD: Johns Hopkins University Press.
Lassiter, Matthew D. 2006. The Silent Majority: Suburban Politics in the Sunbelt South. Prince-
ton, NJ: Princeton University Press.
Leavy, Walter. 1992. “Take Charge: A Big Victory in Cincinnati.” Ebony (March):108–110.
Lee, David S., Enrico Moretti and Matthew J. Butler. 2004. “Do Voters Affect or Elect Policies?
Evidence from the U.S. House.” Quarterly Journal of Economics 119:807–859.
Leigh, Andrew. 2007. “Estimating the impact of gubernatorial partisanship on policy settings
and economic outcomes: A regression discontinuity approach.” European Journal of Political
Economy 24:256–68.
Levitt, Steven D. 1997. “Using Electoral Cycles in Police Hiring to Estimate the Effect of Police
on Crime.” American Economic Review 87(3):270–290.
Lowi, Theodore J. 1964. At the Pleasure of the Mayor: Power and Patronage in New York City,
1898-1958. New York: Free Press.
Marschall, Melissa and Anirudh V. S. Ruhil. 2007. “Substantive Symbols: The Attitudinal Di-
36
mension of Black Political Incorporation in Local Government.” American Journal of Political
Science 51(1):17–33.
Marschall, Melissa J. and Anirudh V.S. Ruhil. 2006. “The Pomp of Power: Black Mayoralties in
Urban America.” Social Science Quarterly 87(4):828–850.
McClain, Paula D. 1993. “The Changing Dynamics of Urban Politics: Black and Hispanic Mu-
nicipal Employment–Is There Competition?” Journal of Politics 55(2):399–414.
McCrary, Peyton. 1990. “Racially Polarized Voting in the South: Quantitative Evidence from
the Courtroom.” Social Science History 14(4):507–31.
Meier, Kenneth J. and Robert E. England. 1984. “Black Representation and Educational Policy:
Are They Related?” American Political Science Review 78:392–403.
Mendelberg, Tali. 2001. The Race Card: Campaign Strategy, Implicit Messages, and the Norm
of Equality. Princeton, NJ: Princeton University Press.
Meredith, Marc. 2009. “Persistence in Political Participation.” Quarterly Journal of Political
Science 4(3):187–209.
Mollenkopf. 1992. A Phoenix in the Ashes: The Rise and Fall of the Koch Coalition in New York
City Politics. Princeton, NJ: Princeton University Press.
Mollenkopf, John H. 1983. The Contested City. Princeton, NJ: Princeton University Press.
Morgan, David R. and Sheilah S. Watson. 1995. “The Effects of Mayoral Power on Urban Fiscal
Policy.” Policy Studies Journal 23(2):231–243.
Mullainathan, Sendhil and Ebonya Washington. 2009. “Sticking with Your Vote: Cognitive
Dissonance and Voting.” American Economics Journal: Applied Economics 1:86–111.
Nelson, William E. 1978. “Black Mayors as Urban Managers.” Annals of the American Academy
of Political and Social Sciences 439(September):53–67.
Nivola, Pietro S. 2002. Tense Commandments: Federal Prescriptions and City Problems. Wash-
ington, DC: Brookings Institution Press.
Nye, John V.C., Ilia Rainer and Thomas Stratmann. 2010. “Do Black Mayors Improve
Black Employment Outcomes? Evidence from Large U.S. Cities.” Available at SSRN:
37
http://ssrn.com/abstract=1585283.
Orr, Marion. 1999. Black Social Capital: The Politics of School Reform in Baltimore, 1986-1998.
Lawrence, KS: University of Kansas Press.
Pelissero, John P., David B. Holian and Laura A. Tomaka. 2000. “Does Political Incorporation
Matter? The Impact of Minority Mayors over Time.” Urban Affairs Review 36(1):84–92.
Peterson, Paul. 1981. City Limits. Chicago, IL: University of Chicago Press.
Radcliff, Benjamin and Martin Saiz. 1995. “Race, Turnout, and Public Policy in the American
States.” Political Research Quarterly 48(4):775–794.
Rae, Douglas W. 2003. City: Urbanism and Its End. New Haven, CT: Yale University Press.
Reckhow, Sarah. 2009. “The Distinct Patterns of Organized and Elected Representation of Racial
and Ethnic Groups.” Urban Affairs Review 45(2):188.
Rehavi, M. Marit. 2010. “Sex and Politics: Do Female Legislators Affect State Spending?”
University of British Columbia.
Royko, Mike. 1971. Boss: Richard J. Daley of Chicago. New York: Plume.
Saltzstein, Grace Hall. 1989. “Black Mayors and Police Policies.” Journal of Politics 51(3):525–
544.
Schafer, Joseph L. 1997. Analysis of incomplete multivariate data. London: Chapman & Hall.
Schochet, Peter Z. 2009. “Statistical Power for Regression Discontinuity Designs in Education
Evaluations.” Journal of Educational and Behavioral Statistics 34(2):238–266.
Self, Robert O. 2003. American Babylon: Race and the Struggle for Postwar Oakland. Princeton,
NJ: Princeton University Press.
Sellers, Jeffrey M. 2001. Governing from Below: Urban Regions and the Global Economy. New
York, NY: Cambridge University Press.
Sharp, Elaine. 2006. “Policing Urban America: A New Look at the Politics of Agency Size.”
Social Science Quarterly 87(2):291—307.
Sherman, Lola. 2004. “Oceanside won’t hike builders’ fees: Requirement pays for low-income
homes.” San Diego Union-Tribune (March 5).
38
Sonenshein, Raphael J. 1993. Politics in Black and White: Race and Power in Los Angeles.
Princeton, New Jersey: Princeton University Press.
Stone, Clarence N. 1989. Regime Politics: Governing Atlanta 1946-1988. Lawrence, KS: Univer-
sity of Kansas Press.
Sugrue, Thomas J. 1996. The Origins of the Urban Crisis: Race and Inequality in Postwar
Detroit. Princeton, NJ: Princeton University Press.
Suits, Daniel B. 1977. “Measurement of Tax Progressivity.” American Economic Review
67(4):747–752.
Swain, Carol M. 1995. Black Faces, Black Interests: The Representation of African Americans
in Congress. Cambridge, MA: Harvard University Press.
Tate, Katherine. 1993. From Protest to Politics. New York, NY: Russell Sage Foundation.
Thompson, Helen Ann. 2001. Whose Detroit? Politics, Labor, and Race in an American City.
Ithaca, NY: Cornell University Press.
Thompson, J. Phillip. 2006. Double Trouble: Black Mayors, Black Communities, and the Call
for a Deep Democracy. New York, NY: Oxford University Press.
Trounstine, Jessica. 2011. “Evidence of a Local Incumbency Advantage.” Available online at:
http://faculty.ucmerced.edu/jtrounstine/index.htm.
Valentino, Nicholas. 1999. “Crime and the Priming of Racial Attitudes During Evaluations of the
President.” Public Opinion Quarterly 63:293–320.
Weir, Margaret. 2000. Coalition-Building for Regionalism. In Reflections on Regionalism, ed.
Bruce Katz. Washington, DC: Brookings Institution Press pp. 127–153.
Weir, Margaret, Harold Wolman and Todd Swanstrom. 2005. “The Calculus of Coalitions: Cities,
Suburbs, and the Metropolitan Agenda.” Urban Affairs Review 40(6):730–760.
Westfall, Peter H. and Stanley S. Young. 1993. Resampling-Based Multiple Testing: Examples
and Methods for p-Value Adjustment. New York, NY: Wiley.
Whitby, Kenneth J. 1997. The Color of Representation: Congressional Behavior and Black
Interests. Ann Arbor, MI: University of Michigan Press.
39
Wilson, William J. 1996. When Work Disappears: The World of the New Urban Poor. New York,
NY: Alfred a Knopf Inc.
Wolman, Harold, John Strate and Alan Melchior. 1996. “Does Changing Mayors Matter?” Jour-
nal of Politics 58(1):201–223.
Wooldridge, Jeffrey M. 2003. “Cluster-Sample Methods in Applied Econometrics.” American
Economic Review 93(2):133–138.
40
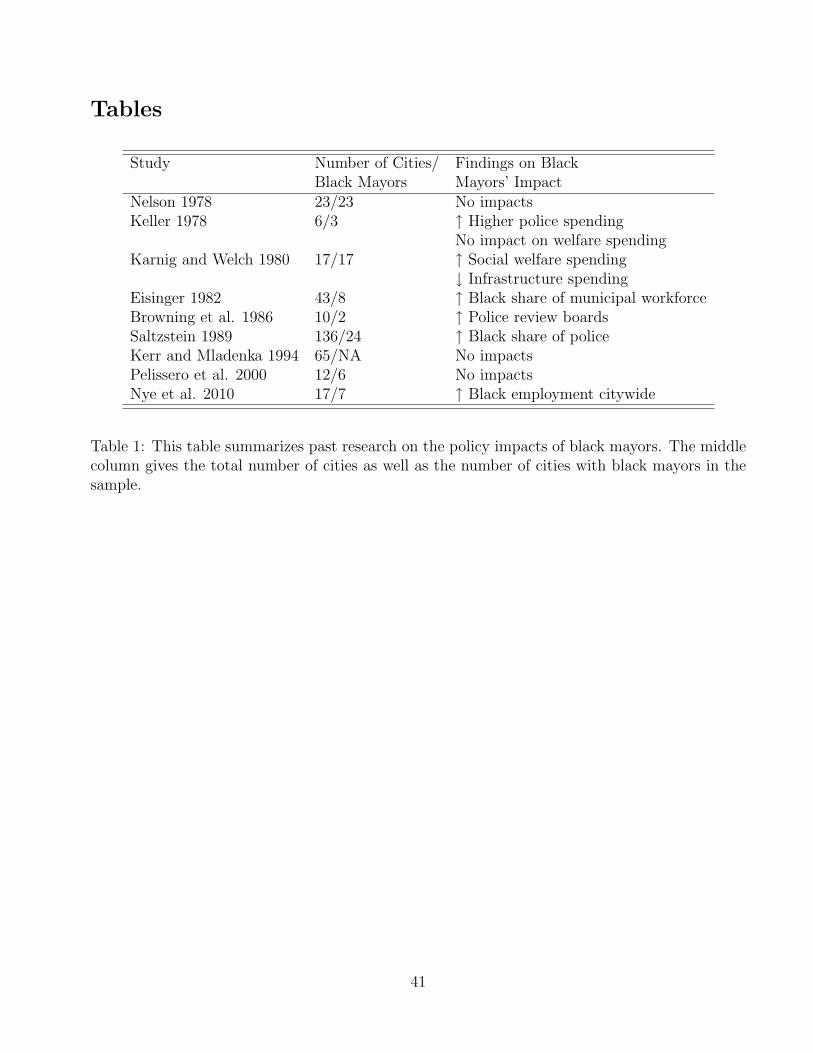
Tables
Study Number of Cities/ Findings on BlackBlack Mayors Mayors’ Impact
Nelson 1978 23/23 No impactsKeller 1978 6/3 ↑ Higher police spending
No impact on welfare spendingKarnig and Welch 1980 17/17 ↑ Social welfare spending
↓ Infrastructure spendingEisinger 1982 43/8 ↑ Black share of municipal workforceBrowning et al. 1986 10/2 ↑ Police review boardsSaltzstein 1989 136/24 ↑ Black share of policeKerr and Mladenka 1994 65/NA No impactsPelissero et al. 2000 12/6 No impactsNye et al. 2010 17/7 ↑ Black employment citywide
Table 1: This table summarizes past research on the policy impacts of black mayors. The middlecolumn gives the total number of cities as well as the number of cities with black mayors in thesample.
41
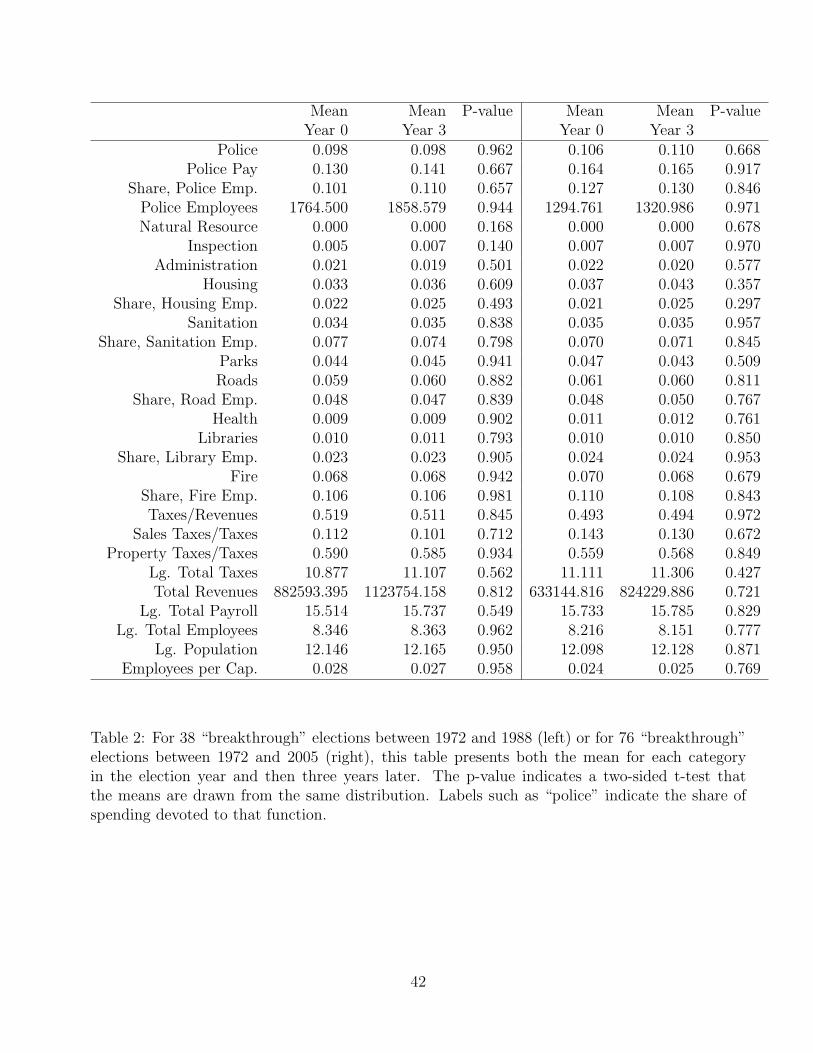
Mean Mean P-value Mean Mean P-valueYear 0 Year 3 Year 0 Year 3
Police 0.098 0.098 0.962 0.106 0.110 0.668Police Pay 0.130 0.141 0.667 0.164 0.165 0.917
Share, Police Emp. 0.101 0.110 0.657 0.127 0.130 0.846Police Employees 1764.500 1858.579 0.944 1294.761 1320.986 0.971Natural Resource 0.000 0.000 0.168 0.000 0.000 0.678
Inspection 0.005 0.007 0.140 0.007 0.007 0.970Administration 0.021 0.019 0.501 0.022 0.020 0.577
Housing 0.033 0.036 0.609 0.037 0.043 0.357Share, Housing Emp. 0.022 0.025 0.493 0.021 0.025 0.297
Sanitation 0.034 0.035 0.838 0.035 0.035 0.957Share, Sanitation Emp. 0.077 0.074 0.798 0.070 0.071 0.845
Parks 0.044 0.045 0.941 0.047 0.043 0.509Roads 0.059 0.060 0.882 0.061 0.060 0.811
Share, Road Emp. 0.048 0.047 0.839 0.048 0.050 0.767Health 0.009 0.009 0.902 0.011 0.012 0.761
Libraries 0.010 0.011 0.793 0.010 0.010 0.850Share, Library Emp. 0.023 0.023 0.905 0.024 0.024 0.953
Fire 0.068 0.068 0.942 0.070 0.068 0.679Share, Fire Emp. 0.106 0.106 0.981 0.110 0.108 0.843Taxes/Revenues 0.519 0.511 0.845 0.493 0.494 0.972
Sales Taxes/Taxes 0.112 0.101 0.712 0.143 0.130 0.672Property Taxes/Taxes 0.590 0.585 0.934 0.559 0.568 0.849
Lg. Total Taxes 10.877 11.107 0.562 11.111 11.306 0.427Total Revenues 882593.395 1123754.158 0.812 633144.816 824229.886 0.721
Lg. Total Payroll 15.514 15.737 0.549 15.733 15.785 0.829Lg. Total Employees 8.346 8.363 0.962 8.216 8.151 0.777
Lg. Population 12.146 12.165 0.950 12.098 12.128 0.871Employees per Cap. 0.028 0.027 0.958 0.024 0.025 0.769
Table 2: For 38 “breakthrough” elections between 1972 and 1988 (left) or for 76 “breakthrough”elections between 1972 and 2005 (right), this table presents both the mean for each categoryin the election year and then three years later. The p-value indicates a two-sided t-test thatthe means are drawn from the same distribution. Labels such as “police” indicate the share ofspending devoted to that function.
42
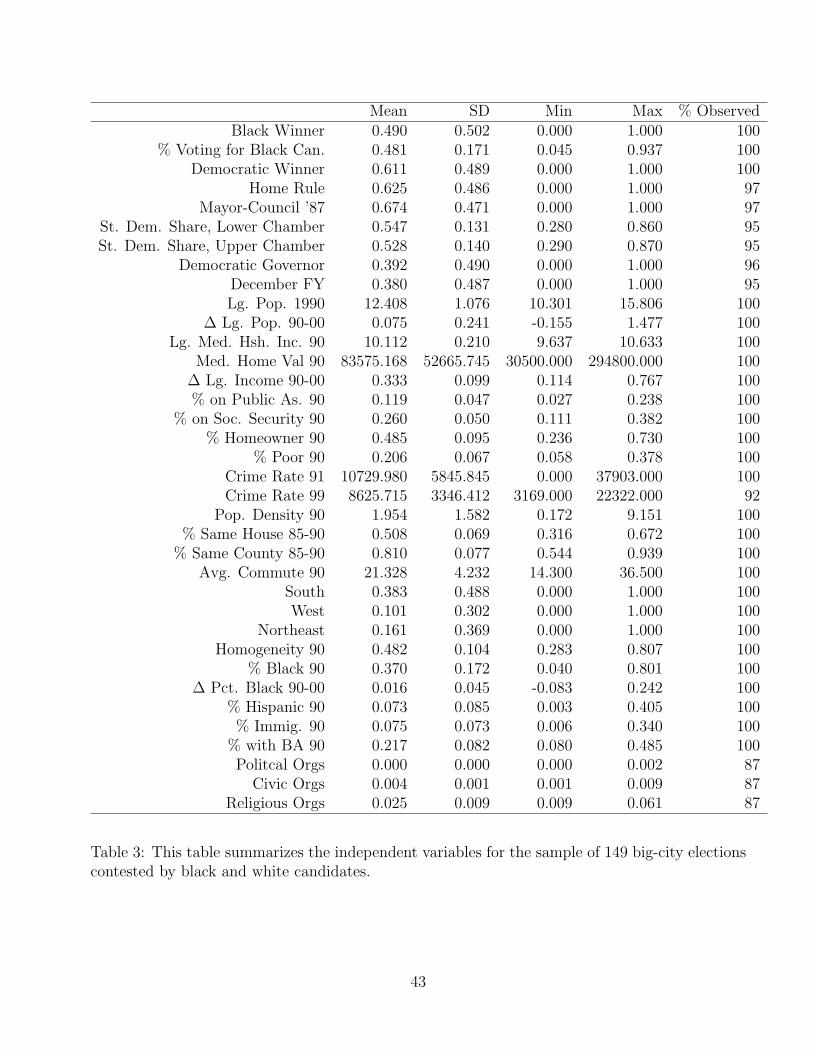
Mean SD Min Max % ObservedBlack Winner 0.490 0.502 0.000 1.000 100
% Voting for Black Can. 0.481 0.171 0.045 0.937 100Democratic Winner 0.611 0.489 0.000 1.000 100
Home Rule 0.625 0.486 0.000 1.000 97Mayor-Council ’87 0.674 0.471 0.000 1.000 97
St. Dem. Share, Lower Chamber 0.547 0.131 0.280 0.860 95St. Dem. Share, Upper Chamber 0.528 0.140 0.290 0.870 95
Democratic Governor 0.392 0.490 0.000 1.000 96December FY 0.380 0.487 0.000 1.000 95Lg. Pop. 1990 12.408 1.076 10.301 15.806 100
∆ Lg. Pop. 90-00 0.075 0.241 -0.155 1.477 100Lg. Med. Hsh. Inc. 90 10.112 0.210 9.637 10.633 100
Med. Home Val 90 83575.168 52665.745 30500.000 294800.000 100∆ Lg. Income 90-00 0.333 0.099 0.114 0.767 100% on Public As. 90 0.119 0.047 0.027 0.238 100
% on Soc. Security 90 0.260 0.050 0.111 0.382 100% Homeowner 90 0.485 0.095 0.236 0.730 100
% Poor 90 0.206 0.067 0.058 0.378 100Crime Rate 91 10729.980 5845.845 0.000 37903.000 100Crime Rate 99 8625.715 3346.412 3169.000 22322.000 92
Pop. Density 90 1.954 1.582 0.172 9.151 100% Same House 85-90 0.508 0.069 0.316 0.672 100
% Same County 85-90 0.810 0.077 0.544 0.939 100Avg. Commute 90 21.328 4.232 14.300 36.500 100
South 0.383 0.488 0.000 1.000 100West 0.101 0.302 0.000 1.000 100
Northeast 0.161 0.369 0.000 1.000 100Homogeneity 90 0.482 0.104 0.283 0.807 100
% Black 90 0.370 0.172 0.040 0.801 100∆ Pct. Black 90-00 0.016 0.045 -0.083 0.242 100
% Hispanic 90 0.073 0.085 0.003 0.405 100% Immig. 90 0.075 0.073 0.006 0.340 100
% with BA 90 0.217 0.082 0.080 0.485 100Politcal Orgs 0.000 0.000 0.000 0.002 87
Civic Orgs 0.004 0.001 0.001 0.009 87Religious Orgs 0.025 0.009 0.009 0.061 87
Table 3: This table summarizes the independent variables for the sample of 149 big-city electionscontested by black and white candidates.
43
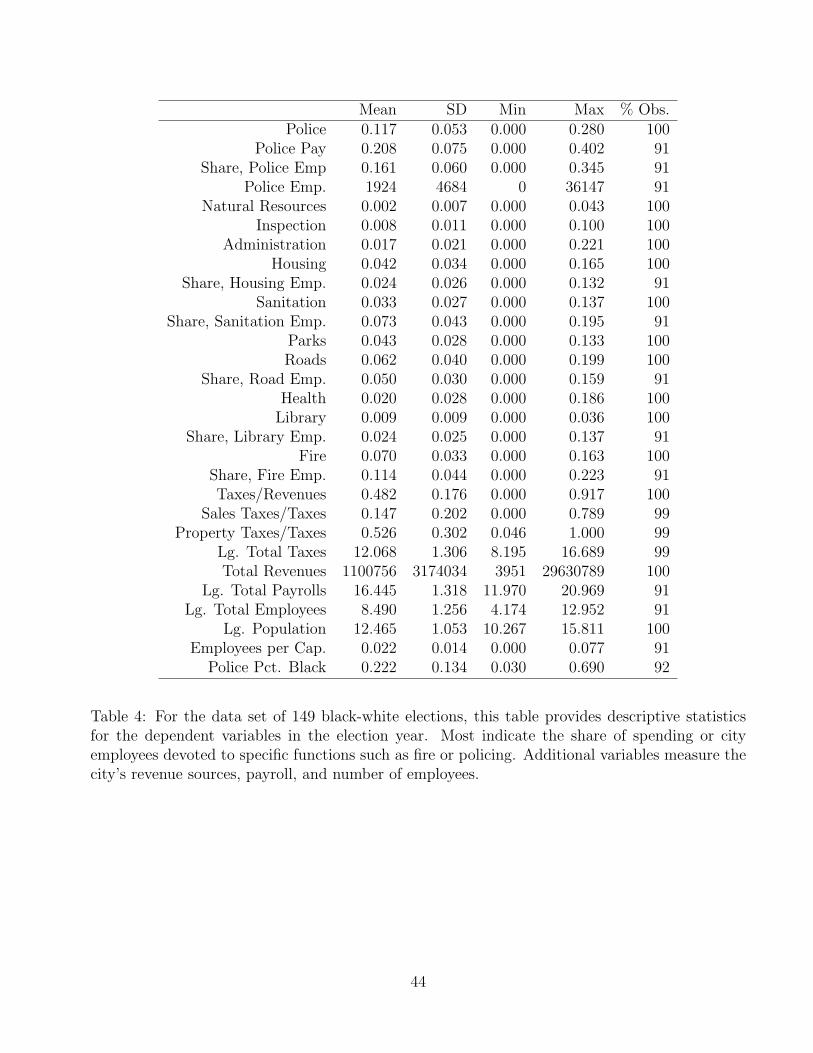
Mean SD Min Max % Obs.Police 0.117 0.053 0.000 0.280 100
Police Pay 0.208 0.075 0.000 0.402 91Share, Police Emp 0.161 0.060 0.000 0.345 91
Police Emp. 1924 4684 0 36147 91Natural Resources 0.002 0.007 0.000 0.043 100
Inspection 0.008 0.011 0.000 0.100 100Administration 0.017 0.021 0.000 0.221 100
Housing 0.042 0.034 0.000 0.165 100Share, Housing Emp. 0.024 0.026 0.000 0.132 91
Sanitation 0.033 0.027 0.000 0.137 100Share, Sanitation Emp. 0.073 0.043 0.000 0.195 91
Parks 0.043 0.028 0.000 0.133 100Roads 0.062 0.040 0.000 0.199 100
Share, Road Emp. 0.050 0.030 0.000 0.159 91Health 0.020 0.028 0.000 0.186 100
Library 0.009 0.009 0.000 0.036 100Share, Library Emp. 0.024 0.025 0.000 0.137 91
Fire 0.070 0.033 0.000 0.163 100Share, Fire Emp. 0.114 0.044 0.000 0.223 91Taxes/Revenues 0.482 0.176 0.000 0.917 100
Sales Taxes/Taxes 0.147 0.202 0.000 0.789 99Property Taxes/Taxes 0.526 0.302 0.046 1.000 99
Lg. Total Taxes 12.068 1.306 8.195 16.689 99Total Revenues 1100756 3174034 3951 29630789 100
Lg. Total Payrolls 16.445 1.318 11.970 20.969 91Lg. Total Employees 8.490 1.256 4.174 12.952 91
Lg. Population 12.465 1.053 10.267 15.811 100Employees per Cap. 0.022 0.014 0.000 0.077 91
Police Pct. Black 0.222 0.134 0.030 0.690 92
Table 4: For the data set of 149 black-white elections, this table provides descriptive statisticsfor the dependent variables in the election year. Most indicate the share of spending or cityemployees devoted to specific functions such as fire or policing. Additional variables measure thecity’s revenue sources, payroll, and number of employees.
44
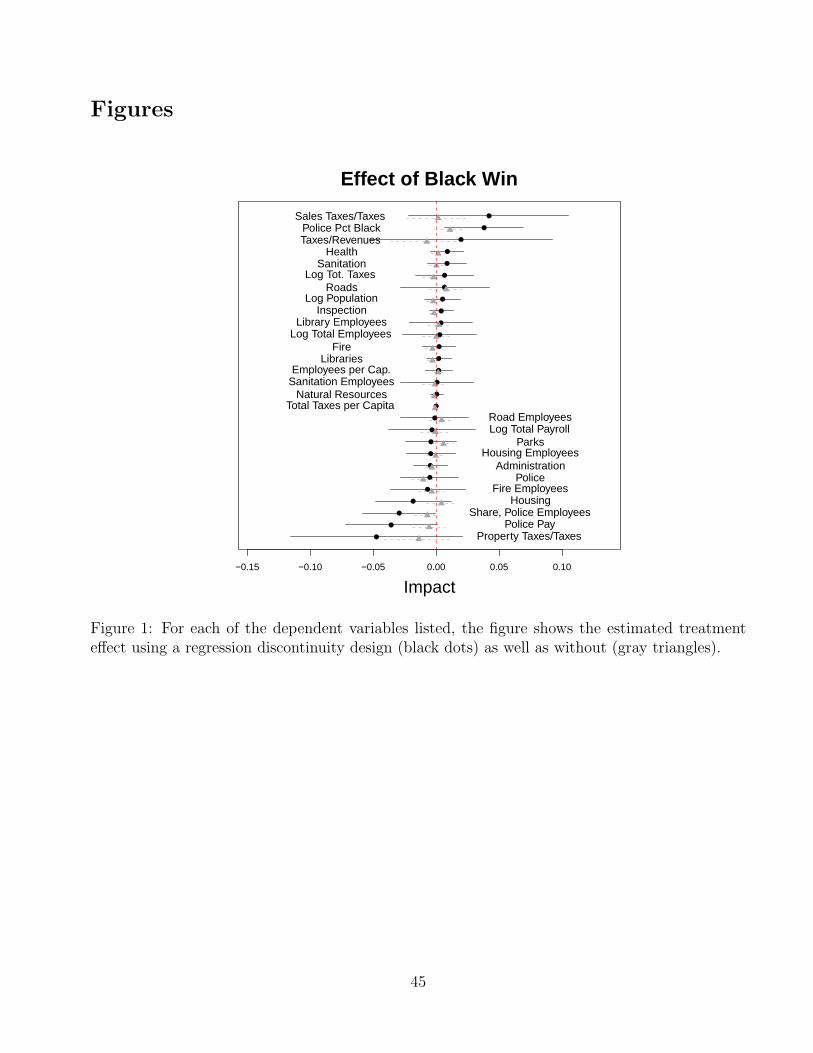
Figures
−0.15 −0.10 −0.05 0.00 0.05 0.10
Effect of Black Win
Impact
Property Taxes/TaxesPolice Pay
Share, Police EmployeesHousing
Fire EmployeesPolice
AdministrationHousing Employees
ParksLog Total PayrollRoad Employees
Total Taxes per CapitaNatural Resources
Sanitation EmployeesEmployees per Cap.
LibrariesFire
Log Total EmployeesLibrary Employees
InspectionLog Population
RoadsLog Tot. Taxes
SanitationHealth
Taxes/RevenuesPolice Pct Black
Sales Taxes/Taxes
Figure 1: For each of the dependent variables listed, the figure shows the estimated treatmenteffect using a regression discontinuity design (black dots) as well as without (gray triangles).
45
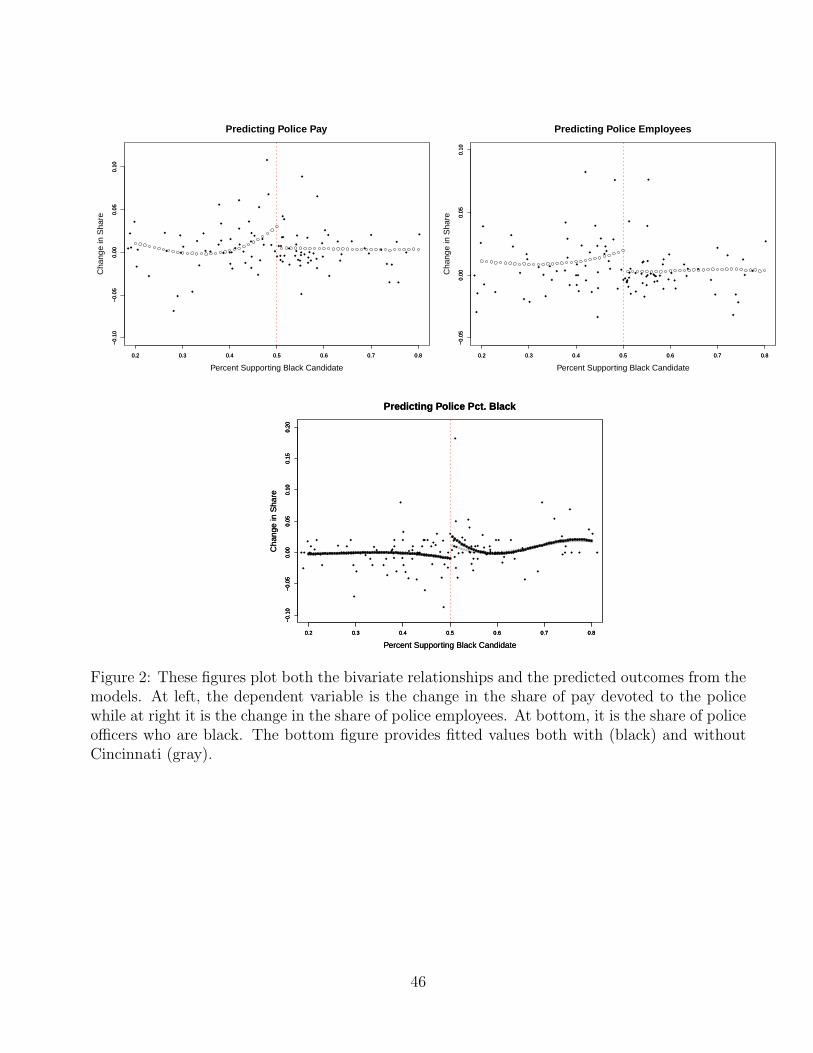
0.2 0.3 0.4 0.5 0.6 0.7 0.8
−0.
10−
0.05
0.00
0.05
0.10
Predicting Police Pay
Percent Supporting Black Candidate
Cha
nge
in S
hare
0.2 0.3 0.4 0.5 0.6 0.7 0.8
−0.
10−
0.05
0.00
0.05
0.10
0.2 0.3 0.4 0.5 0.6 0.7 0.8
−0.
050.
000.
050.
10
Predicting Police Employees
Percent Supporting Black Candidate
Cha
nge
in S
hare
0.2 0.3 0.4 0.5 0.6 0.7 0.8
−0.
050.
000.
050.
10
0.2 0.3 0.4 0.5 0.6 0.7 0.8
−0.
10−
0.05
0.00
0.05
0.10
0.15
0.20
Predicting Police Pct. Black
Percent Supporting Black Candidate
Cha
nge
in S
hare
0.2 0.3 0.4 0.5 0.6 0.7 0.8
−0.
10−
0.05
0.00
0.05
0.10
0.15
0.20
Predicting Police Pct. Black
Percent Supporting Black Candidate
Cha
nge
in S
hare
0.2 0.3 0.4 0.5 0.6 0.7 0.8
−0.
10−
0.05
0.00
0.05
0.10
0.15
0.20
Figure 2: These figures plot both the bivariate relationships and the predicted outcomes from themodels. At left, the dependent variable is the change in the share of pay devoted to the policewhile at right it is the change in the share of police employees. At bottom, it is the share of policeofficers who are black. The bottom figure provides fitted values both with (black) and withoutCincinnati (gray).
46
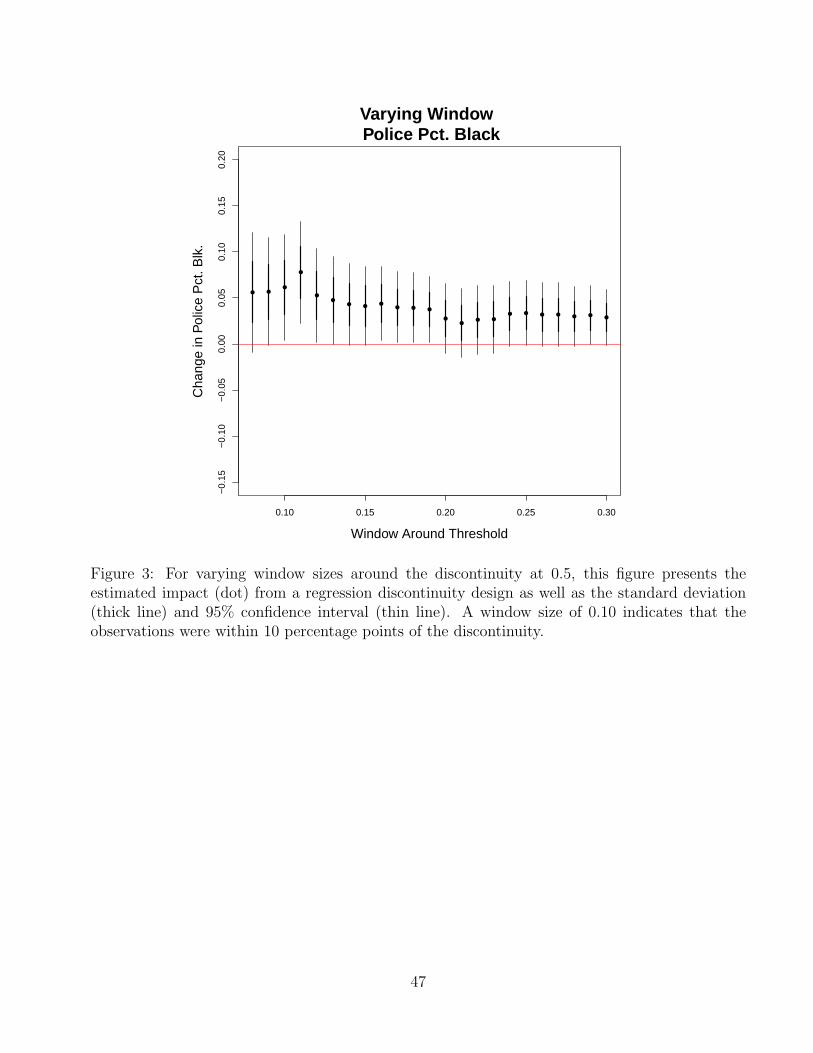
0.10 0.15 0.20 0.25 0.30
−0.
15−
0.10
−0.
050.
000.
050.
100.
150.
20
Varying Window Police Pct. Black
Window Around Threshold
Cha
nge
in P
olic
e P
ct. B
lk.
Figure 3: For varying window sizes around the discontinuity at 0.5, this figure presents theestimated impact (dot) from a regression discontinuity design as well as the standard deviation(thick line) and 95% confidence interval (thin line). A window size of 0.10 indicates that theobservations were within 10 percentage points of the discontinuity.
47
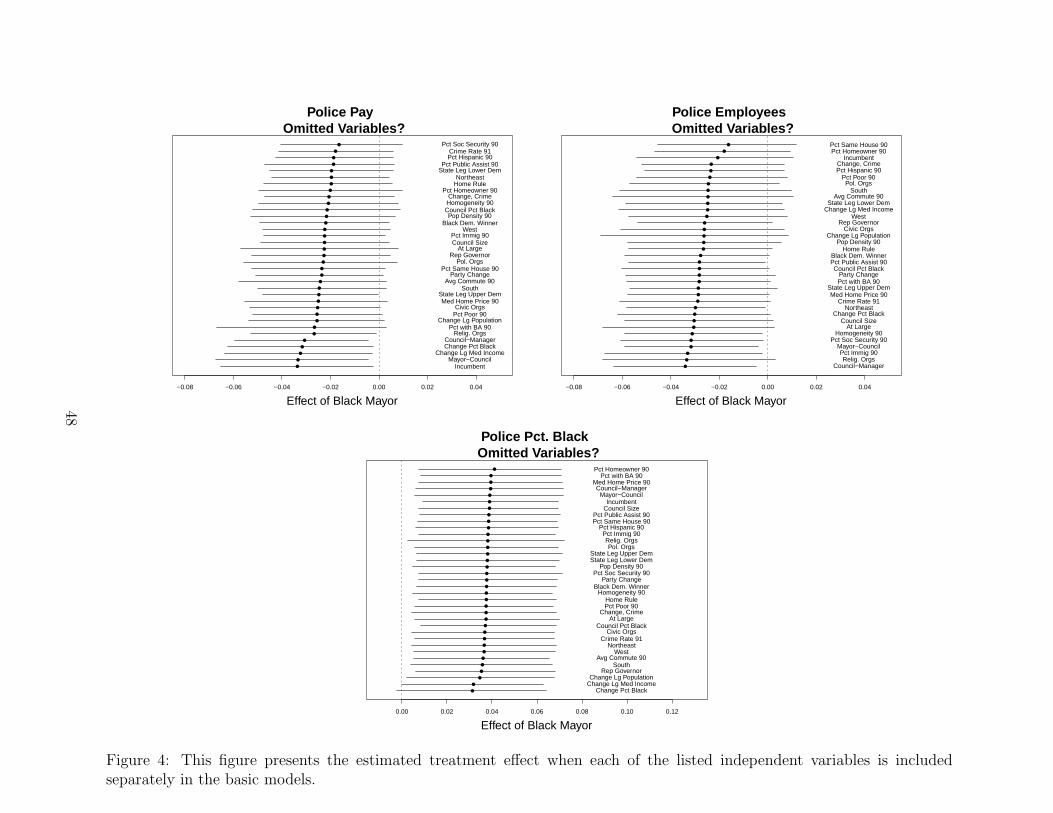
−0.08 −0.06 −0.04 −0.02 0.00 0.02 0.04
Police Pay Omitted Variables?
Effect of Black Mayor
IncumbentMayor−Council
Change Lg Med IncomeChange Pct BlackCouncil−Manager
Relig. OrgsPct with BA 90
Change Lg PopulationPct Poor 90Civic Orgs
Med Home Price 90State Leg Upper Dem
SouthAvg Commute 90
Party ChangePct Same House 90
Pol. OrgsRep Governor
At LargeCouncil SizePct Immig 90
WestBlack Dem. Winner
Pop Density 90Council Pct BlackHomogeneity 90Change, Crime
Pct Homeowner 90Home RuleNortheast
State Leg Lower DemPct Public Assist 90
Pct Hispanic 90Crime Rate 91
Pct Soc Security 90
−0.08 −0.06 −0.04 −0.02 0.00 0.02 0.04
Police Employees Omitted Variables?
Effect of Black Mayor
Council−ManagerRelig. Orgs
Pct Immig 90Mayor−Council
Pct Soc Security 90Homogeneity 90
At LargeCouncil Size
Change Pct BlackNortheast
Crime Rate 91Med Home Price 90
State Leg Upper DemPct with BA 90Party Change
Council Pct BlackPct Public Assist 90Black Dem. Winner
Home RulePop Density 90
Change Lg PopulationCivic Orgs
Rep GovernorWest
Change Lg Med IncomeState Leg Lower Dem
Avg Commute 90South
Pol. OrgsPct Poor 90
Pct Hispanic 90Change, Crime
IncumbentPct Homeowner 90Pct Same House 90
0.00 0.02 0.04 0.06 0.08 0.10 0.12
Police Pct. Black Omitted Variables?
Effect of Black Mayor
Change Pct BlackChange Lg Med IncomeChange Lg Population
Rep GovernorSouth
Avg Commute 90West
NortheastCrime Rate 91
Civic OrgsCouncil Pct Black
At LargeChange, Crime
Pct Poor 90Home Rule
Homogeneity 90Black Dem. Winner
Party ChangePct Soc Security 90
Pop Density 90State Leg Lower DemState Leg Upper Dem
Pol. OrgsRelig. Orgs
Pct Immig 90Pct Hispanic 90
Pct Same House 90Pct Public Assist 90
Council SizeIncumbent
Mayor−CouncilCouncil−Manager
Med Home Price 90Pct with BA 90
Pct Homeowner 90
Figure 4: This figure presents the estimated treatment effect when each of the listed independent variables is includedseparately in the basic models.
48
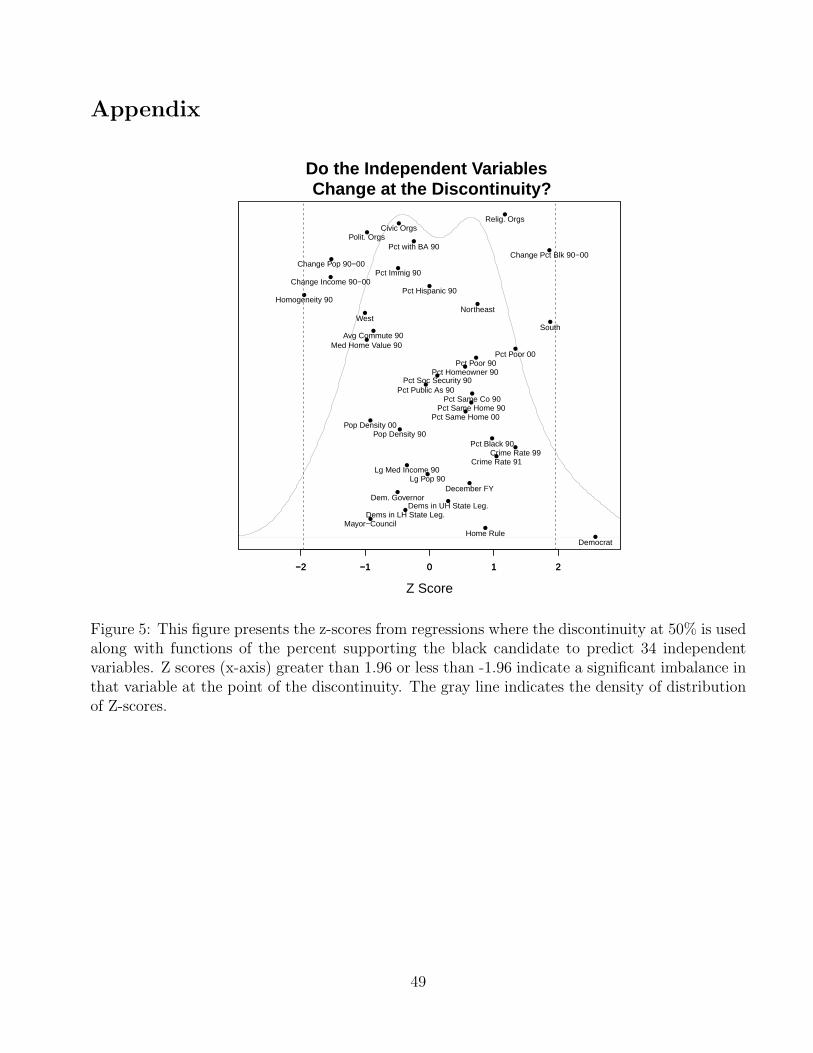
Appendix
−2 −1 0 1 2−2 −1 0 1 2
Do the Independent Variables Change at the Discontinuity?
Z Score
DemocratHome Rule
Mayor−CouncilDems in LH State Leg.
Dems in UH State Leg.Dem. Governor
December FYLg Pop 90
Lg Med Income 90Crime Rate 91
Crime Rate 99Pct Black 90
Pop Density 90Pop Density 00
Pct Same Home 00Pct Same Home 90
Pct Same Co 90Pct Public As 90
Pct Soc Security 90Pct Homeowner 90
Pct Poor 90Pct Poor 00
Med Home Value 90Avg Commute 90
SouthWest
NortheastHomogeneity 90
Pct Hispanic 90Change Income 90−00
Pct Immig 90Change Pop 90−00
Change Pct Blk 90−00Pct with BA 90
Polit. OrgsCivic Orgs
Relig. Orgs
Figure 5: This figure presents the z-scores from regressions where the discontinuity at 50% is usedalong with functions of the percent supporting the black candidate to predict 34 independentvariables. Z scores (x-axis) greater than 1.96 or less than -1.96 indicate a significant imbalance inthat variable at the point of the discontinuity. The gray line indicates the density of distributionof Z-scores.
49
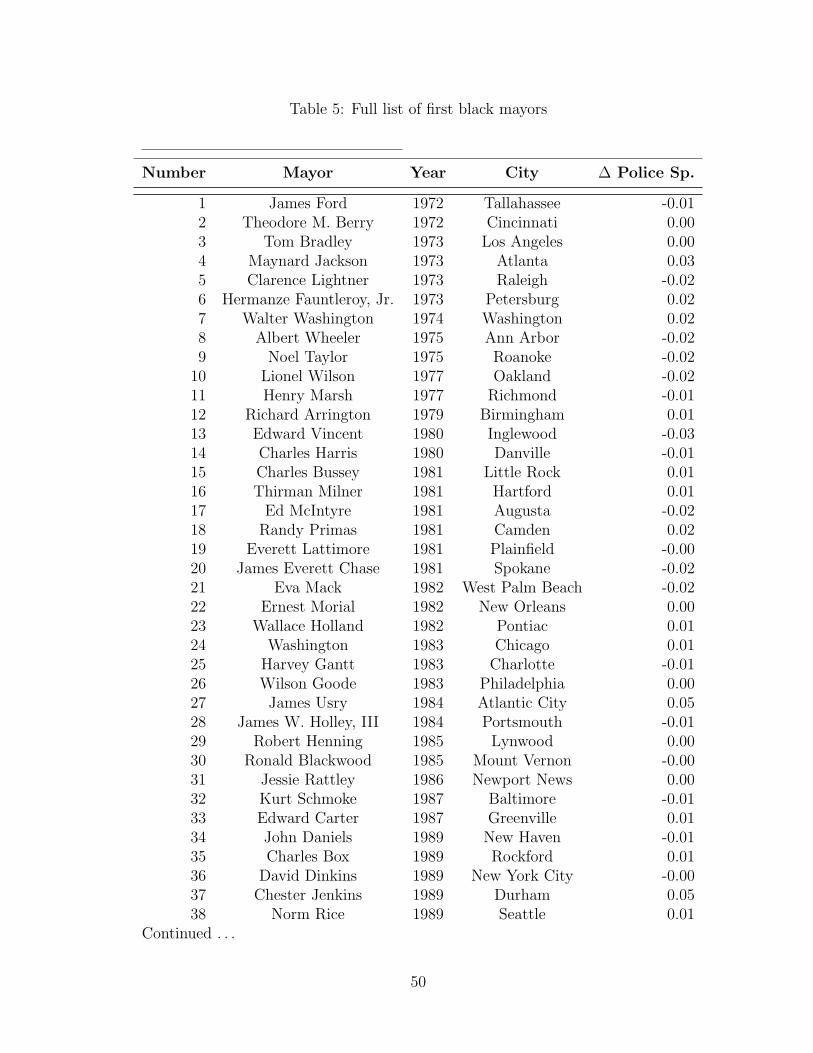
Table 5: Full list of first black mayors
Number Mayor Year City ∆ Police Sp.
1 James Ford 1972 Tallahassee -0.012 Theodore M. Berry 1972 Cincinnati 0.003 Tom Bradley 1973 Los Angeles 0.004 Maynard Jackson 1973 Atlanta 0.035 Clarence Lightner 1973 Raleigh -0.026 Hermanze Fauntleroy, Jr. 1973 Petersburg 0.027 Walter Washington 1974 Washington 0.028 Albert Wheeler 1975 Ann Arbor -0.029 Noel Taylor 1975 Roanoke -0.02
10 Lionel Wilson 1977 Oakland -0.0211 Henry Marsh 1977 Richmond -0.0112 Richard Arrington 1979 Birmingham 0.0113 Edward Vincent 1980 Inglewood -0.0314 Charles Harris 1980 Danville -0.0115 Charles Bussey 1981 Little Rock 0.0116 Thirman Milner 1981 Hartford 0.0117 Ed McIntyre 1981 Augusta -0.0218 Randy Primas 1981 Camden 0.0219 Everett Lattimore 1981 Plainfield -0.0020 James Everett Chase 1981 Spokane -0.0221 Eva Mack 1982 West Palm Beach -0.0222 Ernest Morial 1982 New Orleans 0.0023 Wallace Holland 1982 Pontiac 0.0124 Washington 1983 Chicago 0.0125 Harvey Gantt 1983 Charlotte -0.0126 Wilson Goode 1983 Philadelphia 0.0027 James Usry 1984 Atlantic City 0.0528 James W. Holley, III 1984 Portsmouth -0.0129 Robert Henning 1985 Lynwood 0.0030 Ronald Blackwood 1985 Mount Vernon -0.0031 Jessie Rattley 1986 Newport News 0.0032 Kurt Schmoke 1987 Baltimore -0.0133 Edward Carter 1987 Greenville 0.0134 John Daniels 1989 New Haven -0.0135 Charles Box 1989 Rockford 0.0136 David Dinkins 1989 New York City -0.0037 Chester Jenkins 1989 Durham 0.0538 Norm Rice 1989 Seattle 0.01
Continued . . .
50
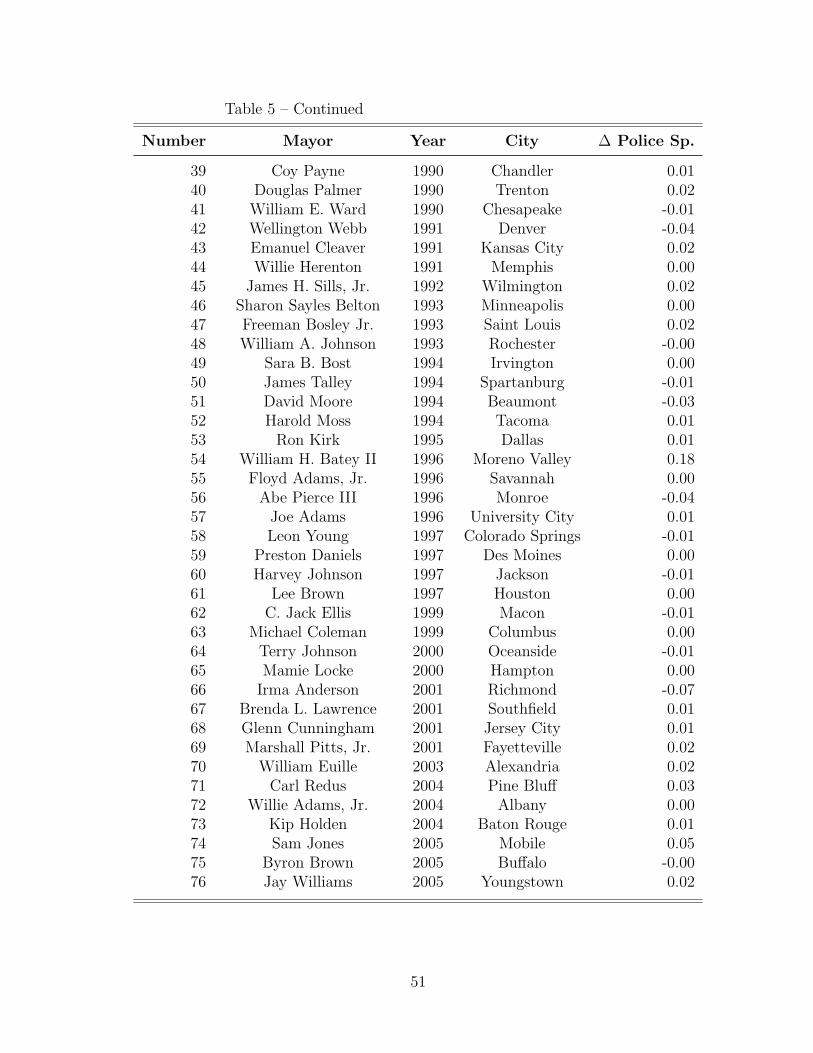
Table 5 – Continued
Number Mayor Year City ∆ Police Sp.
39 Coy Payne 1990 Chandler 0.0140 Douglas Palmer 1990 Trenton 0.0241 William E. Ward 1990 Chesapeake -0.0142 Wellington Webb 1991 Denver -0.0443 Emanuel Cleaver 1991 Kansas City 0.0244 Willie Herenton 1991 Memphis 0.0045 James H. Sills, Jr. 1992 Wilmington 0.0246 Sharon Sayles Belton 1993 Minneapolis 0.0047 Freeman Bosley Jr. 1993 Saint Louis 0.0248 William A. Johnson 1993 Rochester -0.0049 Sara B. Bost 1994 Irvington 0.0050 James Talley 1994 Spartanburg -0.0151 David Moore 1994 Beaumont -0.0352 Harold Moss 1994 Tacoma 0.0153 Ron Kirk 1995 Dallas 0.0154 William H. Batey II 1996 Moreno Valley 0.1855 Floyd Adams, Jr. 1996 Savannah 0.0056 Abe Pierce III 1996 Monroe -0.0457 Joe Adams 1996 University City 0.0158 Leon Young 1997 Colorado Springs -0.0159 Preston Daniels 1997 Des Moines 0.0060 Harvey Johnson 1997 Jackson -0.0161 Lee Brown 1997 Houston 0.0062 C. Jack Ellis 1999 Macon -0.0163 Michael Coleman 1999 Columbus 0.0064 Terry Johnson 2000 Oceanside -0.0165 Mamie Locke 2000 Hampton 0.0066 Irma Anderson 2001 Richmond -0.0767 Brenda L. Lawrence 2001 Southfield 0.0168 Glenn Cunningham 2001 Jersey City 0.0169 Marshall Pitts, Jr. 2001 Fayetteville 0.0270 William Euille 2003 Alexandria 0.0271 Carl Redus 2004 Pine Bluff 0.0372 Willie Adams, Jr. 2004 Albany 0.0073 Kip Holden 2004 Baton Rouge 0.0174 Sam Jones 2005 Mobile 0.0575 Byron Brown 2005 Buffalo -0.0076 Jay Williams 2005 Youngstown 0.02
51
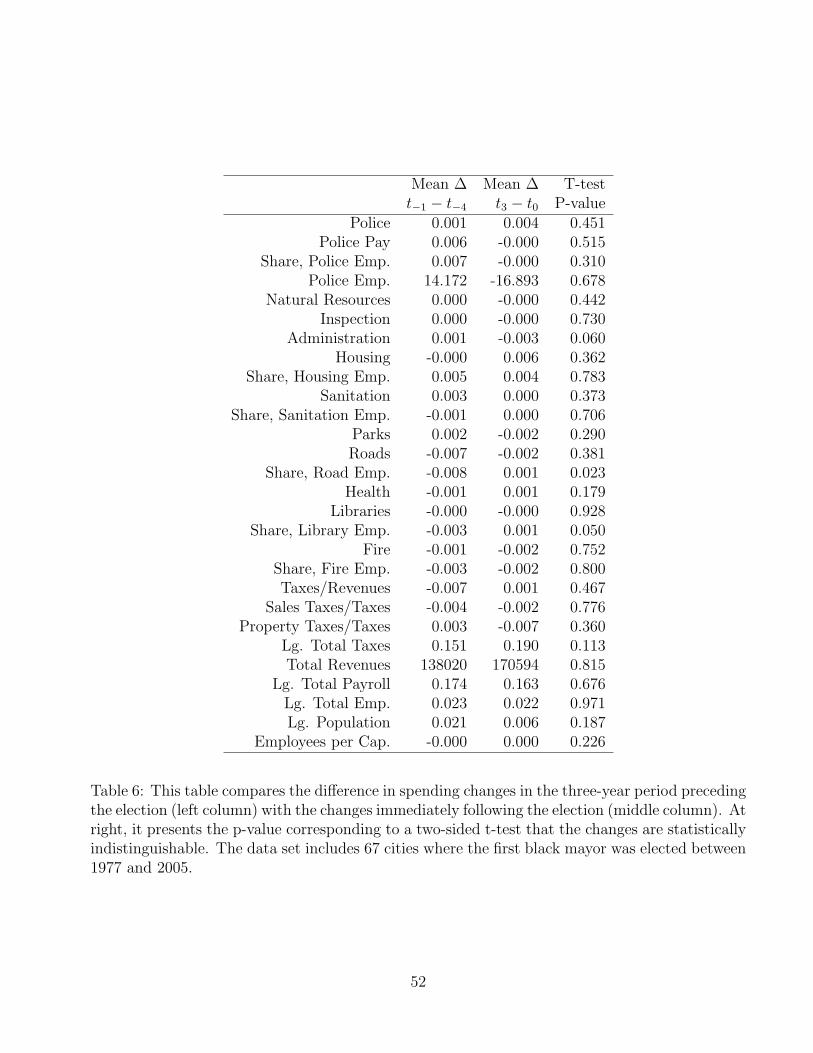
Mean ∆ Mean ∆ T-testt−1 − t
−4 t3 − t0 P-valuePolice 0.001 0.004 0.451
Police Pay 0.006 -0.000 0.515Share, Police Emp. 0.007 -0.000 0.310
Police Emp. 14.172 -16.893 0.678Natural Resources 0.000 -0.000 0.442
Inspection 0.000 -0.000 0.730Administration 0.001 -0.003 0.060
Housing -0.000 0.006 0.362Share, Housing Emp. 0.005 0.004 0.783
Sanitation 0.003 0.000 0.373Share, Sanitation Emp. -0.001 0.000 0.706
Parks 0.002 -0.002 0.290Roads -0.007 -0.002 0.381
Share, Road Emp. -0.008 0.001 0.023Health -0.001 0.001 0.179
Libraries -0.000 -0.000 0.928Share, Library Emp. -0.003 0.001 0.050
Fire -0.001 -0.002 0.752Share, Fire Emp. -0.003 -0.002 0.800Taxes/Revenues -0.007 0.001 0.467
Sales Taxes/Taxes -0.004 -0.002 0.776Property Taxes/Taxes 0.003 -0.007 0.360
Lg. Total Taxes 0.151 0.190 0.113Total Revenues 138020 170594 0.815
Lg. Total Payroll 0.174 0.163 0.676Lg. Total Emp. 0.023 0.022 0.971Lg. Population 0.021 0.006 0.187
Employees per Cap. -0.000 0.000 0.226
Table 6: This table compares the difference in spending changes in the three-year period precedingthe election (left column) with the changes immediately following the election (middle column). Atright, it presents the p-value corresponding to a two-sided t-test that the changes are statisticallyindistinguishable. The data set includes 67 cities where the first black mayor was elected between1977 and 2005.
52
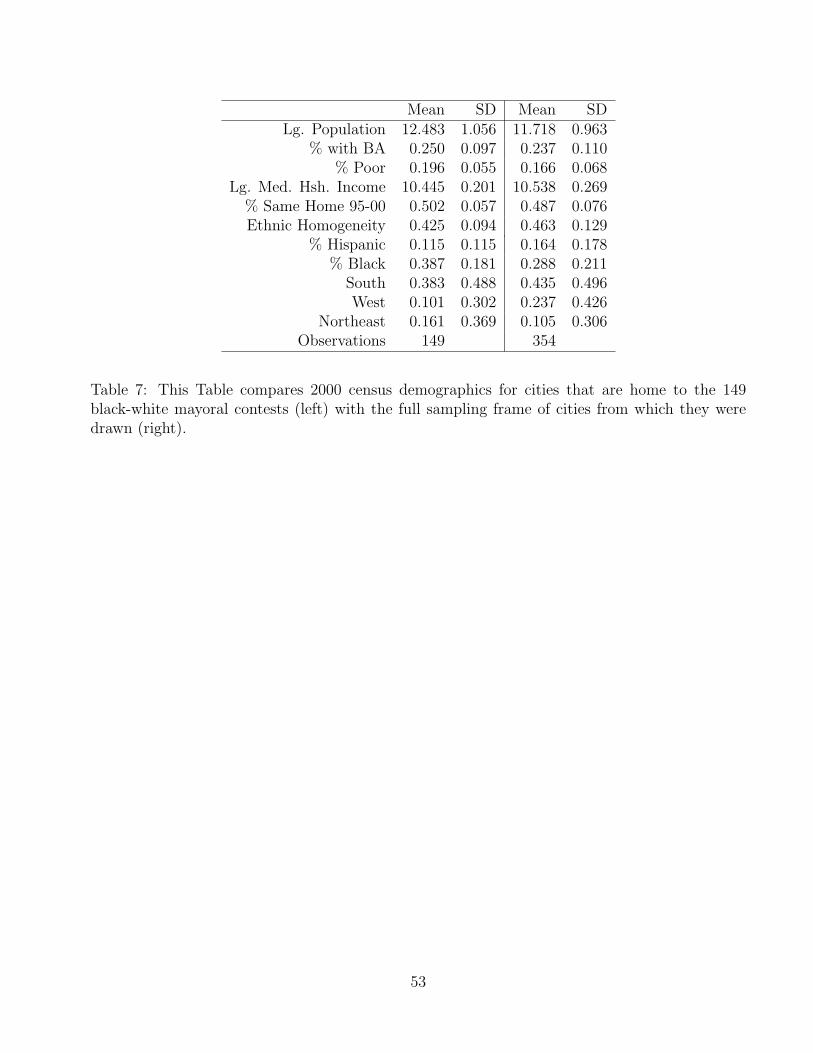
Mean SD Mean SDLg. Population 12.483 1.056 11.718 0.963
% with BA 0.250 0.097 0.237 0.110% Poor 0.196 0.055 0.166 0.068
Lg. Med. Hsh. Income 10.445 0.201 10.538 0.269% Same Home 95-00 0.502 0.057 0.487 0.076Ethnic Homogeneity 0.425 0.094 0.463 0.129
% Hispanic 0.115 0.115 0.164 0.178% Black 0.387 0.181 0.288 0.211
South 0.383 0.488 0.435 0.496West 0.101 0.302 0.237 0.426
Northeast 0.161 0.369 0.105 0.306Observations 149 354
Table 7: This Table compares 2000 census demographics for cities that are home to the 149black-white mayoral contests (left) with the full sampling frame of cities from which they weredrawn (right).
53
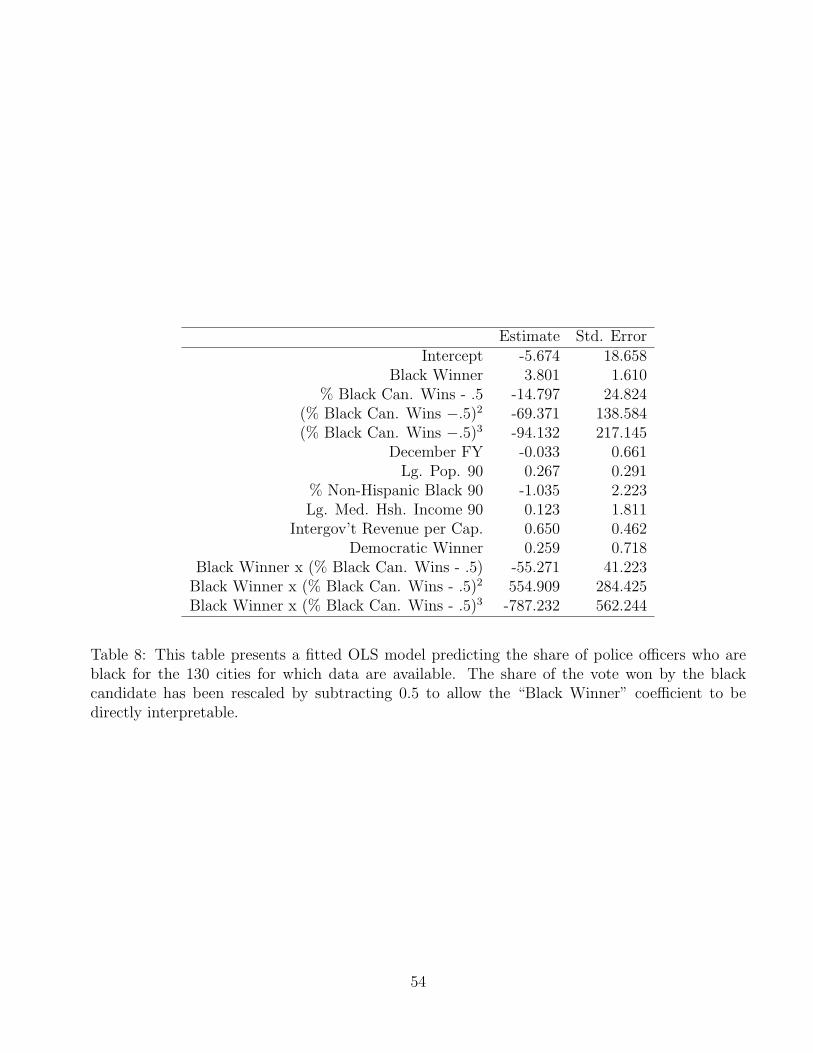
Estimate Std. ErrorIntercept -5.674 18.658
Black Winner 3.801 1.610% Black Can. Wins - .5 -14.797 24.824
(% Black Can. Wins −.5)2 -69.371 138.584(% Black Can. Wins −.5)3 -94.132 217.145
December FY -0.033 0.661Lg. Pop. 90 0.267 0.291
% Non-Hispanic Black 90 -1.035 2.223Lg. Med. Hsh. Income 90 0.123 1.811
Intergov’t Revenue per Cap. 0.650 0.462Democratic Winner 0.259 0.718
Black Winner x (% Black Can. Wins - .5) -55.271 41.223Black Winner x (% Black Can. Wins - .5)2 554.909 284.425Black Winner x (% Black Can. Wins - .5)3 -787.232 562.244
Table 8: This table presents a fitted OLS model predicting the share of police officers who areblack for the 130 cities for which data are available. The share of the vote won by the blackcandidate has been rescaled by subtracting 0.5 to allow the “Black Winner” coefficient to bedirectly interpretable.
54
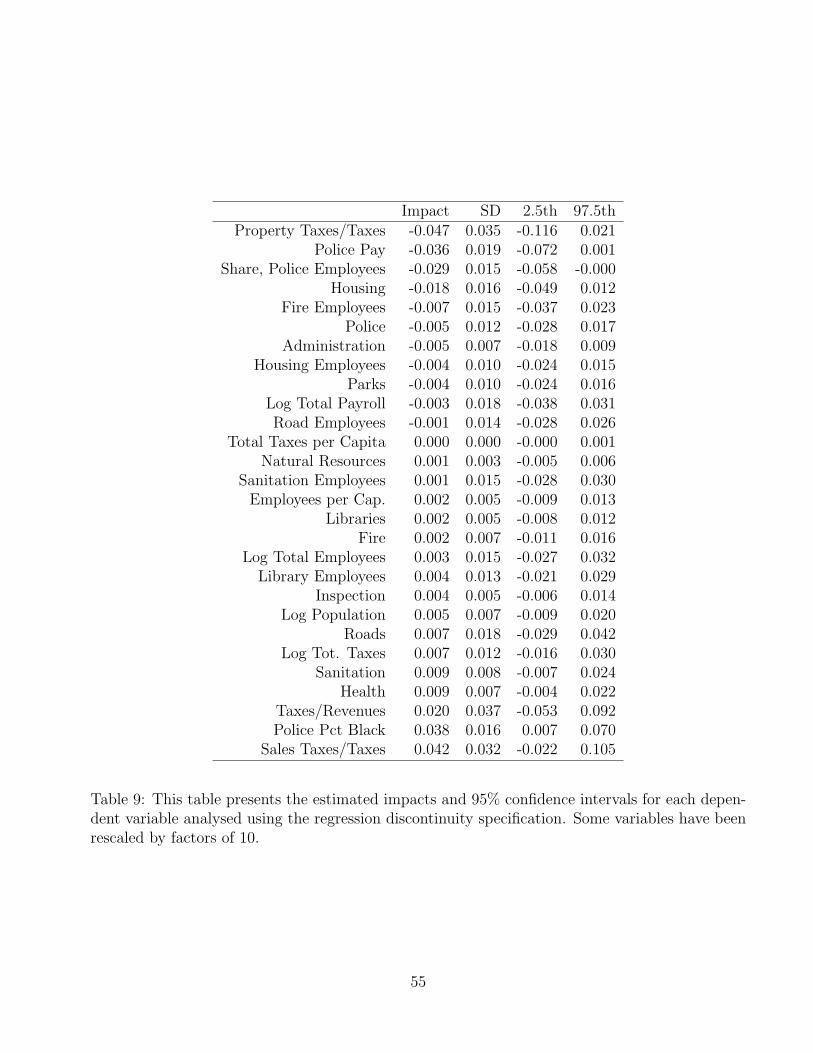
Impact SD 2.5th 97.5thProperty Taxes/Taxes -0.047 0.035 -0.116 0.021
Police Pay -0.036 0.019 -0.072 0.001Share, Police Employees -0.029 0.015 -0.058 -0.000
Housing -0.018 0.016 -0.049 0.012Fire Employees -0.007 0.015 -0.037 0.023
Police -0.005 0.012 -0.028 0.017Administration -0.005 0.007 -0.018 0.009
Housing Employees -0.004 0.010 -0.024 0.015Parks -0.004 0.010 -0.024 0.016
Log Total Payroll -0.003 0.018 -0.038 0.031Road Employees -0.001 0.014 -0.028 0.026
Total Taxes per Capita 0.000 0.000 -0.000 0.001Natural Resources 0.001 0.003 -0.005 0.006
Sanitation Employees 0.001 0.015 -0.028 0.030Employees per Cap. 0.002 0.005 -0.009 0.013
Libraries 0.002 0.005 -0.008 0.012Fire 0.002 0.007 -0.011 0.016
Log Total Employees 0.003 0.015 -0.027 0.032Library Employees 0.004 0.013 -0.021 0.029
Inspection 0.004 0.005 -0.006 0.014Log Population 0.005 0.007 -0.009 0.020
Roads 0.007 0.018 -0.029 0.042Log Tot. Taxes 0.007 0.012 -0.016 0.030
Sanitation 0.009 0.008 -0.007 0.024Health 0.009 0.007 -0.004 0.022
Taxes/Revenues 0.020 0.037 -0.053 0.092Police Pct Black 0.038 0.016 0.007 0.070
Sales Taxes/Taxes 0.042 0.032 -0.022 0.105
Table 9: This table presents the estimated impacts and 95% confidence intervals for each depen-dent variable analysed using the regression discontinuity specification. Some variables have beenrescaled by factors of 10.
55