affirmative action and the occupational advancement of
TRANSCRIPT

Affirmative Action and the OccupationalAdvancement of Minorities and Women During
1973–2003
FIDAN ANA KURTULUS*
*E-ma
TBadgOaxaparticand sJEL C
IND
Pub
The share of minorities and women comprising high-paying skilled occupationssuch as management, professional, and technical occupations has been increasingsince the 1960s, while the proportion of white men in such occupations has beendeclining. What has been the contribution of affirmative action to the occupationaladvancement of minorities and women from low-wage unskilled occupations intohigh-wage skilled ones in U.S. firms? I examine this by comparing the occupationalposition of minorities and women at firms holding federal contracts, and therebymandated to implement affirmative action, and noncontracting firms, over the courseof 31 years during 1973–2003. I use a new longitudinal dataset of over 100,000large private-sector firms across all industries and regions uniquely suited for theexploration of this question obtained from the U.S. Equal Employment OpportunityCommission. My key findings show that the share of minorities and women in high-paying skilled occupations grew more at federal contractors subject to affirmativeaction obligation than at noncontracting firms during the three decades under study,but these advances took place primarily during the pre- and early Reagan years andduring the decade following the Glass Ceiling Act of 1991.
Introduction
THE PURPOSE OF AFFIRMATIVE ACTION LEGISLATION IS NOT ONLY TO MOVE MINORITIES
and women into employment but also to facilitate their move up the job ladder
The author’s affiliation is Department of Economics, University of Massachusetts, Amherst, MA.il: [email protected] author thanks the editor and two anonymous referees, as well as Sami Alpanda, Michael Ash, Leeett, Fran Blau, Jed DeVaro, Ron Ehrenberg, Nancy Folbre, Richard Freeman, Ira Gang, Doug Kruse, Ronca, Lisa Saunders, Wayne Vroman, Tom Weisskopf, Stephen Woodbury, Myeong-Su Yun, and sessionipants at the 2012 Annual Meetings of the Allied Social Sciences Associations for insightful commentsuggestions.lassifications: J15, J16, J21, J7, J8, K31, N32, N42, M51.
USTRIAL RELATIONS, Vol. 51, No. 2 (April 2012). � 2012 Regents of the University of Californialished by Wiley Periodicals, Inc., 350 Main Street, Malden, MA 02148, USA, and 9600 Garsington
Road, Oxford, OX4 2DQ, UK.
213

214 / FIDAN ANA KURTULUS
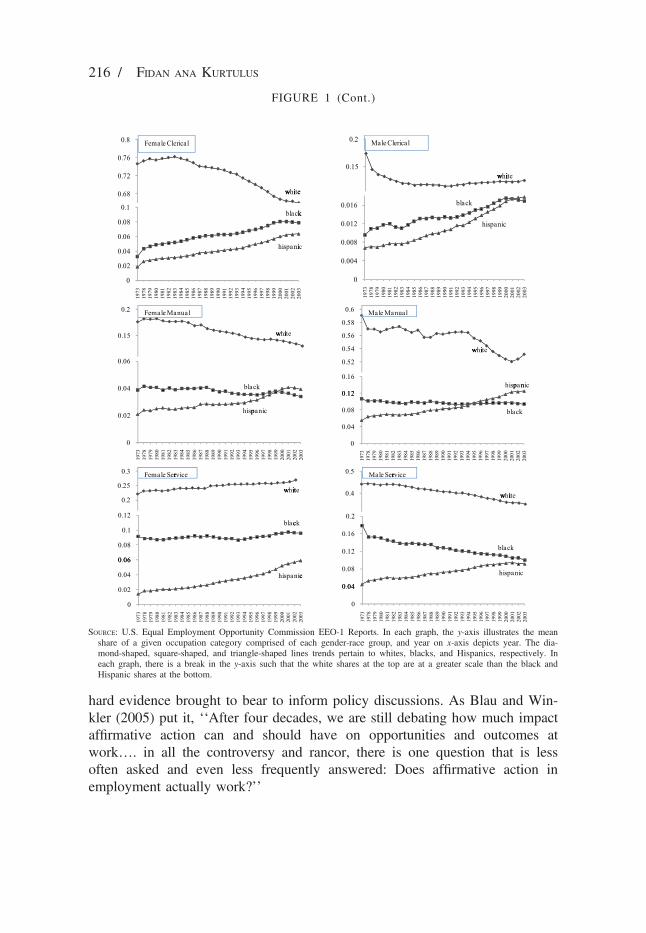
into higher-paying skilled positions where they have historically been starklyunderrepresented. Long-term trends indicate that the share of minoritiesand women comprising highly skilled occupations such as management,professional, and technical positions at large U.S. firms has been increasingsince the 1960s, while the proportion of white men in such occupations hasbeen declining (Figure 1).1 What has been the contribution of affirmativeaction to the occupational advancement of minorities and women from low-wage unskilled occupations into high-wage skilled ones in U.S. firms over thepast decades? i explore this question by comparing the occupational positionof minorities and women at firms holding federal contracts and thereby man-dated to implement affirmative action, and noncontracting firms, over the threedecades spanning 1973–2003 using a new large national dataset uniquely sui-ted for the exploration of this topic obtained from the U.S. Equal EmploymentOpportunity Commission.my key findings show that the share of black women and white women in pro-
fessional occupations, and Hispanic women and black men in technical occupa-tions increased more on average at federal contractors subject to affirmativeaction obligation during 1973–2003, and these results are robust to controllingfor firm size, corporate and occupational structure, industry-specific shocks,region-specific shocks, economy-wide shocks, and firm fixed effects. I alsouncover some important results on how the impact of affirmative action hasevolved over the three decades under study. For example, affirmative action hada positive effect on moving black women, Hispanic women, white women, andblack men into high-skill high-pay management, professional, and technicaloccupations during the 1970s and early 1980s, but the impact of affirmativeaction on advancing minorities and women into the top echelons of firm struc-tures subsided during the Reagan years. Another key finding is that during thedecade following the Glass Ceiling Act of 1991, affirmative action resurfaced asan important factor moving Hispanic women and white women into managerialoccupations, black women and Hispanic women into professional occupations,and black men into professional and technical occupations.Affirmative action in the labor market has generated heated debate ever
since its incorporation into federal law during the Civil Rights Movement.Several states have prohibited affirmative action in public employment inrecent years, and the future of affirmative action in the United States is uncer-tain. Rhetoric abounds on both sides of the affirmative action debate with little
1 These trends are based on data from the U.S. Equal Employment Opportunity Commission. Nationallyrepresentative data on the share of employed women and men by race aged 16 and over from Current Popu-lation Survey confirm these trends. Data on the share of women and non-whites in managerial, professional,and technical occupations reported by Donohue and Siegelman (1991) based on Census data also matchthese trends.

0.15
0.2
0.25
0.3white
Female Managers
0
0.01
0.02
0.03
0.04
1973
1978
1979
1980
1981
1982
1983
1984
1985
1986
1987
1988
1989
1990
1991
1992
1993
1994
1995
1996
1997
1998
1999
2000
2001
2002
2003
black
hispanic
0.6
0.7
0.8
0.9
white
Male Managers
0
0.01
0.02
0.03
1973
1978
1979
1980
1981
1982
1983
1984
1985
1986
1987
1988
1989
1990
1991
1992
1993
1994
1995
1996
1997
1998
1999
2000
2001
2002
2003
black
hispanic
0.25
0.3
0.35
0.4
white
Female Professionals
0
0.01
0.02
0.03
0.04
1973
1978
1979
1980
1981
1982
1983
1984
1985
1986
1987
1988
1989
1990
1991
1992
1993
1994
1995
1996
1997
1998
1999
2000
2001
2002
2003
black
hispanic
0.5
0.6
0.7
0.8 Male Professionals
white
0
0.005
0.01
0.015
0.02
0.025
1973
1978
1979
1980
1981
1982
1983
1984
1985
1986
1987
1988
1989
1990
1991
1992
1993
1994
1995
1996
1997
1998
1999
2000
2001
2002
2003
hispanic
black
0.25
0.3
0.35
0.4 Female Technicians
white
0
0.01
0.02
0.03
0.04
1973
1978
1979
1980
1981
1982
1983
1984
1985
1986
1987
1988
1989
1990
1991
1992
1993
1994
1995
1996
1997
1998
1999
2000
2001
2002
2003
black
hispanic
0.5
0.6
0.7
white
Male Technicians
0
0.01
0.02
0.03
0.04
0.05
1973
1978
1979
1980
1981
1982
1983
1984
1985
1986
1987
1988
1989
1990
1991
1992
1993
1994
1995
1996
1997
1998
1999
2000
2001
2002
2003
hispanic
black
0.1
0.2
0.3
0.4 Female Sales white
0
0.01
0.02
0.03
1973
1978
1979
1980
1981
1982
1983
1984
1985
1986
1987
1988
1989
1990
1991
1992
1993
1994
1995
1996
1997
1998
1999
2000
2001
2002
2003
black
hispanic
0.6
0.7
0.8
0.9 Male Sales
white
0
0.005
0.01
0.015
0.02
0.025
0.03
1973
1978
1979
1980
1981
1982
1983
1984
1985
1986
1987
1988
1989
1990
1991
1992
1993
1994
1995
1996
1997
1998
1999
2000
2001
2002
2003
hispanic
black
FIGURE 1
MEAN GENDER AND RACE SHARES OF OCCUPATIONS AT U.S. FIRMS: 1973–2003
Affirmative Action and Occupational Advancement / 215
0.68
0.72
0.76
0.8 Female Clerical
whww itii ee
0
0.02
0.04
0.06
0.08
0.1
1973
1978
1979
1980
1981
1982
1983
1984
1985
1986
1987
1988
1989
1990
1991
1992
1993
1994
1995
1996
1997
1998
1999
2000
2001
2002
2003
hispaniic
blackk
0.15
0.2
whww itii e
Male Clerical
0
0.004
0.008
0.012
0.016
1973
1978
1979
1980
1981
1982
1983
1984
1985
1986
1987
1988
1989
1990
1991
1992
1993
1994
1995
1996
1997
1998
1999
2000
2001
2002
2003
black
hispanic
0.15
0.2 Female Manual
whww itii e
0
0.02
0.04
0.06
1973
1978
1979
1980
1981
1982
1983
1984
1985
1986
1987
1988
1989
1990
1991
1992
1993
1994
1995
1996
1997
1998
1999
2000
2001
2002
2003
hisppanic
black
0.52
0.54
0.56
0.58
0.6 Male Manual
whww itii e
0
0.04
0.08
00.1122
0.16
1973
1978
1979
1980
1981
1982
1983
1984
1985
1986
1987
1988
1989
1990
1991
1992
1993
1994
1995
1996
1997
1998
1999
2000
2001
2002
2003
hisppannic
black
0.2
0.25
0.3 Female Servrr ice
whww ittii e
0
0.02
0.04
00.0066
0.08
0.1
0.12
1973
1978
1979
1980
1981
1982
1983
1984
1985
1986
1987
1988
1989
1990
1991
1992
1993
1994
1995
1996
1997
1998
1999
2000
2001
2002
2003
blacck
hispanicc
0.4
0.5 Male Servrr ice
whww itii e
0
00.0044
0.08
0.12
0.16
0.2
1973
1978
1979
1980
1981
1982
1983
1984
1985
1986
1987
1988
1989
1990
1991
1992
1993
1994
1995
1996
1997
1998
1999
2000
2001
2002
2003
black
hispanic
FIGURE 1 (Cont.)
SOURCE: U.S. Equal Employment Opportunity Commission EEO-1 Reports. In each graph, the y-axis illustrates the meanshare of a given occupation category comprised of each gender-race group, and year on x-axis depicts year. The dia-mond-shaped, square-shaped, and triangle-shaped lines trends pertain to whites, blacks, and Hispanics, respectively. Ineach graph, there is a break in the y-axis such that the white shares at the top are at a greater scale than the black andHispanic shares at the bottom.
216 / FIDAN ANA KURTULUS
hard evidence brought to bear to inform policy discussions. As Blau and Win-kler (2005) put it, ‘‘After four decades, we are still debating how much impactaffirmative action can and should have on opportunities and outcomes atwork…. in all the controversy and rancor, there is one question that is lessoften asked and even less frequently answered: Does affirmative action inemployment actually work?’’

Affirmative Action and Occupational Advancement / 217
This study presents evidence on the effects of affirmative action on theoccupational advancement of minorities and women using a large national lon-gitudinal database containing information on both federal contractors bound byaffirmative action obligation and noncontractor firms in all industries andregions of the United States. This is also one of the first studies of how theeffect of affirmative action has evolved over the course of three decades, dur-ing political administrations with drastically different views about affirmativeaction. The Equal Employment Opportunity Commission firm reports haveonly recently become available to scientific researchers for the first time sincethe early 1980s, presenting a unique opportunity to investigate the long-termeffects of affirmative action. Indeed, with over 100,000 firms over 31 years,these data constitute the largest and longest available panel of U.S. firms withinformation on gender and race composition by occupation.
Institutional Background
Affirmative action in the labor market was incorporated into federal law in1961 by President John F. Kennedy with Executive Order 10925, which requiredthat government contractors not discriminate against employees or job applicants,mandated that contractors ‘‘take affirmative action to ensure that applicants areemployed and employees are treated during employment without regard to theirrace, creed, color, or national origin,’’ and established the Committee on EqualEmployment Opportunity. Kennedy’s executive order was strengthened withExecutive Order 11246 in 1965 by President Lyndon B. Johnson by expandingaffirmative action to cover women and establishing the Office of Federal ContractCompliance Programs (OFCCP), a branch of the Department of Labor responsi-ble for affirmative action and nondiscrimination enforcement. Johnson’s execu-tive order clarified the guidelines for affirmative action implementation; itstipulated that firms with government contracts must prepare annual written affir-mative action plans identifying under-utilization of women and minorities rela-tive to their availability in the labor market from which employees are recruited,and required that these written affirmative action plans lay out procedures, place-ment goals, and timetables firms will follow in recruitment, evaluation, hiring,training, and promotion of minority and female employees at every level of theworkplace.2 Johnson’s executive order also mandated that governmentcontractors are subject to compliance reviews by the Office of Federal Contract
2 Detailed guidelines for affirmative action and equal employment opportunity implementation are pro-vided by the OFCCP in their Federal Contract Compliance Manual, which states that the geographic areaused to determine labor availability of protected groups may vary from local to nationwide as the skill levelrequired for the job increases (U.S. Department of Labor, 1998, chapter 2, section G).

218 / FIDAN ANA KURTULUS
Compliance, with penalties for noncompliance ranging from revocation of cur-rent government contracts to suspension of the right to bid on future contracts.The affirmative action climate changed dramatically in the 1980s. Govern-
ment enforcement of affirmative action was severely weakened beginning in1981 when the Office of Federal Contract Compliance came under new leader-ship that was neither committed to the organization nor to affirmative action.During the presidency of Ronald Reagan, a serious effort was made to rescindExecutive Order 11246 and when that failed, numerous steps were taken toweaken affirmative action enforcement (Anderson 1996). During the Reaganyears, the OFCCP continued to conduct compliance reviews but rarely issuedsanctions for noncompliance (Leonard 1990, 1996). After having risen sharplyduring the 1970s, the number of employment discrimination lawsuits plateauedin the 1980s, the number of class action discrimination suits fell, and mostemployment discrimination cases involved termination rather than hiring(Bergmann 1996; Donohue and Siegelman 1991). Enforcement activityincreased somewhat beginning in 1989 when President George Bush tookoffice, and the Civil Rights Act of 1991 allowed plaintiffs trial by jury in dis-crimination lawsuits and to recover compensatory and punitive damages. TitleII of the Civil Rights Act of 1991, also called ‘‘The Glass Ceiling Act,’’ estab-lished the Federal Glass Ceiling Commission to review and prepare recom-mendations for the President and business leaders on the progression ofprotected groups into the top echelons of the corporate ladder (U.S. GlassCeiling Commission 1995a, 1955b).3 With the inauguration of President BillClinton in 1993, OFCCP enforcement accelerated and the number of debar-ments because of affirmative action noncompliance increased dramatically.4
Recent years have witnessed efforts to rescind affirmative action at the statelevel, with California prohibiting affirmative action in public employment in1996, Washington in 1998, Michigan in 2006, Nebraska in 2008, Arizona in2010, and legislation pending in several other states.
Previous Literature
In previous work, I found that affirmative action had a positive effect onincreasing the overall employment of minority women during 1973–2003(Kurtulus 2010). The focus of this paper is the role of affirmative action on the
3 The Glass Ceiling Act also established a Presidential Award given annually to a business that madesignificant efforts to remove obstacles to career growth and provided advancement of opportunities towomen and minorities.
4 See Holzer and Neumark (2000) for a detailed review of affirmative action legislation and enforcementsince the 1960s.

Affirmative Action and Occupational Advancement / 219
advancement of minorities and women into high-paying skilled occupations. It isin skilled occupations like management and professional jobs that protectedgroups have historically been the most underrepresented relative to white malesbut where the impact on increasing the incomes of protected groups is likely tobe greatest.5 There is a vast literature documenting gender and race disparities inthe hiring and promotion of women and minorities into the top echelons of jobhierarchies (Bertrand, Goldin, and Katz 2010; Bertrand and Hallock 2001; Blauand DeVaro 2007; Blau, Ferber, and Winkler 2010; Ransom and Oaxaca 2005;Smith and Welch 1986, U.S. Glass Ceiling Commission 1995a, 1995b). The fewpast studies that have specifically looked at the role of affirmative action wereconducted in the late 1970s and early 1980s using EEOC records and found thatcontractors were more successful than noncontractors in hiring protected groupsinto relatively unskilled blue-collar positions during the late 1960s and early1970s, but that contractors were more effective than noncontractors in advancingminorities and women into white-collar occupations during the late 1970s.Ashenfelter and Heckman (1976) found that between 1966 and 1970, affirmativeaction led to increases in black men’s employment share relative to white men inoperative, sales, and laborer occupations, while black men’s relative sharedecreased in managerial and professional occupations more rapidly in the con-tracting sector during this time. Heckman and Wolpin (1976) found that between1972 and 1973, black male employment gains were concentrated in blue-collaroccupations in the contracting sector and that contractors did not promote minor-ities into white-collar jobs at a greater rate than noncontractors. Leonard (1984)found that the black male share of managerial, technical, sales, clerical, craft, andservice occupations increased faster among contractors than noncontractorsbetween 1974 and 1980. He also found evidence of a twist in demand at contrac-tors vis-a-vis noncontractors toward nonblack minority males in white-collaroccupations, particularly in sales and clerical positions, and away from thesegroups in operative and laborer positions; black women increased their employ-ment in all occupations except technical and craft positions faster in the contrac-tor sector; and white women’s representation in managerial and professional jobsgrew faster in the contractor sector, while their presence in clerical, sales, andoperative occupations diminished faster in that sector.6,7 My study contributes to
5 As seen in Figure 1, minority and female representation relative to that of white men has also beenlow in blue-collar jobs, as well as in sales, clerical, and service jobs, though not as low as in managementand professional occupations. Figure 1 also illustrates the great strides white women have made in manage-ment occupations in particular, where their mean share increased from 14 percent in 1973 to nearly 30 per-cent in 2003.
6 Brown (1982), Donohue and Heckman (1991), and Blau and Winkler (2005) provide a critical reviewof some of these studies.
7 As we will see later in the paper, the current paper’s findings pertaining to the years common withthese early studies are consistent with their findings.

220 / FIDAN ANA KURTULUS
this literature by updating our knowledge about the effect of affirmative actionon the occupational advancement of minorities and women since these earlystudies, an exercise that has not been possible until now because of the unavail-ability of appropriate data to examine this important topic.
Data and Methodology
The firm-level data used in the empirical analyses come from confidentialannual EEO-1 Employer Information Reports for 1973 and each year in 1978–2003 that have been collected by the U.S. Equal Employment OpportunityCommission as mandated by Title VII of the U.S. Civil Rights Act of 1964.8
EEO-1 reports describe the race and gender composition of employees by occu-pation across all U.S. private-sector firms with one hundred or more employeesand private-sector federal contractors with fifty or more employees.9,10 Thesedata are exceptional for numerous reasons. First, they contain records on over100,000 firms over 1973–2003. Furthermore, a great advantage of these data istheir longitudinal nature, allowing us to follow firms over time and thereby usepanel regression methods to control for unobserved attributes of firms that maybe correlated with female and minority representation and derive sharper econo-metric estimates of the effect of affirmative action. EEO-1 reports have onlyrecently become available to scientific researchers, and I have gained access tothese data through use of an Inter-Government Personnel Act Agreement withthe Equal Employment Opportunity Commission.EEO-1 reports provide employment counts at each firm by gender and five
race or ethnic groups: White, Black, Hispanic, Asian or Pacific Islander, Ameri-can Indian or Alaskan Native, distributed across the following occupationalcategories: Managers and Officers, Professionals, Technicians, Sales Workers,Office and Clerical Workers, Manual Workers, and Service Workers. The mana-gerial and professional jobs generally require a college degree or more, whiletechnician, sales, clerical, manual, and service occupations typically require only
8 EEO-1 records for the years 1974–1977 were unavailable from the U.S. Equal Employment Opportu-nity Commission.
9 As a robustness check, the baseline regressions were also estimated restricting the sample to firms withone hundred or more employees and the results were very similar to those reported in the paper.
10 Prior to 1983, the EEO-1 reporting requirement was such that firms with fifty or more employees andfederal contractors with twenty-five or more employees had to submit records. As a robustness check, thebaseline regressions were also estimated restricting the pre-1983 sample to firms with one hundred or moreemployees and federal contractors with fifty or more employees to match the post-1983 EEO-1 reportingrequirement and the results matched those reported in the paper very closely.

Affirmative Action and Occupational Advancement / 221
an education level of 2 years of junior college or less.11 Firms are instructed notto include temporary or casual employees hired for a specified period of time orfor the duration of a specified job in their reports but to include leased employeesas well as both part-time and full-time employees. Robinson et al. (2005) com-pare employment covered in the EEO-1 data to employment estimates from theU.S. Bureau of Labor Statistics and report EEO-1 coverage to typically bebetween 40 and 50 percent of all U.S. private-sector employment, with higherproportions in industries comprised of larger firms such as manufacturing andtransportation. The EEO-1 reports also include information on the firm’s indus-try, geographic location, whether or not the firm is a federal contractor, andwhether or not the firm is a multi-establishment organization.The main independent variable in my empirical analysis is federal contractor
status. Firms with government contracts are mandated to implement affirmativeaction and are subject to compliance reviews by the Office of Federal ContractCompliance, with penalties for noncompliance ranging from revocation of cur-rent government contracts to suspension of the right to bid on future contracts.Therefore the empirical approach is to investigate the relationship between firmfederal contractor status and changes in female and minority shares withinoccupational categories in U.S. firms to study the impact of affirmative action.Use of contracting status to understand the effects of affirmative action wasalso the approach taken in the earlier studies that used EEO-1 records (Ashen-felter and Heckman 1976; Heckman and Wolpin 1976; Leonard 1984,1986).12,13
The longitudinal nature of the EEO-1 data is utilized to estimate fixedeffects regressions of the relationship between firm federal contractor statusand the shares of women and men of different races within each occupationalcategory. Identification of the federal contractor effects comes from variation
11 Detailed descriptions of these occupational categories and examples of jobs they comprise are inAppendix A. I consolidated three categories—‘‘craft workers,’’ ‘‘operatives,’’ and ‘‘laborers,’’ which allpertain broadly to manual work of varying skill levels and which yielded similar trend and regressionresults—into the category ‘‘manual workers’’ in this paper.
12 Note that in these earlier studies, the unit of analysis was an establishment, while in mine the unit ofanalysis is a firm. However, since the entity being awarded a government contract is the firm and not indi-vidual establishments within the firm, there is no variation at the establishment level within a given firm inmy main independent variable, and so the firm is the more appropriate unit of analysis for the purposes ofthe current study. My methodology also differs from these early studies in that I control for firm fixedeffects, industry-specific, region-specific, and economy-wide shocks in my empirical models.
13 An additional element that would have enriched the analysis but which I do not have data on is whichcontracting firms underwent formal OFCCP compliance reviews. It has been argued, however, that the threatof enforcement can actually have a larger effect than enforcement action (Heckman and Wolpin 1976; Leon-ard 1985, 1996). Moreover, survey evidence also shows that fear of litigation or debarment from governmentcontracting is a strong deterrent against violation of affirmative action laws even in the absence of OFCCPreviews (Badgett 1995).
222 / FIDAN ANA KURTULUS
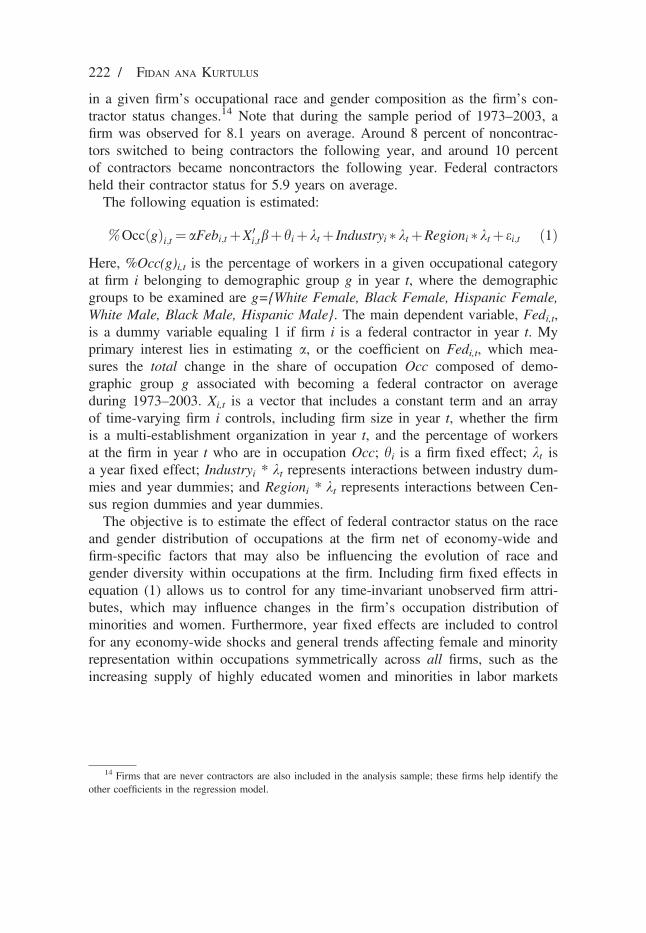
in a given firm’s occupational race and gender composition as the firm’s con-tractor status changes.14 Note that during the sample period of 1973–2003, afirm was observed for 8.1 years on average. Around 8 percent of noncontrac-tors switched to being contractors the following year, and around 10 percentof contractors became noncontractors the following year. Federal contractorsheld their contractor status for 5.9 years on average.The following equation is estimated:
%OccðgÞi;t¼ aFebi;tþX 0i;tbþhiþktþ Industryi �ktþRegioni �ktþ ei;t ð1Þ
Here, %Occ(g)i,t is the percentage of workers in a given occupational categoryat firm i belonging to demographic group g in year t, where the demographicgroups to be examined are g={White Female, Black Female, Hispanic Female,White Male, Black Male, Hispanic Male}. The main dependent variable, Fedi,t,is a dummy variable equaling 1 if firm i is a federal contractor in year t. Myprimary interest lies in estimating a, or the coefficient on Fedi,t, which mea-sures the total change in the share of occupation Occ composed of demo-graphic group g associated with becoming a federal contractor on averageduring 1973–2003. Xi,t is a vector that includes a constant term and an arrayof time-varying firm i controls, including firm size in year t, whether the firmis a multi-establishment organization in year t, and the percentage of workersat the firm in year t who are in occupation Occ; hi is a firm fixed effect; kt isa year fixed effect; Industryi * kt represents interactions between industry dum-mies and year dummies; and Regioni * kt represents interactions between Cen-sus region dummies and year dummies.The objective is to estimate the effect of federal contractor status on the race
and gender distribution of occupations at the firm net of economy-wide andfirm-specific factors that may also be influencing the evolution of race andgender diversity within occupations at the firm. Including firm fixed effects inequation (1) allows us to control for any time-invariant unobserved firm attri-butes, which may influence changes in the firm’s occupation distribution ofminorities and women. Furthermore, year fixed effects are included to controlfor any economy-wide shocks and general trends affecting female and minorityrepresentation within occupations symmetrically across all firms, such as theincreasing supply of highly educated women and minorities in labor markets
14 Firms that are never contractors are also included in the analysis sample; these firms help identify theother coefficients in the regression model.

Affirmative Action and Occupational Advancement / 223
since the 1960s that high-skill occupations like management and professionaloccupations draw from.15
It is likely that there are also factors influencing the share of women andminorities in skilled occupations that vary within the firm’s industry and thefirm’s geographic region over time which could bias my estimates of the rela-tionship between contractor status and female and minority representation ifsuch factors do not change at a national level uniformly and get picked up bythe year fixed effects in my model. Therefore it would be desirable to addi-tionally control for such industry-specific and region-specific factors that mayalso be serving to increase the firm’s share of women and minorities withincertain occupations over time. I incorporate interactions of industry dummieswith year dummies to account for industry-specific shocks to female andminority representation within occupations. For example, many firms in agiven industry may respond to a high-profile lawsuit on gender discriminationin promotion into management brought against a similar firm by enacting apolicy of increasing the share of women in managerial positions over a periodof time. Including industry-year dummies allows us to flexibly control for suchphenomena and get more accurate estimates of the influence of federal contrac-tor status net of any industry trends toward higher levels of gender and racediversity within certain occupations. In a similar fashion, interactions of regiondummies with year dummies (hi * kt) are also incorporated to account forregion-specific changes in available female and minority labor pools that firmsface and thus influence the extent to which firms can implement affirmativeaction hiring.However, even after we account for firm fixed effects, year fixed effects,
industry-specific time effects, and region-specific time effects, there may stillremain differences across firms in factors such as management practices thatvary over time and that influence the evolution of the occupational position ofminority and female workers at the firm, biasing the estimates of the effect ofaffirmative action on minority and female occupational advancement. To alle-viate this potential source of bias, the regression model additionally controlsfor a set of observable time-varying firm characteristics that are likely to becorrelated with unobservable factors like management practices and that may
15 Bound and Freeman (1992) and Freeman (1976), for example, showed that the share of black menwho graduated college increased greatly during the 1960s, 1970s, and 1980s. Donohue and Heckman(1991), Heckman and Payner (1989), and Smith and Welch (1986) present further evidence on the increas-ing educational attainment of black men and women vis-a-vis whites during the 1960s and 1970s, particu-larly in the South. Also, the educational attainment of women has been on the rise since the 1960s, thoughthe rise in black male educational attainment has slowed since the 1980s (Blau, Ferber, and Winkler 2010;McDaniel et al. 2011). Finally, the quality of education blacks have been receiving since the 1960s alsoincreased as documented by Smith and Welch (1986) and Card and Krueger (1992a, 1992b).

224 / FIDAN ANA KURTULUS
influence the effect of contractor status on the occupational upgrading of pro-tected groups at the firm. For example, firm size is likely to be important:large firms are more likely to have formalized personnel policies and recruit-ment programs that may reduce barriers to the hiring and promotion of womenand minorities.16 Therefore, larger firms may have better affirmative actiontrack records. At the same time contractor status may be positively correlatedwith firm size. In this case, a positive revealed relationship between contractorstatus and female and minority occupational advancement might be spurious;it might be picking up the correlation between promotion of protected groupsand firm size. The regression model therefore includes controls for firm sizeand whether the firm is a multi-establishment organization. The regressionmodel also controls for the share of workers at the firm in the occupationalgroup relevant to each specification to account for the possibility that a smalleroccupational group may allow more flexibility to grow to accommodate thehiring and promotion of minorities and women to that occupational category.17
In the second part of the empirical analysis, the evolution of the relationshipbetween federal contractor status and the occupational upgrading of minoritiesand women over the three decades during 1973–2003 is examined. To do this,equation (1) is modified by replacing the federal contractor indicator withinteractions of each of the year dummies with federal contractor status(kt*Fedi,t), allowing us to study the effect of affirmative action by year.Table 1 presents descriptive statistics for key variables in the pooled sam-
ple. Some 43 percent of firms hold federal contracts. The contractor firms areon average bigger and more likely to be multi-establishment organizations thannoncontractors. They are more likely than noncontractors to be located in theU.S. South and West and relatively less likely to be in the Northeast and Mid-west. They are also more likely than noncontractors to be in the construction,manufacturing, mining, finance, and transportation and utilities industries, andrelatively less likely to be in services, wholesale and retail trade, and agricul-ture. Contractors also have higher proportions of employment comprised ofmanagerial, professional, technical, clerical, and manual occupations but lowerproportions comprised of sales and service occupations. Shares of women inall occupational categories have generally been lower at contractors on averageduring the 31 years under study, except in the case of black women and His-panic women in clerical occupations. Black and Hispanic men’s shares of pro-fessional, technical, clerical, and service occupations have been higher at
16 A number of past studies have found a positive relationship between employer size and the rate ofblack and female employment since the 1970s, including Holzer (1998) and Carrington, McCue, and Pierce(2000).
17 Variables used in the empirical analyses are defined in greater detail in the Appendix A.
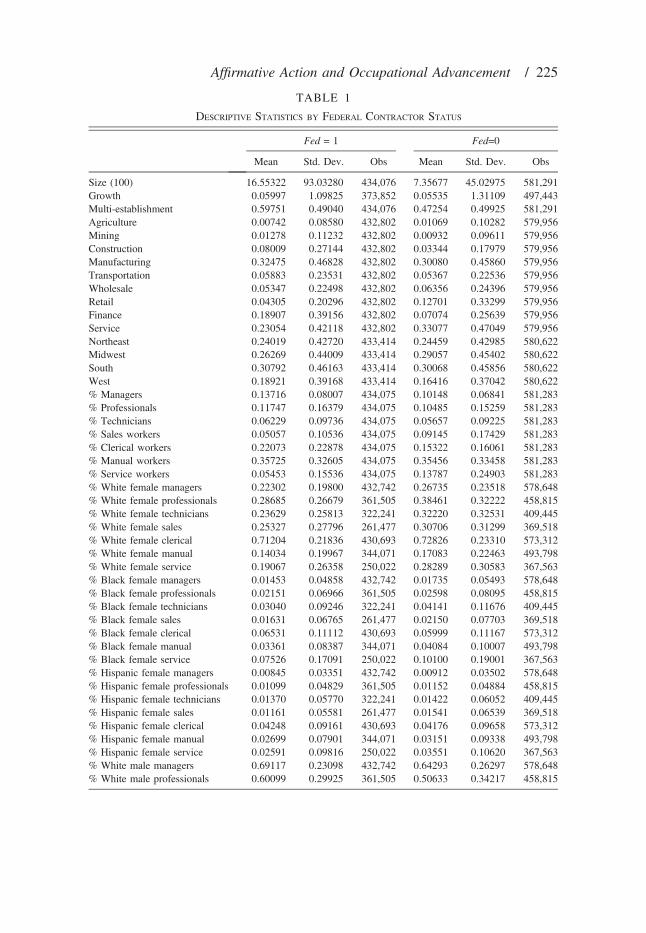
TABLE 1
DESCRIPTIVE STATISTICS BY FEDERAL CONTRACTOR STATUS
Fed = 1 Fed=0
Mean Std. Dev. Obs Mean Std. Dev. Obs
Size (100) 16.55322 93.03280 434,076 7.35677 45.02975 581,291Growth 0.05997 1.09825 373,852 0.05535 1.31109 497,443Multi-establishment 0.59751 0.49040 434,076 0.47254 0.49925 581,291Agriculture 0.00742 0.08580 432,802 0.01069 0.10282 579,956Mining 0.01278 0.11232 432,802 0.00932 0.09611 579,956Construction 0.08009 0.27144 432,802 0.03344 0.17979 579,956Manufacturing 0.32475 0.46828 432,802 0.30080 0.45860 579,956Transportation 0.05883 0.23531 432,802 0.05367 0.22536 579,956Wholesale 0.05347 0.22498 432,802 0.06356 0.24396 579,956Retail 0.04305 0.20296 432,802 0.12701 0.33299 579,956Finance 0.18907 0.39156 432,802 0.07074 0.25639 579,956Service 0.23054 0.42118 432,802 0.33077 0.47049 579,956Northeast 0.24019 0.42720 433,414 0.24459 0.42985 580,622Midwest 0.26269 0.44009 433,414 0.29057 0.45402 580,622South 0.30792 0.46163 433,414 0.30068 0.45856 580,622West 0.18921 0.39168 433,414 0.16416 0.37042 580,622% Managers 0.13716 0.08007 434,075 0.10148 0.06841 581,283% Professionals 0.11747 0.16379 434,075 0.10485 0.15259 581,283% Technicians 0.06229 0.09736 434,075 0.05657 0.09225 581,283% Sales workers 0.05057 0.10536 434,075 0.09145 0.17429 581,283% Clerical workers 0.22073 0.22878 434,075 0.15322 0.16061 581,283% Manual workers 0.35725 0.32605 434,075 0.35456 0.33458 581,283% Service workers 0.05453 0.15536 434,075 0.13787 0.24903 581,283% White female managers 0.22302 0.19800 432,742 0.26735 0.23518 578,648% White female professionals 0.28685 0.26679 361,505 0.38461 0.32222 458,815% White female technicians 0.23629 0.25813 322,241 0.32220 0.32531 409,445% White female sales 0.25327 0.27796 261,477 0.30706 0.31299 369,518% White female clerical 0.71204 0.21836 430,693 0.72826 0.23310 573,312% White female manual 0.14034 0.19967 344,071 0.17083 0.22463 493,798% White female service 0.19067 0.26358 250,022 0.28289 0.30583 367,563% Black female managers 0.01453 0.04858 432,742 0.01735 0.05493 578,648% Black female professionals 0.02151 0.06966 361,505 0.02598 0.08095 458,815% Black female technicians 0.03040 0.09246 322,241 0.04141 0.11676 409,445% Black female sales 0.01631 0.06765 261,477 0.02150 0.07703 369,518% Black female clerical 0.06531 0.11112 430,693 0.05999 0.11167 573,312% Black female manual 0.03361 0.08387 344,071 0.04084 0.10007 493,798% Black female service 0.07526 0.17091 250,022 0.10100 0.19001 367,563% Hispanic female managers 0.00845 0.03351 432,742 0.00912 0.03502 578,648% Hispanic female professionals 0.01099 0.04829 361,505 0.01152 0.04884 458,815% Hispanic female technicians 0.01370 0.05770 322,241 0.01422 0.06052 409,445% Hispanic female sales 0.01161 0.05581 261,477 0.01541 0.06539 369,518% Hispanic female clerical 0.04248 0.09161 430,693 0.04176 0.09658 573,312% Hispanic female manual 0.02699 0.07901 344,071 0.03151 0.09338 493,798% Hispanic female service 0.02591 0.09816 250,022 0.03551 0.10620 367,563% White male managers 0.69117 0.23098 432,742 0.64293 0.26297 578,648% White male professionals 0.60099 0.29925 361,505 0.50633 0.34217 458,815
Affirmative Action and Occupational Advancement / 225
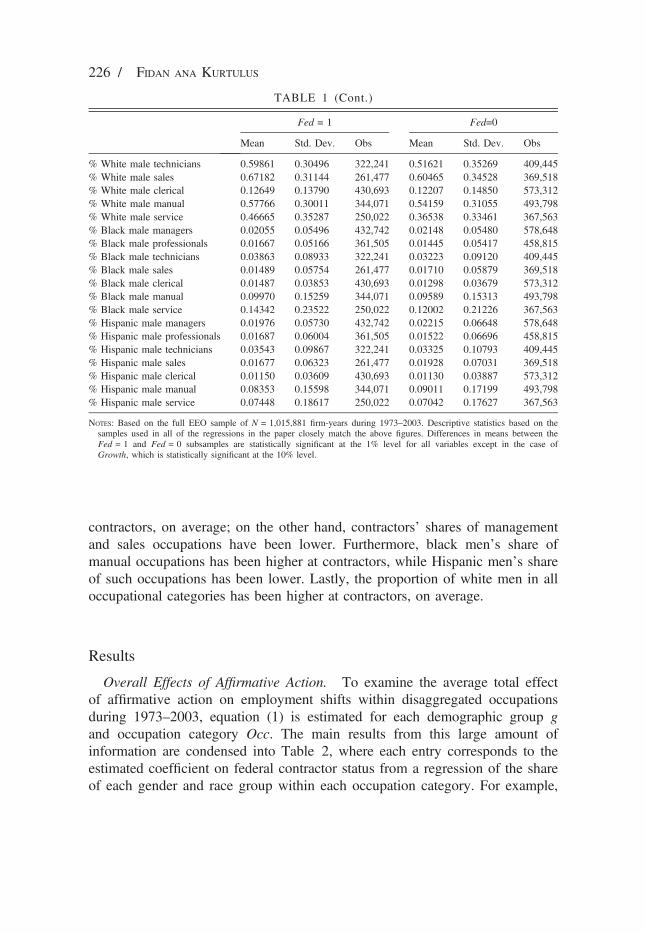
TABLE 1 (Cont.)
Fed = 1 Fed=0
Mean Std. Dev. Obs Mean Std. Dev. Obs
% White male technicians 0.59861 0.30496 322,241 0.51621 0.35269 409,445% White male sales 0.67182 0.31144 261,477 0.60465 0.34528 369,518% White male clerical 0.12649 0.13790 430,693 0.12207 0.14850 573,312% White male manual 0.57766 0.30011 344,071 0.54159 0.31055 493,798% White male service 0.46665 0.35287 250,022 0.36538 0.33461 367,563% Black male managers 0.02055 0.05496 432,742 0.02148 0.05480 578,648% Black male professionals 0.01667 0.05166 361,505 0.01445 0.05417 458,815% Black male technicians 0.03863 0.08933 322,241 0.03223 0.09120 409,445% Black male sales 0.01489 0.05754 261,477 0.01710 0.05879 369,518% Black male clerical 0.01487 0.03853 430,693 0.01298 0.03679 573,312% Black male manual 0.09970 0.15259 344,071 0.09589 0.15313 493,798% Black male service 0.14342 0.23522 250,022 0.12002 0.21226 367,563% Hispanic male managers 0.01976 0.05730 432,742 0.02215 0.06648 578,648% Hispanic male professionals 0.01687 0.06004 361,505 0.01522 0.06696 458,815% Hispanic male technicians 0.03543 0.09867 322,241 0.03325 0.10793 409,445% Hispanic male sales 0.01677 0.06323 261,477 0.01928 0.07031 369,518% Hispanic male clerical 0.01150 0.03609 430,693 0.01130 0.03887 573,312% Hispanic male manual 0.08353 0.15598 344,071 0.09011 0.17199 493,798% Hispanic male service 0.07448 0.18617 250,022 0.07042 0.17627 367,563
NOTES: Based on the full EEO sample of N = 1,015,881 firm-years during 1973–2003. Descriptive statistics based on thesamples used in all of the regressions in the paper closely match the above figures. Differences in means between theFed = 1 and Fed = 0 subsamples are statistically significant at the 1% level for all variables except in the case ofGrowth, which is statistically significant at the 10% level.
226 / FIDAN ANA KURTULUS
contractors, on average; on the other hand, contractors’ shares of managementand sales occupations have been lower. Furthermore, black men’s share ofmanual occupations has been higher at contractors, while Hispanic men’s shareof such occupations has been lower. Lastly, the proportion of white men in alloccupational categories has been higher at contractors, on average.
Results
Overall Effects of Affirmative Action. To examine the average total effectof affirmative action on employment shifts within disaggregated occupationsduring 1973–2003, equation (1) is estimated for each demographic group gand occupation category Occ. The main results from this large amount ofinformation are condensed into Table 2, where each entry corresponds to theestimated coefficient on federal contractor status from a regression of the shareof each gender and race group within each occupation category. For example,

Affirmative Action and Occupational Advancement / 227
the entry in the first row and first column is the estimated coefficient on con-tractor status in a regression of the proportion of managers who are whitewomen. Focusing on the coefficients that are statistically significant, we seethat becoming a federal contractor was associated with a 0.183 percentagepoint increase on average during 1973–2003 in white women’s share of pro-fessional occupations, and a 0.052 percentage point increase in black women’sshare of professional occupations. As shown in the trend plots in Figure 1, themean share of black women in professional occupations across firms increasedfrom 1.35 percent in 1973 to 3.37 percent in 2003. Thus, in terms of theimplied contribution of affirmative action in federal contracting to the overalltrends in the status of black women in professional jobs, the 0.052 percentagepoint increase because of affirmative action represents a 3.9 percent increasefrom its 1973 level and constitutes 2.6 percent of the total increase over 1973–2003. Likewise, given that the share of white women in professional occupa-tions advanced from 25 percent in 1973 to 36.8 percent in 2003, the 0.183percentage point increase because of affirmative action represents a 7.3 percentincrease from its 1973 level, and 1.6 percent of the total advancement from1973 to 2003.Another interesting finding from Table 2 is that Hispanic women and black
men made inroads into technical occupations at federal contractors, increasingtheir share by 0.058 percentage points and 0.109 percentage points, respec-tively, at firms that became federal contractors. Given that the mean share ofHispanic women in technical occupations across firms increased from 0.75 per-cent in 1973 to 1.85 percent in 2003, and the mean share of black menincreased from 2.6 percent to 4.1 percent, this means that affirmative actionincreased the 1973 shares by 7.7 percent for Hispanic women and by 4.2 per-cent for black men (amounting to 5.3 percent of the 31 year increase for His-panic women technicians and 7.3 percent of the 31 year increase for blackmale technicians). At the same time, white men’s share of professional, techni-cal, and clerical occupations declined substantially at federal contractors incontrast to noncontractors, although contractor status was not associated withanalogous declines in white male managerial representation. We also see that,on average, black women increased their share of clerical and manual occupa-tions by 0.191 and 0.089 percentage points at firms that became contractors(amounting to a 5.83 percent increase and a 2.29 percent increase, respec-tively, from their 1973 mean values of 3.28 percent and 3.88 percent), andblack men increased their share of manual occupations by 0.120 percentagepoints at firms that became contractors (amounting to a 1.1 percent increasefrom its 1973 value of 10.7 percent). Finally, Table 2 illustrates that Hispanicmen did not benefit from affirmative action on average during 1973–2003: thecoefficients on federal contractor status in the Hispanic male regressions are

TABLE
2
THEEFF
ECT
OFFE
DERALCONTRACTORST
ATUS
ONG
ENDER
ANDRACESH
ARES
OFO
CCUPA
TIO
NSD
URIN
G19
73–2
003
Occup
ation
Managers
(1)
Professionals
(2)
Techn
icians
(3)
Sales
(4)
Clerical
(5)
Manual
(6)
Service
(7)
omen:
White
female
)0.0005
1(0.000
52)
0.00
183**
(0.000
92)
0.0009
7(0.001
03)
0.0005
5(0.001
11)
)0.0001
5(0.000
71)
)0.00
005
(0.000
61)
0.00
105
(0.001
16)
Black
female
)0.0001
2(0.000
17)
0.00
052*
(0.000
27)
0.0003
6(0.000
37)
0.0000
2(0.000
29)
0.0019
1***
(0.000
31)
0.0008
9***
(0.000
32)
0.00
067
(0.000
71)
Hispanicfemale
0.0000
8(0.000
11)
0.00
013
(0.000
20)
0.0005
8**
(0.000
26)
)0.00
005
(0.000
25)
)0.0004
4(0.000
28)
0.0001
0(0.000
26)
)0.0001
0(0.000
49)
en:
White
male
0.0009
8*(0.000
58)
)0.0025
2***
(0.000
97)
)0.00
221*
(0.001
16)
)0.00
069
(0.001
16)
)0.0016
9***
(0.000
55)
)0.00
120
(0.000
82)
)0.0012
2(0.001
41)
Black
male
0.0000
3(0.000
19)
)0.0001
6(0.000
22)
0.0010
9**
(0.000
43)
0.0001
6(0.000
26)
0.0000
7(0.000
15)
0.0012
0**
(0.000
47)
)0.0009
7(0.001
00)
Hispanicmale
)0.0004
3**
(0.000
19)
)0.0000
2(0.000
26)
)0.00
014
(0.000
42)
0.0000
7(0.000
29)
0.0000
1(0.000
14)
)0.00
119***
(0.000
45)
0.00
011
(0.000
78)
servations
1,007,80
781
7,73
272
9,43
262
8,73
81,000,479
834,97
261
5,66
3mberof
firms
123,18
410
3,82
395
,275
88,380
122,52
010
6,38
484
,522
TES:
Eachentryrepresents
thecoefficient
estim
ateon
federalcontractor
status
from
aregression
oftheshareof
wom
enandmen
ofdifferentraceswith
ineach
occupatio
nalcategory
atthefirm
onfederalcontractor
status
andcontrolsforfirm
size,corporatestructure,
occupatio
nshare,
firm
fixed
effects,year
fixed
effects,region-specific
timeeffects,andindustry-
specifictim
eeffects.Robuststandard
errors
clusteredby
firm
arein
parentheses.*,
**,and***indicate
significanceat
the10%,5%
,and1%
levels,respectiv
ely.
228 / FIDAN ANA KURTULUS
W M Ob
Nu
NO
Affirmative Action and Occupational Advancement / 229
either not statistically significant at conventional levels or are statistically sig-nificantly negative.18,19
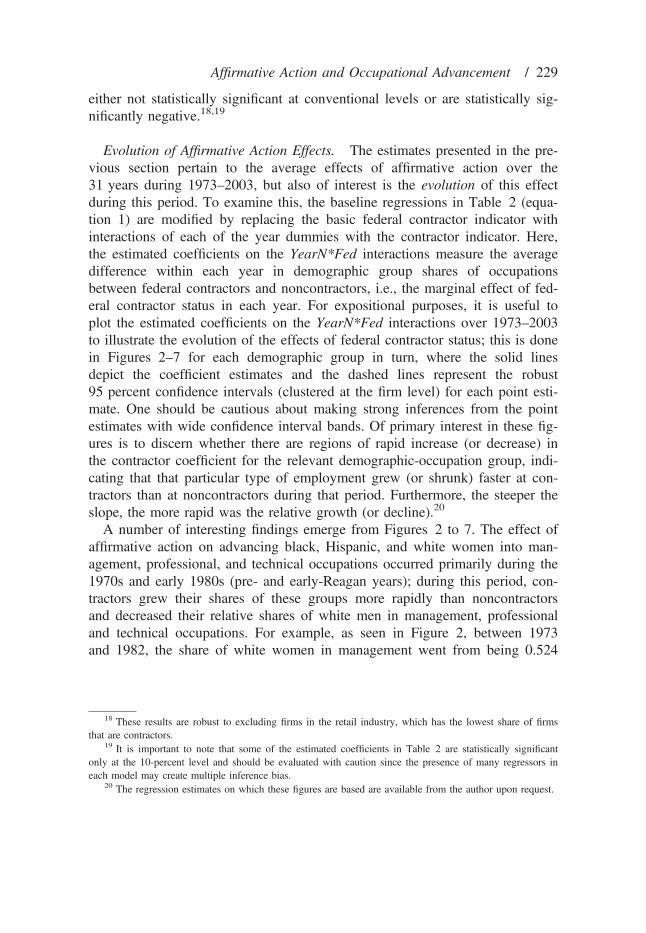
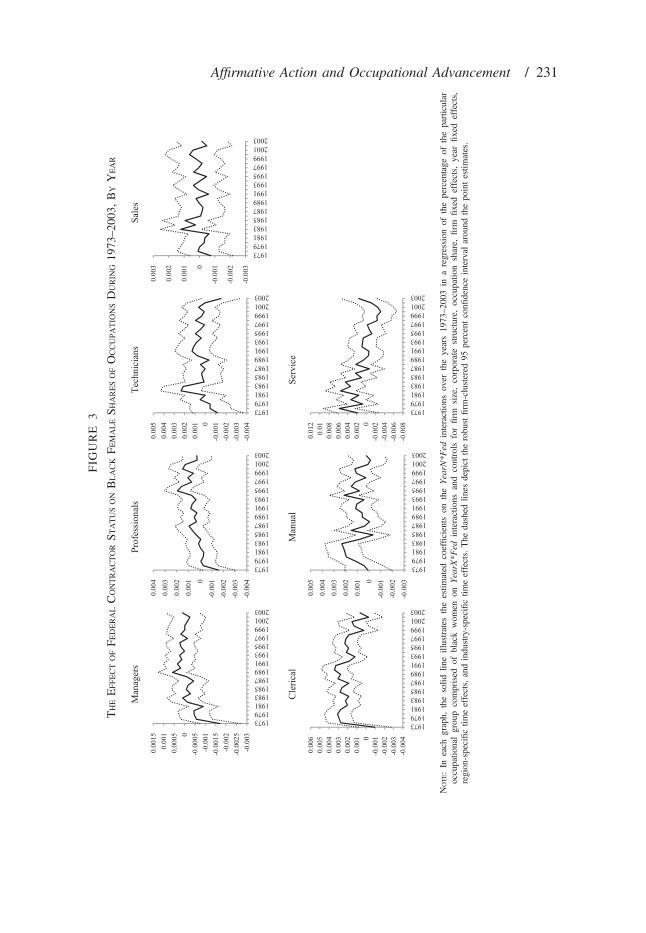
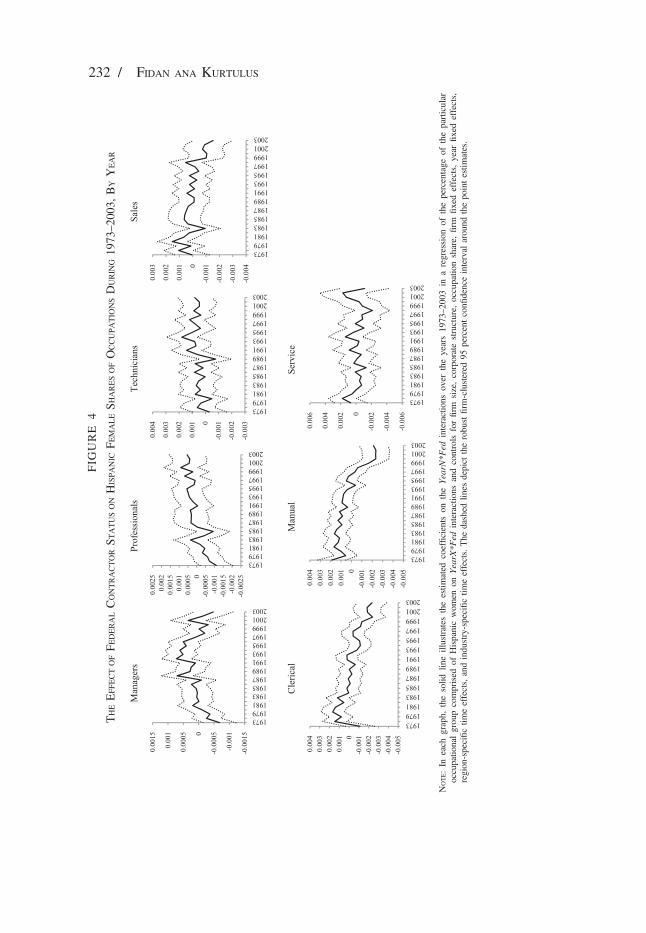
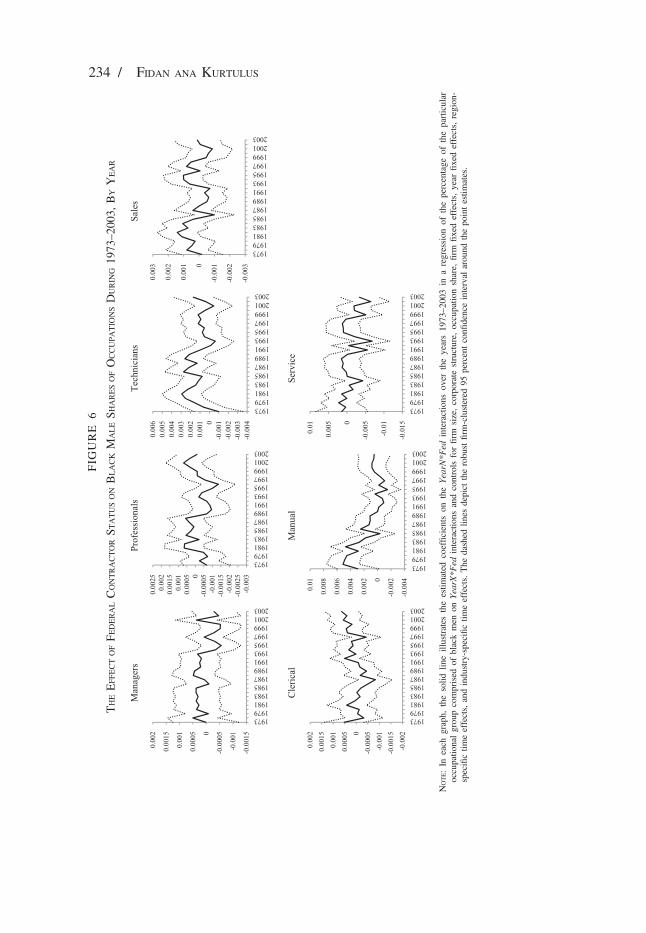
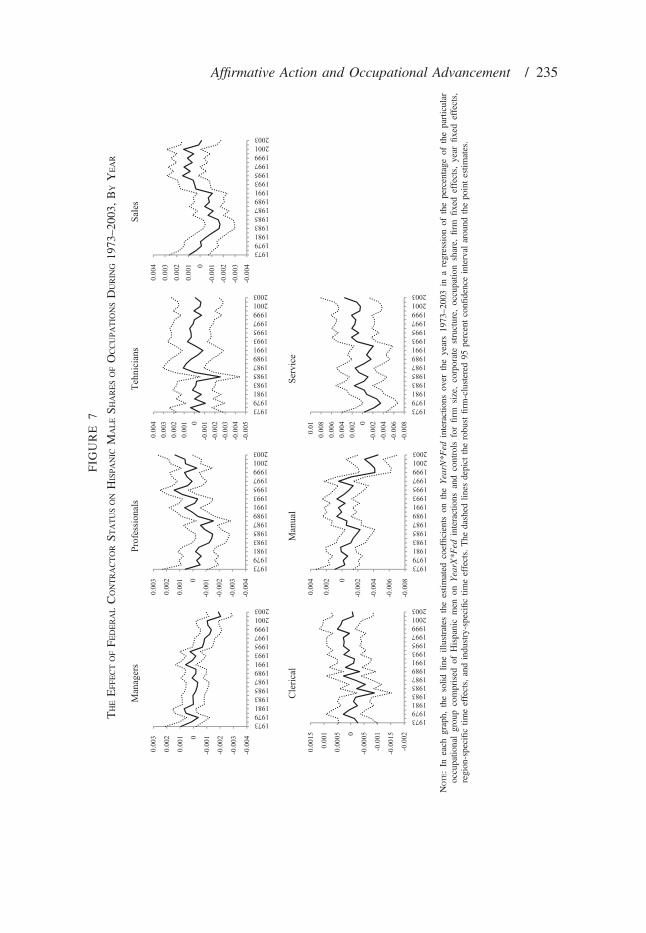
Evolution of Affirmative Action Effects. The estimates presented in the pre-vious section pertain to the average effects of affirmative action over the31 years during 1973–2003, but also of interest is the evolution of this effectduring this period. To examine this, the baseline regressions in Table 2 (equa-tion 1) are modified by replacing the basic federal contractor indicator withinteractions of each of the year dummies with the contractor indicator. Here,the estimated coefficients on the YearN*Fed interactions measure the averagedifference within each year in demographic group shares of occupationsbetween federal contractors and noncontractors, i.e., the marginal effect of fed-eral contractor status in each year. For expositional purposes, it is useful toplot the estimated coefficients on the YearN*Fed interactions over 1973–2003to illustrate the evolution of the effects of federal contractor status; this is donein Figures 2–7 for each demographic group in turn, where the solid linesdepict the coefficient estimates and the dashed lines represent the robust95 percent confidence intervals (clustered at the firm level) for each point esti-mate. One should be cautious about making strong inferences from the pointestimates with wide confidence interval bands. Of primary interest in these fig-ures is to discern whether there are regions of rapid increase (or decrease) inthe contractor coefficient for the relevant demographic-occupation group, indi-cating that that particular type of employment grew (or shrunk) faster at con-tractors than at noncontractors during that period. Furthermore, the steeper theslope, the more rapid was the relative growth (or decline).20
A number of interesting findings emerge from Figures 2 to 7. The effect ofaffirmative action on advancing black, Hispanic, and white women into man-agement, professional, and technical occupations occurred primarily during the1970s and early 1980s (pre- and early-Reagan years); during this period, con-tractors grew their shares of these groups more rapidly than noncontractorsand decreased their relative shares of white men in management, professionaland technical occupations. For example, as seen in Figure 2, between 1973and 1982, the share of white women in management went from being 0.524
18 These results are robust to excluding firms in the retail industry, which has the lowest share of firmsthat are contractors.
19 It is important to note that some of the estimated coefficients in Table 2 are statistically significantonly at the 10-percent level and should be evaluated with caution since the presence of many regressors ineach model may create multiple inference bias.
20 The regression estimates on which these figures are based are available from the author upon request.

-0.0
1-0
.008
-0.0
06-0
.004
-0.0
0200.
002
0.00
40.
006
0.00
8
19731979198119831985198719891991199319951997199920012003
Man
ager
s
-0.0
3-0
.025
-0.0
2-0
.015
-0.0
1-0
.0050
0.00
50.
010.
015
0.02
19731979198119831985198719891991199319951997199920012003
Prof
essi
onal
s
-0.0
2
-0.0
15
-0.0
1
-0.0
050
0.00
5
0.01
0.01
5
19731979198119831985198719891991199319951997199920012003
Tech
nici
ans
-0.0
2
-0.0
15
-0.0
1
-0.0
050
0.00
5
0.01
0.01
5
19731979198119831985198719891991199319951997199920012003
Sale
s
-0.0
15
-0.0
1
-0.0
050
0.00
5
0.01
19731979198119831985198719891991199319951997199920012003
Cle
rical
-0.0
1-0
.008
-0.0
06-0
.004
-0.0
0200.
002
0.00
40.
006
0.00
8
19731979198119831985198719891991199319951997199920012003
Man
ual
-0.0
2
-0.0
15
-0.0
1
-0.0
050
0.00
5
0.01
0.01
5
19731979198119831985198719891991199319951997199920012003
Serv
ice
FIG
URE
2
THEEFF
ECTOFFE
DERALCONTRACTORST
ATUSONW
HITEFE
MALESH
ARESOFO
CCUPA
TIO
NSD
URIN
G19
73–2
003,
BYY
EAR
NOTE:In
each
graph,
thesolid
lineillustrates
theestim
ated
coefficientson
theYearN*F
edinteractions
over
theyears1973–2003in
aregression
ofthepercentage
oftheparticular
occu-
patio
nalgroupcomprised
ofwhite
wom
enon
YearX*F
edinteractions
andcontrols
forfirm
size,corporatestructure,
occupatio
nshare,
firm
fixed
effects,year
fixed
effects,region-spe-
cific
timeeffects,andindustry-specific
timeeffects.The
dashed
lines
depict
therobustfirm-clustered
95percentconfi
denceinterval
around
thepointestim
ates.
230 / FIDAN ANA KURTULUS
-0.0
03-0
.002
5-0
.002
-0.0
015
-0.0
01-0
.000
500.
0005
0.00
10.
0015
19731979198119831985198719891991199319951997199920012003
Man
ager
s
-0.0
04-0
.003
-0.0
02-0
.0010
0.00
10.
002
0.00
30.
004
19731979198119831985198719891991199319951997199920012003
Prof
essi
onal
s
-0.0
04-0
.003
-0.0
02-0
.0010
0.00
10.
002
0.00
30.
004
0.00
5
19731979198119831985198719891991199319951997199920012003
Tech
nici
ans
-0.0
03
-0.0
02
-0.0
010
0.00
1
0.00
2
0.00
3
19731979198119831985198719891991199319951997199920012003
Sale
s
-0.0
04-0
.003
-0.0
02-0
.0010
0.00
10.
002
0.00
30.
004
0.00
50.
006
19731979198119831985198719891991199319951997199920012003
Cle
rical
-0.0
03-0
.002
-0.0
0100.
001
0.00
20.
003
0.00
40.
005
19731979198119831985198719891991199319951997199920012003
Man
ual
-0.0
08-0
.006
-0.0
04-0
.0020
0.00
20.
004
0.00
60.
008
0.01
0.01
2
19731979198119831985198719891991199319951997199920012003
Serv
ice
FIG
URE
3
THEEFF
ECTOFFE
DERALCONTRACTORST
ATUSONBLACKFE
MALESH
ARESOFO
CCUPA
TIO
NSD
URIN
G19
73–2
003,
BYY
EAR
NOTE:In
each
graph,
thesolid
lineillustrates
theestim
ated
coefficientson
theYearN*F
edinteractions
over
theyears1973–2003in
aregression
ofthepercentage
oftheparticular
occupatio
nalgroupcomprised
ofblackwom
enon
YearX*F
edinteractions
andcontrols
forfirm
size,corporatestructure,
occupatio
nshare,
firm
fixed
effects,
year
fixed
effects,
region-specific
timeeffects,andindustry-specific
timeeffects.The
dashed
lines
depict
therobustfirm-clustered
95percentconfi
denceinterval
around
thepointestim
ates.
Affirmative Action and Occupational Advancement / 231
-0.0
015
-0.0
01
-0.0
0050
0.00
05
0.00
1
0.00
15
19731979198119831985198719891991199319951997199920012003
Man
ager
s
-0.0
025
-0.0
02-0
.001
5-0
.001
-0.0
0050
0.00
050.
001
0.00
150.
002
0.00
25
19731979198119831985198719891991199319951997199920012003
Prof
essi
onal
s
-0.0
03
-0.0
02
-0.0
010
0.00
1
0.00
2
0.00
3
0.00
4
19731979198119831985198719891991199319951997199920012003
Tech
nici
ans
-0.0
04
-0.0
03
-0.0
02
-0.0
010
0.00
1
0.00
2
0.00
3
19731979198119831985198719891991199319951997199920012003
Sale
s
-0.0
05-0
.004
-0.0
03-0
.002
-0.0
0100.
001
0.00
20.
003
0.00
4
19731979198119831985198719891991199319951997199920012003
Cle
rical
-0.0
05-0
.004
-0.0
03-0
.002
-0.0
0100.
001
0.00
20.
003
0.00
4
19731979198119831985198719891991199319951997199920012003
Man
ual
-0.0
06
-0.0
04
-0.0
020
0.00
2
0.00
4
0.00
6
19731979198119831985198719891991199319951997199920012003
Serv
ice
FIG
URE
4
THEEFF
ECTOFFE
DERALCONTRACTORST
ATUSONH
ISPA
NIC
FEMALESH
ARESOFO
CCUPA
TIO
NSD
URIN
G19
73–2
003,
BYY
EAR
NOTE:In
each
graph,
thesolid
lineillustrates
theestim
ated
coefficientson
theYearN*F
edinteractions
over
theyears1973–2003in
aregression
ofthepercentage
oftheparticular
occupatio
nalgroupcomprised
ofHispanicwom
enon
YearX*F
edinteractions
andcontrols
forfirm
size,corporatestructure,
occupatio
nshare,
firm
fixed
effects,
year
fixed
effects,
region-specific
timeeffects,andindustry-specific
timeeffects.The
dashed
lines
depict
therobustfirm-clustered
95percentconfi
denceinterval
around
thepointestim
ates.
232 / FIDAN ANA KURTULUS

-0.0
1
-0.0
050
0.00
5
0.01
0.01
5
0.02
19731979198119831985198719891991199319951997199920012003
Man
ager
s
-0.0
3
-0.0
2
-0.0
10
0.01
0.02
0.03
0.04
19731979198119831985198719891991199319951997199920012003
Prof
essi
onal
s
-0.0
2-0
.015
-0.0
1-0
.0050
0.00
50.
010.
015
0.02
0.02
50.
03
19731979198119831985198719891991199319951997199920012003
Tech
nici
ans
-0.0
15-0
.01
-0.0
0500.
005
0.01
0.01
50.
020.
025
19731979198119831985198719891991199319951997199920012003
Sale
s
-0.0
15
-0.0
1
-0.0
050
0.00
5
0.01
0.01
5
0.02
19731979198119831985198719891991199319951997199920012003
Cle
rical
-0.0
15
-0.0
1
-0.0
050
0.00
5
0.01
0.01
5
19731979198119831985198719891991199319951997199920012003
Man
ual
-0.0
15
-0.0
1
-0.0
050
0.00
5
0.01
0.01
5
0.02
19731979198119831985198719891991199319951997199920012003
Serv
ice
FIG
URE
5
THEEFF
ECTOFFE
DERALCONTRACTORST
ATUSONW
HITEM
ALESH
ARESOFO
CCUPA
TIO
NSD
URIN
G19
73–2
003,
BYY
EAR
NOTE:In
each
graph,
thesolid
lineillustrates
theestim
ated
coefficientson
theYearN*F
edinteractions
over
theyears1973–2003in
aregression
ofthepercentage
oftheparticular
occupatio
nalgroupcomprised
ofwhite
men
onYearX*F
edinteractions
andcontrols
forfirm
size,corporatestructure,
occupatio
nshare,
firm
fixed
effects,
year
fixed
effects,
region-
specifictim
eeffects,andindustry-specific
timeeffects.The
dashed
lines
depict
therobustfirm-clustered
95percentconfi
denceinterval
around
thepointestim
ates.
Affirmative Action and Occupational Advancement / 233
-0.0
015
-0.0
01
-0.0
0050
0.00
05
0.00
1
0.00
15
0.00
2
19731979198119831985198719891991199319951997199920012003
Man
ager
s
-0.0
03-0
.002
5-0
.002
-0.0
015
-0.0
01-0
.000
500.
0005
0.00
10.
0015
0.00
20.
0025
19731979198119831985198719891991199319951997199920012003
Prof
essi
onal
s
-0.0
04-0
.003
-0.0
02-0
.0010
0.00
10.
002
0.00
30.
004
0.00
50.
006
19731979198119831985198719891991199319951997199920012003
Tech
nici
ans
-0.0
03
-0.0
02
-0.0
010
0.00
1
0.00
2
0.00
3
19731979198119831985198719891991199319951997199920012003
Sale
s
-0.0
02-0
.001
5-0
.001
-0.0
0050
0.00
050.
001
0.00
150.
002
19731979198119831985198719891991199319951997199920012003
Cle
rical
-0.0
04
-0.0
020
0.00
2
0.00
4
0.00
6
0.00
8
0.01
19731979198119831985198719891991199319951997199920012003
Man
ual
-0.0
15
-0.0
1
-0.0
050
0.00
5
0.01
19731979198119831985198719891991199319951997199920012003
Serv
ice
FIG
URE
6
THEEFF
ECTOFFE
DERALCONTRACTORST
ATUSONBLACKM
ALESH
ARESOFO
CCUPA
TIO
NSD
URIN
G19
73–2
003,
BYY
EAR
NOTE:In
each
graph,
thesolid
lineillustrates
theestim
ated
coefficientson
theYearN*F
edinteractions
over
theyears1973–2003in
aregression
ofthepercentage
oftheparticular
occupatio
nalgroupcomprised
ofblackmen
onYearX*F
edinteractions
andcontrols
forfirm
size,corporatestructure,
occupatio
nshare,
firm
fixed
effects,
year
fixed
effects,
region-
specifictim
eeffects,andindustry-specific
timeeffects.The
dashed
lines
depict
therobustfirm-clustered
95percentconfi
denceinterval
around
thepointestim
ates.
234 / FIDAN ANA KURTULUS
-0.0
04
-0.0
03
-0.0
02
-0.0
010
0.00
1
0.00
2
0.00
3
19731979198119831985198719891991199319951997199920012003
Man
ager
s
-0.0
04
-0.0
03
-0.0
02
-0.0
010
0.00
1
0.00
2
0.00
3
19731979198119831985198719891991199319951997199920012003
Prof
essi
onal
s
-0.0
05-0
.004
-0.0
03-0
.002
-0.0
0100.
001
0.00
20.
003
0.00
4
19731979198119831985198719891991199319951997199920012003
Tehn
icia
ns
-0.0
04-0
.003
-0.0
02-0
.0010
0.00
10.
002
0.00
30.
004
19731979198119831985198719891991199319951997199920012003
Sale
s
-0.0
02
-0.0
015
-0.0
01
-0.0
0050
0.00
05
0.00
1
0.00
15
19731979198119831985198719891991199319951997199920012003
Cle
rical
-0.0
08
-0.0
06
-0.0
04
-0.0
020
0.00
2
0.00
4
19731979198119831985198719891991199319951997199920012003
Man
ual
-0.0
08-0
.006
-0.0
04-0
.0020
0.00
20.
004
0.00
60.
008
0.01
19731979198119831985198719891991199319951997199920012003
Serv
ice
FIG
URE
7
THEEFF
ECTOFFE
DERALCONTRACTORST
ATUSONH
ISPA
NIC
MALESH
ARESOFO
CCUPA
TIO
NSD
URIN
G19
73–2
003,
BYY
EAR
NOTE:In
each
graph,
thesolid
lineillustrates
theestim
ated
coefficientson
theYearN*F
edinteractions
over
theyears1973–2003in
aregression
ofthepercentage
oftheparticular
occupatio
nalgroupcomprised
ofHispanicmen
onYearX*F
edinteractions
andcontrols
forfirm
size,corporatestructure,
occupatio
nshare,
firm
fixed
effects,
year
fixed
effects,
region-specific
timeeffects,andindustry-specific
timeeffects.The
dashed
lines
depict
therobustfirm-clustered
95percentconfi
denceinterval
around
thepointestim
ates.
Affirmative Action and Occupational Advancement / 235

236 / FIDAN ANA KURTULUS
percentage points lower to being over 0.234 percentage points higher at con-tractors than at contractors.21 After the early 1980s, the positive impact ofaffirmative action on white, black, and Hispanic women in management, pro-fessional, and technical occupations decelerated or vanished entirely. It is inter-esting to note that the slowdown in the occupational advancement ofminorities and women into high-skill high-pay management, professional, andtechnical jobs at federal contractors was concurrent with the major shifts inpolitical attitudes toward affirmative action that began when President Reagantook office, including efforts to rescind affirmative action legislation andsevere cuts in EEOC and OFCCP budgets as described in the InstitutionalBackground section. There was, however, a resurgence in the case of Hispanicfemale managers in the early 1990s concurrent with the passage of the GlassCeiling ⁄Civil Rights Act of 1991, as seen in Figure 4, and in the case ofwhite female managers and black and Hispanic female professionals in the late1990s and early 2000s, as seen in Figures 2–4. Figure 6 shows that analogoustrends took place also for black men in professional, technical, and sales occu-pations.Turning to blue-collar jobs, we see that during the 1970s and early 1980s
the share of black and white women in manual occupations also grew faster atcontractors relative to noncontractors, while the relative share of Hispanicwomen, white men, black men, and Hispanic men shrunk more rapidly.22 Dur-ing the 1990s and early 2000s on the other hand, contractors experienceddeclining representation in manual occupations of white women, Hispanicwomen, black men, and Hispanic men, concurrent with increasing white malerepresentation in such jobs. The trends in service jobs were similar but lesspronounced.Several other interesting trends emerge. For example, during the 1990s,
white, black, and Hispanic women left clerical jobs, traditionally a femaledomain, more rapidly at contracting firms, while white, black, and Hispanicmen increased their representation in the clerical positions of contractors fasterduring this time. Also, the main benefits of affirmative action on Hispanicmale employment occurred in professional and sales occupations primarilyduring the early 1990s.
21 Note that these findings are consistent with previous research on this period, notably Leonard’s (1984)analysis of the years 1974–1980 showing the share of black and white women in management and profes-sional occupations had increased faster at contractors relative to non-contractors.
22 Leonard’s (1984) analysis of the 1974–1980 period also found that black women’s share of blue collaroccupations increased faster, and Hispanic men’s share of blue collar occupations decreased faster, at con-tractors.
Affirmative Action and Occupational Advancement / 237
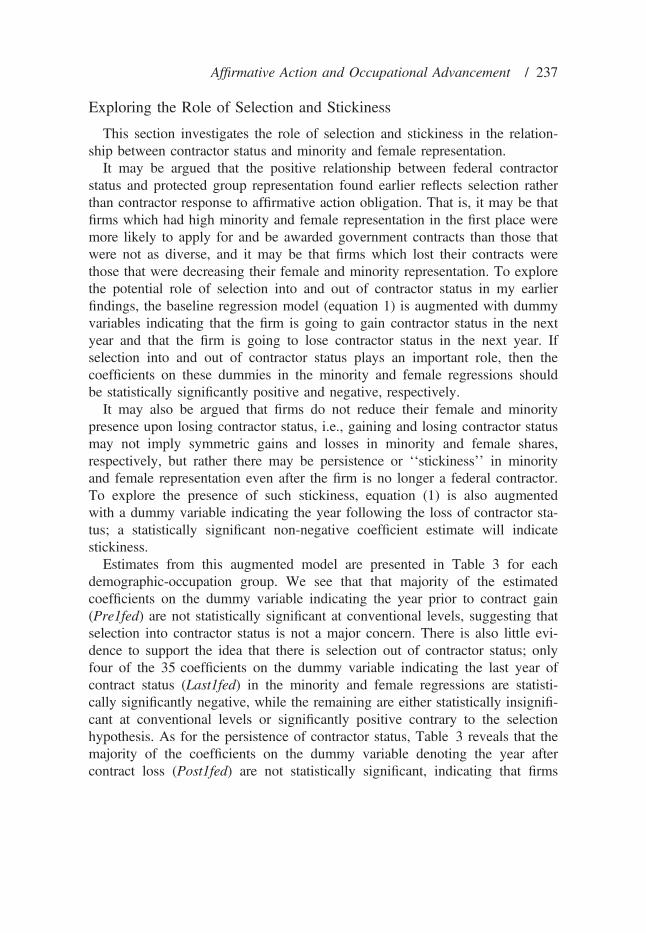
Exploring the Role of Selection and Stickiness
This section investigates the role of selection and stickiness in the relation-ship between contractor status and minority and female representation.It may be argued that the positive relationship between federal contractor
status and protected group representation found earlier reflects selection ratherthan contractor response to affirmative action obligation. That is, it may be thatfirms which had high minority and female representation in the first place weremore likely to apply for and be awarded government contracts than those thatwere not as diverse, and it may be that firms which lost their contracts werethose that were decreasing their female and minority representation. To explorethe potential role of selection into and out of contractor status in my earlierfindings, the baseline regression model (equation 1) is augmented with dummyvariables indicating that the firm is going to gain contractor status in the nextyear and that the firm is going to lose contractor status in the next year. Ifselection into and out of contractor status plays an important role, then thecoefficients on these dummies in the minority and female regressions shouldbe statistically significantly positive and negative, respectively.It may also be argued that firms do not reduce their female and minority
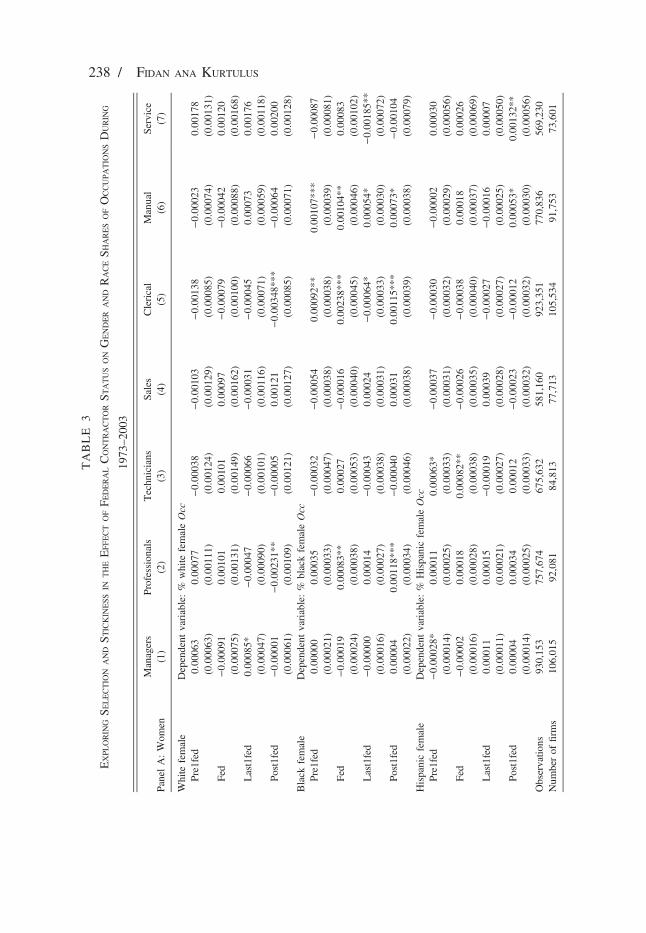
presence upon losing contractor status, i.e., gaining and losing contractor statusmay not imply symmetric gains and losses in minority and female shares,respectively, but rather there may be persistence or ‘‘stickiness’’ in minorityand female representation even after the firm is no longer a federal contractor.To explore the presence of such stickiness, equation (1) is also augmentedwith a dummy variable indicating the year following the loss of contractor sta-tus; a statistically significant non-negative coefficient estimate will indicatestickiness.Estimates from this augmented model are presented in Table 3 for each
demographic-occupation group. We see that that majority of the estimatedcoefficients on the dummy variable indicating the year prior to contract gain(Pre1fed) are not statistically significant at conventional levels, suggesting thatselection into contractor status is not a major concern. There is also little evi-dence to support the idea that there is selection out of contractor status; onlyfour of the 35 coefficients on the dummy variable indicating the last year ofcontract status (Last1fed) in the minority and female regressions are statisti-cally significantly negative, while the remaining are either statistically insignifi-cant at conventional levels or significantly positive contrary to the selectionhypothesis. As for the persistence of contractor status, Table 3 reveals that themajority of the coefficients on the dummy variable denoting the year aftercontract loss (Post1fed) are not statistically significant, indicating that firms
TABLE
3
EXPL
ORIN
GSE
LECTIO
NANDST
ICKIN
ESS
INTHEEFF
ECT
OFFE
DERALCONTRACTORST
ATUS
ONG
ENDER
ANDRACESH
ARES
OFO
CCUPA
TIO
NSD
URIN
G
1973
–200
3
PanelA:Wom
enManagers
(1)
Professionals
(2)
Technicians
(3)
Sales
(4)
Clerical
(5)
Manual
(6)
Service
(7)
White
female
Dependent
variable:%
white
femaleOcc
Pre1fed
0.0006
3(0.000
63)
0.00
077
(0.001
11)
)0.0003
8(0.001
24)
)0.0010
3(0.001
29)
)0.0013
8(0.000
85)
)0.0002
3(0.000
74)
0.0017
8(0.001
31)
Fed
)0.0009
1(0.000
75)
0.00
101
(0.001
31)
0.00
101
(0.001
49)
0.0009
7(0.001
62)
)0.0007
9(0.001
00)
)0.0004
2(0.000
88)
0.0012
0(0.001
68)
Last1fed
0.0008
5*(0.000
47)
)0.0004
7(0.000
90)
)0.0006
6(0.001
01)
)0.0003
1(0.001
16)
)0.0004
5(0.000
71)
0.0007
3(0.000
59)
0.0017
6(0.001
18)
Post1fed
)0.0000
1(0.000
61)
)0.0023
1**
(0.001
09)
)0.0000
5(0.001
21)
0.0012
1(0.001
27)
)0.0034
8***
(0.000
85)
)0.0006
4(0.000
71)
0.0020
0(0.001
28)
Black
female
Dependent
variable:%
blackfemaleOcc
Pre1fed
0.0000
0(0.000
21)
0.00
035
(0.000
33)
)0.0003
2(0.000
47)
)0.0005
4(0.000
38)
0.0009
2**
(0.000
38)
0.0010
7***
(0.000
39)
)0.0008
7(0.000
81)
Fed
)0.0001
9(0.000
24)
0.0008
3**
(0.000
38)
0.00
027
(0.000
53)
)0.0001
6(0.000
40)
0.0023
8***
(0.000
45)
0.0010
4**
(0.000
46)
0.0008
3(0.001
02)
Last1fed
)0.0000
0(0.000
16)
0.00
014
(0.000
27)
)0.0004
3(0.000
38)
0.0002
4(0.000
31)
)0.0006
4*(0.000
33)
0.0005
4*(0.000
30)
)0.0018
5**
(0.000
72)
Post1fed
0.0000
4(0.000
22)
0.0011
8***
(0.000
34)
)0.0004
0(0.000
46)
0.0003
1(0.000
38)
0.0011
5***
(0.000
39)
0.0007
3*(0.000
38)
)0.0010
4(0.000
79)
Hispanicfemale
Dependent
variable:%
HispanicfemaleOcc
Pre1fed
)0.0002
8*(0.000
14)
0.00
011
(0.000
25)
0.00
063*
(0.000
33)
)0.0003
7(0.000
31)
)0.0003
0(0.000
32)
)0.0000
2(0.000
29)
0.0003
0(0.000
56)
Fed
)0.0000
2(0.000
16)
0.00
018
(0.000
28)
0.00
082**
(0.000
38)
)0.0002
6(0.000
35)
)0.0003
8(0.000
40)
0.0001
8(0.000
37)
0.0002
6(0.000
69)
Last1fed
0.0001
1(0.000
11)
0.00
015
(0.000
21)
)0.0001
9(0.000
27)
0.0003
9(0.000
28)
)0.0002
7(0.000
27)
)0.0001
6(0.000
25)
0.0000
7(0.000
50)
Post1fed
0.0000
4(0.000
14)
0.00
034
(0.000
25)
0.00
012
(0.000
33)
)0.0002
3(0.000
32)
)0.0001
2(0.000
32)
0.0005
3*(0.000
30)
0.0013
2**
(0.000
56)
Observatio
ns93
0,15
375
7,67
467
5,63
258
1,16
092
3,35
177
0,83
656
9,23
0Num
berof
firms
106,01
592
,081
84,813
77,713
105,53
491
,753
73,601
238 / FIDAN ANA KURTULUS
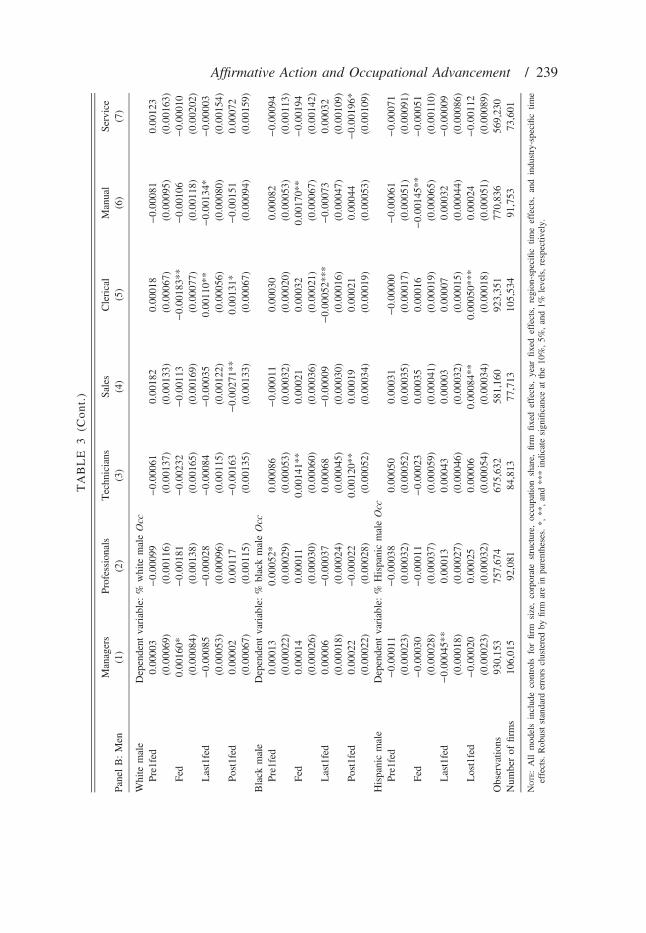
TABLE
3(C
ont.)
PanelB:Men
Managers
(1)
Professionals
(2)
Technicians
(3)
Sales
(4)
Clerical
(5)
Manual
(6)
Service
(7)
White
male
Dependent
variable:%
white
maleOcc
Pre1fed
0.0000
3(0.000
69)
)0.0009
9(0.001
16)
)0.0006
1(0.001
37)
0.0018
2(0.001
33)
0.0001
8(0.000
67)
)0.0008
1(0.000
95)
0.0012
3(0.001
63)
Fed
0.0016
0*(0.000
84)
)0.0018
1(0.001
38)
)0.0023
2(0.001
65)
)0.0011
3(0.001
69)
)0.00
183**
(0.000
77)
)0.0010
6(0.001
18)
)0.00
010
(0.002
02)
Last1fed
)0.00
085
(0.000
53)
)0.0002
8(0.000
96)
)0.0008
4(0.001
15)
)0.0003
5(0.001
22)
0.0011
0**
(0.000
56)
)0.0013
4*(0.000
80)
)0.00
003
(0.001
54)
Post1fed
0.0000
2(0.000
67)
0.00
117
(0.001
15)
)0.0016
3(0.001
35)
)0.0027
1**
(0.001
33)
0.0013
1*(0.000
67)
)0.0015
1(0.000
94)
0.0007
2(0.001
59)
Black
male
Dependent
variable:%
blackmaleOcc
Pre1fed
0.0001
3(0.000
22)
0.0005
2*(0.000
29)
0.00
086
(0.000
53)
)0.0001
1(0.000
32)
0.0003
0(0.000
20)
0.0008
2(0.000
53)
)0.00
094
(0.001
13)
Fed
0.0001
4(0.000
26)
0.00
011
(0.000
30)
0.00
141**
(0.000
60)
0.0002
1(0.000
36)
0.0003
2(0.000
21)
0.00
170**
(0.000
67)
)0.00
194
(0.001
42)
Last1fed
0.0000
6(0.000
18)
)0.0003
7(0.000
24)
0.00
068
(0.000
45)
)0.0000
9(0.000
30)
)0.00
052***
(0.000
16)
)0.0007
3(0.000
47)
0.0003
2(0.001
09)
Post1fed
0.0002
2(0.000
22)
)0.0002
2(0.000
28)
0.00
120**
(0.000
52)
0.0001
9(0.000
34)
0.0002
1(0.000
19)
0.0004
4(0.000
53)
)0.00
196*
(0.001
09)
Hispanicmale
Dependent
variable:%
HispanicmaleOcc
Pre1fed
)0.00
011
(0.000
23)
)0.0003
8(0.000
32)
0.00
050
(0.000
52)
0.0003
1(0.000
35)
)0.0000
0(0.000
17)
)0.0006
1(0.000
51)
)0.00
071
(0.000
91)
Fed
)0.00
030
(0.000
28)
)0.0001
1(0.000
37)
)0.0002
3(0.000
59)
0.0003
5(0.000
41)
0.0001
6(0.000
19)
)0.0014
5**
(0.000
65)
)0.00
051
(0.001
10)
Last1fed
)0.0004
5**
(0.000
18)
0.00
013
(0.000
27)
0.00
043
(0.000
46)
0.0000
3(0.000
32)
0.0000
7(0.000
15)
0.0003
2(0.000
44)
)0.00
009
(0.000
86)
Lost1fed
)0.00
020
(0.000
23)
0.00
025
(0.000
32)
0.00
006
(0.000
54)
0.00
084**
(0.000
34)
0.0005
0***
(0.000
18)
0.0002
4(0.000
51)
)0.00
112
(0.000
89)
Observatio
ns93
0,15
375
7,67
467
5,63
258
1,16
092
3,35
177
0,83
656
9,23
0Num
berof
firms
106,01
592
,081
84,813
77,713
105,53
491
,753
73,601
NOTE:All
modelsincludecontrols
forfirm
size,corporatestructure,
occupatio
nshare,
firm
fixed
effects,
year
fixed
effects,
region-specific
timeeffects,
andindustry-specific
time
effects.Robuststandard
errors
clusteredby
firm
arein
parentheses.*,
**,and***indicate
significanceat
the10%,5%
,and1%
levels,respectiv
ely.
Affirmative Action and Occupational Advancement / 239
240 / FIDAN ANA KURTULUS
generally do not reduce their female and minority shares once they are nolonger contractors; in fact, in some cases, the estimates are statistically signifi-cantly positive indicating that firms continue to diversify even after their fed-eral contract has ended.23,24,25,26
Conclusion
Using longitudinal data on more than 100,000 large private-sector firmsfrom all industries and regions from the U.S. Equal Employment OpportunityCommission, this study finds that minority and female shares of higher-payingskilled occupations grew more at federal contractors subject to affirmativeaction obligation over the three decades spanning 1973–2003, and this result isrobust to controlling for firm size, corporate and occupational structure, indus-try-specific shocks, region-specific shocks, economy-wide shocks, and firmfixed effects. Specifically, becoming a federal contractor increased whitewomen’s share of professional occupations by 0.183 percentage points, or by7.3 percent, on average during these three decades, and increased blackwomen’s share by 0.052 percentage points (or by 3.9 percent). Becoming afederal contractor also increased Hispanic women’s and black men’s share oftechnical occupations on average by 0.058 and 0.109 percentage points,respectively (or by 7.7 and 4.2 percent). These represent a substantial contribu-tion of affirmative action to overall trends in the occupational advancement ofwomen and minorities over the three decades under study. Affirmative actionalso had a smaller impact on race and gender diversity in blue-collar occupa-tions, by increasing the share of black women and black men in manual occu-pations during 1973–2003. Auxiliary checks indicate that selection was not
23 Note that the estimated coefficients on federal contractor status are generally qualitatively similar tothose reported in Table 2.
24 Note that also adding additional dummy variables indicating 2 years before gaining contract status,2 years until the end of contract status, and 2 years after the end of contract status resulted in qualitativelyvery similar results to those reported above.
25 As a further check on the role of selection, the baseline regressions in Table 2 were re-estimated lim-iting the sample to firms that were ever contractors (i.e., excluding firms that never held a federal contractduring the 31 years under study). Similar results between these and Table 2’s baseline results would indicateselection in and out of contractor status does not bias the results. Indeed, the results using only those firmsthat were ever contractors are very similar to the baseline results reported in Table 2, suggesting that selec-tion into contractor status is not a major concern. These additional results are reported in Table B1.
26 An event study-type specification was also estimated, with dummy variables indicating the year priorto contract status, first year of contract status, second year of contract status, third year of contract status,etc. The estimates revealed that most of the increases in minority and female shares occurred fairly continu-ously within the first 5 years of contract status for the specifications which also had statistically significantcoefficients on Fed in the baseline specification in Table 2. These results are available from the author.

Affirmative Action and Occupational Advancement / 241
driving these results and also that contractors maintained their increased minor-ity and female shares even after they no longer held a federal contract.The paper also reveals some important results on how the impact of affirma-
tive action evolved over the three decades under study. For example, affirma-tive action had a positive effect on moving black women, Hispanic women,white women, and black men into high-skill high-pay management, profes-sional, and technical occupations during the 1970s and early 1980s, but theimpact of affirmative action on advancing minorities and women into the topechelons of firm structures subsided during the Reagan years. Another keyfinding is that during the decade following the Glass Ceiling Act of 1991,affirmative action resurfaced as an important factor moving Hispanic womenand white women into managerial occupations, black women and Hispanicwomen into professional occupations, and black men into professional andtechnical occupations.Affirmative action in the labor market continues to generate heated debate,
yet there is little hard evidence brought to bear to inform policy discussions.This paper has presented large-sample evidence that minority and female rep-resentation in high-wage skilled occupations increased more on average at fed-eral contractors subject to affirmative action obligation during 1973–2003.Recent years have also witnessed much discussion surrounding the glass ceil-ing phenomenon and ways to reduce barriers that women and minorities facein achieving positions at high levels of firms. The current study suggests thatgovernment policy plays an important role in cracking the glass ceiling forwomen and minorities in the workplace.
REFERENCES
Anderson, Bernard. 1996. ‘‘The Ebb and Flow of Enforcing Executive Order 11246.’’ American EconomicReview Papers and Proceedings 86(2): 298–301.
Ashenfelter, Orley, and James Heckman. 1976. ‘‘Measuring the Effect of an Anti-discrimination Program.’’In Evaluating the Labor Market Effects of Social Programs, edited by Orley Ashenfelter, and JamesBlum, pp. 46–89. Princeton, NJ: Princeton University, Industrial Relations Section.
Badgett, M. V. Lee. 1995. ‘‘Affirmative Action in a Changing Legal and Economic Environment.’’ Indus-trial Relations 34(4): 489–506.
Bergmann, Barbara. 1996. In Defense of Affirmative Action. New York: Basic Books.Bertrand, Marianne, Claudia Goldin, and Lawrence Katz. 2010. ‘‘Dynamics of the Gender Gap for Young
Professionals in the Financial and Corporate Sectors.’’ American Economic Journal: Applied Econom-ics 2(3): 228–55.
—––—, and Kevin Hallock. 2001. ‘‘The Gender Gap in Top Corporate Jobs.’’ Industrial and Labor Rela-tions Review 55: 3–21.
Blau, Francine D., and Jed L. DeVaro. 2007. ‘‘New Evidence on Gender Differences in Promotion Rates:An Empirical Analysis of a Sample of New Hires.’’ Industrial Relations 46(3): 511–50.
—––—, Marianne Ferber, and Anne Winkler. 2010. The Economics of Women, Men, and Work, 6th ed.Upper Saddle River, NJ: Prentice-Hall.

242 / FIDAN ANA KURTULUS
—––—, and Anne Winkler. 2005. ‘‘Does Affirmative Action Work?’’ Regional Review. The FederalReserve Bank of Boston Q1: 38–40.
Bound, John, and Richard B. Freeman. 1992. ‘‘What Went Wrong? The Erosion of Relative Earnings andEmployment Among Young Black Men in the 1980s.’’ Quarterly Journal of Economics 107(1): 201–32.
Brown, Charles. 1982. ‘‘The Federal Attack on Labor Market Discrimination: The Mouse that Roared?’’ InResearch in Labor Economics, Vol. 5, edited by Ronald Ehrenberg, pp. 33–68. New York, NY: JAIPress.
Card, David, and Alan B. Krueger. 1992a. ‘‘School Quality and Black-White Relative Earnings: A DirectAssessment.’’ Quarterly Journal of Economics 107(1): 151–200.
—––—, and —––—. 1992b. ‘‘Does School Quality Matter? Returns to Education and the Characteristics ofPublic Schools in the United States.’’ Journal of Political Economy 100(1): 1–40.
Carrington, William J., Kristin McCue, and Brooks Pierce. 2000. ‘‘Using Establishment Size to Measure theImpact of Title VII and Affirmative Action.’’ Journal of Human Resources 35(3): 503–23.
Donohue, John J., and James J. Heckman. 1991. ‘‘Continuous Versus Episodic Change: The Impact of CivilRights Policy on the Economic Status of Blacks.’’ Journal of Economic Literature 29(4): 1603–43.
—––—, and Peter Siegelman. 1991. ‘‘The Changing Nature of Employment Discrimination Litigation.’’Stanford Law Review 43: 483–1033.
Freeman, Richard B. 1976. Black Elite. New York: McGraw-Hill.Heckman, James J., and Brook S. Payner. 1989. ‘‘Determining the Impact of Federal Antidiscrimination Pol-
icy on the Economic Status of Blacks: A Study of South Carolina.’’ American Economic Review79(1): 138.
—––—, and Kenneth I. Wolpin. 1976. ‘‘Does the Contract Compliance Program Work? An Analysis ofChicago Data.’’ Industrial and Labor Relations Review 29(4): 544–64.
Holzer, Harry J. 1998. ‘‘Why Do Small Establishments Hire Fewer Blacks Than Large Ones?’’ Journal ofHuman Resources 4(33): 896–914.
Holzer, Harry J., and David Neumark. 2000. ‘‘Assessing Affirmative Action.’’ Journal of Economic Litera-ture 38(3): 483–568.
Kurtulus, Fidan Ana. 2010. ‘‘The Impact of Affirmative Action on the Employment of Minorities andWomen Over Three Decades: 1973–2003.’’ Working Paper. Amherst, MA: University of Massachu-setts.
Leonard, Jonathan S. 1984. ‘‘Employment and Occupational Advance under Affirmative Action.’’ Review ofEconomics and Statistics 66: 377–85.
—––—. 1985. ‘‘What Promises Are Worth: The Impact of Affirmative Action Goals.’’ Journal of HumanResources 20(1): 3–20.
—––— 1986. ‘‘The Effectiveness of Equal Employment Law and Affirmative Action Regulation.’’ InResearch in Labor Economics, Vol. 8, edited by R. G. Ehrenberg, pp. 318–50. Greenwich, CT: JAIPress.
—––—. 1990. ‘‘The Impact of Affirmative Action Regulation and Equal Employment Law on BlackEmployment.’’ Journal of Economic Perspectives 4(4): 47–63.
—––—. 1996. ‘‘Wage Disparities and Affirmative Action in the 1980s.’’ American Economic ReviewPapers and Proceedings 86(2): 285–89.
McDaniel, Anne, Thomas A. DiPrete, Claudia Buchmann, and Uri Shwed. 2011. ‘‘The Black Gender Gapin Educational Attainment: Historical Trends and Racial Comparisons.’’ Demography 48: 889–914.
Ransom, Michael., and Ronald L. Oaxaca. 2005. ‘‘Intrafirm Mobility and Sex Differences in Pay.’’ Indus-trial and Labor Relations Review 58(2): 219–37.
Robinson, Corre L., Tiffany Taylor, Donald Tomaskovic-Devey, Catherine Zimmer, and Matthew Irwin.2005. ‘‘Studying Race or Ethnic and Sex Segregation at the Establishment Level: MethodologicalIssues and Substantive Opportunities Using EEO-1 Reports.’’ Work and Occupations 32(1): 5–38.
Smith, James, and Finis Welch. 1986. ‘‘Closing the Gap. Forty Years of Economic Progress for Blacks.’’Rand Corporation Publication Series, R-2296.

Affirmative Action and Occupational Advancement / 243
U.S. Department of Labor, Employment Standards Administration, Office of Federal Contract CompliancePrograms. 1998. Federal Contract Compliance Manual, http://www.dol.gov/ofccp/regs/compliance/fccm/fccmanul.htm (accessed April 6, 2010).
U.S. Glass Ceiling Commission. 1995a. Good for Business: Making Full Use of the Nation’s Human Capi-tal. Washington, DC: U.S. Government Printing Office.
U.S. Glass Ceiling Commission. 1995b. A Solid Investment: Making Full Use of the Nation’s Human Capi-tal. Washington, DC: U.S. Government Printing Office.
Appendix A
Occupational Category Descriptions.Managers and Officers: Administrative and managerial occupations comprised of personnel whoset broad policies, exercise overall responsibility for execution of these policies, and direct indi-vidual departments or special phases of the firm’s operations. Examples include officers, execu-tives, middle management, plant managers, department managers, superintendents, salariedsupervisors who are members of the management, ship captains, and farm operators and manag-ers.
Professionals: Occupations requiring a college degree or experience providing a comparablebackground. Examples include accountants and auditors, airplane pilots and navigators, archi-tects, artists, chemists, designers, dietitians, editors, engineers, lawyers, librarians, mathemati-cians, natural scientists, registered professional nurses, personnel and labor relations specialists,physical scientists, physicians, social scientists, teachers, and surveyors.
Technicians: Occupations requiring a combination of basic scientific knowledge and manualskill which can be obtained through 2 years of post-high school education, such as is offered intechnical institutes and junior colleges, or through equivalent on-the-job training. Examplesinclude computer programmers; drafters; engineering aides; junior engineers; mathematicalaides; licensed, practical, or vocational nurses; photographers; radio operators; scientific assis-tants; technical illustrators; medical and dental technicians; and electronic technicians.
Sales Workers: Occupations engaging wholly or primarily in direct selling, including advertisingagents and sales workers, insurance agents and brokers, real estate agents and brokers, stockand bond sales workers, sales workers and sales clerks, grocery clerks, and cashiers.
Office and Clerical Workers: All clerical-type work regardless of level of difficulty, where theactivities are predominantly nonmanual work. Examples include bookkeepers, messengers andoffice helpers, office machine and computer operators, shipping and receiving clerks, stenogra-phers, typists and secretaries, telephone operators, and legal assistants.
Manual Workers: Manual occupations of all skill levels, including skilled craft workers, semi-skilled machine operatives, and unskilled laborers. Examples include hourly paid supervisorsand lead operators who are not members of management, mechanics and repairers, electricians,mine operatives and laborers, motor operators, truck and tractor drivers, welders, farm workers,and laborers performing lifting and loading operations.
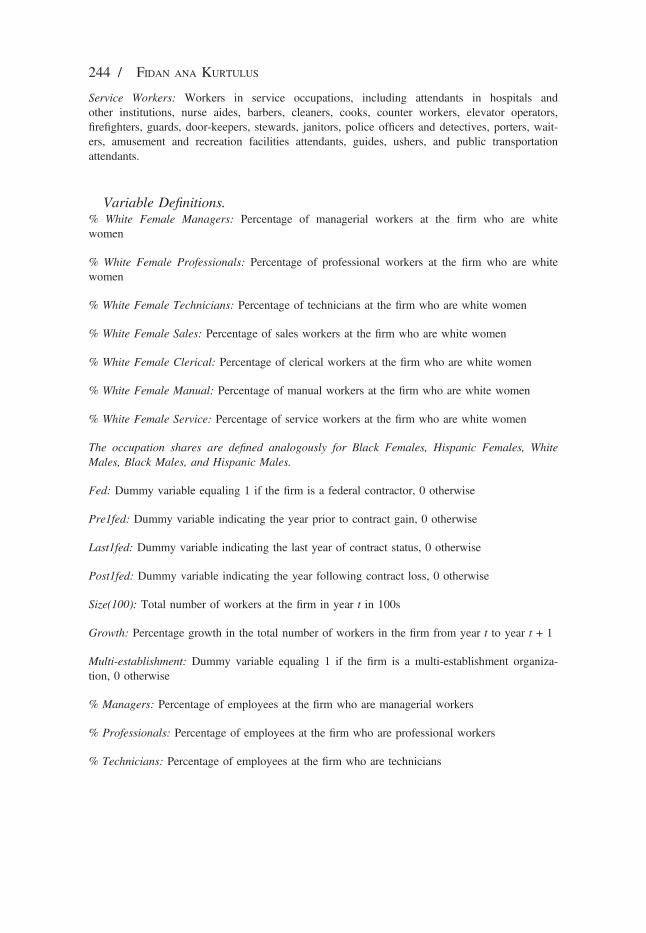
244 / FIDAN ANA KURTULUS
Service Workers: Workers in service occupations, including attendants in hospitals andother institutions, nurse aides, barbers, cleaners, cooks, counter workers, elevator operators,firefighters, guards, door-keepers, stewards, janitors, police officers and detectives, porters, wait-ers, amusement and recreation facilities attendants, guides, ushers, and public transportationattendants.
Variable Definitions.% White Female Managers: Percentage of managerial workers at the firm who are whitewomen
% White Female Professionals: Percentage of professional workers at the firm who are whitewomen
% White Female Technicians: Percentage of technicians at the firm who are white women
% White Female Sales: Percentage of sales workers at the firm who are white women
% White Female Clerical: Percentage of clerical workers at the firm who are white women
% White Female Manual: Percentage of manual workers at the firm who are white women
% White Female Service: Percentage of service workers at the firm who are white women
The occupation shares are defined analogously for Black Females, Hispanic Females, WhiteMales, Black Males, and Hispanic Males.
Fed: Dummy variable equaling 1 if the firm is a federal contractor, 0 otherwise
Pre1fed: Dummy variable indicating the year prior to contract gain, 0 otherwise
Last1fed: Dummy variable indicating the last year of contract status, 0 otherwise
Post1fed: Dummy variable indicating the year following contract loss, 0 otherwise
Size(100): Total number of workers at the firm in year t in 100s
Growth: Percentage growth in the total number of workers in the firm from year t to year t + 1
Multi-establishment: Dummy variable equaling 1 if the firm is a multi-establishment organiza-tion, 0 otherwise
% Managers: Percentage of employees at the firm who are managerial workers
% Professionals: Percentage of employees at the firm who are professional workers
% Technicians: Percentage of employees at the firm who are technicians
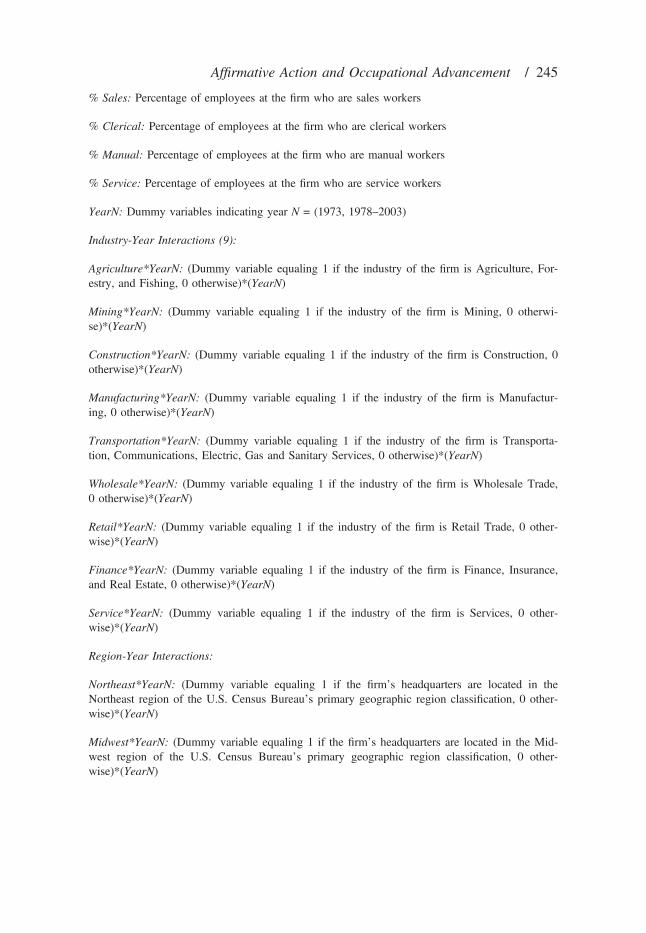
Affirmative Action and Occupational Advancement / 245
% Sales: Percentage of employees at the firm who are sales workers
% Clerical: Percentage of employees at the firm who are clerical workers
% Manual: Percentage of employees at the firm who are manual workers
% Service: Percentage of employees at the firm who are service workers
YearN: Dummy variables indicating year N = (1973, 1978–2003)
Industry-Year Interactions (9):
Agriculture*YearN: (Dummy variable equaling 1 if the industry of the firm is Agriculture, For-estry, and Fishing, 0 otherwise)*(YearN)
Mining*YearN: (Dummy variable equaling 1 if the industry of the firm is Mining, 0 otherwi-se)*(YearN)
Construction*YearN: (Dummy variable equaling 1 if the industry of the firm is Construction, 0otherwise)*(YearN)
Manufacturing*YearN: (Dummy variable equaling 1 if the industry of the firm is Manufactur-ing, 0 otherwise)*(YearN)
Transportation*YearN: (Dummy variable equaling 1 if the industry of the firm is Transporta-tion, Communications, Electric, Gas and Sanitary Services, 0 otherwise)*(YearN)
Wholesale*YearN: (Dummy variable equaling 1 if the industry of the firm is Wholesale Trade,0 otherwise)*(YearN)
Retail*YearN: (Dummy variable equaling 1 if the industry of the firm is Retail Trade, 0 other-wise)*(YearN)
Finance*YearN: (Dummy variable equaling 1 if the industry of the firm is Finance, Insurance,and Real Estate, 0 otherwise)*(YearN)
Service*YearN: (Dummy variable equaling 1 if the industry of the firm is Services, 0 other-wise)*(YearN)
Region-Year Interactions:
Northeast*YearN: (Dummy variable equaling 1 if the firm’s headquarters are located in theNortheast region of the U.S. Census Bureau’s primary geographic region classification, 0 other-wise)*(YearN)
Midwest*YearN: (Dummy variable equaling 1 if the firm’s headquarters are located in the Mid-west region of the U.S. Census Bureau’s primary geographic region classification, 0 other-wise)*(YearN)

246 / FIDAN ANA KURTULUS
South*YearN: (Dummy variable equaling 1 if the firm’s headquarters are located in the Southregion of the U.S. Census Bureau’s primary geographic region classification, 0 other-wise)*(YearN)
West*YearN: (Dummy variable equaling 1 if the firm’s headquarters are located in the Westregion of the U.S. Census Bureau’s primary geographic region classification, 0 other-wise)*(YearN)
Appendix B
TABLE B1
THE EFFECT OF FEDERAL CONTRACTOR STATUS ON GENDER AND RACE SHARES OF OCCUPATIONS
DURING 1973–2003 USING THE SUBSAMPLE OF FIRMS THAT WERE EVER CONTRACTORS
Occupation
Managers(1)
P
rofessionals(2)T
echnicians(3)Sales(4)
Clerical(5)
Manual(6)
Service(7)
Women:
White female )0.00049(0.00052)
0.00192**(0.00092)0.00101(0.00104)
0.00065(0.00112)
)0.00017(0.00071)
)0.00005(0.00061)
0.00106(0.00116)
Black female
)0.00010(0.00017)0.00055**(0.00027)
0.00036(0.00037)
0.00005(0.00029)
0.00187***(0.00031)
0.00085***(0.00032)
0.00065(0.00071)
Hispanic female
0.00009(0.00011)0.00015(0.00020)
0.00059**(0.00026)
)0.00004(0.00025)
)0.00046(0.00028)
0.00007(0.00026)
)0.00008(0.00049)
Male:
White male 0.00089(0.00058))
0.00265***(0.00097))
0.00231**(0.00116))0.00077(0.00116)
)0.00162***(0.00055)
)0.00111(0.00082)
)0.00113(0.00142)
Black male
0.00002(0.00019))0.00018(0.00022)
0.00108**(0.00043)
0.00014(0.00026)
0.00008(0.00015)
0.00121**(0.00047)
)0.00113(0.00100)
Hispanic male )
0.00040**(0.00019))0.00003(0.00026)
)0.00010(0.00042)
0.00006(0.00029)
0.00001(0.00014)
)
0.00121***(0.00046)0.00015(0.00078)
Observations
717,236 596,142 533,922 447,751 712,957 591,296 434,103 Number of firms 72,380 64,180 59,390 52,749 72,141 62,929 51,122NOTE: This table re-estimates the specifications in Table 2 using the subsample of firms that were ever contractors during1973–2003. Each entry represents the coefficient estimate on federal contractor status from a regression of the share ofwomen and men of different races within each occupational category at the firm on federal contractor status and controlsfor firm size, corporate structure, occupation share, firm fixed effects, year fixed effects, region-specific time effects, andindustry-specific time effects. Robust standard errors clustered by firm are in parentheses. *, **, and *** indicatesignificance at the 10%, 5%, and 1% levels, respectively.