african trade report 2017 - african export–import bank · 4 afreximbank african trade report 2017...
TRANSCRIPT

African Trade Report2017
African Export-Import BankBanque Africaine D’Import-Export
Transforming Africa’s Trade
Bridging Africa’s Trade Finance Gap through Domestic Resource Mobilization


Bridging Africa’s Trade Finance Gap through Domestic Resource Mobilization
© Copyright Afreximbank, Cairo 2017. All rights reserved
No part of this publication may be reproduced or transmitted, in any form or by any means, electronic, mechanical, photocopying, recording or otherwise or stored in any retrieval system of any nature without the prior, written permission of the African Export-Import Bank, application for which shall be made to the Bank.
ISBN 978-92-95097-39-1
HEAD OFFICE African Export-Import Bank 72(B) El Maahad El Eshteraky Street Heliopolis, Cairo 11341 P O Box 613 Heliopolis Cairo 11757, Egypt Tel: +202 24564100/1/2/3 Email. [email protected] Website: www.afreximbank.com
AFRICAN TRADE REPORT 2017

4 AFREXIMBANK AFRICAN TRADE REPORT 2017
ForewordThe global economy appears to be gradually recovering after two years of tepid growth. The macroeconomic environment has been challenging despite concerted efforts at policy levels to counter major dislocations in several markets. In the midst of that challenging global economic and financial environment, some salient points stood out. First, for the first time in 15 years, the ratio of trade growth to world GDP growth fell below 1:1, signaling a weakening of the long-established relationship between the two indicators. Second, the sustained deterioration in commodity terms of trade led to renewed external imbalances, which heightened uncertainty and macroeconomic volatility, especially in natural resource–dependent economies in the developing world. Already widening trade deficits in Africa were aggravated by declining trade finance in a global context of increasing aversion to risk and a stringent international compliance environment. Finally, the large-scale withdrawal of international banks and financial institutions from developing countries, including those in Africa, and massive capital outflows were exacerbated by diverging monetary policy and increased uncertainty associated with macroeconomic management challenges, most notably currency gyrations and shortages of foreign reserves. In Africa, where financing gaps have been consistently singled out as major constraints to investment and economic growth, the implications were significant and evident in observed declines in Foreign Direct Investment (FDI) flows and increased recourse to domestic resource mobilization.
The 2017 edition of the African Export-Import Bank’s annual flagship report—African Trade Report—appropriately titled “Bridging Africa’s Trade Finance Gap Through Domestic Resource Mobilization”—provides important insights on the critical role of inward resource mobilization in growth and economic transition. In particular, it stresses the complementarity between domestic resource mobilization and foreign direct investment in structural transformation. By crowding in foreign direct investment, domestic resource mobilization creates the conditions for expanding investments while enhancing the transfer of technology needed for industrial upgrading and structural transformation.
As I write, the drive for domestic resource mobilization is taking hold across the continent, and recent developments and initiatives by both the public and private sectors have been very encouraging. Average tax revenue as a percentage of GDP has increased since the 1990s. In addition to traditional approaches—which have primarily involved expanding fiscal space—innovative market solutions are increasingly being considered to raise domestic resources in support of trade and investment. These have involved local currency financing through issuance of bonds by African sovereign and corporate entities and other options contemplated by banks and financial institutions to leverage African resources to support intra-African trade.
The 2017 edition of the African Trade Report also provides a comprehensive analysis of the state of global and African trade in 2015–16. It is published at a time when the institution is rebranding, with implications for all Bank publications. This combined issue, which ensures continuity in the coverage

AFREXIMBANK AFRICAN TRADE REPORT 2017 5
and publication of the Bank’s flagship report, is an exceptional measure, and subsequent issues will revert to an annual review covering developments in global and African trade.
While overall trade contracted in 2015–16, stemming the incremental growth in African trade of prior years, intra-African trade was more resilient, essentially absorbing global shocks. The Report reviews the progress related to ongoing efforts to boost intra-African trade by further mitigating the region’s exposure to global volatility and by deepening economic integration within the continent. The signing of the Tripartite Framework Agreement in 2015 and progress towards establishing the Continental Free Trade Area were particularly important.
Other initiatives undertaken to boost African trade in 2015–16 include measures to improve the trade-enabling environment and African trade–facilitating initiatives to expedite the movement, release and clearance of goods. Despite the challenging global and African economic context, a growing number of African countries improved their trade-enabling environment, recording significant improvement in trade facilitation metrics between 2014 and 2016. At the global level the most important development in the context of rising anti-trade rhetoric was the ability of the international development community to sustain the momentum towards adoption of the Trade Facilitation Agreement by members of the World Trade Organization.
Looking ahead to the near term, Africa is expected to enjoy stronger economic growth and trade in 2017 and beyond, riding on the momentum of the global economy, although weak investment in the face of low commodity prices and productivity growth will continue to weigh on the medium-term outlook. Growth prospects are also likely to be affected by downside risks associated with ongoing rebalancing in China—Africa’s main trade partner. To mitigate against these risks and set the region on a sustainable growth path, the Report argues for expanding intra-African trade to achieve economies of scale and for pursuing structural transformation to increase productivity and diversify the sources of Africa’s growth and exports. These two priorities form the bedrock of the Bank’s Fifth Strategic Plan covering 2017-2021. The Plan, dubbed Impact 2021—Africa Transformed will inform the Bank’s intervention in member countries over the next five years.
Dr. Benedict O. Oramah President and Chairman of the Board of Directors The African Export-Import Bank Cairo, Egypt June 2017

Table of Contents8 Introduction and Executive Summary
10 Domestic Resource Mobilization and Structural Transformation10 Global and Regional Output in 2015–1611 Merchandise Trade12 Prospects12 Structure of the Report
14 Bridging Africa’s Trade Finance Gap Through Domestic Resource Mobilization16 Domestic Resource Mobilization and Structural Transformation in Africa17 Successes and Failures in Domestic Resource Mobilization and Structural
Transformation19 Approaches to Mobilizing and Deploying Domestic Resources23 Policy Lessons for Africa
26 Economic environment26 Output and Price Developments36 International Financial Markets and Financing Conditions
40 Trade and the Trading Environment40 Global Trade42 Global Trading Environment45 Africa’s External Reserves and Exchange Rates
58 Commodity Prices
72 Rising Protectionism in Global Trade75 Protectionist Measures by Type75 State Aid75 Trade Defence Measures79 ImportTariffMeasures80 Standards and Technical Barriers to Trade80 Trade Finance Measures81 Other Protectionist Measures81 Trade Disputes
86 Trade facilitation88 The World Trade Organization Trade Facilitation Agreement90 Africa’s Trade-Enabling Environment93 Africa’s Trade Facilitation Initiatives
98 Intra-African Trade101 Intra-African Trade Champions105 Intra-African trade developments for selected countries108 Trade within regional economic communities
110 Prospects
113 References

1Chapter One

AFREXIMBANK AFRICAN TRADE REPORT 2017 9
Introduction and Executive Summary
As the global economic recovery continues to struggle against economic headwinds, this report—with the theme “Bridging Africa’s Trade Finance Gap Through Domestic Resource Mobilization”—reviews major developments in the global and African macroeconomic and trade environment in 2015–16. Continued weakness in the global economy characterized by synchronous growth decelerations in most developing economies, including China; by lingering effects of the fiscal and sovereign debt crisis in the Eurozone; and by financial market volatility—all of which contributed to dampening global demand at a time of creeping protectionism and sustained deterioration in commodity terms of trade—had adverse implications for liquidity, especially trade and development finance for Africa. These patterns exacerbated challenges related to macroeconomic management—that is, management of fiscal, monetary, real and external sectors—faced by African countries over the past two years, hindering Africa’s trade and economic growth.
In 2015–16, the global economic environment was affected by the divergence of monetary policy, with the US Federal Reserve committing to a gradual tightening of interest rates. It raised the federal funds rate in December 2015, from the zero lower bound, and in December 2016. Monetary policy remained highly accommodative
in Japan and the Eurozone, reflecting continued risk of stagnation or deflation. Episodes of volatility and the US Federal Reserve’s rate hikes affected global financial markets through tighter external financial flows, declining capital flows, and currency depreciations. Developing economies, which faced structural imbalances, slower growth and lower commodity prices, were the most affected by global liquidity constraints in 2016.
In a region where infrastructure and trade finance gaps are wide, the increasingly tightening financing conditions at the global level and the large-scale withdrawal of international banks from the region and particularly from correspondent banking relationships have heightened the urgency for Africa to pay more attention to domestic resource mobilization in order to ensure that financing to boost trade and infrastructure development in support of growth and structural transformation is sustained.1
1 The annual global infrastructure financing gap is
estimated at US$3–4 trillion and at US$93 billion
for Africa, mainly covering basic infrastructure,
housing, health and education (World Economic
Forum (2014); Foster and Briceno (2009)). The
region’s trade financing gap is conservatively
estimated at around US$120 billion a year
(African Development Bank, 2014).

10 CHAPTER ONE AFRICAN TRADE REPORT 2017
1.1 Domestic Resource Mobilization and Structural Transformation
For this report the African Export–Import Bank undertook a study to explore options for drawing on domestic resources to “bridge Africa’s trade finance gap”. It found that the shortage of hard currency across the region has been exacerbated by capital outflows that have seen capital-starved economies become net exporters of financial resources (see chapter 2). The counter-intuitive direction of financial flows from Africa is at odds with other regions of the world where domestic resource mobilization has played a key role in financing economic development and trade.
The findings of the study—which was motivated by efforts to draw on global best practices to increase domestic resource management to support growth and economic development—highlight a contrast in development strategy and outcomes, most notably between Africa and other developing regions. While foreign direct investment has played a key role in growth and structural transformation of local economies in Asia over the last few decades, investment has been financed primarily by surplus savings that ultimately crowded in foreign investment. In Africa, by contrast, structurally low domestic savings constrains the growth of physical capital, even though high marginal product and subsequent attraction of capital should have been expected, especially given the region’s excess natural resource endowment and growing population.
1.2 Global and Regional Output in 2015–16
Growth in global output decelerated marginally, from 3.4 percent in 2014 to 3.2 percent in 2015 and 3.1 percent in 2016, largely mirroring the growth decelerations
that characterized developing economies, especially those in the Commonwealth of Independent States, Latin America and the Caribbean, and Developing Asia. Developing Asia was the leading driver of global growth and trade, and the deceleration of its output growth more than outweighed the modest recovery in Group of Seven countries.
African economies showed resilience in 2015–16 despite the challenging global environment. The difficulties posed by falling global demand and counter-shocks in commodity markets with the plunge in prices for commodities of export interest to Africa—particularly oil—emerged as major downside risks to growth and trade in a region where oil-exporting countries account for more than half of gross domestic product (GDP) and over 55 percent of exports. These risks were compounded by difficult domestic conditions such as heightened security concerns. Aggregate output in Africa expanded at a moderate rate, with average GDP decelerating slightly, from 3.9 percent in 2014 to 2.9 percent in 2015 to around 2.8 percent in 2016.
In tandem, global financial markets experienced phases of turbulence and volatility in 2015–16, leading to massive capital outflows, especially where foreign direct investment was dominated by portfolio flows, with adverse implications for macroeconomic management. These moves in financial markets were driven primarily by continued global uncertainties and uninspiring growth in developed economies; increasing macroeconomic management challenges in developing economies; divergent monetary policies between the US Federal Reserve and other major central banks, leading to volatility in capital markets; slowdown in growth and uncertainty over the rebalancing of the Chinese economy; weaker global commodity prices; and increasing protectionism.

AFREXIMBANK AFRICAN TRADE REPORT 2017 11
1.3 Merchandise Trade
Growth in the volume of world merchandise trade became increasingly lethargic in 2015–16, declining from 2.8 percent in 2014 to 2.7 percent in 2015 to 1.3 percent in 2016. Volatility in exchange rates and persistent weaknesses in global commodity prices, particularly for oil, which are priced in US dollars, resulted in a divergence between world merchandise trade figures in 2015–16 by volume and by value. Volume remained flat in 2015, but the value showed a sharp decline, with world merchandise exports falling 14 percent from 2014 (US$19 trillion) to 2015 (US$16 trillion) and 3.3 percent from 2015 to 2016 (US$15.46 trillion).
North American exports grew marginally, at 0.5 percent in 2016, down from 0.8 percent growth in 2015 and 4.1 percent in 2014. This sluggishness largely reflected weaknesses in the merchandise exports of the United States, the largest economy in the region. In Asia growth in merchandise exports rebounded slightly, to 1.8 percent in 2016 from a slump of 1.1 percent in 2015, but remained far below the 4.3 percent in 2014. The deceleration of merchandise exports in the region was due largely to weak performances in China and India, the two largest economies in the region. In Brazil and other developing economies, growth in exports remained weak in 2015–16 due to low prices of oil and other primary commodities and to higher exchange rate volatility. Brazil was hit by a wave of political scandals, a deep recession, a fiscal crisis and falling export prices, which undermined the performance of South and Central America, whose merchandise exports grew 1.3 percent in 2016.
Africa’s total merchandise trade fell 14.3 percent from 2014 (US$1.21 trillion) to 2015 (US$1.03 trillion) but rebounded 4.1 percent in 2016 (to US$1.08 trillion). The contraction in 2015 was due largely to slow growth in many developed and developing economies,
weak global demand for commodities and a challenging global environment, including the sharp decline in global commodity prices and the slowdown of the Chinese economy. However, China is still Africa’s largest country trade partner—accounting for 16.3 percent of Africa’s total trade in 2015 and 11.9 percent in 2016—followed by France—which accounted for 6 percent of Africa’s total trade in 2015 and 4.8 percent in 2016. The European Union remained Africa’s largest trade partner—accounting for 43.2 percent of Africa’s total trade in 2015 and 38.9 percent in 2016, though its share has been steadily declining over the last few years (after a peak of 45.1 percent in 2013).
Following growth of 8.6 percent in 2015, intra-African trade grew marginally by 0.6 percent in 2016, to US$156.94 billion. While still below the peak of US$174.9 billion in 2013, this growth was driven by a modest recovery in commodity prices, particularly in energy markets; improved regional trade across regional economic communities; and some countries’ increased focus on promoting intra-African trade. Trade within regional economic communities remained buoyant, aided by market access preferences and continued efforts to develop trade and transport corridors for intra-African trade.
At the regional level the Southern African Development Community (SADC) remained the most vibrant trading bloc on the continent, underpinned by strong demand for South African exports from other SADC countries, despite the dampening effect of the decline in energy prices. South Africa (23.3 percent), Nigeria (8.5 percent) and Namibia (8.1 percent) were the drivers of intra-African trade. Still, at about 15 percent of the continent’s total merchandise trade, the share of intra-African trade compares unfavourably with intra-regional trade in other regions—Europe (67 percent), Asia (58 percent), North America (48 percent) and Latin America and the Caribbean (20 percent).

12 CHAPTER ONE AFRICAN TRADE REPORT 2017
1.4 Prospects
Global growth is projected to rise to 3.5 percent in 2017, from 3.1 percent in 2016, as global economic activity continues its gradual improvement, supported by rising investment and manufacturing output coupled with an expected pick-up in global demand. Underpinned by accommodative policies, cyclical recovery, rising global manufacturing and improving market confidence, the gradual pick-up in economic activity among developed economies is expected to be sustained. The US economy is projected to strengthen, driven by growing public spending, especially on infrastructure; increasing manufacturing output; and rising consumer spending on the back of falling unemployment. In the Eurozone, the combined effects of cyclical recovery from the global financial crisis, abatement of the impact of the sovereign debt crisis, and accommodative monetary policy are expected to sustain the pace of 2016’s growth at 1.7 percent in 2017.
Growth in developing economies is projected to strengthen slightly, on the back of strong activity in India and expected recovery in Brazil. However, major downside risks include sustained growth deceleration in China as the country rebalances, with consequent dampening effects on commodity prices and revenues in commodity-dependent countries; tighter external financing conditions; and pronounced reversal of capital flows to the United States owing to gradual increases in interest rates by the US Federal Reserve, which are likely to strengthen the US dollar.
African economies are projected to strengthen, with growth quickening to about 3.4 percent in 2017, up from 2.8 percent in 2016, largely reflecting the gradual recovery in developed economies and knock-on effect on global demand, which will help sustain the upward momentum of most commodity prices and lift the growth of Africa’s merchandise trade. The projected recovery
of the largest economies in Africa, notably Nigeria on account of higher oil prices and growing public investment as well as South Africa and Angola, is also expected to pull up GDP growth on the continent.
Growth in the volume of global merchandise trade is projected to strengthen to 2.4 percent in 2017, from 1.3 percent in 2016, mirroring improvements in the global economy, led by a synchronized modest expansion in developed economies, notably the United States, Canada, and France, and a slight pick-up in developing economies, driven by strong performance in India and recovery in Russia and Brazil. Potential downside risks include sustained growth deceleration in China. Also, uncertainty associated with trade arrangements between the United Kingdom and the European Union after the vote on Brexit and the spectre of rising protectionism could limit the global recovery.
Still, intra-African trade is projected to improve as countries in the region continue to undertake measures and initiatives at the national and regional levels to boost intra-regional trade with a view to insulate themselves from global shocks. Efforts across the continent to deepen regional integration are expected to build a solid foundation for dynamic intra-African trade in the medium to long term, especially the Tripartite Free Trade Area aimed at deepening and strengthening economic integration in Southern and Eastern Africa; the Common External Tariff of the Economic Community of West African States to promote investment and industrialization and facilitate exports of processed goods; and the Continental Free Trade Area.
1.5 Structure of the Report
The report is organized in nine chapters. Chapter 2 presents thematic research on domestic resource mobilization. Chapter 3 reviews global macroeconomic and financial

developments, including Africa’s, while Chapter 4 discusses the global trade and trading environment. Chapter 5 looks at the dynamics of commodities, with an emphasis on commodities of trade interest to Africa. Chapter 6 examines the re-emergence of protectionism and its implications
for global and African trade. Chapter 7 discusses trade facilitation, highlighting Africa’s particularities while reviewing the role of such facilitation in promoting trade and economic growth. Chapter 8 focuses on intra-African trade. Chapter 9 reviews growth, development and trade prospects.
AFREXIMBANK AFRICAN TRADE REPORT 2017 13

2Chapter Two
AFREXIMBANK AFRICAN TRADE REPORT 2017 15
Bridging Africa’s Trade Finance Gap Through Domestic Resource Mobilization
Capital is essential for industrial upgrading, sectoral diversification, trade and infrastructure development, and many successful developing economies rely on domestic capital mobilization for investment and growth. High saving and investment rates have helped the economies that have consistently achieved robust economic growth rates over the last 25 years, setting them on a path to substantial capital accumulation. For instance, in China, Japan and the Republic of Korea foreign direct investment played only a small role in industrial investment. Instead, domestic resources were crucial for upgrading and capacity growth.
In contrast to the Asian development model, decades of insufficient foreign direct investment and of capital flight have left African economies severely undercapitalized, compromising total factor productivity and prolonging disinvestment by limiting returns to capital and ultimately undermining the diversification of Africa’s trade and its integration into the global economy. Ndikumana (2015,) argues that “by draining domestic resources, capital flight perpetuates dependence on external aid even as it undermines aid effectiveness”.
Furthermore, capital account liberalization, supported by Washington Consensus reform prescriptions, induced capital flight and may have constrained accumulation (Hermes and Lensink 2014). In seeking to stimulate industrial growth in sectors consistent with comparative advantages, developing countries often require immediate capital injections. Given the continuing frictions in international capital flows, sources of rapid capitalization exist more among domestic investors than among foreign investors. Domestic resource mobilization is thus crucial to economic transformation and must be understood from both a historical and cross-sectional perspective. It may even be more important now that there is a concerted effort to accelerate industrialization of African economies, as illustrated by the selection of industrialization and export development as the second pillar of the African Export–Import Bank’s Fifth Strategic Plan.
The Monterrey Consensus, which emerged from the United Nations International Conference on Financing for Development in 2002, emphasized the role of domestic resource mobilization in achieving the Millennium Development Goals. The

16 CHAPTER TWO AFRICAN TRADE REPORT 2017
2005 UN Millennium Project included domestic resource mobilization in a suite of initiatives alongside capacity building, public investment and official development assistance. According to USAID (2016), domestic resource mobilization programmes generate US$20 in increased revenue for every US$1 of related assistance. In 2014 the United States announced a US$63 million programme to assist countries in mobilizing domestic resources for public health initiatives. The variety, scope and depth of challenges facing developing countries—public health, education, infrastructure (including trade-supporting infrastructure), to name just a few—require more resources than what foreign aid can provide. This partly explains the rising interest in domestic resource mobilization from both academia and practitioners.
This chapter examines the importance of domestic resource mobilization for growth, trade and economic development and structural transformation in Africa, highlighting key persistent challenges. It discusses various successes and failures in raising domestic resources in support of investment and growth from around the globe. And it concludes with lessons for domestic resource mobilization and structural transformation as well as policy lessons for Africa.
2.1 Domestic Resource Mobilization and Structural Transformation in Africa
In an early study of Asian developing countries, Dowling and Hiemenz (1983) operationalized governments’ role in domestic resource mobilization as a ratio of tax revenue to gross domestic product (GDP), finding that government contributions to domestic resource mobilization have a significant positive effect on GDP growth despite the diminishing effect of higher taxes on private capital formation. Vos et al. (2007) took a
less sanguine view, arguing that financing Millennium Development Goal initiatives from taxes and domestic borrowing has negative macroeconomic impacts, including “Dutch Disease” (rising real exchange rates due to rapid capital inflows), the crowding-out of private investment and less disposable income. They argued that domestic resource mobilization strategies can also have unexpectedly delayed effects.
Scholarship has also explored different types of domestic resource mobilization. Binagwaho and Sachs (2005) argued that value-added taxes are an example of broad-based revenue initiatives needed to expand the fiscal space for increased resource mobilization. They recommended “rechanneling current low-priority spending into higher priority MDG investments” (p. 55).
Chong-Hyun and Chang-Jin (2000) found that the Republic of Korea’s corporate sector accounts for a large percentage of national savings and was crucial in mobilizing domestic resources in the country’s rapid development in the 1960s and 1970s. Extending the focus on the private sector, Fofack and Ndikumana (2009) argued that a potential source of domestic resources for Africa lies in repatriation of a vast store of capital that fled the continent for foreign banks. For example: the depletion of domestic resources in Nigeria throughout the 1970s and 1980s, when capital outflows exceeded foreign debt accumulation (Ajayi 1995). Weisskopf’s (1973) study of post-colonial India argued that the government’s failure to limit demand for foreign goods and services (particularly among wealthy consumers) constrained the growth of domestic capital.
While domestic capital markets are a potentially valuable source of domestic resource mobilization, many African countries’ under-developed or under-diversified industrial structures reduce their ability to channel surplus savings

AFREXIMBANK AFRICAN TRADE REPORT 2017 17
to productive investments. Options for drawing on external financing in the form of portfolio investments to the region are constrained because most African countries are not connected to the global financial architecture and because their financial infrastructure deficits of the last few years have further increased their dependency on foreign aid.
Tax reform, although it has been shown to hamper domestic consumption and raise producer costs, is an opportunity for governments to improve domestic resource mobilization (Ndikumana et al. 2015). Nevertheless, Africa continues to suffer from constraints to domestic resource mobilization.
Understanding the role of industrial policy and institutions in the growth patterns of resource-rich developing countries requires understanding the links among domestic resource mobilization, capital inflows and outflows, and economic transformation. Africa suffers from low physical capital despite having abundant natural resources and a large population. These conditions suggest the potential for high marginal product and subsequent attraction of capital—but they have not materialized.
The two channels of capital inflows for upgrading—government and the private sector—are both subject to perceptions of sovereign risk. Domestic and foreign investors must be assured that returns are lucrative and that loan repayments are guaranteed; financial intermediation is one method of addressing these concerns. According to Ndikumana and Blankson (2015, p. 24), “efficient financial intermediation…helps to channel resources into the most productive investments”. However, Africa’s weak financial intermediation constrains the flow of capital from private creditors to private borrowers. Costs associated with financial intermediary activity are numerous, and transaction costs are higher than those in
developed countries, limiting capital flows where government institutions are weak, loan markets thin, lending capacities low and trust among contracting parties lacking. The financial intermediary industry is designed to address such lending risks, but in Africa its underdevelopment has been a substantial deterrent to foreign direct investment.
Other risks that hamper capital inflows and raise Africa’s external finance premium include the threat of domestic and international banking crises, which reduces available risk capital; erroneous perceptions of high risk associated with investing in Africa; and weak or missing financial markets. These factors illustrate the challenges of mobilizing external resources for Africa and the need to explore the prospects for domestic resource mobilization.
2.2 Successes and Failures in Domestic Resource Mobilization and Structural Transformation
Many African countries still face the challenging growth conditions once endured by many developing countries in the post–World War II era: poor infrastructure, low educational attainment, high death rates with high population growth, and dependence on extractive industries and manufactured imports. Many developing post-war economies adopted an industrialization strategy centred on capital-intensive manufacturing, seeking to replicate the success of such industries in developed countries. However, this abrupt strategic shift was incompatible with the factor endowments of these largely agrarian economies. Further, it allocated aid capital and already scarce domestic capital to comparative advantage–defying industries (industries that are non-viable in competitive markets and require government policy support for their initial investment and continuous operations). Consequently, modern industries in

18 CHAPTER TWO AFRICAN TRADE REPORT 2017
developing countries, including Africa, failed to achieve the success of those in developed countries and remain uncompetitive and unprofitable.
To account for the costly and disruptive mismatch between industrial structure and factor endowments, most governments in Africa and other developing countries embraced interventionist policies, moving away from strict laissez-faire policies to protecting failing industries. However, this artificial support generated opportunities for rent-seeking behaviour, corruption and embezzlement (Kornai 1986; Schaffer 1998; Kornai et al. 2003). A perverse symbiosis emerged whereby firms relied on government subsidies and intervention despite the distortionary nature of such policies, and government relied on the survival of firms to maintain output, employment and social stability.
The reforms prescribed by post-war development institutions and governments embracing neoliberal ideology falsely
attributed stagnation to government failures, calling for the immediate and comprehensive removal of distortions and envisioning a single massive leap from central planning to market-based resource allocation. However, these recommendations were founded on an incomplete understanding of the interdependencies between governments and uncompetitive industries, which over time had ossified into an endogenous, albeit unproductive, equilibrium based on the misguided strategy of import substitution. Lacking any economic protection, these industries quickly failed and sent tenuously stable developing economies plummeting, in an era in Africa known as the lost decades (Artadi and Sala-i-Martin 2003; Fofack 2014). Countries that continued with market-distorting policies “under the radar” likewise suffered—first because new supportive policies were less efficient than the ones they replaced and second because developed countries with competitive industries commanded an increasing share of global trade and crowded out firms from developing countries.

AFREXIMBANK AFRICAN TRADE REPORT 2017 19
Notable counter-examples include the rapidly developing post-war economies of East Asia and Southeast Asia, as well as China. These newly industrializing economies eschewed the structuralist model of import substitution that focused on comparative advantage–defying and capital-intensive heavy industries and instead adopted a dual-track approach that maintained support for unviable industries while opening the production market to private firms. They also acquired foreign technologies to achieve structural change oriented towards comparative advantages. The resulting growth of labour-intensive industries initially generated rapid growth and attracted industries from countries with increasingly high labour-cost structures.
Over time, economic prosperity enabled these economies to invest public and private surpluses to improve factor endowments, including in infrastructure, technology-based industrial upgrading and workforce education. As they advanced rapidly through development stages, their constantly evolving factor endowment structures enabled them to become globally competitive in higher value-added production, particularly leading-edge technology. Examples are the Republic of Korea’s automobile industry; Taiwan, China’s semiconductor industry; and Singapore’s petrochemicals industry, all of which leveraged national comparative advantages such as labour productivity and innovative capacity.
Africa seems to have followed a different, if not the opposite, path. Despite evidence that comparative advantage is the basis of an effective growth strategy, many African countries failed to identify priority industries, while industrial policies have generally been ineffective. This failure has led to the allocation of resources either to existing low-growth industries or to advanced, overly ambitious, comparative advantage–defying industries. This strategic failure has perpetuated economic stagnation
and unemployment and kept several countries in a low-income trap.
The inherent strategic flaw is that governments targeted industries that did not take into account comparative advantages, forcing firms into competitively untenable positions where they were compromised either by low product quality or by high factor prices. In the absence of market distortions these firms were non-viable in globally competitive markets, and globalization only magnified growing gaps in competitiveness. Exploiting the weaknesses of economic planning elsewhere, firms in the newly industrializing economies entered markets with lower barriers to trade and outperformed the beneficiaries of legacy industrial policies in less successful countries.
To support initial investments and ensure favoured firms’ continued operations, African governments “doubled down” on their bad bets by channelling more resources into non-viable firms and sectors and by adopting numerous protectionist measures such as subsidies and tariffs. This misallocation led ultimately to rent-seeking by beneficiary industries but did nothing to improve long-term development. A fatal knock-on effect of this strategy was the suppression of investment returns, prompting capital flight and inhibiting foreign direct investment in most industries, natural resources aside. Under these conditions the Lucas Paradox arose (capital-starved economies became net exporters of financial resources), reflecting low domestic returns to capital and lost confidence among investors, foreign and domestic (the latter, owners of wealth often derived from rents and rent-seeking).
2.3 Approaches to Mobilizing and Deploying Domestic Resources
Almost all developing countries began their transition to the market system in

20 CHAPTER TWO AFRICAN TRADE REPORT 2017
the 1980s, out of pressure to improve development performance that had lagged under economic planning. Most countries in Africa and Latin America followed the Washington Consensus but were caught in the lost decades of the 1980s and 1990s. By contrast, several economies in East Asia adopted a gradual approach to development that avoided an immediate and full-scale embrace of free markets. This strategy proved highly successful, with these countries achieving macroeconomic stability and sustaining dynamic growth. A comparison of these case types offers lessons for transition strategies.
Before the advent of the 20th century’s rapid and unprecedented industrial restructuring, growth in developing countries was constrained by non-viable firms in legacy sectors. Transition strategies recommended by development advisors and aid organizations encouraged African governments to immediately eliminate all distortions, precipitating sectoral collapse and leading to deindustrialization, unemployment and strains on social support efforts. This fallout was particularly challenging at a time when government budgets were constrained by falling revenues. Washington Consensus–based reform prescriptions also discouraged governments from facilitating firms’ entry into sectors consistent with comparative advantages. So capital returns stayed low and capital flight endured.
By contrast, successful transition economies illustrate how a pragmatic and gradual approach enabled a smoother industrial restructuring without the economic and social disruptions accompanying free market “shock therapy”. The dynamic transition economies of China, Vietnam, Mauritius and Cambodia adopted this approach using a dual-track strategy. First, governments continued to provide transitional support to non-viable firms in legacy sectors and removed distortions only when those firms became viable or their sectors contracted.
Second, governments facilitated private firms’ entry into sectors that were consistent with national comparative advantages latent before transition. This dual strategy ensured stability while stimulating dynamic growth. It was also favourable to domestic resource mobilization and foreign direct investment.
According to Lin and Monga (2010, p. 18), “Policymakers around the world, especially in developing countries, still face difficulty in identifying actionable specific policy levers that can help ignite and sustain the type of dynamic growth rates that are necessary to reduce poverty”. There are numerous cases of successful economic transformation that can serve as examples for aspiring countries, but few are as dramatic and instructive as China’s, especially for growth, trade performance and poverty reduction.1 Deng Xiaoping’s reforms and “open door policy”, while appearing to outsiders to be an embrace of neoliberal market reforms, in reality represented a nuanced approach to development that simultaneously supported legacy industries by retaining some market distortions while liberalizing factor markets and enabling private sector growth to pursue comparative advantage–following industries.
This gradual and hybrid strategy helped China avoid the negative economic and social impacts endured by countries that chose, or were coerced into, shock therapy liberalization. With stable and shock-free economic growth, China’s household consumption fell as a percentage of GDP, while fixed asset formation and net exports rose. Growing savings provided a financial asset base to support industrial upgrading. Although China must eventually address growing income inequality, unsustainable
1 In its transition to a fully developed economy,
China achieved sustained and rapid economic
growth while reducing its poverty rate from 85
percent in 1981 to 24 percent in 2004, lifting 600
million people out of poverty (World Bank 2010).
AFREXIMBANK AFRICAN TRADE REPORT 2017 21
pension systems and lingering distortions in finance, natural resources and services, the success of its dual-track model is evidence of its validity. According to Lin (2013, p. 265), “No country in human history has ever grown so fast for so long as China did in the past three decades”.
Comparative advantage–based industrial policies have mitigated the risks of the Lucas Paradox in developing economies, and the results provide insights for governments and development finance institutions. In designing transition strategies and performance, countries must first identify an optimal economic governance framework that turns latent comparative advantages into “quick-win activities” that can be scaled up in support of structural transformation. To achieve this goal, countries must
reinterpret legacy economic planning as an industrial policy that emphasizes a facilitating but non-interventionist state. This type of industrial policy casts government not as an arbiter of sectoral determinism and favouritism, but as a provider of infrastructure and coordination that help industries attract capital and grow endogenously around factor endowments and comparative advantages. While government tasks may vary across countries depending on development conditions and the needs of industries and firms, industrial policy must be applied tactically, given the limited resources and capacity of the public sector.
The opportunities for domestic resource mobilization are promising, but the challenges are equally formidable. A

22 CHAPTER TWO AFRICAN TRADE REPORT 2017
development approach that avoids the interventionist determinism of traditional structural economics on the one hand, while shunning the anti-government ideology of neoliberalism on the other, implies that governments are responsible for conditions that attract foreign direct investment in sectors aligned with comparative advantages.
A new generation of economic governance reflects this approach to balanced and pragmatic economic stewardship and regards governments as facilitators of growth, creators of markets, enforcers of institutional norms and providers of enabling infrastructure. Further, these tasks must occur within the context of aligning industrial structure with factor endowments. In soliciting investment amid an increasingly competitive and financially constrained aid environment, countries must consider stores of capital held domestically. Encouraging domestic investors to commit their money to domestic firms and industries partly involves effective “branding”: a commitment to good governance and prudent industrial policy should be as reassuring to domestic investors as it is to foreign investors.
Lin (2012, p. 5) states that “Economic development is a process of structural change with continuous technological innovations, industrial upgrading, and improvement in infrastructure and institutions”. To this end, modern economic development is a process of continuous growth identification and facilitation: technological innovation and industrial upgrading that requires consistency in capital flows. Under the right conditions developing countries can achieve middle- or even high-income status after several decades of dynamic growth, but only if they exploit comparative and latecomer advantages. Poor development performance in Africa is the result of inadequate ideas that have wrongly shaped government policies for economic transition. Indeed, policy credibility requires availability of funds
to propel the continent towards accelerated growth and structural transformation. The right ideas, in combination with a new regime of cooperation among developing countries, can help African countries transform natural endowments into productive assets and grow as dynamically as the world’s most successful economies.
In this context, and given declining external capital flows, mobilization of domestic resources has gained traction among African governments, policy makers and academics. As available data on foreign reserves suggests, the challenge has not been lack of resources but the ability to effectively harness existing financial resources. Foreign reserves held by African central banks on behalf of their countries grew rapidly over the last 20 years (Figure 2.1), fuelled by the commodity super-cycle and debt relief under the World Bank’s Heavily Indebted Poor Countries (HIPC) Initiative, which enabled countries to grow their reserves. External reserve holdings of African countries rose from US$42 billion in 1995 to US$550 billion in 2013 before declining because of the end of the commodity super-cycle. Despite this wealth of liquidity, Africa’s reserves are either largely domiciled offshore or invested in foreign securities, which consequently restricts their use in funding viable trade, project and developmental needs of the continent.
A number of African countries are now making concerted efforts to mobilize domestic resources in support of long-term investment and economic growth by improving tax collection, broadening the tax base, reducing capital flight and increasing financial resource mobilization. The African Capacity Building Foundation (ACBF) (2015) notes that African countries have sought to improve fiscal revenues through reforms to boost domestic resource mobilization. These reforms include measures to modernize revenue management administration, expand the tax base, combat illicit financial flows and leverage financial resources. Tax

AFREXIMBANK AFRICAN TRADE REPORT 2017 23
revenue performance in African countries shows a positive trend, with average tax revenue as a share of GDP rising from 22 percent in 1990 to 27 percent in 2000, and reforming and widening the tax net of the continent will help address loopholes in existing tax structures.
African sovereigns, multilateral financial institutions and, to a smaller extent, corporations are also increasingly tapping into domestic currency markets to finance large-scale infrastructure development projects or investments, drawing on excess liquidity in the domestic banking system coupled with low yields while mitigating currency risks. For instance, the government of Côte d’Ivoire has successfully mobilized funds from within the West African Economic and Monetary Union and manages a local currency bond portfolio of around US$4.6 billion. Ethiopia introduced a housing savings programme; introduced pension programmes for government, nongovernmental organizations and the private sector; and issued diaspora bonds to finance large projects such as the Grand Renaissance Dam (ACBF 2015). Egypt issued domestic bonds to leverage finance for the expansion of the Suez Canal, a main artery for global
trade and significant foreign exchange earner for the country.
Similarly, several African countries used domestic bond issuances to raise resources in support of investment projects. The African Development Bank’s African Financial Markets Initiative Bloomberg African Bond Index, which assesses and tracks the market value of Africa’s most liquid local currency sovereign bond issuances, had a market capitalization of US$160 billion at the end of 2016, up from US$146 billion at the end of 2013, as Nigeria, South Africa, Ghana and Namibia reverted to domestic resources to champion national development efforts. The African Export-Import Bank, through its Central Bank Deposit Programme, is also supporting mobilization of domestic resources that can be deployed to galvanize intra-Africa trade and boost the continent’s structural transformation.
2.4 Policy Lessons for Africa
The efforts by African countries to mobilise and deploy domestic resources is commendable and should be done in the context of a robust industrial strategy. An overview of the history of economic
Figure 2.1: Africa’s reserve position, 1995–2016 (US$ billions)
Source: World Bank World Development Indicators Database, Afreximbank Annual Reports (2010-2016)
500 -
600 -
0 -
100 -
200 -
200 -
300 -
400 -
1995
20
03
201
1
199
9
20
07
201
5
1997
20
05
201
3
20
01
20
09
199
6
20
04
201
2
20
00
20
08
201
6
199
8
20
06
201
4
20
02
201
0

24 CHAPTER TWO AFRICAN TRADE REPORT 2017
development suggests that a winning strategy is one where developing countries look at what they can do well, based on what they have, and then create the conditions to scale up what they can do well (Lin 2012). The case of successful developing economies is used to provide the following five policy lessons for African countries.
First, countries must base their industrial promotion strategies on their current stage of development. This requires a diligent and honest accounting of factor endowments, a robust strategy to facilitate their contribution to the development of targeted growth industries and a robust understanding of how the country’s tradable goods industries can become globally competitive or how to enhance the global competitiveness of that country’s growth industries. Further, countries must embrace rather than deny their backward status in technological innovation, upgrading existing technologies and committing resources to acquiring and integrating new technologies for upgrading efforts. This process must be repeated for each development stage when it is reached, as factor endowment structures will evolve and new opportunities for comparative advantage will emerge.
Second, efficient and reliable institutions are essential for loosening production
bottlenecks that discourage investment, particularly for hard infrastructure, logistics, information sharing, financial capital, bureaucratic red tape, legal systems, workforce development and all other transaction costs. This requires stability and consistency across multiple policy arenas and, depending on a country’s bureaucratic capacities, may also require deep administrative reforms and restructuring. Two examples are special economic zones and financial institutions.
For countries struggling to address these constraints through comprehensive national policy and administrative reforms, special economic zones provide a small-scale policy laboratory for testing experimental initiatives in a controlled environment. Special economic zones also facilitate the development of highly specialized infrastructure and generate economies of scale (multiple users sharing the same facilities) and economies of scope (facilities for one purpose can be used for other purposes). This approach, which includes industrial parks, export processing zones and other forms of concentrated economic activity, has been used to productive effect in China and Southeast Asia. For example: Chinese government’s 1979 special economic zone initiatives in Shenzhen, which precipitated one of history’s most dynamic

AFREXIMBANK AFRICAN TRADE REPORT 2017 25
urban growth stories, transforming a fishing village of fewer than 100,000 people into a modern metropolis of 19 million that serves as an anchor for the Pearl River Delta, home to 45 million. The region’s transformative economic progress is evidence in part of the effectiveness of the special economic zone approach, and lessons from Shenzhen ultimately informed similar initiatives across China.
Further reforms should target financial institutions, which should be tailored to meet the needs of labour-intensive firms in the emerging industries of developing countries (Lin et al. 2013). Many developing countries have adopted, by choice or coercion, the types of domestic financial systems that serve the economic structures and interests of developed countries. Developing countries need smaller scale financial institutions that cater to the types of firms, often at the household level, that supply factors of production to larger firms. As these countries progress through development stages, financial institutions can be redesigned to serve the increasingly sophisticated needs of larger domestic producers.
Third, an efficient market is an important institutional mechanism for signalling the relative prices of production factors—not only to global investors but also to firms in growth industries that might relocate from developed countries. These markets help the private sector identify a country’s cost-based comparative advantages by reflecting the scarcity of production factors within the country’s endowment mix, thereby mobilizing capital towards productive uses. The collective strategic decisions of profit-maximizing entrepreneurs, who are driven to substitute low-cost factors of production for high-cost factors, are generated naturally and without market incentives in an industrial structure that efficiently aligns itself with a country’s factor endowments. Here, markets play an essential role in facilitating the endogenous
growth of comparative advantage–following industries, free from the risks and distortions of direct government intervention.
Fourth, countries must work to increase capital abundance in their factor endowment structures, enabling the intermediate upgrading of existing industries and the longer term structural transformation away from labour-intensive industries and towards capital-intensive industries. From a policy perspective rapid capitalization is possible through budgetary and fiscal prudence, including revenue collection, and through industrial profitability, including support of industries that are aligned with their comparative advantages. As a country’s industries achieve efficiency, profitability and global competitiveness, theory holds that capital inflows will accelerate through international financial markets. Additionally, investments will become more attractive to domestic entrepreneurs.
Finally, governments must monitor trends in shifting factor endowments, identifying and supporting firms in growth industries and in industries with latent comparative advantages. One important lesson is that “government should know which new industries are consistent with the country’s changing endowment structure, and which infrastructure and institutions require improvements to enable those new industries to thrive” (Lin 2012, p. 6). With this industrial monitoring also comes the need for governments to adopt a counter-cyclical policy in economic shocks; for example, in periods of recession, governments should invest in infrastructure to take advantage of low costs of capital and to stimulate the macroeconomic environment through investment and employment. Government investments in hard and soft infrastructure, along with institutional improvement, facilitate the type of dynamic structural change that keeps national development on pace.

3Chapter Three

AFREXIMBANK AFRICAN TRADE REPORT 2017 27
Economic Environment
3.1 Output and Price Developments
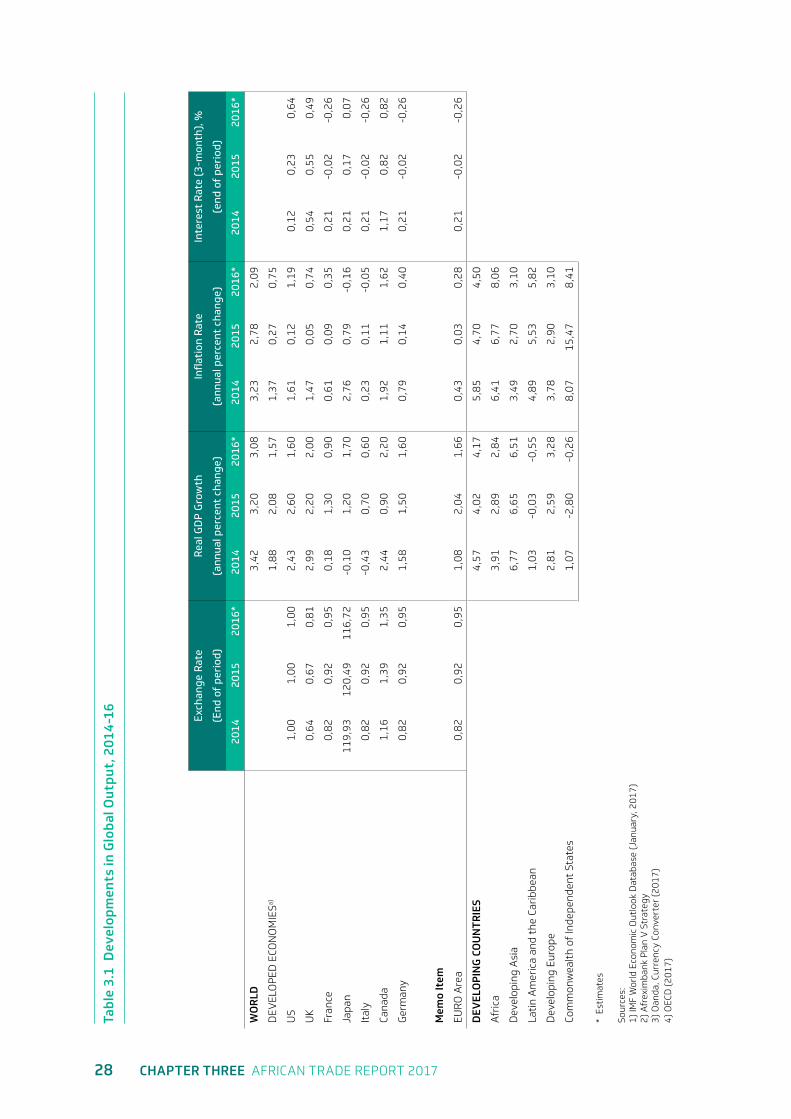
The Global and African economic environment remained challenging during 2015-2016. The sluggish recovery of developed economies and the slowdown in developing countries, mainly China, were key factors dragging down global growth. This chapter reports on the global and African economic environment with a focus on output and price developments and financial market developments and financing conditions.
3.1.1 Global
Global economic activity remained subdued in 2015–16 after a marginal pick-up in 2014. From 3.4 percent in 2014, growth in global
output declined to 3.2 percent in 2015 and further to 3.1 percent in 2016 (Table 3.1 and Figure 3.1). The outturn in 2015 was driven by growth decelerations in developing economies, especially those in the Commonwealth of Independent States, Latin America and the Caribbean, and Developing Asia, whose rate of decline outweighed the modest recovery made by Group of Seven countries, especially Canada, Germany and Japan. However, hampered by unfinished post-crisis adjustments, especially within the Eurozone, performance in 2016 largely mirrored the sluggish recovery in developed economies after the 2008/09 global financial crisis. It was also affected by the adverse impact of growth decelerations in developing market economies, especially in a context of sustained declines in commodity terms of trade.
Figure 3.1. Global Output and Inflation (Percent)
4.5 - 9 -
2.5 - 5 -
3.5 - 7 -
1.5 - 3 -
0.5 - 1 -
4 - 8 -
2 - 4 -
3 - 6 -
1 - 2 -
0 - 0 -Developed Economies
Developed Economies
World WorldAfrica AfricaDeveloping Countries
Developing Countries
Real GDP (%) Inflation (%)
2015 2016
28 CHAPTER THREE AFRICAN TRADE REPORT 2017
Tabl
e 3.
1 D
evel
opm
ents
in G
loba
l Out
put,
201
4-16 Ex
chan
ge R
ate
Real
GD
P G
row
thInflationRate
Inte
rest
Rat
e (3
-mon
th),
%
(End
of
peri
od)
(ann
ual p
erce
nt c
hang
e)(a
nnua
l per
cent
cha
nge)
(end
of
peri
od)
2014
2015
2016
*20
1420
1520
16*
2014
2015
2016
*20
1420
1520
16*
WO
RLD
3,42
3,20
3,08
3,23
2,78
2,09
DEV
ELO
PED
ECO
NO
MIE
Sa)1,
882,
081,
571,
370,
270,
75
US
1,0
0 1
,00
1,0
0 2,
432,
601,
601,
610,
121,
190,
120,
230,
64
UK
0,6
4 0
,67
0,8
1 2,
992,
202,
001,
470,
050,
740,
540,
550,
49
Fran
ce 0
,82
0,9
2 0
,95
0,18
1,30
0,90
0,61
0,09
0,35
0,21
-0,0
2-0
,26
Japa
n 1
19,9
3 1
20,4
9 1
16,7
2 -0
,10
1,20
1,70
2,76
0,79
-0,1
60,
210,
170,
07
Ital
y 0
,82
0,9
2 0
,95
-0,4
30,
700,
600,
230,
11-0
,05
0,21
-0,0
2-0
,26
Cana
da 1
,16
1,3
9 1
,35
2,44
0,90
2,20
1,92
1,11
1,62
1,17
0,82
0,82
Ger
man
y 0
,82
0,9
2 0
,95
1,58
1,50
1,60
0,79
0,14
0,40
0,21
-0,0
2-0
,26
Mem
o It
em
EUR
O A
rea
0,8
2 0
,92
0,9
5 1,
082,
041,
660,
430,
030,
280,
21-0
,02
-0,2
6
DEV
ELO
PIN
G C
OU
NTR
IES
4,57
4,02
4,1
7 5
,85
4,7
0 4
,50
Afr
ica
3,91
2,89
2,84
6,41
6,77
8,06
Dev
elop
ing
Asi
a6,
776,
656,
513,
492,
703,
10
Lati
n A
mer
ica
and
the
Cari
bbea
n1,
03-0
,03
-0,5
54,
895,
535,
82
Dev
elop
ing
Euro
pe
2,81
2,59
3,28
3,78
2,90
3,10
Com
mon
wea
lth
of In
depe
nden
t St
ates
1,
07-2
,80
-0,2
68,
0715
,47
8,41
* E
stim
ates
Sour
ces:
1)
IMF
Wor
ld E
cono
mic
Out
look
Dat
abas
e (J
anua
ry, 2
017)
2)
Afr
exim
bank
Pla
n V
Str
ateg
y 3)
Oan
da, C
urre
ncy
Conv
erte
r (2
017)
4) O
ECD
(20
17)
AFREXIMBANK AFRICAN TRADE REPORT 2017 29
Global activity in 2015–16 was also influenced by a gradual slowdown and rebalancing of economic activity in China—the lead driver of global trade and growth—away from investment and manufacturing towards domestic consumption and services, which continued to adversely impact global demand and commodity prices. In addition, lower commodity prices, persistent volatility in financial markets, subdued investment, less accommodating financing conditions, gradual tightening in US monetary policy and uncertainty over creeping protectionism and greater use of anti-trade rhetoric also dampened global activity.
After a modest recovery in 2015, when output in developed economies grew 2.1 percent—up from 1.9 percent in 2014—output growth decelerated to 1.6 percent in 2016, due largely to deflationary threats and rising uncertainty. Growth in the United States, which strengthened from 2.4 percent in 2014 to 2.6 percent in 2015, decelerated to 1.6 percent in 2016. Output in the United Kingdom followed a similar trend of slowing for two consecutive years, with growth of 2.2 percent in 2015 and 2 percent in 2016, down from 2.9 percent in 2014. While weakening growth in the United States was attributed partly to global uncertainty, low investment (especially in energy) and low labour productivity (due to a deceleration in the capital-intensive manufacturing and energy-producing industries), economic activity in the United Kingdom, especially in 2016, was hit by uncertainty over the Brexit vote and the future trade arrangements between the United Kingdom and the European Union in the post-Brexit era.
The Japanese economy continued on its recovery path with sustained growth expansion over the past two years, after contraction in 2014. The Canadian economy recovered from a blip in 2015, when growth was 0.9 percent, posting growth of 2.2 percent in 2016 on the back of increased household consumption and a strong
financial services sector, but expansion remained below the 2.4 percent in 2014.
Recovery in the Eurozone remained lacklustre. After a sharp rise, from 1.1 percent in 2014 to 2 percent in 2015, real GDP growth decelerated to 1.7 percent in 2016. Output expansion in the bloc was supported by firm domestic demand and some growth in investment, though recovery remained slow, with investment on the downside in many economies in the zone. Although financial markets remained resilient, the legacy of the crisis, including inadequate demand, high debt and elevated unemployment, continued to pose challenges to robust growth. Germany, the bloc’s largest economy (accounting for about 30 percent of its GDP), showed growth of 1.8 percent in 2016, a slight recovery from the 1.5 percent in 2015 and 1.6 percent in 2014. The improvement derived from solid domestic demand driven by increased consumption and from strong export performance.
Economic activity across developing countries picked up slightly, to 4.2 percent in 2016, after a decline to 4 percent in 2015 from 4.6 percent in 2014. While 2015’s slow growth was due primarily to the slump in commodity prices, deceleration in developing economies (especially China), heightened uncertainty and global financial market volatility, the marginal improvement in 2016 was driven by the gradual pick-up in commodity prices in the second half of the year and by countries’ policy responses to mitigate the impact of the lingering effects of the global economic crisis. Growth in developing economies in 2015–16 was driven largely by Developing Asia, despite the sustained growth deceleration in China, with Africa stagnating at about 2.9 percent (see Table 3.1 and Figure 3.1).
The Middle East showed mixed results in 2015–16. Growth contracted 0.5 percent in 2015, from 2.5 percent in 2014, owing to plummeting oil prices, but improved

30 CHAPTER THREE AFRICAN TRADE REPORT 2017
markedly in 2016, to 2.5 percent, thanks to expanded output in Gulf Cooperation Council countries and a modest improvement in oil prices, increased government spending and solid domestic investment. However, activity in the region’s oil-importing countries remained insipid on the back of deep-rooted inefficiencies in economic structures, conflicts, persistent political instability and geopolitical tensions in several countries.
Output in Latin America and the Caribbean contracted in both 2015 and 2016. From anaemic growth of 1 percent in 2014, output contracted 0.03 percent in 2015 and 0.6 percent in 2016. Exports fell short of expectations in both years, and the terms of trade deteriorated in some countries. Domestic factors were also important as Brazil, the region’s largest economy, slipped into recession during the period.
After a moderate pick-up in 2014, growth in Central and Eastern Europe blipped in 2015 but recovered to 3.3 percent in 2016. While the deceleration in 2015 was due to weaknesses in some countries, especially amid political tensions and timid private investment, the improvement in 2016 was stimulated by strong net exports and accelerated activity reflecting a pick-up in investment, falling unemployment and higher public spending in some countries, especially Hungary. After posting growth of 1.1 percent in 2014, the Commonwealth of Independent States saw contractions in 2015–16. A drop in investment in Russia and Ukraine, because of geopolitical tensions, and lower oil prices weighed on the region’s performance.
Global inflationary pressures continued to ease in 2015–16, owing to declining headline inflation on falling commodity prices. Core inflation remained relatively stable but was generally below most central bank inflation objectives. Global inflation eased from 3.2 percent in 2014 to 2.8 percent in 2015 and dipped further, to 2.1 percent, in 2016 (see Table 3.1 and Figure 3.1).
Inflation in developed economies slowed to 0.3 percent in 2015, from 1.4 percent in 2014, owing to weaker commodity prices, declining global demand and general decelerations in economic activity globally. However, the gradual pick-up in commodity prices in 2016 contributed to renewed inflation, which inched up to 0.8 percent.
Inflation in the United States eased in 2015, from 1.6 percent in 2014 to 0.1 percent, but inched higher in 2016, to 1.2 percent. The US Federal Reserve raised interest rates for the first time in almost a decade in the last quarter of 2015. The movement in the general price level in 2015 was anchored on a tight monetary policy stance of the Federal Reserve, while increased inflation in 2016 was driven by market reaction to the incoming Trump Administration’s promise of expansionary policies.
Inflation in the United Kingdom slowed from 1.5 percent in 2014 to 0.1 percent in 2015, owing to fiscal tightening and to lower food, energy and fuel prices. However, the Bank of England’s loose monetary policy, intended to boost growth after the Brexit referendum in June 2016, put upward pressure on prices, with inflation rising to 1.2 percent that year, driven largely by prices of key non-food items such as fuel and clothing.
After years of deflation, the inflationary gains achieved in Japan during 2014 appeared to have been mitigated in 2015–16, as the change in prices levels declined from 2.8 percent in 2014 to 0.7 percent in 2015 to 0.2 percent in 2016, influenced largely by global trends.
In the Eurozone, inflation declined from 2014 to 2015 on the back of fragile domestic demand and lower energy, oil and food prices, though average price increases climbed to 0.3 percent in 2016, from 0.03 percent in 2015, partly because of quantitative easing by the European Central Bank, but remained below the 0.4 percent in 2014.

AFREXIMBANK AFRICAN TRADE REPORT 2017 31
For developing countries generally, inflationary pressures eased with the end of commodity super-cycle. Inflation declined from 5.9 percent in 2014 to 4.7 percent in 2015 and to 4.5 percent in 2016.
In contrast to global and regional trends, Africa recorded a modest increase in inflation, from 6.4 percent in 2014 to 6.8 percent in 2015 to 8.1 percent in 2016. Currency depreciation in oil-exporting countries raised the price of imported goods and exerted upward pressure on prices. Similarly, the CFA franc, which is the currency of most oil-exporters in the Central African Economic and Monetary Community (including Cameroon, Chad, Republic of Congo, Equatorial Guinea and Gabon) and which is pegged to the euro, depreciated against the US dollar in line with the euro, stoking inflationary pressures. But the global oil price slump provided support to real incomes in most oil-importing countries and contributed to lowering inflationary pressures.
3.1.2 Africa
Growth in Africa’s aggregate output slowed from 3.9 percent in 2014 to 2.9 percent in 2015 to 2.8 percent in 2016 (see Table 3.1 and Figure 3.1). After 2014, falling global demand and plunging prices for commodities created challenges for the continent that required fiscal adjustments. Matters were exacerbated by difficult domestic conditions such as heightened terrorist activities and the prolonged effects of the Ebola outbreak in West Africa.
The overall deceleration in 2016 stemmed from macroeconomic management challenges relating to the end of the commodity super-cycle, the continued slowdown in China, pockets of socio-political instability in some parts of North and West Africa, sluggish growth in the Eurozone (still one of Africa’s largest trade partners), and a weak pickup in economic activity in other developed economies. Needless to
say, growth in output varied across the continent.
In 2015–16 oil-exporting countries in Africa saw growth decelerate, from 2.8 percent in 2014 to 2.4 percent in 2015 to 0.3 percent 2016 (Figure 3.2 and Table 3.2). The trend reflected continued weakness in oil prices owing to subdued demand, driven largely by the slowing Chinese economy, and a global supply glut, led by high production in members of the Organization of the Petroleum Exporting Countries and by increased oil production in the United States and Canada. These patterns exerted pressure on export receipts of African oil exporters, depressing their reserves and leading to sharp fiscal adjustments in some countries, particularly the largest oil producers, Nigeria and Angola. The difficulties of this group were compounded by lingering socio-political unrest in parts of North Africa, particularly Libya, Sudan and South Sudan, which disrupted oil production and overall economic activity.
Although GDP growth in oil-importing countries declined marginally in 2015, to 3.2 percent from 3.4 percent in 2014, on
Figure 3.2. Average Real GDP Growth of African Net Oil Exporters and Importers, 2015-16 (Percent)
2015 2016
Real GDP (%)4.5 -
2.5 -
3.5 -
1.5 -
0.5 -
4 -
2 -
3 -
1 -
0 -
Oil Exporters Oil Importers

32 CHAPTER THREE AFRICAN TRADE REPORT 2017
Table 3.2 Africa: Real GDP Growth, 2014 - 16 (annual percent change)
Country Name 2014* 2015* 2016**Algeria 3,80 3,90 3,57Angola 4,80 3,01 0,00Benin 6,54 4,96 4,60Botswana 3,21 -0,26 3,11Burkina Faso 4,01 4,03 5,20Burundi 4,49 -3,96 -0,51Cameroon 5,93 5,80 4,80Cape Verde 1,87 1,45 3,63Central African Republic 1,04 4,80 5,19Chad 6,89 1,77 -1,11Comoros 1,95 1,03 2,16Congo, Dem. Rep. of 7,92 6,92 3,94Congo, Rep. of 9,47 2,32 1,75Côte d’Ivoire 6,85 8,54 7,98Djibouti 6,00 6,50 6,50Egypt 2,24 4,20 3,83Equatorial Guinea -0,50 -7,44 -9,87Eritrea 4,99 4,78 3,67Ethiopia 10,32 10,20 6,49Gabon 4,32 4,01 3,18Gambia -0,22 4,38 2,31Ghana 3,99 3,88 3,34Guinea 1,11 0,14 3,85Guinea-Bissau 2,54 4,80 4,80Kenya 5,33 5,65 5,99Lesotho 3,45 2,83 2,39Liberia 0,69 0,02 1,96Libya -24,03 -6,38 -3,32Madagascar 3,32 3,12 4,14Malawi 5,70 2,95 2,70Mali 7,04 5,96 5,31Mauritania 5,35 1,24 3,22Mauritius 3,62 3,50 3,52Morocco 2,55 4,51 1,85Mozambique 7,44 6,61 4,50Namibia 6,46 5,30 4,24Niger 7,05 3,55 5,23Nigeria 6,31 2,65 -1,75Rwanda 6,96 6,91 6,00Sao Tome and Principe 4,50 4,00 4,00Senegal 4,34 6,49 6,64Seychelles 6,21 5,74 4,88Sierra Leone 4,56 -21,08 4,29Somalia n/a n/a n/aSouth Africa 1,63 1,27 0,12South Sudan 2,92 -0,17 -13,12Sudan 1,61 4,88 3,05Swaziland 2,45 1,66 0,47Tanzania 6,97 6,96 7,17Togo 5,40 5,40 5,30Tunisia 2,26 0,80 1,50Uganda 4,93 4,81 4,94Zambia 5,03 3,00 3,01Zimbabwe 3,85 1,06 -0,29
* Revised** Estimatesn/a not availableSources: IMF (2016) World Economic Outlook Database (October)

AFREXIMBANK AFRICAN TRADE REPORT 2017 33
the rippling effect of the general economic downtown, the net benefit accruing from the commodity price shock to this group saw their output increase 3.9 percent in 2016. The pick-up was driven largely by a dynamic services sector led by telecommunications, banking, a growing construction industry and higher consumer spending, as well as infrastructure investment.
Regional variations
Except for North Africa, which experienced a contraction, other regions saw growth decelerate. The weakest performer was Central Africa. On inflation, North Africa was by far the poorest performer, as inflation there shot up, while in Eastern and Central Africa it abated.
North Africa saw GDP grow 2.2 percent in 2014 and 1.7 percent in 2015 but contract 0.4 percent in 2016 (Figure 3.3 and Table 3.2). For most countries in the region the deceleration and subsequent contraction in the face of rising macroeconomic management challenges was driven by loss of revenue from declining commodity prices, exacerbated by socio-political instability in Libya. The tourism sector in Egypt and Tunisia was hit by security concerns.
Inflationary pressures in North Africa increased in 2015–16, with inflation surging to 80.2 percent in 2016, from 4.3 percent in 2014 and 15.1 percent in 2015 (Figure 3.4 and Table 3.3). Currency depreciations pushed up import costs, particularly in Algeria and Egypt. Reductions in subsidies and rising domestic demand also raised prices, particularly in Algeria, Egypt and Morocco.
Figure 3.3. Africa: Output by Region, 2015–16 (Percent)
Figure 3.4. Africa: Inflation by Region, 2015–16 (Percent)
Although economies in Southern Africa witnessed a moderate increase in output growth in 2015, they lost steam in 2016. GDP growth was up from 2.4 percent in 2014, to 2.7 percent in 2015, but decelerated to 2 percent in 2016 due to challenges facing the South African economy, the largest in the region. That country’s economy remained weak, growing only 0.1 percent in 2016, down sharply from 1.3 percent in 2015. The economy was choked by recurrent power shortages and their adverse effects on manufacturing, coupled with dwindling global demand for the country’s major natural resources. The poor performance of other economies, notably Lesotho, Swaziland and Zimbabwe, caused by weaknesses in commodity markets and a major drought, also undermined growth.
North WestSouth East Central
7 -
3 -
5 -
1 -
-1 -
6 -
2 -
4 -
0 -
2015 2016
North WestSouth East Central
90 -
50 -
70 -
30 -
10 -
80 -
40 -
20 -
60 -
0 -
2015 2016
Country Name 2014* 2015* 2016**Algeria 3,80 3,90 3,57Angola 4,80 3,01 0,00Benin 6,54 4,96 4,60Botswana 3,21 -0,26 3,11Burkina Faso 4,01 4,03 5,20Burundi 4,49 -3,96 -0,51Cameroon 5,93 5,80 4,80Cape Verde 1,87 1,45 3,63Central African Republic 1,04 4,80 5,19Chad 6,89 1,77 -1,11Comoros 1,95 1,03 2,16Congo, Dem. Rep. of 7,92 6,92 3,94Congo, Rep. of 9,47 2,32 1,75Côte d’Ivoire 6,85 8,54 7,98Djibouti 6,00 6,50 6,50Egypt 2,24 4,20 3,83Equatorial Guinea -0,50 -7,44 -9,87Eritrea 4,99 4,78 3,67Ethiopia 10,32 10,20 6,49Gabon 4,32 4,01 3,18Gambia -0,22 4,38 2,31Ghana 3,99 3,88 3,34Guinea 1,11 0,14 3,85Guinea-Bissau 2,54 4,80 4,80Kenya 5,33 5,65 5,99Lesotho 3,45 2,83 2,39Liberia 0,69 0,02 1,96Libya -24,03 -6,38 -3,32Madagascar 3,32 3,12 4,14Malawi 5,70 2,95 2,70Mali 7,04 5,96 5,31Mauritania 5,35 1,24 3,22Mauritius 3,62 3,50 3,52Morocco 2,55 4,51 1,85Mozambique 7,44 6,61 4,50Namibia 6,46 5,30 4,24Niger 7,05 3,55 5,23Nigeria 6,31 2,65 -1,75Rwanda 6,96 6,91 6,00Sao Tome and Principe 4,50 4,00 4,00Senegal 4,34 6,49 6,64Seychelles 6,21 5,74 4,88Sierra Leone 4,56 -21,08 4,29Somalia n/a n/a n/aSouth Africa 1,63 1,27 0,12South Sudan 2,92 -0,17 -13,12Sudan 1,61 4,88 3,05Swaziland 2,45 1,66 0,47Tanzania 6,97 6,96 7,17Togo 5,40 5,40 5,30Tunisia 2,26 0,80 1,50Uganda 4,93 4,81 4,94Zambia 5,03 3,00 3,01Zimbabwe 3,85 1,06 -0,29
* Revised** Estimatesn/a not availableSources: IMF (2016) World Economic Outlook Database (October)

34 CHAPTER THREE AFRICAN TRADE REPORT 2017
Table 3.3 Africa: Inflation, 2014- 16 (annual percent change)
Africa 2014* 2015* 2016**Algeria 2,92 4,78 5,90Angola 7,30 10,29 33,68Benin -1,08 0,27 0,60Botswana 4,40 3,04 3,20Burkina Faso -0,26 0,91 1,64Burundi 4,42 5,55 6,34Cameroon 1,85 2,75 2,20Cape Verde -0,24 0,13 0,09Central African Republic 11,60 4,50 4,01Chad 1,68 3,68 0,00Comoros 1,35 2,00 2,20Congo, Dem. Rep. of 0,45 1,24 1,00Congo, Rep. of 1,24 0,96 1,67Côte d’Ivoire 0,91 2,01 4,04Djibouti 2,94 2,10 3,00Egypt 10,10 10,99 10,20Equatorial Guinea 4,30 1,70 1,45Eritrea 10,04 9,00 9,00Ethiopia 7,40 10,12 7,71Gabon 4,51 0,10 2,50Gambia 6,25 6,81 8,33Ghana 15,49 17,15 17,02Guinea 9,71 8,15 8,18Guinea-Bissau -1,03 1,48 2,64Kenya 6,88 6,58 6,15Lesotho 4,02 5,32 8,60Liberia 9,86 7,74 8,57Libya 2,80 14,10 14,20Madagascar 6,08 7,40 6,74Malawi 23,78 21,86 19,78Mali 0,89 1,44 0,97Mauritania 3,77 0,49 1,31Mauritius 3,22 1,29 1,45Morocco 0,44 1,55 1,30Mozambique 2,29 2,39 16,70Namibia 5,35 3,40 6,60Niger -0,94 1,01 1,60Nigeria 8,05 9,01 15,38Rwanda 1,78 2,51 5,33Sao Tome and Principe 6,99 5,26 3,89Senegal -1,08 0,13 1,01Seychelles 1,39 4,04 -0,80Sierra Leone 8,29 8,97 9,73Somalia n/a n/a n/aSouth Africa 6,07 4,59 6,40South Sudan 1,66 52,81 476,02Sudan 36,91 16,91 13,49Swaziland 5,68 4,96 6,97Tanzania 6,13 5,59 5,22Togo 0,19 1,80 2,10Tunisia 4,92 4,85 3,75Uganda 3,13 5,52 5,51Zambia 7,81 10,11 19,10Zimbabwe -0,21 -2,41 -1,58
* Revised** Estimatesn/a not availableSources: IMF (2016) World Economic Outlook Database (October)

AFREXIMBANK AFRICAN TRADE REPORT 2017 35
Southern Africa’s inflation increased to 12 percent in 2016, having receded to 6.4 percent in 2015 from 6.6 percent in 2014. That marginal reduction was on account of low oil prices and falling global demand, while the increase in 2016 reflected regional variations in consumer prices. For example, Zimbabwe faced deflationary pressures, but other countries, notably Angola and Mozambique, witnessed double-digit rates in 2015–16. The rise in inflation in the region in 2016 was driven by huge price increases in Angola and Mozambique, which had inflation of 33.7 percent and 16.7 percent, driven by food, non-alcoholic beverages, and imported clothing and footwear.
West African economies witnessed a second consecutive year of decline in output growth, from 5.4 percent in 2014 to 5.3 percent in 2015 to 4.1 percent in 2016. The declining economic fortunes of the region were anchored on continued low oil prices and reduced oil export revenues in Nigeria, the region’s largest economy,
which experienced a sharp contraction, with knock-on effects on other countries. Foreign exchange reserve constraints and a weakening naira demanded drastic fiscal adjustments that dented the country’s growth. Growth also decelerated in other major economies: from 3.9 percent in 2015 to 3.3 percent in 2016 in Ghana, largely on account of the commodity price slump and rising macroeconomic management challenges. Still, West Africa’s growth remained fairly robust on the back of strong activity in Côte d’Ivoire and Senegal, where socio-political stability, improved investor confidence and large-scale infrastructure projects were undertaken, including in roads, ports, airports, telecommunications and construction.
Following the easing from 5.6 percent in 2014 to 4.2 percent in 2015, the average rate of inflation in West Africa increased to 5.2 percent in 2016. Price developments in 2015 reflected low commodity prices, especially fuel prices, which reduced energy

36 CHAPTER THREE AFRICAN TRADE REPORT 2017
costs across all sectors. In the West African Economic and Monetary Union the pegging of the CFA franc to the euro limited inflation in 2016 to the increase in price levels caused by a gradual pickup in commodity prices, improved economic activity, heightened uncertainty and financial market volatility.
After posting the strongest growth of all regions in 2015, Eastern Africa remained relatively stable in 2016. Growth decelerated from 6.1 percent in 2014 to 5.8 percent in 2015 to 5.3 percent in 2016, but the region remained the continent’s strongest performer. While real GDP growth has been driven partly by robust public and private investment in transport infrastructure, buoyant household consumption and continued implementation of programmes and policies to deepen economic integration within the East African Community,1 the continued expansion of the region’s growth was also buttressed by strong activity in Kenya—the region’s largest economy—on the back of a vibrant services sector driven by banking, telecommunications and retail. In Tanzania growth was supported by steep investment and continued government efforts to expand manufacturing. In Uganda output was influenced by strong private consumption, high government spending and a healthy financial services industry.
Inflation in Eastern Africa eased to 4.9 percent in 2016 after inching up to 5.4 percent in 2015 from 5.3 percent in 2014. Inflationary pressures reflected booming economic activity in the region, fuelled by declining energy prices, massive investments in infrastructure and industry, and a stable macroeconomic environment. More recently, the deceleration of inflationary pressures has been due partly to Kenya, where inflation dropped from 6.6 percent in 2015 to 6.2 percent in 2016 as the country recovered from previously high inflationary pressures caused by high food prices due
1 Burundi, Kenya, Rwanda, Tanzania and Uganda.
to the El Niño weather phenomenon that brought heavy rains.
Central Africa persisted in its poor economic performance in 2015–16, with growth slowing from 3.8 percent in 2014 to 2 percent in 2015 to 1.3 percent in 2016. The sustained deterioration in commodity terms of trade, especially in a region where most countries are oil exporters, had drastic effects on output in Equatorial Guinea and Republic of Congo, which dragged the region’s growth downwards. Socio-political difficulties in Central African Republic and recurrent terrorist activities in northern Cameroon, coupled with frequent clashes with rebels in the Goma, Katanga and Kivu regions of Democratic Republic of Congo, also considerably dampened economic activities in the region.
Inflation in Central Africa dropped for the second consecutive year in 2016, from 4.1 percent in 2014 to 2.9 percent in 2015 to 2.6 percent in 2016, reflecting weak economic activity and falling oil prices, and the peg of the CFA franc to the euro.
3.2 International Financial Markets and Financing Conditions
Global financial markets experienced turbulence and volatility in 2015–16. In 2015 market sentiment was driven by continued global uncertainties and sluggish growth in developed economies; by increasing macroeconomic management challenges in developing economies; by divergent monetary policies between the United States and other major central banks, leading to volatility in capital markets; by the slowdown in growth and uncertainties over the rebalancing of the Chinese economy; and by the global geopolitical environment. The Brexit vote and the associated economic and financial risks heightened uncertainty and market volatility in 2016. Additionally, the election of Donald Trump as US president ushered in a period of policy uncertainty

AFREXIMBANK AFRICAN TRADE REPORT 2017 37
but raised expectations of an expansionary fiscal policy, which boosted asset prices and fuelled a rally in equity prices. The slowdown in China and the cyclical downtrend in commodity prices moderated. Financial markets improved from 2015, generally showing some resilience and adjusting to risks surrounding potential spill-over effects.
Monetary policy remained divergent, with the US Federal Reserve committing to a gradual tightening of interest rates. It raised the Federal Funds rate in December 2015, from the zero lower bound, and in December 2016. Monetary easing in the Eurozone and Japan proceeded as envisaged, with their central banks keeping interest rates stable and within the zero lower bound in an attempt to stimulate growth. The US Federal Reserve’s rate hikes, as well as episodes
of volatility, affected global financial markets through tighter external financial flows, declining capital flows and currency depreciations. Developing economies, many of which faced structural imbalances, slower growth and lower commodity prices, were the most affected by tightening global liquidity and financing conditions in 2016.
Central bank policy in most developed economies remained accommodative, with interest rates falling as monetary authorities attempted to stimulate growth. In the Eurozone real short-term interest rates declined from 0.21 percent in 2014 to –0.02 percent in 2015 to –0.26 percent in 2016. Real short-term rates in Japan slipped from 0.21 percent in 2014 to 0.17 percent in 2015 to 0.07 percent in 2016. The move to increase the policy rate by the US Federal
38 CHAPTER THREE AFRICAN TRADE REPORT 2017
Reserve led the real short-term interest rate up from 0.12 percent in 2014 to 0.23 percent in 2015 to 0.64 percent in 2016. In the United Kingdom the rate stayed stable at 0.54 percent in 2014 and 0.55 percent in 2015 before declining to 0.49 percent in 2016. Overall, term premiums for sovereign bonds remained low in most developed economies and were particularly low in Japan and Germany in 2015–16.
In response to anticipated monetary tightening in the United States and to stimulus by Japanese and European central banks and in the face of deflation and growth deceleration, China stepped up monetary easing in 2015–16 with interest rate cuts in the one-year benchmark lending rate. The move was supported by a reduction in the reserve requirement ratio
for all banks and an additional reduction for banks that lend to agricultural firms and small companies.
The continued easing of monetary policy in Europe, Japan and China; the anticipated and subsequent rate hikes by the US Federal Reserve; and low commodity prices (particularly for oil) contributed to volatility in equity markets in 2016. US Treasury rates stayed low for most of 2016 but spiked in the second half of the year, with increased prospects of tightened monetary policy. In the UK bond market competing investor demand kept credit spreads low at the start of 2016, a trend reinforced after the Bank of England’s accelerated bond purchase programme in the second half. Financing conditions in China remained accommodative in a context of growth deceleration.

AFREXIMBANK AFRICAN TRADE REPORT 2017 39
According to the Bank for International Settlements Global Liquidity Indicators, in 2015–16 global liquidity conditions started to tighten for developing economies. A key yardstick for global liquidity is the US dollar–denominated debt of non-bank borrowers outside the United States, which stood at US$9.7 trillion in December 2015, down from US$9.8 trillion at end-June 2015, in 2016, while dollar borrowing by non-banks in developing economies stood at US$3.2 trillion, also down from US$3.3 trillion in June 2014. This was the first time since 2009 that dollar borrowing by non-banks in developing economies had declined. Cross-border bank lending also
showed signs that global liquidity conditions might have peaked for developing economies.
Financing conditions in Africa remained tight owing to limited liquidity caused by the lingering effect of the end of the commodity super-cycle and the withdrawal of many international financial institutions from Africa. Continuing perception of high risk for the continent and challenges with confirmation of letters of credit, among other factors, meant that access to funds became more difficult or was at a higher premium for African entities than for those from other regions.
END
4Chapter Four

AFREXIMBANK AFRICAN TRADE REPORT 2017 41
Trade and the Trading Environment
4.1 Global Trade
Growth in world merchandise trade volume stagnated in 2015, at 2.8 percent, similar to the rate in 2014. In 2016 it slipped to 1.3 percent, the lowest since 2001. WTO (2016b) highlights the divergence in volume and value of trade growth in recent years. While volume remained flat in 2015, the value declined 14 percent from 2014 (US$19 trillion) to 2015 (US$16 trillion) and 3.3 percent from 2015 to 2016 (US$15.46 trillion). The variations arose largely from shifts in exchange rates and persistent weaknesses in global commodity prices (particularly for oil), which are priced in US dollars.
The sluggish growth in volume in 2015–16 was attributable to such factors as financial market volatility (driven by divergent monetary policies in developed countries), wide fluctuations in exchange rates, falling prices for oil and other primary commodities, economic slowdown in China and recessions in other large developing economies such as Brazil and Russia. The recent trend of growth in world merchandise trade volume mirroring that of world gross domestic product (GDP) was not sustained in 2016: growth in world merchandise trade volume was much slower than that of global GDP, reflecting the continued growth of the global supply chain model (under which intermediate goods cross borders many more times than they did when most stages of production took place in one country).
Slow growth in the volume of world merchandise trade also reflected a change to the regional contribution of trade growth. Whereas in previous years trade growth was driven by strong demand in developing countries, particularly China, that trend reversed in 2015, as East Asia’s contribution to global import demand was lower than Europe’s, owing largely to growth deceleration in China and other Asian economies. Hence, recovery in import demand in Europe and North America (primarily the United States and Mexico) compensated for weak demand in developing countries.
As the negative impact of the sovereign debt crisis abated, intra-EU trade rebounded and helped lift European import volumes to 4.3 percent growth in 2015, from 3.2 percent in 2014, with Europe’s demand accounting for over 60 percent of the growth in world merchandise imports in 2015. Germany, the United Kingdom, France and the Netherlands remained Europe’s largest importers in 2015.
In 2016 the largest contributors to global import demand were Asia (49 percent) and Europe (39 percent). On the supply side, Europe demonstrated resilience, with merchandise exports rising 3.7 percent in 2015, up from 2 percent in 2014. That resilience was also felt in 2016, when Europe recorded the smallest decline in exports (0.3 percent), in contrast to other regions where the decline was bigger. The largest decline (16.2 percent) was recorded by

42 CHAPTER FOUR AFRICAN TRADE REPORT 2017
the Commonwealth of Independent States (WTO 2016b). North American exports grew marginally, at 0.5 percent, in 2016 (compared with 4.1 percent in 2014 and 0.8 percent in 2015) on weakness in US merchandise exports.
In Asia growth in merchandise exports rebounded slightly to 1.8 percent in 2016, from a slump of 1.1 percent in 2015, but remained far below the 4.3 percent in 2014. The deceleration of merchandise exports in the region was due largely to weak performances in China and India—the region’s two largest economies.
In Brazil and other developing economies, growth in exports remained weak in 2015–16 on the back of low prices of oil and other primary commodities, as well as increased exchange rate volatility. Brazil was hit by a wave of scandals, a deep recession, a fiscal crisis, falling export prices and other domestic challenges, which heavily undermined the performance of South and Central America, whose merchandise exports grew marginally, to 1.3 percent in 2016.
4.2 Global Trading Environment
Celebrating its 20th anniversary in 2015, the World Trade Organization (WTO) continued its efforts to resolve issues related to the stalled Doha Development Agenda. The
divergence of views on the future of the Doha Development Round at the 10th WTO Ministerial Meeting in Nairobi, Kenya, in December 2015 was a major setback to multilateralism, which has been contested by the rise of protectionism over the last few years. The WTO urged its members to minimize protectionist measures to ease conditions for market access, avoid policies that distort competition and agree on reforms to global trade rules. At a 2016 meeting of the WTO’s Technical Barriers Committee, members acknowledged the need to regulate such products as medical devices, cosmetics, chemicals and motor vehicles to ensure the safety and health of consumers and protection of the environment but emphasized that regulation should not create barriers to trade in those products.
In 2015–16 more countries joined the WTO, and efforts to enhance its trade facilitation agenda continued, as did implementation of capacity-building and training programmes. The WTO also continued its key role in resolving trade disputes among members through its dispute settlement mechanism. The period also saw negotiations for regional and preferential trade agreements among countries and between regions, including mega-regional trade agreements such as the Trans-Pacific Partnership and the Transatlantic Trade and Investment Partnership.

AFREXIMBANK AFRICAN TRADE REPORT 2017 43
WTO membership stood at 162 at the end of 2015, after Seychelles and Kazakhstan joined, and at 164 at the end of 2016, after Liberia and Afghanistan joined. Despite the challenging global environment and the setback on the Doha Development Agenda, the WTO’s role is becoming even more important, with members now accounting for about 98 percent of global trade, compared with 91 percent when it came into being in 1995. The WTO was also in discussions with many countries seeking to become members, including (in Africa) Algeria, Equatorial Guinea, Ethiopia, Libya and Sudan.1
Trade negotiations culminated at the 10th Ministerial Conference in Nairobi in December 2015. Six ministerial decisions were adopted on issues related to agriculture, cotton and least developed countries, known collectively as the Nairobi Package. The conference also revealed divergent views among WTO members on the future of the Doha Round and how the negotiations at the WTO level should continue. The United States and European Union emphasized that the Doha Round is over and stressed the need to move on to new issues, unlike some developing countries, including India and China, which remain supportive of concluding the Doha Round.
However, 53 WTO members agreed to expand the Information Technology Agreement, which covers goods with an estimated annual trade value of US$1.3
1 Forty-three African countries were members
of the WTO at the end of 2016: Angola, Benin,
Botswana, Burkina Faso, Burundi, Cabo Verde,
Cameroon, Central African Republic, Congo,
Côte d’Ivoire, Democratic Republic of Congo,
Djibouti, Egypt, Gabon, The Gambia, Ghana,
Guinea, Guinea-Bissau, Kenya, Lesotho, Liberia,
Madagascar, Malawi, Mali, Mauritania, Mauritius,
Morocco, Mozambique, Namibia, Niger, Nigeria,
Rwanda, Senegal, Seychelles, Sierra Leone,
South Africa, Swaziland, Tanzania, Togo, Tunisia,
Uganda, Zambia and Zimbabwe.
trillion, and concluded a deal to liberalize trade in an additional 201 high-tech products in what was the first major tariff-cutting deal at the WTO since 1996. Eighteen of the 24 participants in the Information Technology Agreement began implementing their tariff commitment—65 percent of tariff lines fully eliminated since 1 July 2016—and the remaining participants are on track for full implementation in the near future.
In 2015 most WTO members continued to negotiate new regional trade agreements. The trend towards agreements between developing and developed trading partners continued in 2015–16: all WTO members had a regional trade agreement in force in 2016 after the agreement between Mongolia and Japan in June was notified.
Broadly, the new regional trade agreements notified in 2015–16 cover goods and services, with members from the Asia–Pacific region involved in six agreements, members from the Americas region involved in three and members from Europe, Africa and the Middle East involved in one each. In many instances the new regional trade agreements both broaden and deepen coverage compared with older ones and are comprehensive, covering not just market access for goods and services but also investment, competition policy, trade facilitation, government procurement, intellectual property, electronic commerce, labour and the environment.
In 2015–16 the WTO continued providing technical assistance and training programmes on dispute settlement, trade-related intellectual property rights, regional trade agreements, sanitary and phytosanitary issues, trade in services and trade policy analysis to member countries. It also arranged and delivered Geneva-based and regional advanced trade policy courses. The regional courses covered Anglophone and francophone Africa, Asia and the Pacific, the Caribbean, Latin America, Arab and Middle East countries, and Central and
44 CHAPTER FOUR AFRICAN TRADE REPORT 2017
Eastern Europe and Central Asia. In addition, the WTO delivered other specialist courses on sanitary and phytosanitary measures and technical barriers to trade for Anglophone African countries; a regional workshop on intellectual property and public health for francophone African countries; a course for Latin America on managing trade contingency measures; a seminar on the Government Procurement Agreement for Central and Eastern Europe, Central Asia and the Caucasus; and a seminar on agriculture for Arab and Middle East countries.
The WTO’s Enhanced Integrated Framework Steering Committee began work in 2015 on designing Phase Two of the framework, which aims to help least developed countries use trade as a tool for growth, development and poverty reduction. Phase Two started in January 2016 and will run to 2022. At the Enhanced Integrated Framework Pledging Conference in December 2015 on the sidelines of the 10th Ministerial Conference in Nairobi, 15 donor countries pledged US$90 million to the programme.
Negotiations and initiatives to establish and conclude regional and plurilateral trade agreements outside the WTO continued in 2015–16, in light of the persistent stalemate that has plagued the Doha Round of negotiations at the multilateral level. Because the coverage and depth of regional and plurilateral trade agreements are tailored to specific trade and geopolitical interests of the negotiating parties, they will continue to dominate the global trade landscape in the coming years. This is especially true as the global trade landscape becomes dominated by mega-regional trade arrangements such as the Trans-Pacific Partnership, the Transatlantic Trade and Investment Partnership and the Regional Comprehensive Economic Partnership.
The Trans-Pacific Partnership is a trade agreement under negotiation among Australia, Brunei, Canada, Chile, Japan,
Malaysia, Mexico, New Zealand, Peru, Singapore, Vietnam and the United States. The 12 countries have a combined population of about 800 million and account for some 40 percent of world trade. After more than five years of negotiations the Trans-Pacific Partnership was finalized in October 2015 and signed in October 2016. However, the recent US threat to withdraw has raised concerns about its future.
Negotiations towards a free trade agreement between the European Union and the United States, which are underpinned by the Transatlantic Trade and Investment Partnership, continued in 2015–16. The Transatlantic Trade and Investment Partnership is designed to foster growth and job creation on both sides of the Atlantic by removing trade barriers. It has three main pillars: improving market access by removing customs duties on goods and restrictions on services, by providing better access to markets and by making it easier to invest; improving regulatory coherence and cooperation by dismantling unnecessary regulatory barriers; and improving cooperation in setting international standards. Despite efforts to conclude a deal by December 2015, negotiations have stalled, and the future of the Transatlantic Trade and Investment Partnership remains uncertain, especially after the Brexit vote and the rise of trade-restrictive rhetoric in the United States.
The 10 countries of the Association of Southeast Asian Nations,2 along with their six free trade agreement partners (Australia, China, Japan, the Republic of Korea, India and New Zealand) continued negotiations in 2015–16 to concluding the Regional Comprehensive Economic Partnership, a comprehensive free trade agreement covering goods, services, investment, competition and intellectual property. Once
2 Brunei, Cambodia, Indonesia, Lao PDR, Malaysia,
Myanmar, the Philippines, Singapore, Thailand
and Vietnam.
AFREXIMBANK AFRICAN TRADE REPORT 2017 45
concluded, it will be one of the world’s largest trading blocs, with a population of more than 3.4 billion and GDP in excess of US$23 trillion. In 2015 negotiations centred on tariff concessions and rules of origin. In 2016 negotiations were completed on small and medium-size enterprises and on economic and technical cooperation, setting a growing momentum for the Regional Comprehensive Economic Partnership and raising optimism for successful negotiations on remaining areas such as goods, services, investments, intellectual property rights and movement of labour among member countries.
The impacts of these mega-regional trade deals on third countries and regions, including Africa, are uncertain, as not all their provisions are fully known, except for the Trans-Pacific Partnership. However, African countries that are not part of any of the three main mega-regional initiatives are likely to be affected by increased competition and preference erosion in a number of markets. In an effort to address these concerns and promote greater intra-African trade and integration, in June 2015 member and partner states of the Common Market for Eastern and Southern Africa, East African Community and Southern African Development Community signed the Tripartite Free Trade Area Agreement, bringing together 26 countries representing 48 percent of the African Union membership, 51 percent of the continent’s GDP and a combined population of 632 million.
Under the auspices of the African Union, African countries launched negotiations for establishing the Continental Free Trade Area in 2015. Negotiations continued in 2016 and are expected to be concluded in 2017. The Continental Free Trade Area will bring together 54 African countries with a combined population of more than 1 billion and a GDP of more than US$3 trillion, creating a market with the potential to catalyse intra-African trade and industrialization.
Apart from granting easier access to Africa’s large and growing market, the Continental Free Trade Area will enable its members to diversify and transform their economies more quickly through the opportunity to supply their own import needs. It should also enhance competitiveness at the industry and enterprise levels through economies of scale, continental market access and better allocation of resources. Moreover, the enhanced flow of foreign direct investment could shift focus from natural resources into industry and manufacturing, given the Continental Free Trade Area’s market size.
However, the Continental Free Trade Area is not without challenges, including diversity of interests at the regional and national levels, particularly given that disparities in the continent’s development could create winner and losers. For this reason the Continental Free Trade Area should be structured to ensure that gains for member countries are broad-based, and policy makers should learn from free trade agreements already in force on the continent (UNCTAD 2015a).
4.3 Africa’s External Reserves and Exchange Rates
The sustained decline in commodity prices and the consequent reduction in export revenues put considerable pressure on African countries’ foreign reserves, which contracted 13.6 percent from 2014 (US$490.52 billion) to 2015 (US$423.6 billion) and 9 percent from 2015 to 2016 (US$385.56 billion; Table 4.1). Because oil exporters account for more than 45 percent of Africa’s total export revenues, the decline in these countries’ reserves had a steep impact on the continent’s overall reserves. All major oil producers in the region—Angola, Republic of Congo, Equatorial Guinea, Gabon, Libya and Nigeria—saw their reserves decline in both 2015 and 2016.
This decline was exacerbated by capital outflows triggered by local currency

46 CHAPTER FOUR AFRICAN TRADE REPORT 2017
Table 4.1 Reserve Position of African Countries, 2014-16 (in US$ Billions unless otherwise indicated)
Total Reserves (Excl. Gold) Growth Rate (%)† Months of Import Cover by Reserves
Country Name 2014* 2015* 2016** 2015* 2016** 2014* 2015* 2016**Algeria 179,62 144,68 114,39 -19,45 -20,94 36,94 32,43 27,11Angola** 28,13 23,79 22,21 -15,43 -6,64 11,99 14,35 13,57Benin 0,76 0,67 0,58 -11,84 -13,43 2,50 1,04 0,90Botswana** 8,32 7,55 7,85 -9,25 3,97 16,21 16,87 16,04Burkina Faso 0,82 0,66 0,50 -19,51 -24,24 3,48 2,77 1,98Burundi 0,32 0,14 0,09 -56,25 -35,71 5,46 2,50 1,58Cameroun** 3,20 3,50 2,56 9,37 -26,86 4,84 5,78 4,00Cape Varde** 0,51 0,49 0,54 -3,92 10,20 7,18 6,66 7,22Central Africa Republic** 0,26 0,21 0,21 -19,23 0,00 6,38 3,09 3,40Chad** 1,08 0,37 0,09 -65,74 -75,68 8,92 4,56 1,41Comoros** 0,17 0,20 0,18 17,65 -10,00 7,57 8,73 7,27Congo Dem. Rep. of 1,56 1,22 0,71 -21,79 -41,80 2,54 1,94 0,96Congo Republic** 4,93 2,22 1,22 -54,97 -45,05 10,78 5,18 2,25Cote d’Ivoire 0,40 0,34 0,35 -15,00 2,94 0,43 0,34 0,33Djibouti** 0,39 0,36 0,37 -7,69 2,78 1,10 0,83 0,74Egypt** 12,00 13,23 19,54 10,25 47,69 2,11 2,23 3,12Equatorial Guinea** 2,91 1,21 0,55 -58,42 -54,55 12,90 7,35 2,86Eritrea** 0,21 0,20 0,21 -4,76 5,00 2,21 2,09 2,59Ethiopia** 2,76 3,73 3,08 35,14 -17,43 1,98 2,42 1,82Gabon** 2,48 1,87 1,36 -24,60 -27,27 7,10 5,67 3,78Gambia** 0,16 0,10 0,08 -37,50 -20,00 1,54 1,12 0,75Ghana** 5,50 5,89 6,10 7,09 3,57 3,73 3,95 3,60Guinea, The 0,29 0,25 0,39 -13,79 56,00 0,51 0,43 0,60Guinea, Bissau 0,19 0,18 0,24 -5,26 33,33 4,85 6,52 7,30Kenya** 7,91 7,55 7,89 -4,55 4,50 5,25 4,15 3,89Lesotho** 1,07 0,90 0,96 -15,89 6,67 6,94 5,57 5,57Liberia** 0,50 0,52 0,49 4,00 -5,77 0,47 0,65 0,48Libya** 89,09 73,67 69,15 -17,31 -6,14 53,97 62,06 58,04Madagascar 0,78 0,83 1,18 6,41 42,17 2,46 2,57 3,04Malawi** 0,60 0,69 0,63 15,00 -8,70 4,17 5,04 4,45Mali 0,12 0,11 0,12 -8,33 9,09 0,33 0,31 0,31Mauritania** 0,62 0,54 0,49 -12,90 -9,26 1,77 1,88 1,63Mauritius 3,61 3,96 4,50 9,70 13,64 8,03 10,02 11,25Morocco 19,67 22,25 24,54 13,12 10,29 5,18 6,83 6,81Mozambique 3,00 2,41 2,04 -19,67 -15,35 2,89 2,57 1,89Namibia** 1,18 1,69 1,73 43,22 2,37 1,65 2,37 2,94Niger 0,96 0,79 0,71 -17,71 -10,13 5,57 5,08 4,18Nigeria 36,67 30,61 25,84 -16,53 -15,58 6,25 6,30 5,23Rwanda** 1,07 1,03 1,02 -3,74 -0,97 8,43 7,80 7,08Sao Tome and Principe** 0,63 0,73 0,62 15,87 -15,07 61,60 81,36 62,33Senegal 0,19 0,15 0,12 -21,05 -20,00 0,38 0,34 0,25Seychelles 0,47 0,54 0,52 14,89 -3,70 4,42 4,59 3,94Sierra Leone** 0,60 0,62 0,59 3,33 -4,84 5,19 5,57 4,21Somalia — — — — — — — —South Africa** 44,23 41,62 42,22 -5,90 1,44 4,85 5,07 5,36South Sudan 0,42 0,23 0,07 -45,24 -69,57 — — —Sudan** 0,18 0,17 0,17 -5,56 0,00 0,23 0,18 0,17Swaziland** 0,69 0,55 0,60 -20,29 9,09 4,93 4,93 5,50Tanzania** 4,39 4,01 3,87 -8,66 -3,49 3,38 3,51 3,06Togo 0,90 0,74 0,43 -17,78 -41,89 1,37 0,86 0,43Tunisia 7,24 7,33 5,89 1,24 -19,65 3,32 3,87 2,89Uganda** 3,32 2,91 3,07 -12,35 5,50 8,59 7,51 7,43Zambia 3,08 2,97 2,35 -3,57 -20,88 3,81 4,21 2,86Zimbabwe** 0,36 0,42 0,35 16,67 -16,67 0,88 1,01 0,87Total 490,52 423,60 385,56 -13,64 -8,98 379,56 385,09 331,26Average 9,26 7,99 7,27 -9,41 -8,25 14,32 7,41 6,37
Growth rates are Afreximbank Staff calculations.* Revised ** Estimates for 2016 based on latest avaibale data — Not availableSources: IMF, IFS Database, EIU Country Reports, various issues, IMF IFS Database

AFREXIMBANK AFRICAN TRADE REPORT 2017 47
depreciation coupled with interest rate hikes in the United States. Persistent socio-political challenges in parts of Africa, notably Tunisia, Libya, Sudan, South Sudan, Central African Republic and Mali, increased uncertainty, heightened risk perceptions and drove many international investors to exit. The increased anxiety created by the environment in these countries also undermined tourist receipts and foreign direct investment inflows, hitting the continent’s foreign reserves in 2015–16.
Owing largely to the decline in Africa’s total external reserves, average import coverage fell from 14.3 in 2014 to 7.4 months in 2015 and to 6.4 months in 2016 (see Table 4.1). However, this rate is still above the International Monetary Fund’s recommended threshold of 3 months.
Shrinking export earnings caused by falling commodity prices, rising fiscal and external imbalances and weak growth in tourism receipts, combined with growing current account deficits and persistent socio-
political turmoil in many countries across the continent, had a sharp dampening effect on African currencies. Most of them depreciated against the US dollar in 2015–16. The currencies of many oil-exporting and mineral- and metal-exporting countries were particularly affected by weak commodity prices and the resulting dry-up of foreign reserves. For instance, the Mozambican metical depreciated 39.8 percent against the US dollar in 2015 and fell a further 50 percent in 2016 owing to continued weaknesses in commodity prices and anxieties over the country’s exploding external debt (Table 4.2). The Ghanaian cedi continued to slide against the US dollar, depreciating 18.5 percent in 2015 and 12.2 percent in 2016.
The currencies of major oil-exporting countries were among the hardest hit by the fall in oil prices in 2015–16. The Angolan kwanza depreciated 31.5 percent in 2015 and 22.1 percent in 2016; the fall in oil exports, which account for more than 90 percent of Angola’s export revenues and

48 CHAPTER FOUR AFRICAN TRADE REPORT 2017
Table 4.2 Africa: Exchange Rate Developments, 2014 - 16 (in US$ Billions unless otherwise indicated)
Percentage change between
2014 (1) 2015 (2) 2016 (3) (2) & (1) (3) & (2)Algeria - dinar 87,95 107,15 110,17 21,83 2,81Angola - kwanza 102,86 135,22 165,08 31,46 22,08Benin - franc 541,66 603,65 623,38 11,45 3,27Botswana - pula 9,50 11,26 10,68 18,56 -5,20Burkina Faso - franc 541,66 603,65 623,38 11,45 3,27Burundi - franc 1 555,25 1 558,00 1 675,05 0,18 7,51Cameroon - franc 541,66 603,65 623,38 11,45 3,27Cape Verde - escudos 90,05 100,99 104,88 12,15 3,85Central African Republic - franc 541,66 603,65 623,38 11,45 3,27Chad - franc 541,66 603,65 623,38 11,45 3,27Comoros - franc 406,24 452,74 467,54 11,45 3,27Congo, Dem. Rep. of - Congo franc 922,77 925,50 1 076,00 0,30 16,26Congo, Rep. of - franc 541,66 603,65 623,38 11,45 3,27Cote d’Ivoire - franc 541,66 603,65 623,38 11,45 3,27Djibouti - franc 177,99 177,63 177,60 -0,20 -0,02Egypt - pound 7,15 7,83 18,13 9,43 131,73Equatorial Guinea - franc 541,66 603,65 623,38 11,45 3,27Eritrea - nakfa 10,47 10,47 15,28 0,00 45,94Ethiopia - birr 20,20 21,28 22,70 5,34 6,67Gabon - franc 541,66 603,65 623,38 11,45 3,27Gambia - dalasi 43,19 39,36 42,15 -8,89 7,10Ghana - cedi 3,21 3,81 4,28 18,51 12,22Guinea - Guinea franc 7 015,10 7 755,00 9 368,00 10,55 20,80Guinea-Bissau - franc 541,66 603,65 623,38 11,45 3,27Kenya - shilling 90,52 102,33 102,22 13,04 -0,10Lesotho - loti 11,55 15,52 13,74 34,37 -11,46Liberia - Liberia dollar 92,50 86,75 91,00 -6,22 4,90Libya - dinar 1,31 1,37 1,44 3,86 5,33Madagascar - Ariary 2 584,70 3 220,00 3 340,00 24,58 3,73Malawi - kwacha 465,78 615,50 715,76 32,14 16,29Mali - franc 541,66 603,65 623,38 11,45 3,27Mauritania - ouguiyas 290,97 309,50 354,00 6,37 14,38Mauritius - rupee 31,75 35,90 35,85 13,07 -0,14Morocco - dirham 9,07 9,92 10,11 9,41 1,98Mozambique - meticals 33,99 47,50 71,23 39,75 49,96Namibia - namibia dollar 11,55 15,52 13,74 34,37 -11,46Niger - franc 541,66 603,65 623,38 11,45 3,27Nigeria - naira 183,00 199,03 304,20 8,76 52,85Rwanda - franc 688,98 745,00 811,65 8,13 8,95Sao Tome and Principe - dobra 20 108,62 22 497,50 23 304,50 11,88 3,59Senegal - franc 541,66 603,65 623,38 11,45 3,27Seychelles - rupee 13,18 12,07 13,36 -8,40 10,66Sierra Leone - leone 4 236,48 4 147,31 5 465,00 -2,10 31,77Somalia - shilling 824,97 618,00 575,71 -25,09 -6,84South Africa - rand 11,55 15,52 13,74 34,37 -11,46South Sudan - pound 5,85 6,10 6,48 4,24 6,22Sudan - pound 5,85 6,10 6,48 4,24 6,22Swaziland - lilangeni 11,55 15,52 13,74 34,37 -11,46Tanzania - shilling 1 734,21 2 158,66 2 174,00 24,48 0,71Togo - franc 541,66 603,65 623,38 11,45 3,27Tunisia - dinar 1,86 2,03 2,30 9,10 13,25Uganda - shilling 2 764,94 3 372,68 3 602,00 21,98 6,80Zambia - kwacha 6,40 11,00 9,96 71,88 -9,47Zimbabwe - US Dollar* 1,00 1,00 1,00 0,00 0,00
* US Dollar used as official currency since 2009Sources: Bloomberg, XE website (www.xe.com)

AFREXIMBANK AFRICAN TRADE REPORT 2017 49
almost 70 percent of its fiscal revenues, pushed up fiscal deficits and heightened issues of macroeconomic management. Likewise, the Nigerian naira continued to weaken, depreciating 8.8 percent in 2015 and 52.9 percent in 2016, reflecting oil price weakness and a consequent decline in foreign reserves, which compelled the government to stabilize the reserves and the currency by stopping dollar sales, imposing tight capital controls and abandoning the currency peg in favour of a floating exchange rate. However, the gap created between the official and parallel market rate fuelled the parallel market, and this, alongside an acute recession in the country, drove down the naira still further. The Egyptian pound was even more affected in 2016, depreciating 131.7 percent after the Egyptian Central Bank’s decision to float the currency. In contrast, the CFA franc depreciated only 3.3 percent, largely on account of divergent monetary policies between the European Central Bank and the US Federal Reserve.
In an even greater contrast, several African currencies recorded good performance, reversing the depreciating trend seen in 2015. Among the best-performing
were members of the Common Monetary Area—Lesotho, Namibia, South Africa and Swaziland—which saw their currencies appreciate 11.5 percent against the US dollar in 2016. The Zambian kwacha also appreciated 9.5 percent against the US dollar on the back of adjustments in monetary policy.
4.4 Africa’s Trade
Africa’s total merchandise trade fell 14.3 percent to US$1.03 trillion in 2015, from US$1.21 trillion in 2014, but rebounded 4.1 percent in 2016, to US$1.08 trillion (Table 4.3 and Figure 4.1). The challenging global environment in 2015, including the sharp decline in global commodity prices and the slowdown of the Chinese economy, were the main factors.
The dramatic decline in crude oil prices, which fell below US$30 per barrel in the fourth quarter of 2015, had heavy effects on trade performance that year. Especially hard hit were net oil exporters, notably Algeria, Angola, Equatorial Guinea, Republic of Congo, Libya and Nigeria. Nigeria, Africa’s largest economy and biggest oil exporter, recorded a 29.3 percent decline in total
Source: Economist Intelligence Unit, Country Report (various issues), International Monetary Fund Direction of Trade
Statistics database, United Nations Conference on Trade and Development UNCTADStat database and United Nations
Statistics Division database.
Figure 4.1 Africa’s merchandise trade, 2005–16 (US$ billion)
800 - 1400
400 - 600
600 - 1000
200 - 200
700 - 1200
300 - 400
2005 2009 20132007 2011 20152006 2010 20142008 2012 2016
500 - 800
100 - 0
0 - -400
-200
Exports Imports Total Trade - (Right Axis) Trade Balance - (Right Axis)
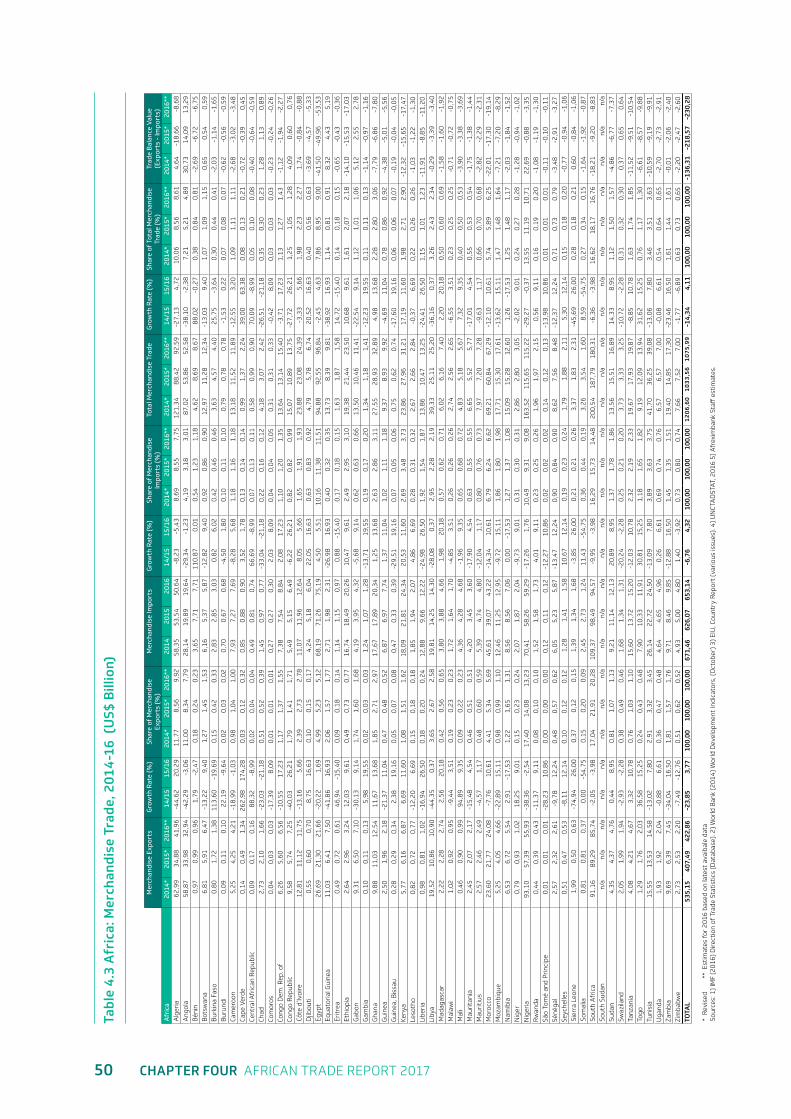
50 CHAPTER FOUR AFRICAN TRADE REPORT 2017
Tabl
e 4.
3 A
fric
a: M
erch
andi
se T
rade
, 201
4-16
(U
S$ B
illio
n)
Mer
chan
dise
Exp
orts
G
row
th R
ate
(%)
Shar
e of
Mer
chan
dise
Ex
port
s (%
)M
erch
andi
se Im
port
sG
row
th R
ate
(%)
Shar
e of
Mer
chan
dise
Im
port
s (%
)To
tal M
erch
andi
se T
rade
Gro
wth
Rat
e (%
)Sh
are
of T
otal
Mer
chan
dise
Tr
ade
(%)
Trad
e B
alan
ce V
alue
(E
xpor
ts -
Impo
rts)
Afr
ica
2014
*20
15*
2016
**14
/15
15/1
620
14*
2015
*20
16**
2014
2015
2016
14/1
515
/16
2014
*20
15*
2016
**20
14*
2015
*20
16**
14/1
515
/16
2014
*20
15*
2016
**20
14*
2015
*20
16**
Alg
eria
62
,99
34,8
841
,96
-44,
6220
,29
11,7
78,
569,
9258
,35
53,5
450
,64
-8,2
3-5
,43
8,69
8,55
7,75
121,
3488
,42
92,5
9-2
7,13
4,72
10,0
68,
568,
614,
64-1
8,66
-8,6
8A
ngol
a58
,87
33,9
832
,94
-42,
29-3
,06
11,0
08,
347,
7928
,14
19,8
919
,64
-29,
34-1
,23
4,19
3,18
3,01
87,0
253
,86
52,5
8-3
8,10
-2,3
87,
215,
214,
8930
,73
14,0
913
,29
Bén
in0,
970,
990,
961,
79-2
,47
0,18
0,24
0,23
3,65
7,71
7,71
110,
870,
010,
541,
231,
184,
628,
698,
6788
,02
-0,2
70,
380,
840,
81-2
,69
-6,7
2-6
,75
Bot
swan
a6,
815,
916,
47-1
3,22
9,40
1,27
1,45
1,53
6,16
5,37
5,87
-12,
829,
400,
920,
860,
9012
,97
11,2
812
,34
-13,
039,
401,
071,
091,
150,
650,
540,
59B
urki
na F
aso
0,80
1,72
1,38
113,
60-1
9,69
0,15
0,42
0,33
2,83
2,85
3,03
0,82
6,02
0,42
0,46
0,46
3,63
4,57
4,40
25,7
5-3
,64
0,30
0,44
0,41
-2,0
3-1
,14
-1,6
5B
urun
di0,
090,
110,
1022
,19
-9,6
40,
020,
030,
020,
700,
670,
68-4
,50
1,80
0,10
0,11
0,10
0,79
0,78
0,78
-1,5
30,
220,
070,
080,
07-0
,62
-0,5
6-0
,59
Cam
eroo
n5,
254,
254,
21-1
8,99
-1,0
30,
981,
041,
007,
937,
277,
69-8
,28
5,68
1,18
1,16
1,18
13,1
811
,52
11,8
9-1
2,55
3,20
1,09
1,11
1,11
-2,6
8-3
,02
-3,4
8Ca
pe V
erde
0,14
0,49
1,34
262,
9817
4,28
0,03
0,12
0,32
0,85
0,88
0,90
3,52
1,78
0,13
0,14
0,14
0,99
1,37
2,24
39,0
063
,38
0,08
0,13
0,21
-0,7
2-0
,39
0,45
Cent
ral A
fric
an R
epub
lic0,
090,
170,
1688
,32
-8,9
90,
020,
040,
040,
490,
810,
7466
,69
-8,9
90,
070,
130,
110,
580,
990,
9070
,09
-8,9
90,
050,
100,
08-0
,40
-0,6
4-0
,59
Chad
2,73
2,10
1,66
-23,
03-2
1,18
0,51
0,52
0,39
1,45
0,97
0,77
-33,
04-2
1,18
0,22
0,16
0,12
4,18
3,07
2,42
-26,
51-2
1,18
0,35
0,30
0,23
1,28
1,13
0,89
Com
oros
0,04
0,03
0,03
-17,
398,
090,
010,
010,
010,
270,
270,
302,
038,
090,
040,
040,
050,
310,
310,
33-0
,42
8,09
0,03
0,03
0,03
-0,2
3-0
,24
-0,2
6Co
ngo
Dem
. Rep
. of
6,26
5,60
6,56
-10,
5517
,23
1,17
1,37
1,55
7,38
7,54
8,84
2,08
17,2
31,
101,
201,
3513
,64
13,1
415
,40
-3,7
117
,23
1,13
1,27
1,43
-1,1
2-1
,94
-2,2
7Co
ngo
Rep
ublic
9,58
5,74
7,25
-40,
0326
,21
1,79
1,41
1,71
5,49
5,15
6,49
-6,2
226
,21
0,82
0,82
0,99
15,0
710
,89
13,7
5-2
7,72
26,2
11,
251,
051,
284,
090,
600,
76Cô
te d
’Ivoi
re12
,81
11,1
211
,75
-13,
165,
662,
392,
732,
7811
,07
11,9
612
,64
8,05
5,66
1,65
1,91
1,93
23,8
823
,08
24,3
9-3
,33
5,66
1,98
2,23
2,27
1,74
-0,8
4-0
,88
Djib
outi
0,55
0,60
0,70
8,75
16,6
30,
100,
150,
174,
245,
186,
0422
,05
16,6
30,
630,
830,
924,
795,
786,
7420
,52
16,6
30,
400,
560,
63-3
,69
-4,5
7-5
,33
Egyp
t26
,69
21,3
021
,66
-20,
221,
694,
995,
235,
1268
,19
71,2
675
,19
4,50
5,51
10,1
611
,38
11,5
194
,88
92,5
596
,84
-2,4
54,
637,
868,
959,
00-4
1,50
-49,
96-5
3,53
Equa
tori
al G
uine
a11
,03
6,41
7,50
-41,
8616
,93
2,06
1,57
1,77
2,71
1,98
2,31
-26,
9816
,93
0,40
0,32
0,35
13,7
38,
399,
81-3
8,92
16,9
31,
140,
810,
918,
324,
435,
19Er
itre
a0,
490,
720,
6146
,94
-15,
400,
090,
180,
141,
141,
150,
970,
88-1
5,40
0,17
0,18
0,15
1,63
1,87
1,58
14,7
2-1
5,40
0,14
0,18
0,15
-0,6
5-0
,43
-0,3
6Et
hiop
ia
2,64
2,96
3,24
12,0
39,
610,
490,
730,
7716
,74
18,4
920
,26
10,4
79,
612,
492,
953,
1019
,38
21,4
423
,50
10,6
89,
611,
612,
072,
18-1
4,10
-15,
53-1
7,03
Gab
on9,
316,
507,
10-3
0,13
9,14
1,74
1,60
1,68
4,19
3,95
4,32
-5,6
89,
140,
620,
630,
6613
,50
10,4
611
,41
-22,
549,
141,
121,
011,
065,
122,
552,
78G
ambi
a0,
100,
110,
135,
9819
,55
0,02
0,03
0,03
1,24
1,07
1,28
-13,
7119
,55
0,19
0,17
0,20
1,34
1,18
1,41
-12,
2319
,55
0,11
0,11
0,13
-1,1
4-0
,97
-1,1
6G
hana
9,88
11,0
312
,54
11,6
713
,68
1,85
2,71
2,97
17,6
717
,89
20,3
41,
2513
,68
2,63
2,86
3,11
27,5
528
,93
32,8
94,
9813
,68
2,28
2,80
3,06
-7,7
9-6
,86
-7,8
0G
uine
a2,
501,
962,
18-2
1,37
11,0
40,
470,
480,
526,
876,
977,
741,
3711
,04
1,02
1,11
1,18
9,37
8,93
9,92
-4,6
911
,04
0,78
0,86
0,92
-4,3
8-5
,01
-5,5
6G
uine
a, B
issa
u0,
280,
290,
342,
3819
,16
0,05
0,07
0,08
0,47
0,33
0,39
-29,
5119
,16
0,07
0,05
0,06
0,75
0,62
0,74
-17,
6019
,16
0,06
0,06
0,07
-0,1
9-0
,04
-0,0
5Ke
nya
5,77
6,16
6,87
6,69
11,6
01,
081,
511,
6218
,09
21,8
124
,34
20,5
311
,60
2,69
3,48
3,73
23,8
627
,96
31,2
117
,19
11,6
01,
982,
712,
90-1
2,32
-15,
65-1
7,47
Leso
tho
0,82
0,72
0,77
-12,
206,
690,
150,
180,
181,
851,
942,
074,
866,
690,
280,
310,
322,
672,
662,
84-0
,37
6,69
0,22
0,26
0,26
-1,0
3-1
,22
-1,3
0Li
beri
a0,
980,
811,
02-1
6,94
26,5
00,
180,
200,
2412
,88
9,66
12,2
2-2
4,98
26,5
01,
921,
541,
8713
,86
10,4
713
,25
-24,
4126
,50
1,15
1,01
1,23
-11,
91-8
,85
-11,
20Li
bya
19,5
210
,86
10,9
0-4
4,35
0,37
3,65
2,67
2,58
19,8
114
,25
14,3
0-2
8,08
0,37
2,95
2,28
2,19
39,3
325
,11
25,2
0-3
6,16
0,37
3,26
2,43
2,34
-0,2
9-3
,39
-3,4
0M
adag
asca
r2,
222,
282,
742,
5620
,18
0,42
0,56
0,65
3,80
3,88
4,66
1,98
20,1
80,
570,
620,
716,
026,
167,
402,
2020
,18
0,50
0,60
0,69
-1,5
8-1
,60
-1,9
2M
alaw
i1,
020,
920,
95-9
,44
3,51
0,19
0,23
0,23
1,72
1,64
1,70
-4,8
53,
510,
260,
260,
262,
742,
562,
65-6
,55
3,51
0,23
0,25
0,25
-0,7
1-0
,72
-0,7
5M
ali
0,46
0,90
0,99
94,8
99,
350,
090,
220,
234,
364,
284,
68-1
,96
9,35
0,65
0,68
0,72
4,83
5,18
5,67
7,32
9,35
0,40
0,50
0,53
-3,9
0-3
,38
-3,6
9M
auri
tani
a2,
452,
072,
17-1
5,48
4,54
0,46
0,51
0,51
4,20
3,45
3,60
-17,
904,
540,
630,
550,
556,
655,
525,
77-1
7,01
4,54
0,55
0,53
0,54
-1,7
5-1
,38
-1,4
4M
auri
tius
2,57
2,46
2,49
-4,5
71,
170,
480,
600,
595,
394,
744,
80-1
2,04
1,17
0,80
0,76
0,73
7,97
7,20
7,28
-9,6
31,
170,
660,
700,
68-2
,82
-2,2
9-2
,31
Mor
occo
23,6
021
,77
24,0
8-7
,76
10,6
14,
415,
345,
6945
,61
39,0
743
,22
-14,
3410
,61
6,79
6,24
6,62
69,2
160
,84
67,2
9-1
2,10
10,6
15,
745,
896,
25-2
2,01
-17,
30-1
9,14
Moz
ambi
que
5,25
4,05
4,66
-22,
8915
,11
0,98
0,99
1,10
12,4
611
,25
12,9
5-9
,72
15,1
11,
861,
801,
9817
,71
15,3
017
,61
-13,
6215
,11
1,47
1,48
1,64
-7,2
1-7
,20
-8,2
9N
amib
ia6,
536,
725,
542,
91-1
7,53
1,22
1,65
1,31
8,56
8,56
7,06
0,00
-17,
531,
271,
371,
0815
,09
15,2
812
,60
1,26
-17,
531,
251,
481,
17-2
,03
-1,8
4-1
,52
Nig
er0,
790,
931,
0218
,25
9,01
0,15
0,23
0,24
2,07
1,87
2,04
-9,7
39,
010,
310,
300,
312,
862,
803,
05-2
,02
9,01
0,24
0,27
0,28
-1,2
8-0
,94
-1,0
2N
iger
ia93
,10
57,3
955
,93
-38,
36-2
,54
17,4
014
,08
13,2
370
,41
58,2
659
,29
-17,
261,
7610
,49
9,31
9,08
163,
5211
5,65
115,
22-2
9,27
-0,3
713
,55
11,1
910
,71
22,6
9-0
,88
-3,3
5R
wan
da0,
440,
390,
43-1
1,37
9,11
0,08
0,10
0,10
1,52
1,58
1,73
4,01
9,11
0,23
0,25
0,26
1,96
1,97
2,15
0,56
9,11
0,16
0,19
0,20
-1,0
8-1
,19
-1,3
0Sã
o To
mé
and
Pri
ncip
e0,
010,
010,
01-2
8,23
10,8
60,
000,
000,
000,
120,
110,
12-1
2,27
10,8
60,
020,
020,
020,
140,
120,
13-1
3,98
10,8
60,
010,
010,
01-0
,11
-0,1
0-0
,11
Séné
gal
2,57
2,32
2,61
-9,7
812
,24
0,48
0,57
0,62
6,05
5,23
5,87
-13,
4712
,24
0,90
0,84
0,90
8,62
7,56
8,48
-12,
3712
,24
0,71
0,73
0,79
-3,4
8-2
,91
-3,2
7Se
yche
lles
0,51
0,47
0,53
-8,1
112
,14
0,10
0,12
0,12
1,28
1,41
1,58
10,6
712
,14
0,19
0,23
0,24
1,79
1,88
2,11
5,30
12,1
40,
150,
180,
20-0
,77
-0,9
4-1
,06
Sier
ra L
eone
1,99
0,50
0,63
-74,
9426
,00
0,37
0,12
0,15
1,39
1,34
1,68
-3,8
526
,00
0,21
0,21
0,26
3,37
1,83
2,31
-45,
6926
,00
0,28
0,18
0,21
0,60
-0,8
4-1
,06
Som
alia
0,81
0,81
0,37
0,00
-54,
750,
150,
200,
092,
452,
731,
2411
,43
-54,
750,
360,
440,
193,
263,
541,
608,
59-5
4,75
0,27
0,34
0,15
-1,6
4-1
,92
-0,8
7So
uth
Afr
ica
91,1
689
,29
85,7
4-2
,05
-3,9
817
,04
21,9
120
,28
109,
3798
,49
94,5
7-9
,95
-3,9
816
,29
15,7
314
,48
200,
5418
7,79
180,
31-6
,36
-3,9
816
,62
18,1
716
,76
-18,
21-9
,20
-8,8
3So
uth
Suda
nn/
an/
an/
an/
an/
an/
an/
an/
an/
an/
an/
an/
an/
an/
an/
an/
an/
an/
an/
an/
an/
an/
an/
an/
an/
an/
an/
aSu
dan
4,35
4,37
4,76
0,44
8,95
0,81
1,07
1,13
9,21
11,1
412
,13
20,8
98,
951,
371,
781,
8613
,56
15,5
116
,89
14,3
38,
951,
121,
501,
57-4
,86
-6,7
7-7
,37
Swaz
iland
2,05
1,99
1,94
-2,9
3-2
,28
0,38
0,49
0,46
1,68
1,34
1,31
-20,
24-2
,28
0,25
0,21
0,20
3,73
3,33
3,25
-10,
72-2
,28
0,31
0,32
0,30
0,37
0,65
0,64
Tanz
ania
4,08
4,21
4,67
3,32
10,7
80,
761,
031,
1015
,60
13,7
215
,20
-12,
0310
,78
2,32
2,19
2,33
19,6
717
,93
19,8
7-8
,85
10,7
81,
631,
741,
85-1
1,52
-9,5
1-1
0,54
Togo
1,29
1,76
2,03
36,5
815
,25
0,24
0,43
0,48
7,90
10,3
311
,91
30,8
115
,25
1,18
1,65
1,82
9,19
12,0
913
,94
31,6
215
,25
0,76
1,17
1,30
-6,6
1-8
,57
-9,8
8Tu
nisi
a15
,55
13,5
314
,58
-13,
027,
802,
913,
323,
4526
,14
22,7
224
,50
-13,
097,
803,
893,
633,
7541
,70
36,2
539
,08
-13,
067,
803,
463,
513,
63-1
0,59
-9,1
9-9
,91
Uga
nda
1,93
1,92
2,04
-0,8
86,
610,
360,
470,
484,
644,
654,
960,
266,
610,
690,
740,
766,
576,
577,
00-0
,08
6,61
0,54
0,64
0,65
-2,7
0-2
,73
-2,9
1Za
mbi
a9,
696,
397,
45-3
4,04
16,5
01,
811,
571,
769,
718,
469,
85-1
2,88
16,5
01,
451,
351,
5119
,40
14,8
517
,30
-23,
4616
,50
1,61
1,44
1,61
-0,0
1-2
,06
-2,4
0Zi
mba
bwe
2,73
2,53
2,20
-7,4
9-1
2,76
0,51
0,62
0,52
4,93
5,00
4,80
1,40
-3,9
20,
730,
800,
747,
667,
527,
00-1
,77
-6,8
90,
630,
730,
65-2
,20
-2,4
7-2
,60
TOTA
L53
5,15
407,
4942
2,86
-23,
853,
7710
0,00
100,
0010
0,00
671,
4662
6,07
653,
14-6
,76
4,32
100,
0010
0,00
100,
001
20
6,6
01
03
3,5
61
07
5,9
9-1
4,34
4,11
100,
0010
0,00
100,
00-1
36,3
1-2
18,5
7-2
30,2
8
* R
evis
ed
**
Est
imat
es fo
r 20
16 b
ased
on
late
st a
vaib
ale
data
Sour
ces:
1)
IMF
(201
6) D
irect
ion
of T
rade
Sta
tist
ics
(Dat
abas
e). 2
) W
orld
Ban
k (2
014)
Wor
ld D
evel
opm
ent
Indi
cato
rs, (
Oct
ober
) 3)
EIU
, Cou
ntry
Rep
ort
(var
ious
issu
es).
4) U
NCT
AD
STAT
, 201
6 5)
Afr
exim
bank
Sta
ff e
stim
ates
.

AFREXIMBANK AFRICAN TRADE REPORT 2017 51
merchandise trade, from US$163.52 billion in 2014 to US$115.65 billion in 2015 (see Table 4.3). This fall was due mainly to the sharp decline in the country’s oil export revenues: total merchandise exports fell 38.4 percent from 2014 (US$93.10 billion) to 2015 (US$57.39 billion).
However, in 2016 the trend reversed, as growth of the continent’s merchandise trade rebounded to an estimated 4.1 percent, largely because prices of major commodities began to rally on the back of weak supplies in the agricultural sector and because of robust demand, which boosted the prices of major metal and mineral commodities. The total merchandise trade of oil-importing countries rose 4.9 percent in 2016 after a decline of 7.4 percent in 2015. Although growth remained sluggish over the same period, oil-dependent African countries saw total trade climb 1.3 percent, helping lift the continent’s total merchandise trade to US$1.08 trillion in 2016.
In 2015 the fall in global demand for most of Africa’s major export commodities weighed on its total merchandise exports, which contracted 23.9 percent from 2014 (US$533.15 billion) to 2015 (US$407.49 billion), owing to persistent difficulties in developed and some developing economies. The main export commodities include coffee, copper, gold, palm oil, platinum and rubber. However, the modest pick-up in prices of major export commodities in 2016 reversed the declining trend of total merchandise exports, which rebounded an estimated 3.8 percent.
Under the challenging global and African economic environment of 2015, Africa’s five largest trading economies, which account for about 60 percent of the continent’s exports, saw exports shrink: Algeria by 44.62 percent, Angola by 42.3 percent, Egypt by 20.2 percent, Nigeria by 38.4 percent and South Africa by 2.1 percent in 2015 (see Table 4.3). However, in 2016 the moderate improvement in commodity markets helped
two of these countries: export growth was estimated at 20.3 percent in Algeria and 1.7 percent in Egypt. Though exports continued to decline in Angola, Nigeria and South Africa, they decelerated at a much lower rate in 2016 than in 2015.
Another factor underlying the decline in Africa’s merchandise exports was the financing constraint faced by the continent’s exporters. Perceptions of the African business environment as highly risky, coupled with a more stringent regulatory environment at the global level, prompted many international banks to scale down their lending activities across the continent. This affected trade finance availability in Africa in 2015–16 because the big players on the continent are large international banks, including Citibank, Barclays, HSBC and Standard Chartered.
Africa’s merchandise imports declined 6.8 percent from 2014 (US$671.46 billion) to 2015 (US$626.07 billion) but recovered an estimated 4.3 percent in 2016 (to US$653.14 billion). While 2015’s decline may reflect increasing challenges in accessing trade financing, other factors may also be at play, including falling foreign exchange reserves and rationing, depreciation of local currencies and drastic adjustment measures. For instance, as oil prices dropped, the Algerian government sought to reduce the country’s import bill by reducing imports of construction materials such as cement, ceramic, wood, iron and steel. Algeria’s imports declined 8.2 percent from 2014 (US$58.35 billion) to 2015 (US$53.54 billion). In South Africa total merchandise imports shrank almost 10 percent from 2014 (US$109.37 billion) to 2015 (US$98.49 billion), reflecting sharp cutbacks in imports of electronics and vehicles. In Nigeria imports fell 17.3 percent from 2014 (US$70.41) to 2015 (US$58.26 billion), owing to reductions in imports of equipment related to electronics, plastics, ceramics and iron. Similar import-restriction measures were adopted in Angola and other major

52 CHAPTER FOUR AFRICAN TRADE REPORT 2017
oil-dependent countries in Africa to preserve foreign reserves.
The recovery in merchandise imports in 2016 was supported by strong growth in imports in Democratic Republic of Congo (17.2 percent), Djibouti (16.6 percent), Guinea (11 percent), Kenya (11.6 percent), Liberia (26.5 percent), Morocco (10.6 percent), Mozambique (15.1 percent), Senegal (12.1 percent), Tanzania (10 percent), Togo (15.3 percent) and Zambia (16.5 percent). This performance stemmed largely from the positive effects of still-low oil prices as the easing of oil import bills continued to generate savings and windfalls in highly energy-intensive economies and oil-importing countries such as Egypt, Morocco and Kenya. Kenya and Tanzania are still reaping the fiscal benefits of weak oil prices. The value of imports rose 5.7 percent in Côte d’Ivoire, 9.6 percent in Ethiopia, 7.8 percent in Tunisia and 6.6 percent in Uganda.
The increasing demand for capital goods in Africa over the past few years (as many African governments embarked on initiatives and investment programmes to improve their processing capacities and diversify their export base and economy) continued to put upward pressure on the continent’s merchandise imports in 2016 and widened the trade deficit.
Despite the recovery in Africa’s merchandise trade, reflected by an estimated growth rate of 4.1 percent in 2016, the continent’s share of global trade was estimated at only 3.2 percent that year—a slight improvement over the 3.1 percent of 2015. But much more needs to be done to integrate Africa into the global economy.
Africa has historically traded more with Europe, particularly the European Union, than with any other region, mostly because of colonial history. However, in the early 2000s that trend began to change, with African countries diversifying their trade relationships towards other developing
Figure 4.2 Share of Africa’s merchandise exports to developed and developing countries (%)
Source: International Monetary Fund Direction of Trade
Statistics database.
regions, as the “Global South” provided opportunities for expanding trade with other developing countries. Developed economies, facing secular stagnation or lacklustre growth after the global financial crisis, contributed to this shift, especially given the Eurozone’s growth slowdown. The share of Africa’s merchandise exports to developing countries, which fell to 31.1 percent in 2015 on a slowing Chinese economy, rebounded to 33 percent in 2016 (Figure 4.2). Africa’s exports to developed countries have generally weakened in recent years, though the share to the European Union within developed countries grew slightly, from 26.9 percent in 2015 to 28.1 percent in 2016, but remain far below the 38.4 percent in 2014.
The continued expansion of developing countries’ share of exports from Africa is due to intensification of trade relationships between Africa and Asia, particularly China and India. Asian countries accounted for 39 percent of African exports in 2016, up from 32.3 percent in 2014 and 32.7 percent in 2015 (Table 4.4 and Figure 4.3). China continued to dominate Africa’s exports
2014 2015 2016
40 -
20 -
30 -
10 -
35 -
15 -
25 -
5 -
0 -
Share of developed countries
Share of developing countries

AFREXIMBANK AFRICAN TRADE REPORT 2017 53
to Asia, although persistent structural challenges in the country led to a decline in its share of the continent’s exports from 13.3 percent in 2014 to 11.8 percent in 2015 to 9.3 percent in 2016. The bulk of Africa’s exports to Asia are primary commodities related to energy, metals and minerals, and agricultural raw materials. The dynamic of trade between the two regions reflects both contraction in global demand and price volatility.
The Middle East’s share of exports from Africa also continued its upward movement, from 3.16 percent in 2014 to 4.5 percent in 2015 to 7.1 percent in 2016 (see Table 4.4 and Figure 4.3). The expansion arose as the continent continued to strengthen cooperation with the Middle East, especially with the members of the Gulf Cooperation Council, through promotion of investments and through trade and financial initiatives. Africa’s merchandise exports to the Middle East are dominated by petroleum gases, coal, petroleum oils (not crude), gold and diamonds.
Latin America and the Caribbean was gradually becoming another important export destination for Africa, with an estimated 6.3 percent share in 2014. However, the wave of economic challenges, especially the recession that hit Brazil, the main destination of Africa’s exports in
the region, put downward pressure on the share, taking it from 5 percent in 2015 to 2.5 percent in 2016.
Despite Africa’s efforts to diversify its trade partners, Europe remains the main export destination, accounting for 42.4 percent of the continent’s exports in 2016 (compared with over 50 percent in the early 2000; see Table 4.4 and Figure 4.3). The economic difficulties of the Eurozone and Europe at large weakened the region’s industrial production capacity and undermined its demand for primary and industrial raw commodities, which have been the main drivers of trade with Africa. France and Spain have been the main European destinations of Africa’s exports over the last three years, but France’s share has declined to from 6.2 percent in 2014 to 5.9 percent 2015 to 5.2 percent in 2016 and Spain’s share has declined from 6.5 percent in 2014 to 6.3 percent in 2015 to 4.9 percent in 2016.
North America remained the third-largest destination for Africa’s exports in 2016, behind the European Union and Asia. Its share of the continent’s exports declined from 10.2 percent in 2015 to 9 percent in 2016, driven largely by the United States, as the country continued to reduce imports of commodities from the continent, especially crude oil (see Table 4.4 and Figure 4.3).
Figure 4.3 Regional distribution of Africa’s merchandise Exports (%)
Source: International Monetary Fund Direction of Trade Statistics database and International Trade Centre Database.
60 -
10 -
20 -
45 -
0 -
30 -
50 -
Asia European Union Latin America & Caribbean
Middle-East North America
2014 2015 2016

54 CHAPTER FOUR AFRICAN TRADE REPORT 2017
Sour
ce: I
nte
rnat
ion
al M
onet
ary
Fun
d D
irec
tion
of
Trad
e St
atis
tics
dat
abas
e an
d In
tern
atio
nal
Tra
de
Cen
tre
Dat
abas
e.
Tabl
e 4.
4. D
irec
tion
of
Afr
ica’
s m
erch
andi
se t
rade
, 201
3–16
(%)
Mer
chan
dise
exp
orts
Mer
chan
dise
impo
rts
Tota
l mer
chan
dise
tra
de
2013
2014
2015
2016
2013
2014
2015
2016
2013
2014
2015
2016
Asi
a29
.96
32.2
832
.65
39.0
232
.77
34.9
338
.81
45.8
931
.44
33.7
436
.42
43.1
3
Chin
a13
.31
13.3
411
.81
9.26
14.0
816
.05
19.4
413
.52
13.7
114
.81
16.3
311
.85
Indi
a5.
486.
527.
705.
605.
305.
254.
883.
385.
385.
836.
034.
25
Euro
pean
Uni
on47
.39
48.3
747
.64
42.4
043
.05
42.0
840
.30
36.6
145
.10
44.9
143
.16
38.9
4
Fran
ce6.
006.
205.
935.
206.
036.
046.
084.
456.
026.
116.
024.
75
Ger
man
y2.
963.
023.
613.
514.
664.
694.
593.
973.
863.
934.
193.
79
Ital
y4.
244.
173.
754.
163.
573.
673.
432.
893.
893.
903.
563.
39
The
Net
herl
ands
4.52
4.93
3.76
2.79
2.76
2.67
2.71
1.75
3.59
3.70
3.14
2.16
Spai
n6.
006.
486.
274.
873.
403.
262.
942.
654.
634.
744.
303.
52
Uni
ted
King
dom
4.38
3.94
3.50
2.43
2.48
2.42
2.11
1.57
3.38
3.12
2.67
1.91
Lati
n A
mer
ica
& C
arib
bean
6.11
6.31
4.99
2.50
4.82
4.17
3.86
3.75
5.43
5.13
4.30
3.25
Bra
zil
3.32
3.46
2.46
1.08
1.60
1.38
1.28
1.21
2.42
2.33
1.76
1.16
Mid
dle
East
2.81
3.16
4.52
7.11
10.7
29.
839.
558.
176.
996.
837.
597.
74
Saud
i Ara
bia
0.24
0.33
0.42
0.96
3.06
2.73
2.01
1.33
1.72
1.63
1.37
1.18
Uni
ted
Ara
b Em
irate
s0.
890.
981.
261.
081.
471.
491.
730.
581.
191.
261.
540.
78
Nor
th A
mer
ica
13.7
39.
8910
.20
8.97
8.64
8.99
7.48
5.57
11.0
49.
398.
546.
94
Uni
ted
Stat
es8.
275.
945.
875.
755.
555.
964.
833.
556.
845.
955.
264.
49

AFREXIMBANK AFRICAN TRADE REPORT 2017 55
The US share of Africa’s exports declined marginally, from 5.9 percent in 2014 to 5.9 percent in 2015 to 5.8 percent in 2016.
Africa has also diversified its sources of imports over the last decade. The share of Africa’s imports from developing countries has risen steadily over the last three years to reach about 38.8 percent in 2016. The share of imports from Asia has continued to grow, from 34.9 percent in 2014 to 38.8
percent in 2015 to 45.9 percent in 2016 (Figure 4.4; see also Table 4.4). Africa’s imports from Asia are dominated by machinery and electricals and electronics, which account for over 25 percent of the continent’s imports from Asia (Figure 4.5). The expansion of the share of Africa’s imports from Asia is due largely to low cost of inputs and technologies, rising investment and trade finance flows from that region to the continent.
Figure 4.4. Regional distribution of Africa’s merchandise imports (%)
Source: International Monetary Fund Direction of Trade Statistics database and International Trade Centre Database.
50 -
30 -
40 -
20 -
5 -
45 -
25 -
15 -
35 -
10 -
0 -
2014 2015 2016
Asia European Union Latin America & Caribbean
Middle-East North America

56 CHAPTER FOUR AFRICAN TRADE REPORT 2017

AFREXIMBANK AFRICAN TRADE REPORT 2017 57
Figure 4.5 Africa’s sources of capital goods, by region (%)
Source: International Monetary Fund Direction of Trade Statistics database and International Trade Centre Database.
The share of Africa’s imports from EU countries has declined steadily over the last three years, from 42.08 percent in 2014 to 40.3 percent in 2015 to 36.6 percent in 2016 (see Table 4.4 and Figure 4.4). However, the European Union remains an important source of imports for Africa, most of which are agricultural and mining equipment and machinery, energy-related products, vehicles, and other machinery and high-skilled technological products (see Figure 4.5).
Africa’s imports from North America declined from 9 percent in 2014 to 7.5 percent in 2015 to 5.6 percent in 2016. Products sourced from that region are generally machinery and transport-related equipment. Though the share of Africa’s imports from the Middle East has declined steadily over the last three years, to 8.2 percent in 2016, the region remains a significant source of Africa’s imports of mineral fuels and bituminous substances, which account for 32.6 percent of the continent’s imports from the region.
35 -
15 -
25 -
5 -
30 -
10 -
20 -
0 -
2014 2015 2016
Mac
hine
ry
Mac
hine
ry
Mac
hine
ry
Mac
hine
ry
Elec
tric
als
& E
lect
roni
cs
Asia European Union Latin America & Caribbean
North America
Elec
tric
als
& E
lect
roni
cs
Elec
tric
als
& E
lect
roni
cs
Elec
tric
als
& E
lect
roni
cs
Iron
& S
teel
Asi
a
Iron
& S
teel
Iron
& S
teel

5Chapter Five

AFREXIMBANK AFRICAN TRADE REPORT 2017 59
Commodity Prices
As net exporters of oil and gas and of base and precious metals or as net importers of agricultural commodities, excluding cocoa (for which Africa is the world’s largest exporter), African economies remain highly exposed to commodity markets. According to International Monetary Fund data (2017), oil and gas accounted for over 90 percent of exports from Nigeria and over 40 percent of that country’s government revenue in 2016. Four countries in Africa—Egypt, Algeria, Morocco and Nigeria—accounted for more than 17 percent of global wheat imports in the 2015/16 season. Shifts in commodity fundamentals, which influence prices on international markets, have wide-ranging macro implications for the region through their effects on inflation, the terms of trade, fiscal balances, financial market liquidity (including currency and foreign exchange) and growth prospects.
Except energy, all commodity groups (agriculture and metals and minerals) recovered in 2016 after slumping in 2015. The broad Thomson Reuters Core Commodity Index ended 13 percent higher in 2016, after a decline of 30 percent in 2015, although prices remained near multi-year lows. The recovery in commodity prices emanated largely from the modest improvement in some developed economies, including Canada, France and Germany, and some developing economies, notably India, which exerted upward pressure on
global demand and pushed up prices in 2016. Commodity markets also benefited from emerging supply concerns and signs of a pick-up in demand from China, as it ramped up infrastructure spending. Further, markets reacted positively to US President Donald Trump’s ambitious infrastructure plans, which they considered potentially supportive for base metal prices. Finally, the expansionary monetary policy adopted by a large swathe of central banks helped improve market liquidity and buttress commodity demand and prices.
The bearish trend seen in commodity prices in 2015 had been heavily influenced by weak growth in the Eurozone, a strong US dollar and lower-than-expected growth in other developed and developing economies, particularly China. Average nominal prices contracted 8.4 percent for agriculture and 16.5 percent for metals and minerals in 2015 before making gains of 1.6 percent and 10.9 percent in 2016.
Oil prices were undermined by burgeoning inventories as supply outpaced global demand and the US and Canada expanded shale output. Brent oil markets therefore contracted sharply, falling by 47.2 percent in 2015 and again by 15.8 percent in 2016, although oil prices reacted positively to the decision by members and non-members of the Organization of the Petroleum Exporting Countries to curtail output for six months in the fourth quarter of 2016.

60 CHAPTER FIVE AFRICAN TRADE REPORT 2017
Box 5.1: Implications of commodity price shocks for African economies and policy responses
The end of the commodity super-cycle in 2014 once again amplified the dangers of over-reliance on natural resources and commodities in a continent where oil-exporting countries alone account for over 55 percent of GDP and for more than 50 percent of export revenue. The sharp downturn in commodity prices, especially that of oil, significantly undermined the continent’s growth performance, with a more pronounced impact on natural resources and oil-exporting countries such as Angola, Nigeria, Republic of Congo and Zambia, where oil and base metals account for the bulk of export receipts and fiscal revenues. The sustained decline in commodities terms of trade more generally and oil prices in particular pushed Nigeria—the top oil-producing country in Africa—into a recession in 2016, the first time in over two decades, with GDP contracting around 1.8 percent. And despite the budgetary buffer provided to oil-importing countries by lower oil prices, most oil-exporting countries have faced other macroeconomic challenges, including fiscal revenue shortfalls, terms of trade deterioration and currency volatility.
More generally for the region, these challenges emanated mostly from the fact that in 2014–16 most commodities of export interest to the continent were subjected to bearish price swings because of weak growth in their core markets, including the Eurozone, a strong US dollar and lower-than-expected growth in other developed and developing economies, particularly China. Oil markets fell sharply, reflecting burgeoning inventories and tame global demand, while base metal prices were undermined by weaker seaborne volumes to traditional markets and agricultural prices fell because of a return to trend yields after sharply lower output in 2015 as a result of dry El Niño weather conditions.
Africa’s external reserve holdings have gradually but steadily grown over the past two decades, with foreign exchange reserves recording a growth rate of over 1,300 percent, from US$42 billion in 1995 to a peak of US$550 billion in 2013 (Figure B5.1.1). Elhiraika and Ndikumana (2007) outline several factors that account for the variations in Africa’s reserves, chief among them, exports, which account for
Source: World Bank World Development Indicators database, Bloomberg
Figure B5.1.1: Trend in Africa’s foreign reserves and oil prices, 1995–2016
600 - - 120
- 60
- 80
- 20
- 100
- 40
- 00 -
100 -
200 -
300 -
400 -
500 -
1995
20
03
201
1
199
9
20
07
201
5
1997
20
05
201
3
20
01
20
09
199
6
20
04
201
2
20
00
20
08
201
6
199
8
20
06
201
4
20
02
201
0
Reserves (US$ Billion) – Left Axis
Oil Price (US$/bbl) – Right Axis

AFREXIMBANK AFRICAN TRADE REPORT 2017 61
64–70 percent of the continent’s total reserve position. Since Africa’s exports are depend heavily on natural resources and commodities, the sustained decline in the continent’s foreign exchange reserve position since 2014 appears to be a direct consequence of the end of the commodity super-cycle, characterized by plunging commodity prices, including those for oil and base metals. Total foreign reserves declined from US$550 billion in 2013 to US$487 billion in 2014 and to US$386 billion in 2016.
Notwithstanding the apparent challenges emanating from over-reliance on natural resources and oil, there is still optimism among new and existing oil producers that resource abundance can contribute significantly to the continent’s quest for accelerated growth and structural transformation. The expectation is that Africa’s rich endowment in natural
resources and commodities and resultant revenues can deliver substantial social, economic and infrastructure improvements; create jobs; and reduce donor dependency, with potential trickle-down effects on the continent as a whole. In this context volatility in commodity prices continues to present a challenge for both exporting and importing countries, especially in terms of the region’s foreign reserves. Further, the supply-side effects of reduced availability and increased costs of oil as an input create immediate economic distortions in oil-intensive production sectors. Again, while increased oil prices lead to deterioration in the terms of trade for importing countries, lower oil prices present fiscal revenue challenges for exporting countries (though, arguably with some gains to oil-importing countries in the form of enhanced savings; Dohner, 1981).
Figure B5.1.2: Impact of low oil prices on GDP growth and total reserves in Angola and Nigeria
Source: World Bank World Development Indicators database. IMF World Economic Outlook database
10,0
5,0
0,0
5,0
10,0
15,0
20,0
25,0
5,0
0,0
5,0
10,0
15,0
20,0
25,0
30,0
35,0
40,0
Angola Nigeria
GDP growth (%) – Left Axis Total Reserves (US$ Mn) – Right Axis
40,000
60,000
35,000
30,000
25,000
50,000
20,000
40,000
15,000
30,000
10,000
20,000
5,000
10,000
0
0

62 CHAPTER FIVE AFRICAN TRADE REPORT 2017
The impact of sluggish commodity prices on the foreign reserves position of African countries is aptly demonstrated in Zambia, where the steep decline in the price of copper—for which Zambia is among the top 10 producing countries in the world and which accounts for around 70 percent of the country’s export revenues—eroded foreign currency receipts. At the same time, recurrent power shortages dampened productivity, and heightened debt servicing costs exacerbated already weak foreign exchange levels and adversely impacted the country’s current account position, undermining the performance of the Zambian kwacha, which depreciated by 71.9 percent, the most among African currencies in 2015 (although it subsequently recovered in 2016 as copper prices picked-up from their seven-year low).
The impact of low oil prices on African economies cannot be overemphasized even though the current term structure in oil prices suggests some upside potential in the medium term as the global economy gathers momentum and Organization of the Petroleum Exporting Countries members provide support by restraining output. Both Angola and Nigeria suffered sustained declines in output growth and subsequent worsening of reserve positions during 2014–16 as a result of the recent oil price shock (Figure B5.1.2). Before the oil price shock Angola’s GDP growth increased 6.8 percent in 2013; after the shock growth declined to 4.8 percent in 2014, to 3 percent in 2015 and to 0.6 percent in 2016. In response to unfavourable oil price developments and falling export receipts, Angola’s total reserves declined from US$32 billion in 2013, to US$28.13 billion in 2014, to US$23.79 billion in 2015
and to US$22.21 billion in 2016, or about 32.2 percent over the period. The slump in oil prices, combined with the withdrawal of corresponding banking relationships by global banks and a devaluation of the currency, undermined the Angolan kwanza, causing it to depreciate 31.5 percent in 2015 and over 22 percent in 2016. The Nigerian economy experienced similar developments, with GDP growth declining from 6.3 percent in 2014 to 2.7 percent at the end of 2015 and contracting by 1.8 percent in 2016. Total reserves also declined, from US$45.42 billion in 2013 to about US$25.84 billion by the end of 2016, or about 43.1 percent.
Fiscal pressures associated with tight liquidity on the back of lower oil prices forced most oil-exporting economies to resort to stopgap measures to mitigate the adverse impact of the oil price decline. In addition to increased external borrowing, some African governments (such as Nigeria and Angola) instituted foreign exchange controls, adopted restrictions and rationing of access to and distribution of available foreign currency in order to insulate their domestic currencies from speculative attacks and possible devaluations. In response to the squeeze on foreign exchange reserves triggered by the collapse in oil prices, the Central Bank of Nigeria abandoned the currency peg to the US dollar in favour of a floating arrangement, denting the performance of the Nigerian naira, which depreciated by 52.8 percent in 2016.
To ensure liquidity availability in order to sustain economic growth in the face of contracting global demand, the Central Bank of Nigeria reduced reserve ratios for commercial banks and reduced benchmark rates by 200 basis points. Many governments also

AFREXIMBANK AFRICAN TRADE REPORT 2017 63
resorted to fiscal adjustment through spending cuts to support domestic currencies against growing inflationary pressures emanating from unmet foreign exchange demand. This was the case for monetary authorities in the Central African Economic and Monetary Union, where falling foreign exchange reserves not only severely dented government expenditures but also raised the prospect of a devaluation of the common currency, the CFA franc, which is pegged to the euro
The end of the commodity super-cycle also helped refocus policy makers’ attention on long-term measures aimed at enhancing export diversification and structural transformation to meet the challenge of long-term sustainable growth and currency stability. The overarching intent of policy makers to diversify the continent’s export basket is aptly captured by a statement by the Office of the President of Nigeria: “Nigeria succeeded in making itself a mono-economy over the years due to over-dependence on oil, and President Buhari is determined to ensure that it will no longer remain the same”. The statement resonates with the African Export-Import
Bank’s plan fifth strategic plan, which strongly advocates for diversifying African economies and supporting trade, industrialization and export development strategies within the continent.
Elsewhere, countries are increasingly using non-oil resource endowments to stimulate structural transformation and industrialization of their economies. Angola is exploring the development of its blue economy, leveraging its 1,650 kilometre Atlantic Ocean coastline and its 330,000 square kilometre exclusive economic zone as strategic options for economic diversification. This strategy considers Angola’s traditional trade deficit in fishery products and the thriving market for fish imports in Nigeria, Egypt, Ghana, Côte d’Ivoire and Cameroon. Accordingly, the blue economy is expected to contribute as much as 3 percent to the country’s GDP. This strategy aligns strongly with the African Export-Import Bank’s commitment to promoting the blue economy, particularly because poor logistics remain a key hurdle to African trade, economic development and structural transformation.
In agricultural markets cocoa prices were volatile between January 2015 and December 2016, with two distinct trends. Between January and December 2015 the cocoa market was on the ascendency, with the most sustained bull period in the second quarter of 2015, as the nearby futures cocoa contract on the London intercontinental exchange, the global benchmark for West African physical cocoa, rallied from £1,901 per tonne to £2,169 per tonne, a 14 percent gain, boosted by commercial demand and speculative interest. A more moderate rise was seen in the fourth quarter of 2015,
with prices rallying from £2,132 per tonne to £2,264 per tonne. That rally generated a windfall for African producers, who typically account for over 70 percent of global output and exports.
The rally was attributable largely to El Niño weather, the strongest in nearly two decades according to the Australian Bureau of Meteorology (2015), which lingered for most of the 2015/16 season. Dryness brought about by El Niño curbed rainfall in top cocoa-exporting countries in West and Central Africa, principally in Côte d’Ivoire

64 CHAPTER FIVE AFRICAN TRADE REPORT 2017
but also in Cameroon, and slashed yields in South America, including Brazil and Ecuador, two important cocoa-growing countries. The cocoa market recorded a second consecutive deficit in the 2015/16 season, totalling almost 200,000 tonnes, according to data from the International Cocoa Organization (2017), with global output down nearly 7 percent year on year.
However, as 2015 drew to a close, evidence of growing cocoa stockpiles in importing countries, and the anticipation of wetter La Niña weather over West Africa in the 2016/17 season started to undermine prices. While the market remained fairly supported in the first half of 2016, it was unable to convincingly breach £2,550 per tonne in a sustained manner, as investors cut back on their cocoa positions in anticipation of improved yields. The second half of 2016 saw a precipitous decline in prices, with the market falling nearly 35 percent from the year’s high of £2,577 per tonne, closing the year at £1,732 per tonne and prompting the rating agency Moody’s to acknowledge that the price decline would pressure the economies and fiscal positions of Côte d’Ivoire and Ghana. The drop was due to a healthy recovery in output as soil moisture improved, despite the lingering threat of harmattan weather in West Africa. Data from the International Cocoa Organization (2017) underlines the bearish fundamentals that dominated the cocoa market in 2016, with global cocoa output in the 2016/17 season estimated to rise by 15 percent.
The price of coffee recovered, growing 2.27 percent in 2016 after contracting 20.1 percent in 2015. Volatility in most of the period was influenced by changes in stocks in producing and importing countries, which in turn were affected by weather. Despite the risk of moderately weaker coffee output in the 2015/16 season, markets were pressured lower on account of strong exports from top producer Brazil, reflecting the large inventories it had built in the previous season. A weaker Brazilian
real also put downward pressure on coffee prices, which are denominated in US dollars. Prices ended 2015 down 22 percent from a year earlier for Arabica and 16 percent for Robusta but recovered strongly in 2016, with Arabica prices rallying to a high of 172 US cents per pound in November 2016.
The strength in coffee markets in 2016 was on account of the dry El Niño weather that severely limited global output and, in particular, yields in Southeast Asia, especially Indonesia, in the 2016/17 season. Persistent rainfall in Brazil and sporadic frost in the country slashed Robusta output to its lowest level in 12 years, compelling roasters to scramble for Arabica supplies. In Africa, too, coffee production in Uganda—Africa’s largest exporter—fell by almost a quarter, to 3.2 million bags, far lower than the initial forecast of 4.2 million bags, owing to dry weather. Overall, the global balance stayed tight in 2016/17 and bolstered prices, although the market suffered a decline in December, partly on opportunistic selling by Vietnam. Nevertheless, Arabica and Robusta prices ended the year 20 percent higher on the New York exchange and 50 percent higher on the London exchanges, continuing the rebound of the average coffee price in 2015–16.
Tea prices were cyclical over the two-year period, rallying strongly in the first half of 2015 partly on account of a shortfall in the market from weak output in Kenya, the third-largest tea producer, before paring some of the gains in the second half of 2015 as supply concerns eased. Prices remained on a downward trajectory, with a year-on-year decline of 2.6 percent in 2016, continuing the declines of 4.9 percent in 2014 and 0.37 percent in 2015, reflecting increased production and supplies from Bangladesh, India and Sri Lanka, three of the world’s largest tea producers. This coincided with a fall in demand stemming from difficulties in some countries in the Middle East, especially Iraq, Syria and Yemen, where the bulk of tea from major producing

AFREXIMBANK AFRICAN TRADE REPORT 2017 65
countries is exported. The contraction in global demand was also affected by market disruptions in Russia, Turkey and Ukraine—three major export destinations—where socio-economic difficulties and currency depreciation undermined imports and contributed to lower prices.
Rubber prices recovered slightly in 2016, with growth of 0.73 percent ending two consecutive years of contraction in 2014 and 2015. The market was well supported in the first half of 2015 due to strong US auto sales and investor optimism that China’s economic stimulus package would improve the country’s economy and its demand for commodities. However, a weakening Chinese economy in the second half of the year hurt market sentiment. In addition, maturing trees in Asia boosted latex production, undermining rubber prices in 2015. The decline in prices severely affected rubber farmers in Côte d’Ivoire, which is the fifth-largest rubber producer globally and accounts for over 60 percent of Africa’s rubber exports; many switched to other crops. However, prices improved markedly in 2016—particularly in the second half—fuelled by the recovery in
the crude oil market as members of the Organization of the Petroleum Exporting Countries agreed to cut output by 1.2 million barrels per day for six months. Additionally, floods raised supply concerns in Thailand, which accounts for 37 percent of global natural rubber supply, putting upward pressure on prices in 2016. Further, according to the Association of Natural Rubber Producing Countries (Bloomberg, 2017), the global supply of natural rubber fell 0.6 percent in 2016 while demand grew 3.2 percent, creating an annual deficit of around 655,000 tonnes.
Cotton prices ended 2015 softer, declining 15.3 percent after an 8 percent decline in 2014. Despite the market breaking above 65 US cents per pound at the start of 2015, it was unable to maintain those gains as initially supportive fundamentals turned bearish towards the end of the year. Although global production for the 2015 season was 119 million bales, relatively unchanged from the previous year, demand was sluggish, particularly from China, and resulted in a build-up of stocks, taking the global stocks-to-use-ratio from 94 percent to 100 percent and weighing on prices.

66 CHAPTER FIVE AFRICAN TRADE REPORT 2017
Additionally, global mill use for cotton remained below its long-run average, as use remained undermined by low polyester prices relative to cotton and by teething problems associated with China’s transition to new cotton policies.
In 2016 the cotton market rallied strongly, with average prices rising as much as 5.8 percent. The upturn stemmed from production shortfalls in key producing countries, especially India, which suffered from sharply lower yields on account of poor soil moisture, and China, where plantings dropped after a cut to government cotton price support. Stronger fundamentals in the cotton market benefited top African cotton producers, especially Mali, which not only enjoyed a bumper harvest in 2016 but also saw renewed demand interest from China, culminating in an agreement with that country to build spinning mills to produce fibre aimed at the Chinese and North African markets. Global demand remained robust, creating a disequilibrium between worldwide supply and demand that helped lift prices in 2016.
Average nominal prices of sugar, which contracted 5.1 percent in 2014 and 18.9 percent 2015, rebounded strongly in 2016, gaining 33.3 percent as prospects for weaker global output emerged in the second half of the season, reversing hitherto bearish fundamentals. The rise in prices was also caused by El Niño weather vagaries—disruptive rains in Brazil (the world’s largest sugar producer) and dry weather in South Asia and Southeast Asia, limiting cane yields. The sugar rally hurt Africa’s commodity terms of trade because the continent is a net importer of more than 10 million tonnes of sugar, with the largest importers in the region—Morocco, Algeria, Egypt, Nigeria and Sudan—the most affected. According to data from the International Sugar Organization (Bloomberg, 2016), global production in 2015–16 trailed consumption by 6.7 million tonnes, further supporting prices.
Soybean prices trended lower in 2015, ending the year down 20.7 percent (after an 8.7 percent fall the previous year), attributable to ample stocks and strong global production. World production of soybeans rose by over 13 percent owing to increased acreage and yields in the United States, Brazil and Argentina, which together account for around 80 percent of production. Although global imports and consumption also climbed, the increase was less than that of output, keeping the market bearish.
However, in 2016 fundamentals in the market tightened on a fall in global output of around 2 percent, which contrasted with rising consumption, particularly from China. According to the US Department of Agriculture (2017), global soybean output fell from 320 million tonnes in 2015 to 313 million tonnes, largely on account of a sharp drop in Argentina’s production that was due primarily to floods. China raised its consumption of soybeans from 87 million tonnes in 2015 to 97 million tonnes, which ate into global stocks a little and exerted upward pressure on prices, which ended the year 4.1 percent higher.
The maize market recovered in 2016 with an average nominal price gain of 3.1 percent after losses of 25.6 percent in 2014 and 11.9 percent in 2015. The contractions stemmed from comfortable supplies reflecting a massive build-up in stocks as good weather improved growing conditions and yields in China, Argentina, Brazil and the United States (which together account for more than 65 percent of global production) and more than offset the fall in production in the European Union, where adverse weather conditions dampened yields and output in the 2015/16 season. The glut in stocks was particularly evident in China and the United States, with end-season stocks rising 20 percent in China and 40 percent in the United States. Further, good harvests in major producing but net importing countries in Africa, including Egypt (which is among the

AFREXIMBANK AFRICAN TRADE REPORT 2017 67
crop’s top five global importers), Malawi and Nigeria, more than outweighed the decline in production in South Africa and was bearish for prices.
The trend in the average nominal price of wheat has been to the downside over the last three years, with a loss of 18.1 percent in 2016, after previous losses in 2014 and 2015. As a key ingredient in many staple foods, declining prices have been a boon for wheat importers in the region, notably Egypt and Nigeria. The sustained decline in prices in 2015–16 derived from large excess supply driven by persistent high stocks and robust production in several major wheat-producing countries, including the United States, where favourable weather conditions encouraged planting and improved harvests in major wheat-producing states. According to data from the US Department of Agriculture (2017), global wheat output expanded by 13 million tonnes to 728 million tonnes in the 2014/15 season and again by 7 million tonnes in the 2015/16 season, while global consumption struggled to keep pace with
supply, leading to downward pressure on prices in the 2015/16 season.
Among the group of fats and oils, the palm oil market followed a pattern similar to some other agricultural commodities in 2015–16, first slumping in both 2014 and 2015 before recovering strongly, with an average nominal price gain of 12.4 percent in 2016. The bearishness of the palm oil market in 2015 was due to firm global output, with production up by around 2 million tonnes owing to strong yields in Indonesia, where production increased to 33 million tonnes from 30.5 million tonnes the previous season. (Indonesia and Malaysia together account for over 85 percent of global output.) This rise helped boost global stocks by around 500,000 tonnes. However, production surpluses were reversed in 2016, pulling the futures market in Kuala Lumpur 25 percent higher over the course of the year and pushing up import costs in Africa, which bought more than 5 million tonnes of palm oil a year in 2015–16. Price momentum was due to the lagged impact of dry El Niño

68 CHAPTER FIVE AFRICAN TRADE REPORT 2017
weather in Southeast Asia in 2014/15, which cut palm oil yields in the region even though production in Africa remained flat. The supply shortfalls raised fears that export demand would not be met. Nigeria, Africa’s largest palm oil consumer, drew down significantly on its domestic stocks in the season, with end-season stocks put at 40,000 tonnes, down from 138,000 tonnes 12 months earlier. Additionally, Indonesia’s decision to raise the amount of palm oil blended with diesel to 20 percent from 15 percent provided a strong boost to prices in 2016.
The price of copra also trended downward, culminating in a 14 percent decline in 2015 after a significant gain in 2014. The decline arose largely from strong production in the Philippines, Indonesia and India—the largest suppliers—which increased availability against weaker demand from major consuming markets, including the European Union and the United States. However, in 2016 prices reversed and made strong gains, with prices in the Philippines rallying as much as 60 percent, attributable to the growth in
specialty use of coconut, including coconut water and coconut sugar, due to their perceived health benefits. Supply of copra and coconut oil dropped as farmers opted for younger coconuts for specialty use, which pushed coconut oil and copra prices higher.
The group of metal/minerals commodities suffered a bearish year in 2015, posting significant losses owing largely to increased production capacity, subdued demand led by a slowing Chinese economy and most developed economies, and a strengthening US dollar. Prices subsequently recorded steep gains in 2016 on the back of emerging supply concerns, signs of a pick-up in demand from China and expectations of strong demand from the United States as the new administration revealed ideas to modernize US infrastructure.
Copper prices continued their vertiginous decline through 2015 and by the end of the year reached their lowest level since 2009. The descent in prices was due largely to waning demand from electronic,

AFREXIMBANK AFRICAN TRADE REPORT 2017 69
construction and automobile industries in China, reflecting the country’s strategy to move away from an economy based on infrastructure investment and heavy industry to one relying on consumption and services (IMF 2016). China accounts for around 50 percent of global copper demand. Increases in new supply capacity and still strong stockpiles globally also contributed to dampening prices. And because copper prices are denominated in US dollars on major exchanges, dollar strength undermined demand. Copper prices had seemingly bottomed out at the start of 2016 as disruptions to copper projects raised the risk of a market deficit, but prices dropped for most of 2016 and failed to reverse owing to weaker than expected global demand, resulting in a price loss of 11.7 percent by year end.
Gold prices were bearish for most of 2015 and finished the year with an 8.3 percent loss, after a decline of 10.4 percent in 2014. Still, many investors continued viewing gold as a “safe haven” asset. The falling price reflected a strong dollar, which signalled a gradual revival of the US economy, raised the prospect of higher interest rates and undermined the price of the precious metal. In addition, the agreement between members of the Eurozone on the Greek debt crisis—mitigating the risk of a messy default by Greece and its exit from the Eurozone—also raised confidence for the bloc and made gold less attractive. Weak demand from China, the main consumer of gold, also put pressure on prices in 2015.
In 2016, though, the market rebounded strongly, with a price gain of 18.1 percent by year end, due mainly to a weaker US dollar, buoyant investor demand and sustained demand from the Chinese Central Bank, which prompted renewed investor interest in Africa’s gold-mining industry and boosted prospects for intra-African trade. In Ghana, Africa’s second-largest gold exporter, the South African mining firm Gold Fields committed to investing US$1.4 billion in
the Damang mine over eight years, while Canada’s Roxgold continued to expand its activities in Burkina Faso, where gold output in 2016 rose 40 percent year on year.
The price of aluminium fell 10.9 percent in 2015 from the modest gains realized in 2014. In 2016 the market was unable to reverse the downward trend and ended the year with a price loss of 3.7 percent. The slump in prices in 2015 was due to strong growth in global production, led by China, which accounts for about 55 percent of global aluminium output, combined with high stockpiles on the market. A strong US dollar, coupled with the decelerating Chinese economy and slow pace of growth in Western Europe and other developed economies, depressed demand, thus creating a supply–demand imbalance. Weak global demand (notably lower than expected growth in the Chinese economy) in the face of strong supply and huge stockpiles were responsible for the price loss in 2016.
Zinc prices also lost steam in 2015, with a sharp year-on-year decline of 10.6 percent, reversing the significant price gain made in 2014. The retreat in the price was driven mainly by subdued global demand on account of the slowdown in China and slow infrastructure spending in other developing economies, partly reflecting capital outflows. The market recouped most of these losses in 2016 on improving market fundamentals in the Chinese economy, especially in the light of the country’s continued implementation of massive stimulus to boost growth. In addition, the probability of an expansionary fiscal policy in the United States under President Donald Trump and the likelihood of a supply deficit on the market, given production shortfalls, helped lift prices in 2016.
The nominal prices of lead and tin maintained their downward trends, retreating 14.7 percent and 26.6 percent, respectively, in 2015. Behind the price declines were waning demand sparked by a

70 CHAPTER FIVE AFRICAN TRADE REPORT 2017
strong US dollar and concerns over growth in China (the largest producer and consumer of lead), intensified by that country’s shift from manufacturing (which requires considerable use of lead) to a domestic consumption and service-based economy. Oversupply in the tin market due to huge stockpiles, built up in part with the opening up of the economy of Myanmar—one of the world’s largest tin producers—along with still-robust exports from Indonesia depressed tin prices in 2015.
In 2016 lead prices recovered, buoyed by rising global demand as consumption in China, Europe and the United States expanded on increased use in the automotive and telecommunications sectors, though this was balanced partly by a reduction in demand in the e-bike market resulting from slower sales growth and competition from lithium-ion batteries, which are increasingly gaining ground as off-grid renewable energy-storage solutions. Global lead demand outpaced production as mine output was dented by a decline in production from major producers such as Australia. Tin prices surged in 2016 on the
back of a modest recovery in the Chinese solder market. (Soldering accounts for the largest share of tin use globally.) Tin prices were also supported by a sharp decline in pipeline stocks held by industry users, according to a survey by the International Tin Research Institute.
Prices of platinum and silver also continued their downward movements, with year-on-year declines of 23.9 percent and 17.6 percent, respectively, in 2015. The price of platinum fell because of weak demand from the automotive industry, particularly in Europe, where diesel cars make up 50 percent of the car market,1 and the rise of anti-diesel sentiment in Europe in favour of a cleaner environment. The price of platinum rebounded in 2016 principally because of a surge in speculative and investor demand that was further reinforced by slower mine
1 This was fuelled by a scandal at the car
manufacturer Volkswagen, which fitted its
diesel cars with software that made the engine’s
emissions appear far lower (to regulators) than
they in fact were.

AFREXIMBANK AFRICAN TRADE REPORT 2017 71
output. Despite the presence of large above-ground inventories, output from South Africa, which accounts for 80 percent of platinum production, fell more than expected due to difficult wage negotiations with mine workers. Additionally, strong auto-catalyst demand and improving global sentiment contributed to a more bullish platinum market in 2016.
The decline in silver prices in 2015 came from a strong US dollar and persistent weakness in the Chinese economy, which depressed demand in the face of strong supply. But like platinum, the metal staged a strong recovery in 2016, also due to the recovery in speculative and investor demand and to a supportive macroeconomic environment for precious metals, resulting partly from falling US real interest rates. On a fundamental basis, silver mine production fell in 2016 after being stable in 2015, although stronger scrap supply, triggered by high prices, and weaker industrial demand capped the upside.
The downward trend in the nominal price of crude oil accelerated, with prices falling 47.2 percent in 2015 after an 11.6 percent
decline in 2014, as global supply continued to outpace global demand, weakened by slower growth in China. The context of weaker oil prices was exacerbated in Africa by declining production in 2015–16. US International Energy Statistics data show that Africa’s oil output fell around 1 percent in 2015 and 5 percent in 2016, as rising Angolan production (in 2015 especially) was offset by supply disruptions in Nigeria and Libya, helping reduce Africa’s share of global oil output from 9.3 percent in 2014 to 8.9 percent in 2015 to 8.4 percent in 2016. Firm production of shale gas oil in the United States and Canada and strong oil production from members of the Organization of the Petroleum Exporting Countries bloated global inventories in both crude oil and oil products, slowing market momentum. And although prices staged a late recovery in the fourth quarter of 2016 after the decision of members and non-members to limit production, the fall-out from sustained weak energy prices eroded foreign exchange reserves for the region’s energy exporters, created severe terms-of-trade shocks and stifled growth prospects in Angola and Nigeria, which also suffered its first recession in over two decades in 2016.
END

6Chapter Six

AFREXIMBANK AFRICAN TRADE REPORT 2017 73
Rising Protectionism in Global Trade
The volume of world merchandise trade has tended to grow faster than world output, yet after the global financial crisis in 2007/08, trade and world output have shown similar sluggish performance. Lacklustre growth of world trade, 2.7 percent in 2015, continued in 2016 at 1.3 percent, compared with global output growth of 3.1 percent—the first time since 2001 that the two indicators did not have the same growth rate (WTO 2017). Weak growth in the volume of merchandise trade in 2016 is attributable to cyclical factors as economic activity slowed globally and deeper structural changes in the relationship between trade and economic output.
The most trade-intensive components of global demand were particularly weak last year as China continued to rebalance its economy, growth in Europe remained anaemic, investment spending slumped in the United States and commodity prices stayed lower throughout the year. Against a weak international trade backdrop, the temptation to undertake protectionist measures was high, particularly among Group of 20 (G20) countries (which include major industrialized and developing countries and account for around 85 percent of world merchandise trade), in the face of already weak global demand after the global financial crisis. Amid rising anti-trade and anti-globalization sentiment, especially in the United States and Europe, the threat of protectionism and inward-looking policies has become more pronounced.
While different from the protectionism of the 1930s after the Great Depression, which saw the imposition of large tariff increases, import quotas and competitive devaluations, the recent approach reflects creeping protectionism. One of the reasons for the decline in traditional protectionist measures is that, unlike in the 1930s, when the gold standard limited the ability of countries to let their exchange rate fall, countries today can do so when confronted with macroeconomic challenges. Another reason is that conventional measures such as tariffs and quotas, while still widely employed, have been constrained by disciplines imposed by the World Trade Organization (WTO), which since its creation in 1995 has regularly seen competing trading countries bring cases to it and respect its rulings. The return to protectionism in recent years has been characterized by creeping protectionism in different guises, using conventional and non-conventional measures.
The WTO, which concentrates on measures designed to keep out imports—import tariffs, anti-dumping duties, countervailing duties, quantitative restrictions, safeguards, sanitary and phytosanitary measures, special safeguards, technical barriers to trade, tariff-rate quotas, export subsidies and other regulatory or customs procedures—reports that the increase in measures introduced and the slow pace of eliminating measures saw the stock of trade-restrictive measures grow by over 380 percent, from 424 measures in 2010 to

74 CHAPTER SIX AFRICAN TRADE REPORT 2017
2,238 measures in mid-October 2016 (WTO 2016a). Trade-restrictive measures by G20 countries grew 290 percent from October 2010 (324 measures) to October 2016 (1,263 measures; Figure 6.1). According to the WTO, G20 countries introduced an average of 19 trade restrictive measures per month in 2016 and account for about 57 percent of trade-restrictive measures in place globally.
Widening the definition of protectionist measures to include non-conventional protectionist measures results in a significantly higher number of measures and demonstrates the extent to which creeping protectionism has become a feature of global trade in recent years. Global Trade Alert, a monitoring service operated by the London-based Centre for Economic Policy Research, defines protectionism more broadly to include any measure that discriminates against foreign commercial interests. By this definition protectionism includes government bailouts of domestic companies, wage subsidies, export and value-added tax rebates, localization requirements, export taxes, export credits and financing from state-owned banks, investment measures, and public procurement measures. Under this wider
definition, the Global Trade Alert database estimates that since 2010, 4,279 measures that discriminate against foreign commercial interests have been implemented globally (Figure 6.2). G20 countries accounted for around 79 percent of those measures, and almost 80 percent of those measures were launched against other G20 countries.
Figure 6.1 Stock of trade restriction measures and number of trade restriction measures removed in Group of 20 countries, October 2010–October 2016
Source: OECD, WTO and UNCTAD (2016) and World Trade Organization Non-Tariff Measures Database.
Figure 6.2 Number of measures implemented that discriminate against foreign commercial interests, 2010–16
Source: Global Trade Alert Database
1400 -
600 -
1000 -
200 -
1200 -
400 -
800 -
0 -
800 -
0 -
200 -
400 -
600 -
100 -
300 -
500 -
700 -
201
0
oct-
10
oct-
12
oct-
14
oct-
11
oct-
13
oct-
15
may
-11
may
-13
may
-15
may
-12
may
-14
may
-16
oct-
16
201
2
201
5
201
1
201
4
201
3
201
6
Stock of Measures
Measures Removed

AFREXIMBANK AFRICAN TRADE REPORT 2017 75
6.1 Protectionist Measures by Type
Governments have recourse to conventional and non-conventional measures to restrict or protect trade. The most commonly used in recent years were state-aid measures; trade-restrictive and defence measures such as anti-dumping duties, countervailing duties and safeguards; and import tariffs. Other widely used measures to discriminate against foreign commercial interests include trade finance measures, product standards and technical regulations, localization requirements, public procurement measures, export incentives and investment measures (all of which are discussed in further detail below).
According to Global Trade Alert data, in 2015–16 the most widely used measures were state aid, trade defence measures, import tariffs and trade finance measures, which collectively accounted for 68 percent of the measures implemented globally (Figure 6.3).
6.2 State Aid
State-aid measures refer to any advantage—granted by public authorities through state resources on a selective basis to an organization—that could distort competition and trade. The definition is very broad because an advantage can take many forms but is considered so by virtue of the characteristic of not being able to be acquired on the open market.
Examples of state aid include grants to firms for investment, research and development, employee training and the like; the provision of loans and guarantees below market rates; cash injections to, and writing off losses of, public enterprises; sale or lease of public land or property at discounted rates; selective promotion of local companies using public funding; restrictions on competitive tendering; discretionary deferral of or exemption from tax, social security and other payments to the state; legislation to protect or guarantee market share; and public funding of privately owned infrastructure.
In 2015–16 state aid was the most widely used measure to discriminate against foreign commercial interests. Global Trade Alert data indicates that 355 such measures were implemented over the period, 86 percent of them by G20 countries. Russia ranked first, with 76 measures, followed by the United States (43), Japan (38), France (25) and Germany and Italy (20 each). State aid covered a range of sectors, from agriculture and infrastructure to finance and heavy industry. In Africa, Nigeria and South Africa implemented one state-aid measure each, with Nigeria providing support to its dry-season farming programme and South Africa to its power utility, Eskom.
6.3 Trade Defence Measures
The second most widely used protectionist measure in 2015–16 was trade defence
Figure 6.3 Measures used to discriminate against foreign commercial interests, 2015–16 (%)
Source: Global Trade Alert Database.
30% -
25% -
20% -
15% -
10% -
5% -
0% -
Oth
er
Sub
-nat
iona
l Gov
ernm
ent
Mea
sure
s
Pub
lic P
rocu
rem
ent
Trad
e Fi
nanc
e
Imp
ort
Tari
ff
Inve
stm
ent
Mea
sure
s
Exp
ort
Ince
nti
ve
Loca
lisat
ion
Req
uirm
ents
Trad
e D
efen
ce
Stat
e A
id

76 CHAPTER SIX AFRICAN TRADE REPORT 2017
measures, in the form of anti-dumping duties, countervailing duties and safeguard measures.
An anti-dumping duty is a protectionist measure—usually in the form of a tariff following an investigation—that a government imposes on foreign imports that it believes are priced below fair market value. It can take up to 18 months for an investigation to be concluded, and the initiation of an investigation does not necessarily lead to the imposition of a trade measure, but the number of investigations initiated indicates the likelihood of a rise in measures implemented.
In 2016 there was a decline in investigations initiated and measures implemented, but recourse to anti-dumping measures increased after the global financial crisis, with 2015 seeing the most anti-dumping measures coming into force (Figure 6.4). In 2015–16, 376 anti-dumping investigations were initiated by WTO members, and 268 anti-dumping measures entered into force. G20 countries were responsible for initiating 274 (73 percent) of those anti-dumping investigations and accounted for 188 (70 percent) of those anti-dumping measures entering into force.
The countries initiating the most anti-dumping investigations in 2015–16 were India (77), the United States (66) and Brazil (27), and the countries with the most
anti-dumping measures entering into force were India (54), the United States (23) and Australia (20). The countries most frequently targeted by these measures were China, the Republic of Korea and Japan.
Metal products accounted for the largest share of anti-dumping measures initiated or entering into force (38 percent; Figure 6.5). Steel and steel products accounted for about 92 percent of these metal products anti-dumping measures.
Figure 6.4 Number of anti-dumping investigations initiated and anti-dumping measures entered into force by World Trade Organization members, 2010–16
Source: World Trade Organization Non-Tariff Measures Database.
Figure 6.5 Anti-dumping measures by product, 2015–16
Source: World Trade Organization Non-Tariff Measures
Database.
Metals
Chemicals
Plastics and Rubber
Textiles
Paper
Stone/Plaster
Machinery
and Electrical Equipment
Other
38%
21%
10%
5%
4%
5%
7%
10%
350 -
150 -
250 -
50 -
300 -
100 -
200 -
0 -2010 2012 20142011 2013 2015 2016
Anti-dumping Investigations Initiated Anti-dumping measures entered into force

AFREXIMBANK AFRICAN TRADE REPORT 2017 77
Chemical products were the second most frequent target of anti-dumping measures in 2015–16, accounting for about 21 percent of measures. China was the most frequent target of measures in this sector, and India was the most active in initiating investigations or implementing measures.
Plastics and rubber was the third most frequently targeted sector, and textiles was the fourth. Brazil was the main driver behind the number of measures in the plastics and rubber sector, and India accounted for almost 50 percent of the measures initiated or in force in the textile sector.
The use of anti-dumping measures by African countries remained limited, at 64 (initiated or entering into force) at the end of 2016. Three African countries account for those measures: South Africa (32)1, Egypt (19) and Morocco (13). In 2015–16 Morocco was the most active user of anti-dumping trade measures, initiating six investigations and entering two measures into force, Egypt initiated five investigations and entered two measures into force and South Africa did not initiate any investigations but entered five measures into force.
African countries have had few anti-dumping measures imposed on their exports: 29 at the end of 2016, 62 percent of which target South Africa. The WTO members most active in implementing anti-dumping measures against African countries are India, Brazil, the United States and the European Union, which collectively account for 75 percent of the total implemented against Africa. In 2015–16 South Africa and Egypt were the only countries affected by anti-dumping measures: with two investigations initiated and five measures entered into force.
1 Trade defence measures, initiated or applied
by or against South Africa are applicable to the
Southern African Customs Union member states:
Botswana, Lesotho, Namibia, South Africa and
Swaziland.
Countries are also increasingly having recourse to countervailing measures, with 2015 seeing the most countervailing measures investigations initiated since the WTO was set up (Figure 6.6). To encourage exports, many governments grant subsidies to exporters, which results in decreased costs of production that distort global trade. To counterbalance this, the WTO allows importing countries to impose a duty, called a countervailing duty, on imported goods to raise the price of the subsidized product and offset its lower price. The use of countervailing duties therefore provides an insight into the degree of trade-distorting subsidies and domestic support provided to protect exporters.
While 2016 saw a decline in the number of investigations initiated and measures implemented, recourse to countervailing measures has increased since the global financial crisis. In 2015–16, 51 countervailing investigations were initiated by WTO members, and 26 countervailing measures entered into force. G20 countries were responsible for initiating over 98 percent of those countervailing investigations (92 percent of which were against other G20 countries) and accounted for 92 percent of the measures that entered into force (96 percent of which were against other G20 countries).
The United States was both the leading initiator of countervailing investigations (35) and implementer of countervailing measures (13) in 2015–16. The country most often targeted was China, with 47 percent of countervailing investigations initiated and countervailing measures entering into force. Metal products, specifically steel, accounted for the largest share of countervailing measures, with most countervailing investigations conducted concurrently with anti-dumping investigations related to the same product. Plastics and rubber was the second most frequently targeted sector, followed by paper.
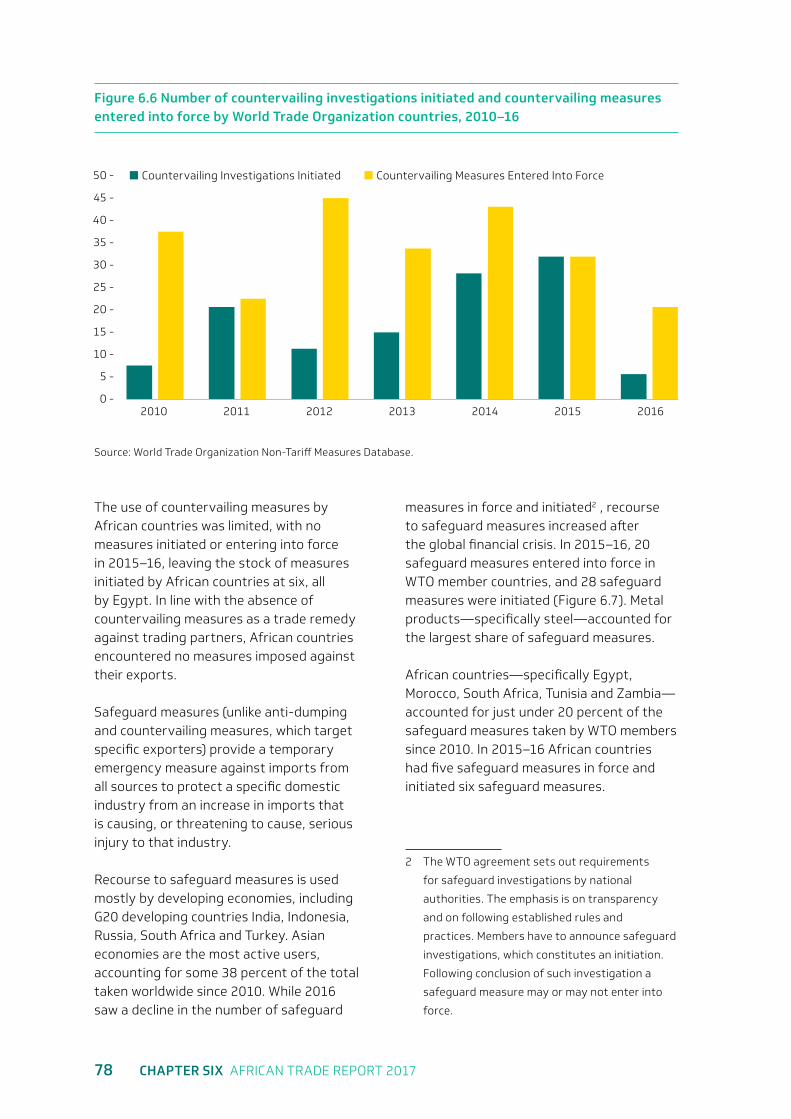
78 CHAPTER SIX AFRICAN TRADE REPORT 2017
The use of countervailing measures by African countries was limited, with no measures initiated or entering into force in 2015–16, leaving the stock of measures initiated by African countries at six, all by Egypt. In line with the absence of countervailing measures as a trade remedy against trading partners, African countries encountered no measures imposed against their exports.
Safeguard measures (unlike anti-dumping and countervailing measures, which target specific exporters) provide a temporary emergency measure against imports from all sources to protect a specific domestic industry from an increase in imports that is causing, or threatening to cause, serious injury to that industry.
Recourse to safeguard measures is used mostly by developing economies, including G20 developing countries India, Indonesia, Russia, South Africa and Turkey. Asian economies are the most active users, accounting for some 38 percent of the total taken worldwide since 2010. While 2016 saw a decline in the number of safeguard
measures in force and initiated2 , recourse to safeguard measures increased after the global financial crisis. In 2015–16, 20 safeguard measures entered into force in WTO member countries, and 28 safeguard measures were initiated (Figure 6.7). Metal products—specifically steel—accounted for the largest share of safeguard measures.
African countries—specifically Egypt, Morocco, South Africa, Tunisia and Zambia—accounted for just under 20 percent of the safeguard measures taken by WTO members since 2010. In 2015–16 African countries had five safeguard measures in force and initiated six safeguard measures.
2 The WTO agreement sets out requirements
for safeguard investigations by national
authorities. The emphasis is on transparency
and on following established rules and
practices. Members have to announce safeguard
investigations, which constitutes an initiation.
Following conclusion of such investigation a
safeguard measure may or may not enter into
force.
Figure 6.6 Number of countervailing investigations initiated and countervailing measures entered into force by World Trade Organization countries, 2010–16
Source: World Trade Organization Non-Tariff Measures Database.
30 -
50 -
25 -
45 -
20 -
40 -
15 -
35 -
10 -
5 -
0 -2010 2011 2012 2013 2014 2015 2016
Countervailing Investigations Initiated Countervailing Measures Entered Into Force

AFREXIMBANK AFRICAN TRADE REPORT 2017 79
6.4 Import Tariff Measures
Although the prevalence of import tariffs as a protectionist instrument has declined given the disciplines imposed by multilateral trade rules under the WTO, they remain an important and widely used instrument to protect trade and raise revenues. According to Global Trade Alert data, since the global financial crisis, import tariffs have been the third most popular instrument to discriminate against foreign commercial interests, with an estimated 605 import tariff measures implemented since 2010 (Figure 6.8), 443 (73 percent) of them by G20 countries.
Global Trade Alert reports that in 2015–16, 135 import tariff measures were implemented globally. The leading countries implementing import tariff measures were Sri Lanka, the Southern African Customs Union (comprising Botswana, Lesotho, Namibia, South Africa and Swaziland), the United States, Argentina, Pakistan, India, Turkey and China, and G20 countries as a group were responsible for 66 percent of the import tariff measures implemented. Given that tariff increases affect all countries because the measures are applied equally, all African countries—except those that enjoy preferential market access to certain markets—were affected.
Other African countries also implemented import tariff measures, notably Egypt, which sharply raised customs duties on more than 300 goods to encourage domestic production and curb a ballooning trade deficit. Angola introduced large hikes in the Consumption Tax Regulation and the General Customs Tariff on imported alcohol, beverages and tobacco. Looking to boost local production, Nigeria raised import duties on luxury goods and consumable items that have local substitutes, including sports utility vehicles, alcohol, sugar, rice, cotton and salt.
The period 2015–16 also saw the removal of tariff preferences under preferential trade
Figure 6.7 Number of safeguard measures in force and safeguard measures initiated by World Trade Organization members, 2010–16
Source: World Trade Organization Non-Tariff Measures Database.
Figure 6.8 Number of tariff measures implemented, 2010–16
Source: Global Trade Alert Database.
120 -
40 -
80 -
100 -
20 -
60 -
0 -2010 20142012 20162011 20152013
30 -
25 -
20 -
15 -
10 -
5 -
0 -2010 2011 2012 2013 2014 2015 2016
Safeguard Measures in Force
Safeguard Measures Initiated

80 CHAPTER SIX AFRICAN TRADE REPORT 2017
arrangements. The European Commission announced that effective 1 January 2015 it would drop China, Ecuador, the Maldives and Thailand from the list of countries eligible for tariff preferences under the Generalized System of Preferences, as the World Bank has classified them as upper-middle-income countries. Similarly, effective 1 January 2015 Canada removed 72 countries and territories from beneficiary status under its General Preferential Tariff programme, including Algeria, Botswana, Equatorial Guinea, Gabon, Mauritius, Namibia, Seychelles, South Africa and Tunisia, to concentrate the remaining preferences on the least developed countries.
6.5 Standards and Technical Barriers to Trade
With the decline in the use of tariffs, behind-the-border non-tariff trade measures such as standards, technical regulations or conformity assessment procedures have gained prominence. These non-tariff barriers often aim to protect human, plant and animal health—through sanitary and phytosanitary measures—as well as the environment, consumers and national security—through technical barriers to trade—but may also discriminate against imports and therefore restrict trade and cause market distortions.
When standards or technical regulations are not well targeted or scientifically underpinned, they can be used to unduly restrict or distort trade. Given that they often entail high compliance costs, especially for companies operating in different markets, producers in developing countries face considerable challenges in meeting product standards and overcoming these non-tariff barriers because they often lack the capital and the technical and institutional capacity to comply with emerging standards, regulations and conformity assessments.
The use of product standards and technical barriers to trade has become more
pervasive, with the WTO Non-Tariff Measure database reporting that, since 2010 more than 18,000 sanitary and phytosanitary and technical barriers to trade measures have been notified and more than 4,500 measures have entered into force. Of these, 382 have raised specific trade concerns among WTO members.
In 2015–16, 611 sanitary and phytosanitary measures and 928 technical barriers to trade measures were implemented, and 96 specific trade concerns related to sanitary and phytosanitary and technical barriers to trade measures were raised at the WTO. The leading countries having recourse to sanitary and phytosanitary measures were the United States (17 percent), the Philippines (13 percent), Saudi Arabia (10 percent) and the European Union (5 percent). Only 16 (3 percent) of the sanitary and phytosanitary measures implemented by WTO members were from African countries: Egypt (10), Morocco and South Africa (2 each), and Cabo Verde and Madagascar (1 each).
The leading countries implementing technical barriers to trade in 2015–16 were the United States (22 percent), Ecuador (10 percent), Egypt (9 percent) and China (8 percent). African countries, led by Egypt, Kenya and South Africa, accounted for 15 percent of the technical barriers to trade implemented.
6.6 Trade Finance Measures
Trade finance, especially in the form of export credits, is the lifeline of the global trade system. Through borrowing from the treasury or capital markets, national export credit agencies use such funds to finance exports. The Organisation for Economic Co-operation and Development and several BRICS3 governments extend guarantees or long-term export credits to allow purchasers, particularly in developing
3 Brazil, Russia, India, China and South Africa.

AFREXIMBANK AFRICAN TRADE REPORT 2017 81
countries, to defer payment for costly capital goods. Protectionism concerns raised by export credits arise from the fact that many governments subsidize these credits to promote exports. Official support can take the form of guarantees or insurance for bank loans or direct government finance, such as direct loans, interest rate subsidies or public refinancing. Recognizing the trade-distortionary impacts of export credits, Organisation for Economic Co-operation and Development governments entered into the Arrangement on Officially Supported Export Credits, which limits the conditions under which credits may be granted, provides for the automatic adjustment of those conditions in response to changes in domestic capital markets and foreign exchange rates and provides for mandatory exchange of information on credit practices.
Yet recent years have seen an increase in business conducted outside the arrangement, with unregulated credit from Organisation for Economic Co-operation and Development countries estimated to exceed US$110 billion and that from China, India, Russia and Brazil (and to some degree South Africa) estimated to exceed US$70 billion in 2013. Global Trade Alert data shows that 105 trade finance measures implemented in 2015–16 were discriminatory against foreign commercial interests, with the leading countries the United Kingdom, India, Japan, Russia and Italy. African countries’ use of such measures in this way is low, with none recorded in the period, although several were beneficiaries of export credits from other countries, especially India, which in 2015–16 extended loans and buyer credits conditional on inputs and minimum contract values being sourced from Indian suppliers.
6.7 Other Protectionist Measures
Some of the other most popular measures in recent years have been localization and public procurement requirements (see Box 6.1), which aim to favour domestic over
foreign industries. Global Trade Alert data reveals that more than 535 such measures have been implemented since 2010, almost a third since January 2015.
These measures include local content requirements (requirements to purchase domestically manufactured goods or domestically supplied services); subsidies or other preferences that are received only if producers use local goods, locally owned service providers, or domestically owned or developed intellectual property; requirements to provide services using local facilities or infrastructure and the like; and public procurement measures that either provide incentives for local procurement or restrict foreign procurement.
Global Trade Alert data shows that 91 localization and 92 public procurement requirements were implemented globally in 2015–16, 96 percent of them by G20 countries. The countries most often adopting localization requirements were India, Brazil and the United Kingdom, and the country most often using public procurement measures was the United States, under its Buy-American rules.
6.8 Trade Disputes
Resolving trade disputes is one of the core activities of the WTO. A dispute arises when a member government believes that another member government is violating an agreement or a commitment that it has made in the WTO. The WTO has one of the most active international dispute settlement mechanisms in the world. Since 1995 more than 500 disputes have been brought to the WTO, and more than 350 rulings have been issued. The most active users of WTO’s Dispute Settlement Unit since its founding in 1995, excluding disputes joined as third parties, are the United States, with 112 complaints and 129 respondent cases, and the European Union (with 97 complaints and 83 respondent cases).
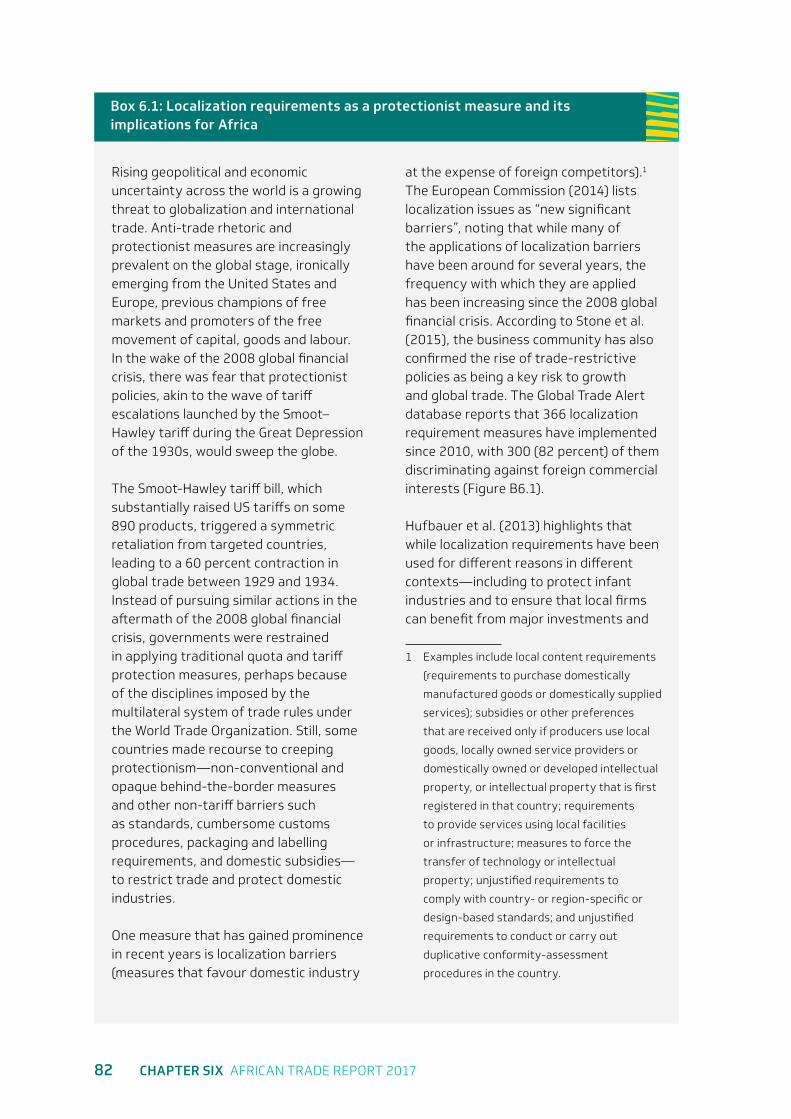
82 CHAPTER SIX AFRICAN TRADE REPORT 2017
Rising geopolitical and economic uncertainty across the world is a growing threat to globalization and international trade. Anti-trade rhetoric and protectionist measures are increasingly prevalent on the global stage, ironically emerging from the United States and Europe, previous champions of free markets and promoters of the free movement of capital, goods and labour. In the wake of the 2008 global financial crisis, there was fear that protectionist policies, akin to the wave of tariff escalations launched by the Smoot–Hawley tariff during the Great Depression of the 1930s, would sweep the globe.
The Smoot-Hawley tariff bill, which substantially raised US tariffs on some 890 products, triggered a symmetric retaliation from targeted countries, leading to a 60 percent contraction in global trade between 1929 and 1934. Instead of pursuing similar actions in the aftermath of the 2008 global financial crisis, governments were restrained in applying traditional quota and tariff protection measures, perhaps because of the disciplines imposed by the multilateral system of trade rules under the World Trade Organization. Still, some countries made recourse to creeping protectionism—non-conventional and opaque behind-the-border measures and other non-tariff barriers such as standards, cumbersome customs procedures, packaging and labelling requirements, and domestic subsidies— to restrict trade and protect domestic industries.
One measure that has gained prominence in recent years is localization barriers (measures that favour domestic industry
at the expense of foreign competitors).1 The European Commission (2014) lists localization issues as “new significant barriers”, noting that while many of the applications of localization barriers have been around for several years, the frequency with which they are applied has been increasing since the 2008 global financial crisis. According to Stone et al. (2015), the business community has also confirmed the rise of trade-restrictive policies as being a key risk to growth and global trade. The Global Trade Alert database reports that 366 localization requirement measures have implemented since 2010, with 300 (82 percent) of them discriminating against foreign commercial interests (Figure B6.1).
Hufbauer et al. (2013) highlights that while localization requirements have been used for different reasons in different contexts—including to protect infant industries and to ensure that local firms can benefit from major investments and
1 Examples include local content requirements
(requirements to purchase domestically
manufactured goods or domestically supplied
services); subsidies or other preferences
that are received only if producers use local
goods, locally owned service providers or
domestically owned or developed intellectual
property, or intellectual property that is first
registered in that country; requirements
to provide services using local facilities
or infrastructure; measures to force the
transfer of technology or intellectual
property; unjustified requirements to
comply with country- or region-specific or
design-based standards; and unjustified
requirements to conduct or carry out
duplicative conformity-assessment
procedures in the country.
Box 6.1: Localization requirements as a protectionist measure and its implications for Africa

AFREXIMBANK AFRICAN TRADE REPORT 2017 83
Figure B6.1. Number of localization measures that discriminate against foreign commercial interests, 2010–16
Source: Global Trade Alert database.
new business created by large foreign or domestic firms—the recent increase in localization requirements is driven primarily by the powerful appeal to create jobs domestically in a context of sharpening competition in the global trade arena and widening income inequality and declining real wages in developed economies. Since 2010, Group of 20 countries have accounted for 89 percent of the localization requirements that discriminate against foreign commercial interests.
International Chamber of Commerce (2013) cautions that while governments view localization requirements as beneficial to their domestic economy, localization policies fundamentally distort the global trade system, affecting both the countries against which they are targeted and the countries implementing them. In particular, localization requirements increase the cost structure of firms and the complexity of doing
business in a country; raise the costs of key capital goods (especially information and communication technologies) and important raw materials and equipment; reduce choices for businesses and consumers; discourage innovation by reducing intellectual property protection; affect the implementing country’s reputation and investment attractiveness; and isolates the country from the global economy. In other words, while traditional tariff and quota measures have not been used as much as might have been expected in the aftermath of the global financial crisis, the increase in localization requirements presents a new form of beggar-thy-neighbour trade policy by forcing production in one country at the expense of production in other countries, which may in turn encourage third countries to pursue their own localization policies and in the process undermine global trade.
Implications for Africa
The contraction of African trade over the last few years can be attributed partly to the rise of protectionist measures, including localization requirements, because they constrain global demand from Africa and other leading African export markets. By insulating domestic markets from foreign trade and investment, localization requirements negatively affect imports in applying countries and global value chains. Localization requirements thus have the potential to adversely impact global and African trade both directly, through limiting access into export markets, and indirectly, by dampening demand for Africa’s exports, and could ultimately undermine ongoing efforts to enhance the integration of African economies into global value chains.
60 -
30 -
40 -
10 -
50 -
20 -
0 -
2010 2012 20142011 2013 2015 2016

84 CHAPTER SIX AFRICAN TRADE REPORT 2017
For instance, the application of localization requirements under the “Buy American, Hire American” policy advocated by US President Donald Trump’s administration may eliminate some preferences that African countries enjoy into the US market under the African Growth and Opportunity Act, which could directly impact some African exports, most notably automotive exports from South Africa and apparel exports from Kenya, Ethiopia and Ghana. Another key area in which Africa may be directly impacted by a “Hire American” policy is remittance flows. Given that the United States remains among the favourite destinations for African migrants, economic challenges brought by the policy could affect the opportunities for and employment and earnings of the African diaspora, reducing the flow of funds they can repatriate to their home countries. For instance, Nigerians living in the diaspora sent home approximately US$21 billion in 2015, a significant portion of which came from the United States. Localization requirements relating to employment may make it more difficult for Africans to migrate to the United States for employment, which could reduce remittance flows to the continent. The indirect impact of localization policies could be even more pronounced because Africa would likely suffer a knock-on effect as other developing economies such as China and India, which are more directly impacted by US localization requirements, reduce demand for Africa’s export commodities.
Despite these short-term costs, the re-emergence of localization requirements
may present an opportunity for Africa to accelerate efforts towards structural transformation. While World Trade Organization law—predominantly through the Agreement on Trade Related Investment Measures, the Agreement on Subsidies and Countervailing Measures and the General Agreement on Trade in Services—generally bans measures that discriminate against foreign goods or service providers, it provides flexibility and policy space for localization requirements. This includes requiring or incentivizing the use of domestic service suppliers and domestic labour. In fact, proponents of local content point to the fact that most developed countries employed protective measures, including local content requirements, in the early stages of their industrial development and argue that if well-defined and appropriately implemented, localization requirements could support Africa’s industrial development and integration in the global economy (Chang, 2002; Whitfield et al. 2015). Hansen et al. (2015) notes that localization requirements can be used to help develop weak local industries, facilitate technology transfer and thereby close the huge technology gap between developing countries and more developed countries. Indeed, Mozambique, Nigeria, Tanzania and Uganda have used localization requirements to break the enclave nature of extractive industries and ensure that domestic industries have the capacity to integrate into strategic industries in support of local economic development and growth.

AFREXIMBANK AFRICAN TRADE REPORT 2017 85
The prevalence of protectionist measures is seen in the number of trade disputes brought before the WTO—116 since 2010. In 2015–16, 30 trade disputes were raised, led by the United States, Japan, China and Brazil, which together accounted for half of the disputes raised. The economies against which complaints were raised most often were the United States, China, the European Union and Indonesia which together accounted for 60 percent of complaints.
No African country has brought a dispute to the WTO as a complainant, but some have joined disputes as a third party or been respondents. In 2015–16 the only African country to join a dispute as a third party was Egypt (three disputes). The first dispute related to a complaint brought by Russia against the European Union
regarding cost adjustment methodologies used to calculate dumping margins in anti-dumping investigations and reviews. The second concerned a complaint brought by the United States against China over measures through which China appeared to have provided domestic support in favour of agricultural producers, in particular, to those producing wheat, India rice, Japonica rice and corn. The third related to a complaint brought by Turkey against Morocco within the context of anti-dumping measures on some hot-rolled steel items.
Two African countries were respondents in 2015–16. Turkey raised a complaint against Morocco over anti-dumping measures on some hot-rolled steel items from Turkey, and Pakistan raised a complaint against South Africa over provisional anti-dumping duties on Portland cement from Pakistan.
END

7Chapter Seven

AFREXIMBANK AFRICAN TRADE REPORT 2017 87
Trade Facilitation
Despite the slowdown in international trade after the global financial crisis, trade remains an important driver of economic growth and development, especially for developing countries. High trade and transaction costs associated with movements of goods across borders are a key challenge to competitiveness and prevent countries from integrating into global value chains in a world of comparative advantage where competitiveness is crucial for trade performance and structural transformation. In this world, global production is increasingly fragmented, driven by cross-border value chains and supply chains, where outsourcing is increasing rapidly and tariff rates and other trade barriers have declined. Hence, reducing trade costs has become even more important as a source of competitive advantage.
The evolving pattern of global trade, with about four-fifths in manufactured goods, one third in unfinished goods and one third in intra-company trade (all overlapping shares), suggests that reducing trade costs through greater trade facilitation is vital for Africa’s trade growth. For many African countries, trade costs arising from trade procedures and logistical costs often prove to be far greater impediments to trade than the tariffs they face in developed countries. These trade costs loom large in the high trade costs faced by the continent and constrain growth in trade volumes. The United Nations Conference on Trade and Development estimates that Africa pays 40–70 percent more on average than developed
countries for the international transport of its imports (UNCTAD 2015b). Fifteen African countries are landlocked, making them both physically and economically more remote from major world markets, which also feeds into high trade costs.
Awareness of the costs of burdensome trade procedures and of the potential gains from trade facilitation has led to these areas gaining increased prominence and resulted in trade facilitation’s inclusion in the Doha Development Agenda, culminating in the multilateral Trade Facilitation Agreement in 2013. The World Trade Organization (WTO) estimates that implementing the agreement could increase global merchandise exports by up to US$1 trillion a year and that developing countries will benefit strongly, capturing more than half the trade gains (WTO 2015). Similarly, according to the Organisation for Economic Co-operation and Development Trade Facilitation Indicators, such implementation could reduce worldwide trade costs 12.5–17.5 percent, with the opportunities for the biggest reductions in trade costs accruing to low- and lower-middle-income countries.
The benefits of trade facilitation measures are even more pronounced when using a wider definition of trade facilitation that includes the logistics and transport costs associated with cross-border trade and not just “the simplification and harmonization of international trade procedures”, with trade procedures being “the activities, practices and formalities involved in collecting,

88 CHAPTER SEVEN AFRICAN TRADE REPORT 2017
presenting, communicating and processing data required for the movement of goods in international trade” as done under the Trade Facilitation Agreement. Using a wider conception of trade facilitation that includes infrastructure and the trade operating environment, the World Economic Forum estimates that the benefits of improved global trade facilitation far exceed those of further tariff reductions and could increase global GDP by US$2.6 trillion (4.7 percent) and global exports by US$1.6 trillion (14.5 percent) (WEF and Global Alliance for Trade Facilitation 2016), with developing countries and small enterprises, including those in Africa, gaining the most.
The African Union has recognized such benefits, too, and included trade facilitation as one of the seven priority clusters in its Action Plan for Boosting Intra-African Trade. This move and the Trade Facilitation Agreement—and others, as discussed in the following sections—will help African countries embark on trade facilitation reforms in an effort to reduce trade costs, ultimately boosting Africa’s trade and increasing its share in global trade.
7.1 The World Trade Organization Trade Facilitation Agreement
By end-December 2016, 103 WTO members had ratified the Trade Facilitation Agreement, leaving only 7 members needed to attain the two-thirds required for it to enter into force.
The Trade Facilitation Agreement is the first major agreement by WTO member states since the conclusion of the Uruguay Round more than 20 years ago. The final agreement contains provisions for faster and more efficient customs procedures through effective cooperation between customs and other authorities on trade facilitation and customs compliance issues. It also contains provisions for technical assistance and capacity building. The WTO estimates that
full implementation would reduce members’ trade costs an average of 14.3 percent, with most gains accruing to developing countries globally.
The Trade Facilitation Agreement is made up of three sections. Section I contains provisions for expediting the movement, release and clearance of goods. It clarifies the relevant articles (V, VIII and X) of the 1994 General Agreement on Tariffs and Trade. Articles 1–12 of Section I create obligations for members (Table 7.1).
Section II contains “special and differential” treatment provisions for developing and least developed countries aimed at helping them implement the provisions of the Trade Facilitation Agreement’s three commitment categories (A, B and C) for notifying the implementation of its various provisions. The categories can be broadly described as follows. Category A includes provisions that can be implemented immediately upon entry into force, category B includes provisions designated for implementation after a self-selected transition period and category C includes provisions that will be implemented upon acquisition of capacity through assistance after a self-selected transition period.
Section III contains provisions that establish a permanent committee on trade facilitation at the WTO, requires members to have a national committee to facilitate domestic coordination and implementation of the provisions of the Trade Facilitation Agreement and sets out a few final provisions.
In 2015–16, 14 African countries ratified the Trade Facilitation Agreement.1 In anticipation of its imminent entry into force, several African countries started notifying commitments under the
1 Botswana, Côte d’Ivoire, Gabon, Kenya, Lesotho,
Madagascar, Mali, Mauritius, Niger, Senegal,
Seychelles, Swaziland, Togo and Zambia.

AFREXIMBANK AFRICAN TRADE REPORT 2017 89
respective categories. At end of 2016, 24 African countries had notified category A commitments, and 4 had notified category B and C commitments. Chad, Malawi, Mauritius and Zambia have notified all their commitments.
African countries also stand to benefit from the Trade Facilitation Agreement’s capacity-building and technical assistance provisions, which require donor members to provide assistance and support to developing and
least developed country members for implementing the agreement. To facilitate this, the WTO Trade Facilitation Agreement Facility was formally launched on 22 July 2014 and operational guidelines agreed to in 2015.
To support implementation of the Trade Facilitation Agreement, the business-led Global Alliance for Trade Facilitation was launched in 2015. Bringing together the Center for International Private Enterprise,
Table 7.1 Summary of World Trade Organization Trade Facilitation Agreement
Source: World Trade Organization Trade Facilitation Agreement.
Article Provisions Concerned parties
1 Publication and availability of information
Executive authority, all border agencies, trade authority, revenue authority, agency responsible for information management
2 Opportunity to comment, information before entry into force and consultation
Executive authority, legislative authority, trade authority, all border agencies
3 Advance rulings Customs and other border agencies
4 Procedures for appeal or review All border agencies
5 Other measures to enhance impartiality, non-discrimination and transparency
All border agencies
6 General disciplines on fees and charges imposed on or in connection with importation and exportation
Customs and other border agencies
7 Release and clearance of goods Customs and other border agencies
8 Border agency cooperation All border agencies
9 Movement of goods intended for import under customs control
Customs
10 Formalities connected with importation, exportation and transit
All border agencies
11 Freedom of transit All border agencies
12 Customs cooperation Customs

90 CHAPTER SEVEN AFRICAN TRADE REPORT 2017
the International Chamber of Commerce and the World Economic Forum, along with the governments of Canada, Germany, the United Kingdom and the United States, the alliance aims to leverage business expertise and resources in implementing customs and border reforms. It will support Trade Facilitation Agreement–related projects in 12–15 developing countries by identifying trade bottlenecks and working with governments to implement trade-facilitation reforms and to increase private-sector awareness of the agreement. As of December 2016, the alliance was active in four pilot countries, including Ghana and Kenya.
7.2 Africa’s Trade-Enabling Environment
Trade facilitation extends beyond “at the border” customs and institutional reforms to cover a myriad of “behind the border” and “beyond the border” measures, such as trade-enabling infrastructure, a conducive business environment, transport and
information and communications technology services to facilitate trade, and domestic and foreign market access. African countries perform poorly on international indices that measure the costs of doing business, logistics performance and the trade-enabling environment.2
The Enabling Trade Index, co-published by the World Economic Forum and the Global Alliance for Trade Facilitation, assesses the capacity to facilitate the flow of goods across borders and to their final destination, based on the extent to which economies have the required institutions, policies, infrastructure and services. Its scope is thus much broader than trade facilitation as approached by the WTO’s Trade Facilitation Agreement, and it provides a more comprehensive measure of trade facilitation at the country level. The index, which
2 For example, the World Bank Logistics
Performance Index and Ease of Doing Business
Index, the World Economic Forum’s Global
Competitiveness Index and the Heritage
Foundation’s Index of Economic Freedom.
Figure 7.1 Overall trade-enabling environment, by region, 2014 and 2016 (Enabling Trade Index value)
Source: African Export-Import Bank calculations based on data from the World Economic Forum and the Global Alliance
for Trade Facilitation.
7 -
0 -
1 -
3 -
5 -
2 -
4 -
6 -
2014 2016
Africa Middle East Latin America and the
Caribbean
North America Europe Eurasia Asia and Pacific

AFREXIMBANK AFRICAN TRADE REPORT 2017 91
covers 34 African economies,3 comprises four subindices—market access, border administration, infrastructure and operating environment.
According to the Enabling Trade Index, the best-performing region at facilitating trade in general was North America, followed by Europe and the Asia and Pacific region (Figure 7.1). Africa was the third best on the market access subindex (Figure 7.2), but its overall score was weighed down by its scores on the other three subindices.
Despite Africa’s poor overall performance, all but 4 of the 34 African countries showed gains between 2014 and 2016, with
3 Algeria, Benin, Botswana, Burundi, Cameroon,
Chad, Côte d’Ivoire, Democratic Republic of
Congo, Egypt, Ethiopia, Gabon, The Gambia,
Ghana, Kenya, Lesotho, Liberia, Madagascar,
Malawi, Mali, Mauritania, Mauritius, Morocco,
Mozambique, Namibia, Nigeria, Rwanda, Senegal,
Sierra Leone, South Africa, Tanzania, Tunisia,
Uganda, Zambia and Zimbabwe.
Africa—after the Asia and Pacific region—showing the second-best improvement on the overall index. The top-ranked African countries on the overall index in 2016 were Mauritius, Morocco, Rwanda, South Africa and Botswana, while the countries with the greatest gains between 2014 and 2016 were Liberia, Tanzania, Ethiopia, Ghana and Benin. Liberia was the outstanding performer owing largely to improvements in market access after its accession to the WTO in 2016.
7.2.1 Market Access
Market access measures the extent and complexity of a country’s tariff regime, as well as tariff barriers faced and preferences enjoyed by a country’s exporters in foreign markets. Among developing regions, Latin America and the Caribbean, performs the best on the market access subindex, followed by Africa, whose performance varies widely depending on whether domestic or foreign market access is being considered.
Figure 7.2 Trade-enabling environment subindices, by region, 2016 (Enabling Trade Index subindex value)
Source: African Export-Import Bank calculations based on data from the World Economic Forum and the Global Alliance
for Trade Facilitation.
7 -
0 -
1 -
3 -
5 -
2 -
4 -
6 -
Market Access Border Administration Infrastructure Operating Environment
Africa Middle East Latin America and the
Caribbean
North America Europe Eurasia Asia and Pacific

92 CHAPTER SEVEN AFRICAN TRADE REPORT 2017
Domestic market access looks at the level and complexity of a country’s tariff protection as a result of its trade policy and includes average tariffs applied, the share of goods imported duty free and the complexity of the tariff regime. African economies perform poorly in this area, with only Mauritius, Botswana, Lesotho and Tunisia in the top 75 countries for domestic market access. Between 2014 and 2016 the African countries that recorded the biggest improvements were Lesotho, Tunisia, Gabon, Morocco and Mozambique. Those going in the other direction were Cameroon, Kenya, Rwanda, Ghana, Uganda, Malawi, Ethiopia and South Africa.
African countries fared better on access to foreign markets, given their participation in the WTO, bilateral trade agreements and the preferential access of many African countries to developed country markets. In 2016, 7 African countries were ranked among the top 10: Lesotho, Uganda, Madagascar, Malawi, Mozambique, Tanzania and Mauritius. Between 2014 and 2016 the countries with the biggest improvements were Liberia, Senegal, Lesotho, The Gambia and Mali. Countries showing a worsening trend were Chad, Gabon, Mauritius, Mauritania, Tunisia and Zimbabwe.
7.2.2 Border Administration
In 2016 Africa was the weakest region for efficiency and transparency of border administration and costs associated with the import and export of goods. Still, some African countries improved certain aspects between 2014 and 2016. In 2016 documentation and border clearance for imports into Botswana required only eight hours on average—on a par with the Republic of Korea and the United States—while Kenya recorded a steep reduction in the cost of import documentation clearance procedures, from US$550 to US$115 (WEF and Global Alliance for Trade Facilitation 2016). The best-performing African countries for border administration
in 2016 were Botswana, Morocco, Rwanda, South Africa, Mauritius and Kenya, and the countries that recorded the biggest improvements between 2014 and 2016 were Ghana, Kenya, Tanzania and Mali.
7.2.3 Infrastructure
Africa’s trade is hampered by a lack of transport infrastructure and the poor quality of transport services within countries and across borders. In 2016 Africa was the worst-performing region on this subindex. The countries that ranked highest for infrastructure in 2016 were South Africa, Morocco, Namibia, Mauritius, Egypt, Côte d’Ivoire and Botswana, and the countries that improved the most between 2014 and 2016 were Côte d’Ivoire, Ethiopia, Gabon, Algeria and Kenya. The countries that ranked highest for transport services in 2016 were South Africa, Kenya, Egypt, Rwanda and Botswana, and the countries that made the greatest strides in improving transport services were Tanzania, Botswana, Egypt, South Africa, Uganda and Kenya.
African countries also lag behind in the use of information and communications technology infrastructure for trade, with only Mauritius, South Africa, Morocco and Tunisia ranking in the top half of countries on this measure. Still, apart from Egypt, Zimbabwe and Mauritania, all African countries improved between 2014 and 2016, particularly Ghana, Tunisia, Algeria, Rwanda, Côte d’Ivoire and Nigeria.
7.2.4 Operating Environment
In 2016 Africa’s operating environment for supporting the capacity of companies to export, import, trade and transport merchandise had generally improved from 2014, to differing degrees by country. The African countries with the best trade-facilitating operating environments were Rwanda, Mauritius, Morocco, Zambia and South Africa. African countries that improved on this metric between 2014 and

AFREXIMBANK AFRICAN TRADE REPORT 2017 93
2016 included Côte d’Ivoire, Ghana, Algeria, Rwanda and Benin.
7.3 Africa’s Trade Facilitation Initiatives
In addition to the reforms at the multilateral and bilateral levels, initiatives to facilitate trade have also been pursued at the national and regional levels. For example, in December 2016 the African Export-Import Bank partnered with the African Union to host the first Africa Trade Facilitation Forum in Addis Ababa, Ethiopia, which brought together policy makers, the private sector and senior representatives from stakeholder groups to share experiences
and good practices on how “Africa can trade with Africa”. The forum explored ways to overcome restrictions to trade and imports across Africa, such as non-tariff barriers, and looked at reducing the cost of trade and the future of trade facilitation in Africa; connecting African companies to regional and international markets through trade facilitation; implementing the Trade Facilitation Agreement; facilitating transport corridors; financing trade facilitation in Africa; and benchmarking improvements.
The Ethiopia–Djibouti railway modernization project, also known as the Addis Ababa–Djibouti railway, saw its first freight service in November 2015. The 752.7 kilometre electric line is the first modern electrified
Since the African Export-Import Bank was established in 1993, it has adopted strategic planning to advance its medium- and long-term corporate goals and has successfully used five-year rolling strategic plans as a guide towards achieving them. In December 2016 the Bank’s Board of Directors approved the fifth strategic plan, IMPACT 2021—Africa Transformed, covering 2017–21.
In developing a strategic plan, the Bank considers several internal and external factors. The primary internal consideration is to conform to the vision of the founding fathers as specified in the Bank’s charter—that is, to facilitate, promote and expand extra- and intra-African trade, following a thorough assessment of the Bank’s capacity. Another critical internal consideration is the Bank’s unique institutional setup, which requires it to deliver financial value to its diverse shareholder base,
while achieving its trade development objectives.
A key external consideration shaping the 2017–21 strategic plan is the growing significance of intra-African trade. In view of recent regional and global economic developments, there is increased urgency to boost the promotion and financing of intra-African trade. There is also strong political will across the continent to spearhead these efforts, with intra-African trade a top priority at the highest level of the African Union.
Another external consideration is the difficulties that some African economies have faced in recent years from the sustained decline in commodity terms of trade and slower economic growth in the region’s major trading partners, which have demonstrated the need for industrialization and export manufacturing as well as structural
Box 7.1: The African Export-Import Bank’s Fifth Strategic Plan:
IMPACT 2021 – Africa Transformed

94 CHAPTER SEVEN AFRICAN TRADE REPORT 2017
transformation of African economies. The Bank’s strategy takes advantage of the rising cost of light manufacturing in Asia and other developing regions, which have created an opportunity for Africa to assume an important role in labour-intensive light manufacturing and become hosts to delocalized Asian factories.
Other external factors include the rising middle class in Africa, the withdrawal of correspondent banking services from Africa, the continued poor state of trade-facilitating infrastructure across the continent, the growing importance of the Chinese currency (renminbi) in international trade, and the African diaspora’s increased role in the context of the region’s growth and economic development.
In view of the above considerations, as well as the Bank’s comparative advantage, the 2017–21 strategic plan was anchored on four key strategic pillars: Intra-African Trade, Industrialization and Export Development, Trade Finance Leadership, and Financial Soundness and Performance.
Under the Intra-African Trade pillar, the Bank will aggressively promote and finance intra-African trade and trade with the African diaspora. The strategy for intra-African trade is conceived around three themes: create, connect and deliver, with measure as an ancillary theme (CCDm).1 The philosophy behind CCDm is that building solid export-production capacities as well as domestic and continental supply chains will facilitate an increase in the flow of goods and services
1 The Bank’s Board of Directors approved a
separate Intra-African Trade Strategy in
April 2016.
across borders in Africa. The measure ancillary theme introduces monitoring and measurement mechanisms. CCDm will bring together key players in intra-African trade—farmers, processors, manufacturers, tradable services providers, traders, financiers, logistics providers, consumers and policymakers.
The Industrialization and Export Development pillar is framed around three themes: Catalyse, Produce and Trade (CPT). Under the CPT framework the Bank intends to act as a catalyst for industrialization and export development in Africa by directly addressing the constraints to industrialization by facilitating the production of value-added exports and services, while ensuring that the produced goods and services are traded. Interventions under the Industrialization and Export Development pillar will thus focus on supporting the development of the agro-processing, light manufacturing and tradable service sectors.
The Trade Finance Leadership pillar will see the Bank extend its leadership in trade finance by expanding interventions in critical trade finance products and by creating new products and initiatives. The objective is to fill the gap resulting from the exit of international banks from Africa trade finance (stemming from high compliance costs and economic uncertainty). The Bank’s interventions will be provided through financial instruments—focused on providing trade services; trade finance (short-term products, including import and export finance); specialized products (including forfaiting and supply chain finance); and guarantees—and non-financial instruments—focused on improving the capacity of Africans in trade finance and trade negotiations and initiatives

AFREXIMBANK AFRICAN TRADE REPORT 2017 95
aimed at making Africa-related trade information widely available in a cost-effective manner.
The Financial Soundness and Performance pillar recognizes that to have a meaningful impact on African trade, the Bank must be big enough and financially sound enough to earn the continued confidence of its clients and attain its strategic objectives. The Bank plans to be adequately capitalized over the course of its 2017–21 strategic plan and will seek to improve its credit ratings. It will also introduce innovative initiatives aimed at achieving a source of permanent capital and improving overall capital management. The Bank intends to achieve improved and strong earnings, secure sufficient liquidity (reducing over-reliance on non-African sources), develop
a robust loan portfolio and adopt sound risk management and corporate governance processes. Furthermore, the Bank’s Central Bank Deposit Programme will be deepened, and the Bank’s risk management capability will continue to be strengthened to accommodate the growth anticipated under the 2017–21 strategic plan.
Under each of the strategic pillars are specific programmes and financial instruments through which priorities identified in the strategy document are to be tackled. Effective implementation of the Bank’s 2017–21 strategic plan will involve the cooperation of African governments, multilateral institutions, African and international banks, African traders and African corporates as well as the strong support of the Bank’s shareholders.
96 CHAPTER SEVEN AFRICAN TRADE REPORT 2017

AFREXIMBANK AFRICAN TRADE REPORT 2017 97
railway line in East Africa and is expected to cut the time needed to transport a container from Addis Ababa to Djibouti from three days to 10 hours and slash the costs by a third. The year 2015 also witnessed the inauguration of the new Suez Canal in Egypt, which expanded capacity from 49 ships per day to 97 along one of the main arteries of global trade. In 2016 the African Corridor Management Alliance was launched, which is expected to coordinate the sharing of best practices and other strategies.
At the regional level, the East African Community continued developing a regional Authorized Economic Operator programme with the assistance of the World Customs Organization. The programme will provide expedited customs clearance procedures for authorized traders in the region. The Southern African Customs Union continued
developing its regional Preferred Trade Programme, also with the support of the World Customs Organization. The programme is geared towards promoting traders’ compliance while improving trade facilitation and regional integration.
Many African countries also introduced (or are about to bring in) single window systems. A single window is a facility that allows parties in international trade and transport to lodge standardized trade-related information or documents once at a single entry point to fulfil all import, export and transit-related regulatory requirements. In 2015–16 Benin, Republic of Congo, Côte d’Ivoire, Kenya, Libya, Madagascar, Morocco, Mozambique, Rwanda, Tanzania and Togo all initiated or continued rolling out such systems. Other countries have introduced port community and regulatory systems.
END

8Chapter Eight

AFREXIMBANK AFRICAN TRADE REPORT 2017 99
Intra-African Trade
Intra-African trade recovered and gathered momentum in 2016, growing an estimated 8.6 percent, to US$156.94 billion, after a decline of 7.4 percent in 2015 (Table 8.1 and Figure 8.1). Still, the share of intra-region trade in the continent’s total merchandise trade (15 percent) compares unfavourably with that of Europe (67.3 percent), Asia (58 percent), North America (48 percent)
and Latin America (20 percent) (Figure 8.2). Three main drivers were at work in 2015–16: commodity prices (particularly energy), intra-African trade champions and trade-enhancing regional economic blocs, and currency shifts. This chapter focuses on these themes in the countries that dominate the intra-African trade landscape and highlights key trends in other countries.
Figure 8.1 Trends in intra-African merchandise trade, 2005–16 (US$ billion)
Figure 8.2 Share of intra-region trade in total merchandise trade by region, 2014–16 (%)
Source: Economist Intelligence Unit, Country Report (various issues), International Monetary Fund Direction of Trade
Statistics database, United Nations Conference on Trade and Development UNCTADStat database and United Nations
Statistics Division database
a. Data are projections. Source: International Trade Centre Trade Map database.
80% -
60% -
40% -
70% -
50% -
30% -
20% -
10% -
0% -
0% -
200% -
120% -
160% -
80% -
40% -
180% -
100% -
140% -
60% -
20% -
2014 2015 2016a
Intra-African Exports
Intra-African Imports
Total Intra-African Merchandise Trade
Africa Latin America and the Caribbean
North America Asia EU
2005 2006 2010 20132007 2008 2011 20142009 2012 2015 2016

100 CHAPTER EIGHT AFRICAN TRADE REPORT 2017
Tabl
e 8.
1 In
tra-
Afr
ican
Tra
de, (
2014
-16)
(in
US$
bill
ion
unle
ss o
ther
wis
e in
dica
ted)
In
tra-
Afr
ican
Exp
orts
Gro
wth
Rat
e, %
Coun
try
Shar
e of
Tot
al
Intr
a-A
fric
an E
xpor
ts,
%In
tra-
Afr
ican
Impo
rts
Gro
wth
Rat
e, %
Coun
try
Shar
e of
Tot
al
Intr
a-A
fric
an Im
port
s,
%
Tota
l Int
ra-A
fric
an
Trad
eG
row
th R
ate,
%Co
untr
y Sh
are
of T
otal
In
tra-
Afr
ican
Tra
de, %
Trad
e B
alan
ce V
alue
(E
xpor
ts -
Impo
rts)
Afr
ica
2014
*20
15*
2016
**14
/15
15/1
620
14*
2015
*20
16**
2014
*20
15*
2016
**14
/15
15/1
620
14*
2015
*20
16**
2014
*20
15*
2016
**14
/15
15/1
620
14*
2015
*20
16**
2014
*20
15*
2016
**A
lger
ia2,
721,
612,
01-4
0,81
24,8
43,
472,
332,
681,
151,
090,
65-5
,01
-40,
171,
481,
450,
803,
872,
702,
66-3
0,16
-1,4
62,
481,
871,
701,
570,
521,
36A
ngol
a2,
071,
431,
98-3
0,92
38,4
62,
642,
072,
641,
481,
221,
08-1
7,77
-11,
111,
901,
611,
323,
552,
653,
06-2
5,44
15,6
92,
271,
831,
950,
590,
210,
90B
enin
0,38
0,39
0,27
2,63
-30,
770,
490,
570,
360,
660,
710,
887,
8922
,93
0,85
0,95
1,07
1,04
1,10
1,15
5,97
3,96
0,67
0,76
0,73
-0,2
8-0
,32
-0,6
1B
otsw
ana
1,25
1,35
1,44
8,00
6,45
1,60
1,96
1,92
5,91
6,00
7,28
1,52
21,3
37,
617,
958,
887,
167,
358,
722,
6518
,60
4,59
5,09
5,55
-4,6
6-4
,65
-5,8
4B
urki
na F
aso
0,12
0,12
0,22
0,00
83,3
30,
150,
170,
291,
281,
351,
795,
1132
,68
1,65
1,78
2,18
1,40
1,47
2,01
4,67
36,8
20,
901,
021,
28-1
,16
-1,2
3-1
,57
Bur
undi
0,03
0,03
0,01
0,00
-66,
670,
040,
040,
010,
250,
260,
404,
3253
,37
0,32
0,35
0,49
0,28
0,29
0,41
3,85
40,9
80,
180,
200,
26-0
,22
-0,2
3-0
,39
Cam
eroo
n0,
540,
580,
137,
41-7
8,35
0,69
0,84
0,17
1,69
1,75
2,06
3,68
17,7
82,
172,
322,
522,
232,
332,
194,
58-6
,14
1,43
1,61
1,39
-1,1
5-1
,17
-1,9
4Ca
pe V
erde
0,01
0,00
0,00
-100
,00
0,00
0,01
0,00
0,00
0,02
0,02
0,02
-10,
3938
,12
0,03
0,02
0,03
0,03
0,02
0,02
-40,
4138
,12
0,02
0,01
0,02
-0,0
1-0
,02
-0,0
2Ce
ntra
l Afr
ican
Rep
.0,
020,
020,
010,
00-5
0,00
0,03
0,03
0,01
0,07
0,07
0,09
7,47
21,5
10,
090,
100,
110,
090,
090,
105,
796,
300,
060,
070,
06-0
,05
-0,0
5-0
,08
Chad
0,03
0,04
0,02
33,3
3-5
0,00
0,04
0,06
0,03
0,21
0,22
0,41
4,51
89,6
10,
270,
290,
500,
240,
260,
438,
1667
,81
0,15
0,18
0,27
-0,1
8-0
,18
-0,3
9Co
mor
os0,
000,
000,
00n/
an/
a0,
000,
000,
000,
000,
000,
00n/
an/
a0,
000,
000,
000,
000,
000,
00n/
an/
a0,
000,
000,
000,
000,
000,
00Co
ngo,
Dem
. Rep
. of
1,46
1,08
0,64
-26,
03-4
1,13
1,86
1,57
0,85
3,60
3,67
4,41
1,80
20,1
24,
644,
865,
385,
064,
755,
04-6
,22
6,20
3,25
3,29
3,21
-2,1
4-2
,59
-3,7
7Co
ngo,
Rep
. of
0,17
0,19
0,10
11,7
6-4
5,44
0,22
0,28
0,14
0,54
0,48
0,71
-10,
5747
,44
0,69
0,64
0,87
0,71
0,67
0,81
-5,2
121
,16
0,45
0,46
0,52
-0,3
7-0
,29
-0,6
1Cô
te d
’Ivoi
re4,
243,
424,
65-1
9,34
35,9
65,
414,
966,
203,
253,
483,
436,
91-1
,21
4,19
4,60
4,19
7,49
6,90
8,08
-7,9
517
,23
4,80
4,77
5,15
0,99
-0,0
61,
22D
jibou
ti0,
460,
480,
634,
3530
,74
0,59
0,70
0,84
0,16
0,16
0,12
0,24
-26,
950,
210,
220,
150,
620,
640,
753,
2716
,03
0,40
0,45
0,48
0,30
0,32
0,51
Egyp
t2,
902,
653,
31-8
,62
25,0
63,
703,
844,
421,
131,
630,
4144
,37
-74,
551,
452,
150,
514,
034,
283,
736,
21-1
2,83
2,58
2,96
2,38
1,77
1,02
2,90
Equa
tori
al G
uine
a0,
570,
310,
40-4
5,61
29,4
30,
730,
450,
540,
310,
270,
43-1
2,01
57,2
60,
400,
360,
520,
880,
580,
83-3
3,76
42,4
70,
560,
400,
530,
260,
04-0
,03
Erit
eria
n/a
n/a
n/a
n/a
n/a
n/a
n/a
n/a
n/a
n/a
n/a
n/a
n/a
n/a
n/a
n/a
n/a
n/a
n/a
n/a
n/a
n/a
n/a
n/a
n/a
n/a
n/a
Ethi
opia
0,14
0,16
0,14
14,2
9-1
2,50
0,18
0,23
0,19
0,45
0,59
0,67
31,5
612
,50
0,58
0,78
0,81
0,59
0,75
0,81
27,4
67,
180,
380,
520,
51-0
,31
-0,4
3-0
,53
Gab
on0,
350,
240,
21-3
1,43
-13,
670,
450,
350,
280,
580,
540,
75-7
,01
40,1
80,
740,
710,
920,
930,
780,
96-1
6,25
23,5
10,
590,
540,
61-0
,23
-0,3
0-0
,54
Gam
bia,
The
0,01
0,01
0,01
0,00
0,00
0,01
0,01
0,01
0,15
0,11
0,20
-26,
9377
,52
0,20
0,15
0,24
0,16
0,12
0,21
-25,
2971
,20
0,11
0,08
0,13
-0,1
4-0
,10
-0,1
9G
hana
1,33
0,68
0,46
-48,
87-3
2,35
1,70
0,99
0,61
3,65
3,86
5,27
5,86
36,4
34,
705,
126,
434,
984,
545,
73-8
,76
26,1
33,
193,
143,
65-2
,32
-3,1
8-4
,81
Gui
nea
0,03
0,10
0,08
233,
33-2
0,00
0,04
0,15
0,11
0,37
0,31
0,43
-16,
5637
,36
0,48
0,41
0,52
0,40
0,41
0,51
1,99
23,4
50,
260,
290,
32-0
,34
-0,2
1-0
,35
Gui
nea-
Bis
sau
0,08
0,08
0,07
0,00
-12,
500,
100,
120,
090,
090,
050,
09-4
4,46
73,6
40,
120,
070,
110,
170,
130,
16-2
3,94
21,3
70,
110,
090,
10-0
,01
0,03
-0,0
2Ke
nya
2,27
2,62
2,52
15,4
2-3
,67
2,90
3,80
3,37
1,33
1,50
0,79
12,4
8-4
7,12
1,72
1,99
0,97
3,60
4,12
3,32
14,3
3-1
9,49
2,31
2,85
2,11
0,94
1,12
1,73
Leso
tho
0,02
0,03
0,03
50,0
011
,88
0,03
0,04
0,04
0,01
0,01
0,01
0,00
28,7
60,
010,
010,
020,
030,
040,
0533
,33
16,1
00,
020,
030,
030,
010,
020,
02Li
beri
a0,
020,
020,
010,
00-5
0,00
0,03
0,03
0,01
0,27
0,27
0,33
0,94
23,6
00,
350,
360,
410,
290,
290,
340,
8818
,54
0,18
0,20
0,22
-0,2
5-0
,25
-0,3
2Li
bya
0,41
0,16
0,02
-60,
98-8
7,50
0,52
0,23
0,03
1,04
1,07
1,00
3,11
-6,7
11,
341,
421,
221,
451,
231,
02-1
4,99
-17,
180,
930,
850,
65-0
,63
-0,9
1-0
,98
Mad
agas
car
0,20
0,20
0,07
0,00
-66,
510,
260,
290,
090,
440,
420,
55-2
,85
29,1
10,
560,
560,
670,
640,
620,
61-1
,95
-1,5
90,
410,
430,
39-0
,24
-0,2
2-0
,48
Mal
awi
0,28
0,24
0,07
-14,
29-7
0,83
0,36
0,35
0,09
0,83
0,82
1,05
-1,2
227
,56
1,07
1,09
1,28
1,11
1,06
1,12
-4,5
05,
370,
710,
740,
71-0
,55
-0,5
8-0
,98
Mal
i0,
040,
040,
060,
0050
,00
0,05
0,06
0,08
1,83
1,77
2,49
-3,2
940
,43
2,36
2,35
3,04
1,87
1,81
2,55
-3,2
240
,64
1,20
1,25
1,62
-1,7
9-1
,73
-2,4
3M
auri
tani
a0,
400,
420,
425,
000,
200,
510,
610,
560,
620,
580,
60-5
,88
2,37
0,80
0,77
0,73
1,02
1,00
1,02
-1,6
11,
460,
650,
690,
65-0
,22
-0,1
6-0
,17
Mau
riti
us0,
410,
440,
317,
32-2
8,90
0,52
0,64
0,42
0,54
0,53
0,54
-1,6
01,
740,
690,
700,
660,
950,
970,
852,
25-1
2,17
0,61
0,67
0,54
-0,1
3-0
,09
-0,2
3M
oroc
co1,
861,
781,
66-4
,30
-6,8
42,
372,
582,
211,
831,
531,
67-1
5,92
8,97
2,35
2,03
2,04
3,69
3,31
3,33
-10,
060,
482,
362,
292,
120,
030,
25-0
,01
Moz
ambi
que
1,24
1,07
0,75
-13,
71-3
0,23
1,58
1,55
1,00
3,72
3,42
4,32
-8,0
426
,41
4,79
4,53
5,28
4,96
4,49
5,07
-9,4
512
,91
3,18
3,11
3,23
-2,4
8-2
,35
-3,5
8N
amib
ia4,
335,
476,
0126
,33
9,87
5,53
7,93
8,01
5,19
5,08
6,71
-2,1
231
,99
6,68
6,73
8,18
9,52
10,5
512
,72
10,8
220
,52
6,10
7,30
8,10
-0,8
60,
39-0
,70
Nig
er0,
230,
240,
124,
35-5
0,16
0,29
0,35
0,16
0,55
0,57
0,68
4,51
18,0
60,
710,
760,
830,
780,
810,
804,
46-2
,04
0,50
0,56
0,51
-0,3
2-0
,33
-0,5
6N
iger
ia11
,58
9,72
11,4
9-1
6,06
18,2
114
,78
14,1
015
,32
2,83
2,56
1,91
-9,3
4-2
5,47
3,64
3,39
2,33
14,4
112
,28
13,4
0-1
4,74
9,10
9,24
8,50
8,54
8,75
7,16
9,58
Rw
anda
0,13
0,14
0,10
7,69
-28,
570,
170,
200,
130,
570,
590,
673,
3614
,92
0,73
0,78
0,82
0,70
0,73
0,77
4,17
6,54
0,45
0,50
0,49
-0,4
4-0
,45
-0,5
7Sa
o To
me
and
Pri
ncip
e0,
000,
000,
00n/
an/
a0,
000,
000,
000,
010,
010,
014,
8931
,48
0,01
0,01
0,02
0,01
0,01
0,01
4,89
31,4
80,
010,
010,
01-0
,01
-0,0
1-0
,01
Sene
gal
1,20
0,99
1,07
-17,
507,
781,
531,
441,
420,
970,
880,
71-9
,36
-19,
271,
241,
160,
862,
171,
871,
77-1
3,87
-4,9
11,
391,
291,
130,
230,
110,
36Se
yche
lles
0,06
0,09
0,08
50,0
0-1
1,11
0,08
0,13
0,11
0,11
0,11
0,14
-0,0
225
,27
0,14
0,14
0,17
0,17
0,20
0,22
17,7
48,
810,
110,
140,
14-0
,05
-0,0
2-0
,06
Sier
ra L
eone
0,03
0,03
0,03
0,00
0,00
0,04
0,04
0,04
0,17
0,14
0,21
-18,
2947
,90
0,22
0,18
0,25
0,20
0,17
0,24
-15,
5439
,38
0,13
0,12
0,15
-0,1
4-0
,11
-0,1
8So
mal
ia0,
030,
040,
0133
,33
-75,
000,
040,
060,
010,
670,
700,
934,
2332
,70
0,87
0,93
1,13
0,70
0,74
0,94
5,47
26,8
90,
450,
510,
60-0
,64
-0,6
6-0
,92
Sout
h A
fric
a27
,52
23,5
526
,75
-14,
4313
,59
35,1
334
,15
35,6
713
,72
11,6
49,
86-1
5,13
-15,
3317
,67
15,4
212
,03
41,2
435
,19
36,6
1-1
4,66
4,02
26,4
424
,36
23,3
313
,80
11,9
116
,89
Sout
h Su
dan
n/a
n/a
n/a
n/a
n/a
n/a
n/a
n/a
n/a
n/a
n/a
n/a
n/a
n/a
n/a
n/a
n/a
n/a
n/a
n/a
n/a
n/a
n/a
n/a
n/a
n/a
n/a
Suda
n0,
220,
180,
18-1
8,18
1,12
0,28
0,26
0,24
0,23
0,26
0,21
13,0
5-1
8,27
0,29
0,34
0,26
0,45
0,44
0,39
-2,3
1-1
0,28
0,29
0,30
0,25
-0,0
1-0
,08
-0,0
3Sw
azila
nd0,
140,
100,
11-2
8,57
10,0
00,
180,
150,
150,
270,
280,
253,
70-9
,93
0,35
0,37
0,31
0,41
0,38
0,36
-7,3
2-4
,68
0,26
0,26
0,23
-0,1
3-0
,18
-0,1
4Ta
nzan
ia0,
850,
830,
68-2
,35
-18,
071,
091,
200,
911,
351,
481,
639,
719,
521,
741,
961,
982,
202,
312,
315,
05-0
,37
1,41
1,60
1,47
-0,5
0-0
,65
-0,9
5To
go0,
820,
850,
963,
6612
,94
1,05
1,23
1,28
0,43
0,47
0,46
10,2
3-1
,82
0,55
0,62
0,56
1,25
1,32
1,42
5,90
7,70
0,80
0,91
0,90
0,39
0,38
0,50
Tuni
sia
1,22
1,10
1,18
-9,8
47,
101,
561,
601,
570,
000,
000,
01n/
an/
a0,
000,
000,
011,
221,
101,
19-9
,84
8,01
0,78
0,76
0,76
1,22
1,10
1,17
Uga
nda
0,77
0,77
0,56
0,00
-26,
850,
981,
120,
751,
992,
082,
354,
7312
,89
2,56
2,76
2,87
2,76
2,85
2,91
3,41
2,16
1,77
1,97
1,86
-1,2
2-1
,31
-1,7
9Za
mbi
a2,
141,
701,
98-2
0,56
16,4
72,
732,
472,
645,
855,
666,
21-3
,16
9,65
7,53
7,50
7,58
7,99
7,36
8,19
-7,8
211
,23
5,12
5,10
5,22
-3,7
1-3
,96
-4,2
3Zi
mba
bwe
1,00
1,17
0,98
17,0
0-1
6,24
1,28
1,70
1,31
3,30
3,21
4,06
-2,5
626
,53
4,24
4,25
4,96
4,30
4,38
5,04
1,99
15,1
12,
753,
033,
21-2
,30
-2,0
4-3
,08
Tota
l 7
8,33
6
8,96
7
4,99
-1
1,96
8,75
100,
0010
0,00
100,
0077
,65
75,5
281
,95
-2,7
58,
51 1
00,0
010
0,00
100,
0015
5,98
144,
4815
6,94
-7,3
88,
6310
0,00
100,
0010
0,00
0,68
-6,5
6-6
,95
* R
evis
ed
**
Est
imat
es fo
r 20
16 b
ased
on
late
st a
vaib
ale
data
n/a
not
ava
ilabl
eSo
urce
s: 1
) IM
F (2
016)
Dire
ctio
n of
Tra
de S
tati
stic
s (D
atab
ase)
. 2)
IMF
(200
1) D
irect
ion
of T
rade
Sta
tist
ics
- Ye
arbo
ok. 3
) EI
U, C
ount
ry R
isk
Serv
ice
(var
ious
issu
es).
4) E
IU, C
ount
ry R
epor
t (v
ario
us is
sues
). 5)
UN
CTA
DST
AT, 2
016.
6)
Afr
exim
bank
Sta
ff e
stim
ates
.

AFREXIMBANK AFRICAN TRADE REPORT 2017 101
Commodity price shifts, particularly in energy markets, heavily affected intra-African trade in 2015–16. Crude oil prices fell sharply in 2015, dipping over 47 percent as global supply continued to outpace global demand, bottoming out only in the first half of 2016 and staging a modest recovery in the rest of the year. Because oil is the main product in intra-African trade, the fall in oil prices reduced the total US dollar value of trade within the continent in 2015 and, conversely, boosted the US dollar value of trade as oil prices began to rise (though modestly) in 2016. Oil as a share of intra-African trade fell an estimated 3 percentage points from its long-term average of 28.6 percent, to 25.6 percent in 2015.
Trade within regional economic blocs was lively, with regional economic communities providing enabling environments, as reflected by market access preferences and continued efforts at developing trade and transport corridors. The Southern African Development Community was the most vibrant trading bloc in Africa (see section 8.3), with strong demand from member countries for a host of South African exports, including petroleum products and vehicles.
8.1 Intra-African Trade Champions
Of the top 10 contributors to intra-African trade, 3 accounted for 40 percent of the total US dollar value: South Africa (23.3 percent), Nigeria (8.5 percent) and Namibia (8.1 percent) in 2016 (Figure 8.3). Seven—Botswana, Zambia, Côte d’Ivoire, Ghana, Mozambique, Democratic Republic of Congo and Zimbabwe—account for around 30 percent of the total. The remaining 44 African countries account for around 30 percent.
South Africa dominated intra-African trade in 2016, accounting for just over 23 percent of the total, down from 26.4 percent in 2014 and 24.4 percent in 2015. The moderation was steeper in 2015, with exports falling more than 14 percent and imports falling more than 15 percent. While exports to the rest of the region have recovered, South Africa’s imports from other African countries remained sluggish, trending downward from US$13.7 billion in 2014 to US$11.64 billion in 2015 to US$9.9 billion in 2016. South Africa therefore widened its trade surplus with the rest of Africa from US$13.8 billion in 2014 to US$11.9 billion in 2015 to around US$17 billion in 2016.
Figure 8.3 Top 10 contributors to intra-African trade, 2014–16 (%)
Source: International Trade Centre Trade Map database
30% -
15% -
20% -
25% -
10% -
5% -
0% -
South AfricaBotswana
GhanaNigeria
Zambia
MozambiqueNamibia
Côte d’Ivoire
Congo, Dem.
Rep. of Congo Zimbabwe
2014 2015 2016

102 CHAPTER EIGHT AFRICAN TRADE REPORT 2017
The decrease in South Africa’s import values relates to the collapse in the price of oil over 2015–16, as oil is the largest product imported by South Africa (for intra- and extra-Africa trade). According to data from the International Trade Centre Trade Map database, South Africa typically imports 40–50 percent of its fuel and energy needs from the rest of Africa, mainly Nigeria and Angola. Oil and gas imports account for around 70 percent of South Africa’s imports from the rest of the region. Intriguingly, there has been a larger share of oil and gas imports from the rest of Africa as oil prices fell in 2015, suggesting that the competitiveness of African oil producers to importers in the region has been enhanced.
South Africa’s exports to the rest of Africa recovered in 2016 after sliding in 2015 and have generally been resilient to the headwinds that have slowed its exports to rest of the world over the last five years.
Regional economic communities have been a particularly important catalyst for South Africa’s trade with its peers: the strongest demand for the country’s exports comes from other Southern African Development Community members,1 and demand from them is buoyant. Exports to the rest of Africa are broad-based and include vehicles, consumer goods, construction materials, agricultural inputs and food.
Nigeria is the second largest intra-African trader, but trade slumped in 2015 before rebounding in 2016. The decline is attributable largely to a drop in exports, which fell over 16 percent in 2015, to
1 The other Southern African Development
Community members are Angola, Botswana,
Democratic Republic of Congo, Lesotho,
Madagascar, Malawi, Mauritius, Mozambique,
Namibia, Seychelles, Swaziland, Tanzania,
Zambia and Zimbabwe.
Limited manufacturing industries have confined African countries to the production of the same goods, resulting in product concentration in a world where trade is driven by product differentiation and exploitation of comparative advantages. This constraint, possibly the result of a historical legacy, has hindered the continent’s ability to integrate into the global economy where trade is increasingly dominated by manufactured goods, and has undermined the expansion of intra-Africa trade, which languishes at about 15 percent of total African trade. Inadequate industrial capability means that Africa cannot meet its growing need for manufactured goods, which account for over 65 percent of total imports, thus widening the region’s
balance of payments deficits and further undermining intra-Africa trade. A thriving light manufacturing sector has several benefits. In addition to driving economic transition and structural transformation, it can boost export investments, diversification and value addition and facilitate technology transfer to raise productivity.
Much of the success that developing Asian economies achieved over the last few decades is a result of well-implemented export development strategies supported by a rise in light manufacturing products. China and Vietnam, at the initial stage of their industrialization and economic development, established manufacturing zones at the proximity of major ports
Box 8.1: Light manufacturing as a driver of intra-Africa trade: Emerging best practice

AFREXIMBANK AFRICAN TRADE REPORT 2017 103
to ensure competitiveness and success of their nascent industries. They also undertook reforms to attract foreign direct investment in key industries to ensure competitiveness and economies of scale (Dinh et al. 2012).
A growing number of African countries whose comparative advantage hinges on low-cost labor and abundant resources are promoting light manufacturing industries in their development strategies, with a view to accelerating industrialization to mitigate the risks associated with deteriorating commodity terms of trade. These countries are actively supporting policies focused on growing key industries and associated infrastructure in order to shift the continent’s economy from resource-based to higher value added production. These aspirations are captured in the African Union’s Vision 2063 and the associated African Industrialization Development Action Plan, which prioritize industrialization through regional manufacturing hubs and scaling up of higher value added products (AU Agenda 2063, 2014). The emphasis on light manufacturing will also address product concentration, which has constrained
the expansion of intra-Africa trade and undermined economic integration.
While African countries are taking steps to promote light manufacturing industries, the region as a whole still compares unfavorably with other regions, including other developing countries. For instance, South Africa, the most industrialized African economy, compares unfavorably with China and the Republic of Korea in the share of higher value products in intra-regional trade (Figure B8.1). Limited industrial capability and product concentration has kept the continent’s share of global trade at about 3 percent. At the same time the share of intra-Africa trade in total African trade remains at 15 percent, compared with 67 percent in Europe and 58 percent in Asia.
One key constraint facing African countries is the limited access to competitive and sustainable financing to establish new factories and draw on innovation to expand the capacity of existing ones. This, combined with such factors as infrastructure deficits, particularly electricity and transport networks, are constraining both output and expansion of productivity.
Figure B8.1. Share of manufacturing in intra-regional trade, 2007–16 (%)
Source: World Bank World Development Indicators database.
80 -
60 -
40 -
20 -
0 -2007 2010 20132008 2011 20142009 2012 2015 2016
China South Korea South Africa

104 CHAPTER EIGHT AFRICAN TRADE REPORT 2017
US$9.72 billion, before improving to US$11.5 billion in 2016. Still, the recovery in trade in 2016 was too shallow to maintain Nigeria’s historical share of intra-African trade, which stood at 8.54 percent in 2016, down sharply from 9.24 percent in 2014. Imports from the rest of the continent fell 9.3 percent in 2015 and 25.5 percent 2016.
Because Nigeria’s export profile is skewed heavily towards crude oil, the fall in commodity prices hit the value of the country’s intra-African exports but not the volume. African importers of Nigerian crude oil—mainly South Africa, Côte d’Ivoire, Cameroon and Senegal—benefited from the weakness in crude oil prices and boosted their demand for Nigerian crude in 2015–16. For example, South Africa imported around 53 percent of its crude oil and gas needs from Nigeria in 2015, up from 31 percent in 2014. Oil shipments from Saudi Arabia
to South Africa fell over the same period, from 37 percent of total imports to under 18 percent, suggesting that Nigeria was able to grab market share from the previous top energy supplier to South Africa.
Moves on domestic currency markets impeded growth of Nigerian imports from the rest of the continent as tight foreign exchange supplies after the end of the commodity super-cycle capped the country’s imports. The sharp devaluation of the naira and subsequent measures by the Nigerian Central Bank to control speculation curtailed supply of foreign currency, which in turn constrained imports. The devaluation of the naira raised the competitiveness of locally manufactured goods in Nigeria. The drop in Nigeria’s demand for goods from the rest of Africa marginally affected South Africa, Nigeria’s largest import partner for chemicals, food
For instance, poor transport logistics undermines the competitiveness of the wood and apparel industries in Ethiopia and the consequent high transport cost erodes the industries’ labor cost advantage (Dinh et al. 2012). The report also highlights that labor productivity per worker in the light manufacturing sector is higher in Asia than in Africa. Poor skills, both managerial and technical, and high input costs are also significant impediments to the growth of light manufacturing industries in the continent.
The importance of light manufacturing industries for promoting growth and trade diversification in Africa has also informed the development of the African Export-Import Bank’s fifth strategic plan. The promotion of Pillar Two, Industrialization and Export Development, is essential to the growth
of Pillar One, Intra-Africa Trade. The Bank has already embarked on initiatives to support industrialization in Africa with a view to creating greater capacity for the production of value-added goods and to boosting intra-Africa trade. Key instruments that the Bank will deploy to achieve these objectives include the financing of industrial parks, production input financing facility, project financing line of credit, and construction and export manufacturing facility. The Bank is also working with various African governments establish and rehabilitate industrial parks or export processing zones to accelerate industrialization in support of intra-Africa trade and structural transformation. A shift from product concentration to value addition and differentiation under the strategy will ultimately diversify growth sources and boost intra-Africa trade.

AFREXIMBANK AFRICAN TRADE REPORT 2017 105
and vegetables, construction materials and vehicles.
Firmer exports and weaker imports helped Nigeria boost its trade surplus with the rest of Africa from US$7.2 billion in 2015 to US$9.6 billion in 2016. Nigeria is one of only two countries in the region to have an intra-African trade surplus of over US$3 billion (the other is South Africa). That said, these figures do not capture the thriving cross-border trade in Gulf of Guinea countries, involving Nigeria, Cameroon, Benin and Togo, but particularly between Nigeria and Cameroon, given their extensive and porous shared border. Food imports to Nigeria from Cameroon dominate this trade, while light equipment and cosmetics form part of the profile of goods from Nigeria to Cameroon.
Namibia is the last of the trio of countries that account for 40 percent of intra-African trade, with an estimated at US$12.7 billion in 2016, up from US$9.5 billion in 2014. The country has greatly boosted its share of intra-African trade, which rose 10.8 percent in 2015 and 20.5 percent in 2016. Namibia accounted for over 8 percent of intra-African trade in 2016, up from 6.1 percent in 2014 and 5.0 percent in 2010.
Two key drivers are the country’s strong trade links with South Africa and the growth of its precious minerals industry. South Africa has consistently been the source of over 70 percent of Namibia’s imports, even though Asian exporters, mainly China and the Republic of Korea, are starting to make some gains. The fluidity in South Africa–Namibia trade is enhanced by the countries’ membership in the Southern African Development Community, the South African Customs Union and the Common Monetary Area, whose currency peg keeps the Namibian dollar and the South African rand at parity. That peg helped mitigate the impact of the Namibian dollar’s depreciation in 2015 and allowed Namibian imports of vehicles, heavy and light manufacturing, and fuels to continue unabated in 2015–16.
Namibia also has a thriving export trade with Southern African Development Community countries, primarily Botswana, South Africa and Angola, which together account for around 50 percent of Namibia’s global export markets. About a quarter of Namibia’s merchandise exports comes from diamonds. Gold, zinc concentrate, uranium, manufactured goods, and food and live animals are also important. Botswana is the trade destination for around a quarter of Namibia’s diamond exports, by virtue of its world class diamond industry. In 2015–16 Namibia’s diamond mining sector faced headwinds owing to a modest decline in prices related to the slowdown in the global economy, particularly in China, which restrained discretionary spending. Further, Namibia saw a contraction in diamond supply attributable partly to the lower quality of diamonds mined by its diamond corporation Namdeb, which slowed the growth in diamond exports. However, the impact of smaller diamond exports on total intra-African exports was offset partly by a rebound in exportable uranium surpluses, firmer gold prices in 2016 and exports of small livestock. Otherwise, Namibia’s position as an important re-export hub in Southern Africa continues to support its burgeoning intra-African trade.
8.2 Intra-African trade developments for selected countries
Among other countries that have smaller but still-sizable shares of intra-African trade, Botswana, Zambia and Côte d’Ivoire saw a marked recovery in intra-African exports in 2016, after plummeting in 2015. Ghana, Mozambique, Democratic Republic of Congo and Zimbabwe all saw double-digit growth in intra-African imports in 2016—Ghana aside, building on the modest growth of their intra-African imports in 2015.
Commodity price shifts were a strong driver for intra-African trade, even among

106 CHAPTER EIGHT AFRICAN TRADE REPORT 2017
exporters such as Botswana, where the consistent growth of its intra-African exports reflects increased diamond sales, largely to South Africa. Botswana now accounts for 5.6 percent of intra-African trade, up from 4.6 percent in 2014.
In Zambia the decline in intra-African exports in 2015 was due partly to the slowdown in the global economy, which undermined prices for base metals, including copper, a key Zambian export, as well as demand from trade partners in Africa (mainly South Africa and Mozambique). The US dollar value of Zambia’s sugar exports to Democratic Republic of Congo and South Africa was stunted by softer prices, reflecting large global supplies, but the declines were compensated for partly by an increase in Zambia’s grain exports to the rest of Africa in 2015, with strong sales to Zimbabwe and, to a lesser extent, Malawi. Still, moderately firmer copper prices and a rally in sugar prices in 2016 helped boost the value of Zambia’s intra-African exports.
The V-shaped trend in Côte d’Ivoire’s exports to the rest of Africa was also driven by commodity prices, as the US dollar value of its refined petroleum exports to Nigeria, Mali, Burkina Faso, Togo and Cameroon dipped in line with the slump in energy prices in 2015 but improved in 2016, as energy prices began to recover. Oil dominates Côte d’Ivoire’s exports to the rest of Africa, accounting for more than a third of such exports. The decline in 2015 and subsequent recovery in 2016 of edible oil exports from Côte d’Ivoire to the rest of Africa also reflect the trend in global edible oil prices on international markets. Côte d’Ivoire expanded its share of intra-African trade from 4.8 percent in 2014 to 5.2 percent in 2016.
Trade with Côte d’Ivoire helped Ghana expand its share of intra-African trade as it ramped up imports. South Africa, Côte d’Ivoire and Guinea are three of the biggest sources of Ghana’s African imports.
Products are broad-based and include vehicles, construction equipment, foodstuffs and primary commodities (including cocoa, and oil and gold). Firmer commodity prices in 2016 helped boost the US dollar value of Ghana’s intra-African imports in 2016 while lifting the value of exports from other African countries.
Mozambique’s burgeoning power and infrastructure needs are helping drive its intra-African trade, with South Africa, from which Mozambique typically sources over 75 percent of its imports, the main beneficiary. Mozambique’s imports from Africa grew over 25 percent in 2016 (after declining 8 percent in 2015), which marginally increased the country’s share of intra-African trade.
Democratic Republic of Congo deepened its demand for imports from the rest of Africa, which after a tame performance in 2015 grew by 20 percent in 2016. South Africa and Zambia are the main sources of its African imports, accounting for more than 30 percent of the country’s total imports by value. Democratic Republic of Congo’s imports from South Africa range wide and include manufactured and intermediate goods, vehicles and consumer perishables. Democratic Republic of Congo’s main import categories from Zambia are agricultural commodities, energy products and chemicals. However, despite the significant increase in Democratic Republic of Congo’s import demand from Africa, the country’s share of intra-African trade stagnated in 2014–16 because of a large decline in its exports to the rest of Africa.
Zimbabwe deepened its trade links with the rest of Africa over 2015–16, expanding imports 26.5 percent in 2016 after a moderate decline in 2015. The decline largely reflected weaker prices for energy, which Zimbabwe sources from South Africa and Mozambique, and sluggish prices for grain, much of which it sources from Zambia. The rebound in the US dollar value of Zimbabwe’s intra-African imports partly reflects higher
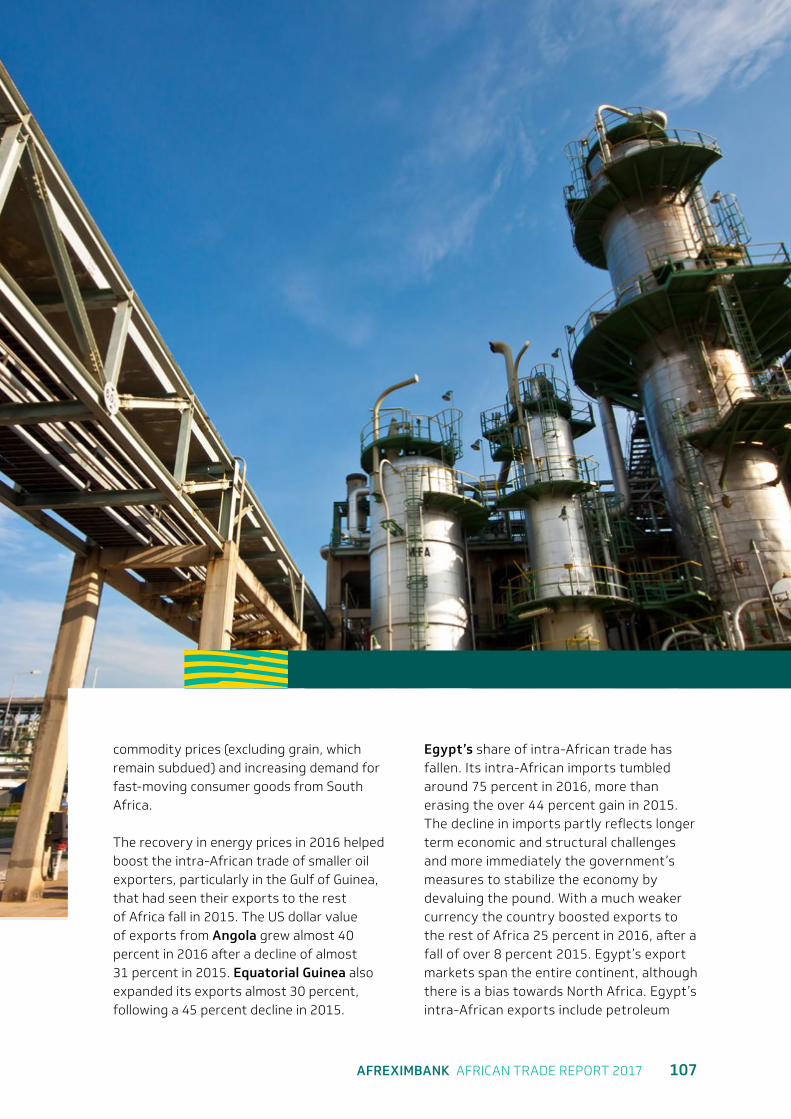
AFREXIMBANK AFRICAN TRADE REPORT 2017 107
commodity prices (excluding grain, which remain subdued) and increasing demand for fast-moving consumer goods from South Africa.
The recovery in energy prices in 2016 helped boost the intra-African trade of smaller oil exporters, particularly in the Gulf of Guinea, that had seen their exports to the rest of Africa fall in 2015. The US dollar value of exports from Angola grew almost 40 percent in 2016 after a decline of almost 31 percent in 2015. Equatorial Guinea also expanded its exports almost 30 percent, following a 45 percent decline in 2015.
Egypt’s share of intra-African trade has fallen. Its intra-African imports tumbled around 75 percent in 2016, more than erasing the over 44 percent gain in 2015. The decline in imports partly reflects longer term economic and structural challenges and more immediately the government’s measures to stabilize the economy by devaluing the pound. With a much weaker currency the country boosted exports to the rest of Africa 25 percent in 2016, after a fall of over 8 percent 2015. Egypt’s export markets span the entire continent, although there is a bias towards North Africa. Egypt’s intra-African exports include petroleum

108 CHAPTER EIGHT AFRICAN TRADE REPORT 2017
products and agricultural commodities, fast-moving consumer goods, and building and construction materials. The value of Egypt’s intra-African exports for 2016 is estimated at US$3.3 billion, which makes it the fifth largest intra-African exporter, after South Africa, Nigeria, Namibia and Côte d’Ivoire.
São Tomé and Príncipe, Cape Verde, Lesotho, Central African Republic and Guinea-Bissau are at the low end of the intra-African trade spectrum. Their share of intra-African trade is fettered by scarcity of natural resources, small markets and, for Central African Republic, socio-political instability. That said, there is anecdotal evidence of a thriving, albeit, informal trade in fast-moving consumer goods between Central African Republic and Cameroon, which is also supported by Cameroon’s seaport facilities.
The composition of intra-African trade is heavily skewed towards commodities, particularly oil and precious minerals such
as diamonds and gold, which have propelled commodity exporters and importers to a larger share of intra-African trade. More important for structural transformation (see chapter 2), the gradual rise of machinery and intermediate goods in recent years is encouraging because it suggests a move away from trading primary commodities to value-added products (Figure 8.4). Nonetheless, the growth rate of manufactured goods is marginal, reflecting still-low industrialization.
8.3 Trade within regional economic communities
Regional economic communities remain vibrant areas for intra-African trade and are gaining in prominence, especially given rising global protectionism. Although the US dollar value of intra-regional trade declined in 2015–16, this was more an indication of weaker US$ dollar–denominated commodity prices. For example, because oil and energy products account for over 40 percent of
Figure 8.4 Composition of intra-African trade for selected products, 2001–15 (%)
Source: International Trade Centre Trade Map database.
10% -
12% -
8% -
6% -
4% -
0% -
2% -
20102010
20102015
20152015
20142014
20142013
20132013
20122012
20122011
20112011
Precious minerals
Machinery and intermediate goods
Vehicles other than railway stocks
Electrical machinery and equipment
Iron and steel

AFREXIMBANK AFRICAN TRADE REPORT 2017 109
total trade by value in the Arab Maghreb Union and the Economic Community of West African States, the sharp decline in oil prices (47.2 in 2015 and 11.6 percent in 2016) similarly stifled the value of trade in these regional economic communities.
Among the six regional economic communities assessed, trade within the Southern African Development Community is the largest, followed by that within Economic Community of West African States (Figure 8.5). Trade within some regional economic communities is facilitated by currency arrangements, as in the Southern African Development Community and its four-country Common Monetary Area, which has mitigated the impact of currency volatility and helped keep trade buoyant in the subregion. Similarly, the CFA franc arrangement among eight Economic Community of West African States countries benefits cross-border trade in that subregion.
Trade within the Economic Community of Central African States remains muted, at
only US$1.1 billion in 2016. This is explained partly by the fact that it is made up of six countries with small economies, compared with 19 in the Economic Community of West African States and 15 in the Southern African Development Community, with weak complementarity in their merchandise trade profile.
Because of the East African Community’s diverse merchandise trade profile, with electrical goods, textiles, construction materials and agricultural products accounting for over 50 percent of trade and energy products making up less than 8 percent, the subregion’s intra-regional trade remained largely flat in 2015, at US$5.6 billion, showing greater resilience than trade within other regional economic communities, which declined. The inclusion of South Sudan as a new member in 2016 strengthened the bloc and promoted regional integration. It also provided seaport facilities to landlocked South Sudan and access to a market with a combined GDP of around US$155 billion.
Figure 8.5 Total trade within African regional economic communities, 2014–16 (US$ billion)
Source: International Trade Centre Trade Map database.
0 -
20 -
60 -
70 -
80 -
90 -
50 -
40 -
30 -
10 -
CEMAC SADCECOWASCOMESAUMAEAC
2014 2015 2016

9Chapter Nine

AFREXIMBANK AFRICAN TRADE REPORT 2017 111
Prospects
Global growth is projected to increase to 3.5 percent in 2017, up from 3.1 percent in 2016, supported by rising investment and manufacturing output coupled with a pick-up in global demand.
The gradual but steady improvement in activity among developed economies is projected to continue, driven by accommodative policies, especially expansionary fiscal policy in the United States and continued implementation of quantitative easing by the European Central Bank, the Bank of England and the Bank of Japan; by cyclical recovery; by rising global manufacturing; and by improving market confidence.
The US economy is projected to strengthen on the back of growing public spending, especially in infrastructure, increasing manufacturing and rising consumer spending in the face of strong job growth. In the Eurozone continuation of current trends is expected to keep the pace of growth at about 1.7 percent in 2017. Nonetheless, the Brexit vote and consequent uncertainty associated with the future relationship between the United Kingdom and the rest the European Union, along with the possibility of increased protectionism, constitute major downside risks for developed economies, with implications for global trade and growth.
Among developing economies growth is projected to strengthen slightly, driven
largely by strong activity in India and Brazil’s recovery from recession. Major downside risks include sustained growth deceleration in China as the country rebalances, with a consequent dampening effect on commodity prices and fiscal revenues in commodity-dependent countries; tighter external financing conditions; and pronounced reversal of capital flows to the United States on the back of the expected gradual increase in policy interest rates, with a likely strengthening of the dollar.
Other risks to growth include structural bottlenecks, domestic strife, political friction and geopolitical tensions, especially in parts of the Middle East, Eastern Europe and Africa. Unanticipated inflationary pressures could compel central banks to implement a contractionary monetary policy, with adverse implications for global growth, trade and investment.
Growth in the volume of global merchandise trade is projected to strengthen, accelerating to 2.4 percent in 2017, up from 1.3 percent in 2016. The rebound reflects expected improvement in the global economy led by synchronized expansion (though modest) in most developed economies, notably the United States, Canada, France and the United Kingdom, and a slight pick-up in developing economies driven by strong performance in India and recovery in Russia and Brazil. All of this could boost global trade growth. Potential downside risks largely mirror those for output.

112 CHAPTER NINE AFRICAN TRADE REPORT 2017
END
African economies are projected to strengthen, quickening to about 3.4 percent growth in 2017, up from 2.8 percent in 2016, largely reflecting the gradual recovery in developed economies and resultant knock-on effects on global demand. These elements should help sustain the upward momentum of most commodity prices and lift Africa’s merchandise trade growth. Projected recovery of the largest economies on the continent—notably the emergence of Nigeria from recession (as oil prices pick up and public investment strengthens) and modest recovery in South Africa and Angola—are also expected to pull up Africa’s GDP growth. Private consumption and investment, underpinned by increasing consumer confidence, continued improvement in the business environment and declining costs of doing business across the continent, and increasing government spending, especially on infrastructure, are other factors that should stimulate African growth in 2017.
The key downside risks are essentially those touched on just above.
Intra-African merchandise trade is projected to improve as African countries continue to undertake measures at the national and regional levels to insulate themselves from recurrent global shocks. These efforts include the development of infrastructure-supporting cross-border trade; initiatives to diversify the export base; establishment or reinforcement of regional blocs; and economic cooperation with a view to expanding cross-border and regional trade.
Longer term efforts across the continent to deepen regional integration, especially the Tripartite Free Trade Area Agreement, the Economic Community of West African States Common External Tariff and the Continental Free Trade Area, are expected to build a solid foundation for boosting intra-African trade.

AFREXIMBANK AFRICAN TRADE REPORT 2017 113
References
ACBF (African Capacity Building Foundation). 2015. “Africa Capacity Report: Capacity Imperatives for Domestic Resource Mobilisation”. Harare: ACBF.
AFDB (African Development Bank). 2014. “Trade Finance in Africa”. Tunis. https://www.afdb.org/fileadmin/uploads/afdb/Documents/Publications/Trade_Finance_Report_AfDB_EN_-_12_2014.pdf.
African Union. 2014. Agenda 2063: The Africa We Want. African Union, Addis Ababa. https://archive.au.int/assets/images/agenda2063.pdf
Ajayi, S. 1995. “Capital Flight and External Debt in Nigeria”. Research Paper No. 35, African Economic Research Consortium, Nairobi, Kenya.
Anuradhu, R. 2017. “Rubber Market Seen Boosted by Higher Commodity Prices”. Bloomberg. January 2017.
Artadi, E.V., and X. Sala-i-Martin. 2003. “The Economic Tragedy of the 20th Century: Growth in Africa”. National Bureau of Economic Research (NBER) Working Paper No. 9865, NBER, Cambridge, MA.
Australian Bureau of Meteorology. 2015. “El Niño strengthens but a warm Indian Ocean” http://www.bom.gov.au/climate/enso/archive/ensowrap_20150901.pdf.
Binagwaho, A., and J.D. Sachs. 2005. Investing in Development: A Practical Plan to Achieve the Millennium Development Goals. London: Earthscan.
Chang, H.-J. 2002. Kicking Away the Ladder: Development Strategy in Historical Perspective. London: Anthem Press.
Chong-Hyun, N., and K. Chang-Jin. 2000. “Capital Accumulation and Trade Policy: The Case of Korea”. International Economic Journal 14 (1): 111–31.
Dinh H. T., V. Palmade, V. Chandra, and F Cossar. 2012. Light Manufacturing in Africa: Targeted Policies to Enhance Private Investment and Create Jobs. World Bank, Washington, DC.
Dohner, R.S. 1981.“Energy prices, economic activity, and inflation: a survey of issues and results”. in K.A. Mork (ed.), Energy Prices, Economic Activity, and Inflation, Cambridge (Mass): Ballinger.
114 AFREXIMBANK AFRICAN TRADE REPORT 2017
Dowling, J.M., and U. Hiemenz. 1983. “Aid, Savings, and Growth in the Asian Region”. The Developing Economies 21 (1): 3–13.
Elhiraika, Adam and Ndikumana, Léonce. 2007. “Reserves Accumulation in African Countries: Sources, Motivations, and Effects”. Economics Department Working Paper Series. 24. http://scholarworks.umass.edu/econ_workingpaper/24.
European Commission. 2014. Trade and Investment Barriers Report 2014. Report from the Commission to the European Council. Brussels. http://trade.ec.europa.eu/doclib/docs/2014/march/tradoc_152272.pdf.
Fofack, H. 2014. “The Idea of Economic Development: Views from Africa”. World Institute for Development Economics Research (WIDER) Working Paper No. 2014/093, United Nations University-WIDER, Helsinki, Finland.
Fofack, H., and L. Ndikumana. 2009. “Potential Gains from Capital Flight Repatriation for Sub-Saharan African countries”. Policy Research Working Paper No. 5024, World Bank, Washington, DC.
Foster, Vivien and Cecilia Briceno-Garmendia. 2009. Africa’s Infrastructure: A Time for Transformation. Africa Development Forum Series. Washington, DC: World Bank. http://documents.worldbank.org/curated/ en/2009/01/11487313/africas-infrastructure-time-transformation.
Global Trade Alert. Online Monitoring Database. http://www.globaltradealert.org/.
Hansen, M.W., L. Buur, O. Therkildsen and M. Kjær. 2015. “The Political Economy of Local Content in African Extractives: Lessons from Three African Countries”. Paper presented at: Årsmøde i Dansk Selskab for Statskundskab, 23–24 October 2014, Vejle, Denmark. http://openarchive.cbs.dk/bitstream/handle/10398/9014/Wendelboe%20Hansen.pdf?sequence=1.
Hermes, N., and R. Lensink. 2014. “Financial Liberalization and Capital Flight: Evidence from the African Continent”. In Capital Flight from Africa: Causes, Effects, and Policy Issues, edited by S. Ibi Ajayi and Léonce Ndikumana, 164–99. Oxford, UK: Oxford University Press.
Hufbauer, G.C., J.J. Schott, C. Cimino, M. Viero and E. Wada. 2013. Local Content Requirements: A Global Problem. Policy Analyses in International Economics No. 102, Washington, DC: Peterson Institute of International Economics.
International Chamber of Commerce. 2013. “Localization Barriers to Trade”. ICC Policy Statement, Paris. https://cdn.iccwbo.org/content/uploads/sites/3/2014/06/LOCALIZATION-BARRIERS-TO-TRADE.pdf.
International Cocoa Organisation. 2017. Quarterly Bulletin of Cocoa Statistics, Vol. XLIII, No. 1. London.

AFREXIMBANK AFRICAN TRADE REPORT 2017 115
IMF (International Monetary Fund). 2017. “Nigeria: 2017 Article IV Consultation- Press Release”; Staff Report; and Statement by the Executive Director for Nigeria, Country report no.17/80. Washington, DC.
Isis, A. 2016. “ISO sees 2nd Global Sugar Shortage Eroding Surplus Stockpiles”. Bloomberg. May 2016
Lin, J.Y. 2012. “New Structural Economics: The Third Wave of Development Thinking”. The 12th Heinz W. Arndt Memorial Lecture, The Australian National University, Canberra, Australia, June 6.
———. 2013. “Demystifying the Chinese Economy”. Australian Economic Review 46 (3): 259–68.
Lin, J.Y., and C. Monga. 2010. “The Growth Report and New Structural Economics”. Policy Research Working Paper No. 5336, World Bank, Washington, DC.
Lin, J.Y., X. Sun and Y. Jiang. 2013. “Endowment, Industrial Structure and Appropriate Financial Structure: A New Structural Economics Perspective”. Journal of Economic Policy Reform 16 (2): 1–14.
Ndikumana, L. 2015. “Savings, Capital Flight, and African Development”. In The Oxford Handbook of Africa and Economics: Volume 2: Policies and Practices, edited by C. Monga and J.Y. Lin, 204–21. Oxford, UK: Oxford University Press.
Ndikumana, L., L. Pickbourn, T. Mannah-Blankson, J.K. Boyce, H. Fofack and A.S. Ndiaye. 2015. “The Role of Foreign Aid in Post-Conflict Countries”. Working Paper No. 405, Political Economy Research Institute, Amherst, MA.
Ndikumana, L., and T. Mannah Blankson. 2015. “Financing Domestic Investment in African Countries: Does the Source of Financing Matter?” Journal of African Development 17 (2): 21–44.
OECD (Organisation for Economic Co-operation and Development), WTO (World Trade Organization) and UNCTAD (United Nations Conference on Trade and Development). 2016. 16th Report on G20 Trade and Investment Measures. Paris.
Schaffer, M.E. 1998. “Do Firms in Transition Economies Have Soft Budget Constraints? A Reconsideration of Concepts and Evidence”. Journal of Comparative Economics 26 (1): 80–103.
Stone, S., J. Messent and D. Flaig. 2015. “Emerging Policy Issues: Localisation Barriers to Trade”. OECD Trade Policy Paper No. 180, Organisation for Economic Co-operation and Development, Paris. http://dx.doi.org/10.1787/5js1m6v5qd5j-en.
UNCTAD (United Nations Conference on Trade and Development). 2015a. “Building the African Continental Free Trade Area: Some Suggestions on the Way Forward”. UNCTAD Policy Paper. New York and Geneva. http://unctad.org/en/PublicationsLibrary/ditc2015misc1_en.pdf.

116 AFREXIMBANK AFRICAN TRADE REPORT 2017
———. 2015b. Review of Maritime Transport. UNCTAD Report. New York and Geneva
USAID (United States Agency for International Development). 2016. “Domestic Resource Mobilization”. Washington, DC. https://www.usaid.gov/what-we-do/economic-growth-and-trade/domestic-resource-mobilization.
USDA (United States Department of Agriculture Production). 2017. Supply and Distribution, Foreign Agricultural Service.
Vos, R., M. Sánchez and K. Inoue. 2007. “Constraints to Achieving the MDGs through Domestic Resource Mobilization”. Department of Economic and Social Affairs (DESA) Working Paper No. 36, United Nations-DESA, New York.
WEF (World Economic Forum) and the Boston Consulting Group. 2014. Strategic Infrastructure Steps to Operate and Maintain Infrastructure Efficiently and Effectively. http://www3.weforum.org/docs/WEF_IU_StrategicInfrastructureSteps_Report_2014.pdf.
WEF (World Economic Forum) and Global Alliance for Trade Facilitation. 2016. The Global Enabling Trade Report 2016. Washington, DC. Weisskopf, T.E. 1973. “Dependence and Imperialism in India”. Review of Radical Political Economics 5 (1): 53–96.
Whitfield, L., O. Therkildsen, L. Buur and M. Kjær. 2015. The Politics of African Industrial Policy: A Comparative Perspective. Cambridge, UK: Cambridge University Press.
World Bank. 2010. “Results Profile: China Poverty Reduction”. Washington, DC. http://www.worldbank.org/en/news/feature/2010/03/19/results-profile-china-poverty-reduction.
WTO (World Trade Organization). 2015. World Trade Report. WTO: Geneva
———. 2016a. “Overview of Developments in International Trading Environment: Annual Report by the Director-General.” Geneva.
2016b. World Trade Statistical Review 2016. Geneva.
———. 2017. “Trade Recovery Expected in 2017 and 2018, amid Policy Uncertainty”. Press Release 793. Geneva. www.wto.org/english/news_e/pres17_e/pr791_e.htm.
Zhang, Li. 2016. “Rebalancing in China–Progress and Prospects”. IMF Working Paper, WP/16/183, Washington, DC.


HEADQUARTERS72(B) El-Maahad El-Eshteraky Street, (Opposite Merryland Park) Heliopolis,
Cairo 11341, EgyptPostal Address: P.O. Box 613 Heliopolis,
Cairo 11757, EgyptTel: +20 2 24564100/1/2/3
ABUJA BRANCHNo. 2 Gnassingbe Eyadema Street,
Asokoro, Abuja, NigeriaPostal Address: PMB 601 Garki, Abuja, Nigeria
Tel: +234 9 4603160
HARARE BRANCHEastgate Building, 3rd Floor, Gold Bridge
(North Wing), 2nd Street,Harare, Zimbabwe
Postal Address: P.O. Box 1600 Causeway,Harare, Zimbabwe
Tel: +263 4 700941/904
ABIDJAN BRANCHAngle Boulevard Botreau Roussel,
Rue Privée CRRAE – UMOAPostal Address : 01 BP 5634, Abidjan 01, Côte
d’IvoireTel: +225 20 307300
WEBSITEwww.afreximbank.com

African Trade Report2017