african mega trends: shaping and prolonging the future of lubricants
TRANSCRIPT
1
We Accelerate Growth
African Mega Trends: Shaping and
Prolonging the Future of LubricantsUnlocking Africa’s potential
“The 2nd ICIS African Base Oils & Lubricants Conference”
by Anthony Lawrence
2
Africa’s Mega Trends – The Future for Lubricants
Table of Contents
Why Frost & Sullivan
Mega Trends & Africa Perspective
What does this all mean for the Lubricants Market?
Snap shot into key African Markets
What does the future hold for the lubricants market?
3
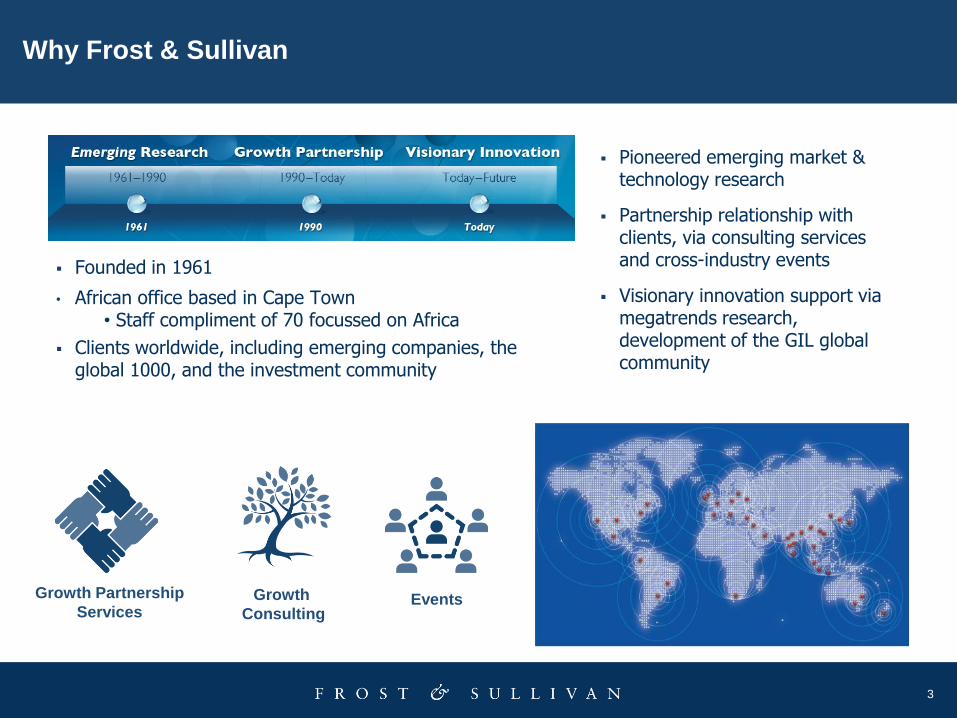
Why Frost & Sullivan
Founded in 1961
• African office based in Cape Town• Staff compliment of 70 focussed on Africa
Clients worldwide, including emerging companies, the global 1000, and the investment community
Growth Partnership
ServicesGrowth
ConsultingEvents
Pioneered emerging market & technology research
Partnership relationship with clients, via consulting services and cross-industry events
Visionary innovation support via megatrends research, development of the GIL global community
4
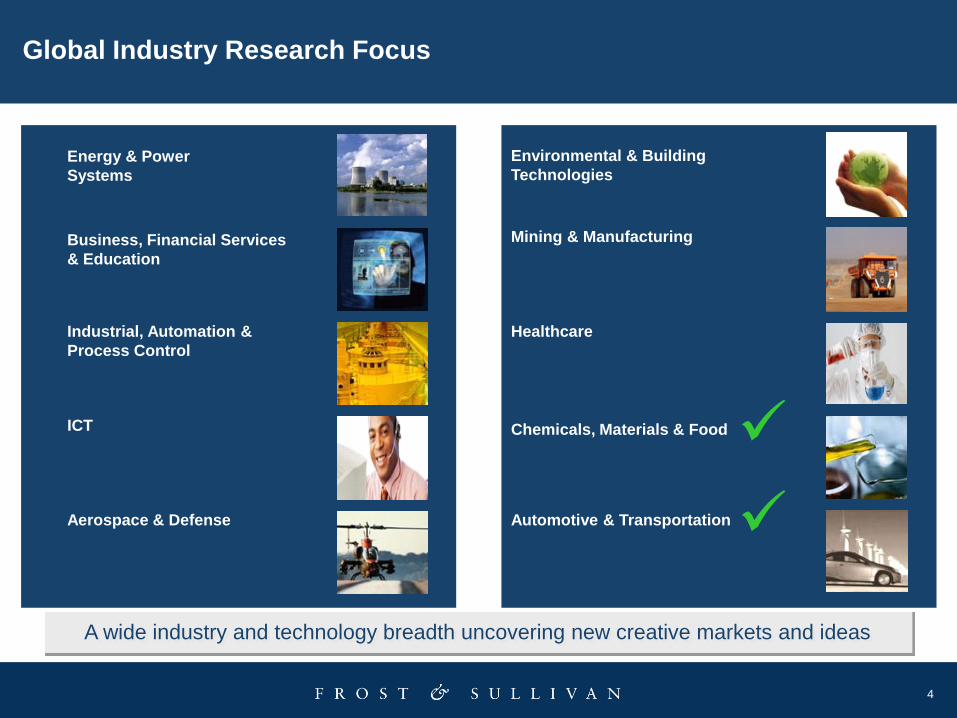
Mining & Manufacturing
Industrial, Automation &
Process Control
Business, Financial Services
& Education
Environmental & Building
Technologies
Healthcare
Energy & Power
Systems
ICT Chemicals, Materials & Food
Aerospace & Defense Automotive & Transportation
A wide industry and technology breadth uncovering new creative markets and ideas
Global Industry Research Focus
5
How we align our research with your needs
Relevant Global/ African
Mega Trends
Selection of
relevant Mega
Trends in Africa
Design the
research for
most relevant
sectors
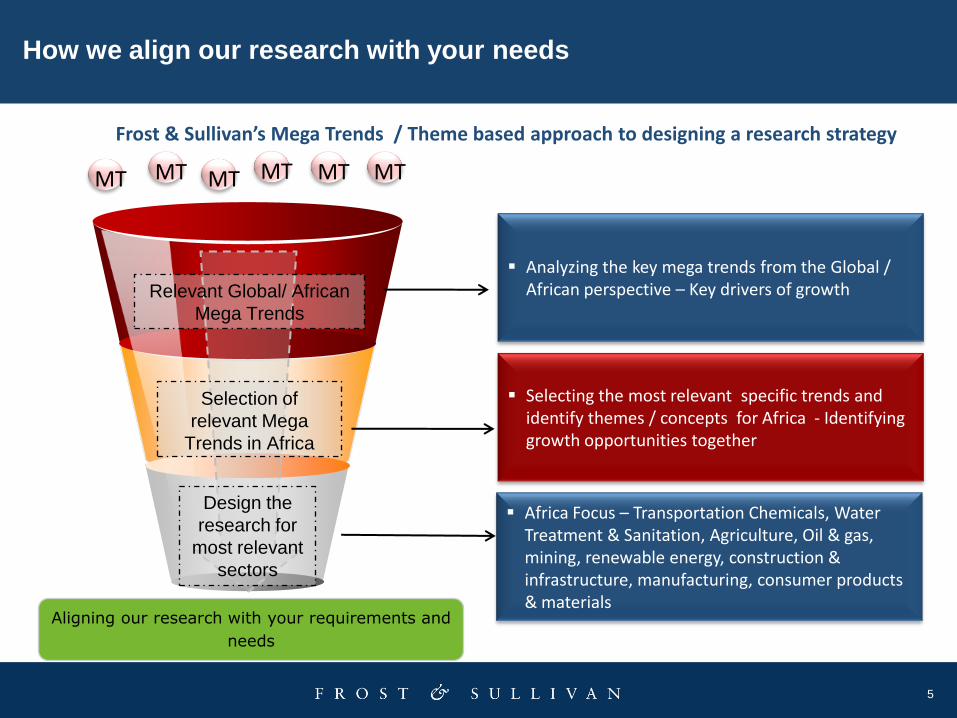
Frost & Sullivan’s Mega Trends / Theme based approach to designing a research strategy
Analyzing the key mega trends from the Global / African perspective – Key drivers of growth
Selecting the most relevant specific trends and identify themes / concepts for Africa - Identifying growth opportunities together
Africa Focus – Transportation Chemicals, Water Treatment & Sanitation, Agriculture, Oil & gas, mining, renewable energy, construction & infrastructure, manufacturing, consumer products & materials
MT MT MT MT MTMT
Aligning our research with your requirements and
needs
6
Mega Trends & Africa Perspective
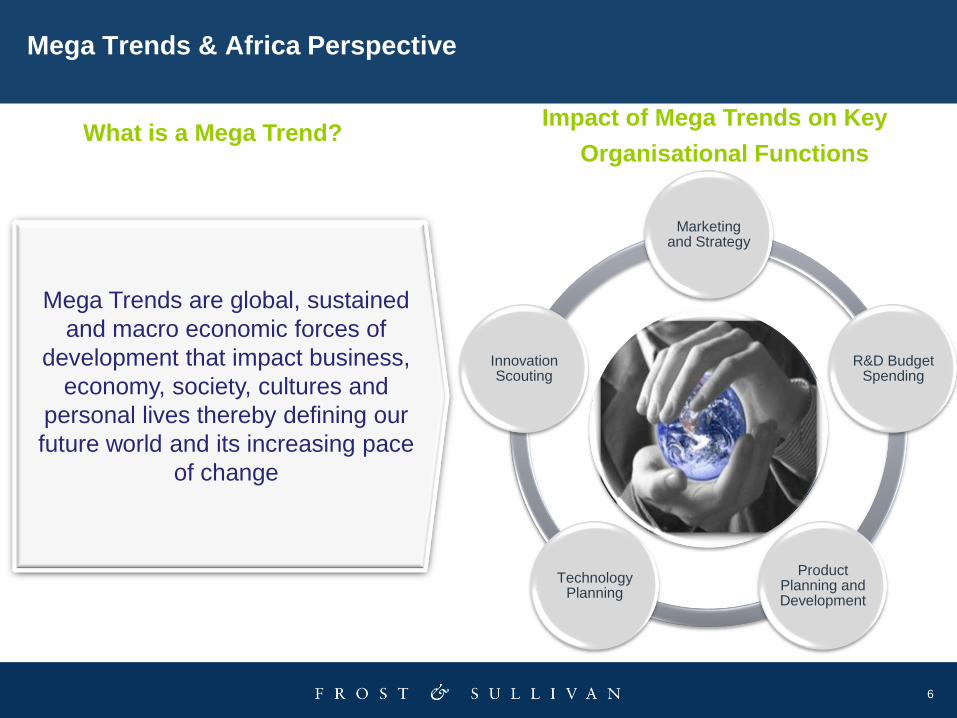
What is a Mega Trend? Impact of Mega Trends on Key
Organisational Functions
Mega Trends are global, sustained
and macro economic forces of
development that impact business,
economy, society, cultures and
personal lives thereby defining our
future world and its increasing pace
of change
Marketing and Strategy
R&D Budget Spending
Product Planning and Development
TechnologyPlanning
InnovationScouting
7
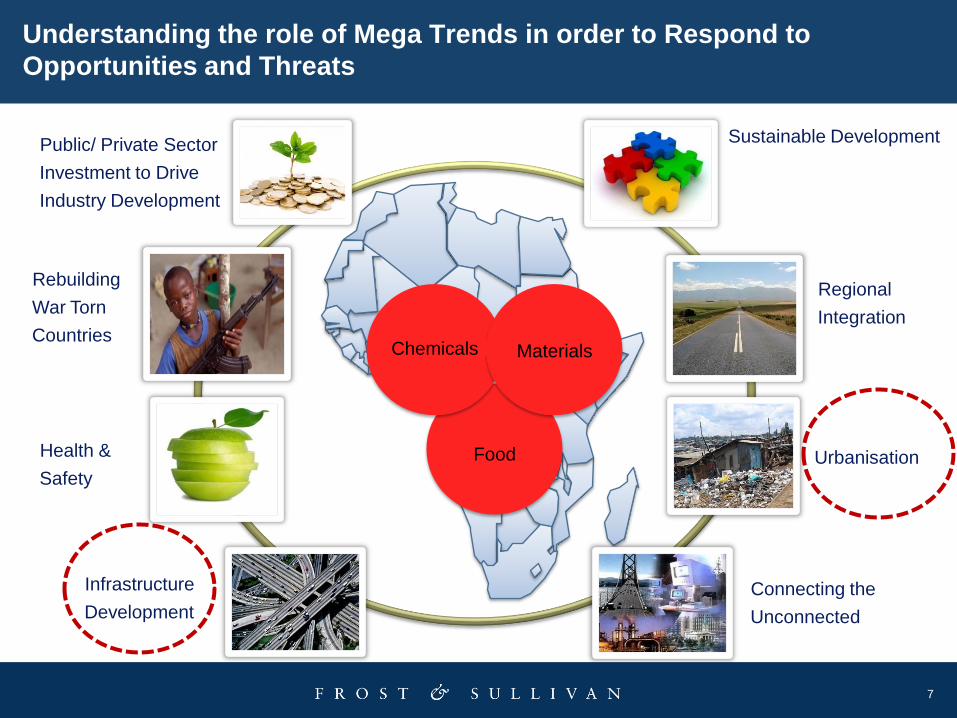
Regional
Integration
Public/ Private Sector
Investment to Drive
Industry Development
Infrastructure
Development
Sustainable Development
Connecting the
Unconnected
Urbanisation
Chemicals Materials
Food
Rebuilding
War Torn
Countries
Health &
Safety
Understanding the role of Mega Trends in order to Respond to
Opportunities and Threats
8
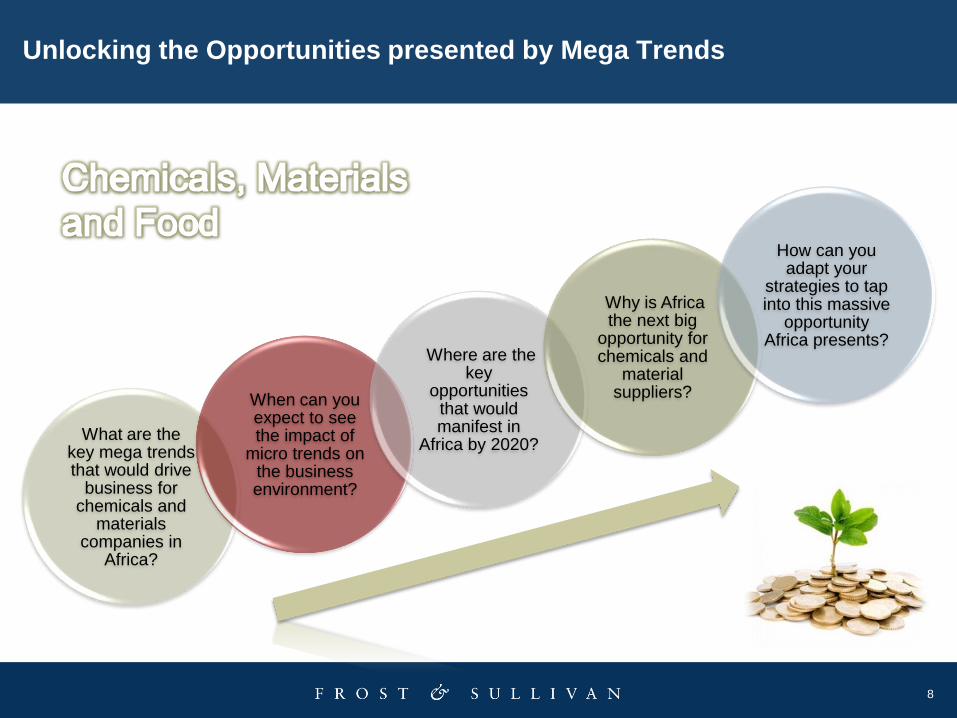
Unlocking the Opportunities presented by Mega Trends
What are the key mega trends that would drive
business for chemicals and
materials companies in
Africa?
When can you expect to see the impact of
micro trends on the business environment?
Where are the key
opportunities that would manifest in
Africa by 2020?
Why is Africa the next big
opportunity for chemicals and
material suppliers?
How can you adapt your
strategies to tap into this massive
opportunity Africa presents?
9
HOW DOES URBANISATION
INFLUENCE YOUR BUSINESS?
What does this mean for the Lubricants Market…
10
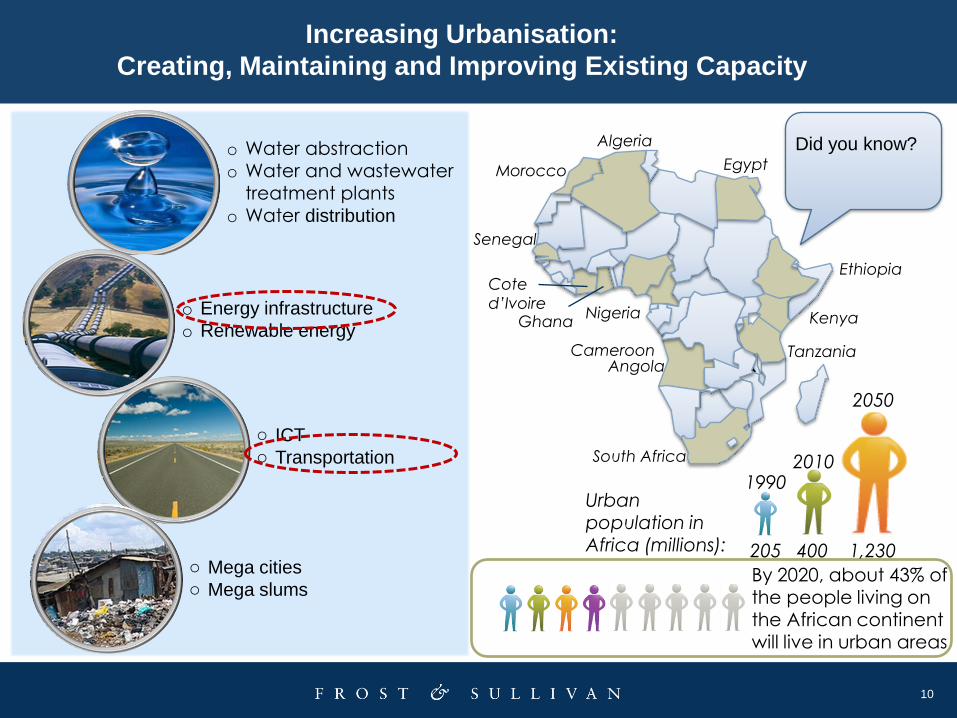
Increasing Urbanisation:
Creating, Maintaining and Improving Existing Capacity
o Water abstractiono Water and wastewater
treatment plantso Water distribution
o Energy infrastructure
o Renewable energy
o ICT o Transportation
o Mega citieso Mega slums
By 2020, about 43% of the people living on
the African continent will live in urban areas
Urban population in Africa (millions): 205
19902010
400
2050
1,230
`
South Africa
AngolaTanzania
Kenya
Ethiopia
Egypt
Algeria
Morocco
Cameroon
Nigeria
Cote
d’IvoireGhana
Senegal
Did you know?
11
HOW DOES INFRASTRUCTURE
INFLUENCE YOUR BUSINESS?
What does this mean for the Lubricants Market…
12
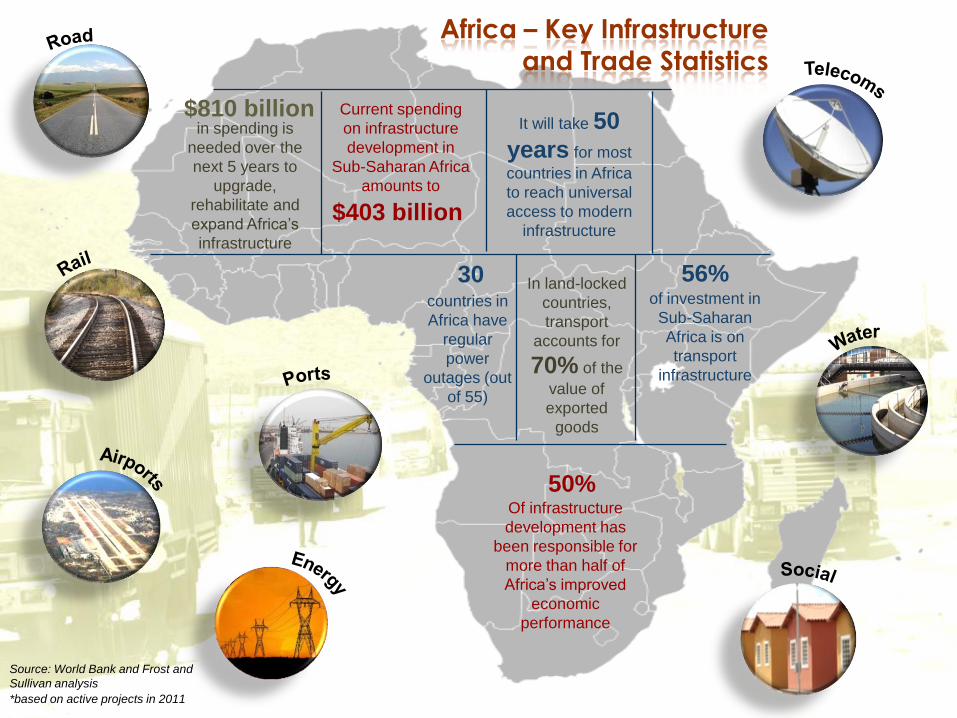
Africa – Key Infrastructure and Trade Statistics
$403 billion
Current spending
on infrastructure
development in
Sub-Saharan Africa
amounts to
of investment in
Sub-Saharan
Africa is on
transport
infrastructure
56%In land-locked
countries,
transport
accounts for
70% of the
value of
exported
goods
countries in
Africa have
regular
power
outages (out
of 55)
30
It will take 50
years for most
countries in Africa
to reach universal
access to modern
infrastructure
50%Of infrastructure
development has
been responsible for
more than half of
Africa’s improved
economic
performance
*based on active projects in 2011
Source: World Bank and Frost and
Sullivan analysis
$810 billionin spending is
needed over the
next 5 years to
upgrade,
rehabilitate and
expand Africa’s
infrastructure
13
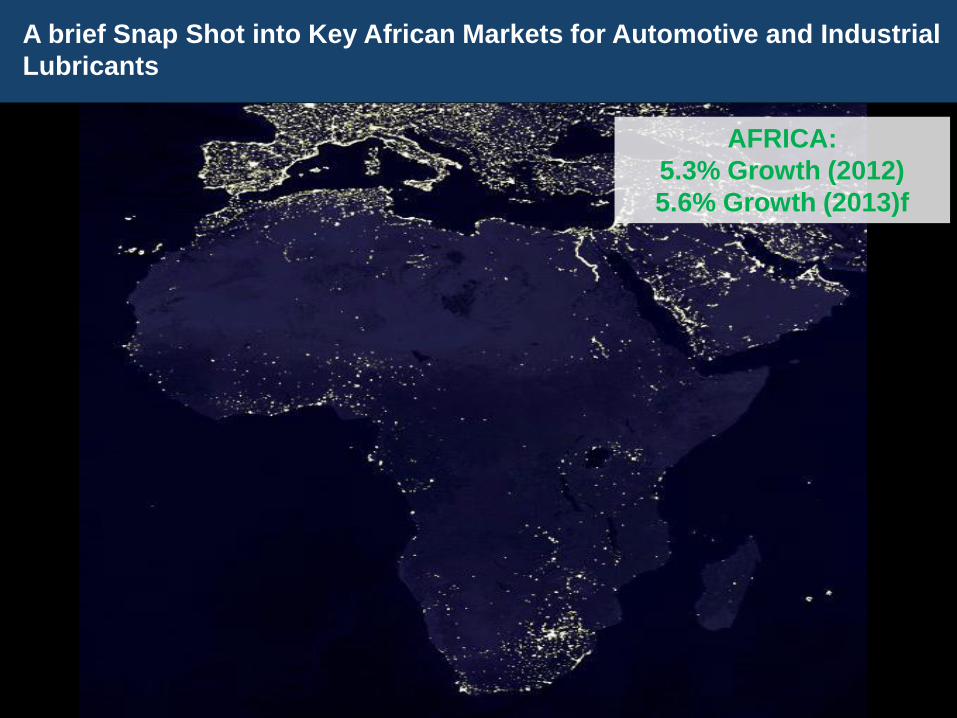
A brief Snap Shot into Key African Markets for Automotive and Industrial
Lubricants
AFRICA:
5.3% Growth (2012)
5.6% Growth (2013)f
14
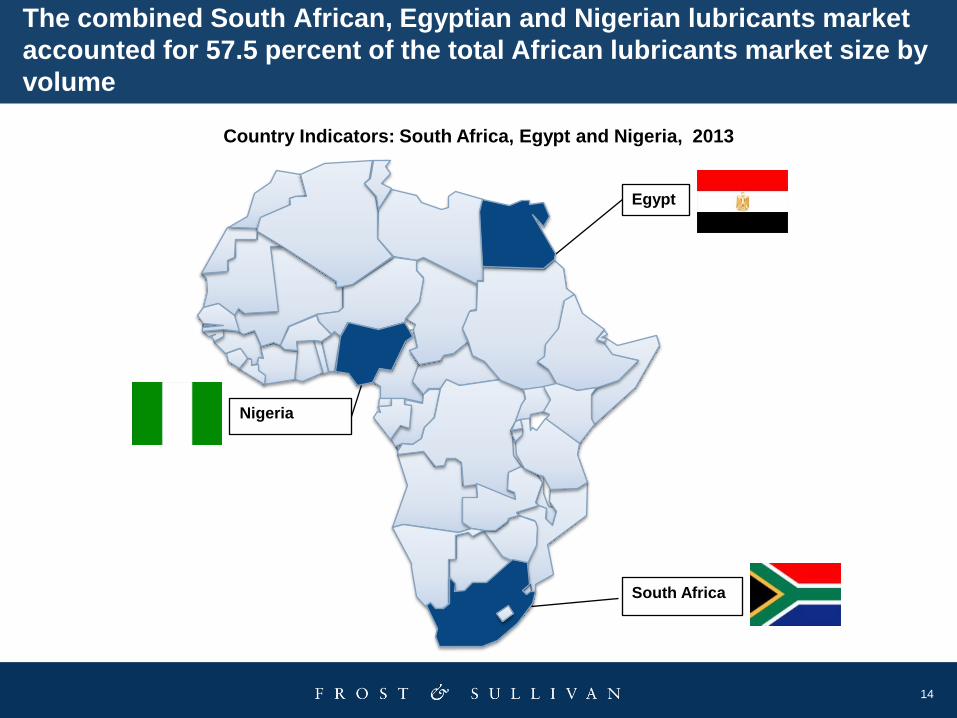
Country Indicators: South Africa, Egypt and Nigeria, 2013
Egypt
Nigeria
`
The combined South African, Egyptian and Nigerian lubricants market
accounted for 57.5 percent of the total African lubricants market size by
volume
South Africa
15
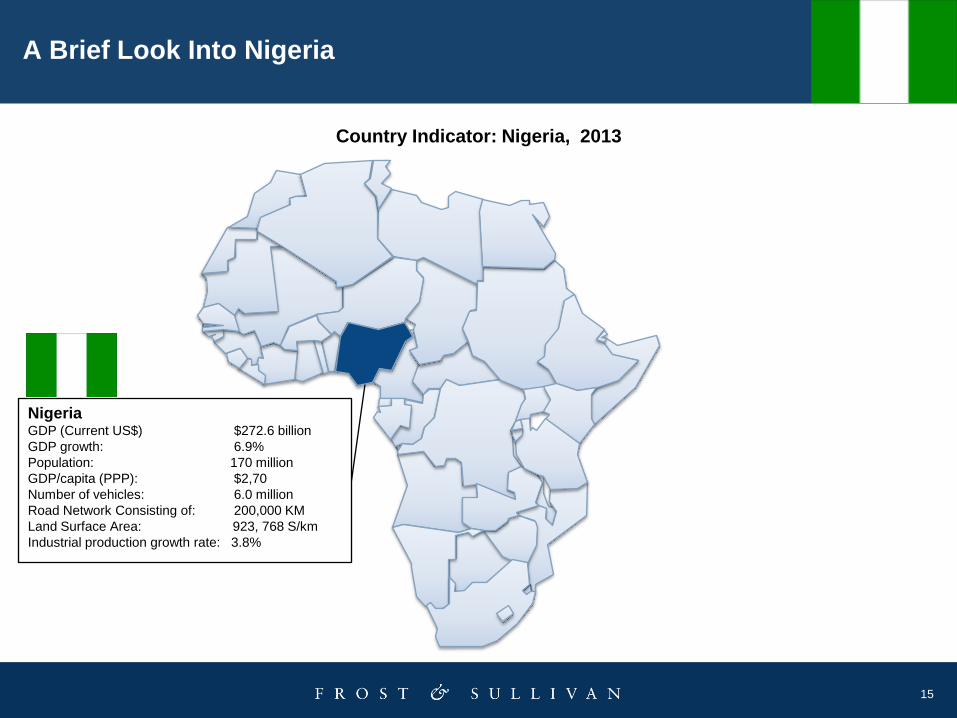
Country Indicator: Nigeria, 2013
NigeriaGDP (Current US$) $272.6 billion
GDP growth: 6.9%
Population: 170 million
GDP/capita (PPP): $2,70
Number of vehicles: 6.0 million
Road Network Consisting of: 200,000 KM
Land Surface Area: 923, 768 S/km
Industrial production growth rate: 3.8%
`
A Brief Look Into Nigeria
16
Note: All figures are rounded.
Source: Frost & Sullivan
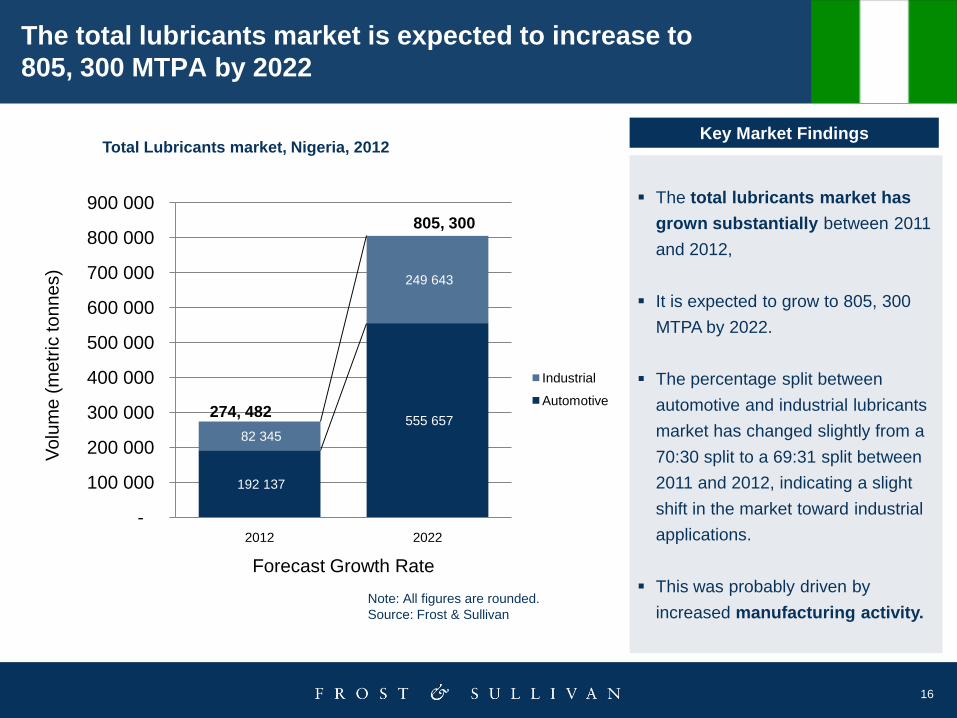
Total Lubricants market, Nigeria, 2012Key Market Findings
The total lubricants market has
grown substantially between 2011
and 2012,
It is expected to grow to 805, 300
MTPA by 2022.
The percentage split between
automotive and industrial lubricants
market has changed slightly from a
70:30 split to a 69:31 split between
2011 and 2012, indicating a slight
shift in the market toward industrial
applications.
This was probably driven by
increased manufacturing activity.
The total lubricants market is expected to increase to
805, 300 MTPA by 2022
192 137
555 657
82 345
249 643
-
100 000
200 000
300 000
400 000
500 000
600 000
700 000
800 000
900 000
2012 2022
Vo
lum
e (
me
tric
to
nn
es)
Forecast Growth Rate
Industrial
Automotive274, 482
805, 300
17
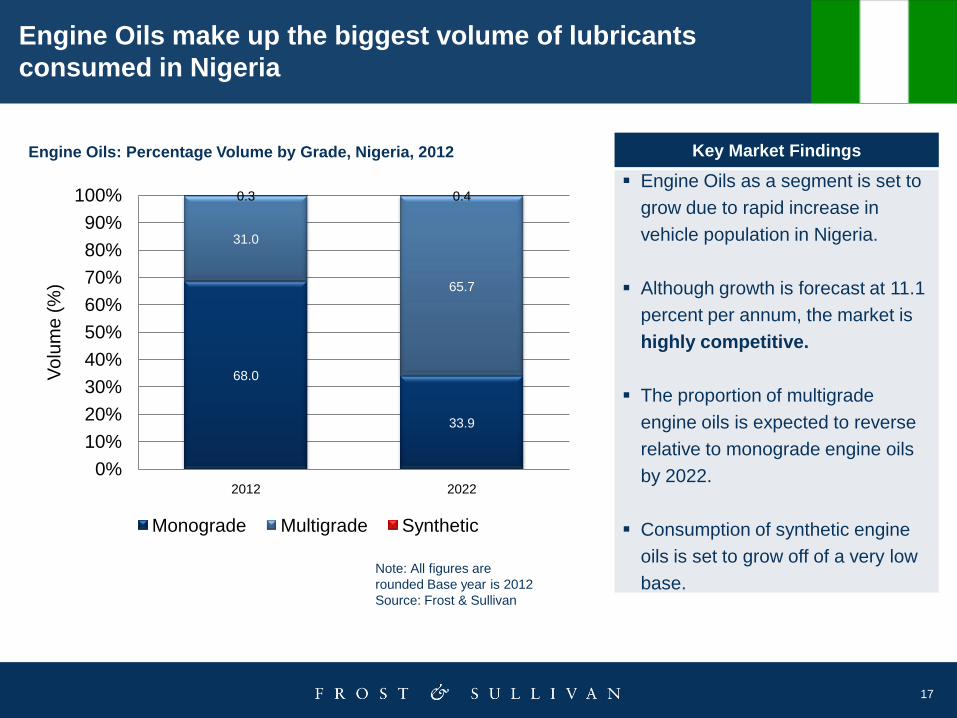
Note: All figures are
rounded Base year is 2012
Source: Frost & Sullivan
Key Market Findings
Engine Oils as a segment is set to
grow due to rapid increase in
vehicle population in Nigeria.
Although growth is forecast at 11.1
percent per annum, the market is
highly competitive.
The proportion of multigrade
engine oils is expected to reverse
relative to monograde engine oils
by 2022.
Consumption of synthetic engine
oils is set to grow off of a very low
base.
Engine Oils make up the biggest volume of lubricants
consumed in Nigeria
Engine Oils: Percentage Volume by Grade, Nigeria, 2012
68.0
33.9
31.0
65.7
0.3 0.4
0%
10%
20%
30%
40%
50%
60%
70%
80%
90%
100%
2012 2022
Vo
lum
e (
%)
Monograde Multigrade Synthetic
18
Total Nigeria Plc hold the leading market share in terms
of the total market for lubricants in Nigeria
• Six tier one suppliers hold about just over 70
percent of the total lubricants market in
Nigeria.
• TOTAL Nigeria Plc is Nigeria’s lubricant
market leader in terms of the total market
share, followed by the leading indigenous
company, Conoil Plc.
• TOTAL was the only Tier 1 supplier that grew
its market share since 2011, as well as its
revenue from lubricants.
• The remaining Tier 1 suppliers lost market
share, predominantly to an increase in the
number of independent suppliers.
Analysis of the competitor market
19
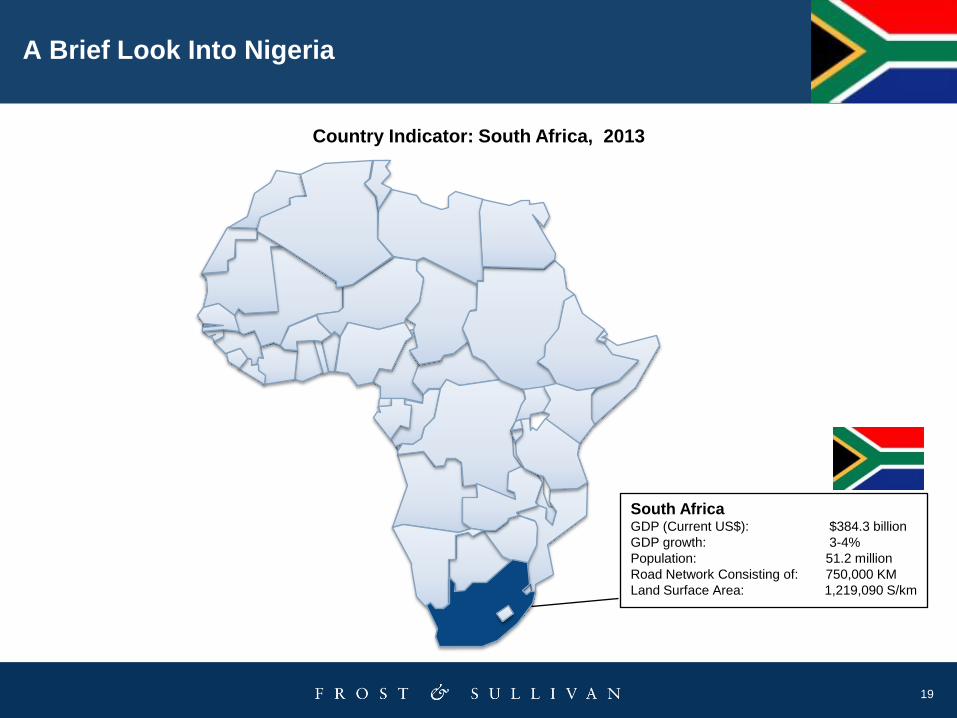
Country Indicator: South Africa, 2013
` South AfricaGDP (Current US$): $384.3 billion
GDP growth: 3-4%
Population: 51.2 million
Road Network Consisting of: 750,000 KM
Land Surface Area: 1,219,090 S/km
A Brief Look Into Nigeria
20
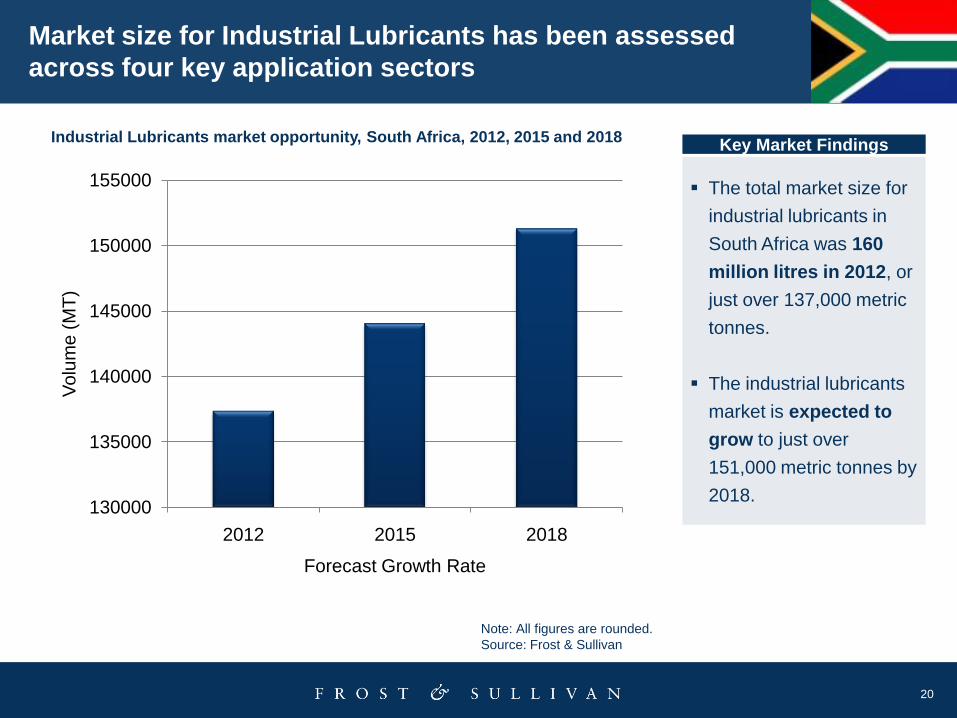
Note: All figures are rounded.
Source: Frost & Sullivan
Industrial Lubricants market opportunity, South Africa, 2012, 2015 and 2018Key Market Findings
The total market size for
industrial lubricants in
South Africa was 160
million litres in 2012, or
just over 137,000 metric
tonnes.
The industrial lubricants
market is expected to
grow to just over
151,000 metric tonnes by
2018.
Market size for Industrial Lubricants has been assessed
across four key application sectors
130000
135000
140000
145000
150000
155000
2012 2015 2018
Vo
lum
e (
MT
)
Forecast Growth Rate
21
Note: All figures are rounded
Base year is 2012
Source: Frost & Sullivan
Key Market Findings
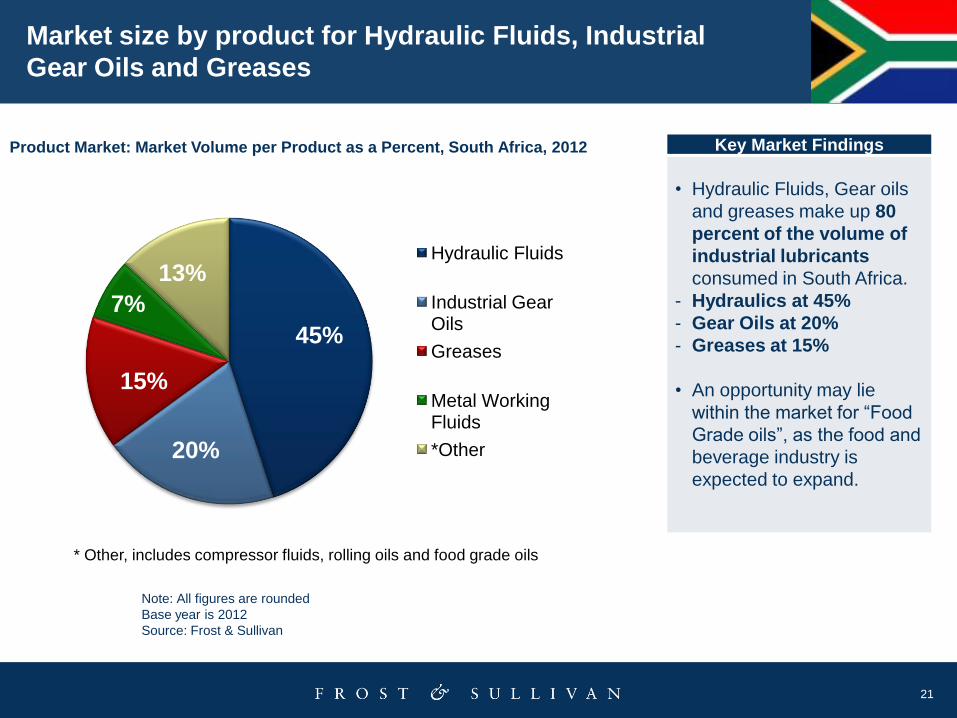
• Hydraulic Fluids, Gear oils
and greases make up 80
percent of the volume of
industrial lubricants
consumed in South Africa.
- Hydraulics at 45%
- Gear Oils at 20%
- Greases at 15%
• An opportunity may lie
within the market for “Food
Grade oils”, as the food and
beverage industry is
expected to expand.
Market size by product for Hydraulic Fluids, Industrial
Gear Oils and Greases
Product Market: Market Volume per Product as a Percent, South Africa, 2012
45%
20%
15%
7%
13%Hydraulic Fluids
Industrial Gear Oils
Greases
Metal Working Fluids
*Other
* Other, includes compressor fluids, rolling oils and food grade oils
22
Five of the major oil companies make up 80-90 percent of the
industrial lubricants market
• The major oil companies make up 80 - 90
percent of the industrial lubricants market.
• Shell and Chevron have the largest shares
of industrial lubricants.
• Engen, Castrol BP and TOTAL hold the
3rd, 4th and 5th position, respectively, in
terms of market share for industrial
lubricants in South Africa.
• The remainder of the market is split between
Fuchs, SASOL and a multitude of
independent blenders manufacturing a
wide range of products.
Analysis of the competitor market
23
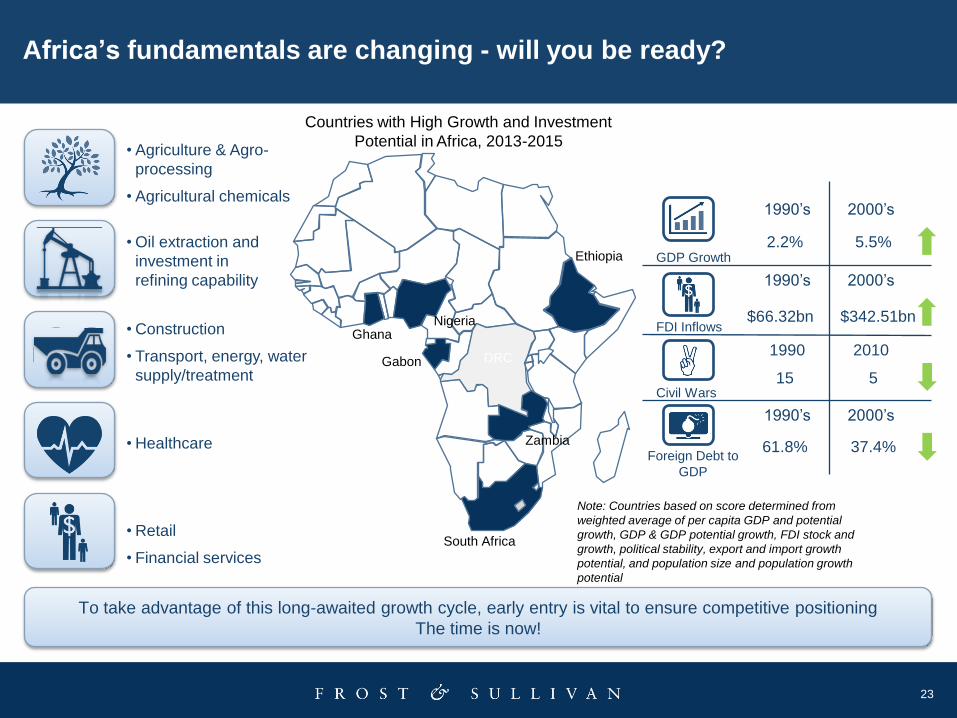
Africa’s fundamentals are changing - will you be ready?
To take advantage of this long-awaited growth cycle, early entry is vital to ensure competitive positioning
The time is now!
GDP Growth
1990’s 2000’s
FDI Inflows
Civil Wars
2.2% 5.5%
1990 2010
1990’s 2000’s
15 5
$66.32bn $342.51bn
Foreign Debt to
GDP
1990’s 2000’s
61.8% 37.4%
• Agriculture & Agro-
processing
• Agricultural chemicals
• Oil extraction and
investment in
refining capability
• Construction
• Transport, energy, water
supply/treatment
• Healthcare
Nigeria
Zambia
Ethiopia
DRC
Ghana
Note: Countries based on score determined from
weighted average of per capita GDP and potential
growth, GDP & GDP potential growth, FDI stock and
growth, political stability, export and import growth
potential, and population size and population growth
potential
Countries with High Growth and Investment
Potential in Africa, 2013-2015
• Retail
• Financial servicesSouth Africa
Gabon
24
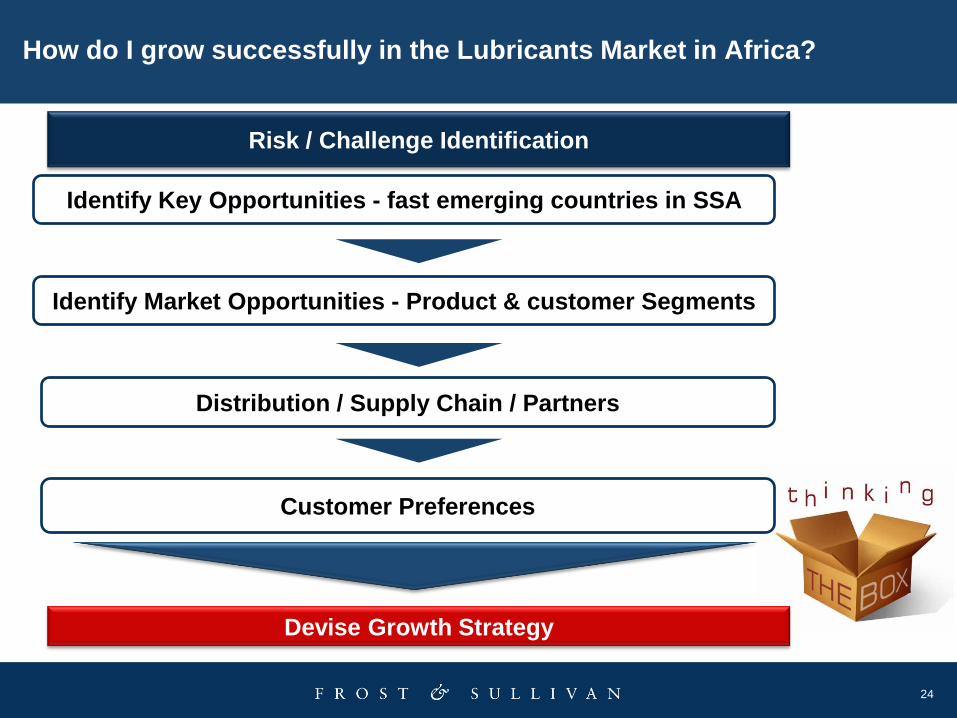
How do I grow successfully in the Lubricants Market in Africa?
Risk / Challenge Identification
Identify Key Opportunities - fast emerging countries in SSA
Identify Market Opportunities - Product & customer Segments
Distribution / Supply Chain / Partners
Customer Preferences
Devise Growth Strategy
25
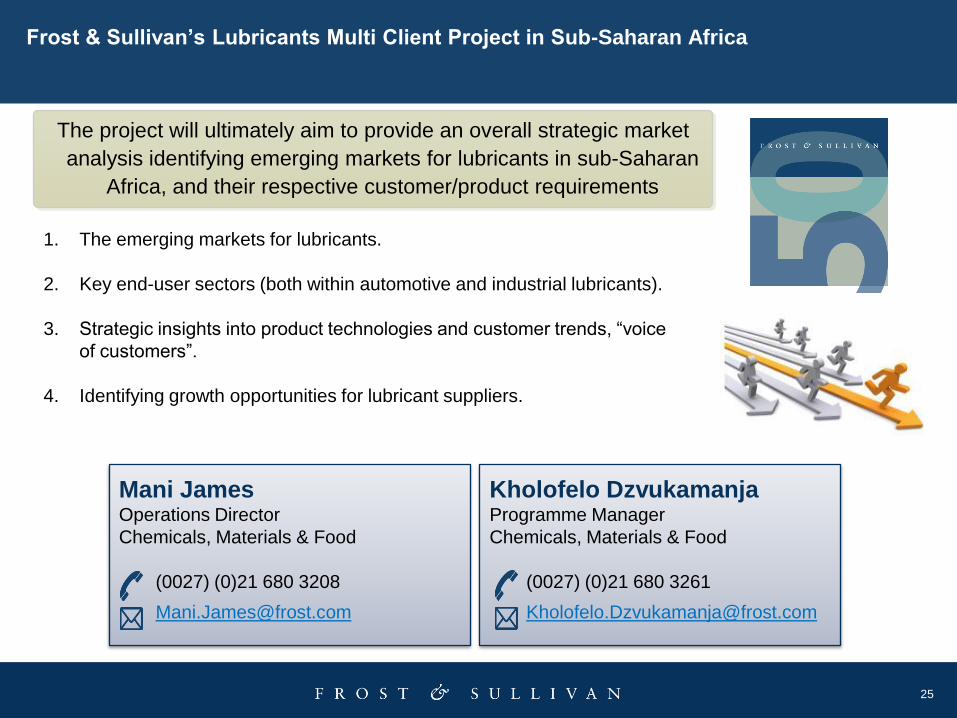
Frost & Sullivan’s Lubricants Multi Client Project in Sub-Saharan Africa
1. The emerging markets for lubricants.
2. Key end-user sectors (both within automotive and industrial lubricants).
3. Strategic insights into product technologies and customer trends, “voice
of customers”.
4. Identifying growth opportunities for lubricant suppliers.
Mani James Operations Director
Chemicals, Materials & Food
(0027) (0)21 680 3208
Kholofelo DzvukamanjaProgramme Manager
Chemicals, Materials & Food
(0027) (0)21 680 3261
The project will ultimately aim to provide an overall strategic market
analysis identifying emerging markets for lubricants in sub-Saharan
Africa, and their respective customer/product requirements
26
Thank You