african easterly jet: structure and maintenance · the african easterly jet ... feature controlling...
TRANSCRIPT

African Easterly Jet:Structure and Maintenance
Man-Li C. Wu*
Global Modeling and Assimilation OfficeNASA Goddard Space Flight Center
Greenbelt, Maryland 20771
Oreste Reale tLaboratory for Atmospheres
NASA Goddard Space Flight CenterGreenbelt, Maryland 20771
Siegfried D. SchubertMax J. Suarez
Randy D. KosterPhilip J. Pegion t
Global Modeling and Assimilation OfficeNASA Goddard Space Flight Center
Greenbelt, Maryland 20771
May 20, 2009
*Email [email protected] Affiliation: University of Maryland, Baltimore County, Baltimore, Maryland# Current Affiliation: National Ocean and Atmosphere Administration, Camps Springs, Mary-
land
1
https://ntrs.nasa.gov/search.jsp?R=20090026605 2018-07-12T05:10:58+00:00Z

Abstract
This article investigates the African Easterly Jet (AEJ), its structure and the forc-
ings contributing to its maintenance, critically revisiting previous work which at-
tributed the maintenance of the jet to soil moisture gradients over tropical Africa.
A state-of-the-art global model in a high-end computer framework is used
to produce a 3-member 73-year ensemble run forced by observed SST to repre-
sent the Control run. The AEJ as produced by the Control is compared with the
representation of the AEJ in the European Center for Medium Range Forecast
Reanalyses (ERA-40) and other observational data sets and found very realistic.
Five Experiments are then performed, each represented by sets of 3-member
22 year long (1980-2001) ensemble runs. The goal of the Experiments is to inves-
tigate the role of meridional soil moisture gradients, different land surface proper-
ties and orography. Unlike previous studies, which have suppressed soil moisture
gradients within a highly idealized framework (i.e., the so-called bucket model),
terrestrial evaporation control is here achieved with a highly sophisticated land-
surface treatment and with an extensively tested and complex methodology. The
results show that the AEJ is suppressed by a combination of absence of meridional
evaporation gradients over Africa and constant vegetation, even if the individual
forcings taken separately do not lead to the AEJ disappearance, but only its modifi-
cation. Moreover, the suppression of orography also leads to a different circulation
in which there is no AEJ. This work suggests that it is not just soil moisture gradi-
ents, but a unique combination of geographical features present only in northern
tropical Africa, which causes and maintains the jet.

1. Introduction
The African Easterly Jet (AEJ) is one of the most complex and intriguing dynami-
cal features in tropical meteorology. It raises a number of questions, ranging from
its formation mechanism to its maintenance, and from the causes of its intensity
fluctuations to its role in generating weather systems. The AEJ is a crucial element
in global-, synoptic- and meso-scale dynamics, and its representation in models is
important for climate modeling, seasonal predictions, and weather forecasting.
This work uses a combination of state-of-the-art global reanalyses and model
experiments, to shed light on some aspects of the AEJ. A general discussion of
the problem and a literature review are presented in the next Section. Section
3 provides a description of the data and the NASA Seasonal-Interannual Predic-
tion Project (NSIPP) Atmospheric General Circulation Model (AGCM), version
1 (NSIPP-1). Section 4 describes a set of five Experiments and a Control run that
are carried out to investigate the role of soil moisture, vegetation and orography
in maintaining and controlling the AEJ. In Section 5 the structure of the AEJ is
analyzed as it appears in the reanalyses and in the Control run. This is followed
by a discussion of all the forcings introduced in the Experiments and the resulting
impact on the AEJ. Section 6 discusses the dynamical implications of the Experi-
ments and Section 7 states the conclusions of this work.

2. The AEJ: previous research
Besides the Inter Tropical Convergence Zone (ITCZ) the three planetary features
that most prominently control the northern African summer and tropical Atlantic
weather systems are the Saharan thermal low, the Tropical Easterly Jet (TEJ) and
the AEJ (e.g. Asnani 2005). The Saharan thermal low can be considered as an
extension of the planetary-scale thermal trough associated with the Asian mon-
soon. It affects the troposphere from the surface up to about 600 hPa above which
is replaced by relatively high geopotential values and divergence. It is the main
feature controlling the so-called Harmattan flow, a low-level predominantly north-
easterly flow sweeping over northwestern Sahara during summer and contributing
to Saharan dust outbreaks into the Atlantic ocean. The TEJ, located at about 100-
200 hPa, 5° to 15°N, and stretching from Indo-China to the tropical Atlantic, has
been shown to be linked to anomalous SSTs on a planetary scale (Chen and Loon
1987). It plays a paramount role in controlling the easterly vertical shear over
developing weather systems off the Atlantic coast of Africa.
It appears, however, that of the above phenomena, the AEJ exerts the strongest
influence on the occurrence, intensity, and frequency characteristics of the African
weather systems within the west African Monsoon region (e.g. Cook 1999). That
influence appears to extend well beyond the monsoon region to impact a substan-
tial fraction of tropical Atlantic weather systems (e.g. Asnani 2005).
Hamilton and Archibald (1945) should be remembered among the first authors
to present evidence of the AEJ. Based on a surface wind-based definition of the
2

ITCZ (i.e. wind-veering line) they described Sahelian Africa to be characterized
by four fundamental zones. Regardless of the fact that modern definitions of the
ITCZ are based on the line where maximum vertical velocities occur rather than
as the surface wind-veering line, the distinction of those four environments (A:
north of the wind-changing line, characterized by dry Saharan air, B: between the
AEJ and the wind-changing line, C: south of the AEJ, and D: far away to the
south of the AEJ) and their different weather patterns, is still of enormous value
and emphasizes the importance of the AEJ position. Moreover, these authors
correctly ascertained the important role of the AEJ as a triggering mechanism of
weather phenomena and the confinement of the weather systems to a very narrow
band to the south of the AEJ.
In particular, the zone to the immediate south of the AEJ core, being subject
to cyclonic shear and strong convective activity, has been recognized for decades
as the area in which African Easterly Waves (AEWs) form, where several weather
disturbances develop in form of squalls, and where the maximum precipitation is
recorded. In particular, some authors have separated squall- by nonsquall- AEWs
(e.g. Dhonneur 1971) and other authors have provided a much deeper understand-
ing of squalls (e.g. Houze 1977; Zipser and Gautier 1978). To this day, one of the
most comprehensive studies on AEWs is perhaps the 3-part work by Kiladis et al.
(2006); Hall et al. (2006); and Thorncroft et al. (2008).
However, in this work AEWs are not treated and the focus is only on the AEJ
structure and maintenance. Despite the importance of the AEJ as a prominent fea-
ture of African meteororology, the observational network over northern Africa has
3

been deemed not adequate to completely capture its fine structure. Parker et al.
(2008) state that “in recent years the meteorological observing system of Africa
has been in a worse state than that of any other populated continent.” In addition
to the poor observing network, the diagnosis of the AEJ through global, relatively
low-resolution datasets, has shown some degree of uncertainty. Differences in
height, shape and intensity of the jet were noted by Cook (1999), while compar-
ing the gridded climatologies of the National Centers for Environmental Predic-
tions (NCEP) with the European Centre for Medium-Range Weather Forecasts
(ECMWF). With respect to the AEJ, Cook (1999) notes that the AEJ maximum
easterly velocities are 1 1m s-1 at 500 hPa in the ECMWF data, and 12 . 5m s-1 at
600 hPa in the NCEP reanalyses (Kistler et al. 2001), contrasting with a 8-year
observational data set (Burpee 1972) that shows the AEJ max at about 650 hPa.
Moreover, as observed by Cook in the same work, the shape of the AEJ differs too,
being more displaced to the east in the NCEP data. These important differences
were attributed by the author to sampling problems and relatively low resolution.
The relative scarcity of observations is also stressed in a more recent observa-
tional experiment, called Jet 2000 (Thorncroft et al. 2003), in which the jet height
was found at about 675 hPa, and more to the south than expected, but possibly
in agreement with the behavior of the AEJ in dry years. The Data Assimilation
and forecasting Systems from ECMWF and the United Kingdom Met Office were
initialized with some of the campaign data and provided reasonable representa-
tions in the AEJ although some differences between the two systems were noted
(Thorncroft et al. 2003).
4

Increasing vertical and horizontal resolution in more recent data sets have not
yet totally dissipated some ambiguity in the AEJ definition, as it will be shown
later. In addition to insufficient observational coverage and models’ resolution,
several important aspects may be at this point still inadequately represented. For
example, Tompkins et al. (2005) show that the ECMWF 5-day forecast of the
AEJ, which had a bias with respect to observations (being too far north, too weak
and at a greater height than observed) was substantially improved by including a
realistic, annually-varying, aerosol climatology. A different treatment of aerosols
may be then at least partly responsible for the discrepancy.
Given that uncertainties in defining the strength, horizontal extent and height
of the observed AEJ may be reduced in the future by a denser observational net-
work, as advocated by the proponents of the African Monsoon Multidisciplinary
Analysis (AMMA, described, among others, by Redelsperger et al. 2006), im-
proved data assimilation capabilities and higher resolution, this will not directly
address the more fundamental problems related to the AEJ, involving its physical
causes, its maintenance and its ability to produce and confine the tracks of weather
systems.
A relevant study that assesses the possible forcings on the maintenance of
the AEJ is by Thorncroft and Blackburn (1999). In this work the authors com-
pare the importance of the surface fluxes, low-level heating and dry convection
associated with the Saharan thermal low, against the role of deep moist convec-
tion taking place in the ITCZ. Their conclusion is that it is the low-level heating,
which extends vertically up to about 700 hPa, to play the most prominent role in
5

maintaining the AEJ.
Accepting that the mean position of the AEJ may be controlled predominantly
by low-level thermal forcing, the problem of interannual variability connected
with intensity fluctuations or changes in position has been the subject of investi-
gation for several decades. Amidst the considerable amount of literature available,
perhaps two different but not necessarily antithetical views can be extracted: one
that emphasizes the importance of global or Atlantic or Indian Ocean SSTs, and
one that emphasizes the role of land-surface properties. In the former category,
one can mention among many other studies the work by Foland et al. (1986);
Semazzi et al. (1996); Nicholson (1997); Nicholson and Kim (1997), and Vizy
and Cook (2001). In the latter category, studies stressing the importance of land
surface properties start with the seminal works of Charney on the albedo impact
in semi-arid regions (e.g. Charney et al. 1977) and more recently include the
increasingly sophisticated description of land-surface characteristics, including
vegetation properties, as potential modulators of north-African rainfall on a vari-
ety of time-scales (e.g., Xue and Shukla 1993; Zeng and Neelin 2000; Clark et al.
2004; Douville et al. 2005; Hagos and Cook 2005).
All these different perspectives are perceived as fundamentally concurring
mechanisms in the study on Sahelian droughts by Giannini et al. (2003), where ev-
idence is presented that Sahelian rainfall variability may be controlled by oceanic
forcings and amplified by land-atmosphere interaction.
Of particular relevance for the present work is the study by Cook (1999),
which showed with great clarity the importance of the AEJ in controlling west
6

African precipitation, and quantified the connection between the Saharan thermal
low and the steep soil moisture gradients observed from the wet areas close to the
Guinea coast to the dry environment of the Saharan desert, as prominent mecha-
nism controlling the AEJ. Hsieh and Cook (2005) expanded on these findings by
showing the interdependence of the ITCZ and the AEJ in the generation of AEWs,
Cook and Vizy (2006) analyze and review the capability of coupled GCMs to re-
produce the overall west African Monsoon dynamics, and Hsieh and Cook (2007)
investigate the energetics of AEWs within a regional framework. All these latter
study, and many others, make assumptions based upon Cook (1999) and do not
discuss the maintenance of the AEJ.
In the work presented here, which is focused on the AEJ and not on the AEWs,
we follow Cook (1999) by looking in more detail, and with a less idealized model,
at the impacts of surface conditions on the AEJ. Cook’s study, for example, used
zonally prescribed clouds, perpetual July conditions, a bucket model of the land
surface, no topography and a uniform albedo of 0.1. The conclusion that under
these conditions the AEJ is produced by prescribing soil moisture alone does not
address the importance of other factors or, indeed, the details of the soil moisture
distribution or its relative impact in a more realistic setting. We thus decided to
revisit the problem within a more realistic modeling framework and with a more
rigorous set of experiments.
In this study, we start from a perspective opposite to Cook (1999): after exam-
ining the structure of the AEJ as represented in ERA-40, and in other reanalysis,
we carry out a number of sensitivity experiments with a state-of-the-art global
7

AGCM, with realistic topography and sophisticated land surface, that is capable
of producing a realistic AEJ. In particular, a set of five experiments is performed:
in four of them one forcing at a time is removed and in one two forcings are
removed. By doing so, we separate the roles of soil moisture, orography and veg-
etation. The well-tested strategy developed by Koster and Suarez (1995, hereafter
KS95), and Koster et al. (2000, hereafter KA00) is used to control land evapora-
tion in AGCMs (see also Reale and Dirmeyer 2002; and Reale et al. 2002).
3. Data and Model description
The data used for this study are: a) the ERA-40 reanalyses (Uppala et al. 2005), a
6-hourly global data set covering more than 40 years, produced by the ECMWF,
describing the state of the atmosphere from September 1957 to August 2002; b)
the NCEP Department of Energy (NCEP-DOE) Reanalyses 2 (NCEP R2, Kistler
et al. 2001; Kanamitsu et al. 2002) which cover about sixty years; and c) the
Japanese 25-year Reanalyses (JRA-25, Onogi et al., 2007). In this work, only the
subperiod between 1980 and 2001 is being used.
The model is the Global Modeling and Assimilation Office (GMAO) NSIPP-
1 AGCM, run at a horizontal resolution of 20 x 2.50 and with 34 vertical levels
spaced to provide higher vertical resolution in the lower 2 kms of the atmosphere.
It is the same model that has been previously used by Wu et al. (2006) to investi-
gate the seasonality and meridional propagation of the Madden Julian Oscillation
(MJO). NSIPP-1 is a grid point model using a 4th-order dynamical core (Suarez
and Takacs, 1995) with explicit leapfrog time differencing. The vertical coordi-
8

nate is a standard sigma-coordinate and the vertical differencing follows Arakawa
and Suarez (1983). The boundary layer scheme is a K-scheme calculating tur-
bulent diffusivities for heat and momentum based on Monin-Obukhov similarity
theory (Louis et al. 1982). Turbulent diffusivities are determined as function of
roughness length, von Karman constant and a bulk boundary-layer Richardson
number.
The relaxed Arakawa-Schubert (RAS) scheme is adopted to parameterize con-
vection (Moorthi and Suarez 1992). RAS uses a sequence of simple linearly-
entraining plumes (clouds types) that originate at the lowest sigma level and de-
train at specific model levels. The initial clouds-base mass flux for each cloud
type is determined from a convective available potential energy closure. The RAS
scheme effectively acts as a parameterization of both deep and shallow convec-
tion in the NSIPP-1 model. Bacmeister and Suarez (2002) show that the model
produces a reasonable simulation of the thermodynamic structure of the lower tro-
posphere. The adopted parameterization of solar and infrared radiative heating is
described in Chou and Suarez (1994, 1999). The solar heating includes absorption
of O3, CO2, water vapor, O2, clouds, and gaseous and aerosol scattering.
The land surface model (LSM) is the Mosaic scheme of Koster and Suarez
(1992, 1996), a soil-vegetation-atmosphere transfer LSM. The Mosaic scheme
subdivides each AGCM grid square into subregions, called ‘tiles’, in which the
vegetation type is relatively homogeneous, and then calculates separate one-dimensional
energy and water balances over each tile, with strong stomatal control over tran-
spiration rates. The LSM performance against observations has been discussed in
9

Chen et al. (1997) and Wood et al. (1998).
The climate of the NSIPP-1 model and a more detailed model formulation are
described in Bacmeister et al. (2000). Aspects of the model’s climate variability
are assessed by, among others, Pegion et al. (2000) and Schubert et al. (2002).
This is the same model used in the investigation of Sahelian rainfall variability by
Giannini et al. (2003) Of particular importance for this work is the model’s ability
to produce realistic AEJ and the good performance of the LSM documented in the
studies above (see also Figs. 1 and 5 in this study), which makes it suitable for
investigating the role of soil moisture in maintaining the AEJ.
4. Experiments
The Control runs consist of a three-member 73-year ensemble of simulations car-
ried out at a horizontal resolution of 2° x 2.50 and forced with observed monthly
varying SSTs from 1930 to 2002. The atmospheric initial conditions for the three
members of the ensemble were arbitrarily chosen from previously completed sim-
ulations. Unlike earlier work (e.g. Thorncroft and Blackburn, 1999; Cook, 1999),
which used highly idealized models, it should be stressed that this Control run is
a relatively realistic climate simulation.
The purpose of the five Experiment runs is to examine the impacts of modi-
fied surface conditions in Equatorial and Saharan Africa obtained by 1) suppress-
ing directly the meridional gradients of evaporation, 2) imposing meridionally
uniform land surface properties (with two different settings), 3) simultaneously
suppressing evaporation gradients and prescribing land surface properties, and 4)
10

suppressing the orography’s role. Each experiment consists of a three-member
27-year ensemble of simulations (performed at the same resolution as that of the
Control, with the same atmospheric initialization and the same observed monthly
varying SSTs from 1978 to 2004), in which one of the forcings is disabled. The
overall period (1978-2004) was chosen due to the much better quality of reanal-
yses available during the satellite era. The first two years of the each simulation
are discarded for spin-up, and also the last three years are not included, in order to
overlap with the ERA-40. All the statistics and subsequent analysis of this work
are therefore based on the 22-year period 1980-2001.
One important aspect of our experiment settings is that the Control may be
able to represent possible trends or fluctuations connected with changes in land
surface properties. These have been documented over the region, and the actual
Sahara-Sahel border has been shown to be subject to fluctuations (e.g. Tucker et
al. 1991; Giannini et al. 2003).
The land interaction is disabled following the same conceptual design adopted
by KS95 and KA00. The main goal is to disable the impact of evaporation vari-
ability, which is more difficult than disabling SSTs due to the intrinsic differ-
ence between SST’s and soil moisture’s control of evaporation. Following KS95
and KA00, the concept of “evaporability” or “evaporation efficiency” is therefore
adopted. The evaporability 0 is defined as the ratio between actual evaporation
and potential evaporation. The former is given by
E = pE es — ea
(1)ps ?-aer + ?-surf
11

where ρ is the air density, ǫ is constant, ps is the surface pressure, es is the saturated
vapor pressure at the surface temperature, ea is the vapor pressure in the free air
(namely, the lowest σ level), raer is the aerodynamic resistance and rsur f is the
surface resistance, computed as a parallel resistance of all the resistances that
contribute to it. Potential evaporation Ep is calculated from actual evaporation
when the surface resistance rsur f is set to zero.
E = ρǫ es — ea (2)pps raer
For each month and each year of the control run we compute the following ratio
_ P E(i)βmy — E Ep (i)
where the sums are over all the timesteps i of that particular month and year. This
allows the definition of a time series of 22 x 12 monthly βs from the control run
for each gridbox.
The climatological seasonal cycle of evaporability is obtained by averaging β
for each month throughout the 22-year period. Prescribing the evaporation effi-
ciency in a simulation allows us to control continental evaporation in the simula-
tions without directly prescribing the evaporation and yet disabling land-atmosphere
feedbacks due to changes in surface water. As argued by KS95, this is a more gen-
eral and direct way of accomplishing this than attempting to prescribe the water in
all surface reservoirs. Once β is prescribed, the actual evaporation for each time
step is computed by multiplying Ep (i) by the corresponding βm .
In summary, the following experiments were performed:
(3)
12

1. Experiment 1: the climatological set of βms is averaged over the Sahel re-
gion (hereby defined as 101 to 201N and 201W to 351E) and imposed on the
rest of continental Africa. By doing so, evaporation interannual variability
is suppressed and Sahelian conditions are prescribed.
2. Experiment 2: conditions of βm computed from Saharan values are imposed
on the rest of Africa. This experiment acts in the opposite direction of Ex-
periment 1. In fact, Experiment 1 imposes some evaporation over desert,
thus reducing the meridional gradients of evaporation by increasing evapo-
ration to the north of the gradient maximum, whereas Experiment 2 reduces
evaporation over areas which are not desert, thus reducing the gradients by
constraining evaporation to the south of the gradient maximum.
3. Experiment 3: the vegetation is imposed to be uniform, namely the pre-
dominant Sahelian land type (i.e., grassland) is imposed over the entire
African continent, and the subgrid vegetation variability within each tile is
suppressed. The primary effect is believed to be the suppression of albedo
gradients and their effects on temperatures, but it also results in changes
in surface roughness and hydrological properties associated with vegetated
surfaces.
4. Experiment 4: the forcings of Experiment 1 and 3 are combined: vegeta-
tion and the evaporation efficiency are simultaneously prescribed to Sahel
values.
5. Experiment 5: orography is imposed to be flat, eliminating any possible
13

contributions induced by the southward sloping terrain over the Sahel, and
by the Ethiopian highlands.
The Experiments’ settings are summarized in Table 1.
5. Analyses and experiment results
Daily means were extracted from the five Experiments and the Control runs from
the 1980-2001 period. In Fig 1, the zonal wind climatology for July, based on
the ERA-40 data, the NCEP R2, and the JRA-25 are compared with the NSIPP-1
Control Run.
The fundamental properties of the AEJ and of the general circulation over
northern Africa can be clearly distinguished in the 3 sets of reanalyses:
• a maximum of about 11 ms- ' at 600hPa approximately 15°N over western
Africa
• a low-level westerly flow confined below 800hPa and affecting the latitude
band between the Equator and 20°
• a low-level easterly flow (Harmattan) confined between 20° and 30°N
• an upper level easterly flow (TEJ) at latitudes south of 10°N
• a shift in the AEJ position between May and July from about 9°N to 15°N,
followed by a 20% AEJ speed decline in October and southward symmetric
displacement (not shown)
14

Previous work by Cook (1999, Fig. 1) showed a remarkable difference in the AEJ
maximum speed, of about 20%, between the older European Center and NCEP-
NCAR reanalyses, and suggested resolution as a possible cause for the discrep-
ancy. In the more recent datasets, ERA-40, NCEP R2 and JRA-25, wich are
presented in this paper, the AEJ Maximum is at about the same value of approx-
imately 11 ms-i . Also the location of the maximum, which Cook (1999) noted
to differ substantially, tends to be in all analyses concentrated at about 10° — 15°
longitude W.
However, the structure of the AEJ as represented in the two reanalyses still
differs especially on its eastern side, with the ERA-40 representation of the AEJ
consisting of a secondary speed maximum over the Aethopian highlands. The
JRA-25, which is a more recent product, agrees more closely to the NCEP R2
as for the location of the jet maximum, but more to the ERA-40 as for the shape
of the AEJ over central-eastern Africa. Quantitatively, speed differences of about
20% exist between JRA-25 and NCEP R2 at longitudes between 20° and 40°E .
The cross-section at 0° longitude, extracted from the ERA-40, shows a well-
defined AEJ core at about 600 hPa, well separated from the TEJ above 300 hPa and
from the low-level Harmattan flow centered between 27° and 30°N. Comparing
this Figure with Fig. 2 in Cook (1999) and with NCEP R2 there is a good agree-
ment on the low-level monsoonal flow between approximately 2°N and 20°N and
the representation of the AEJ core at about 600 hPa. However, there is substantial
difference in the representation of the Harmattan flow at about 27°N: ERA-40
shows a much deeper Harmattan flow (up to 700 hPa) with a maximum located
15

about 21 in latitude further to the north with respect to the NCEP R2. Considering
the importance of the Harmattan flow in advecting Saharan Air, and the impli-
cations of that for suppressing or limiting convection, the difference between the
analysis seems significant. Another important difference is the intensity of the
TEJ, which affects easterly vertical shear on the equatorward flank of the AEJ.
The TEJ is almost 20% weaker in the ERA-40 data than in the NCEP R2. The
JRA-25 is overall closer to the NCEP R2, except that the AEJ is definitely weaker
on its eastern side in the JRA-25: at about 25°E the difference is of the order
of 40%. Moreover, in the JRA-25 a separate speed maximum is evident on the
Ethiopian highlands. This feature is also present in the ERA-40, but not in the
NCEP R2. At this time, because of the relatively scarce observational network,
these differences can only be acknowledged and it is not possible to make a final
statement on which data set provides a more realistic representation. It should be
emphasized however that even wind speed differences of small magnitude, rela-
tive to a feature as important as the AEJ, may be relevant considering that NCEP
R2, ERA-40 and JRA-25 are state-of-the-art reanalysis products.
In Fig. 1 the July zonal wind mean computed from the NSIPP-1 three-member
ensemble Control run is also shown. Given the uncertainties in the representation
of the AEJ among different data sets, some degree of resemblance suggests that
the NSIPP-1 is a reasonable simulation. The AEJ is clearly defined and well
separated from the low-level Harmattan flow. Its maximum is at about 650 hPa,
in agreement with the 8-year observation-based climatology (Burpee 1972), the
ERA-40, NCEP R2 and JRA-25 data. The maximum is somewhat weaker, being
16

about 7 m s-1 , and it is also slightly displaced to the north. The relative weakness
of the AEJ appears to be, in our model, a function of resolution. In experiments
with the same model run at higher resolution ( 1 ° x 1 °) the AEJ intensity is on the
order of 9 m s-1 (not shown), close to the ERA-40 results. The shallow west-
erly monsoonal flow and the TEJ are also well defined. As for the AEJ life-cycle,
the NSIPP simulation agrees well with the reanalyses with a northward shift of
about 60N in the AEJ position occurring between May and July, and a symmetric
southwad displacement, with decline in speed, in October (not shown). Moreover,
being the positions of the AEJ, of the monsoonal flow and of the TEJ well rep-
resented at the peak of the monsoon, there is confidence that the NSIPP model
is a valuable tool to investigate the forcings affecting the AEJ, even if the maxi-
mum speed of the AEJ as represented by the model is lower than the reanalyses.
The purpose of this work is to gain a deeper understanding of the mechanisms
controlling the basic AEJ structure and maintenance, and for this goal the NSIPP
representation of the AEJ structure appears satisfactory.
To further investigate some properties of the AEJ, the structure of the AEJ
with respect to the meridional horizontal shear of the zonal wind, is displayed in
Figure 2. This quantity, corresponding to the relative vorticity produced by the
zonal wind, is indicative of the part of the AEJ which may be more conducive
to barotropic instability to develop. All the 3 data sets show a strip of positive
values at about on the sourthern flank of the AEJ. The corresponding meridional
cross-sections localize the heigths and latitudes which appear, according to these
data sets, more likely to be barotropically unstable. All data sets agree that the
17

strongest cyclonic shear induced by the AEJ is at about 600 hPa and at about
10°N , but the ERA-40 display a more confined maximum. The cross-sections also
emphasize that in the ERA-40 the cyclonic shear appears to slope equatorward
with height, which is the opposite of what is observed in the JRA-25.
To further investigate the problem of barotropic instability in the AEJ, we plot
the quantity∂∂U
K(y) = ∂y [f (y) — ∂y ]
(4)
where f is the Coriolis parameter, and U is the zonal wind. K (Y) = 0 represents
the well-known necessary condition for barotropic instability to occur in response
to the zonal component of the flow. In our case, K (y) = 0 on the cyclonic side
of a flow indicates locations where barotropic instability is not impossible. This
corresponds to K (y) being zero to the north of positive values of K and to the
south of negative values of K (when the flow is easterly). In Figure3 K (y) is
plotted against the zonal wind. The 3 data sets differ substantially on this regard.
In particular the ECMWF builds a contiguous line with K=0 on the southern flank
of the AEJ, indicating that a strip of latitudes at about 10°N across the entire
continent is potentially unstable for cyclonic disturbances to grow at the expenses
of the mean flow. This contiguous feature is absent from the other data sets. Most
remarkable is the presence, again in the ERA-40, of a contiguous vertical line
of K (y) = 0 sloping slightly poleward with increasing latitude and decreasing
height, almost reaching the surface at about 121N . A full investigation of the AEJ
instabilities as AEWs-producing mechanisms should consider both baroclinic and
barotropic instability as done by Hsieh and Cook (2008). This however would be
18
beyond the purpose of this work, which is concerned on the AEJ structure and
maintenance, and not on AEW production.
Figure 4 shows the mean vegetation and the orography used in the Control
run. The vegetation follows a mosaic approach so that each gridbox is actually a
mosaic of vegetation types with strong subgrid variability. The colors in Figures 4
identify the predominant vegetation type in each gridbox. The subgrid variability
of land surface specifics cannot be easily represented in a map, but it should be
emphasized that each grid box consists of up to six different kinds of land prop-
erties, including albedoes, roughness, vegetation cover, etc. The orography of the
Control at this resolution is relatively smooth compared to reality, but the most
important topographic features of the African continent are represented: namely
the southern plateau, the Ethiopian highlands, the Atlas range, and the lower el-
evations of western Sahara. The effects on atmospheric dynamics resulting from
the suppression of these features, as we will show later, are actually very strong.
Controlling the evaporation and modifying the vegetation distribution has pow-
erful effects on the distribution of surface temperatures. Figure 5 shows the sur-
face temperatures produced by the experiments, and the changes with respect to
the Control. The uniform β that uses Sahelian values everywhere cools the Sahara
by more than 5°C and warms the area south of it by about 3 — 5°C. When Saha-
ran values of β are imposed, the meridional temperature gradient changes in the
opposite direction, with no change over the Sahara but a heating of up to 7 — 9°C
in the Sahel and to the south of it.
The uniform vegetation (Sahel type) imposed in the Experiment 3 leads to a
19

cooling of the southern part of the Sahara and a warming in the northern part. The
effect is opposite to Experiment 1, in which a constant 0 is imposed.
The comparison of Experiment 1 (uniform 0) and Experiment 3 (uniform veg-
etation) explains Experiment 4, in which both evaporation and vegetation proper-
ties are imposed to Sahelian values. In other words, the particular response of
surface temperature to the changes in vegetation and evaporation is nonlinear and
derives from the addition of two partly contrasting forcings.
Most interesting is the impact of the suppressed orography, which causes an
increase of surface temperature comparable to the one in which uniform values
of (Saharan) 0 are imposed: namely a heating of 7 — 9oC, with maximum on the
Ethiopian region. In addition to the temperature change induced by lower eleva-
tion, the increase is also connected with the reduction of topographic uplift which
is in nature imposed on the monsoonal flow by the Ethopian highland, and that is
being suppressed by the experiment. This causes a strong reduction in precipita-
tion and latent heat flux. The heating is stronger where the reduction of precipi-
tation is larger, and demonstrates the importance of the particular topography of
northern Africa in controlling the monsoonal flow.
Figure 6 shows the JAS precipitation and the difference from the Control in
all the experiments. The most striking result is that increasing 0 over the Sahara
(Experiment 1) does not produce large changes in precipitation while the opposite
change, imposing Saharan 0 everywhere, leads to a large reduction in precipitation
over the Sahel. Another interesting and somewhat counterintuitive result is that
prescribing uniform Sahelian type vegetation over Africa produces a much larger
20

impact than prescribing Sahelian-type 0, which leads to an impressive northward
shift of the ITCZ (Experiment 3).
Experiment 4, in which both evaporation and vegetation are prescribed, clearly
results in some nonlinear effects, in which the vegetation change (and presumably
the albedo) dominates the evaporability change.
Of great interest is the result of the orography experiment (Experiment 5)
which alone, without any modification to other surface forcings, can produce a
dramatic reduction of precipitation throughout the Sahel region. The orographic
effect, in fact, is comparable to the 0 effect in Experiment 2, where Saharan val-
ues of evaporability are imposed. In other words, the removal of the topography
of northern Africa can produce a reduction of precipitation almost equivalent to
the one obtained by forcing the evaporability to be virtually zero.
Figure 7 displays the corresponding JAS surface latent heat fluxes in the vari-
ous experiments, and their difference from the Control. Consistent with the above,
Sahelian and Saharan values of 0 alter the meridional gradients of latent heat (with
Sahelian 0 increasing latent heat over the Sahara and Saharan 0 reducing latent
heat south of the Sahara). Vegetation change and Sahelian 0 change act in the
same direction (increasing latent heat north of the Sahel, and decreasing it to the
south), but the impact scale of 0 is larger. This is reasonable because to prescribe
0 over the desert leads to very strong evaporation with consequent large latent
heat anomalies.
Figure 8 compares the meridional surface temperature gradients, a zonal cross-
section of meridional temperature gradients at 12°N and the temperature structure
21

in a meridional vertical cross section at 0° longitude, in the Control and vari-
ous Experiments. The displacement of precipitation induced by the Experiments
corresponds well to the displacement of the strongest surface temperature gradi-
ents. The zonal cross-section of meridional gradients is computed from 180°W to
180°E . However, changes with respect to the Control are noticeable, as expected,
only over the longitudes corresponding to the African continent, where the sur-
face conditions are altered in the experimental setup. Of particular significance
is the suppression of the meridional thermal gradient inversion, on the top of the
AEJ, between about 20°W and 60°E, at about 600 hPa. In the Control, merid-
ional temperature gradients are positive below 600 hPa, and vanish or become
slightly negative at about 500 hPa-600 hPa. In the uniform vegetation experiment
(Experiment 3) and uniform vegetation and uniform β experiment (Experiment 4)
the meridional temperature gradients, albeit smaller with height, remain always
positive. The meridional cross-sections of temperature at 0° longitude further re-
inforce the notion that the thermal structure of the atmospheres is dramatically
altered as a consequence of the Experiments, with evident changes in position and
amplitude of the thermal maxima.
In Fig. 9 the zonal wind at 600 hPa, and a meridional vertical cross section at
0° longitude are shown. The common feature between Experiments 1, 3 and 4 is
the thickening and strengthening of the low-level westerly monsoonal flow at 0°
longitude. The Harmatthan flow is not suppressed in any experiment, since being
simply driven by the always present summer thermal low over the Sahara.
In both Experiments 1 (with constant evaporability) and 3 (constant Sahelian
22

vegetation), the AEJ is still present, albeit displaced and with different intensity
(stronger and higher in Experiment 3, weaker and lower in Experiment 1).
It is in the Experiment 4, in which both vegetation and evaporation are simul-
taneously controlled, that the AEJ disappears. The relatively ‘moderate’ changes
in the boundary forcings performed in Experiments 1 and 3 are not sufficient to
suppress the AEJ, but only to change its intensity and position. The most drastic
Experiment 2, which imposes Saharan-like conditions (through constant 0) over
all Africa does suppress the jet, but it is very important to note that a less extreme
value of constant 0 as the one obtained from grassland is not sufficient to destroy
the jet. In other words, a ‘moderate’ control of evaporation (and thus soil mois-
ture gradients) alone is not sufficient to suppress the AEJ, but is the combination
of controlled evaporation and vegetation properties (inclusive of albedo) gradients
together which suppresses the Jet. This finding partly contradict Cook’s (1999)
conclusions: in that study an AEJ was produced by the use of realistic soil mois-
ture imposed over uniform albedo and the conclusion was made that only soil
moisture is relevant. In this present work it is shown, by separating the various
forcings, that the realistic vegetation types (inclusive of properties such as albedo)
can also produce an AEJ even if evaporation is controlled. Since Cook 1999 did
not produce an experiment with realistic albedo and prescribed evaporation, it is
suggested in this work that Cook’s (1999) conclusions should be revisited.
Moreover, it is important to notice that the experiment in which orography
is suppressed, but evaporation gradients and realistic vegetation are maintained,
leads to a different circulation with a weaker monsoonal flow and, most important,
23

no AEJ. In other words, the role of orography in controlling the AEJ is at least as
important as the role of combined vegetation and evaporation gradients. This is
another aspect of Cook’s (1999) conclusion that needs to be revisited: in that study
the orography was considered flat.
In Figure 10, similarly for what was done in Figure ??, the 600 zonal wind and
the corresponding meridional vertical sections at 0° longitude, together with the
meridional horizontal shear induced by the zonal wind, are shown to emphasize
the areas that are more ‘active’ from the point of view of barotropic instability
in the various experiments. It is important to realize that the areas with stronger
cyclonic vorticity are not necessarily controlled by the stronger AEJ, being also
partly controlled by the monsoonal flow. Cyclonic vorticity occurs on the south-
ern side of an easterly jet but also on the northern side of a westerly flow: in
both cases barotropic instability can develop. The Experiments seem to suggest
that what the AEJ controls is not so much the occurrence of instability, but the
confinement of it. For example, Experiment 4, which is remarkable for the ab-
sence of an AEJ, does have a broad area of cyclonic shear, mostly induced by the
strengthened monsoonal flow, and confined more to the north and to the east of
the Control. On the other hand the experiment with uniform 0 imposed to Sa-
haran values shows almost no area over northern Africa where cyclonic vorticity
dominates, confirming the overall absence of precipitation noted in Figure 5.
The changes in lower midtropospheric circulation associated with the Exper-
iments are summarized in Fig. 11, by comparing the Control and Experiments
geopotential and wind at 600 hPa and 925 hPa. The suppression of a strong east-
24

erly flow at about 15°N in the Experiment 4 is remarkable. 600 hPa wind speed
at 151N decreases from about 10m s-1 in the Control to few m s-1 in the Ex-
periment. This is consistent with the observed change in surface temperature, and
the strong weakening of meridional surface temperature gradients which occur in
Experiment 4 with respect to the control. Moreover, the southward penetration of
the predominantly low-level northerly flow from the eastern Mediterranean feed-
ing into the northern branch of the Hadley cell over Africa, is slightly reduced in
the Experiment 4, in which both vegetation properties and evaporation are con-
trolled.
In contrast, the orography experiment allows the flow from the Mediterranean
to directly collide with the monsoonal flow, essentially advecting dry air into the
ITCZ, consistent with the drastic reduction in precipitation and latent heat shown
in Figs. 6 and 7.
Being that the AEJ constrained by the thermal wind relationship, the recip-
rocal position of surface temperature gradients and zonal winds are emphasized
in Fig. 12 for the Control and Experiments 3 and 5, which displays meridional
surface temperature gradients against 600 hPa zonal wind. Experiments 3 and
5 are chosen as the two most extreme cases of meridional displacement of sur-
face temperature gradients: in Experiment 3 the maximum gradient is displaced
as far north as 20°N, whereas in Experiment 5 is displaced southward over west-
ern Africa, and almost to the Equator over Eastern Africa. While in Experiment
3 a feature resembling the AEJ can be identified in good correspondence to the
maximum temperature surface gradient, Experiment 5 shows that basically the
25

AEJ disappears merging within the predominatly easterly flow associated with
the ITCZ. This impressive change emphasizes the importance of orography in
creating meridional surface temperature gradients.
The overall findings indicate that the AEJ is a very fragile element of the Trop-
ical Meteorology, strongly constrained by boundary forcings, and that variations
in these constrains may lead to a completely different atmospheric regime.
6. Discussion and dynamical implications
This work starts with an analysis of the AEJ using the ERA-40 data and compar-
ing the AEJ representation with that in other state-of-the-art reanalysis data sets,
namely the JRA-25 and the NCEP R2. Despite some agreement among these rep-
resentations, and despite some consistency with pre-existing data sets regarding
the definition of the AEJ, it is found that some degree of ambiguity in terms of
AEJ shape and intensity still persists, indicating the need for a denser observa-
tional coverage over the Sahelian region.
A Control simulation and a set of five experiments are then performed using
the NSIPP-1 Atmospheric General Circulation Model. The Control is designed to
be a realistic representation of the atmosphere in which, among other forcings, re-
alistic land-surface properties, realistic orography and realistic SSTs are adopted.
The model has previously been demonstrated to satisfactorily reproduce climate
variability (Schubert et al. 2000; Giannini et al. 2003). The Control run produces
a reasonable circulation over Africa and represents well the AEJ. The five exper-
iments are designed to test the roles of various forcings, namely vegetation type,
26

soil moisture gradients (with two settings), vegetation type and soil moisture gra-
dients combined together, and orography. A sophisticated treatment of vegetation
is used, that determines a whole set of land surface properties including, but not
limited to, albedo.
The most important result is that the meridional thermal gradients associated
with the AEJ are primarily controlled by gradients of continental surface proper-
ties. In a GCM experiment in which both the evaporability and vegetation of the
land surface are prescribed to uniform, moderate values (i.e., those obtained in
a Control climate run over the Sahel region) over the entire African continent, a
general circulation is produced that completely suppresses the AEJ. Interestingly,
experiments in which vegetation and evaporability are prescribed separately both
result in a distinct AEJ, albeit one of somewhat different strength and position.
This result contrasts with the idealized experiments of Cook (1999) in which soil
moisture gradients alone controlled the AEJ. Indeed, a similar effect occurs in our
model when the soil moisture gradients are eliminated in an extreme experiment
in which we effectively set the evaporability to zero (i.e., to Saharan values) over
the entire continent. However, this experiment not only eliminates the AEJ but
also the African ITCZ and results in a very unrealistic general circulation over the
entire African monsoon region.
Among the various changes noted in the general circulation produced by Ex-
periment 4, in which both vegetation and evaporation are controlled, we empha-
size: a) the weakening of the Harmattan flow, b) the corresponding strengthen-
ing of the monsoonal flow and c) the overall increased zonality of the circu-
27

lation over Northern Africa. These changes are consistent with the Reale and
Dirmeyer (2002) findings on the effects of suppressing the interannual variabil-
ity of β. Those experiments were performed with the same methodology as in
KA00, but globally and on a different model. The Reale and Dirmeyer (2002)
study, based on a single realization, found a mid-tropospheric negative vorticity
anomaly over the Sahelian region suggestive of a northward shift of the ITCZ and
a weakening of the AEJ as a consequence of disabling globally the interannual
variability of β.
From this perspective, the results from this study, which are obtained with
a more localized change (only Africa) and with a 3-member ensemble, are much
more robust and support the idea that a combination of meridional gradients of soil
moisture and vegetation properties (including albedo) are crucial for maintaining
the AEJ.
The topography experiment (Experiment 5) is also relevant. Suppressing the
topography, of which a prominent feature are the Ethiopian Highlands, well repre-
sented in the model’s resolution (Fig. 4), leads to a strong increase in temperature
over East and equatorial Africa and a dramatic reduction of precipitation in the
eastern side of the African ITCZ. These two factors act in the same direction of
Experiment 4: namely the disappearance of meridional positive surface temper-
ature gradients at about 10° — 151N (Fig. 8). In other words, the combination
of vegetation properties and soil moisture gradients produces the same effects of
orography, particularly over eastern Africa.
Since the Control experiment includes all of these forcings (varying vegeta-
28

tion, varying evaporability and realistic topography), and since the suppression
of the first two leads to the disappearance of the AEJ as does the suppression of
the third, it can be safely argued that orography is just as important a player in
the maintenance of the AEJ, as the vegetation and evaporability. This finding was
not accessible to previous experiments that used more idealized simulations with
unrealistic orography.
Finally, another important aspect is the nonlinearity of the response to the com-
bined action of prescribing 0 and vegetation properties together. The prescription
of uniform Sahelian values of 0 over the entire continent has an effect on tem-
perature gradients that is opposite in sign to that of imposing uniform vegetation.
However, when both forcings are prescribed together in Experiment 4, their ef-
fects do not appear additive. This is further clarified in Fig. 13 where surface
latent heat flux, temperature and precipitation anomalies (computed as Experi-
ment minus Control) are displayed together for Experiments 1, 3, 4 and compared
with the simple sum of the anomalies computed from Experiments 1 and 3. When
constant 0 and constant vegetation act together in Experiment 4, their net result is
very different from the simple addition of the individual anomalies.
7. Conclusions
This work investigates the African Easterly Jet within the framework of a realis-
tic global model simulation. The current understanding of the AEJ is discussed
with the aid of reanalyses data sets, and five experiments are designed to assess
the importance of vegetation, soil moisture gradients and orography for forming
29

and maintaining the Jet. The results further strengthen the original intuition at the
basis of the Charney feedback (Charney et al. 1977) by confirming the sensitivity
to vegetation change of the Sahel. In particular, decrease in vegetation (corre-
sponding in part to a increase in albedo) over the Sahel leads to an altered surface
radiation balance which in turn leads to decreased evaporation and decreased pre-
cipitation.
However, the increased realism of vegetation modeling, which now includes
many other properties besides albedo, and the more sophisticated treatment of
evaporation introduce new insights and add substantial complexity to the problem.
Several steps have been taken in this direction by various authors. In particular, in
the process of further refining our understanding of the African meteorology, this
work aims to continue the research performed by Cook (1999).
Because of the use of a more realistic model with higher vertical and hori-
zontal resolution, and the use of multiple realization ensemble runs, this study
provides a more robust assessment of the mechanisms contributing to the AEJ.
The results presented here confirm that soil moisture is indeed an important forc-
ing, thus partly agreeing with previous findings by Cook (1999). However, the
set of experiments performed also suggest that not only evaporation gradients,
but a combination of vegetation properties and orography are also essential for
the maintenance of the mean climatological AEJ. In other words, according to
this study, it is the very particular combination of moisture gradients, vegetation
distribution and orography that produces the AEJ, not the soil moisture gradients
alone.
30

Finally, this work emphasizes the fragility of the African Easterly Jet, which
appears as a somewhat fortuitous element of tropical African meteorology, sub-
ject to fluctuations or even disappearance whenever one of the boundary forcings
is altered. In particular, there are several studies documenting the possible im-
pact of deforestation on regional climate: among these, changes in precipitation
and squall systems propagation on the Amazon (Da Silva et al., 2008); global
changes affecting Europe Asia and the United States (Findell et al. 2007) and
even teleconnections arising out of possible future deforestation over the Amazon
and central Africa (Avissar and Werth 2005). Most relevant is the study by Taylor
et al. (2002) which investigated the impact of land surface change on Sahelian
climate, demonstrating its sensitivity to small changes in albedo and leaf area in-
dex. It is therefore likely that change in vegetation over the Sahel may impact
precipitation, soil moisture gradients and consequently even the AEJ.
This aspect has some socio-economic implications, suggesting that land-surface
use over the Sahelian region should be carefully considered and that large-scale
dramatic changes in terms of deforestation and clearings to the south of the Jet,
over Equatorial Africa, may have repercussions on regional and larger-scale cli-
mate.
Acknowledgments This work was supported by the NASA Earth Science Enter-
prise’s Global Modeling and Analysis Program.
31

REFERENCES
Arakawa, A., and M. J. Suarez, 1983: Vertical differencing of the primitive
equations in sigma coordinates. Mon. Wea. Rev., 111, 34-45.
Asnani, G. C., 2005: Tropical Meteorology. Publisher: Indian Institute of
Tropical Meteorology, Pashan, Pune-411008, India. 3 vols.
Avissar, R., and D. Werth, 2005: Global Hydroclimatological Teleconnections
Resulting from Tropical Deforestation. J. Climate, 6, 134-145.
Bacmeister, J. T., P. J. Pegion, S. D. Schubert, and M. J. Suarez, 2000: Atlas of
seasonal means simulated by the NSIPP-1 atmospheric GCM. NASA God-
dard Space Flight Center, NASA Tech. Memo 104606, Vol. 17, 194pp.
,and M. J. Suarez, 2002: Wind stress simulations and the equatorial mo-
mentum budget in an AGCM. J. Atmos. Sci, 59, 3051-3073.
Burpee, R. W., 1972: The origin and structure of easterly waves in the lower
troposphere of north Africa. J. Atmos. Sci, 29, 77-90.
Charney, J., W. J. Quirk, S.-h. Chow, and J. Kornfield, 1977: A comparative
study of the effects of albedo change on drought in semi-arid regions.. J.
Atmos. Sci., 34, 1366-1385.
Chen, T.-C., and H. van Loon, 1987: Interannual variation of the Tropical
Easterly Jet. Mon. Wea. Rev., 115, 1739-1759.
Chen, T. H., and Coauthors, 1997: Cabauw experimental results from the
Project for Intercomparison of Land-Surface Parameterization Schemes.
J. Climate, 10, 11941215..
32

Chou, M.-D., and M. J. Suarez, 1994: An efficient thermal infrared radiation
parametrization for use in general circulation models. NASA Goddard
Space Flight Center, NASA Tech. Memo 104606, Vol 3, 85 pp.
,and—, 1999: A solar radiation parametrization for use in general circu-
lation models. NASA Goddard Space Flight Center, NASA Tech. Memo
104606, Vol 11, 40 pp.
Clark, D. B., C. M. Taylor, and A. J. Thorpe, 2004: Feedback between the
Land Surface and rainfall at convective lenght scales. J. Hydrometeor., 5,
625-639.
Cook, K., 1999: Generation of the African Easterly Jet and Its Role in Deter-
mining West African Precipitation. J. Climate, 14, 1165-1184.
,and E. K. Vizy, 2006: Coupled model simulations of the West African
Monsoon System: twentieth- and twenty-first-century simulations. J. Cli-
mate, 19, 3861-3703.
Da Silva, R. R., D. Werth, and R. Avissar, 2008: Regional Impacts of Fu-
ture Land-Cover Changes on the Amazon Basin Wet-Season Climate, J.
Climate, 21, 11531170.
Dhonneur, G. 1971: General circulation and types of weather over western
and central Africa. Annex IV, GATE Design, JOC, WMO, 22pp.
Douville, H., F. Chauvine, and H. Broqua, 2005: Influence of soil moisture
on the Asian and African Monsoons. Part I: Mean Monsoon and daily
precipitation. J. Climate, 14, 2381-2403.
33

Giannini, A., R. Saravanan, and P. Chang, 2003: Oceanic forcing of Sahel
rainfall on interannual to interdecadal time scales. Science, 302, 1027-
1030. DOI: 10.1126/science.1089357.
Findell, K. L., E. Shevliakova, P. C. D. Milly, and R. J. Stouffer, 2007: Mod-
eled Impact of Anthropogenic Land Cover Change on Climate. J. Climate,
20, 3621-3634.
Foland, C. K., Palmer, T. N., Parker, D. E. 1986: Sahel rainfall and worldwide
sea temperatures. Nature, 320, 602-607.
Gibson, J.K., P. Kallberg, S. Uppala, A. Hernandez, A. Nomura and E. Ser-
rano, 1997: ERA Description. ECMWF Re-Analysis Project Report Se-
ries, 1.
Hall N. M. J., G. N. Kiladis, and C. D. Thorncroft, 2006: Three-Dimensional
Sturcture and Cynamics of African Easterly Waves. Part II:Dynamical
Modes, J. Atmos. Sci., 63, 2231-2245.
Hamilton, R. A., and J. W. Archibold, 1945: Meteorology of Nigeria and
adiacent territories. Q. J. Roy. Met. Soc., 71, 231-264.
Hagos, S. M., and K. Cook, 2005: Influence of surface processes over Africa
on the Atlantic Marine ITCZ and South American Precipitation. J. Cli-
mate, 18, 4993-5010.
Houze, R. A., Jr., 1977: Structure and dynamics of a tropical squall-line sys-
tem observed during GATE. Mon. Wea. Rev., 105, 1540-1567.
Hsieh, J.-S., and K. Cook, 2005: Generation of African Easterly Wave distur-
34
bances: Relationship to the African Easterly Jet. Mon. Wea. Rev. 133,
1311-1327.
,and—, 2007: A study of the energetics of African Easterly Waves usign a
regional climate model. J. Atmos. Sci. 64, 421-440.
,and—, 2008: On the instability of the African Easterly Jet and the gen-
eration of African Waves: reversal of the potential vorticity gradient. J.
Atmos. Sci. 65, 2130-2151.
Kallberg, P., A. Simmons, S. Uppala, and M. Fuentes, 2004: The ERA-40
archive. ERA-40 Project Report Series, 17, 1-31. Available online at
http://www.ecmwf.int/publications/library/do/references/list/1 92
Kanamitsu M., W. Ebisuzaki, J. Woollen, S.-K. Yang, J. J. Hnilo, M. Fiorino,
and G. L. Potter, 2002: NCEPDOE AMIP-II Reanalysis (R-2). Bull. Amer.
Meteor. Soc., 83, 16311643.
Kiladis, G. N., C. D. Thorncroft, and N. M. J. Hall, 2006: Three-Dimensional
Sturcture and Cynamics of African Easterly Waves. Part I:Observations,
J. Atmos. Sci., 63, 2212-2230.
Kistler, R., E. Kalnay, W. Collins, S. Saha, G. White, J. Woollen, M. Chelliah,
W. Ebisuzaki, M. Kanamitsu, V. Kousky, H. van den Dool, R. Jenne, and
M. Fiorino, 2001: The NCEP-NCAR 50-year reanalysis: Monthly means
CD-ROM and documentation. Bull. Amer. Meteor. Soc., 82, 247–267.
Koster, R. D., and M. J. Suarez, 1992: Modeling the land surface boundary
in climate models as a composite of independent vegetation stands. J.
35

Geophys. Res., 97, 26972715.
,and—, 1995: Relative contributions of land and ocean processes to pre-
cipitation variability. J. Geoph. Res., 100, 13,775-13,790.
,and—, 1996: Energy and water balance calculations in the Mosaic LSM.
NASA Goddard Space Flight Center, NASA Tech. Memo. 104606, Vol.
9., 59 pp.
,—, and M. Heiser, 2000: Variance and Predictability of Precipitation at
Seasonal-to-Interannual Timescales. J. Hydrometeor., 1, 26-46.
Louis, J., M. Tiedtke, and J. Geleyn, 1982: A short history of the PBL parametriza-
tion at ECMWF. Proc. ECMWF Workshop on Planetary Boundary Layer
Parametrization, Reading, United Kingdom, ECMWF, 59-80.
Moorthi, S., and M. J. Suarez, 1992: Relaxed Arakawa-Schubert: A parametriza-
tion of moist convection for general circulation models. Mon. Wea. Rev.,
120, 978-1002.
Nicholson, S. E., 1997: An analysis of the ENSO signal in the Tropical At-
lantic and western Indian Ocean. Int. J. Climatology., 17, 345-375.
,and J. Kim, 1997: The relationship of the ENSO to African Rainfall. Int.
J. Climatology., 17, 117-135.
Onogi, K., J. Tsutsui, H. Koide, M. Sakamoto, S. Kobayashi, H. Hatsushika,
T. Matsumoto, N. Yamazaki, H. Kamahori, K. Takahashi, S. Kadokura, K.
Wada, K. Kato, R. Oyama, T. Ose, N. Mannoji and R. Taira, 2007: The
JRA-25 Reanalysis. J. Meteor. Soc. Japan, 85, 369-432.
36

Parker, D. J., A. Fink, S. Janicot, J.-B. Ngamini, M. Douglas, E. Afiesimama,
A. Agusti-Panared, A. Beljaars, F. Dide, A. Diedhiou, T. Lebel, J. Polcher,
J.-L. Redelsperger, C. Thorncroft, and G. Ato Wilson, 2008: The AMMA
radiosonde program and its implications for the future of atmospheric
monitoring over Africa. Bull. Am. Meteor. Soc., 89, 1015-1027.
Pegion, P. J., Schubert, and M. J. Suarez, 2000: An assessment of the pre-
dictability of northern winter seasonal means with the NSIPP 1 AGCM.
NASA Goddard Space Flight Center, NASA Tech. Memo 104606, Vol.
18, 110 pp.
Reale, O., and P. Dirmeyer, 2002: Modeling the effect of land-surface evapo-
ration variability on precipitation variability. Part I: General response. J.
Hydrometeor., 3, 433-450.
—,—, and A. Schlosser, 2002: Modeling the effect of land-surface evapora-
tion variability on precipitation variability. Part II: Time- and space-scale
structure. J. Hydrometeor., 3, 451-466.
Schubert, S. D., M. J. Suarez, P. J. Pegion, M. A. Kistler, and A. Kumer, 2002:
Predictability of zonal means during boreal summer. J. Climate, 15, 420-
434.
Semazzi, F. H. M., B. Burns, N.-H. Lin, and J.-K. Schemm, 1996: A GCM
study of the teleconnections between the continental climate of Africa and
Global Sea Surface Temperature anomalies. 2002: Predictability of zonal
means during boreal summer. J. Climate, 9, 2480-2497.
37

Simmsons, A., and J.K. Gibson, 2000: The ERA-40 project plan. ERA-40
Project Report Series, 1, 1-63. Available online at
http://www.ecmwf.int/publications/library/do/references/list/1 92
Suarez M. J., and L. L. Takacs, 1995: Documentation of the Arries-GEOS
dynamical core: version 2. NASA Goddard Space Flight Center, NASA
Tech. Memo. 104606, Vol. 5, 45 pp.
Taylor, C. M., E. F. Lambin, N. Stephenne, R. J. Hardling, and R. L. H. Essey,
2002: The Influence of Land Use Change on Climate in the Sahel. J.
Climate, 15, 36153629.
Tompkins, A. M., C. Cardinali, J.-J. Morcrette, and M. Rodwell, 2005: In-
fluence of aerosol climatology on forecasts of the African Easterly Jet.
Geoph. Res. Letter., 32, L10801, doi:10.1029/2004GL022189.
Thorncroft, C. D., and M. Blackburn, 1999: Maintenance of the African east-
erly jet Q. J. Roy. Met. Soc., 125, 763-786.
,D. J. Parker, R. R. Burton, M. Diop, J. H. Ayers, H. Bariat, S. Devereau,
A. Diongue, R. Dumelow, D. R. Kindred, N. M. Price, M. Saloum, C.
M. Tayor, and A. M. Tompkins, 2003: The JET 2000 Project. Aircraft
observations of the African Easterly Jet and African Easterly Waves. Bull.
Am. Meteor. Soc., 84, 337-351.
Redelsperger, J.-L., C. D. Thorncroft, A. Diedhiou, T. Lebel, D. J. Parker,
and J. Polcher, 2006: African Monsoon Multidisciplinary Analysis: An
international research project and field campaign. Bull. Am. Meteor. Soc.,
38
87, 1739-1746.
Tucker, C., Dregne, H. D., and W. W. Newcomb, 1999: Expansiopn and con-
traction of the Sahara desert from 1980 to 1990. Science, 253, 299-300.
DOI: 10. 1 126/science.253.5017.299.
Uppala, S. M., P. W. Kallberg, A. J. Simmons, U. Andrae, V. D. Bechtold et al.,
2005: The ERA-40 re-analysis. Q. J. R. Meteorol. Soc., 131, 2961-3012.
Xue, Y., and J. Shukla, 1993: The Influence of Land Surface Properties on
Sahel Climate. Part 1: Desertification J. Climate, 6, 2232-2245.
Wu, C. M.-L., S. Schubert, M. J. Suarez, and P. J. Pegion, 2006: Seasonality
and Meridional Propagation of the MJO. J. Climate, 19, 1901-1921.
Wood, E. F., and Coauthors, 1998: The Project for the Intercomparison of
Land-Surface Parameterization Schemes (PILPS) phase 2(c) Red-Arkansas
River basin experiment. 1: Experiment description and summary inter-
comparisons. Global Planet. Change, 19,115-135.
Vizy, E. K, and K. H. Cook, 2001: Mechanisms by which Gulf of Guinea and
Eastern North Atlantic Sea Surface Temperature anomalies can influence
African rainfall. J. Climate, 14, 795-821.
Zipser, E. J., and C. Gautier, 1978: Mesoscale Events within a GATE tropical
depression Mon. Wea. Rev., 106, 789-805.
Zeng, N. and J. D. Neelin, 2000: The role of vegetation-climate interaction
and interannual variability in shaping the African Savanna. J. Climate, 13,
2665-2670.
39

List of Tables
1 The experiment settings are described. The first column shows
the role of albedo and vegetation type. The second column shows
the role of the evaporation efficiency 0. The third column refers
to the orography. . . . . . . . . . . . . . . . . . . . . . . . . . . 41
40

Vegetation Evaporation Efficiency OrographyControl Varying Varying RealisticEXP 1 Varying Prescribed (Sahel conditions) RealisticEXP 2 Varying Prescribed (Sahara conditions) RealisticEXP 3 Prescribed Varyiing RealisticEXP 4 Prescribed Prescribed RealisticEXP 5 Varying Varyiing Prescribed
Table 1: The experiment settings are described. The first column shows the role of
albedo and vegetation type. The second column shows the role of the evaporation
efficiency 0. The third column refers to the orography.
41

List of Figures
1 July zonal wind (m s-1 , contours every 1m s-1 , 0 omitted, solid-positive,
dashed-negative) climatology (1980-2001) based on ERA-40, NCEP R2,
JRA-25 data, and NSIPP-1 AGCM three ensemble runs: 600 hPa (left
column) and cross section at 0° longitude (right column). . . . . . . . 45
2 July zonal wind (m s-1 , contours every 1m s-1 , 0 omitted, solid-positive,
dashed-negative) climatology (1980-2001) based on ERA-40, NCEP R2,
and JRA-25 data, and meridional horizontal shear of the zonal wind at
600 hPa (left column, contours at +/ — 2,1.5, 1,.5.1 x 10 -6 s-1). Cross
section at 0° longitude (right column). . . . . . . . . . . . . . . . . . 46
3 July zonal wind (m s-1 , contours every 1m s-1 , 0 omitted, solid-positive,
dashed-negative) climatology (1980-2001) based on ERA-40, NCEP R2,
and JRA-25 data, and K(y) at 600 hPa (left column, contours at +/ —
2,1, .5 x 10-11 m-1 s-1). Cross section at 0° longitude (right column). . 47
4 Map of predominant vegetation types. The actual vegeatation in the
model is much more complex, since up to six vegetation types can be ob-
served within each gridbox, following a ‘mosaic’ approach (left panel).
Map of model topography (right panel). . . . . . . . . . . . . . . . . 48
5 JAS surface temperature (K) computed for the Control and Experiments
1, 2, 3, 4, 5 (left column, upper color bar). Right column: differences
from the control (lower color bar) . . . . . . . . . . . . . . . . . . . . 49
42

6 JAS precipitation (mm d-1 ) computed for the Control and Experiments
1, 2, 3, 4, 5 (left column, upper color bar). Right column: differences
from the control (lower color bar) . . . . . . . . . . . . . . . . . . . . 50
7 JAS latent heat fluxes (Wm-2) computed for the Control and Experi-
ments 1, 2, 3, 4, 5 (left column, upper color bar). Right column: differ-
ences from the control (lower color bar) . . . . . . . . . . . . . . . . . 51
8 1980-2001 meridional surface temperature gradient ( K deg-1) com-
puted for the Control and Experiments 1, 2, 3, 4, 5 (left column, up-
per color bar). Zonal vertical cross-sections of meridional temperature
gradient (K deg-1) at 12°N (central column, middle color bar). Merid-
ional vertical cross-sections of temperature ( K) at 0° longitude (right
column, lower color bar) . . . . . . . . . . . . . . . . . . . . . . . . 52
9 July zonal wind (m s-1) computed for the Control and Experiments 1,
2, 3, 4, 5 (left column). Right column: meridional vertical cross sections
of zonal wind at 0° longitude. . . . . . . . . . . . . . . . . . . . . . 53
10 July zonal wind (m s-1) computed for the Control and Experiments 1,
2, 3, 4, 5 (left column) and meridional horizontal shear of the zonal wind
at 600 hPa (left column, contours at +/ — 2,1.5,1, .5.1 × 10-6 s-1, solid-
positive, dashed-negative). Right column: meridional vertical cross sec-
tions of the same quantities at 0° longitude. . . . . . . . . . . . . . . 54
11 Geopotential height (hm) and wind (m s-1 ) at 600 hPa (left column, up-
per color bar) and 925 hPa (right column, lower color bar) in the Control
and Experiment runs. . . . . . . . . . . . . . . . . . . . . . . . . . 55
43

12 600 hPa zonal wind (m s-1 , contours every 1m s- 1 , 0 omitted, solid-
positive, dashed-negative) in the Control and Experiments 3 and 5, com-
pared with meridional surface temperature gradients (shaded K deg-1.) 56
13 Anomalies (computed as the difference Experiment minus Control) of
surface latent heat fluxes (first column), surface temperature (second
column) and precipitation (third column) for Experiment 1 (first row),
Experiment 3 (second row), Experiment 4 (third row). The last row
shows the anomaly sums of Experiment 1 plus Experiment 3.. . . . . . 57
44

Figure 1: July zonal wind (m s-1 , contours every 1m s- 1 , 0 omitted, solid-positive,dashed-negative) climatology (1980-2001) based on ERA-40, NCEP R2, JRA-25 data,and NSIPP-1 AGCM three ensemble runs: 600 hPa (left column) and cross section at 0°longitude (right column).
45
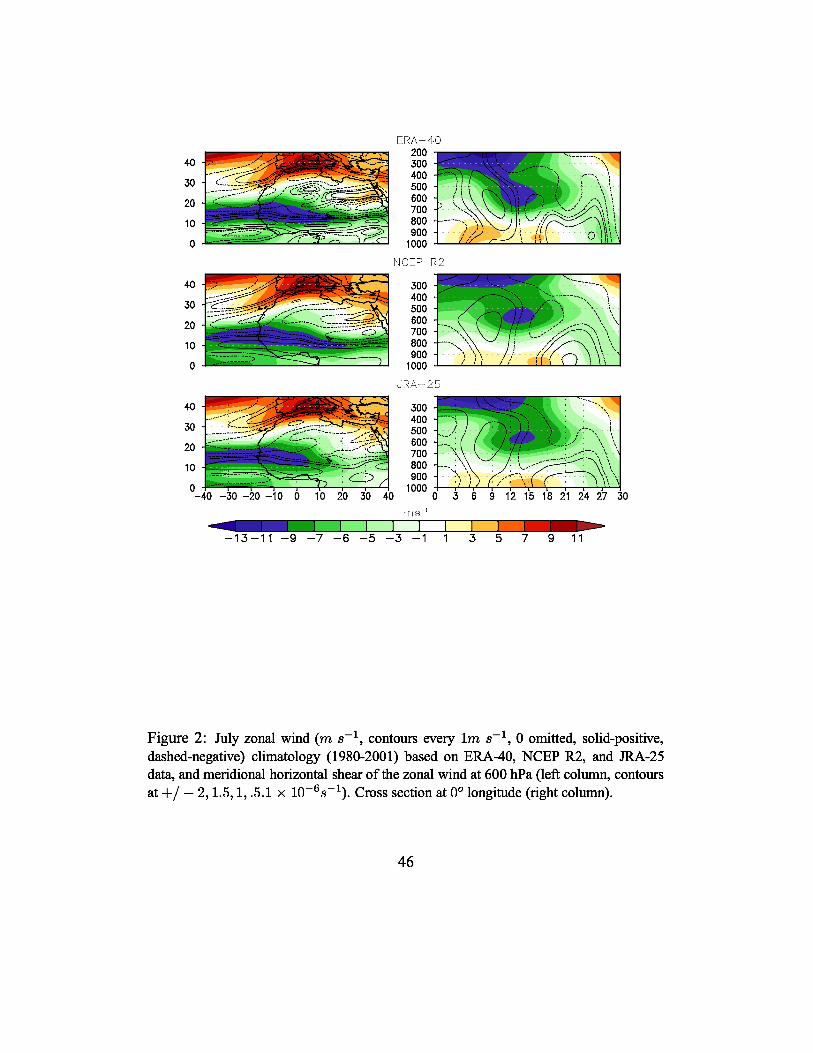
Figure 2: July zonal wind (m s-1 , contours every 1m s- 1 , 0 omitted, solid-positive,dashed-negative) climatology (1980-2001) based on ERA-40, NCEP R2, and JRA-25data, and meridional horizontal shear of the zonal wind at 600 hPa (left column, contoursat +/ — 2, 1.5, 1,.5.1 x 10-6s-1). Cross section at 0° longitude (right column).
46

Figure 3: July zonal wind (m s-1 , contours every 1m s- 1 , 0 omitted, solid-positive,dashed-negative) climatology (1980-2001) based on ERA-40, NCEP R2, and JRA-25data, and K(y) at 600 hPa (left column, contours at +/ — 2,1, .5 x 10- 11 m- 1 s- 1 ).Cross section at 0° longitude (right column).
47
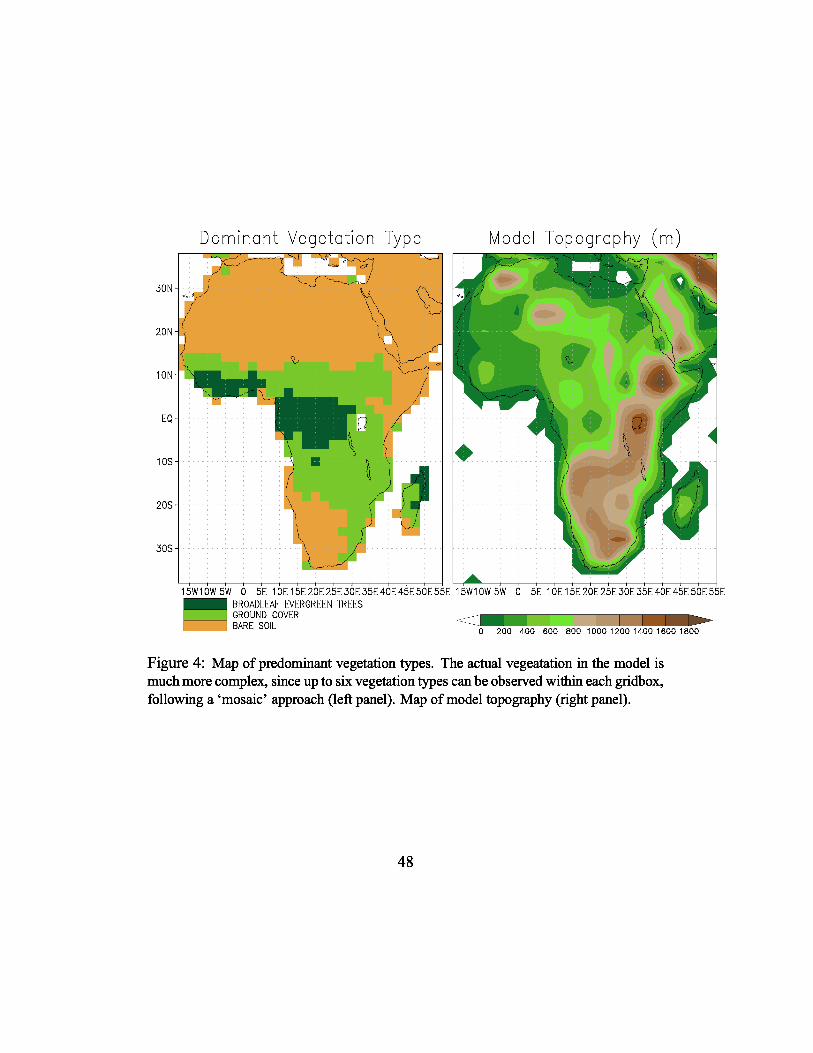
Figure 4: Map of predominant vegetation types. The actual vegeatation in the model ismuch more complex, since up to six vegetation types can be observed within each gridbox,following a ‘mosaic’ approach (left panel). Map of model topography (right panel).
48
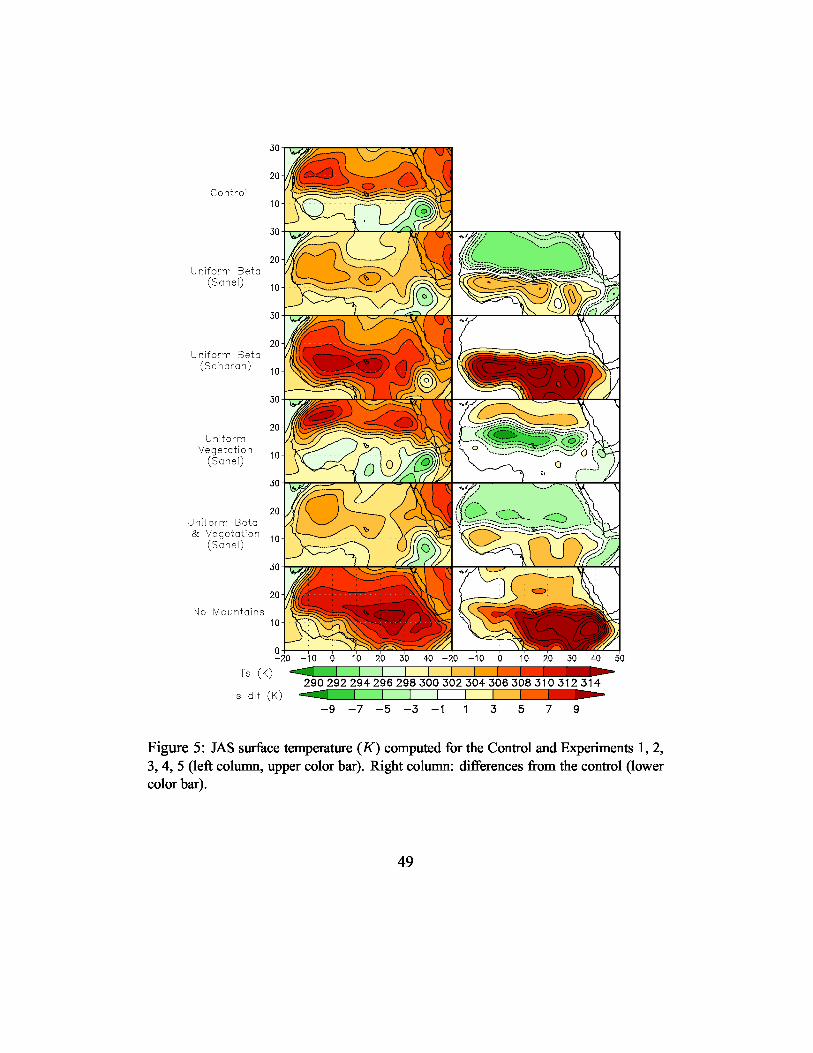
Figure 5: JAS surface temperature (K) computed for the Control and Experiments 1, 2,3, 4, 5 (left column, upper color bar). Right column: differences from the control (lowercolor bar).
49

Figure 6: JAS precipitation (mm d-1 ) computed for the Control and Experiments 1, 2,3, 4, 5 (left column, upper color bar). Right column: differences from the control (lowercolor bar).
50

Figure 7: JAS latent heat fluxes (Wm-2) computed for the Control and Experiments1, 2, 3, 4, 5 (left column, upper color bar). Right column: differences from the control(lower color bar).
51

Figure 8: 1980-2001 meridional surface temperature gradient ( K deg— ') computed forthe Control and Experiments 1, 2, 3, 4, 5 (left column, upper color bar). Zonal verticalcross-sections of meridional temperature gradient (K deg— ') at 12°N (central column,middle color bar). Meridional vertical cross-sections of temperature ( K) at 0° longitude(right column, lower color bar).
52

Figure 9: July zonal wind (m s-1 ) computed for the Control and Experiments 1, 2, 3,4, 5 (left column). Right column: meridional vertical cross sections of zonal wind at 0°longitude.
53

Figure 10: July zonal wind (m s-1 ) computed for the Control and Experiments 1, 2,3, 4, 5 (left column) and meridional horizontal shear of the zonal wind at 600 hPa (leftcolumn, contours at +/- 2,1.5,1, .5.1 × 10-6 s-1, solid-positive, dashed-negative). Rightcolumn: meridional vertical cross sections of the same quantities at 0° longitude.
54

Figure 11: Geopotential height (hm) and wind (m s-1 ) at 600 hPa (left column, uppercolor bar) and 925 hPa (right column, lower color bar) in the Control and Experimentruns.
55

Figure 12: 600 hPa zonal wind (m s-1 , contours every 1m s- 1 , 0 omitted, solid-positive,dashed-negative) in the Control and Experiments 3 and 5, compared with meridional sur-face temperature gradients (shaded K deg-1.)
56

Figure 13: Anomalies (computed as the difference Experiment minus Control) of surfacelatent heat fluxes (first column), surface temperature (second column) and precipitation(third column) for Experiment 1 (first row), Experiment 3 (second row), Experiment 4(third row). The last row shows the anomaly sums of Experiment 1 plus Experiment 3.
57