afm-basierte desorption einzelner oberflächenadsorbierter ... · biopolymers with mineral...
TRANSCRIPT

AFM-basierte Desorption einzelner
oberflachenadsorbierter Polyelektrolyte:
Kompetitive Adhasion und
Biomineralisation
Lars Sonnenberg
Munchen 2006


AFM-basierte Desorption einzelner
oberflachenadsorbierter Polyelektrolyte:
Kompetitive Adhasion und
Biomineralisation
Lars Sonnenberg
Dissertation
an der Fakultat fur Physik
der Ludwig–Maximilians–Universitat
Munchen
vorgelegt von
Lars Sonnenberg
aus Osterode am Harz
Munchen, den 22.12.2006

Erstgutachter: Prof. Dr. Hermann E. Gaub
Zweitgutachter: Prof. Dr. Roland R. Netz
Tag der mundlichen Prufung: 06.02.2007

Zusammenfassung
Die Adhasion von Polymeren an festen Oberflachen ist von großem wissenschaftlichen
Interesse. Ebenso bedeutend ist die Polymerhaftung aber auch fur eine Vielzahl indu-
strieller Anwendungen. Bei Klebungen beispielsweise kommt der Adhasion von Polyme-
ren, die zwei Oberflachen uberbrucken, besonderes Interesse zu. Die außergewohnlichen
Materialeigenschaften von Biomineralien und damit verbunden ihre Bedeutung fur die
Entwicklung zukunftiger Werkstoffe basieren auf der Wechselwirkung von Biopolymeren
mit Mineraloberflachen. Eine gezielte Materialentwicklung mit vorhersagbaren Hafteigen-
schaften ist derzeit jedoch wegen des eingeschrankten Wissens uber die zugrundeliegenden
molekularen Mechanismen und Wechselwirkungen der Polymeradsorption noch nicht in
zufriedenstellender Weise moglich. AFM-basierte Kraftspektroskopie ermoglicht die Un-
tersuchung von Konformationen und Wechselwirkungen von Makromolekulen sowie die
hochprazise Bestimmung inter- und intramolekularer Krafte. Desorptionsmessungen an
einzelnen oberflachenadsorbierten Polyelektrolytketten konnen dabei zu einem besseren
Verstandnis der molekularen Wechselwirkungen beitragen. Sie ermoglichen die hochprazi-
se Quantifizierung der Wechselwirkungskraft zwischen Polymer und Oberflache. Daruber
hinaus bietet eine gesteuerte Veranderung der experimentellen Bedingungen und damit
der Desorptionskraft Einsichten in die unterschiedlichen Wechselwirkungen.
Im Fall oberflachenuberbruckender Polymere adsorbiert die Polymerkette auf zwei Ober-
flachen, die sozusagen in Konkurrenz zueinander stehen, so dass kompetitive Aspekte der
Adhasion eine wichtige Rolle spielen konnen. Im Rahmen dieser Arbeit konnte mit AFM-
Desorptionsmessungen erfolgreich veranschaulicht werden, dass die Adhasionseigenschaf-
ten beider Oberflachen berucksichtigt werden mussen. Daraus ergibt sich zum Beispiel
eine Abhangigkeit der Lange des uberbruckenden Polymersegments von der Dichte der
Molekule auf der Oberflache, da benachbarte Molekule die Wechselwirkung des Polymers
mit der Oberflache ortlich einschranken konnen. Intra- und intermolekulare Wechselwir-
kungen konnen zudem zu einem konturlangenabhangigen Dissoziationsverhalten des Po-
lymers fuhren, das in Unterschieden der gemessenen Desorptionskraft resultiert.
Bei Biomineralien mangelt es an Wissen uber die Struktur der haufig sauren Makro-
molekule und die komplexen Wechselwirkungen mit den Mineraloberflachen. An einem
Modellsystem aus Polyglutaminsaure und Calcit konnte gezeigt werden, dass mit AFM-
Desorptionsmessungen dieses molekulare Zusammenspiel von Wechselwirkungen auf der
Basis von Wechselwirkungskraften sehr detailliert untersucht werden kann. Dies ist not-
wendig, da geringe Veranderungen auf der molekularen Skala große Effekte auf der makro-
skopischen Skala hervorrufen konnen. Es stellte sich außerdem heraus, dass Hochenergie-
kristallflachen von Calcit in guten Losungsmitteln ohne stabilisierende Polymeradditive
nicht existieren konnen, sondern sich in die stabile Calcit (104)-Flache umwandeln.


Abstract
The adhesion of polymers to solid surfaces is of great scientific interest. In addition, poly-
mer adhesion is similarly important for a variety of industrial applications. For example,
the adhesion of polymers that bridge two surfaces is of particular interest in the field of
adhesives. The exceptional material properties of biominerals and with it their import-
ance for the development of future advanced materials are based on the interaction of
biopolymers with mineral surfaces. However, targeted materials design with predictable
adhesive properties is currently not satisfactory due to the limited understanding of the
underlying molecular properties and interactions of polymer adsorption. AFM-based force
spectroscopy enables the study of conformations and interactions of macromolecules as
well as determination of inter- and intra-molecular forces with high precision. Desorption
measurements on single surface-adsorbed polyelectrolyte chains can thereby contribute
to a better understanding of the molecular interactions. They enable the high precision
quantification of the interaction force between polymer and surface. Moreover, the con-
trolled variation of the experimental conditions, and so the desorption force, offers insights
into the different interactions.
In the case of surface bridging polymers the polymer chain adsorbs onto two surfaces,
which are in quasi competition with each other so that competitive aspects of adhesion
may play an important role. In this thesis it was possible to successfully demonstrate using
AFM desorption measurements that the adhesion properties of both surfaces have to be
taken into account. As a consequence, the length of the bridging polymer segment is for
example dependent on the density of molecules on the surface as adjacent molecules can
locally confine the interaction of the polymer with the surface. Intra- and intermolecular
interactions can furthermore lead to a contour length dependent dissociation behavior of
the polymer, which results in differences in the measured desorption force.
The area of biominerals is lacking knowledge about the structure of the often acidic macro-
molecules and their complex interactions with the mineral surfaces. As was demonstrated
using a model system of poly(glutamic acid) and calcite, this molecular interplay of inter-
actions can be investigated in detail on the basis of interaction forces with AFM desorption
measurements. This is necessary because small variations on the molecular scale can have
large effects on the macroscopic scale. It also turned out that high-energy crystal sur-
faces of calcite cannot exist in good solvents without stabilizing polymer additives, but
transform into the stable calcite (104) surface.


Inhaltsverzeichnis
1 Einleitung 1
2 Polyelektrolyte in Losung 3
2.1 Neutrale Polymere . . . . . . . . . . . . . . . . . . . . . . . . . . . . . . . 3
2.2 Polyelektrolyte . . . . . . . . . . . . . . . . . . . . . . . . . . . . . . . . . 7
3 Polyelektrolyte an Fest-Flussig-Grenzflachen 11
3.1 Polyelektrolyt-Substrat-Wechselwirkungen . . . . . . . . . . . . . . . . . . 11
3.2 Adsorption an der Fest-Flussig-Grenzflache . . . . . . . . . . . . . . . . . . 13
4 AFM-basierte Desorption oberflachenadsorbierter Polyelektrolyte 17
4.1 AFM-basierte Einzelmolekulkraftspektroskopie . . . . . . . . . . . . . . . . 17
4.2 Desorptionsmessungen . . . . . . . . . . . . . . . . . . . . . . . . . . . . . 19
5 Desorptionsmessungen an gepfropften Polyacrylsaure-Monolagen 23
5.1 Experimenteller Teil . . . . . . . . . . . . . . . . . . . . . . . . . . . . . . 23
5.2 Ergebnisse . . . . . . . . . . . . . . . . . . . . . . . . . . . . . . . . . . . . 26
6 Kompetitive Adhasion uberbruckender Polymere 28
6.1 Modell zur differentiellen Adhasion . . . . . . . . . . . . . . . . . . . . . . 28
6.2 Ergebnisse . . . . . . . . . . . . . . . . . . . . . . . . . . . . . . . . . . . . 29
7 Polypeptid-Mineral-Wechselwirkungen 31
7.1 Experimenteller Teil . . . . . . . . . . . . . . . . . . . . . . . . . . . . . . 31
7.2 Ergebnisse . . . . . . . . . . . . . . . . . . . . . . . . . . . . . . . . . . . . 33
A Competitive Adhesion of Single Polymer Chains Bridging two
Surfaces 43
B Choose Sides: Differential Polymer Adhesion 51
C AFM-Based Single Molecule Force Spectroscopy of End-Grafted
Poly(acrylic acid) Monolayers 67
D Quantitative Single Molecule Measurements on the Interaction
Forces of Poly(l-Glutamic Acid) with Calcite Crystals 85
E Novel Method for Generation of Additive-Free High Energy
Crystal Faces and their Reconstruction in Solution 107


1
1 Einleitung
Polymere nehmen eine zentrale Stellung in vielen Bereichen des alltaglichen Lebens ein.1
Eine entscheidende Bedeutung kommt bei vielen Anwendungen der Polymerhaftung, d.h.
der Adhasion von Makromolekulen an Oberflachen oder Polymerschichten, zu. Dabei sind
geladene Polymere, Polyelektrolyte, besonders interessant, da deren Wasserloslichkeit zum
einen okologische und okonomische Vorteile mit sich bringt und zum anderen Ladungs-
wechselwirkungen bei der Haftung genutzt werden konnen. Eine Materialentwicklung mit
gezielten Hafteigenschaften ist jedoch wegen des mangelnden Wissens uber die moleku-
laren Mechanismen und Wechselwirkungen der Polymeradhasion derzeit noch nicht in
zufriedenstellender Weise moglich. Bei der Verwendung von Polyelektrolyten kommt zu-
dem noch hinzu, dass komplexe Ladungsregulierungsmechanismen auftreten.2
Einzelmolekulkraftspektroskopie mit einem Rasterkraftmikroskop (AFM) ermoglicht die
Bestimmung der Konformation und Wechselwirkungen von Makromolekulen in Losung.
Insbesondere konnen inter- und intramolekulare Krafte mit hoher Prazision gemessen
werden.3,4 Bei Desorptionsmessungen wird die Adsorptionskraft einer einzelnen Poly-
elektrolytkette auf einer festen Unterlage bestimmt. Indem einzelne Molekule kovalent
an die Spitze einer AFM-Tastfeder gebunden werden, kann die Adsorptionskraft nicht
nur in Abhangigkeit von den experimentellen Bedingungen wie pH-Wert oder Salzge-
halt der wassrigen Losung, sondern auch auf verschiedenen Oberflachen bestimmt wer-
den. Es konnte gezeigt werden, dass sich die gemessene Desorptionskraft aus einem la-
dungsabhangigen und einem ladungsunabhangigen Beitrag zusammensetzt. Der Coulomb-
Beitrag ist dabei in Debye-Huckel-Naherung proportional zur Debye-Abschirmlange und
der Linienladungsdichte des Polymers.5,6 Zum besseren Verstandnis des ladungsunabhangi-
gen Beitrags, der selbst bei hochgeladenen Oberflachen eine bedeutende Rolle spielt, wurde
die Desorptionskraft in Abhangigkeit von der Hydrophobizitat der Kopfgruppen selbsor-
ganisierender Monolagen naher betrachtet.7 Bei der theoretischen Beschreibung der Po-
lyelektrolytadsorption auf geladenen Oberflachen mussen komplexe Ladungsregulierungs-
mechanismen berucksichtigt werden.8 Mit Desorptionsmessungen konnen also unterschied-
liche Kraftbeitrage bei der Adsorption aufgelost und somit Einblicke in die molekularen
Wechselwirkungen der Polyelektrolytadsorption gewonnen werden.
Die bisherigen Desorptionsstudien analysierten die Adsorptionskraft, die ausschließlich
durch die Wechselwirkung der Polyelektrolytkette mit der Oberflache bestimmt ist. Die
Tatsache, dass das Molekul ebenfalls mit der Oberflache der AFM-Spitze, an der es ko-
valent gebunden ist, wechselwirken kann, blieb dabei unberucksichtigt. In diesem Fall
konkurrieren die beiden Oberflachen um die Adhasion des Polymers, so dass kompeti-
tive Aspekte der Adhasion eine wichtige Rolle spielen konnten. In den Kraft-Abstands-
Kurven wurden sich solche Effekte auf die gemessene (scheinbare) Polymerlange auswir-
ken, nicht aber auf die gemessene Desorptionskraft. Fur Desorptionsmessungen sind in
diesem Fall oberflachenverankerte gepfropfte Polymermonolagen uberaus interessant, da

2 1. Einleitung
diese mit definierter molekularer Architektur hergestellt werden konnen. Die mit AFM-
Desorptionsexperimenten ermittelten Polymerlangen konnen also direkt mit der bekann-
ten molekularen Langenverteilung der Monolage verglichen werden.
In praktischen Anwendungen sind die Adhasionseigenschaften uberbruckender Polymere
vor allem bei Klebungen und kolloidalen Losungen von Bedeutung. Hierbei vermitteln
uberbruckende Polymere die Haftung zwischen den Oberflachen oder stabilisieren kolloi-
dale Partikel gegen Flockung. Bei einer Vielzahl materialwissenschaftlicher oder biophysi-
kalischer Fragestellungen, die Polymerhaftung betreffen, steht jedoch die Wechselwirkung
der Polymere mit nur einer Oberflache im Mittelpunkt. Ein solches Beispiel sind Biomine-
ralien, denen die spezifischen Wechselwirkungen von biologischen Molekulen und anorga-
nischen Mineralkristallen aussergewohnliche Materialeigenschaften verleihen.9 Aufgrund
ihrer uberlegenen Materialeigenschaften werden Biomineralien als Archetyp zukunftiger
Materialien betrachtet. Ein Paradebeispiel sind Muschelschalen fur die Entwicklung von
Beton, da Muschelschalen extrem bruchfest sind und sich Risse nur schwer ausbreiten
konnen.
Nach einer Einfuhrung in die wichtigsten Polymer- und insbesondere Polyelektrolyteigen-
schaften in Kapitel 2 werden grundlegende Aspekte der Polyelektrolytadsorption an Ober-
flachen in Kapitel 3 betrachtet. Kapitel 4 gibt einen Uberblick uber Kraftspektroskopie
auf Einzelmolekulebene in Hinblick auf AFM-basierte Desorptionsmessungen. Die Ergeb-
nisse bei Anwendung dieser Technik auf oberflachenverankerte gepfropfte Polyelektrolyt-
Monolagen werden in Kapitel 5 dargestellt. Darauf basierend wurden kompetitive Aspekte
der Polyelektrolytadhasion betrachtet, deren Resultate in Kapitel 6 zusammengefaßt wer-
den. Kapitel 7 zeigt die Ergebnisse der Untersuchungen von Polypeptid-Mineral-Wechsel-
wirkungen mittels Desorptionsmessungen. Die zugehorigen Publikationen finden sich im
Anhang A bis E.

3
2 Polyelektrolyte in Losung
Polymere sind Makromolekule, die aus kovalent verbundenen Einheiten, den Monomeren,
bestehen.10 Diese monomeren Grundbausteine konnen dabei linear in Form einer Kette
angeordnet sein oder verzweigte Formen wie Dendrimere oder Sterne bilden. Synthetisch
hergestellte Polymere sind daruber hinaus vorwiegend Homopolymere, beinhalten also
im Gegensatz zu den biologisch haufigen Heteropolymeren nur eine einzige Monomerart.
Das Aneinanderfugen solcher Homopolymere bezeichnet ein Blockcopolymer, wobei durch
Kombination eines hydrophoben und eines hydrophilen Blocks in wassrigen Losungen Me-
sostrukturen wie Mizellen oder Lamellen geformt werden konnen.
Die bekanntesten Beispiele synthetischer Polymere sind vermutlich Polyethylen (PE), Po-
lypropylen (PP) und Polyvinylchlorid (PVC), wahrend fur Biopolymere diesbezuglich
Desoxyribonucleinsaure (DNA), Proteine oder Polysaccharide zu nennen sind.
Polymere sind von fundamentaler Bedeutung, sowohl fur biologische Prozesse als auch
fur eine Vielzahl industrieller Anwendungen.11 Besonderes Augenmerk liegt bei letzteren
auf geladenen Polymeren, den Polyelektrolyten, die aufgrund ihrer Wasserloslichkeit aus
okonomischen und okologischen Grunden Vorteile bieten.
2.1 Neutrale Polymere
Neutrale Polymere tragen keinerlei Ladungen an den Monomereinheiten. Die aufgrund
nicht vorhandener langreichweitiger Coulomb-Wechselwirkungen resultierende einheitli-
che Langenskala der dominierenden Wechselwirkungen erlaubt eine umfassende Beschrei-
bung ungeladener Makromolekule mittels statistischer Physik. Darauf wiederum grundet
entscheidend das heutige gute Verstandnis neutraler Polymere.12–18
Polyethylen (-CH2-CH2-)n sowie zahlreiche andere ungeladene Polymere sind in vielen
organischen Losungsmitteln, z.B. Toluol, loslich, in Wasser jedoch unloslich. Die Was-
serloslichkeit kann unter anderem durch Einfugen ausgepragter dipolarer Gruppen, die
kompatibel zu der starken Polarisierbarkeit von Wasser sind, erreicht werden, wie im Fall
von Polyethylenoxid (PEO)A (-CH2-CH2-O-)n.
2.1.1 Ideale Ketten
Als ideale Ketten werden lineare Polymere bezeichnet, bei denen die Wechselwirkungen
zwischen den Monomeren vernachlassigt werden konnen. Infolgedessen sind die Ketten
unter anderem ganzlich flexibel auf der Langenskala eines Monomers, so dass bei deren
physikalischer Beschreibung zu Translations- und Rotationsfreiheitsgraden eine Vielzahl
ABasiert die Herstellung auf Ethylenglycolmonomeren anstatt auf Ethylenoxidmonomeren wird Poly-ethylenglycol (PEG) als Bezeichnung verwendet. PEO und PEG unterscheiden sich allerdings nur hin-sichtlich der Endgruppen. Monodisperse PEO/PEG-Polymere mit Molekulargewichten uber ca. 40000g/mol sind PEO-Polymere.19

4 2. Polyelektrolyte in Losung
von Konformationsfreiheitsgraden hinzutreten.
Eine Polymerkette des Polymerisationsgrads N setzt sich dabei vereinfacht aus N frei be-
weglichen Einheiten der Lange a zusammen, deren raumliche Ausrichtungen unabhangig
voneinander sind (s. Abb. 1). Zur vollstandigen Beschreibung der Konformation ist ein
Satz von (N + 1) Ortsvektoren {Ri} = (R0, . . . ,RN), respektive N Bindungsvektoren
{ri} = (r1, . . . , rN) hinreichend, fur die der Zusammenhang besteht:
ri = Ri −Ri−1, i = 1, 2, . . . , N. (1)
Abbildung 1. Schematische Darstellung einer idealen Polymerkette bestehend aus (N+1) Orts-
vektoren Ri und entsprechend N Bindungsvektoren ri der Monomerlange a.
Die Definition des End-zu-End-Vektors R folgt damit intuitiv,
R ≡ RN −R0 =N∑
i=1
ri. (2)
Die Wahrscheinlichkeitsverteilung des End-zu-End-Vektors Φ entspricht einer Gaussver-
teilung,
Φ(R, N) '(
3
2πNa2
) 32
exp
(− 3R2
2Na2
), (3)
ergo den Ergebnissen der Zufallsbewegung (random walk). Der gemittelte End-zu-End-
Vektor 〈R〉 kann wegen der fehlenden Vorzugsrichtung der Monomere, d.h. 〈R〉=0, nicht
zur Charakterisierung der Polymergroße herangezogen werden. Der End-zu-End-Abstand
R als charakteristische Eigenschaft der Polymerausdehnung und -konformation wird viel-
mehr an Hand des gemittelten quadratischen End-zu-End-Vektors 〈R2〉 definiert,
R2 ≡ 〈R2〉 =N∑
i=1
〈r2i 〉+ 2
∑i>j
〈ri · rj〉 = Na2. (4)
Dabei ergibt sich 〈ri · rj〉 = 0 fur i 6= j bei thermischer Mittelung wiederum aus der
ausbleibenden Korrelation zweier willkurlicher Bindungsvektoren, so dass sich die Formel
auf die Terme mit 〈r2i 〉 = a2 reduziert.

2.1 Neutrale Polymere 5
2.1.2 Reale Ketten
Die aufgefuhrten Eigenschaften idealer Ketten gelten fur reale Ketten nur eingeschrankt,
insbesondere wegen der Vernachlassigung kurzreichweitiger Wechselwirkungen innerhalb
der Kette. Das einfachste realitatsnahere Modell ist das Modell der freiverbundenen Kette
(freely jointed chain, FJC), bei dem Abweichungen vom idealen Verhalten durch eine
Anpassung der effektiven Monomerlange ausgeglichen werden. Anstelle der strukturell
definierten Monomerlange a im Modell idealer Ketten tritt hier der variable Parameter
der Kuhn-Lange aK , so dass alle aus dem End-zu-End-Vektor abgeleiteten Relationen ihre
Gultigkeit behalten. Die Notwendigkeit dieser Abstimmung ruhrt wesentlich von einer
finiten Steifheit der Kette sowie eingeschrankten Konformationsfreiheitsgraden her.
Ausgeschlossenes Volumen Neben den kurzreichweitigen Wechselwirkungen entlang
der Polymerkette mussen auch Volumenwechselwirkungen bedacht werden, da in ge-
knauelten Molekulkonformationen auch nicht unmittelbar benachbarte Monomere in Wech-
selwirkung zueinander treten konnen. Die naheliegendste Konsequenz ist eine sterische
Abstoßung, da dasselbe Volumenelement nicht von mehreren Monomeren eingenommen
werden kann. Dieses fur die Kette quasi ausgeschlossene Volumen kann in Analogie zur Zu-
fallsbewegung als eine selbstvermeidende Bewegung (self-avoiding walk) gesehen werden,
die die statistischen Eigenschaften des Molekuls nachhaltig beeinflußt. Die Abhangigkeit
des End-zu-End-Abstands R vom Polymerisationsgrad N beispielsweise geht in
R ' N ν ν ≈ 3/5 (5)
uber. Bei detaillierterer Betrachtung des ausgeschlossenen Volumens mussen zusatzlich zu
der sterischen Abstoßung noch van-der-Waals-Wechselwirkungen und durch das Losungs-
mittel vermittelte Wechselwirkungen einbezogen werden.
Losungsmittelqualitat Die Konformation von Polymeren in Flussigkeit ist entschei-
dend von der Qualitat des Losungsmittels gepragt, die angibt, in welchem Verhaltnis die
Wechselwirkungen der Monomere untereinander zu den Wechselwirkungen der Monomere
mit dem Losungsmittel stehen.
In guten Losungsmitteln dominiert die Wechselwirkung der Monomere mit dem Losungs-
mittel. Die hierbei als repulsiv anzusehende effektive Monomer-Monomer-Wechselwirkung
bewirkt aufgrund des ausgeschlossenen Volumens im Vergleich zur Große idealer Ketten
ein Anschwellen des Polymerknauels,
R ' aN ν ν = 3/5. (6)
In schlechten Losungsmitteln ubersteigt die Monomer-Monomer-Wechselwirkung die der
Monomere mit dem Losungsmittel. Die anziehende effektive Wechselwirkung zwischen den

6 2. Polyelektrolyte in Losung
Segmenten fuhrt zum Kollabieren der Kette und damit zur Anordnung in einem dichten
Kugelchen (polymer globule),
R ' aN ν ν = 1/5. (7)
Theta-Losungmittel bezeichnen den Bereich zwischen gutem und schlechtem Losungsmit-
tel. Die Wechselwirkungen der Momomere untereinander sowie mit dem Losungsmittel
sind demnach von vergleichbarer Starke und der sich in diesem Fall ergebende End-zu-
End-Abstand entspricht nahezu dem idealer Polymerketten,
R ' aN ν ν = 1/2. (8)
Kettensteifigkeit Die Konformation eines Polymers und dessen Adsorptionsverhalten
an festen Oberflachen sind maßgeblich von der Steifheit des Molekuls abhangig. Wahrend
viele Biopolymere auf der Nanometerskala als steif und auf großeren Langenskalen als
semiflexibel angesehen werden konnen, sind synthetische Polymere meist durchweg als
flexibel einzustufen.
Die Biegesteifigkeit von Polymeren wird am einfachsten mit einem Kontinuumsmodell be-
schrieben, wobei vorwiegend das Modell der wurmartigen Kette (worm-like chain, WLC),
auch bekannt als Kratky-Porod-Modell20 angewandt wird. Die Steifigkeit wird darin durch
die Persistenzlange l0 als die Lange, uber die die Bindungsvektoren r entlang der Kette
korreliert sind, beschrieben. Die Energie EB, die mit der Verbiegung einer Polymerket-
te der Konturlange lc, die durch die Raumkurve r(s) parametrisiert wird, assoziiert ist,
schreibt sich damit alsEB
kBT=
l02
∫ lc
0
ds
(d2r(s)
ds2
)2
. (9)
Das Konzept der Persistenzlange, die laut Definition eine Abschatzung uber den Krum-
mungsradius der Kette unter Berucksichtigung thermischer Fluktuationen gibt, findet
mehrheitlich Anwendung bei steifen und semiflexiblen Polymeren. Flexible Polymere wer-
den hingegen haufig mit der Kuhn-Lange aK und dem FJC-Modell beschrieben. Zwischen
den Parametern der beiden Modelle besteht der Zusammenhang l0 = aK/2, sofern die
Konturlange die Persistenzlange deutlich ubertrifft (lc � l0).
Lineare Polymerketten wie die synthetische Polyacrylsaure (PAA) oder einzelstrangige
DNA (ssDNA) sind in der Regel sehr flexibel. Doppelstrangige DNA (dsDNA) ist im
Vergleich dazu aufgrund der Doppelhelixstruktur deutlich versteift. Biopolymere, die in
der Zelle hohen mechanischen Belastungen standhalten mussen, sind deutlich steifer und
werden durch Polymerisation von Proteinen gebildet. Zwei Ketten aus Aktin formen zum
Beispiel durch helikale Anordnung ein Aktin-Filament (F-Aktin). Die rohrenformigen Mi-
krotubuli setzen sich aus parallel angeordneten Ketten von Tubulin-Dimeren, den Proto-
filamenten, zusammen.

2.2 Polyelektrolyte 7
Polymer l0 / nm aB/ nm ∅ / nm Ref.
PAA 0.32 0.25 - 21
ssDNA 1 0.57 - 22,23
dsDNA 50 0.34 2 24
F-Aktin 17·103 2.8 7 25
Mikrotubuli 5·106 8 22 26
Tabelle 1. Persistenzlangen l0 verschiedener (Bio)Polymere sowie Abstande a benachbarter
Monomere und Durchmesser ∅ etwaiger gebildeter ubergeordneter Strukturen.
2.2 Polyelektrolyte
Polyelektrolyte sind Polymere mit ionisierbaren Gruppen, die in polaren Losungsmit-
teln wie zum Beispiel Wasser in geladene Makroionen und kleine Gegenionen dissoziieren
konnen. Die sich daraus ergebende Aufladung des Molekuls und die Relevanz langreich-
weitiger Coulomb-Wechselwirkungen bei der statistischen Beschreibung tragen dazu bei,
dass das Verstandnis von Polyelektrolyten im Vergleich zu neutralen Polymeren noch als
schlecht eingestuft werden muss.27–31
Die Auswirkungen der durch den Dissoziationsprozess hervorgerufenen Ladungswechsel-
wirkungen hangen mit der betrachteten Langenskala zusammen. Die Ladungsneutralitat
bleibt auf großeren Langenskalen erhalten, da das geladene Molekul von einer Gegenla-
dungswolke, bestehend aus schwach durch Coulomb-Wechselwirkungen gebundenen Ge-
genionen, umgeben ist. Auf der molekularen Großenskala indessen wird das statistische
Verhalten maßgeblich durch Coulomb-Abstoßung innerhalb der Kette beeinflusst, so dass
Polyelektrolyte im Gegensatz zu neutralen Polymeren eine gestrecktere bzw. geschwolle-
nere Konformation einnehmen.
Polyelektrolyte werden bezuglich ihres Dissoziationsgrads untergliedert. In wassrigen Lo-
sungen ist das Dissoziationsgleichgewicht schwacher Polyelektrolyte (annealed polyelectro-
lytes) vom pH-Wert der Losung abhangig, das starker Polyelektrolyte (quenched polyelec-
trolytes) unabhangig. Molekule mit Carboxylgruppen (COOH ↔ COO−) oder Amino-
gruppen (NH2 ↔ NH+3 ) sind den schwachen Polyelektrolyten zugehorig, solche mit Sul-
fonsauregruppen (SO−3 ) oder quartaren Ammoniumgruppen (NH+
4 ) sind Beispiele starker
Polyelektrolyte.
Die geladenen Seitengruppen der Polyelektrolyte bewirken zudem wegen des Gewinns
an Bewegungsentropie der Gegenionen die Wasserloslichkeit der meisten Polyelektrolyte,
selbst wenn deren Polymerruckgrat von schlecht loslichen Kohlenstoffgruppen gebildet
wird. Im Fall schwacher Polyelektrolyte kann also die Losungsmittelqualitat durch Ande-
Ba gibt den Abstand benachbarter Monomere entlang der Struktur an. Bei der dsDNA wird einevollstandige Drehung der Doppelhelix nach 3.6 nm erreicht, wozu 10.5 Monomere benotigt werden. FurF-Aktin betragt die Wiederhollange etwa 36 nm bei 13 Monomeren, fur Mikrotubuli entspricht sie mit 8nm der Lange eines Tubulin-Dimers.

8 2. Polyelektrolyte in Losung
rung des Dissoziationsgrads, d.h. des pH-Werts der Losung, manipuliert werden.
2.2.1 Abgeschirmte elektrostatische Wechselwirkungen
Coulomb-Wechselwirkungen zwischen den Ladungen der Polyelektrolytkette sowie bei der
Adsorption mit den Oberflachenladungen sind maßgebend fur das physikalische Verhalten
des Polymers. In salzhaltigen wassrigen Losungen sind allerdings eine Vielzahl geladener
Ionen vorhanden, die ihrerseits mit den Polyelektrolytladungen wechselwirken konnen.
Daher darf der Einfluss der Ionen des Losungsmittels nicht vernachlassigt werden und
muss in die Beschreibung der Ladungswechselwirkungen einbezogen werden.
Das elektrostatische Potential φ einer Ladungsverteilung ρ ist allgemeingultig durch die
Poisson-Gleichung
∆φ(r) = −ρ(r)
ε0ε(10)
bestimmt, wobei ε0 die Dielektrizitatskonstante des Vakuums darstellt und ein homogen
dielektrisches Medium, d.h. ε(r) = ε = const. angenommen wurde.C
Um den Einfluß der Ionen des Losungsmittels auf eine Einheitsladung e (des Polymers)
zu untersuchen, sei als Ladungsverteilung eine Losung aus i Ionensorten der Valenz zi und
lokalen Konzentrationen ci(r) angenommen, also
ρ(r) = e · c(r) = e ·∑
i
zici(r). (11)
In einer mean-field Beschreibung, d.h. unter Vernachlassigung lokaler Fluktuationen, un-
terliegen die lokalen Konzentrationen einem Boltzmann-Verhalten,
ci(r) = ci · exp
(−zie · φ(r)
kBT
), (12)
wobei ci der Ionenkonzentration im Volumen entspricht und kBT die thermische Energie
bezeichnet. Damit kann die Poisson-Gleichung (10) durch Einsetzen unmittelbar in die
Poisson-Boltzmann-Gleichung
∆φ(r) = − e
ε0ε
∑i
zici · exp
(−zie · φ(r)
kBT
), (13)
uberfuhrt werden. Nunmehr werden Naherungen notwendig, da die Poisson-Boltzmann-
Gleichung nicht explizit losbar ist. Bei dem fur schwache Potentiale (ze · φ(r) � kBT )
gultigen Ansatz von Debye und Huckel33 wird die Poisson-Boltzmann-Gleichung lineari-
siert, d.h in Reihenentwicklung bis 1. Ordnung und unter Berucksichtigung der Ladungs-
neutralitat∑
i cizie = 0 zur Debye-Huckel-Gleichung
CFur Wasser betragt die Dielektrizitatskonstante ε ≈ 80. An Grenzflachen zeigt Wasser allerdings einezum Volumen veranderte Struktur,32 so dass direkt an der Grenzflache auch die dielektrischen Eigen-schaften verandert sein konnen.

2.2 Polyelektrolyte 9
∆φ(r) = κ2φ(r) (14)
mit der sogenannten Debye-Abschirmlange κ−1,
κ−1 =
√10−3ε0εkBT
NAe2∑
i z2i ci
=
√10−3
4πlBNA
∑i z
2i ci
≈ 0.43 ·
√1∑
i z2i ci
nm. (15)
Die Bjerrum-Lange lB definiert die Langenskala, auf der die Energie aufgrund der Coulomb-
Wechselwirkung zweier Ladungen der thermischen Energie gleicht,D
lB =e2
4πε0εkBT. (16)
Als Losung der Debye-Huckel-Gleichung (14) fur zwei Einheitsladungen unter der Annah-
me eines kugelsymmetrischen Potentials ergibt sich das Debye-Huckel-Potential VDH
VDH(r)
kBT=
lBr· e−κr, (17)
welches im Vergleich zum Coulomb-Potential zusatzlich exponentiell abfallt. Die Coulomb-
Wechselwirkungen werden also von den Ionen der Losung derart abgeschirmt, dass deren
Reichweite der Debye-Abschirmlange entspricht.E
2.2.2 Dissoziationsgrad
Der Dissoziationsgrad α eines geladenen Polymers, d.h. das Verhaltnis von dissoziierten
ionischen Gruppen zur Gesamtzahl ist bei schwachen Polyelektrolyten vom pH-Wert der
Losung abhangig und unterliegt zusatzlich wegen standiger Dissoziation und Rekombina-
tion zeitlichen und ortlichen Fluktuationen.34 In guten und Theta-Losungsmitteln kommt
es zudem zu einer Ladungsakkumulation an den Kettenenden, da dort nur eine reduzierte
Anzahl an Nachbarn mit den Ladungen wechselwirken kann.
Die Ladungen der Polyelektrolyte Polyacrylsaure und Polyglutaminsaure ruhren von der
Deprotonierung bzw. Protonierung der Carboxylgruppen der Seitenketten her,
COOH COO− + H+. (18)
Die Gleichgewichtskonstante der Reaktion Ka bestimmt sich aus den Konzentrationen c
der entsprechenden Stoffmengen gemaß des Massenwirkungsgesetzes,
Ka =c(H+) · c(COO−)
c(COOH), (19)
und wird experimentell haufig mit Saure-Base-Titrationen gemessen. Auf diese Weise
ermittelte Werte liegen fur Carboxylgruppen in Seitenketten35 bei pKa = -log Ka = 4.6
DDie Bjerrum-Lange betragt in Wasser etwa 0.7 nm.EDie Debye-Abschirmlange betragt unter physiologischen Bedingungen etwa 1 nm.

10 2. Polyelektrolyte in Losung
und fur Acrylsaure36 ungefahr bei pKa = 4.2. Aus dem Massenwirkungsgesetz ergibt sich
daruber hinaus unmittelbar
pH = pKa + log10
(α
1− α
)(20)
sowie fur den Dissoziationsgrad
α = 1/(1 + 10pKa−pH
). (21)
Das Dissoziationsverhalten einer schwachen Polyelektrolytkette wird indes mit einer an-
scheinenden Dissoziationskonstante Ka,app beschrieben, da repulsive elektrostatische Wech-
selwirkungen entlang der Kette der Dissoziation entgegenwirken. Insbesondere wird der
Prozess von der Starke der elektrostatischen Abschirmung beeinflusst, also von der Salz-
konzentration der Losung. Fur Polyacrylsaure andert sich beispielsweise pKa,app zwischen
6.8 (ohne Salz) und 4.7 (bei 1 M NaCl).37 Zu bemerken ist außerdem, dass der Dissozia-
tionsgrad vom lokalen elektrostatischen Potential abhangig ist, so dass dies besonders bei
der Adsorption von Polyelektrolyten an stark geladenen Unterlagen, an denen sich das
lokale elektrostatische Potential deutlich von dem im Volumen unterscheiden kann, aus-
wirkt. Thermodynamisch bedarf es zum Entfernen eines weiteren Protons bei gegebenem
Dissoziationsgrad zusatzlicher elektrostatischer Freier Energie ∆Gel,
pKa,app = pKa +∆Gel
2.303kBT. (22)
Ein mean-field Ansatz, bei dem die Debye-Huckel-Theorie fur Ladungswechselwirkungen
angewandt wurde,2 fuhrt zu der Beziehung
2.303(pH − pKa) + lBκ = ln
(α
1− α
)+4 · α (23)
fur ein gerades, d.h. steifes oder stark adsorbiertes Polymer der Monomerlange a. Die
Ladungsabstoßung benachbarter Monomere geht durch 4 = −2lB/a · ln (1− e−κa) ein.
Im Bereich hoher Salzkonzentrationen (κd � 1 bzw. 4= 0) ergibt sich ein Dissoziations-
verhalten analog zu (20), ansonsten ist die Dissoziation merklich abgeschwacht.

11
3 Polyelektrolyte an Fest-Flussig-Grenzflachen
Die Adsorptionseigenschaften von Polymeren auf festen Substraten werden von den Ober-
flacheneigenschaften, internen Freiheitgraden des Molekuls sowie etwaigen Ladungswech-
selwirkungen bestimmt.38–41 Fur ein Polymer in Losung ist die Adsorption an einer Ober-
flache immer dann bevorzugt, wenn die Wechselwirkungsenergie der Monomere mit der
Oberflache diejenigen mit dem Losungsmittel plus eventueller Entropieverluste aufgrund
eingeschrankter Konformationsfreiheitsgrade ubertrifft.
Deutlich komplexer als bei neutralen Polymeren sind die Mechanismen bei der Adsorption
von Polyelektrolyten an geladenen Oberflachen, da hierbei der Dissoziationsgrad der ioni-
schen Gruppen, die Losungsmittelqualitat, die Dielektrizitatskonstanten von Losung und
Substrat sowie die Salzkonzentration der Losung fur die ladungsabhangigen Polyelektrolyt-
Substrat-Wechselwirkungen eine Rolle spielen.
3.1 Polyelektrolyt-Substrat-Wechselwirkungen
Die der Adsorption von Polyelektrolytketten an geladenen hydrophilen Oberflachen zu-
grundeliegenden Wechselwirkungen konnen in einen ladungsabhangigen, von abgeschirm-
ten Coulomb-Wechselwirkungen bestimmten und einen ladungsunabhangigen Anteil, der
von van-der-Waals-Wechselwirkungen dominiert wird, unterteilt werden.
3.1.1 Van-der-Waals-Wechselwirkungen
Van-der-Waals-Krafte gehen aus sehr kurzreichweitigen Dipolwechselwirkungen hervor,
die auf der Skala bis zu einigen Nanometern umgekehrt proportional zur sechsten Potenz
des Abstands r zwischen den Atomen bzw. Molekulen sind,
FvdW ∼ 1/r6. (24)
Drei Beitrage konnen dabei unterschieden werden, namlich erstens die Orientierung- bzw.
Keesom-Kraft zwischen zwei permanenten Dipolen, zweitens die Induktions- bzw. Debye-
Kraft zwischen einem permanenten und einem induzierten Dipol und drittens die Dispers-
ions- bzw. London-Kraft zwischen zwei induzierten Dipolen. Die universell vorhandene Di-
spersionskraft ist der dabei dominierende Beitrag; deren Starke ist in Flussigkeit allerdings
deutlich herabgesetzt und kann sowohl attraktiv als auch repulsiv sein. Bei detaillierterer
Betrachtung sind insbesondere in Flussigkeiten Retardierungseffekte der Dispersionskraft
bei großeren Separierungen zu beachten, die in dem Bereich eine Abstandsabhangigkeit
von r−7 verursachen.
Die Starke der van-der-Waals-Kraft ist proportional zu einer materialspezifischen Kon-
stante, der Hamaker-Konstante, deren Wert fur Gold (25·10−20 J)42 den fur Siliciumnitrid
(5·10−20 J)43 in Wasser um das funffache ubertrifft.

12 3. Polyelektrolyte an Fest-Flussig-Grenzflachen
3.1.2 Coulomb-Wechselwirkungen
Zur Betrachtung der Ladungswechselwirkungen sei angenommen, dass eine Polyelektro-
lytkette der Linienladungsdichte τ in Interaktion mit einer planaren geladenen Oberflache
der Oberflachenladungsdichte σ tritt.F Das elektrostatische Potential der Oberflache in
einer Elektrolytlosung V elS ist in Debye-Huckel-Naherung gegeben als
V elS (z)
kBT= 4πlBσκ−1e−κz (25)
fur σ < (4πlBκ−1)−1.44,45 Die mittlere elektrostatische Adsorptionskraft kann experimen-
tell bestimmt werden, indem das sukzessive Herunterziehen der Kette von der Oberflache
betrachtet wird. Sofern dabei weder stabile kovalente Bindungen zerrissen werden noch
andere stark bindende Wechselwirkungen gelost werden mussen, wird lediglich eine Reihe
von Ladungen gegen das exponentielle Potential bewegt. Die elektrostatische Adsorptions-
bzw. Desorptionskraft berechnet sich folglich durch Integrieren der konservativen elektro-
statischen Kraft Fel(z) = dVel/dz uber die gesamte Kette,
Fel = ∓∫ ∞
0
τ · F elS (z) dz = ±(4πlBkBT ) · σ · τ · κ−1 (26)
wobei dieser Ausdruck auf den Fall beschrankt ist, dass das Polymer in einer Dicke kleiner
als die Debye-Abschirmlange adsorbiert ist.4 In Gleichung (26) fur die mittlere elektro-
statische Adsorptionskraft werden keine Effekte, die von Losungsmittelqualitat oder La-
dungsregulierung herruhren, berucksichtigt. Ebenso werden nichtlineare Effekte aufgrund
von Gegenionenkondensation auf dem Polyelektrolyten (Manning-Theorie) oder auf dem
Substrat (Gouy-Chapman-Theorie) vernachlassigt.
Bei Polyelektrolyten ist das Dissoziationsgleichgewicht, verursacht von der elektrostati-
schen Abstoßung benachbarter Monomere, von einer ganzen Reihe von Parametern abhan-
gig (siehe 2.2.2 ) und andert sich insbesondere bei der Adsorption.46,47 An dielektrischen
Grenzen sind solche Ladungsregulierungsmechanismen mitunter noch ausgepragter, da die
Ladungen des Polymers zusatzlich mit ihren Spiegelladungen sowie den Spiegelladungen
benachbarter Monomere wechselwirken.
Sofern die Dielektrizitatskonstante des adsorbierenden Substrats großer als die der Losung
ist, haben Spiegelladung und Testladung entgegengesetzte Valenzen. Mit anderen Worten
erhoht/erniedrigt eine Oberflache großer/kleiner Dielektrizitatskonstanten den Dissozia-
tionsgrad der adsorbierten Kette. Bei der Adsorption auf Metallen (ε →∞) werden sogar
schwach geladene Polyelektrolyte vollstandig dissoziiert, so dass die daraus hervorgehende
elektrostatische Anziehung besonders ausgepragt ist.
FDie Linienladungsdichte oder lineare Ladungsdichte einer Polyelektrolytkette bezeichnet das Inversedes Abstands zweier Ladungen entlang der Kette. Ein negatives Vorzeichen fur τ bedeutet, dass dieLadung des Polymers ein entgegengesetztes Vorzeichen zu dem der Oberflache besitzt, die Coulomb-Wechselwirkung also attraktiv ist.
3.2 Adsorption an der Fest-Flussig-Grenzflache 13
Material/Medium ε Ref.
Metall ∞Wasser 80 48
Calcit 9.1 49
Siliciumnitrid 7.5 50
Vakuum 1
Tabelle 2. Dielektrizitatskonstanten verschiedener Materialien/Medien.
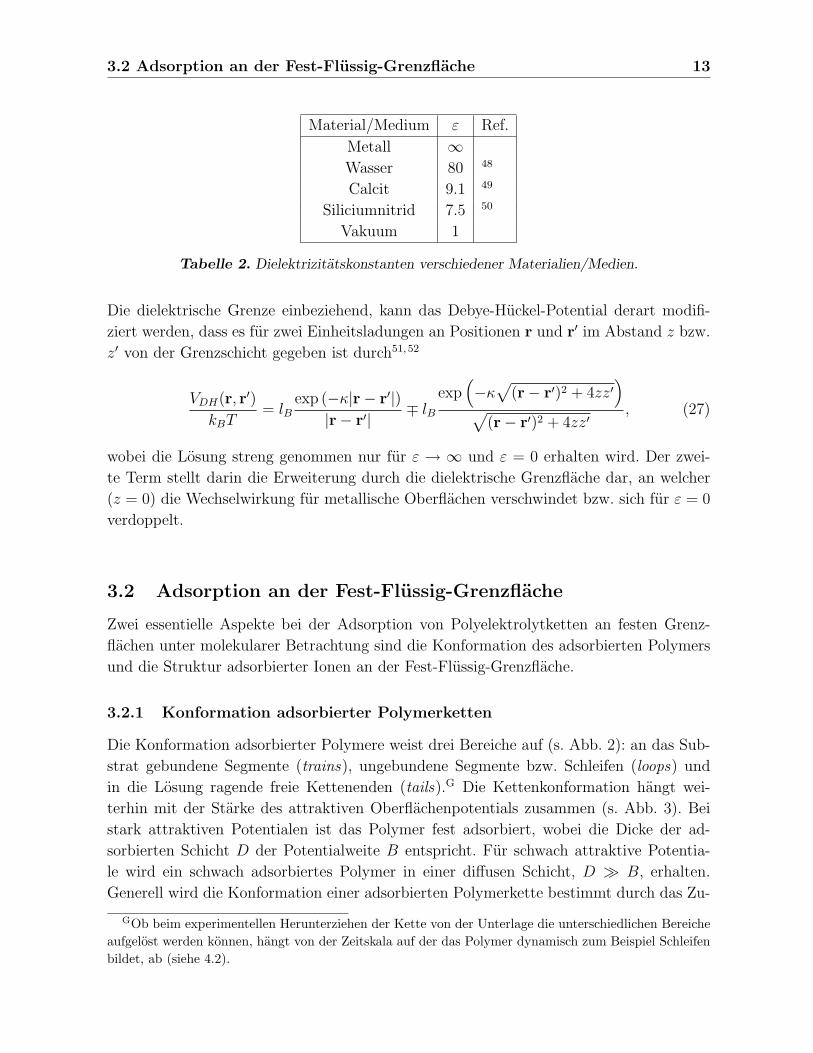
Die dielektrische Grenze einbeziehend, kann das Debye-Huckel-Potential derart modifi-
ziert werden, dass es fur zwei Einheitsladungen an Positionen r und r′ im Abstand z bzw.
z′ von der Grenzschicht gegeben ist durch51,52
VDH(r, r′)
kBT= lB
exp (−κ|r− r′|)|r− r′|
∓ lBexp
(−κ
√(r− r′)2 + 4zz′
)√
(r− r′)2 + 4zz′, (27)
wobei die Losung streng genommen nur fur ε → ∞ und ε = 0 erhalten wird. Der zwei-
te Term stellt darin die Erweiterung durch die dielektrische Grenzflache dar, an welcher
(z = 0) die Wechselwirkung fur metallische Oberflachen verschwindet bzw. sich fur ε = 0
verdoppelt.
3.2 Adsorption an der Fest-Flussig-Grenzflache
Zwei essentielle Aspekte bei der Adsorption von Polyelektrolytketten an festen Grenz-
flachen unter molekularer Betrachtung sind die Konformation des adsorbierten Polymers
und die Struktur adsorbierter Ionen an der Fest-Flussig-Grenzflache.
3.2.1 Konformation adsorbierter Polymerketten
Die Konformation adsorbierter Polymere weist drei Bereiche auf (s. Abb. 2): an das Sub-
strat gebundene Segmente (trains), ungebundene Segmente bzw. Schleifen (loops) und
in die Losung ragende freie Kettenenden (tails).G Die Kettenkonformation hangt wei-
terhin mit der Starke des attraktiven Oberflachenpotentials zusammen (s. Abb. 3). Bei
stark attraktiven Potentialen ist das Polymer fest adsorbiert, wobei die Dicke der ad-
sorbierten Schicht D der Potentialweite B entspricht. Fur schwach attraktive Potentia-
le wird ein schwach adsorbiertes Polymer in einer diffusen Schicht, D � B, erhalten.
Generell wird die Konformation einer adsorbierten Polymerkette bestimmt durch das Zu-
GOb beim experimentellen Herunterziehen der Kette von der Unterlage die unterschiedlichen Bereicheaufgelost werden konnen, hangt von der Zeitskala auf der das Polymer dynamisch zum Beispiel Schleifenbildet, ab (siehe 4.2).

14 3. Polyelektrolyte an Fest-Flussig-Grenzflachen
Abbildung 2. Schematische Darstellung der Konformation einer adsorbierten Polymerkette,
die adsorbierte Bereiche, Schleifen bzw. ungebundene Bereiche und ein freies Kettenende zeigt.
Abbildung 3. Darstellung der Konformation einer adsorbierten Polymerkette in Abhangigkeit
von der Starke des attraktiven Oberflachenpotentials, reprasentiert durch die Potentialbreite B.
Bei stark attraktiven Potentialen entspricht die Dicke der adsorbierten Schicht D der Potenti-
albreite, bei schwachen Potentialen ergibt sich eine eher diffuse Schicht. Abbildung in Analogie
zu 40.
sammenspiel von Enthalpie- und Entropietermen. Bei Polyelektrolyten tritt zusatzlich
eine subtile Balance zwischen elektrostatischer Abstoßung geladener Monomere (Ketten-
versteifung) und elektrostatischer Wechselwirkung zwischen Substrat und Molekul hin-
zu. Adsorbiert beispielsweise bei niedrigen Salzkonzentrationen eine Polyelektrolytkette
auf einer entgegengesetzt geladenen Unterlage, so dominieren vermutlich die Ladungs-
wechselwirkungen. Eine hohe Ladungsdichte des Molekuls fuhrt zusatzlich aufgrund der
Monomer-Monomer-Abstoßung zur Aufweitung des Polymerknauels und zur Anordnung
in einer dunnen Schicht.
Polyelektrolytketten konnen demnach, abhangig von den experimentellen Bedingungen,
sowohl perfekt flach auf dem Substrat liegen als auch Schleifen und Zuge bilden. Im zwei-
ten Fall sind die meisten Ladungen zwar in einem bestimmten Abstand zur Oberflache
lokalisiert, dafur tritt dem ein Gewinn an Entropie als Ausgleich entgegen.
3.2.2 Struktur und Ladung der Fest-Flussig-Grenzflache
Jede Oberflache hoher Dielektrizitatskonstante ist in Wasser geladen. Die Ladung kann
zum Beispiel durch Dissoziation von Oberflachengruppen oder Adsorption von Ionen aus
der Losung entstehen. Unabhangig vom Ladungsmechanismus wird die Oberflachenladung
von geladenen Gegenionen kompensiert, die partiell an der Oberflache in der sogenann-
ten Stern-Schicht fest gebunden und ansonsten nahe der Oberflache in der elektrischen
Doppelschicht angeordnet sind. Das am besten beschriebene System einer geladenen Fest-
Flussig-Grenze ist wegen der elektrochemischen Relevanz der Kontakt zwischen Metall
und Elektrolyt (s. Abb. 4).53
Das erste und namensgebende Modell zur Beschreibung der Metall-Elektrolyt-Grenzflache
ist das der Helmholtz-Doppelschicht. Darin werden die Uberschussladungen auf der Me-

3.2 Adsorption an der Fest-Flussig-Grenzflache 15
tallseite durch eine gleiche Anzahl Ladungen auf der Losungsseite kompensiert, die sich
ganzlich in einer Ebene befinden. Diese Doppelschicht, das Metall und die Ebene der Ionen,
wird haufig mittels eines Kondensatormodells beschrieben. Gouy und Chapman hingegen
vertraten die Ansicht, dass die Ladungswechselwirkung mit dem Metall uber diese eine
Lage von Ionen hinaus reicht und dass mit zunehmendem Abstand von der Elektrode
ein abnehmender Uberschuss an Ladungen erwartet wird. Aufgrund der Warmebewegung
sollte diese Lage von Ionen diffus sein. Dieses Bild ist vollig analog zur Gegenladungswolke
um eine Punktladung im Debye-Huckel-Modell. Stern verband schließlich die beiden An-
sichten dahingehend, dass neben einer Schicht von Uberschussladungen in der Helmholtz-
Schicht einige der Ladungen sich weiter in die Losung hinein erstrecken. Außerdem wird
angenommen, dass die der Elektrode nachsten Ionen in zwei Schichten adsorbiert sind,
wobei die innere Schicht aus wenig solvatisierten und eventuell chemisch gebundenen Io-
nen in Kontakt mit der Oberflache besteht. Spater postulierten Bockris und Potter, dass
die dipolaren Eigenschaften von Wasser fur eine orientierte Schicht Wasser auf der Elek-
trode sorgen, d.h. die innere Schicht im Stern-Modell vorwiegend aus Wasser besteht.
Abbildung 4. Struktur der Metall-Elektrolyt-Grenzflache (in Analogie zu 53). Direkt an der
Grenzflache befindet sich eine Lage orientierter Wassermolekule mit vereinzelt spezifisch adsor-
bierten Anionen (innere Helmholtz-Ebene, IHP). Daran schließt sich eine zweite Lage Wasser-
molekule an, die teilweise zur Solvathulle von adsorbierten Kationen gehoren. Die Ebene der
adsorbierten Kationen bezeichnet die außere Helmholtz-Ebene (OHP). Das Oberflachenpoten-
tial wird mit Hilfe von ζ-Potential-Messungen außerhalb dieser beiden adsorbierten Schichten
bestimmt.
Das Oberflachenpotential bzw. die Oberflachenladungsdichte wird haufig mit elektrokine-
tischen Messungen bestimmt.54 Bewegt sich die auf großen Abstanden elektrisch neutrale
Oberflache durch ein Medium,H so verbleibt ein Teil der diffusiv gebundenen Gegenionen
nicht in der Nahe der Oberflache, sondern wird aufgrund von Reibung abgeschert und
die Oberflache erscheint geladen. Das an dieser Schergrenze vorhandene Potential wird
als Zeta-Potential bezeichnet und kann detektiert werden, sofern die Bewegung in einem
elektrischen Feld ablauft. Unter Kenntnis der experimentellen Bedingungen wie Visko-
sitat, Leitfahigkeit und Dielektrizitatskonstante der Losung sowie Druck zur Erzeugung
HDie Bewegung der Oberflache wird experimentell durch Verwendung kleiner Partikel umgesetzt.

16 3. Polyelektrolyte an Fest-Flussig-Grenzflachen
des Flusses kann daraus uber das angelegte elektrische Potential auf das Oberflachenpo-
tential geschlossen werden.
Wird die Oberflachenladung von dissoziierbaren Oberflachengruppen hervorgerufen, muss
auch hier Ladungsregulierung berucksichtigt werden. Die prinzipiellen Mechanismen bei
Betrachtung einer zweidimensionalen Oberflache sind die gleichen wie bei einem linearen
Molekul (s. 2.2.2),
2.303(pH − pKa) + lBκ = ln
(α
1− α
)+4 · α. (28)
Lediglich in den Ladungsregulierungsparameter 4 mussen die Ladungswechselwirkun-
gen mit allen Nachbarn im Abstand a in einer zweidimensionalen Anordnung eingehen,2
4 = 2πlB/a · (eκa − 1)−1. Es kann festgehalten werden, dass der Dissoziationsgrad ei-
ner zweidimensionalen Flache bei zunehmender Debye-Abschirmlange schneller erniedrigt
wird als der einer eindimensionalen Polyelektrolytkette.
Besondere Bedeutung fur Experimente mit dem Rasterkraftmikroskop erlangen oxidahn-
liche Materialien wie Si-OH, da die Sonde des Rasterkraftmikroskops haufig aus Silicium
oder Siliciumnitrid hergestellt wird. Die Ladung solcher Oberflachen kann wegen deren
amphoteren Eigenschaften sowohl negativ als auch positiv sein,
Si-OH Si-O− + H+ (29)
H+ + Si-OH Si-OH+2 (30)
Der Nullladungspunkt (point of zero charge, PZC) solcher Materialien ist daher unter
Berucksichtigung der Gleichgewichtskonstanten aller moglichen Reaktionen gegeben. Ex-
perimentell bestimmte Werte des PZC liegen fur Si3N4 bei pH=6.5 und SiO2 bei pH=2.55
Die Oberflachenladung ist positiv/negativ wenn der pH-Wert der Losung kleiner/großer
als der Nulladungspunkt ist.

17
4 AFM-basierte Desorption oberflachenadsorbierter
Polyelektrolyte
Kraftspektroskopie an einzelnen Molekulen mit Hilfe eines (Raster-)Kraftmikroskops (ato-
mic force microscope, AFM) ist eine experimentelle Methode, um Konformationen und
Wechselwirkungen von Makromolekulen in Losung zu untersuchen. Sie erlaubt insbeson-
dere einzelne Polymere gezielt auf einer Oberflache adsorbieren zu lassen, um sie anschlie-
ßend von dieser sukzessive wieder herunterzuziehen. Die dabei wirkende Adsorptionskraft
kann hochprazise quantifiziert werden, so dass selbst marginale Unterschiede im Adsorp-
tionsverhalten, die beispielsweise als Reaktion auf externe Manipulationen auftreten, auf-
gelost werden konnen.
4.1 AFM-basierte Einzelmolekulkraftspektroskopie
4.1.1 Funktionsweise eines Rasterkraftmikroskops
Das erste Rasterkraftmikroskop wurde 1986 mit der Zielsetzung Oberflachen mit hoher
ortlicher Auflosung abzubilden, vorgestellt.56 Als Kraftsensor dient eine scharfe Spitze am
Ende einer weichen Blattfeder (cantilever), deren wechselwirkungsabhangige Verbiegung
meist optisch detektiert wird (s. Abb. 5). Zum Abbilden der Oberflache wird schließlich
die Position der AFM-Spitze bezuglich des Substrats lateral mittels piezoelektrischer Kri-
stalle verandert. Die Spitze rastert also die Unterlage, wobei lokale oberflachenspezifische
Anderungen uber die Verbiegung der Blattfeder aufgelost werden. Verschiedene Abbil-
dungsmodi wurden entwickelt, so dass neben festen Substraten auch weiche Objekte, zum
Beispiel Zellen, untersucht werden konnen.I
Das AFM bietet aber nicht nur die Moglichkeit des hochauflosenden Abbildens, son-
dern entwickelte sich zunehmend zur kraftspektroskopischen Technik, mit der inter- und
intramolekulare Wechselwirkungen von oberflachenimmobilisierten Systemen untersucht
werden konnen.4,57,58 Solche Kraftexperimente werden im Gegensatz zum Abbilden von
Objekten und Oberflachen, das oft unter Umgebungsbedingungen stattfindet, normaler-
weise in wassrigen Medien durchgefuhrt. Zum einen entfalten biologische Molekule ihre
naturliche Funktion in wassriger Umgebung und zum anderen ubersteigen die bei Mes-
sungen in Luft bedeutenden Kapillarkrafte, verursacht von einer dunnen Schicht Wasser
auf der Oberflache, oft die zu untersuchenden Krafte.
Bei Kraftmessungen mit dem AFM wird die Spitze an das Substrat angenahert und an-
IDie zwei grundlegendsten Modi sind die konstanter Kraft und konstanter Hohe. Bei ersterem wirddie Wechselwirkungskraft zwischen Spitze und Oberflache konstant gehalten und der Abstand zwischenihnen entsprechend angepasst, bei letzterem bleibt der Abstand zwischen Spitze und Oberflache erhaltenund die Verbiegung der Blattfeder wird aufgezeichnet. Bei weichen Proben wird hingegen oft der tapping-Modus verwendet, bei dem die Blattfeder oberhalb der Probe oszilliert und diese jeweils nur kurz beruhrt,so dass dauerhafte Krafteinwirkungen vermieden werden.

18 4. AFM-basierte Desorption oberflachenadsorbierter Polyelektrolyte
Abbildung 5. Funktionsweise eines Kraftmikroskops und experimentelle Umsetzung in einem
selbstgebauten Instrument. Ein fokussierter Lichtstrahl einer Laserdiode wird von der reflek-
tierenden Beschichtung der Blattfeder zuruckgestrahlt und mit einer segmentierten Photodiode
detektiert. Anderungen in der Wechselwirkung zwischen Spitze und Substrat fuhren zur Verbie-
gung der Blattfeder und konnen so aufgelost werden. Bei der Kraftspektroskopie interessieren
vorwiegend Molekulwechselwirkungen, so dass zwischen Spitze und Substrat haufig Molekule
”eingespannt“ werden. Auch wird das Substrat mittels piezoelektrischem Stellglied (
”Piezo“ )
in der Regel lediglich vertikal und nicht wie beim Rastern erforderlich auch lateral bewegt. Die
Blattfeder ist in der Darstellung am starksten vergroßert dargestellt, angedeutet durch die ab-
gerundete Spitze, die an ihrem Ende typischerweise einen Krummungsradius von weniger als 40
nm bei einer Lange von etwa 3 µm aufweist. Die Spitze ist also makroskopisch gesehen sehr
spitz, auf der molekularen Ebene aber durchaus flach.
schließend wieder entfernt. Die wechselwirkungsabhangige Auslenkung der BlattfederJ
sowie die Ausdehnung des Piezostellglieds werden dabei aufgezeichnet und anschließend
mit Hilfe des Hookschen Gesetzes in eine Kraft-Abstands-Kurve umgerechnet. Die verwen-
deten Kraftmikroskope sind in der Regel fur kraftspektroskopische Fragestellungen opti-
miert worden. Die dabei erreichte Kraftauflosung liegt im Großenordnungsbereich von 10
pN fur kommerziell erhaltliche Blattfedern, ist aber prinzipiell nur durch das thermische
Rauschen bei Raumtemperatur limitiert.59
4.1.2 Einzelmolekulkraftspektroskopie
Mechanische Experimente mit einzelnen Molekulen wurden moglich, als neben der erfor-
derlichen Ortsauflosung im (Sub-)Nanometerbereich auch eine Kraftauflosung von Pico-
newton bis Femtonewton erreicht werden konnte. Methodisch gelang dies außer mit dem
AFM unter anderem mit magnetischen Kugelchen,60 der optischen Pinzette,61,62 Glasmi-
kronadeln63 oder der Biomembrane force probe.64 Das mit den zur Verfugung stehenden
JDie Auslenkung der Blattfeder ist abhangig von deren Federkonstanten. Typische Werte kommerziellerhaltlicher Blattfedern fur Kraftmessungen liegen bei 10-100 pN/nm.

4.2 Desorptionsmessungen 19
Techniken zugangliche Kraftfenster reicht von entropischen Kraften (fN-Bereich) bis zu
kovalenten Bindungen (nN-Bereich) und erlaubt somit sowohl strukturelle als auch funk-
tionelle Untersuchungen von Biomolekulen in ihrer naturlichen Umgebung.65
Die ersten dahingehenden Experimente wurden an Rezeptor-Ligand-Systemen bei kon-
stanter Zuggeschwindigkeit und Federkonstanten durchgefuhrt.66,67 Die damit gewonne-
nen Ergebnisse reprasentieren jedoch nur einen einzelnen Punkt im Kraftspektrum, da sie
die Kraftladungsrate, d.h. die Tatsache, dass jede nicht-kovalente Bindung bei beliebiger
Zugkraft nach hinreichend langer Zeit zerreißt, vernachlassigten.68–70 Nur die dynami-
sche Kraftspektroskopie, bei der die Kraftladungsrate F variiert wird, kann daher die
Energielandschaft von Rezeptor-Ligand-Systemen bestimmen und Einblicke in Bindungs-
potentiale liefern.71–73
Auf der Einzelmolekulebene konnen inter- und intramolekulare Krafte mit hoher Prazision
gemessen und auf diese Weise Konformationen und Bindungsstarken von Molekulen be-
stimmt werden.74,75 Diese mechanische Manipulation vieler Biopolymere fuhrte zu detail-
lierten Einsichten in die Mechanik von Proteinen,75,76 DNA77,78 oder Polysacchariden.79
Einen Schritt weitergehend konnte durch die gezielte Kombination von mechanischer und
optischer Manipulation eines Polyazopeptidmolekuls ein synthetischer molekularer Motor
realisiert werden.80
Ein deutlich jungeres Gebiet ist die Anwendung kraftspektroskopischer Messungen an Sy-
stemen synthetischer Polymere. Das experimentelle Untersuchen der Desorption einzelner
Polymere von festen Substraten kann helfen, die grundlegenden Prozesse der Adsorption
und damit die molekularen Wechselwirkungen zwischen Polymeren und Oberflachen zu
verstehen. Besonderes Interesse kommt dabei externen Stimuli (Anderung von pH-Wert,
Salzkonzentration, etc.) zu, um erstens nachzuvollziehen, wie sich diese in den Adsorpti-
onseigenschaften der Polyelektrolyte niederschlagen und zweitens die molekularen Wech-
selwirkungen gezielt extern steuern zu konnen.
4.2 Desorptionsmessungen
Desorptionsmessungen erlauben die hochprazise Quantifizierung der Wechselwirkungs-
kraft zwischen einem einzelnen Polymer und einem festen Substrat, indem das an der
AFM-Spitze kovalent gebundene Polymer kontinuierlich von der Oberflache herunterge-
zogen wird. Das Desorbieren eines (schwach) adsorbierten Polymers von der Unterlage
entspricht dabei wegen des sukzessiven Ablosens der Kette dem Losbinden mehrerer Bin-
dungen in Serie.
Die Gestalt der resultierenden Kraft-Abstands-Kurve ist stark abhangig von der Dyna-
mik des Polymers auf der Oberflache. Im Extremfall langsamer interner Dynamik bleibt
eine eventuell vorhandene Schleifen-Konformation der Kette (siehe 3.2.1) auf der Zeits-
kala eines Experiments erhalten. Ein Polymersegment ist dann zwischen dem kovalenten

20 4. AFM-basierte Desorption oberflachenadsorbierter Polyelektrolyte
Ankerpunkt an der AFM-Spitze und einem Oberflachenkontakt fest eingespannt.K Beim
Vergroßern des Abstands zwischen Spitze und Unterlage wird dieses Polymersegment ge-
streckt, die Kraft steigt bis der entsprechende Oberflachenkontakt losbindet, ein neues
Polymersegment damit zuganglich ist, der Streckungsgrad des nun langeren Segments
abnimmt und die Kraft daraufhin instantan abfallt bevor sie aufgrund der Streckung
des nun langeren zuganglichen Polymersegments wieder ansteigt, usw.. Auf diese Wei-
se konnte eine Analyse der Schleifengroßen durchgefuhrt werden, die das erwartete de
Gennes-Skalengesetz bestatigte.81 Im Grenzfall einer perfekt ausgestreckten Polymerket-
te kann in diesem Bild jedes Monomer als Oberflachenkontakt angesehen werden. Solche
”Sagezahnmuster“ in den Kraft-Abstands-Kurven werden außerdem beim Entfalten von
Proteindomanen sowie den meisten Rezeptor-Ligand-Systemen beobachtet. Im anderen
Extremum sehr schneller Bindungsdynamik werden keine Polymersegmente gestreckt, da
jeder Oberflachenkontakt so schnell offnet und schließt, dass das Polymersegment schlicht
von der Oberflache abgelost werden kann. Gleichzeitig stellt die große Anzahl an Kontakt-
punkten sicher, dass ein simultanes Losbinden aller Bindungen, d.h. vollstandiges Ablosen
der Polymerkette, sehr unwahrscheinlich bleibt. Dieser kontinuierliche quasi unter Gleich-
gewichtsbedingungen stattfindende Losbindungsprozess zeigt sich als flaches Plateau kon-
stanter Kraft in den Kraft-Abstands-Kurven.
Im Experiment kann das beobachtete Verhalten also mitunter von der Geschwindigkeit v,
mit der AFM-Spitze und Unterlage separiert werden, abhangen.L Die Tatsache, dass beim
Desorbieren von Polyelektrolyten von festen Oberflachen sehr haufig flache Plateaus in
den Kraft-Abstands-Kurven beobachtet werden, hangt wohl auch damit zusammen, dass
sowohl Polyelektrolytkette als auch Oberflache oft vollstandig hydratisiert sind und das
Molekul damit eine entsprechend hohe Mobilitat auf der Oberflache besitzt.
In einem typischen Desorptionsexperiment (s. Abb. 6) werden einige Polymerketten ko-
valent an der AFM-Spitze verankert. Wird die Spitze in Kontakt mit der”attraktiven“
Oberflache gebracht, so adsorbieren die Polymerketten vollstandig darauf. Beim Separie-
ren von AFM-Spitze und Substrat zeigt sich zunachst bei kleinen Distanzen eine unspezi-
fische Kraftspitze in der Kraft-Abstands-Kurve, bevor das fur die entsprechende Polymer-
Substrat-Wechselwirkung spezifische Desorptionsplateau beobachtet wird. Die vollstandi-
ge Desorption einer Polymerkette kann durch das sprunghafte Abfallen der Desorptions-
kraft, d.h. als Stufe in der Kraft-Abstands-Kurve, identifiziert werden.
Die mittlere Desorptionskraft einer Polymerkette mit der Unterlage unter den gegebenen
experimentellen Bedingungen wird durch statistische Analyse einer hinreichend großen
Anzahl an Kraftplateaus ermittelt (s. Abb. 7). Zeigt die Kraft-Abstands-Kurve mehrere
Plateaus, d.h. wurden mehrere Ketten desorbiert, kann die mittlere Desorptionskraft mit
KDie Starke der Einspannung ist bestimmt durch den schwacheren Kontakt, in diesem Fall den Ober-flachenkontakt, da dieser nicht kovalenter Natur ist.
LTypische Zuggeschwindigkeiten liegen bei v ≤ 1 µm/s. Bei deutlich hoheren Geschwindigkeiten wirkenzunehmend hydrodynamische Krafte auf die Blattfeder ein.

4.2 Desorptionsmessungen 21
Abbildung 6. Prinzip eines typischen Desorptionsexperiments. Die an der AFM-Spitze kovalent
gebundenen Polymere adsorbieren beim Kontakt der AFM-Spitze mit der Unterlage auf dieser.
Beim Zuruckfahren der AFM-Spitze wird das Polymer dann in einem Gleichgewichtsprozess
von der Oberflache desorbiert, was sich in der zugehorigen Kraft-Abstands-Kurve als Plateau
konstanter Kraft darstellt. Da die vollstandige Desorption einer Polymerkette sich als sprung-
haften Abfall der Kraft darstellt, entspricht die Anzahl der Plateaus der Anzahl desorbierter
Polymermolekule.
hoher Prazision nur von dem letzten Plateau jeder Kurve ermittelt werden, da hier nur
noch eine einzelne Kette auf der Oberflache verblieben ist und die Desorptionskraft nicht
durch intermolekulare Wechselwirkungen zwischen den Polymerketten verandert werden
kann.
Die ersten Desorptionsmessungen mit einzelnen Polymeren wurden mit Polyelektrolyten
auf Quarz durchgefuhrt.5,82 Es konnte gezeigt werden, dass die gemessene Plateaukraft
sich aus einem ladungsunabhangigen und einem Coulomb-Beitrag zusammensetzt, wo-
bei letzterer in Ubereinstimmung mit der Debye-Huckel-Theorie proportional zur Debye-
Abschirmlange und zur Linienladungsdichte des Polymers ist.5,6 Zum besseren Verstand-
nis des ladungsunabhangigen Beitrags wurde unter anderem die Desorption von Polyelek-
trolyten auf selbstorganisierenden Monolagen unterschiedlich hydrophober Kopfgruppen
untersucht.7 Generell zeigte sich, dass nichtelektrostatische Beitrage selbst bei hochgela-
denen Oberflachen eine bedeutende Rolle spielen und dass bei der theoretischen Beschrei-
bung die oberflacheninduzierte Ladungsregulierung des Polyelektrolytmolekuls einbezogen

22 4. AFM-basierte Desorption oberflachenadsorbierter Polyelektrolyte
Abbildung 7. Darstellung einer Meßreihe bestehend aus 1000 Kraft-Abstands-Kurven. In den
Experimenten wurde die Desorption von Polyglutaminsaure von einem Calcitkristall untersucht
(Details siehe Abschnitt 7). Bemerkenswert ist, dass bei jedem Experiment dasselbe Polymer be-
obachtet wurde (d ≈ 270 nm), zeitweilig zudem noch ein Zweites (Kurvennummern etwa 500 und
950). Die Konstanz der Kraftplateaus erlaubt eine prazise Auswertung der Desoprtionskrafte,
das zugehorige Kraftehistogramm ist im Einsatz dargestellt.
werden muss.8
Zusammenfassend lasst sich sagen, dass mit dieser Methode die Desorptionskraft ei-
ner Polyelektrolytkette auf einem festen Substrat sehr prazise und reproduzierbar in
Abhangigkeit von den experimentellen Bedingungen wie pH-Wert oder Salzkonzentration
der wassrigen Losung bestimmt werden kann. Das Verstandnis ist aber unter anderem
aufgrund der komplexen Ladungsregulierungsmechanismen von Polyelektrolyten an gela-
denen Unterlagen noch unvollstandig.
23
5 Desorptionsmessungen an gepfropften
Polyacrylsaure-Monolagen
Gepfropfte (grafted) Polyelektrolyte sind mit einem Kettenende an einem Substrat ko-
valent oberflachenverankert. Solche Polymermonolagen sind fur eine Reihe industrieller
Anwendungen von Interesse, da sie unter anderem auf dem Substrat, an das sie ange-
bunden sind, nur teilweise adsorbieren, so dass der großte Teil des Molekuls anderweitig
interagieren kann.83 Auf diese Weise konnen zum Beispiel kolloide Partikel in Losung ge-
gen Ausflockung stabilisiert werden.
Bei der Herstellung solcher Polymermonolagen werden zwei grundlegende Techniken un-
terschieden. Beim sogenannten Pfropfen von der Oberflache (grafting-from) wird die Po-
lymerisation mittels eines oberflachengebundenen Initiators an der Oberflache gestartet,
wahrend beim Pfropfen an die Oberflache (grafting-to) das Polymer eine funktionelle End-
gruppe tragt, die mit dem Substrat kovalent reagiert und somit als Anker fungiert.
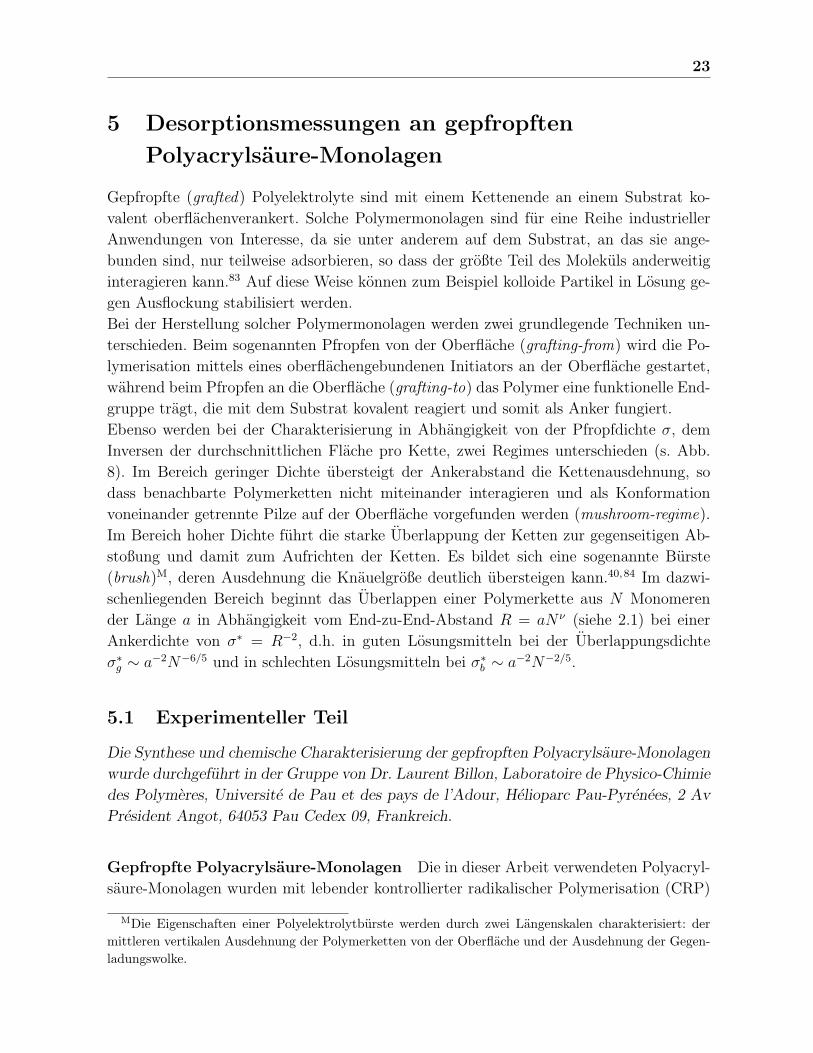
Ebenso werden bei der Charakterisierung in Abhangigkeit von der Pfropfdichte σ, dem
Inversen der durchschnittlichen Flache pro Kette, zwei Regimes unterschieden (s. Abb.
8). Im Bereich geringer Dichte ubersteigt der Ankerabstand die Kettenausdehnung, so
dass benachbarte Polymerketten nicht miteinander interagieren und als Konformation
voneinander getrennte Pilze auf der Oberflache vorgefunden werden (mushroom-regime).
Im Bereich hoher Dichte fuhrt die starke Uberlappung der Ketten zur gegenseitigen Ab-
stoßung und damit zum Aufrichten der Ketten. Es bildet sich eine sogenannte Burste
(brush)M, deren Ausdehnung die Knauelgroße deutlich ubersteigen kann.40,84 Im dazwi-
schenliegenden Bereich beginnt das Uberlappen einer Polymerkette aus N Monomeren
der Lange a in Abhangigkeit vom End-zu-End-Abstand R = aN ν (siehe 2.1) bei einer
Ankerdichte von σ∗ = R−2, d.h. in guten Losungsmitteln bei der Uberlappungsdichte
σ∗g ∼ a−2N−6/5 und in schlechten Losungsmitteln bei σ∗b ∼ a−2N−2/5.
5.1 Experimenteller Teil
Die Synthese und chemische Charakterisierung der gepfropften Polyacrylsaure-Monolagen
wurde durchgefuhrt in der Gruppe von Dr. Laurent Billon, Laboratoire de Physico-Chimie
des Polymeres, Universite de Pau et des pays de l’Adour, Helioparc Pau-Pyrenees, 2 Av
President Angot, 64053 Pau Cedex 09, Frankreich.
Gepfropfte Polyacrylsaure-Monolagen Die in dieser Arbeit verwendeten Polyacryl-
saure-Monolagen wurden mit lebender kontrollierter radikalischer Polymerisation (CRP)
MDie Eigenschaften einer Polyelektrolytburste werden durch zwei Langenskalen charakterisiert: dermittleren vertikalen Ausdehnung der Polymerketten von der Oberflache und der Ausdehnung der Gegen-ladungswolke.

24 5. Desorptionsmessungen an gepfropften Polyacrylsaure-Monolagen
Abbildung 8. Schematische Darstellung oberflachenverankerter gepfropfter Polyelektrolyte.
Links ist die Pfropfdichte geringer als die Uberlappungsdichte, so dass sich ein Pilz-Regime
bildet. Rechts fuhrt die hohe Dichte an Polyelektrolytketten zu deren Aufrichtung und zur Bil-
dung einer Polyelektrolyt-Burste.
unter Verwendung oberflachenimmobilisierter Initiatoren hergestellt (grafting-from).85 Die-
se Methode bietet die Moglichkeit, Polymere mit mehreren hundert Nanometern Kon-
turlange bei gleichzeitig niedriger Polydispersitat zu synthetisieren.N
Zusatzlich zur Oberflache wurden auch in Losung Polyacrylsaure-Ketten gebildet (”freie
Polymere“), die im Anschluß bezuglich ihres Molekulargewichts mit Gel-Permeations-
Chromatographie (GPC) untersucht wurden. Da bei dieser Methode die Trennung der
Polymere in den Chromatographie-Trennsaulen ausschließlich aufgrund ihrer Große statt-
findet, wird die Bezeichnung Großenausschluss-Chromatographie (size exclusion chroma-
tography, SEC) synonym verwendet.86
Weiterhin ist die Polyacrylsaure uber eine spaltbare Estergruppe mit der Oberflache ver-
bunden, so dass nachtraglich Ketten abgespalten werden konnen und die Pfropfdichte
eingestellt werden kann. Bei geringen Pfropfdichten (<0.01 nm−2) kann diese nicht aus-
schließlich mit Ellipsometrie ermittelt werden, sondern nur in Kombination mit Photo-
elektronenspektroskopie (XPS).O
NDazu wurde auf die Oberflache eines Siliciumscheibchens (wafer), nachdem auf dieser Hydroxyl-gruppen (OH−) erzeugt wurden, eine selbstorganisierende Monolage des Polymerisations-Initiators auf-gebracht. Die radikalische Polymerisation, bei der Acrylmonomere in Losung mit einem Radikal am Ket-tenende reagieren, muss kontrolliert ablaufen, um eine geringe Dispersitat der Kettenlangen zu erreichen.Dazu durfen stets nur wenige aktive Zentren, d.h. Polymerradikale, gleichzeitig vorhanden sein, da anson-sten vorzeitige Abbruchreaktionen eintreten. Erreicht wird dies durch Gegenradikale, haufig Nitroxide (ni-troxide mediated polymerization, NMP), welche reversibel an die Polymerradikale binden konnen und dieKettenenden inaktivieren (”schlafende Spezies“). Im zeitlichen Mittel dominiert die schlafende Spezies, sodass ein homogenes Kettenwachstum erreicht wird. Der Polydispersitatsindex der Polyacrylsaure-Kettenbetrug abhangig von der verwendeten Probe zwischen 1.2 und 1.3.
OBei der Polymerisation wird eine Referenzprobe hergestellt mit einer Pfropfdichte, die mit Ellipso-metrie bestimmt werden kann. Abhangig von der Anzahl der Ketten auf der Oberflache andern sich dieIntensitaten der Kohlenstoff- und Silicium-Peaks in den XPS-Spektren. Ein Vergleich der Intensitatenmit denen der Referenz erlaubt schließlich eine Extrapolation der Pfropfdichte.

5.1 Experimenteller Teil 25
Polyacrylsaure (PAA) (-CH2-CHCOOH-)n wird industriell im großen Mengen hergestellt.
Anwendungsbereiche sind zum Beispiel als Flockungsmittel zum Klaren von Abwassern,
als Pigmentverteiler in wasserloslichen Farben oder als Superadsorber in Produkten, z.B.
Windeln, die das Vielfache ihres eigenen Gewichts an Wasser aufnehmen konnen mussen.19
Die folgenden Ausfuhrungen beziehen sich wesentlich auf zwei Polyacrylsaure-Monolagen,
deren Pfropfdichte gering ist, d.h. die Polymerketten uberlappen nicht oder nur schwach
unter der Annahme einer 3d-Konformation der Polymere. Fur die Pfropfdichten der”dich-
ten“ Monolage σD und der”verdunnten“ Monolage σd gilt in etwa σD ≈ 0.005 nm−2 ≈
2.3 · σd.
Desorptionsmessungen an gepfropften Polymeren Das Prinzip der Desorptions-
messungen an gepfropften Polyelektrolytketten ist analog zu dem spitzenverankerter Po-
lyelektrolytmolekule auf festen Oberflachen (siehe 4.2), lediglich die Geometrie ist umge-
dreht (s. Abb. 9). Die PAA-Ketten sind an der Unterlage verankert und desorbieren im
Experiment von der AFM-Spitze. Entsprechend werden in den Kraft-Abstands-Kurven
ebenfalls die typischen Kraftplateaus beobachtet, die in diesem Fall die Wechselwirkung
des Polymers mit der AFM-Spitze wiedergeben.
Abbildung 9. Desorptionsexperiment bei dem eine oberflachenverankerte gepfropfte Poly-
acrylsaure-Kette auf einer AFM-Spitze aus Siliciumnitrid adsorbiert und von dieser desorbiert
wird. Der Prozess ist dabei vollig analog zu dem in Abbildung 6 dargestellten. Der Abstand, bei
dem das Plateau endet, d.h. die Kette vollstandig desorbiert ist, wird als Lange der Polymer-
brucke oder Bruckenlange lbr bezeichnet.
Die Beobachtung flacher Plateaus in den Kraft-Abstands-Kurven bei Verwendung von
Siliciumnitrid (Si3N4)-Spitzen ist allerdings erwahnenswert, als eine Si3N4-Spitze bedingt
durch den Atzprozess bei der Herstellung eine deutlich erhohte Rauigkeit im Vergleich
zu den sonst verwendeten Substraten aufweist. Dies wiederum legt die Vermutung nahe,
dass die Polymere eine hohe laterale Beweglichkeit auf der Oberflache aufweisen. Die-
ser Gesichtspunkt molekularer Reibung und lateraler Mobilitat von einzelnen Polymeren

26 5. Desorptionsmessungen an gepfropften Polyacrylsaure-Monolagen
auf Oberflachen wurde in einer eigenstandigen Arbeit untersucht,87 die bestatigte, dass
viele Polymere auf glatten Oberflachen derart mobil sind, dass sie uneingeschrankt uber
die Oberflache gezogen werden konnen. Bei Systemen hoherer Reibung konnte daruber
hinaus mit AFM-Messungen der Reibungskoeffizient einzelner Molekule auf Oberflachen
bestimmt werden.88
Die Verwendung von oberflachenverankerten Polymeren bietet vor allem aufgrund der
Tatsache, dass die Langenverteilung der gepfropften Polyacrylsaure-Ketten durch die
GPC-Charakterisierung bekannt ist und deren Ergebnisse direkt mit den gemessenen
Bruckenlangen der Kraft-Abstands-Kurven verglichen werden konnen, die Moglichkeit,
konturlangenspezifische Aspekte der Polyelektrolytadsorption zu untersuchen.
5.2 Ergebnisse
Molekulargewichtsbestimmung Das Molekulargewicht von oberflachenverankerten
gepfropften Polymeren kann mit Chromatographiemethoden nicht direkt bestimmt wer-
den. Vielmehr mussen entweder zusatzlich freie Polymere in Losung fur die Analyse po-
lymerisiert werden oder die gepfropften Ketten mussen abgespalten werden, wodurch die
Probe naturlich fur weitere Anwendungen unbrauchbar wird. Desorptionsmessungen hin-
gegen stellen eine nicht-invasive analytische Methode zur Molekulargewichtsbestimmung
dar, bei der die gemessenen Bruckenlangen ausgewertet werden. Daruber hinaus erlaubt
die AFM-basierte Kraftspektroskopie ortsaufgeloste Messungen, so dass auch lokale Ef-
fekte untersucht werden konnen. Die in den Experimenten beobachteten Bruckenlangen
sind in dem untersuchten Bereich der Pfropfdichte von dieser abhangig. Je niedriger die
Pfropfdichte, d.h. je mehr Flache jeder Kette im Mittel auf der Oberflache zur Verfugung
steht, desto starker muss die Adsorption an der AFM-Spitze sein, damit die gemessene
Plateaulange der Konturlange entspricht. Daher konnte die Molekulargewichtsverteilung
der”verdunnten“ PAA-Monolage lediglich mit Gold-bedampften AFM-Spitzen gemessen
werden, nicht aber mit Siliciumnitrid-Spitzen.
Bei Desorptionsmessungen als analytische Methode zur Bestimmung der Molekularge-
wichtsverteilung oberflachenverankerter gepfropfter Polyelektrolyt-Monolagen empfiehlt
sich daher aufgrund der hohen Adhasionsstarke die Verwendung metallisierter AFM-
Spitzen.
pH-Abhangigkeit der Bruckenlange Bei Verwendung von AFM-Spitzen aus Silici-
umnitrid wirkt sich eine Veranderung des pH-Werts der wassrigen NaCl-Losung zwischen
4 und 11 deutlich auf die gemessenen Verteilungen der Bruckenlangen aus. Grunde sind
hierfur zum einen die schlechte Losungsmittelqualitat des Wassers fur PAA bei pH < 6
und zum anderen eine mit der negativen Aufladung der PAA-Ketten einhergehende ver-
ringerte Adsorptionsstarke bei hohen pH-Werten.
Die gemessenen Verteilungen der Bruckenlangen der”dichten“ PAA-Monolage sind bei

5.2 Ergebnisse 27
pH 4-5 bimodal, d.h. zeigen neben der Verteilung, die die GPC-Verteilung reproduziert,
zusatzlich noch eine Verteilung bei kurzeren Langen. Ein Grund der Bimodalitat konn-
te sein, dass der durch die Losungsmittelqualitat bedingte Prozess des Kollabierens der
Ketten ungleichmaßig stattfindet und vom lokalen elektrostatischen Potential abhangt,
so dass kollabierte und geschwollene Zustande koexistieren konnten.89 Andererseits muss
auch bedacht werden, dass die Ketten mit der Oberflache, auf der sie verankert sind,
wechselwirken konnen, wobei eine erhohte Wechselwirkung der Ketten mit der Pfropfo-
berflache zur Aufteilung der Ketten in zwei Populationen fuhren kann, namlich adsorbierte
und gestreckte Ketten.90 Bei der”verdunnten“ PAA-Monolage wird die Bimodalitat nicht
beobachtet, es konnen aber beide Verteilungen unabhangig voneinander detektiert wer-
den. Das Auftreten der jeweiligen Verteilung scheint dabei von der Vorgeschichte abhangig
zu sein.
pH-Abhangigkeit der Desorptionskraft Die Linienladungsdichte der Polyacryl-
saure-Ketten und damit die elektrostatische Abstoßung mit der negativ geladenen AFM-
Spitze ist vom pH-Wert der Losung abhangig. Die mit steigendem pH-Wert zunehmen-
de Aufladung des Molekuls fuhrt demnach zur Verringerung der Desorptionskraft der
Polyacrylsaure an der Si3N4-Spitze und wegen deren Korrelation mit den gemessenen
Plateaulangen (s. Kap. 6) zur Verschiebung der Langenverteilung zu niedrigeren Wer-
ten. Da das Dissoziationsgleichgewicht neben der elektrostatischen Abstoßung entlang
der Kette auch von der elektrostatischen Abstoßung benachbarter Ketten beeinflußt
sein konnte, kann es zu Unterschieden im pH-Verhalten der”dichten“ und
”verdunn-
ten“ Polymermonolage kommen. Dieses Argument wurde den Dissoziationsgrad der”dich-
ten“ Monolage im Vergleich zur”verdunnten“ Monolage reduziert erscheinen lassen. In
Ubereinstimmung damit stehen sowohl die beobachtete Abnahme der Desorptionskraft
als auch der Bruckenlange, die bei der”dichten“ Probe erst bei hoheren pH-Werten auf-
tritt.
In dem pH-Bereich, der geladene PAA-Molekule reprasentiert, ist die gemessene Desorpti-
onskraft zudem von der Konturlange der Polymerketten abhangig. Die Ergebnisse lassen
vermuten, dass der Dissoziationsgrad mit zunehmender Konturlange leicht abnimmt.

28 6. Kompetitive Adhasion uberbruckender Polymere
6 Kompetitive Adhasion uberbruckender Polymere
Bei KlebungenP beispielsweise wird die Haftung zwischen zwei Oberflachen durch Po-
lymere vermittelt. Die Qualitat ist dabei entscheidend davon abhangig, inwieweit die
Molekule eine starke Adhasion zu beiden Oberflachen ausbilden, ohne dass die Uber-
bruckung verloren geht. Im Fall uberbruckender Polymere konnen die Polymerketten auf
beiden Oberflachen adsorbieren, die Oberflachen konkurrieren sozusagen um das Polymer.
Kompetitive Aspekte der Adhasion konnten hierbei eine wichtige Rolle spielen. Die mit
Desorptionsexperimenten gemessene Desorptionskraft ist jedoch einzig durch die Wech-
selwirkung des Polymers mit der Oberflache, von der es desorbiert wird, bestimmt. Im
Gegensatz dazu sollte die Lange der Polymerbrucke bzw. Bruckenlange, d.h. der Abstand,
bei dem die Kraftplateaus der Kraft-Abstands-Kurven enden, von beiden Oberflachen
abhangen.
6.1 Modell zur differentiellen Adhasion
Bei Desorptionsmessungen an oberflachenverankerten gepfropften Polymermonolagen
werden die beiden Oberflachen durch das Substrat, auf dem die Ketten angebunden sind,
und die AFM-Spitze, von der sie desorbiert werden, reprasentiert. Wird die AFM-Spitze
der Monolage angenahert, werden die Molekule nur dann auf dieser adsorbieren, sofern
dies energetische Vorteile mit sich bringt. Vereinfacht ist dies gegeben, wenn die Adsorp-
tionskraft mit der AFM-Spitze FA die mit dem Substrat FS ubersteigt. In diesem Fall
sei angenommen, dass die Kette mit der Lange lads auf der AFM-Spitze adsorbiert. Das
Separieren von AFM-Spitze und Unterlage fuhrt zum kontinuierlichen Desorbieren der
Monomere von der Spitze und damit zur Verminderung der Adsorptionsenergie propor-
tional zu FA (s. Abb. 10). Bei einem bestimmten Abstand zwischen Spitze und Unterlage,
der als Gleichgewichtsabstand deq bezeichnet wird, entspricht die Adsorptionsenergie dem
Wert, der erwartet wird, wenn die Kette vollstandig auf dem Substrat adsorbiert ware:
deq = lads · (1− FS/FA). Fahrt die Spitze nunmehr weiter zuruck und vergroßert den Ab-
stand zur Oberflache, ist die Desorption von Monomeren von der AFM-Spitze energetisch
nicht mehr bevorzugt gegenuber der vollstandigen Adsorption auf der Unterlage, d.h.
gegenuber der kompletten Freisetzung des adsorbierten Segments von der AFM-Spitze.
Gleichwohl ist die”metastabile“ Desorption weiterhin wahrscheinlich, da der adsorbierte
und der freigesetzte Zustand durch eine Energiebarriere getrennt sind, die durch thermi-
sche Fluktuationen uberwunden werden muss. Die Wahrscheinlichkeit zum Uberwinden
der Barriere wird dabei aufgrund der Proportionalitat von Barrierenhohe und Anzahl
adsorbierter Monomere durch fortgefuhrte Desorption von Monomeren von der Spitze
erhoht.
In dem Abstandsbereich d > deq tritt demnach zu der kontinuierlichen Desorption von Mo-
PAllein in Deutschland wurden 2003 ca. 6 Mio. Tonnen Klebstoffe, Lacke und Harze hergestellt.11

6.2 Ergebnisse 29
Abbildung 10. Modell zur differentiellen Adhasion. Aufgetragen ist die Adsorptionsenergie
gegen den Abstand der beiden Oberflachen mit denen das Polymer wechselwirken kann. Im Be-
reich metastabiler Desorption konkurrieren beide Oberflachen um das Polymer, welches dadurch
aus energetischen Grunden vollstandig auf eine Oberflache adsorbieren kann, wodurch die Uber-
bruckung verloren geht. Dies zeigt sich bei Desorptionsmessungen als Anderung der scheinbaren
Polymerlange.
nomeren im Gleichgewicht der Nichtgleichgewichtsprozess der vollstandigen Freisetzung
des adsorbierten Segments von der AFM-Spitze hinzu. Je ahnlicher die beiden Oberflachen
bezuglich ihrer Adhasionsstarke des Polymers sind, desto mehr ist die Bruckenlange zu
kurzeren Werten verschoben und weist eine breitere Verteilung auf.
6.2 Ergebnisse
Die mit Desorptionsexperimenten an gepfropften Polymermonolagen gemessenen
Bruckenlangen hangen sowohl von der Wechselwirkung des Polymers mit der Unterlage
FS als auch von der Wechselwirkung mit der AFM-Spitze FA ab. Bei starkerer Adhasion
an der AFM-Spitze als an der Oberflache (FA > FS) wird im Experiment das Polymer mit
seiner gesamten Lange lc auf der AFM-Spitze adsorbieren, da hierdurch die Adsorptions-
enthalpie maximiert wird, d.h. lads = lc. Dieser Fall konnte mit goldbedampften Spitzen
30 6. Kompetitive Adhasion uberbruckender Polymere
realisiert werden, die ermittelte Verteilung der Bruckenlangen entspricht dann der Mole-
kulargewichtsverteilung (s. 5.2). Wenn jedoch die Adhasion an der Unterlage die an der
AFM-Spitze uberwiegt, wird das Polymer versuchen seine Oberflachenbedeckung zu ma-
ximieren. Bei den gegebenen Adsorptionsenthalpien von 10-20 kBT wird eine vorwiegend
2d-Konformation die Folge sein. Ubersteigt diese Bedeckung jedoch eine Monolage ist
keine freie Flache auf der Unterlage vorhanden und das Polymer wird nur zum Teil auf
der Oberflache adsorbieren konnen und einen in die Losung ragenden Bereich aufweisen.
Im Desorptionsexperiment wird lediglich dieser freie Teil an die Spitze adsorbieren, d.h.
lads < lc.
In diesem Modell ergibt sich insbesondere eine Abhangigkeit der Bruckenlange von der
Dichte der Polymere auf der Unterlage. Eine hohere Dichte sollte die freie Flache auf der
Unterlage reduzieren und den freien Teil des Polymers verlangern, so dass ebenfalls eine
großere Bruckenlange beobachtet werden musste. Dieser Zusammenhang konnte durch
die Verwendung von Polymermonolagen verschiedener Pfropfdichte erfolgreich bestatigt
werden. Eine quantitative Beschreibung gelang ebenfalls, indem, basierend auf dem End-
zu-End-Abstand des Rouse-Zimm-Modells fur Polymere, die auf der Unterlage adsorbierte
Lange berechnet wurde.
Ausgehend von der Dichteabhangigkeit der Lange des an der Spitze adharierten Segments
lads konnen Verkurzungen der Bruckenlange, die sich zum Beispiel als Folge einer Ande-
rung des pH-Werts der Losung ergeben (s. 5.2), mit dem Modell fur differentielle Adhasion
beschrieben werden.

31
7 Polypeptid-Mineral-Wechselwirkungen
Biomineralien sind Zusammensetzungen aus Mineralkristallen und organischen Mole-
kulen, die sich durch außergewohnliche Materialeigenschaften und hierarchische Orga-
nisation auszeichnen.9,91–95 In der Natur reicht das breite Anwendungsspektrum von me-
chanischem Schutz bei Muschelschalen, Navigation bei magnetotaktischen Bakterien bis
zu Werkzeugen und Waffen bei Krebsscheren.
Mineralien sind oft starr und sprode, Biomineralien hingegen gleichzeitig extrem bruchfest
und elastisch. Sie gelten daher als Vorbilder fur zukunftige Materialien. In Muschelscha-
len beispielsweise fuhren die Wechselwirkungen von Calcit und Biopolymeren dazu, dass
Risse sich nur schwer ausbreiten konnen - eine Eigenschaft, die zum Beispiel fur Beton
enorme Bedeutung besitzt. Fur industrielle Anwendungen liegen weitere Vorteile auf der
Hand, da Biomineralisationsprozesse in wassrigen, d.h. umweltfreundlichen Medien und
auf biologische, energieeffiziente Weise ablaufen.
Diese außergewohnlichen Materialeigenschaften sind das Resultat einer prazisen Kontrolle
der Kristallisation und Selbstorganisation durch losliche und unlosliche biologische Mo-
lekule. Viele der loslichen organischen Polymere, die aus Biomineralien extrahiert wurden,
sind dabei auffallend sauer. So enthalten Matrixproteine in Biomineralien gewohnlich 30-
40 mol% der Aminosaurereste Asparaginsaure (D) oder Glutaminsaure (E). Diese wie-
derum konnen mit Calcium wechselwirken, was die Grundlage fur viele Biominerale wie
Calciumcarbonate (z.B. Calcit) oder -phosphate (Apatit) darstellt.
Saure Makromolekule spielen wahrscheinlich eine Schlusselrolle in Biomineralisationspro-
zessen, allerdings mangelt es an Wissen uber die Struktur der Molekule und ihre Wech-
selwirkung mit der Mineraloberflache. Daher wurden bisher zahlreiche synthetische Poly-
mere hergestellt und deren Auswirkungen auf den Kristallisationsprozess der Mineralien
untersucht. Einige Additive sind in der Lage wahrend des Kristallwachstums Nichtgleich-
gewichtsformen zu stabilisieren und somit die Kristallisation zu kontrollieren. Besonders
aussichtsreich sind in diesem Zusammenhang sogenannte doppelthydrophile Blockcopo-
lymere. Um solche Prozesse allerdings gezielt steuern und anorganische Strukturen mit
biomimetischen Eigenschaften definiert und vorhersagbar herstellen zu konnen, ist ein
tieferes Verstandnis der molekularen Prozesse notwendig.
In dieser Arbeit wurde daher die Wechselwirkung eines doppelthydrophilen Blockcopoly-
mers, dessen einer Block von einem sauren Polypeptid aus Glutaminsaure gebildet wird,
mit verschiedenen Calcit-Kristallflachen eingehender untersucht.
7.1 Experimenteller Teil
Die Synthese der doppelthydrophilen Blockcopolymere wurde in der Gruppe von Dr. Hel-
mut Schlaad und die Herstellung der Calcit-Hochenergiekristallflachen in der Gruppe von
Dr. Helmut Colfen durchgefuhrt, Kolloidchemie (Prof. Antonietti), Max-Planck-Institut

32 7. Polypeptid-Mineral-Wechselwirkungen
fur Kolloid- und Grenzflachenforschung, Wissenschaftscampus Golm, D-14424 Potsdam.
Doppelthydrophile Blockcopolymere (PEO-b-PLE) Die verwendeten Polymere
sind doppelhydrophile Blockcopolymere, die aus Polyethylenoxid (PEO) und Poly(l-
Glutaminsaure) (PLE) aufgebaut sind. Hinzu kommt ein Polyaminblock, uber den das
Polymer kovalent an die AFM-Spitze gebunden wird.
Abbildung 11. Struktur des verwendeten doppelthydrophilen Blockcopolymers PEO-b-PLE,
bei dem der Polyaminblock zur kovalenten Anbindung an die AFM-Spitze dient. Das Natrium-
carboxylat dissoziiert in wassrigen Losungen.
Calcit Calcit oder Kalkspat ist die am haufigsten vorkommende kristalline Form
von Calciumcarbonat CaCO3Q und kommt in der Natur unter anderem in Muscheln,
Schnecken, Korallen oder Eierschalen von Vogeln vor. Calcit ist ublicherweise rhombisch
aufgebaut, der Rhomboeder wird dabei von sechs (104) KristallflachenR begrenzt. Calcit
kann mechanisch sehr leicht gespalten werden, wobei die Spaltflache stets eine (104) Orien-
tierung zeigt, die sich aus alternierenden Ca-Atomen und CO3-Gruppen zusammensetzt.
An der Spaltflache selber sind die Ca und CO3 nicht mehr wie im Kristall oktaedrisch
koordiniert, sondern baumelnde Bindungen (dangling bonds) treten hier auf und mussen
berucksichtigt werden. Experimentelle Daten und theoretische Berechnungen zeigen, dass
sich als Folge die obersten Kristallebenen in Form von Rotationen der CO3-Gruppen
sowie lateralen und vertikalen Versetzungen der Ca-Atome und CO3-Gruppen rekonstru-
ieren.97,98 Eine stark gebundene Schicht adsorbierter Wassermolekule scheint in der Lage
zu sein die Oberflache zu stabilisieren.99–102 Auf der Calcit (104) Spaltflache sollte also
eine Hydratationsschicht zu finden sein.
Strukturell sehr ahnlich zu der (104) Spaltflache ist die (100) Kristallflache, die ebenfalls
von alternierenden Ca-Atomen und CO3-Gruppen gebildet wird und im Vergleich zur
(104) Flache lediglich einen großeren Abstand zwischen Ca und CO3 sowie eine unter-
schiedliche Orientierung der CO3-Gruppen zeigt. Im Gegensatz dazu ist die (012) Flache
stark geladen, d.h. eine sogenannte Hochenergiekristallflache, die entweder von einer Lage
QAhnliche Calciumcarbonate sind Aragonit und Vaterit.R(hkl) sind die Millerschen Indices, die die Kristallflachen oder Netzebenen bei vorgegebenen Kristall-
achsen kennzeichnen.96

7.2 Ergebnisse 33
Ca-Atome oder CO3-Gruppen abgeschlossen wird.S
Desorptionsmessungen Zur Durchfuhrung der Desorptionsmessungen wurden einzel-
ne PEO-b-PLE Polymere an eine AFM-Spitze angebunden.T Dabei zeigte sich, dass die
Verwendung eines Polyaminblocks zur Polymeranbindung an die Spitze sowohl eine sehr
gute Anbindungseffizienz als auch eine hervorragende Langzeitstabilitat bietet. Der Ab-
lauf eines Desorptionsexperiments entspricht dem in Abschnitt 4.2 beschriebenen. Als feste
Oberflachen, mit denen das Polymer wechselwirkt, wurden verschiedene Calcitflachen ver-
wendet. In den Kraft-Abstands-Kurven kann eine Anderung der Desorptionskraft beim
Ubergang zwischen den beiden Blocken des Polymers beobachtet werden, die zeigt dass
die Desorptionskraft fur PEO einige pN geringer ist als die fur PLE. Die Messungen er-
lauben also, insbesondere die Wechselwirkung beider Blocke sowie den Ubergang in einem
Experiment zu untersuchen.
7.2 Ergebnisse
(Elektrostatische) Wechselwirkungen zwischen PLE und Calcit Die mit De-
sorptionsexperimenten fur verschiedene pH-Werte zwischen pH 6 und 11 einer wassrigen
Losung mit 10 mM CaCl2 ermittelten Desorptionskrafte zwischen PLE und Calcit zei-
gen eine Glockenkurve mit einem Maximum bei pH 8.6. Die Desorptionskrafte bei pH 6
und 11 sind dabei identisch (65 pN) und am Maximum um etwa 4 pN erhoht. Dies ent-
spricht einem repulsiven Beitrag zur Desorptionskraft, der nur im Fall der ungeladenen
Oberflache103,104 um pH 8.6 verschwindet. Diese Beobachtung unterstreicht das komple-
xe Zusammenspiel verschiedener molekularer Wechselwirkungen in Biomineralien. Neben
elektrostatischen Wechselwirkungen muß insbesondere der Einfluß der Ca2+-Ionen der
Losung berucksichtigt werden, da diese unter anderem an PLE binden konnen.105,106
Die Desorptionskrafte zwischen PLE und Calcit in Abhangigkeit von der Ca2+-
Konzentration der Losung zeigen ein von elektrostatischen Wechselwirkungen bestimm-
tes Verhalten. Dabei sind sowohl die elektrostatische Abschirmung als auch die von der
Salzkonzentration der Losung abhangige Ladungsdichte des Polymers einzubeziehen. Die
beobachteten Kraftunterschiede liegen in der Großenordnung von 10 pN.
Die Sensitivitat der Desorptionsmessungen zeigte sich insbesondere bei den Experimen-
ten mit veranderter Ca2+-Konzentration, da signifikante Unterschiede zwischen der Calcit
(104) und (100) Kristallflache beobachtet werden konnten, obwohl sich diese strukturell
nur geringfugig unterscheiden.
SSolche Hochenergiekristallflachen lassen sich beispielsweise durch Kristallwachstum auf bestimmtenselbstorganisierenden Monolagen herstellen. Es werden dabei triangulare Formen gebildet, verschiedeneKristallflachen konnen anhand der Winkel im Dreieck unterschieden werden.
TDazu wurden auf einer Siliciumnitrid-Spitze durch Aufbringen einer Monolage eines Silans reakti-ve Epoxy-Gruppen erzeugt, die kovalente Bindungen mit den Aminogruppen des Polyaminblocks desPolymers bilden.

34 7. Polypeptid-Mineral-Wechselwirkungen
Rekonstruktion additivfreier Hochenergiekristallflachen von Calcit Desorpti-
onsmessungen wurden auch an der Hochenergiekristallflache Calcit (012) in wassriger
Losung durchgefuhrt. Dabei wurden identische Desorptionskrafte wie fur Calcit (104) er-
halten, was angesichts der Tatsache, dass sogar die Flachen (104) und (100) Unterschiede
in der Desorptionskraft zeigen, einen deutlichen Hinweis fur eine Rekonstruktion der (012)
in eine (104) Flache darstellt. Ein solches Verhalten ist zwar nach Wulffs Regel, die besagt,
dass Kristallflachen niedriger Oberflachenenergie in der Gleichgewichtsmorphologie expo-
niert werden, zu erwarten, aber prinzipiell unter Gesichtspunkten der Biomineralisation
von Bedeutung, da Polymeradditive diese Hochenergiekristallflachen stabilisieren konnen.
In trockener Umgebung oder schlechten Losungsmitteln findet keine Rekonstruktion statt.

LITERATUR 35
Literatur
[1] H.G. Elias: Anwendungen von Polymeren, Band 4 von Makromolekule. 6. Auflage.
Wiley-VCH, Weinheim, 2003.
[2] H. Boroudjerdi, Y.W. Kim, A. Naji, R.R. Netz, X. Schlagberger und A. Serr: Statics
and dynamics of strongly charged soft matter, Physics Reports-Review Section of
Physics Letters 416 (2005), 129.
[3] S. Minko und Y. Roiter: AFM single molecule studies of adsorbed polyelectrolytes,
Current Opinion in Colloid & Interface Science 10 (2005), 9.
[4] T. Hugel und M. Seitz: The study of molecular interactions by AFM force spectros-
copy, Macromolecular Rapid Communications 22 (2001), 989.
[5] T. Hugel, M. Grosholz, H. Clausen-Schaumann, A. Pfau, H.E. Gaub und M. Seitz:
Elasticity of single polyelectrolyte chains and their desorption from solid supports
studied by AFM based single molecule force spectroscopy, Macromolecules 34 (2001),
1039.
[6] M. Seitz, C. Friedsam, W. Jostl, T. Hugel und H.E. Gaub: Probing solid surfaces
with single polymers, ChemPhysChem 4 (2003), 986.
[7] C. Friedsam, A. Del Campo Becares, U. Jonas, M. Seitz und H.E. Gaub: Adsorption
of polyacrylic acid on self-assembled monolayers investigated by single-molecule force
spectroscopy, New Journal of Physics 6 (2004).
[8] C. Friedsam, H.E. Gaub und R.R. Netz: Adsorption energies of single charged po-
lymers, Europhysics Letters 72 (2005), 844.
[9] H.A. Lowenstam und S. Weiner: On Biomineralization. Oxford University Press,
New York, 1989.
[10] H. Morawetz: Difficulties in the Emergence of the Polymer Concept - an Essay,
Angewandte Chemie-International Edition 26 (1987), 93.
[11] www.vke.de (Verband kunststofferzeugender Industrie).
[12] P.J. Flory: Principles of Polymer Chemistry. Cornell Univ. Press, Ithaca, 1953.
[13] P.G. de Gennes: Scaling Concepts in Polymer Physics. Cornell Univ. Press, Ithaca,
1979.
[14] M. Doi und S. Edwards: The Theory of Polymer Dynamics. Clarendon Press, Ox-
ford, 1988.

36 LITERATUR
[15] J. des Cloizeaux und G. Jannink: Polymers in solution: their modelling and struc-
ture. Clarendon Press, Oxford, 1990.
[16] A. Grosberg und A. Chochlov: Statistical physics of macromolecules. AIP Press,
Woodbury, NY, 1994.
[17] M. Doi: Introduction to Polymer Physics. Clarendon Press, Oxford, 1995.
[18] M. Rubinstein und R.H. Colby: Polymer Physics. Oxford University Press, Oxford,
2003.
[19] H.G. Elias: Industrielle Polymere und Synthesen, Band 3 von Makromolekule. 6.
Auflage. Wiley-VCH, Weinheim, 2001.
[20] O. Kratky und G. Porod: Rontgenuntersuchung geloster Fadenmolekule, Recueil
Des Travaux Chimiques Des Pays-Bas-Journal of the Royal Netherlands Chemical
Society 68 (1949), 1106.
[21] H.B. Li, B.B. Liu, X. Zhang, C.X. Gao, J.C. Shen und G.T. Zou: Single-molecule
force spectroscopy on poly(acrylic acid) by AFM, Langmuir 15 (1999), 2120.
[22] C. Rivetti, C. Walker und C. Bustamante: Polymer chain statistics and confor-
mational analysis of DNA molecules with bends or sections of different flexibility,
Journal of Molecular Biology 280 (1998), 41.
[23] S.B. Smith, Y.J. Cui und C. Bustamante: Overstretching B-DNA: The elastic re-
sponse of individual double-stranded and single-stranded DNA molecules, Science
271 (1996), 795.
[24] C. Bustamante, J.F. Marko, E.D. Siggia und S. Smith: Entropic Elasticity of
Lambda-Phage DNA, Science 265 (1994), 1599.
[25] A. Ott, M. Magnasco, A. Simon und A. Libchaber: Measurement of the Persistence
Length of Polymerized Actin Using Fluorescence Microscopy, Physical Review E 48
(1993), R1642.
[26] F. Gittes, B. Mickey, J. Nettleton und J. Howard: Flexural Rigidity of Microtubules
and Actin-Filaments Measured from Thermal Fluctuations in Shape, Journal of Cell
Biology 120 (1993), 923.
[27] H. Dautzenberg, W. Jaeger, J. Kotz, B. Philipp, C. Seidel und D. Stscherbina:
Polyelectrolytes: formation, characterization and application. Hanser, Munich, 1994.
[28] F. Oosawa: Polyelectrolytes. M. Dekker, New York, 1971.
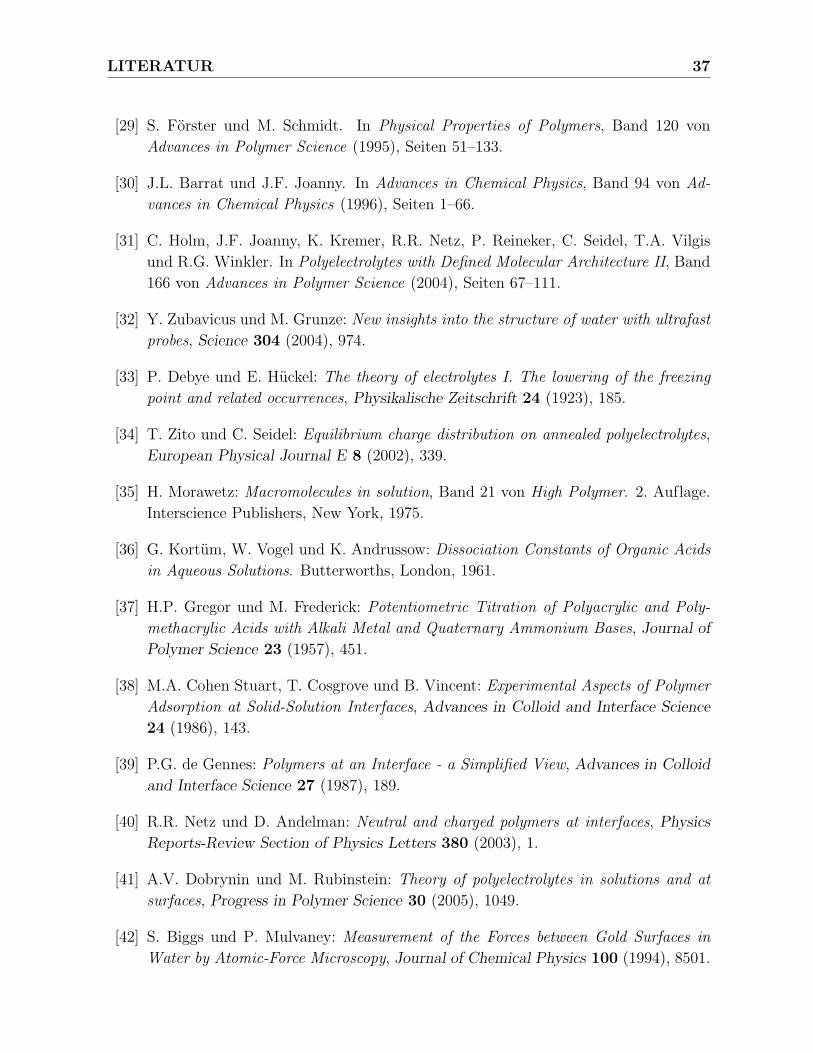
LITERATUR 37
[29] S. Forster und M. Schmidt. In Physical Properties of Polymers, Band 120 von
Advances in Polymer Science (1995), Seiten 51–133.
[30] J.L. Barrat und J.F. Joanny. In Advances in Chemical Physics, Band 94 von Ad-
vances in Chemical Physics (1996), Seiten 1–66.
[31] C. Holm, J.F. Joanny, K. Kremer, R.R. Netz, P. Reineker, C. Seidel, T.A. Vilgis
und R.G. Winkler. In Polyelectrolytes with Defined Molecular Architecture II, Band
166 von Advances in Polymer Science (2004), Seiten 67–111.
[32] Y. Zubavicus und M. Grunze: New insights into the structure of water with ultrafast
probes, Science 304 (2004), 974.
[33] P. Debye und E. Huckel: The theory of electrolytes I. The lowering of the freezing
point and related occurrences, Physikalische Zeitschrift 24 (1923), 185.
[34] T. Zito und C. Seidel: Equilibrium charge distribution on annealed polyelectrolytes,
European Physical Journal E 8 (2002), 339.
[35] H. Morawetz: Macromolecules in solution, Band 21 von High Polymer. 2. Auflage.
Interscience Publishers, New York, 1975.
[36] G. Kortum, W. Vogel und K. Andrussow: Dissociation Constants of Organic Acids
in Aqueous Solutions. Butterworths, London, 1961.
[37] H.P. Gregor und M. Frederick: Potentiometric Titration of Polyacrylic and Poly-
methacrylic Acids with Alkali Metal and Quaternary Ammonium Bases, Journal of
Polymer Science 23 (1957), 451.
[38] M.A. Cohen Stuart, T. Cosgrove und B. Vincent: Experimental Aspects of Polymer
Adsorption at Solid-Solution Interfaces, Advances in Colloid and Interface Science
24 (1986), 143.
[39] P.G. de Gennes: Polymers at an Interface - a Simplified View, Advances in Colloid
and Interface Science 27 (1987), 189.
[40] R.R. Netz und D. Andelman: Neutral and charged polymers at interfaces, Physics
Reports-Review Section of Physics Letters 380 (2003), 1.
[41] A.V. Dobrynin und M. Rubinstein: Theory of polyelectrolytes in solutions and at
surfaces, Progress in Polymer Science 30 (2005), 1049.
[42] S. Biggs und P. Mulvaney: Measurement of the Forces between Gold Surfaces in
Water by Atomic-Force Microscopy, Journal of Chemical Physics 100 (1994), 8501.
38 LITERATUR
[43] L. Bergstrom: Hamaker constants of inorganic materials, Advances in Colloid and
Interface Science 70 (1997), 125.
[44] R.R. Netz und J.F. Joanny: Complexation behavior of polyampholytes and charged
objects, Macromolecules 31 (1998), 5123.
[45] R.R. Netz und J.F. Joanny: Adsorption of semiflexible polyelectrolytes on charged
planar surfaces: Charge compensation, charge reversal, and multilayer formation,
Macromolecules 32 (1999), 9013.
[46] A.F. Xie und S. Granick: Phospholipid membranes as substrates for polymer adsorp-
tion, Nature Materials 1 (2002), 129.
[47] S.E. Burke und C.J. Barrett: Acid-base equilibria of weak polyelectrolytes in multi-
layer thin films, Langmuir 19 (2003), 3297.
[48] M. Uematsu und E.U. Franck: Static Dielectric-Constant of Water and Steam, Jour-
nal of Physical and Chemical Reference Data 9 (1980), 1291.
[49] D.A. Robinson: Measurement of the solid dielectric permittivity of clay minerals and
granular samples using a time domain reflectometry immersion method, Vadose Zone
Journal 3 (2004), 705.
[50] G.N. Parsons, J.H. Souk und J. Batey: Low Hydrogen Content Stoichiometric
Silicon-Nitride Films Deposited by Plasma-Enhanced Chemical Vapor-Deposition,
Journal of Applied Physics 70 (1991), 1553.
[51] R.R. Netz: Debye-Huckel theory for interfacial geometries, Physical Review E 60
(1999), 3174.
[52] R.R. Netz: Charge regulation of weak polyelectrolytes at low- and high-dielectric-
constant substrates, Journal of Physics-Condensed Matter 15 (2003), S239.
[53] J.O. Bockris und S.U.M. Khan: Surface electrochemistry: a molecular level approach.
Plenum Press, New York, 1993.
[54] A.V. Delgado, E. Gonzalez-Caballero, R.J. Hunter, L.K. Koopal und J. Lyklema:
Measurement and interpretation of electrokinetic phenomena - (IUPAC technical
report), Pure and Applied Chemistry 77 (2005), 1753.
[55] B. Cappella und G. Dietler: Force-distance curves by atomic force microscopy, Sur-
face Science Reports 34 (1999), 1.
[56] G. Binnig, C.F. Quate und C. Gerber: Atomic Force Microscope, Physical Review
Letters 56 (1986), 930.
LITERATUR 39
[57] F. Ritort: Single-molecule experiments in biological physics: methods and applicati-
ons, Journal of Physics-Condensed Matter 18 (2006), R531.
[58] A. Janshoff, M. Neitzert, Y. Oberdorfer und H. Fuchs: Force spectroscopy of mo-
lecular systems - Single molecule spectroscopy of polymers and biomolecules, Ange-
wandte Chemie-International Edition 39 (2000), 3213.
[59] M.B. Viani, T.E. Schaffer, A. Chand, M. Rief, H.E. Gaub und P.K. Hansma: Small
cantilevers for force spectroscopy of single molecules, Journal of Applied Physics 86
(1999), 2258.
[60] S.B. Smith, L. Finzi und C. Bustamante: Direct Mechanical Measurements of the
Elasticity of Single DNA-Molecules by Using Magnetic Beads, Science 258 (1992),
1122.
[61] A. Ashkin, K. Schutze, J.M. Dziedzic, U. Euteneuer und M. Schliwa: Force Gene-
ration of Organelle Transport Measured Invivo by an Infrared-Laser Trap, Nature
348 (1990), 346.
[62] M.P. Sheetz: Laser tweezers in cell biology. Acad. Press, San Diego, 1998.
[63] A. Kishino und T. Yanagida: Force Measurements by Micromanipulation of a Single
Actin Filament by Glass Needles, Nature 334 (1988), 74.
[64] E. Evans, K. Ritchie und R. Merkel: Sensitive Force Technique to Probe Molecular
Adhesion and Structural Linkages at Biological Interfaces, Biophysical Journal 68
(1995), 2580.
[65] H. Clausen-Schaumann, M. Seitz, R. Krautbauer und H.E. Gaub: Force spectroscopy
with single bio-molecules, Current Opinion in Chemical Biology 4 (2000), 524.
[66] E.L. Florin, V.T. Moy und H.E. Gaub: Adhesion Forces between Individual Ligand-
Receptor Pairs, Science 264 (1994), 415.
[67] G.U. Lee, L.A. Chrisey und R.J. Colton: Direct Measurement of the Forces between
Complementary Strands of DNA, Science 266 (1994), 771.
[68] E. Evans und K. Ritchie: Dynamic strength of molecular adhesion bonds, Biophysical
Journal 72 (1997), 1541.
[69] G.I. Bell: Models for Specific Adhesion of Cells to Cells, Science 200 (1978), 618.
[70] S. Izrailev, S. Stepaniants, M. Balsera, Y. Oono und K. Schulten: Molecular dyna-
mics study of unbinding of the avidin-biotin complex, Biophysical Journal 72 (1997),
1568.

40 LITERATUR
[71] M. Balsera, S. Stepaniants, S. Izrailev, Y. Oono und K. Schulten: Reconstructing
potential energy functions from simulated force-induced unbinding processes, Bio-
physical Journal 73 (1997), 1281.
[72] B. Heymann und H. Grubmuller: Dynamic force spectroscopy of molecular adhesion
bonds, Physical Review Letters 84 (2000), 6126.
[73] E. Evans: Looking inside molecular bonds at biological interfaces with dynamic force
spectroscopy, Biophysical Chemistry 82 (1999), 83.
[74] M. Grandbois, M. Beyer, M. Rief, H. Clausen-Schaumann und H.E. Gaub: How
strong is a covalent bond?, Science 283 (1999), 1727.
[75] M. Rief, M. Gautel, F. Oesterhelt, J.M. Fernandez und H.E. Gaub: Reversible un-
folding of individual titin immunoglobulin domains by AFM, Science 276 (1997),
1109.
[76] X.W. Zhuang und M. Rief: Single-molecule folding, Current Opinion in Structural
Biology 13 (2003), 88.
[77] M.C. Williams und I. Rouzina: Force spectroscopy of single DNA and RNA mole-
cules, Current Opinion in Structural Biology 12 (2002), 330.
[78] H.G. Hansma, K. Kasuya und E. Oroudjev: Atomic force microscopy imaging and
pulling of nucleic acids, Current Opinion in Structural Biology 14 (2004), 380.
[79] M. Rief, F. Oesterhelt, B. Heymann und H.E. Gaub: Single molecule force spectros-
copy on polysaccharides by atomic force microscopy, Science 275 (1997), 1295.
[80] T. Hugel, N.B. Holland, A. Cattani, L. Moroder, M. Seitz und H.E. Gaub: Single-
molecule optomechanical cycle, Science 296 (2002), 1103.
[81] T.J. Senden, J.M. di Meglio und P. Auroy: Anomalous adhesion in adsorbed polymer
layers, European Physical Journal B 3 (1998), 211.
[82] X. Chatellier, T.J. Senden, J.F. Joanny und J.M. di Meglio: Detachment of a single
polyelectrolyte chain adsorbed on a charged surface, Europhysics Letters 41 (1998),
303.
[83] D. Napper: Polymeric Stabilization of Colloidal Dispersion. Academic Press, New
York, 1983.
[84] J. Ruhe, M. Ballauff, M. Biesalski, P. Dziezok, F. Grohn, D. Johannsmann, N. Hou-
benov, N. Hugenberg, R. Konradi, S. Minko, M. Motornov, R.R. Netz, M. Schmidt,
C. Seidel, M. Stamm, T. Stephan, D. Usov und H.N. Zhang. In Polyelectrolytes

LITERATUR 41
with Defined Molecular Architecture I, Band 165 von Advances in Polymer Science
(2004), Seiten 79–150.
[85] J. Parvole, J.P. Montfort, G. Reiter, O. Borisov und L. Billon: Elastomer polymer
brushes on flat surface by bimolecular surface-initiated nitroxide mediated polyme-
rization, Polymer 47 (2006), 972.
[86] B. Trathnigg: Determination of MWD and Chemical-Composition of Polymers by
Chromatographic Techniques, Progress in Polymer Science 20 (1995), 615.
[87] M. Erdmann: Untersuchung statischer und dynamischer Eigenschaften von adsor-
bierten Polymeren unter Krafteinfluß. Ludwig-Maximilians-Universitat Munchen,
Diplomarbeit, 2006.
[88] F. Kuhner, M. Erdmann, L. Sonnenberg, A. Serr, J. Morfill und H.E. Gaub: Friction
of single polymers at surfaces, Langmuir 22 (2006), 11180.
[89] E. Raphael und J.F. Joanny: Annealed and Quenched Polyelectrolytes, Europhysics
Letters 13 (1990), 623.
[90] E.B. Zhulina, O.V. Borisov, J. van Male und F.A.M. Leermakers: Adsorption of
tethered polyelectrolytes onto oppositely charged solid-liquid interfaces, Langmuir 17
(2001), 1277.
[91] K. Simkiss und K.M. Wilbur: Biomineralization: cell biology and mineral deposition.
Academic Press, San Diego, 1989.
[92] L. Addadi und S. Weiner: Control and Design Principles in Biological Mineraliza-
tion, Angewandte Chemie-International Edition 31 (1992), 153.
[93] P. Ball: The Self Made Tapestry: Pattern Formation in Nature. Oxford University
Press, Oxford, 1999.
[94] S. Mann: The chemistry of form, Angewandte Chemie-International Edition 39
(2000), 3393.
[95] C. Pietschmann, O. Meckes und N. Ottawa: Biominerale: Mit dem Dreh der Natur,
GEO (2006).
[96] C. Kittel: Einfuhrung in die Festkorperphysik. 12. Auflage. Oldenbourg, Munchen,
1999.
[97] S.L.S. Stipp: Toward a conceptual model of the calcite surface: Hydration, hydrolysis,
and surface potential, Geochimica Et Cosmochimica Acta 63 (1999), 3121.

42 LITERATUR
[98] K. Wright, R.T. Cygan und B. Slater: Structure of the (10 1 4 ) surfaces of calcite,
dolomite and magnesite under wet and dry conditions, Physical Chemistry Chemical
Physics 3 (2001), 839.
[99] P. Fenter, P. Geissbuhler, E. DiMasi, G. Srajer, L.B. Sorensen und N.C. Sturchio:
Surface speciation of calcite observed in situ by high-resolution X-ray reflectivity,
Geochimica Et Cosmochimica Acta 64 (2000), 1221.
[100] P. Geissbuhler, P. Fenter, E. DiMasi, G. Srajer, L.B. Sorensen und N.C. Sturchio:
Three-dimensional structure of the calcite-water interface by surface X-ray scatte-
ring, Surface Science 573 (2004), 191.
[101] N.H. de Leeuw und S.C. Parker: Atomistic simulation of the effect of molecular
adsorption of water on the surface structure and energies of calcite surfaces, Journal
of the Chemical Society-Faraday Transactions 93 (1997), 467.
[102] S. Kerisit, S.C. Parker und J.H. Harding: Atomistic simulation of the dissociative
adsorption of water on calcite surfaces, Journal of Physical Chemistry B 107 (2003),
7676.
[103] P. Moulin und H. Roques: Zeta potential measurement of calcium carbonate, Journal
of Colloid and Interface Science 261 (2003), 115.
[104] H. Churchill, H. Teng und R.M. Hazen: Correlation of pH-dependent surface inter-
action forces to amino acid adsorption: Implications for the origin of life, American
Mineralogist 89 (2004), 1048.
[105] B. Kriwet und T. Kissel: Interactions between bioadhesive poly(acrylic acid) and
calcium ions, International Journal of Pharmaceutics 127 (1996), 135.
[106] F. Madsen und N.A. Peppas: Complexation graft copolymer networks: swelling pro-
perties, calcium binding and proteolytic enzyme inhibition, Biomaterials 20 (1999),
1701.

43
A Competitive Adhesion of Single Polymer Chains
Bridging two Surfaces
Lars Sonnenberg, Laurent Billon and Hermann E. Gaub
The interaction of polymers with interfaces comprises a richness of fundamental science
phenomena and at the same time is of utmost technological importance.1,2 A broad spec-
trum of industrial applications e.g. in novel materials heavily relies on polymers bridging
adjacent surfaces.3,4 In dispersions polymers are employed to stabilize colloidal particles
in solution via steric and/or electrostatic repulsion. They also may clot particles together,
i.e. filter unwanted particles out, via polymer bridges.5−10 Such polymers are frequently
end-grafted to the particle surface to enhance long-term stability and to prevent the po-
lymer from desorbing at low interaction strength.11−14 Particularly interesting properties
with many applications in smart materials may be achieved when the interaction/bridging
properties can be tuned by external stimuli. Using polyelectrolytes (PELs) for such purpo-
ses allows the manipulation of electrostatic interactions by varying the salt concentration
and/or pH of the aqueous solution.1,2,15
In this study we investigated the bridging of individual PEL chains, which were end-
grafted to a planar silicon oxide surface. As counter-surface we offer the polymer the blunt
tip of an AFM-cantilever (see Figure 1). The interaction forces were measured with pN-
precision and the bridging lengths with nm-accuracy at the level of single molecules.16−18
By modification of the surface chemistry of the tip or by metal evaporation we altered the
interaction with the polymer and explored the vertical structure of the adsorbate film.
In several studies with different polymers24,25 we found in the past that the measured
bridging lengths depend on both the properties of the surfaces and the ambient condi-
tions. This made us investigate this phenomenon on a well-defined sample26 with end-
grafted PELs. Figure 2 shows several representative force-distance curves from desorption
measurements performed on a poly(acrylic acid) (PAA) monolayer. In Figure 2a a gold-
coated AFM tip and in Figure 2b a bare silicon nitride tip were used. The average number
of plateaus, i.e. the number of adhered polymers, were found to be comparable, but the
desorption force for the PAA chains from the gold-coated tip (95 ± 2 pN) clearly exceeded
the desorption force from the silicon nitride tip (65 ± 2 pN). In addition, the observed
bridging lengths were found to be correlated with the desorption force, i.e. longer plateaus
were found in the case of the gold-coated AFM tip.
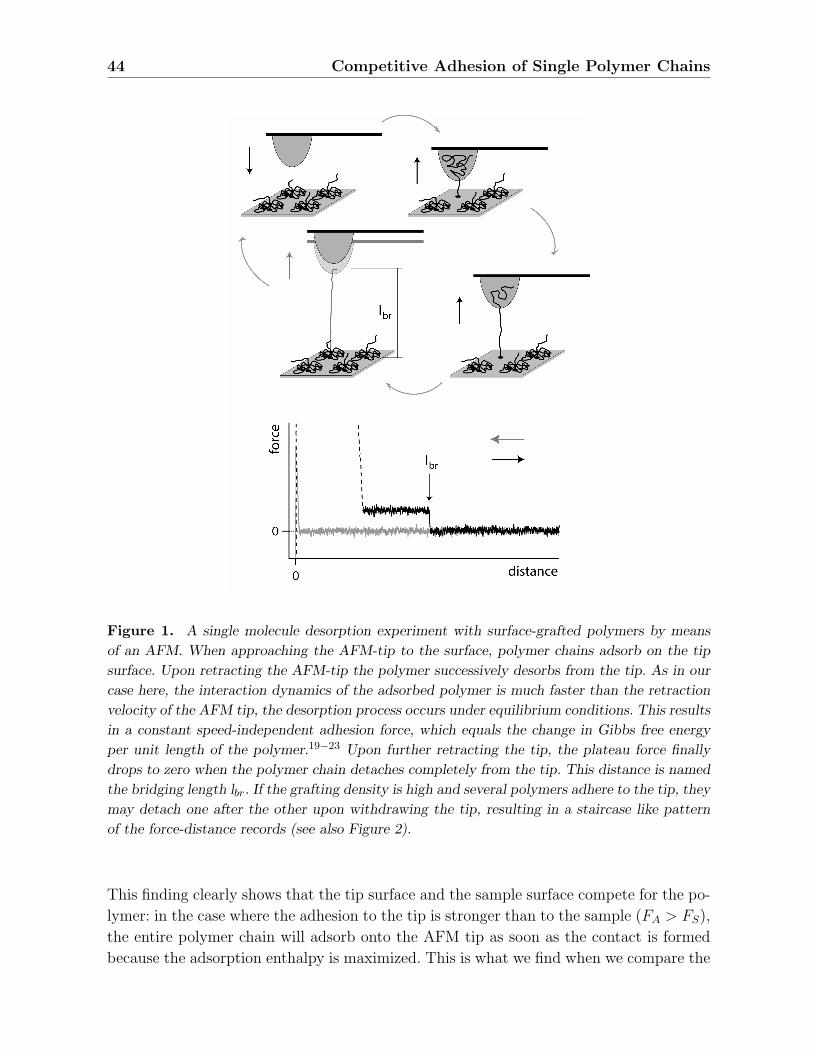
44 Competitive Adhesion of Single Polymer Chains
Figure 1. A single molecule desorption experiment with surface-grafted polymers by means
of an AFM. When approaching the AFM-tip to the surface, polymer chains adsorb on the tip
surface. Upon retracting the AFM-tip the polymer successively desorbs from the tip. As in our
case here, the interaction dynamics of the adsorbed polymer is much faster than the retraction
velocity of the AFM tip, the desorption process occurs under equilibrium conditions. This results
in a constant speed-independent adhesion force, which equals the change in Gibbs free energy
per unit length of the polymer.19−23 Upon further retracting the tip, the plateau force finally
drops to zero when the polymer chain detaches completely from the tip. This distance is named
the bridging length lbr. If the grafting density is high and several polymers adhere to the tip, they
may detach one after the other upon withdrawing the tip, resulting in a staircase like pattern
of the force-distance records (see also Figure 2).
This finding clearly shows that the tip surface and the sample surface compete for the po-
lymer: in the case where the adhesion to the tip is stronger than to the sample (FA > FS),
the entire polymer chain will adsorb onto the AFM tip as soon as the contact is formed
because the adsorption enthalpy is maximized. This is what we find when we compare the

45
Figure 2. Force-distance curves measured at randomly chosen positions on a poly(acrylic acid)
(PAA) monolayer grafted at a density of 1/460 nm−2 (“dilute” monolayer) with a gold-coated
tip (a) and a silicon nitride tip (b). Both measurement series were conducted in an aqueous
solution containing 100 mM NaCl at pH 6.
distribution of the measured bridging length as observed with the gold-coated tip with
the length distribution of the polymers determined by Gel Permeation Chromatography
(GPC-distribution) (see Figure 3a).
This excellent agreement between the bridging length measured by AFM and the contour
length determined by GPC nicely demonstrates that in this regime the AFM-based tech-
nique obviously is well suited to measure the length distribution of the grafted polymers
with superb precision, sensitivity and lateral resolution at a moderate experimental effort.
However, these experiments also suggest that a much more detailed picture on the internal
organization of the grafted polymer layer may be obtained if the adhesion between tip
and polymer is gradually reduced. If the adhesion of the polymers to the sample surface
is higher than to the tip (FA < FS) the polymer will maximize its coverage on the sample
surface. At the given adhesion enthalpies of 10-20 kBT/Kuhn length this will result in a
predominantly 2d conformation as was recently shown.27 However, if the coverage exceeds
a monolayer, no free surface is left and the remaining segments of the polymer are dangling
off the surface or, if the solvent is poor (which is not the case in our experiments here),
they may interact with the adsorbed monolayer. If such a surface is probed with an AFM
tip, only the dangling section of the polymer will adhere to the tip and as a consequence
only this section will bridge the gap between the two surfaces upon separation. This is

46 Competitive Adhesion of Single Polymer Chains
what we find when we probe the same sample as in Figure 3a (“dilute” PAA monolayer)
with a bare silicon nitride tip (see Figure 3b). The histogram of the bridging lengths is
clearly shifted towards shorter lengths.
If the model discussed above holds true, an increase in grafting density should reduce the
free area on the sample surface and as a result should lengthen the dangling section of
the grafted polymers. This was tested with a “dense” PAA monolayer, which had a graf-
ting density of σdense = 1/200 nm−2. An identical experiment as the one described above
resulted in the bridging length histogram in Figure 3c, which does not fully reproduce
the GPC-distribution but shows significantly longer bridging lengths than those measured
on the “dilute” sample. Again, already this qualitative result demonstrates that valuable
information on the vertical structure of the grafted layer may be obtained with this single
molecule approach.
A quantitative description of these effects will be developed in the following. The case
FA > FS needs no quantitative model: upon contact the entire length of the polymer is
“sucked” onto the tip and the polymer bridges with its full length. In the case FA < FS
only that section of the polymer adheres to the tip, which is not adsorbed to the sample
surface. Would the lateral mobility of the polymer at the sample surface be high, adjacent
polymers would compete for the bare surface and neighboring polymers would creep into
voids caused by fluctuations. In this case the polymer would be displaced at the surface
and would adsorb on the AFM tip with its entire length. From the findings in Figure 3
we would therefore conclude a low lateral mobility of the polymers on the sample surface.
In the case of the “dilute” monolayer the average distance between the grafting points
matches the end-to-end distance of the polymer in 3d. This way each polymer may in
the average occupy its projection area on the sample surface. Based on the Rouse-Zimm-
Model for polymers, the area which each polymer may adhere to is therefore on the order
of A = π · (R/2)2 with R = a1−ν · lνc . Therein a is the monomer length (0.25 nm for PAA),
lc the contour length and ν = 0.588 the critical exponent for a polymer in 3d.28 The
length of the surface adherent section of the polymer is then given by lS = A/b, where b
is the effective width of the polymer. In a densely packed monolayer this number will be
equal to the diameter of the polymer and any void in the packing will increase its value,
whereas loops will decrease it again.
If we take the GPC-distribution and the calculated lS as described above, we have to
assume a value of b = 1.5 nm in order to obtain the bridging length distribution drawn
in Figure 3b (solid line). With these values we find an excellent agreement between the
measured bridging length and our calculated distribution.
Whereas in the “dilute” monolayer the area per polymer was 460 nm2, it dropped in
the “dense” monolayer to 200 nm2 as determined by XPS. In average each polymer had
therefore in the “dense” monolayer an area of ∆A ≈ 260 nm2 less available to adsorb to
than in the “dilute” sample. The length of the adsorbed polymer section in the “dense”
monolayer is thus given by lS = (A−∆A)/b). For the calculation of the resulting bridging

47
Figure 3. Distribution of bridging lengths determined by AFM desorption measurements in
comparison with the molecular length distributions obtained by GPC: a) “dilute” PAA mo-
nolayer investigated with gold-coated AFM tip, b) “dilute” PAA monolayer with Si3N4-tip, c)
“dense” PAA monolayer with Si3N4-tip. Moreover, the AFM-results of b) and c) were fitted
with the described model: b=1.5 nm and ν = 0.588 (b) and ν = 0.553 (c). All measurements
were conducted in an aqueous solution containing 100 mM NaCl at pH 6.
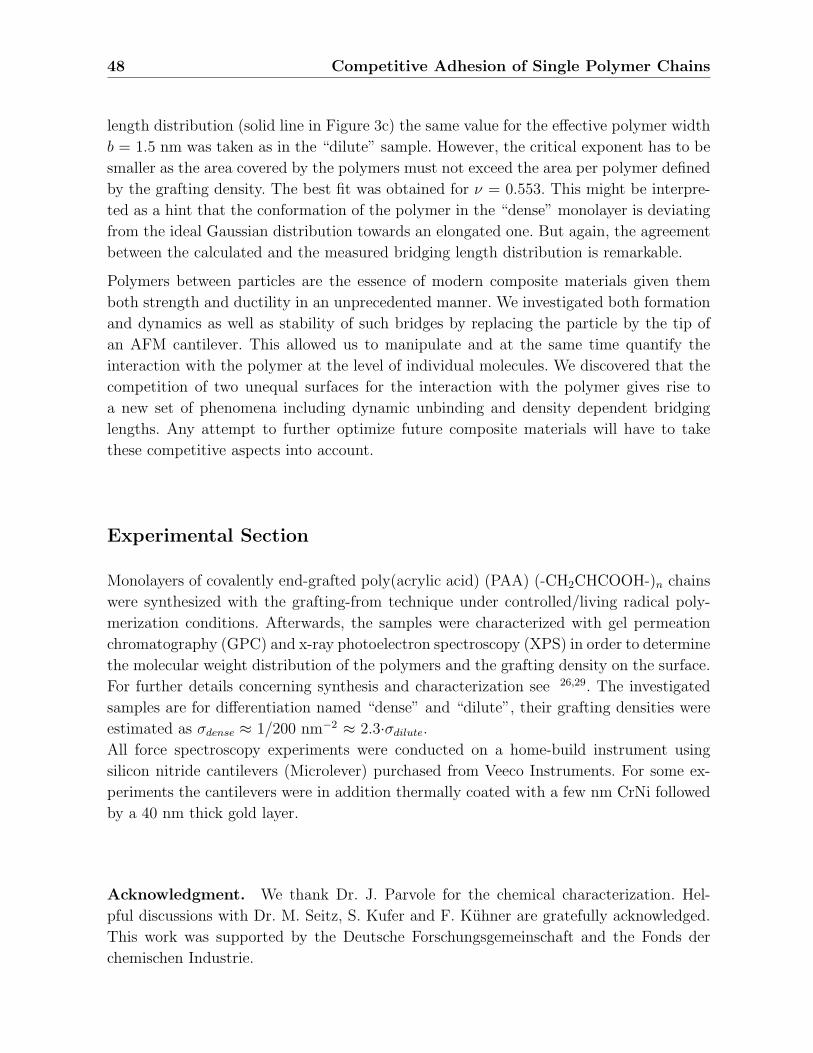
48 Competitive Adhesion of Single Polymer Chains
length distribution (solid line in Figure 3c) the same value for the effective polymer width
b = 1.5 nm was taken as in the “dilute” sample. However, the critical exponent has to be
smaller as the area covered by the polymers must not exceed the area per polymer defined
by the grafting density. The best fit was obtained for ν = 0.553. This might be interpre-
ted as a hint that the conformation of the polymer in the “dense” monolayer is deviating
from the ideal Gaussian distribution towards an elongated one. But again, the agreement
between the calculated and the measured bridging length distribution is remarkable.
Polymers between particles are the essence of modern composite materials given them
both strength and ductility in an unprecedented manner. We investigated both formation
and dynamics as well as stability of such bridges by replacing the particle by the tip of
an AFM cantilever. This allowed us to manipulate and at the same time quantify the
interaction with the polymer at the level of individual molecules. We discovered that the
competition of two unequal surfaces for the interaction with the polymer gives rise to
a new set of phenomena including dynamic unbinding and density dependent bridging
lengths. Any attempt to further optimize future composite materials will have to take
these competitive aspects into account.
Experimental Section
Monolayers of covalently end-grafted poly(acrylic acid) (PAA) (-CH2CHCOOH-)n chains
were synthesized with the grafting-from technique under controlled/living radical poly-
merization conditions. Afterwards, the samples were characterized with gel permeation
chromatography (GPC) and x-ray photoelectron spectroscopy (XPS) in order to determine
the molecular weight distribution of the polymers and the grafting density on the surface.
For further details concerning synthesis and characterization see 26,29. The investigated
samples are for differentiation named “dense” and “dilute”, their grafting densities were
estimated as σdense ≈ 1/200 nm−2 ≈ 2.3·σdilute.
All force spectroscopy experiments were conducted on a home-build instrument using
silicon nitride cantilevers (Microlever) purchased from Veeco Instruments. For some ex-
periments the cantilevers were in addition thermally coated with a few nm CrNi followed
by a 40 nm thick gold layer.
Acknowledgment. We thank Dr. J. Parvole for the chemical characterization. Hel-
pful discussions with Dr. M. Seitz, S. Kufer and F. Kuhner are gratefully acknowledged.
This work was supported by the Deutsche Forschungsgemeinschaft and the Fonds der
chemischen Industrie.

49
References
(1) R. R. Netz, D. Andelman, Phys. Rep. 2003, 380, 1.
(2) A. V. Dobrynin, M. Rubinstein, Prog. Polym. Sci. 2005, 30, 1049.
(3) D. Napper, Polymeric Stabilization of Colloidal Dispersion, Academic Press, New
York, 1983.
(4) J. H. Fendler, Chem. Mater. 1996, 8, 1616.
(5) J. F. Joanny, L. Leibler, P.-G. d. Gennes, J. Polym. Sci. B 1979, 17, 1073.
(6) G. Fritz, V. Schadler, N. Willenbacher, N. J. Wagner, Langmuir 2002, 18, 6381.
(7) H. W. Walker, S. B. Grant, J. Colloid Interface Sci. 1996, 179, 552.
(8) F. Lafuma, K. Wong, B. Cabane, J. Colloid Interface Sci. 1991, 143, 9.
(9) E. Dickinson, L. Eriksson, Adv. Colloid Interface Sci. 1991, 34, 1.
(10) J. Swenson, M. V. Smalley, H. L. M. Hatharasinghe, Phys. Rev. Lett. 1998, 81,
5840.
(11) S. T. Milner, Science 1991, 251, 905.
(12) B. Zhao, W. J. Brittain, Prog. Polym. Sci. 2000, 25, 677.
(13) M. Ballauff, O. Borisov, Curr. Opin. Colloid Interface Sci. 2006, 11, 316.
(14) X. Guo, M. Ballauff, Langmuir 2000, 16, 8719.
(15) S. Minko, Polym. Rev. 2006, 46, 397.
(16) T. Hugel, M. Seitz, Macromol. Rapid Commun. 2001, 22, 989.
(17) A. Janshoff, M. Neitzert, Y. Oberdorfer, H. Fuchs, Angew.Chem., Int. Ed. 2000,
39, 3213.
(18) L. Sonnenberg, J. Parvole, F. Kuhner, L. Billon, H. E. Gaub, Langmuir 2007, 23,
6660.
(19) X. Chatellier, T. J. Senden, J. F. Joanny, J. M. di Meglio, Europhys. Lett. 1998,
41, 303.
(20) T. Hugel, M. Grosholz, H. Clausen-Schaumann, A. Pfau, H. E. Gaub, M. Seitz,
Macromolecules 2001, 34, 1039.
(21) S. X. Cui, C. J. Liu, Z. Q. Wang, X. Zhang, Macromolecules 2004, 37, 946.
(22) C. Friedsam, H. E. Gaub, R. R. Netz, Europhys. Lett. 2005, 72, 844.
(23) F. Hanke, L. Livadaru, H. J. Kreuzer, Europhys. Lett. 2005, 69, 242.
(24) C. Friedsam, A. D. Becares, U. Jonas, M. Seitz, H. E. Gaub, New J. Phys. 2004,
6.
(25) M. Seitz, C. Friedsam, W. Jostl, T. Hugel, H. E. Gaub, ChemPhysChem 2003, 4,
986.
(26) J. Parvole, J. P. Montfort, G. Reiter, O. Borisov, L. Billon, Polymer 2006, 47,
972.
(27) F. Kuhner, M. Erdmann, H. E. Gaub, Phys. Rev. Lett. 2006, 97.
(28) P.-G. d. Gennes, Scaling Concepts in Polymer Physics, Cornell University Press,
USA, 1979.

50 Competitive Adhesion of Single Polymer Chains
(29) L. Sonnenberg, J. Parvole, O. Borisov, L. Billon, H. E. Gaub, M. Seitz,
Macromolecules 2006, 39, 281.

Langmuir 23 (2007), 6660-6666. 51
B Choose Sides: Differential Polymer Adhesion
Lars Sonnenberg, Julien Parvole, Ferdinand Kuhner, Laurent Billon
and Hermann E. Gaub
Langmuir 23 (2007), 6660-6666
Abstract
AFM-based single molecule desorption measurements were performed on surface end-
grafted poly(acrylic acid) monolayers as a function of the pH of the aqueous buffer to
study the adhesion properties of polymers that bridge two surfaces. These properties were
found to depend on the adhesion forces of both surfaces in a differential manner, which is
explained with a simple model in analogy to the Bell-Evans formalism used in dynamic
force spectroscopy. The measured interaction forces between the poly(acrylic acid) chains
and silicon nitride AFM tips depend on the grafting density of the polymer monolayers
as well as on the contour length of the polymer chains. This study demonstrates that the
stability of polymer bridges is determined by the adhesion strengths on both surfaces,
which can be tuned by using pH-dependent polyelectrolyte monolayers.
Introduction
The adhesion of polymers to solid surfaces is of central importance for many technological
applications. Thereby, polyelectrolyte molecules are of special interest since their water
solubility promises economical and ecological benefits. In adhesives not only does the in-
teraction with one surface count, but the polymers have to bridge two surfaces, which
may be of a different nature. Differential adhesion aspects may dominate here! The two
surfaces compete for the polymer to adhere, which eventually may result in a situation
where adhesion is strong but bridging is lost. From the scientific point of view, the adsorp-
tion of charged molecules to charged surfaces is far from being completely understood as
long-range Coulomb interactions play an important role and among other things complex
charge regulation mechanisms occur.1,2
The atomic force microscope (AFM) has been shown to be a powerful tool to stu-
dy the adhesion of single polymer molecules on solid supports by force spectrosco-
py measurements.3−7 Therein single polyelectrolyte (PEL) molecules were continuously
desorbed from a solid surface, and the corresponding desorption force was analyzed. Inte-
restingly, the molecules show a high lateral mobility on the surface and simultaneously a

52 Choose Sides: Differential Polymer Adhesion
high adsorption energy on the order of 10-20 kBT ,8 a combination of adhesion properties
with particular relevance for polymer coatings.
The studies investigating the polyelectrolyte desorption from solid supports showed that
the desorption force can be measured reproducibly and with high precision. However, as
the measured desorption force is only depending on the interaction of the polymer with
the surface from which it is desorbed, differential aspects of the adhesion cannot be mo-
nitored. Instead, the appropriate experimental parameter to monitor the competition of
the two surfaces is the length of the bridging segment as it is directly correlated with the
lengths of the surface adsorbed segments.
Here we show that the adsorption properties of polymer chains bridging two surfaces are
dependent on the adhesion forces of both surfaces. In detail, the adhesion strength bet-
ween end-grafted poly(acrylic acid) (PAA) chains and silicon nitride (Si3N4)AFM tips was
modulated via a pH variation of the aqueous solution. As a result, the measured bridging
length is increased or decreased, respectively. In order to explain the experimentally ob-
served correlation of bridging length and desorption force, we present a model in analogy
to the Bell-Evans formalism used in dynamic force spectroscopy.
The measured pH-dependence of the desorption force resembles the pH-dependent degree
of dissociation of the PAA chains.We show that the density of polymer chains on the
surface has an effect on the obtained desorption forces and thus on the dissociation equi-
librium. In addition, the desorption forces were found to depend on the contour length of
the polymer chains.
Materials and Methods
Surface End-Grafted Poly(acrylic acid) Monolayers. The synthesis and chemical
characterization of surface end-grafted poly(acrylic acid) (PAA) monolayers as used in
this study is described in detail in refs 9 and 10. In brief, the “grafting-from technique”
was used to prepare the PAA (-CH2CHCOOH-)n monolayers. The polymerization initia-
tor was covalently bound via monochlorosilane headsgroups to the inorganic substrate
(silicon wafer) and the PAA chains were synthesized under controlled/living radical po-
lymerization conditions. The grafting density was afterward adjusted by partial cleavage
of the PAA chains from the surface. An ester group that connects the initiator and the
silane anchor group acts herein as a break-seal group.
Gel permeation chromatography (GPC) and X-ray photoelectron spectroscopy (XPS) we-
re applied to the samples to determine the molecular weight of the PAA chains and to
estimate their grafting density on the surface. This characterization opens up the possi-
bility to directly compare GPC and AFM results obtained on the same samples.
In the following, it is referred to two PAA monolayer samples, which are for differentiation
named “dense” (D) and “dilute” (d). The PAA chains from the “dense” monolayer have an
average contour length of 〈lc〉D ≈ 590 nm and a polydispersity of PDD = 1.3. The “dilute”

Langmuir 23 (2007), 6660-6666. 53
sample consists of PAA chains with an average contour length 〈lc〉d ≈ 450 nm and PDd =
1.24. The grafting densities were estimated as follows: σD ≈ 0.005 molecule/nm2 ≈ 2.3σd.
AFM Desorption Experiments. In AFM-based desorption measurements using end-
grafted polymer monolayers, single polymer chains are adsorbed on the tip of an AFM
cantilever and successively desorbed from the tip by separating the AFM tip and sam-
ple surface (see Figure 1). With these experiments, we are able to probe a multitude of
polymers grafted from a flat surface with the very same tip as follows: When approa-
ching a bare AFM tip the chains will adsorb on the AFM tip as they gain adsorption
enthalpy. Upon retraction of the AFM tip, the polymers successively desorb in an equi-
librium process, which is due to a much faster dynamics of the surface-polymer contacts
in comparison to the retraction velocity of the AFM tip (ca. 1 µm/s). The polymers are
not pinned to the AFM tip but highly mobile; that is, the adsorbed polymer segment is
able to slide on the tip surface.8 This means that the heterogeneities of the tip surface
are not reflected in the measured force as the polymer rearranges during the desorption
in order to maximize its adsorption enthalpy. The corresponding force-distance curves
thus show plateaus of constant force representing the desorption process. As the complete
desorption of a polymer chain is indicated by a drop in force, the number of desorbed
molecules equals the number of observed plateaus, and the absolute distance at which a
force drop occurs states the bridging length lbr. At high adsorption strengths, the polymer
chain stays adsorbed until the end segment detaches, and the bridging length therefore
represents the contour length of the polymer. Lateral displacements of the grafting point
on the sample surface and the tip apex shorten the bridging length in comparison to the
contour length of the polymer chain. However, in the case of contour lengths on the order
of several hundred nanometers as used here (i.e., at length scales much larger than the
end-to-end distance of the polymer chains), this effect becomes negligible.
The height of the force plateau represents the magnitude of the desorption force between
the PEL chain and the surface, the mean desorption force is obtained by a statistical
analysis. The desorption force histograms typically show values for the full width at half-
maximum (fwhm) of ca. 6 pN, which enables a determination of the desorption forces
with 1-2 pN precision. The analysis of the desorption forces is a bit more complicated
here as the desorption forces are slightly dependent on the bridging length. From one
measurement series, all plateaus are analyzed in terms of bridging length, but only the
last plateau is considered for the desorption force as here no intermolecular interaction
can adulterate the polymer-surface interaction. The desorption force is then taken from
the bridging length that corresponds to the maximum position of the bridging length
distribution.
All desorption experiments were conducted with a custom-made instrument using sili-
con nitride (Si3N4) cantilevers (Microlever) purchased from Veeco Instruments. Nominal
spring constants were calibrated using the thermal oscillation method.11 Note that the

54 Choose Sides: Differential Polymer Adhesion
calculated spring constants may have deviations of up to 10%; therefore, measurements
series were performed with the same cantilever for being able to monitor minute force
differences.
Figure 1. (a) Schematics of a single molecule desorption experiment with surface end-grafted
polymers by means of an AFM. (b) Typical records of the de-adhesion force measured upon
retracting the tip from the surface. A plateau represents a polymer sliding off the tip. The
number of plateaus equals the number of desorbed polymer chains. (c) Statistical analysis of
the bridging length lbr and the desorption force FA. The distribution of the bridging length is
a function of the molecular length distribution of surface-grafted chains. The histogram of the
desorption force can be fit by a Gaussian distribution with typical values for fwhm of ca. 6 pN.
Histograms were taken from the “dilute” monolayer at pH 6.
Langmuir 23 (2007), 6660-6666. 55
Before the measurements, the Si3N4 tips were cleaned with UV light, and control measu-
rements on the interaction of the AFM tips with bare silica substrates were performed in
order to exclude contaminations of the tip surface. In the desorption experiments, only
these bare Si3N4 tips were used. The experiments were conducted in aqueous solution
containing 100 mM NaCl, and typically at least 1000 force-distance curves were measured
on different spots on the surface to ensure that a representative ensemble of molecules is
probed.
Theoretical Basis
Differential Polymer Adhesion Model. In a desorption experiment as described
above, the PEL chain is not only able to interact with the AFM tip but also with the
sample surface on which the polymers are grafted (see Figure 2). The resulting competi-
tion of the two surfaces for the polymer to adhere affects the measured bridging length.
In contrast to that, the measured desorption force is only depending on the interaction of
the polymer molecule with the desorbing surface.
In the case of an AFM tip in the vicinity of the sample surface, the molecule will only
adsorb onto the tip surface when it is energetically favorable. In a simple perception, the
adhesion force of the polymer chain with the AFM tip FA (which equals the adhesion
enthalpy per unit length) has to exceed the adhesion force with the substrate FS. The
length of the polymer chain, which then adsorbs on the AFM tip is denoted by lads. When
retracting the AFM tip, monomers of the polymer chain are successively desorbed from
the AFM tip surface and the overall adsorption energy is reduced proportional to FA.
However, at a certain tip-substrate separation d, which here is called the equilibrium di-
stance deq, the equilibrium adsorption enthalpies of the remaining adsorbed segment on
the AFM tip and of the polymer chain completely adsorbed on the substrate are equal:
deq = (1− FS/FA)lads. When further enlarging the tip-substrate separation, d, the conti-
nuous desorption from the tip is energetically not favorable to the complete detachment
of the remaining adsorbed segment from the AFM tip any more. Nevertheless, this meta-
stable desorption of monomers from the tip is still likely as the two states are separated
by an energy barrier, which has to be overcome by thermal fluctuations. The probability
that the system manages to overcome the energy barrier is thereby increased by further
desorbing monomers from the AFM tip as the height of the energy barrier is proportional
to the number of adsorbed monomers. In this distance regime, d > deq, a nonequilibrium
process next to the continuous desorption process under equilibrium conditions has to
be considered: the instantaneous and complete detachment of the adsorbed part of the
polymer chain from the AFM tip.
In the framework of a two-state model comprising an adsorbed and a detached confor-
mation, the instantaneous complete detachment of the adsorbed polymer segment can
be treated in close analogy to the dissociation process known for example from breaking

56 Choose Sides: Differential Polymer Adhesion
Figure 2. Model for differential polymer adhesion showing the adsorption energy vs the distance
d of the two surfaces. The polymer chain is grafted at surface S and allowed to interact with
both surfaces, A and S. Only if the adsorption force of A (FA) is higher than the adsorption
force of S (FS), the polymer chain will adsorb on A with the length lads. When successively
desorbing the polymer chain from A, the adsorption energy is reduced proportional to FA until
the equilibrium distance deq is reached at which the adsorption energy of the remaining adsorbed
segment equals the adsorption energy if the polymer would be completely adsorbed on S. Thus,
from this distance on it is energetically not favorable for the adsorbed polymer segment to stay
adsorbed at A. The system is now in a metastable state. Thermal fluctuations may detach the
remaining adsorbed segment and as a consequence, the measured (bridging) length becomes
dependent on the difference of the adsorption forces between both surfaces.
ligand-receptor bonds. Thus, a model in analogy to the Bell-Evans formalism12,13 widely
used in dynamic force spectroscopy is proposed here (see Figure 2). It is therein assumed
that the dissociation process is determined by the difference in adsorption forces of the
two surfaces ∆F = FA − FS. The distance-dependent thermal off-rate koff is then given
as
koff (d) = k0 · exp
((d− lads) ·∆F
kBT
)(1)
with the attempt frequency k0, the length of the adsorbed polymer lads, and the thermal
energy kBT . The probability function P (d) for the detached state is then given by
P (d) = 1− exp
(−1
v
∫ d
d0
koff (l) dl
)(2)

Langmuir 23 (2007), 6660-6666. 57
wherein v = dd/dt describes the retraction velocity of the AFM tip during the experiment,
which is experimentally adjusted. The probability density function p(d), which describes
the probability to find a detachment event at a distance d, becomes
p(d) =dP (d)
dd=
koff (d)
v· exp
(−1
v
∫ d
d0
koff (l) dl
)(3)
The probability density function of the surface-grafted polymer monolayer can in principle
be directly adjusted to the measured distribution of bridging lengths. Therefore, the follo-
wing parameters have to be determined: the adsorbed length lads, the attempt frequency
k0, and the adsorption force of the polymer with the substrate FS. FA representing the
interaction of the molecule with the AFM tip is directly measured in the experiment as
it is given by the height of the force plateau in the force-distance curves.
A calculation of the probability density function for distinct values of ∆F is given in
Figure 3, wherein lads = 590 nm, k0 = 108 s−1, and v = 1 µm/s are assumed. These
values correspond to the average length of a polymer chain in the “dense” monolayer, the
retraction velocity used in the experiments, and the time scale of fluctuations of a Kuhn
segment in a polymer chain (1-10 ns).14,15
Figure 3. Calculated probability density functions p(d) for distinct values of the difference
in adsorption forces ∆F = FA − FS according to the proposed model for differential polymer
adhesion. The adsorbed length is set to 590 nm, the attempt frequency to 10 8 s−1 and the
retraction velocity to 1 µm/s.
It can be seen that a notable decrease of the bridging length only occurs if the adsorption
forces of the two surfaces are quite similar. Already at a force difference ∆F = 4 pN
the bridging length resembles the adsorbed length lads. Moreover, a decrease in bridging
length is associated with a broadening of the probability density function. An average
bridging length 〈lbr〉 can be defined as the maximum position of the probability density

58 Choose Sides: Differential Polymer Adhesion
function p(d) or the measured distribution of bridging lengths, respectively
〈lbr〉 =kBT
∆F· ln
(v ·∆F
k0 · kBT
)+ lads = ∆l + lads (4)
In conclusion, the bridging length is expected to shorten in comparison to lads when the
adhesion forces of both surfaces become similar. The shortening of the bridging length is
in the following also denoted as length shift ∆l < 0.
Results and Discussions
Correlation between Desorption Force and Bridging Length. The aim of this
section of the paper is to compare the experimental results with the proposed differential
polymer adhesion model (i.e., to point out that differential aspects due to the simultaneous
interaction of the polymer with two surfaces have to be considered). For the modeling
according to eq 4, a shift ∆l of the measured bridging length has to be observed. This can
be achieved by varying the pH of the aqueous solution because the electrostatic properties
of PAA as a weak polyelectrolyte can be tuned by the solution pH.9
The most important prerequisite of the proposed model is a correlation between the length
shift ∆l and the difference in desorption forces of both surfaces ∆F . From the experimental
point of view ∆F is unknown and only the desorption force FA can be directly measured
in the experiments. Thus, in Figure 4 the length shift ∆l = 〈lbr〉 − lads is displayed versus
the corresponding desorption force FA as observed at different pH values of an aqueous
solution. Each data point of Figure 4 is based on a measurement series of about 1000 force-
distance curves (see also Figure 1). Moreover data gained from two PAA monolayers of
different grafting densities are shown. For both samples, the observed bridging lengths
are an increasing function of the desorption force. Two main regimes can be distinguished
as follows: In the case of pronounced length shifts (∆l < -50 nm), small variations of the
desorption force have large impact on the length shift, whereas for small length shifts
(∆l > -50 nm), ∆l is getting less sensitive to an increase of the desorption force.
The dependence of the length shift on the desorption force is in very good agreement with
the predictions of the model. The solid lines in Figure 4 are calculated curves based on
formula 4 assuming a pH-independent FS of 63.4 pN for the “dilute” and 66.8 pN for the
“dense” sample. An attempt frequency of k0 = 108 s−1 was used.
These results already show that polymer bridging is a differential process comprising both
surfaces as the bridging length is a function of the interaction force. The validity of the
proposed model can be further tested because a length shift should go hand in hand with
a broadening of the measured bridging length distribution (see Figure 3). This broadening
should be most pronounced for large length shifts. Thus, in Figure 5, the bridging length
distributions for the maximal observed length shift of ∆l ≈ -140 nm as obtained with
the “dilute” and the “dense” PAA monolayer are displayed. In addition the distributions

Langmuir 23 (2007), 6660-6666. 59
Figure 4. Length shift ∆l as obtained with desorption measurements at varying pH in depen-
dence of the measured desorption force FA. The correlation of the two parameters is qualitatively
in very good agreement with formula 4, when FS is considered constant.
of adsorbed lengths are displayed (dashed lines in Figure 5), which correspond according
to the definition to ∆l ≈ 0 nm. The distribution of adsorbed lengths and its correlation
with the molecular length distribution of the PAA monolayer is discussed in detail in a
separate study (manuscript in preparation).
On the basis of eq 3, length distributions can be calculated and directly compared to the
measured distributions of bridging lengths. Thereby, two model parameters have to be
taken into account: the attempt frequency k0 and the force difference between the two
surfaces ∆F . In the following, an attempt frequency of k0 = 108 s−1 was assumed and
∆F remained the only fit parameter. The best agreement of the resulting calculations
(solid lines in Figure 5) and the bridging length histogram was found for ∆F ≈ 0.5 pN
in both cases. This observation is qualitatively in agreement with the proposed model as
a similar value for ∆l has to be associated with a similar value for ∆F . This very good
agreement between model and experiment shows that the model described above is a good
approximation for differential aspects of polymer adhesion.
pH-Dependent Desorption Forces. The main advantage of AFM-based desorption
measurements is the quantification of the interaction between polymer and surface with
very high precision and the possibility to resolve various contributions to the desorpti-
on force (e.g., from electrostatic interactions4,5). In this section of the paper, we use this
strength to conclude the pH-dependent charge density of the PAA chains from the desorp-
tion forces as a function of the solution pH.
In general, the desorption force of a charged polymer on a charged surface consists of
a Coulomb and a non-Coulomb contribution. The electrostatic desorption force Fel is in
Debye-Huckel approximation given as Fel ∝ κ−1στ with the Debye screening length κ−1,
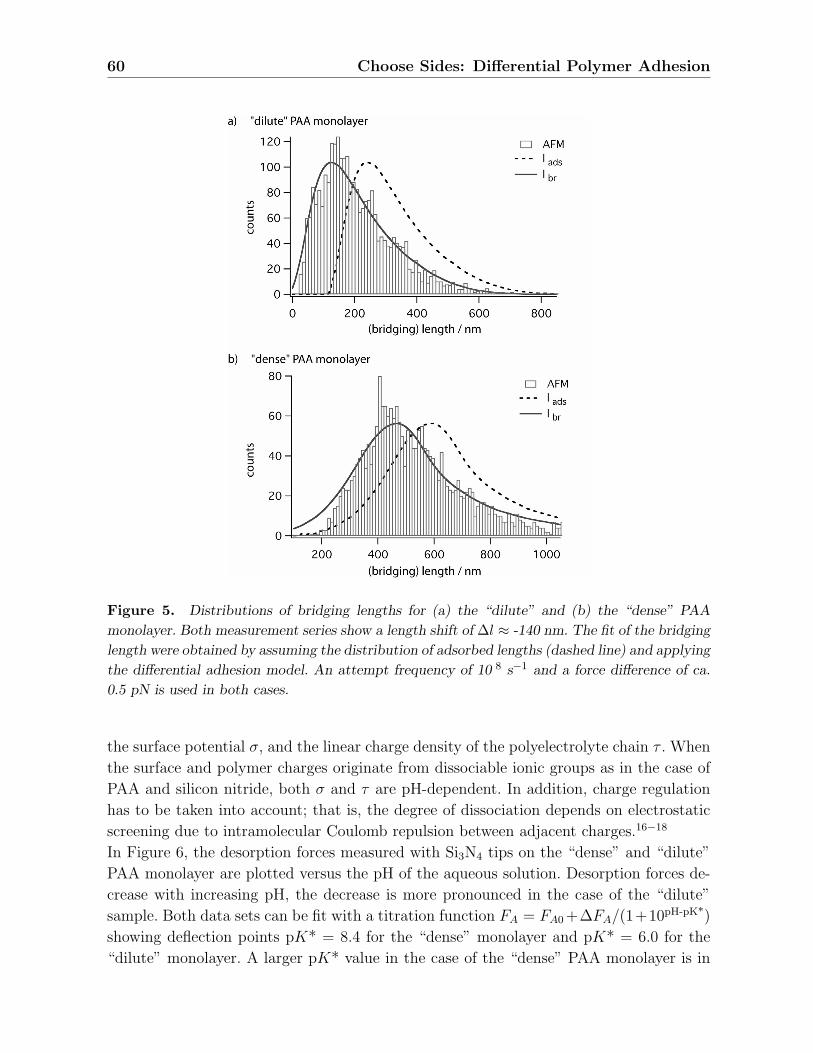
60 Choose Sides: Differential Polymer Adhesion
Figure 5. Distributions of bridging lengths for (a) the “dilute” and (b) the “dense” PAA
monolayer. Both measurement series show a length shift of ∆l ≈ -140 nm. The fit of the bridging
length were obtained by assuming the distribution of adsorbed lengths (dashed line) and applying
the differential adhesion model. An attempt frequency of 10 8 s−1 and a force difference of ca.
0.5 pN is used in both cases.
the surface potential σ, and the linear charge density of the polyelectrolyte chain τ . When
the surface and polymer charges originate from dissociable ionic groups as in the case of
PAA and silicon nitride, both σ and τ are pH-dependent. In addition, charge regulation
has to be taken into account; that is, the degree of dissociation depends on electrostatic
screening due to intramolecular Coulomb repulsion between adjacent charges.16−18
In Figure 6, the desorption forces measured with Si3N4 tips on the “dense” and “dilute”
PAA monolayer are plotted versus the pH of the aqueous solution. Desorption forces de-
crease with increasing pH, the decrease is more pronounced in the case of the “dilute”
sample. Both data sets can be fit with a titration function FA = FA0 +∆FA/(1+10pH-pK*)
showing deflection points pK* = 8.4 for the “dense” monolayer and pK* = 6.0 for the
“dilute” monolayer. A larger pK* value in the case of the “dense” PAA monolayer is in

Langmuir 23 (2007), 6660-6666. 61
qualitative agreement with the proposed model of differential adhesion as the bridging
length also decreases at higher pH for the “dense” monolayer (data not shown). It should
further be noted that with the “dilute” sample at pH < 6 additional desorption forces
were obtained that are significantly smaller than expected from the titration behavior
(points χ1 and χ2 in Figure 6).
Figure 6. Desorption forces as obtained with Si3N4 tips and the “dilute” and “dense” PAA
monolayer in dependence on the solution pH. Errors bars represent the fwhm of the force histo-
grams. Both data sets were fit with a titration function (solid lines). The two measurement series
were taken with different AFM tips. To take small force differences due to the spring constant
calibration into account, the desorption forces were adjusted such that the fit functions overlay
at pH 3.
The decrease of the desorption force with increasing pH value can be explained with in-
creasing electrostatic repulsion of the negatively charged PAA chain and the negatively
charged tip surface (the pK of the surface OH groups is around 2-3). The electrostatic
desorption force is negative in the case of Coulomb repulsion and therefore lowers the
overall desorption force when Coulomb interactions are increased. The observed behavior
in Figure 6 is most probably strongly correlated with the pH-dependent dissociation of
the carboxylic groups in the PAA chains as the typical titration function associated with
dissociation reactions is able to reproduce the data. However, as the surface charge of
the AFM-tip may also be increased with increasing pH, the deflection points pK* of the
titration fits do not necessarily correspond to the apparent pK of the PAA chains.
The difference of the pK* values in dependence on the grafting density of chains on the
sample surface may be explained by Coulomb interactions between adjacent charges. It
is well-known that the electrostatic repulsion between charges along the polyelectrolyte
chain counters the dissociation reaction of the ionic groups. The apparent pK value of a
PAA chain is therefore larger than the pK of a single carboxylic group. One may speculate
that the electrostatic repulsion between neighboring PAA chains also lowers the molecu-

62 Choose Sides: Differential Polymer Adhesion
les’ degree of dissociation. This intermolecular electrostatic repulsion should be absent
for isolated polymer chains and should increase with increasing grafting density. For the
“dilute” and “dense” PAA monolayer separated polymers and overlapping molecules are
expected when a 3d conformation of the polymer chains on the surface is assumed. In
this model, intermolecular interactions would lower the degree of dissociation of the po-
lymer chains in the “dense” sample, whereas intermolecular electrostatic repulsion would
be mainly negligible in the “dilute” sample. This would result in a grafting density de-
pendent pK* value. However, it should be noted that this is most probably not true any
more for higher grafting densities in the regime of dense polyelectrolyte brushes.19,20
At this point, it is important to emphasize that the considerations above did not include
the impact of the AFM tip. The PAA chains adsorb on the tip surface as they gain free
enthalpy. Thereby, the degree of dissociation of the adsorbed polymer might be affected:
As soon as the polymer adsorbs on the AFM tip, the molecule is isolated and its disso-
ciation is not dependent any more on the conformation in the polymer monolayer. As a
consequence, the charge density of the polymer will probably be increased. However, once
the PAA chain is adsorbed on the negatively charged tip surface, an increase in polymer
charge density would lead to an increased Coulomb repulsion and thus to a reduction
of the overall adsorption enthalpy. From the results displayed in Figure 6, we therefore
conclude that the polymer tries to maximize its adsorption enthalpy such that a redu-
ced dissociation of the PAA due to the conformation on the sample surface is conserved
upon adsorption on the silicon nitride AFM tip. That is, the degree of dissociation of
the adsorbed PAA polymer resembles the degree of dissociation of the polymer in the
monolayer before adsorption on the tip. As a consequence, conclusions on the dissociation
equilibrium of polyelectrolytes in a monolayer can be drawn from the desorption forces
as obtained with AFM-based single molecule force spectroscopy.
In the following, a comment on the very different desorption forces that were found for
the “dilute” PAA monolayer at pH < 6 (points χ1 and χ2) is given. Most importantly in
the context of this work, the observed bridging lengths that correspond to the very dif-
ferent desorption forces are in perfect agreement with the proposed model for differential
polymer adhesion. A high/low desorption force results in a large/small bridging length. A
very similar observation was made on the “dense” monolayer, namely a bimodal bridging
length distribution was observed at pH 4 and 5.9 It was discussed that water becomes a
bad solvent for PAA in this pH regime and that theoretical studies predict a coexistence
of collapsed and noncollapsed chain conformations under this conditions.21,22
Contour Length Dependent Desorption Forces Analyzed at the Level of In-
dividual Polymers. The conceptual strength of single molecule experiments is the
option to sort data according to certain criteria and to achieve information that might
be hidden in the ensemble averaging of bulk experiments. In this section of the paper we
make extensively use of this option, since in addition to the ensemble properties discussed

Langmuir 23 (2007), 6660-6666. 63
above, minute differences in the desorption forces were found on the level of individual
PAA molecules.
First of all it should be noted that the observed contour length dependent effects are
minute effects, differences of the desorption force are just on the order of a few pN. Ex-
pressed in terms of adhesion enthalpy these differences correspond to less than 0.5 kBT
per monomer. In Figure 7, force-distance curves are shown, which were sorted according
to the desorption forces (see scale in Figure 6). The curves in Figure 7a were taken from
“dilute” PAA monolayer data and represent the case of “low” desoprtion forces. Flat
plateaus were observed for all bridging lengths, whereas the desorption force was found
to increase with bridging length. This is most visible in the inset where the individual
desorption plateau forces were extracted from the curves and plotted wih the dependence
of the bridging lengths. In Figure 7b, curves from the “intermediate” force regime and the
“dense” PAA monolayer are shown. Therein the plateau force was found to be constant
(see inset Figure 7b). At “high” desorption forces, which correspond from the discussion
above to uncharged polymer chains, a second effect occurs. In the curves in Figure 7c
observed with the “dense” PAA monolayer, it can be seen that the desorption force de-
creases during the desorption process. In this case, the plateau forces seem to overlay at
zero distance.
The desorption forces in dependence on the bridging lengths as shown in the insets of Fi-
gure 7 were fit with a linear regression, FA = F0 +(dFA/dlbr)lbr. Figure 8 shows the values
of the obtained slopes dFA/dlbr plotted versus the mean desorption forces (see Figure 6).
The slopes, which represent the magnitude of the contour length dependent effect on the
desorption forces, are decreasing continuously with desorption force.
The observed length dependent desorption force may be explained by contour length de-
pendent variation of the degree of dissociation. If the force decrease as displayed in Figure
6 is related to enhanced electrostatic interactions, the Coulomb repulsion is most pro-
nounced at “low” desorption forces (Figure 7a). Contour-length dependent effects that
are caused by a slightly varying degree of dissociation should best be visible in this force
regime. The results from Figure 7a would then be interpreted with a slightly decreasing
degree of dissociation of PAA chains with increasing contour length as was also observed
with titration experiments.23 If the argument of contour length dependent polymer charge
densities holds true, this effect has to attenuate when the electrostatic interaction is de-
creased (i.e., at higher desorption forces). This is what we observe as continuous decrease
of this effect as illustrated in Figure 8 until it is not detectable any more (see Figure 7b).
However, at higher desorption forces, which are related to uncharged PAA chains, a se-
cond effect, namely decreasing force plateaus (see Figure 7c), occurs. The fact that the
plateau forces are equal at zero distance indicate that the underlying mechanism does not
depend on the length of the adsorbed segment but on the length of the bridging segment.
How this should effect the plateau force is unclear. The resulting negative slopes in Figure
8 suggest the continuous transition as described above.

64 Choose Sides: Differential Polymer Adhesion
Figure 7. Force-distance curves from different regimes of desorption forces (see scale in Figure
6): (a) was extracted from data of the “dilute” PAA monolayer, (b and c) from “dense” PAA
monolayer data. The desorption forces FA in dependence of the bridging lengths lbr are shown
in the insets.

Langmuir 23 (2007), 6660-6666. 65
Figure 8. Desorption forces FA as a function of the bridging length lbr (see insets of Figure 7)
were fit according to FA = F0 + (dFA/dlbr)lbr. The values of the obtained slopes dFA/dlbr are
plotted versus the mean desorption force FA.
Conclusions
We demonstrated that the adhesion properties of bridging polymers are dependent on
the interaction with both surfaces in a differential manner. In the AFM-based single
molecule desorption experiments surface end-grafted PAA chains were allowed to adsorb
on an AFM-tip and the maximum bridging length was determined upon retracting the
cantilever. The impact of the second surface was clearly shown by a manipulation of the
polymer surface interaction via changing the pH of the aqueous solution, which led to large
differences of the bridging length distributions. The experimental results were found to be
in very good agreement with a model for differential polymer adhesion in analogy to the
Bell-Evans formalism. The findings are of general importance for all applications where
polymer bridging occurs but with special impact in the case of similar surface properties.
Moreover we showed that the desorption force as a function of the solution pH and thus
of the degree of dissociation of the PAA chains depends on the grafting density of the
polymer monolayers. The dissociation was reduced at higher grafting density. Differences
in the interaction force were also found on the level of individual polymers showing that
the desorption force is also depending on the contour length of the polymer chains.
Acknowledgment. Helpful discussions with Prof. Thorsten Hugel (TU Munchen) and
Dr. Markus Seitz are gratefully acknowledged. This work was supported by the Deutsche
Forschungsgemeinschaft (SFB 486) as well as DAAD and EGIDE (Procope).

66 Choose Sides: Differential Polymer Adhesion
References
(1) Netz, R. R.; Andelman, D. Phys. Rep. 2003, 380, 1-95.
(2) Dobrynin, A. V.; Rubinstein, M. Prog. Polym. Sci. 2005, 30, 1049-1118.
(3) Chatellier, X.; Senden, T. J.; Joanny, J. F.; di Meglio, J. M. Europhys. Lett. 1998,
41, 303-308.
(4) Hugel, T.; Grosholz, M.; Clausen-Schaumann, H.; Pfau, A.; Gaub, H.; Seitz, M.
Macromolecules 2001, 34, 1039-1047.
(5) Seitz, M.; Friedsam, C.; Jostl, W.; Hugel, T.; Gaub, H. E. Chem. Phys. Chem.
2003, 4, 986-990.
(6) Friedsam, C.; Becares, A. D.; Jonas, U.; Seitz, M.; Gaub, H. E. New J. Phys. 2004,
6.
(7) Cui, S. X.; Liu, C. J.; Wang, Z. Q.; Zhang, X. Macromolecules 2004, 37, 946-953.
(8) Kuhner, F.; Erdmann, M.; Sonnenberg, L.; Serr, A.; Morfill, J.; Gaub, H. E.
Langmuir 2006, 22, 11180-11186.
(9) Sonnenberg, L.; Parvole, J.; Borisov, O.; Billon, L.; Gaub, H. E.; Seitz, M.
Macromolecules 2006, 39, 281-288.
(10) Parvole, J.; Montfort, J. P.; Reiter, G.; Borisov, O.; Billon, L. Polymer 2006, 47,
972-981.
(11) Butt, H. J.; Jaschke, M. Nanotechnology 1995, 6, 1-7.
(12) Evans, E.; Ritchie, K. Biophys. J. 1997, 72, 1541-1555.
(13) Bell, G. I. Science 1978, 200, 618-627.
(14) Kimmich, R.; Fatkullin, N. Adv. Polym. Sci. 2004, 170, 1-113.
(15) Tang, J.; Lin, S. H. Phys. Rev. E 2006, 73.
(16) Friedsam, C.; Gaub, H. E.; Netz, R. R. Europhys. Lett. 2005, 72, 844-850.
(17) Boroudjerdi, H.; Kim, Y. W.; Naji, A.; Netz, R. R.; Schlagberger, X.; Serr, A.
Phys. Rep. 2005, 416, 129-199.
(18) Netz, R. R. J. Phys.: Condens. Matter 2003, 15, S239-S244.
(19) Ahrens, H.; Forster, S.; Hehn, C. A.; Kumar, N. A.; Naji, A.; Netz, R. R.;
Seidel, C. J. Phys. Chem. B 2004, 108, 16870-16876.
(20) Ruhe, J.; Ballauff, M.; Biesalski, M.; Dziezok, P.; Grohn, F.; Johannsmann, D.;
Houbenov, N.; Hugenberg, N.; Konradi, R.; Minko, S.; Motornov, M.; Netz, R. R.;
Schmidt, M.; Seidel, C.; Stamm, M.; Stephan, T.; Usov, D.; Zhang, H. N. Adv.
Polym. Sci. 2004, 165, 79-150.
(21) Raphael, E.; Joanny, J. F. Europhys. Lett. 1990, 13, 623-628.
(22) Zhulina, E. B.; Borisov, O. V.; van Male, J.; Leermakers, F. A. M. Langmuir 2001,
17, 1277-1293.
(23) Hackley, V. A. J. Am. Ceram. Soc. 1997, 80, 2315-2325.

Macromolecules 39 (2006), 281-288. 67
C AFM-Based Single Molecule Force Spectroscopy
of End-Grafted Poly(acrylic acid) Monolayers
Lars Sonnenberg, Julien Parvole, Oleg Borisov, Laurent Billon, Hermann E. Gaub and
Markus Seitz
Macromolecules 39 (2006), 281-288
Abstract
AFM-based single molecule force spectroscopy has been applied to study the detachment
of poly(acrylic acid) (PAA) chains preadsorbed onto a silicon nitride tip surface at varied
pH. In particular, monolayers of end-grafted chains prepared by nitroxide-mediated poly-
merization initiated from silica substrates were brought into close contact with the silicon
nitride tip of an AFM. The detachment of PAA chains from the tip surface is reflected
by a set of constant-force plateaus in the AFM force spectra. From those, comprehensive
information about the molecular length distribution of surface-grafted polymers, about
their conformation, and about their interaction with the tip as a function of pH is dedu-
ced. At neutral pH, the plateau-length distribution well reproduces the molecular weight
distribution of the grafted polymers as obtained by GPC. At high pH, increasing elec-
trostatic repulsion between PAA and the tip surface reduces the strength of adsorption,
which is manifested in a decrease of average plateau lengths and measured detachment
forces. At low pH, complex force spectra and a bimodal distribution of apparent molecular
lengths are obtained, reflecting the poor solubility of protonated PAA chains in water as
well as polymer-substrate interactions.
Introduction
Polymers anchored to solid interfaces are in the focus of materials science, as they offer
a broad range of applications, from tribology to biomedicine, where specific properties of
the interfaces are tuned by proper surface modification. In general, water-based systems
offer the best opportunity to combine a multitude of independently tunable interactions,
in particular, hydrophobic and electrostatic ones. Hereby, polyelectrolytes are of particu-
lar importance, as their electrostatic interactions can be affected, and thus tuned, by ionic
strength as well as by pH (in the case of pH-sensitive polyelectrolytes and surfaces).
For the creation of end-grafted polymer layers on solid substrates, one most prominent

68 AFM-Based SMFS of End-Grafted PAA Monolayers
method is the so-called “grafting-from” technique. Because of its proficiency to lead to
macromolecules with well-defined architecture and macromolecular dimensions, control-
led/living radical polymerization (CRP) and in particular nitroxide-mediated polymeriza-
tion (NMP) has been extensively described for almost 10 years.1−8 Hereby, postmodificati-
on and/or copolymerization enable to create grafted amphiphilic (co)polymer layers with
controlled hydrophilic/hydrophobic balance, ionic groups, gradient of properties along the
chemical sequence, etc. This opens a large perspective for the design of polymeric mono-
layers with predetermined and responsive features adjustable for different applications.
For a better understanding of the structure-property relationships in these polymer layers,
which is necessary for the tuning of the materials’ properties, there is need for charac-
terization at the molecular level. Several techniques, such as SFA and AFM, have been
employed to study the conformation of surface-attached polymers in ensemble measure-
ments. The interpretation of these experiments was based on well-established theories for
end-grafted polymers and polyelectrolytes.
Among the experimental methods for the studying of conformations and interactions of
macromolecules, AFM-based force spectroscopy is one of the most powerful and sensitive
ones. At the level of individual polymer chains, it has been successfully used to measure
intra- and intermolecular forces with high precision.9−12 The method enables to elucida-
te collective effects arising from confinements and interactions between substrate-grafted
chains subjected to extensional deformation,13 and it was proved useful in the investi-
gation of polymer conformations and molecular bond strengths at the single molecule
level.9,14−16
Finally, and most importantly for the context of this work, the interactions of indivi-
dual macromolecules with solid-liquid interfaces have been successfully studied by AFM
force spectroscopy.17 The loop-size distribution of adsorbed polymer chains at the so-
lid substrate18 and the forces, which are necessary to pull them off the substrate,18−20
were measured. For polyelectrolytes on oppositely charged substrates, it was found that
the magnitude of these desorption forces depends linearly on the Debye screening length
and on the linear charge density of the polyelectrolyte chains.17,21 Further details of non-
Coulomb contributions to the desorption force as well as the influence of the solvent were
revealed.22
In a paper by Li et al.,23 the elastic behavior of poly(acrylic acid) adsorbed on a glass
substrate was studied by AFM force spectroscopy. Hereby, a distribution of “extension
lengths” was given. However, as the adsorbed layer consists of an entangled network of
polymer chains, this distribution rather reflects the lengths of those polymer segments in
the interfacial layer, which are accessible for stretching, but not the full contour lengths
of the poly(acrylic acid) chains.
In a paper by Walker et al.,24 a layer of poly(dimethylsiloxane) grafted to a silica substra-
te was investigated by AFM in water. Again, the elastic profiles of single polymer chains
were recorded, and the distribution of contour lengths of the polymer segments between
Macromolecules 39 (2006), 281-288. 69
the tip and the surface was given, merely reproducing the expected polymer length distri-
butions. However, since poly(dimethylsiloxane) is not water-soluble, these measurements
were performed under bad-solvent conditions, where the tethered polymers are present in
a collapsed conformation.
Here, we show the applicability of AFM-based measurements for the investigation and
structural characterization of pH-sensitive polyelectrolyte chains on solid substrates. In
particular, we are using poly(acrylic acid) grafted from silica substrates by controlled ra-
dical polymerization, which physically interact with an AFM tip, namely adsorbing upon
approaching and desorbing upon retraction of the tip from the substrate. The measure-
ment of the interaction forces during the desorption of individual polymer chains yields
the full lengths of the adhering chains as well as their adhesion forces.
Since the conformation of poly(acrylic acid) depends on the pH of the aqueous buffer, we
were able to study the effect of the solvent condition on the accuracy of the determined
molecular length distributions.
The scope of this paper therefore is to investigate the experimental regimes under which
the correlation of length histograms from AFM experiments with the molecular structure
of the grafted polymer layers is possible.
For this purpose, the AFM data will then be compared to those obtained by standard me-
thods, namely, gel permeation chromatography (GPC) and X-ray photoelectron spectros-
copy (XPS). Our results promise the implementation of the AFM method as an analytical
tool for the analysis of chain length distributions and grafting densities of substrate-grafted
polymer layers.
Materials and Methods
Sample Preparation and Characterization. The covalently attached polymer mo-
nolayers were synthesized via controlled/living radical polymerization using immobili-
zed initiators. The concept is shown in Figure 1. NMP was applied for the prepa-
ration of well-defined polymer monolayers end-grafted onto silica surfaces (vinyl and
acrylic monomers).25−30 For this purpose, preformed functionalized azoic25,26,30,31 or
alkoxyamine26−29 initiators were synthesized and covalently attached to silica substrates.
The initiator used in this study consists of an azo group, which is structurally similar to
AIBN, and two monochlorosilane headgroups (SiMe2Cl) that connect the initiator through
silanol moieties (SiOH) to the surface of the substrate. The ester group connecting the
initiating group and the anchor group can act as a break-seal group under transesterifica-
tion conditions. Hence, this ester can be cleaved after completion of the layer formation,
and the polymer can be removed from the surface for bulk characterization.25−31
In the second step, radical polymerization was initiated from the surface under controlled
conditions. Hereby, the acrylic monomer reacts with the surface-attached initiator. Briefly,
to an initiator-grafted wafer was added a mixture of the monomer acrylic acid (AA), the

70 AFM-Based SMFS of End-Grafted PAA Monolayers
initiator 2,2’-azobis(isobutyronitrile) (AIBN, ratio [AA]/2[AIBN] = 2000), and the coun-
ter radical SG1 ([SG1]/[AIBN] = 2.1). This mixture was thoroughly degassed and heated
to 120 ◦C for chosen periods of time. After the polymerization time, the silicon wafer was
continuously washed free of any adsorbed polymer (PAA) with water and 1,4-dioxane.
Then, the wafer was dried and stocked under nitrogen.
Figure 1. Concept for the synthesis of covalently attached polymer monolayers via control-
led/living radical polymerization using immobilized initiators (grafting from technique).
In preliminary experiments, the free polymer chains were characterized with gel permea-
tion chromatography (GPC) in THF after methylation of PAA to poly(methyl acrylate),
yielding an organo-soluble polymer. GPC characterization was performed using a 2690
Waters Alliance System with THF as the eluent. It was equipped with four Styragel
columns HR 0.5, 2, 4, and 6 working in series at 40◦C, a 2410 Waters refractive index
detector, and a 996 Waters photodiode array detector. A calibration curve established
with low-polydispersity polystyrene standards was used for the determination of the mo-
lecular weights. The GPC data indicate that the (average) contour length of the chains is
590 nm with a polydispersity (PD) of 1.3. At low grafting densities (<0.01 chain.nm−2)
values of the polymer surface density cannot be measured with sufficiently high accuracy.
Therefore, the X-ray photoelectron spectroscopy (XPS) data had to be compared to the
data from samples with known high grafting densities.32 Analyzing the intensities of the
carbon and silicon peaks in the XPS spectra, the grafting density could be estimated as
∼0.005 chain.nm−2. For further details on polymerization and characterization, the reader
is referred to previous publications by Billon33 and Charleux.34

Macromolecules 39 (2006), 281-288. 71
AFM Force Spectroscopy. The force spectroscopy experiments were conducted on a
home-built AFM instrument using silicon nitride cantilevers (Microlever) purchased from
Veeco Instruments. Nominal spring constants were calibrated using the thermal oscillation
method35 before the first force-extension curve was measured.
The experimental strategy adopted in the present study assumes that substrate-grafted
polymers reversibly adsorb onto the AFM tip when the tip approaches the substrate sur-
face and desorb from the AFM tip when it retracts from the substrate. The force acting
on the AFM tip upon retraction was measured. The corresponding force-extension profiles
exhibit a set of characteristic plateaus resembling those obtained in earlier AFM studies
on polymer desorption of tip-attached polymers from bare substrates,21,22 in which the
difference in the heights of the plateaus reflects the magnitude of the desorption force of
a single polymer chain (Figure 2), and the plateau length is proportional to the contour
length of the adsorbed chain segments.
Figure 2. (A) Typical force-distance curve obtained in a single molecule desorption experiment
with a surface-grafted polymer monolayer and a nonfunctionalized AFM tip. Upon contacting
the tip with the substrate, surface-grafted polyelectrolyte chains are allowed to adsorb on the
tip. Upon retracting the tip, typically, a strong adhesive peak is observed at small tip-substrate
separation. Upon further increasing the tip-substrate distance, the continuous desorption of
successive chain segments is reflected by a plateau of constant force, whereas the complete
desorption of the entire polymer chain results in a sudden drop of the adhesive force. (B) In rare
cases, single nonadsorbed (bridging) segments between tip and substrate may still exist, which
are reflected by a nonlinear increase in the stretching force before the successive desorption of
adsorbed monomers sets in.
All AFM measurements were performed in an aqueous environment. The samples of
substrate-grafted poly(acrylic acid) were investigated at varied pH in aqueous solution
containing 100 mM NaCl. As we intended to focus on the pH-dependent properties of
72 AFM-Based SMFS of End-Grafted PAA Monolayers
poly(acrylic acid) here, a NaCl concentration of 100 mM was used in order to reduce the
force contribution of electrostatic interactions between the tip and the polymer chains.
To select a set of individual polymer chains, which represent the molecular weight dis-
tribution of the substrate-grafted ensemble, data were collected at different spots on the
surface and thus for different poly(acrylic acid) chains.
The tip positions were chosen randomly on a 4×3 mm2 area on the surface. Typically,
100 force-extension curves were measured for each investigated pH value and for each of
10 different spots of the sample. Repeated measurements on the same spot resulted in
reproducible force-distance curves, indicating that no polymer chains were worn off from
the substrate. Also, before and after each set of experiments (in which different surface
spots were investigated), control measurements were made, in which the interaction of
the AFM tip with bare silica substrates was recorded to make sure that no polymers were
transferred to the AFM tip during the course of the experiment. It was found that the
tip-silica interaction profile was not altered after the experiment.
The plateaus were analyzed in respect of desorption forces and plateau lengths. The re-
sults were plotted as histograms showing the statistical distributions, i.e., the number of
events observed for certain desorption forces or desorption lengths, respectively. Thereby,
all histograms presented in the following constitute superpositions of measurement series
at different surface positions carried out under the same conditions, representing the en-
semble of the surface-grafted poly(acrylic acid) molecules.
Note that because of the “unspecific” interaction of the silicon nitride tips with the
substrate, force-extension curves may show a high unspecific adsorption peak at short
tip-substrate distances, which under certain conditions may extend to a few hundred na-
nometers. Thus, only desorption events extending beyond this range can be detected in
such cases. In our measurements, most of the polymer chains exhibit sufficiently large con-
tour lengths, so that the unspecific adsorption peak does not affect the measured length
distribution. (For shorter chains, the influence of the unspecific adsorption peak would
manifest itself in an artificial cutoff of the distribution at shorter chain lengths.)
Results
Distribution of Detachment Lengths at pH 6: Comparison with GPC. The
comparison between AFM measurements (plateau length distribution) at pH 6 and GPC
experiments is shown in Figure 3. Very narrow molecular weight distributions, e.g., in-
stantaneous MWD, can be well characterized by Flory or Poisson distributions. A broader
MWD can be described by log-nor distributions:36
P (z) = P0 · exp
[−1
2
(log (z/z0)
t
)2]

Macromolecules 39 (2006), 281-288. 73
The maximum of the distribution is characterized by z0, corresponding to the number-
average of the apparent polymer chain lengths within the interfacial layer. The width of
the curve is given by t, which is related to the polydispersity over t = log(PD). The factor
P0 ensures normalization of the distribution. For the distributions shown in Figure 3, the
fitting process determines z0 = 592 nm for the GPC data and z0 = 572 nm for the AFM
data.
Figure 3. Molecular weight/length distributions obtained by single molecule force spectroscopy
at pH 6 (histogram) and by GPC (black curve). Both data sets were fitted with a log-nor
distribution with constant width ( = log(PD) = 0.26), resulting in maxima positions z0 of 572
nm (solid curve) and 592 nm (dotted curve).
Figure 3 shows that the molecular length distributions obtained by GPC and single mole-
cule force spectroscopy are in good agreement. Hence, single molecule force spectroscopy
can be successfully applied as a tool for molecular weight determination of surface-grafted
poly(acrylic acid) chains under the conditions of neutral to slightly alkaline pH. In con-
trast to GPC, the chains do not have to be cleaved from the substrate (cf. experimental
section) but can be analyzed unaltered. In addition, unprecedented by other methods,
polymer length distributions at the surface can be spatially resolved at the level of indivi-
dual molecules. Further studies are required to define grafting densities and chain lengths
accessible by single molecule force spectroscopy characterization.
pH Dependence of AFM-Determined Length Distribution. The distribution of
the apparent polymer chain lengths of the surface-grafted poly(acrylic acid) molecules
as observed in the desorption profiles depends on the pH (Figure 4). Thus, different
measurement series were conducted for various pH values between pH 2.5 and 11. Figure
5 shows the experimentally obtained average apparent polymer lengths z0 as a function

74 AFM-Based SMFS of End-Grafted PAA Monolayers
of pH. While the maximum in the length distribution, z0, remains merely constant at
570 nm for pH ≤ 7, z0 decreases significantly between pH 8 and 11 to z0 = 430 nm. It
was further observed that the desorption forces recorded at alkaline pH were lowered by
an average of ∼3 pN as compared to the desorption forces at pH ≤ 6 (i.e., the average
desorption force of 73 pN at pH 6 drops to ∼70 pN at pH 10).
Figure 4. Molecular length distributions measured by single molecule force spectroscopy in
aqueous buffer containing 100 mM NaCl at pH 6 and 11. The number of analyzed curves is
identical (N = 1000) for both conditions. At higher pH, the maximum position of the distribution
z0 is shifted to smaller values, and the number of observed plateaus in the force-distance traces
is increased.
Figure 5. Plot of the maximum position z0 taken from the experimentally obtained length
histograms against the pH of the buffer solution.
The experimental data can be well fitted by the following empirical equation:
z0 = c1 − c2 · 10pH−pK*

Macromolecules 39 (2006), 281-288. 75
Therein, z0 is the observed average polymer length at a certain pH and c1, c2, and pK*
are adjustable (fitting) parameters. The best fit gave c1 = 566 nm, c2 = 140 nm, and pK*
= 9.3. However, note that pK* is a fit parameter, which does not necessarily correspond
to the effective pK value of the acrylic acid chains in the grafted layer (which mainly
depends on intermolecular Coulomb interactions).37,38
The frequency of desorption events may also be deduced from the measured desorption
traces and can be given as the number of observed plateaus per curve (i.e., the number
of different individual polymer chains involved in the desorption process upon retraction
of the tip). This frequency was also found to depend on the pH of the buffer solution:
increasing pH yields an increased number of observed plateaus per curve as seen in Figure
4 by the larger number of overall counts for the same number of analyzed desorption
traces.
As the frequency of desorption events is related to the total number of chains adherent to
the tip during the desorption events, one may estimate this number from the distributions:
the number of chains within the contact area between tip and substrate is obtained as the
integrated frequency of events divided by the number of analyzed desorption traces. For
the curves shown in Figure 4, the number of analyzed traces is N = 1000. The average
number of polymer chains, n, adherent to the tip throughout all AFM experiments on
surface-grafted poly(acrylic acid) layers synthesized under the same conditions (as given
in the experimental section) was calculated as approximately n = 3.
Bimodal Plateau Length Distribution at pH < 6. Upon decreasing the pH from
pH 6 to pH 4, the plateau length distribution becomes bimodal. That is, the histograms
of the recorded plateau lengths exhibit an additional peak at shorter lengths (Figure 6),
which was not considered for the above determination of the average chain lengths z0.
While still negligible at pH 6, the second peak at lower plateau length (z1 ≈ 400 nm)
becomes more pronounced at pH 5, where both maxima have almost the same intensity
(i.e., the same frequency of events). When further decreasing the pH (Figure 7a), the lower
length peak broadens but can still be distinguished from the higher length peak (which
keeps its position at z0). At pH 2.5 (Figure 7b), a broad distribution is observed which
may be viewed as a continued broadening of the lower length peak, finally merging with
the higher length peak. Hereby, the frequency of events found at z0 = 570 nm appears to
remain merely unchanged.
Estimation of Polymer Grafting Density. The characterization of surface-grafted
polymer layers in terms of grafting densities with single molecule force spectroscopy re-
quires the knowledge of the AFM tip size and the number of grafted polymer chains under
the tip area. For the microlever tips used in our experiments a tip curvature radius of
20-40 nm is reported by the distributor. It can be assumed that the area on the substrate
in contact with the tip during the experiment is of approximately the same size (i.e., a

76 AFM-Based SMFS of End-Grafted PAA Monolayers
Figure 6. Molecular length distributions measured by single molecule force spectroscopy at pH
5 and 6. The number of analyzed curves is identical (N = 1000). At pH 5, a bimodal distribution
is observed (maximum positions are noted z1, z0).
contact area of approximately 1000-5000 nm2 may be assumed). The number of grafted
molecules within that range should in the ideal case be equal to the number of adhe-
rent chains as observed in the experiments. That is, by measuring the average number of
grafted chains adhering to the tip, the grafting density of polymer chains at the surface
may be estimated. For example, when assuming a curvature radius of the silicon nitride
probe of 20 nm, a grafting density of σ = 0.002 chain.nm−2 is calculated (cf. Discussion
of Figure 4 above: an average of three chains is observed within the contact region; thus,
σ = 3 chains/(π(20 nm)2).
For comparison, the grafting density was also estimated from the signal intensities of car-
bon and silicon peaks in the XPS spectra. The obtained value of σ = 0.005 chain.nm−2
is of the same order of magnitude as the value obtained by AFM. Taking into account
the average contour length of the chains estimated both from GPC data and from the
plateau length distribution, we can conclude that the average area per grafted chain is
comparable to, or larger than, the square gyration radius of the polymer coil. Hence,
intermolecular interactions between neighboring grafted chains are weak, at least in the
neutral or weakly acidic pH range. (Note that in 100 mM sodium chloride solution the
Debye screening length is ∼1 nm so that long-range Coulomb intermolecular interactions
are screened off.)
Discussion
The interpretation of the force-extension spectra may be based on a set of established theo-
retical models. The pulling-off of a neutral polymer chain from an adsorbing substrate in
good or theta-solvent was theoretically analyzed in refs 39 and 40. It was demonstrated

Macromolecules 39 (2006), 281-288. 77
Figure 7. Molecular length histograms observed under acidic conditions: (a) pH 4; (b) pH 2.5
(each plotted in comparison to the molecular length distribution for pH 6).
that the progressive detachment of a preadsorbed chain from the adsorbing surface occurs
when a constant pulling force, fc, is applied to one end of the chain. The magnitude of
this pulling force, fc, which is necessary to induce desorption of the chain, is proportional
to the “binding energy” (per monomer) divided by the monomer size. This force, which is
directly measured in the AFM experiment, increases with increasing adsorption strength.
Upon the desorption process, the polymer chain can be envisioned as partially desorbed,
i.e., consisting of an adsorbed segment (comprising Nads monomers) and a uniformly ex-
tended segment (comprising Nbridge monomers), bridging the chain end to the adsorbing
surface.
The elastic tension in the bridging segment is equal to the desorption force, fc. There-
fore, the degree of extension of the bridging segment, z/(aNbridge) ∼ fca/kBT , increases
with increasing strength of adsorption (here, z is the distance between the tip and the
substrate, i.e., the apparent length of the extended bridging segment of the chain, to
which the force fc is applied; a is the monomer length under “zero force”). At strong

78 AFM-Based SMFS of End-Grafted PAA Monolayers
adsorption, fca/kBT > 1, the bridging segment is almost completely extended, that is,
z/(aNbridge) ≈ 1.
The net free energy of the entire polymer chain comprises the (negative) contribution of
the adsorbed segment and the entropic penalty for the extension of the bridging segment.
If the retreat of the chain end from the surface occurs at an infinitely slow rate, the system
can be considered in perfect equilibrium. As the successive detachment of monomers of
the adsorbed segment from the tip surface continues, the number of monomers in the
extended bridging segment, Nbridge, increases, while the number of monomers in the ad-
sorbed chain segment, Nads, decreases. Hereby, the total free energy of the polymer chain
continuously increases, as the increasing fraction of monomers in the bridging segment
contributes an increasing conformational entropic penalty, while the free energy gain of
the adsorbed segment continuously decreases in proportion to the continuously decreasing
number of adsorbed monomers. In perfect equilibrium, the resulting net increase of the
desorbing polymer chain upon increasing the tip-surface separation by z is equal to the
stretching energy, fc∆z.
At a certain tip-surface distance (i.e., certain length of the extended polymer segment),
the free energy gain in the adsorbed segment is exactly counterbalanced by the conforma-
tional entropy penalty in the bridge; this distance may be termed zb. At this point, the
adsorbed state of the polymer chain is no longer energetically favored over the desorbed
state of the polymer chain, which would thermodynamically favor the full desorption of
the remaining adsorbed chain segment at zb.
However, for complete desorption, the adsorbed segment has to overcome a potential bar-
rier (activation barrier), the height of which is proportional to (fca)2Nads/kBT and thus
much larger than kBT . This activation barrier provides a kinetic hindrance for the full
desorption of the remaining adsorbed chain segments. In perfect equilibrium (i.e., under
conditions of infinitely slow stretching), the activation barrier would be overcome by the
adsorbed chain segments at a natural off-rate, and full desorption of the entire polymer
chain from the tip would be observed at zb. zb thus reflects the lowest limit of the experi-
mentally measured “apparent” polymer chain length.
In a real experiment, the stretching rate is finite. Thus, for a sufficiently high activation
barrier, the continuous desorption of successive monomers from the tip may continue even
upon an increase in z > zb. Hereby, the necessary pulling force, fc, remains constant, and
the system follows a sequence of metastable states with decreasing number of monomers
Nads in the adsorbed segment. Hereby, the (unfavorable) elastic free energy in the bridge
continues to rise as Nbridge increases and the (favorable) adsorption energy of the adsorbed
segment continues to fall as Nads decreases. Simultaneously, as Nads decreases, the height
of the free energy barrier decreases as well and will become of the order of kBT at a point,
which may be termed z = zs > zb. That is, the barrier separating the adsorbed state of
the polymer chain from the desorbed state of the polymer chain becomes of the order of
kBT . zs therefore reflects the maximum “apparent” chain length, which may be observed

Macromolecules 39 (2006), 281-288. 79
under the real experimental conditions of finite stretching rates, which will not always
be reached as stochastic fluctuations may naturally drive the system also over activation
barriers larger than kBT .
However, the larger the adsorption strength of the adsorbed monomers at the tip surface
is, the larger will be, both, the free energy contribution of the adsorbed monomers and
the potential barrier between the adsorbed and the desorbed state of the polymer chain
(i.e., the activation barrier for full desorption). As a result, zs will become larger, too.
Namely, the experimentally observed zs will become comparable to the actual polymer
chain length, L.
It should be noted that, in contrast to the unbinding of single molecular bonds, such as
ligand-receptor bonds, which have been extensively studied by force spectroscopy,9,41,42
in the continuous desorption process of polymer chains two different types of unbinding
events need to be considered: the successive unbinding of individual segments (which re-
peatedly occurs in a zipper-type mechanism) and the instantaneous and complete desorp-
tion of the adsorbed polymer chain end (in which, ultimately, all remaining adsorbed
segments detach at once). The unbinding of an individual segment occurs at a much hig-
her speed than the pulling rates accessible in the AFM experiment. Thus, no dependence
of the plateau force, which resembles the unbinding force of individual segments, is ob-
served. However, there is a rate dependence of the observed unbinding length originating
from the second “unbinding event”. As discussed above, during the desorption process,
the remaining adsorbed chain end continuously shortens. As a result, the “bond” between
the adsorbed polymer chain end and the substrate becomes continuously weaker until,
at a critical length, its unbinding rate becomes comparable to the experimental pulling
speed. Upon varying the pulling speed, this critical length of the remaining adsorbed
polymer end naturally varies as well. Thus, the observed critical length is a function of
pulling speed, and thus is the “apparent” chain length, while the unbinding force is not
rate-dependent (as it is always limited by the unbinding force of the ongoing process of the
continuous desorption of the individual segments). Note that if the adsorption strength is
high, the critical point is reached very close to the actual chain end.
While our model neglects excluded-volume interactions and/or finite extensibility of the
chain, the following main trends remain valid: (i) the detachment distance zs is proportio-
nal to the contour length L of the chain, zs = ϕL, and (ii) the proportionality coefficient
ϕ increases with increasing adsorption strength, approaching unity for strong adsorption.
Hence, the distribution of the detachment lengths, zs, measured in the AFM experiment
can be directly related (with a rescaling factor that depends on the adsorption strength)
to the molecular weight distribution in the ensemble of the polymer chains probed in the
pulling-off experiment. For strong adsorption, the distribution of desorption lengths mea-
sured by AFM should directly resemble the distribution of the polymers’ contour lengths
(i.e., their “real” molecular weight distribution).
The adsorption of poly(acrylic acid) chains onto the negatively (that is, similarly) charged

80 AFM-Based SMFS of End-Grafted PAA Monolayers
silicon nitride (effectively, silicon oxide) surface of the tip is nonelectrostatically driven.
Moreover, the fraction of charged monomers (equal to the degree of ionization) and the
surface charge density are simultaneously affected in the present system by the variation
of the pH. For a PAA chain interacting with the tip surface, both, the repulsive intra-
molecular Coulomb interaction and the polymer-surface interaction are pH-dependent via
the pH-dependent degrees of ionization of AA monomers and Si-OH functions on the tip
surface. The observed pH dependence of the measured plateau lengths may therefore be
interpreted in terms of decreasing strength of adsorption at high pH, resembling a decre-
ase in the force-dependent proportionality factor ϕ. Indeed, upon an increase in pH, the
negative ionic charge of both the adsorbed segments of the PAA chains and the tip sur-
face are known to increase. Therefore, the Coulomb repulsion between the polymer and
the surface becomes stronger and the adsorption strength between the tip surface and
the PAA chains becomes weaker, which is also reflected in the decrease of the measured
desorption forces at high pH.
PAA is a weak acid; the pKa for individual AA monomer is ∼5.5. In the polymer, the
dissociation of AA units results in an intramolecular Coulomb repulsion between dissocia-
ted, and thus negatively charged, neighboring carboxylic groups. Therefore, the effective
pK of AA units in a polymer is larger and depends on the salt concentration (the pK
decreases with increasing ionic strength of the solution due to screening of intramolecular
Coulomb interaction). Moreover, segments of PAA chains adsorbed onto the negatively
charged surface are ionized less than those far from the surface due to the lower local
electrostatic potential (lower local pH) in the vicinity of the negatively charged surface.38
At pH > pK, most of the monomers are ionized, and intramolecular Coulomb repulsion
(partially screened by salt) acts as an excluded-volume interaction ensuring the swelling
of the grafted polymer chains. This scenario therefore holds true for the above discussion
of our results in neutral to alkaline aqueous buffer, which thus constitutes a good solvent
for PAA.
Below approximately pH 5.5, when the carboxylate groups become protonated and thus
uncharged, the quality of water as a solvent for PAA significantly decreases. The variati-
on of pH in our experiments therefore has a similar effect as the variation of the solvent
strength in the case of nonionic polymers.
The high polymer density in the collapsed PAA chain suppresses the ionization of mo-
nomers due to the lowering of the local electrostatic potential and the decreasing of the
effective dielectric constant of the medium. As a result, the collapse transition within
individual chains occurs discontinuously, so that collapsed (weakly ionized) and swollen
(ionized) states may coexist.43
If a collapsed polymer globule (with dominating attractive monomer-monomer interacti-
ons under poor solvent conditions) is brought into contact with the adsorbing tip surface,
the following scenarios can be distinguished:44 (i) Monomer-monomer attraction is stron-
ger than the monomer-surface attraction. Then, no significant perturbation in the globule

Macromolecules 39 (2006), 281-288. 81
conformation (no adsorption to the tip) takes place. (ii) Monomer-surface attraction is
stronger than monomer-monomer attraction. Then, the globule spreads on the surface
(strong adsorption) and the detachment of the adsorbed chain by the applied pulling-
off force occurs similarly to the scenario described above. (iii) Monomer-monomer and
monomer-surface attraction are comparable, and the globule adsorbs onto the surface
(“wets” the surface with a finite contact angle). In this “transition regime” more so-
phisticated patterns in the detachment force-extension spectra are to be expected. The
distribution of the plateau lengths can no longer be directly recalculated into a molecular
length distribution.
In the pH range around pH 5, the PAA chains in the solution (and the bridging segments)
are slightly protonated (marginally good solvent quality of water), while the surface char-
ge density is still large (pK of the surface OH groups is around 2-3). As a result, the local
pH in the vicinity of the surface may drop below the pK of PAA. This may cause the
collapse of the chain segments proximal to the surface.
A second important effect in this pH regime is the possible adsorption of the grafted
polymer chains on the substrate. In this context, it is important to note that the silica
substrate is modified by silanization prior to polymerization, which means that it has a
different, i.e., more hydrophobic, character than the bare silica tip. It is therefore reaso-
nable to assume that adsorption of the (slightly protonated) grafted poly(acrylic acid)
chains becomes more favorable and thus competes with tip adsorption. As has been de-
monstrated earlier,45 an enhanced attraction to the grafting surface generally leads to a
segregation of grafted chains into two populations: adsorbed and extended ones. These
different chain conformations may result in the appearance of the bimodal plateau length
distribution. Further analysis, including the study of grafted polymer layers with higher
grafting density, will help to elucidate this effect.
When the pH is further lowered (pH 4 - pH 2), the acrylic acid groups become fully pro-
tonated. In addition, the SiOH groups on the tip surface also get protonated; i.e., both
the intramolecular and polymer-surface Coulomb repulsion vanish. The distribution of
the measured plateau lengths flattens off, while the average length decreases as compared
to that measured at high pH. This reflects a variety of different metastable states upon
pulling-off the collapsed PAA chain from the tip surface. Hence, in this pH range, there
is no simple relation between observed distribution of the plateau length and molecular
weight distribution of grafted polymers.
Note that, generally, a quantitative prediction of the desorption force magnitude is not
possible since the relevant adsorption energy comprises several contributions, which can-
not be calculated unambiguously. For example, the magnitude of shortrange van der Waals
attractions depends strongly on the polymer-substrate distance (which cannot be predic-
ted), while the Coulomb repulsion depends on the unknown surface charge density or
surface potential. Nevertheless, our results qualitatively support our theoretical model, as
we have demonstrated that an increase in pH, which is expected to lower the net adsorp-

82 AFM-Based SMFS of End-Grafted PAA Monolayers
tion strength, indeed results in decreasing plateau length and force magnitude.
Figure 8 shows a summary of our observations. It illustrates the effects of poor solvent
quality (splitting of the desorption length distribution at low pH) as well as the effects
of weak polymer-tip adsorption (decrease of the average desorption length at high pH).
In the intermediate regime, the desorption length distribution measured by AFM reflects
the molecular length distribution of PAA as determined by GPC. On the basis of our
discussion above, it is thus concluded that AFM desorption measurements allow for the
analysis of the molecular length distribution of substrate-grafted polymers in the regime
of good solvent quality and strong tip adsorption.
Figure 8. Measured maxima of the length distributions in dependence of the pH of the aqueous
buffer (see also Figure 5).
Summary
We have applied AFM-based force spectroscopy for the characterization of monolayers of
end-grafted poly(acrylic acid) (PAA) chains, which were obtained by means of surface-
initiated nitroxide-mediated polymerization from a silica surface. The distribution of the
characteristic desorption lengths of the polymer chains in the measured force-extension
curves and their corresponding desorption forces were recorded under conditions of varying
pH of the aqueous buffer solution. Hereby, the plateau length distributions were found to
depend not only on the real chain length of the grafted polymers but also on the chain
conformation governed by intramolecular interactions and solvent quality as well as the
strength of adsorption of AA monomers on the AFM tip. This relationship follows from
known theories, and it is confirmed by comparison to the GPC data on free polymers. For
sufficiently good solvent quality and strong adsorption of the polymer chains to the AFM
tip, the desorption length distribution coincides with the molecular length distribution
of the substrate-grafted polymers. The latter can thus be directly measured in AFM

Macromolecules 39 (2006), 281-288. 83
desorption experiments.
Acknowledgment. The work was financially supported by Deutsche Forschungsge-
meinschaft (DFG) through SFB 486 and by Deutscher Akademischer Austauschdienst
(DAAD) and EGIDE through the PROCOPE program. J.P. gratefully acknowledges fi-
nancial support by Marie Curie Fellowship.
References and Notes
(1) Fischer, H. J. Am. Chem. Soc. 1986, 108, 3925-3927.
(2) Fischer, H. Macromolecules 1997, 30, 5666-5672.
(3) von Werne, T.; Patten, T. E. J. Am. Chem. Soc. 2001, 123, 7497- 7505.
(4) Matyjaszewski, K. J. Phys. Org. Chem. 1995, 8, 197-207.
(5) Matyjaszewski, K. Macromol. Symp. 2001, 174, 51-67.
(6) Matyjaszewski, K. Curr. Opin. Solid State Mater. Sci. 1996, 1, 769-776.
(7) Matyjaszewski, K.; Miller, P. J.; Shukla, N.; Immaraporn, B.; Gelman, A.;
Luokala, B. B.; Siclovan, T. M.; Kickelbick, G.; Vallant, T.; Hofmann, H.;
Pakula, T. Macromolecules 1999, 32, 8716-8724.
(8) Georges, M. K.; Veregin, R. P. N.; Kazmair, P. M.; Hamer, G. K. Macromolecules
1993, 26, 2987-2988.
(9) Florin, E. L.; Moy, V. T.; Gaub, H. E. Science 1994, 264, 415-417.
(10) Rief, M.; Oesterhelt, F.; Heymann, B.; Gaub, H. E. Science 1997, 275, 1295-1297.
(11) Clausen-Schaumann, H.; Seitz, M.; Krautbauer, R.; Gaub, H. E. Curr. Opin.
Chem. Biol. 2000, 4, 524-530.
(12) Janshoff, A.; Neitzert, M.; Oberdorfer, Y.; Fuchs, H. Angew. Chem., Int. Ed.
2000, 39, 3213-3237.
(13) Goodman, D.; Kizhakkedathu, J. N.; Brooks, D. E. Langmuir 2004, 20, 6238-6245.
(14) Grandbois, M.; Beyer, M.; Rief, M.; Clausen-Schaumann, H.; Gaub, H. E. Science
1999, 283, 1727-1730.
(15) Rief, M.; Gautel, M.; Oesterhelt, F.; Fernandez, J. M.; Gaub, H. E. Science 1997,
276, 1109-1112.
(16) Minko, S.; Roiter, Y. Curr. Opin. Colloid Interface Sci. 2005, 10, 9-15.
(17) Hugel, T.; Grosholz, M.; Clausen-Schaumann, H.; Pfau, A.; Gaub, H. E.; Seitz, M.
Macromolecules 2001, 34, 1039-1047.
(18) Senden, T. J.; di Meglio, J.-M.; Auroy, P. Eur. Phys. J. B 1998, 3, 211-216.
(19) Chatellier, X.; Senden, T. J.; Joanny, J.-F.; Meglio, J.-M. d. Europhys. Lett. 1998,
41, 303-308.
(20) Conti, M.; Bustanji, Y.; Falini, G.; Ferruti, P.; Stefoni, S.; Samori, B.
ChemPhysChem 2001, 2, 610-613.
(21) Seitz, M.; Friedsam, C.; Jostl, W.; Hugel, T.; Gaub, H. E. ChemPhysChem 2003,
84 AFM-Based SMFS of End-Grafted PAA Monolayers
4, 986-990.
(22) Friedsam, C.; Becares, A. D. C.; Jonas, U.; Seitz, M.; Gaub, H. E. New J. Phys.
2004, 6, Art. No. 9.
(23) Li, H.; Liu, B.; Zhang, X.; Gao, C.; Shen, J.; Zou, G. Langmuir 1999, 15,
2120-2124.
(24) Al-Maawali, S.; Bemis, J. E.; Akhremitchev, B. B.; Leecharoen, R.;
Janesko, B. G.; Walker, G. C. J. Phys. Chem. B 2001, 105, 3965-3971.
(25) Parvole, J.; Billon, L.; Montfort, J. P. Polym. Int. 2002, 51, 1111-1116.
(26) Parvole, J.; Laruelle, G.; Guimon, C.; Francois, J.; Billon, L. Macromol. Rapid
Commun. 2003, 24, 1074-1078.
(27) Husemann, M.; Morrison, M.; Benoit, D.; Frommer, J.; Mate, C. M.;
Hinsberg, W. D.; Hedrick, J. L.; Hawker, C. J. J. Am. Chem. Soc. 2000,
122, 1844-1845.
(28) Bartholome, C.; Beyou, E.; Bourgeat-Lami, E.; Chaumont, P.; Zydowicz, N.
Macromolecules 2003, 36, 7946-7952.
(29) Laruelle, G.; Parvole, J.; Francois, J.; Billon, L. Polymer 2004, 45, 5013-5020.
(30) Parvole, J.; Montfort, J. P.; Billon, L. Chem. Phys. 2004, 205, 1369-1378.
(31) Prucker, O.; Ruhe, J. Macromolecules 1998, 31, 592-601.
(32) All samples to be compared were prepared on the same silicon wafer.
(33) Laruelle, G.; Francois, J.; Billon, L. Macromol. Rapid Commun. 2004, 25, 1839-
1844.
(34) Couvreur, L.; Lefay, C.; Belleney, J.; Charleux, B.; Guerret, O.; Magnet, S.
Macromolecules 2003, 36, 8260-8267.
(35) Butt, H.-J.; Jaschke, M. Nanotechnology 1995, 6, 1-7.
(36) Maschio, G.; Scali, C. Macromol. Chem. Phys. 1999, 200, 1708-1721.
(37) Israels, R.; Leermakers, F. A. M.; Fleer, G. J. Macromolecules 1994, 27, 3087-3093.
(38) Borisov, O. V.; Boulakh, A. B.; Zhulina, E. B. Eur. Phys. J. E 2003, 12, 543-551.
(39) Eisenriegler, E.; Kremer, K.; Binder, K. J. Chem. Phys. 1982, 77, 6296-6320.
(40) Klushin, L. I.; Skvortsov, A. M.; Leermakers, F. A. M. Phys. Rev. E 2002, 66,
036114.
(41) Evans, E.; Ritchie, K. Biophys. J. 1997, 72, 1541-1555.
(42) Merkel, R.; Nassoy, P.; Leung, A.; Ritchie, K.; Evans, E. Nature (London) 1999,
397, 50-53.
(43) Raphael, E.; Joanny, J.-F. Europhys. Lett. 1990, 13, 623-628.
(44) Johner, A.; Joanny, J.-F. J. Phys. II 1991, 1, 181-194.
(45) Zhulina, E. B.; Borisov, O. V.; van Male, J.; Leermakers, F. A. M. Langmuir 2001,
17, 1277-1293.

J. Am. Chem. Soc. 85
D Quantitative Single Molecule Measurements on
the Interaction Forces of Poly(l-Glutamic Acid)
with Calcite Crystals
Lars Sonnenberg, Yufei Luo, Helmut Schlaad, Markus Seitz, Helmut Colfen
and Hermann E. Gaub
Abstract
The interaction between poly(l-glutamic acid) (PLE) and calcite crystals was studied with
AFM-based single molecule force spectroscopy. Block copolymers of poly(ethylene oxide)
(PEO) and PLE were synthesized and covalently attached to the tip of an AFM cantilever.
In so-called desorption measurements the molecules were allowed to adsorb on the calcite
crystal faces and afterwards successively desorbed. The corresponding desorption forces
were detected with high precision, showing for example a force transition between the two
blocks. Due to its importance in the crystallization process in biominerals the PLE-calcite
interaction was investigated as a function of the pH as well as the calcium concentration
of the aqueous solution. The sensitivity of the technique was underlined by resolving
different interaction forces for calcite (104) and calcite (100).
Introduction
Biominerals are composite or hybrid materials consisting of an inorganic crystal phase and
an organic phase with outstanding materials properties and hierarchical organization.1
These advanced features are the result of a precise control of crystallization and self-
organization processes by soluble and insoluble organic molecules. Biominerals are thus
considered as archetypes for future advanced materials.
Many of the soluble organic polymers, which can be extracted from biominerals, are extra-
ordinarily acidic.2−5 Matrix proteins in biominerals typically contain 30–40% of aspartic
acid (D) or glutamic acid (E) residues.6,7 The acidic residues can interact with calcium,
which is the basis for many biominerals like calcium carbonates and phosphates. Acidic
macromolecules are therefore considered to play a key role in biomineralization processes.5
Based on this knowledge, synthetic model polymers have been designed and widely applied

86 Interaction Forces of Poly(l-glutamic acid) with Calcite Crystals
for the control of crystallization processes.8,9 Especially successful are the so-called double
hydrophilic block copolymers, which allow for a precise control of crystallization due to the
separation of binding and stabilizing moieties.10,11 Nevertheless, detailed and quantitative
knowledge of the polymer-crystal interaction is still lacking and with it a quantitative ex-
planation for face specific polymer binding (e.g. certain acidic proteins interact selectively
in vitro with calcite crystal faces12,13), which could verify computer modeling predictions
on such interactions.14 It is therefore not only important for the fundamental under-
standing of biomineralization processes to quantify the polymer-crystal interactions, but
also for the understanding of additive controlled crystallization in general concerning to-
pics such as face selective polymer adsorption9,12,13, oriented attachment15 or mesocrystal
formation16, where face selective additive adsorption is of importance for the subsequent
morphogenesis process by self assembly to ordered nanoparticle superstructures or by fur-
ther crystal growth. The collection of such data is thus a most important prerequisite to
transfer the lessons from nature into the synthetic materials world.
AFM-based single-molecule force spectroscopy allows for the precise measurement of the
interaction forces of single polymers with solid (mineral) surfaces.17,18 In so-called desorp-
tion measurements single molecules are covalently attached to an AFM tip and are allowed
to adsorb on the mineral substrate. Then, they are successively desorbed in an equilibrium
process by separating the AFM tip from the substrate surface (Figure 3). The measured
force-distance traces exhibit plateaus of constant force, from which the specific interacti-
on of the polymeric molecules and the mineral surface can be obtained in a quantitative
manner.
In order to elucidate the yet unknown polymer interaction with the mineral phase, we
have applied AFM-desorption measurements to quantitatively investigate the interaction
of poly(l-glutamic acid) (PLE) with calcite (CaCO3) crystal faces on the single molecule
level. For this, a triblock copolymer consisting of a polyamine block for chemical coupling
to the AFM tip, a PEO block as hydrophilic spacer and the PLE block as interacting
block was synthesized and coupled to the AFM tip. In the context of this study two key
aspects were addressed: a) The impact of experimental conditions (pH, Ca-concentration)
on the molecular interaction of PLE with the calcite surface, and b) the impact of crystal
face on the molecular interaction of PLE with the calcite surface.
Materials and Methods
Polymer Synthesis (Polyamine-b-PEO-b-PLE). A double hydrophilic block copo-
lymer consitsting of poly(ethylene oxide) (PEO) and poly(l-glutamic acid) (PLE) and
which also carries primary amine functions was designed for the AFM-based single mo-
lecule force spectroscopy measurements. The polyamine block allows for the covalent
attachment of the block copolymer to the AFM tip with high efficiency and long-term
stability due to the multiple binding sites (see also further below). For this study the PLE

J. Am. Chem. Soc. 87
was of main importance as its interaction with calcite crystal surfaces was investigated.
The PEO has been included for several reasons: i) PEO-b-PLE form together a double
hydrophilic block copolymer, which are of special importance for drug delivery19, as cry-
stallization additive or particle stabilizer in water (Ref. 10), ii) in single molecule force
spectroscopy experiments by means of an AFM, PEO is often used as a spacer to avoid
interactions of the molecules of interest with the (tip) surface.
All reagents and solvents were purchased from Sigma-Aldrich. The synthesic pathway is
visualized in Figure 1.
Figure 1. Schematics of the synthesis of PEO-b-PLE carrying primary amine functions.

88 Interaction Forces of Poly(l-glutamic acid) with Calcite Crystals
ω-Hydroxy-polybutadiene-block -poly(ethylene oxide) (PB-b-PEO-OH):
PB-b-PEO-OH was synthesized by anionic polymerization of ethylene oxide (EO) using
an ω-hydroxy-1,2-polybutadiene (average number of repeating units: 40), as reported by
Justynska et al.20 The characterization with nuclear magnetic resonance spectroscopy
(NMR) and size exclusion chromatography (SEC) yielded the following results: 1H NMR:
mole fraction EO = 0.87, SEC: PDI = 1.05 (apparent polydispersity index).
ω-Amino-polybutadiene-block -poly(ethylene oxide) (PB-b-PEO-NH2):
(a) PB-b-PEO-OH (0.5 g) was dissolved in 20 ml CH2Cl2, and then p-tosyl chloride (0.19
g) and triethylamine (0.095 g) were added under an argon atmosphere. The solution was
heated to reflux overnight. The solution was afterwards concentrated to about 5 ml and
precipitated into diethyl ether. The product (PB-b-PEO-OTos) was collected through
centrifugation, re-precipitated three times and dried in vacuum.
(b) In a 25 ml three-necked round-bottom flask, PB-b-PEO-OTos (0.2 g), potassium
phthalimide (0.093 g) and tetra-n-butylammonium bromide (0.02 g) were suspended in
10 ml N,N-dimethylformamide (DMF) under vigorous stirring. The mixture was gradually
warmed to 100◦C in an oil bath and stirred at this temperature overnight. After cooling
down to room temperature, the mixture was condensed to 2 ml and precipitated into
diethyl ether. The obtained yellow solid was dissolved in CHCl3 and the solution passed
through a filter. The product (PB-b-PEO-phthalimide) was then precipitated again in
diethyl ether and dried in vacuum.
(c) PB-b-PEO-phthalimide (0.2 g) was dissolved in a mixture of dioxane (20 ml) and
methanol (10 ml) and then hydrazine monohydrate (1 ml) was added. The solution was
heated to reflux with stirring overnight. After the solvent was evaporated, 0.5 N aqueous
HCl was added and the mixture stirred for 15 minutes. After dilution with 15 ml of water
and heating for 1 hour, the solution was filtered and dialyzed against deionized water
(MWCO: 3500 Da). The PB-b-PEO-NH2 was then isolated by freeze-drying.
γ-Benzyl l-glutamate-N-carboxyanhydride (BLE-NCA):
γ-Benzyl l-glutamate (5 g) was suspended in a mixture of α-pinene (6.57 ml, 5.74 g) and
ethyl acetate (20 ml) (freshly distilled from CaH2). The suspension was heated to reflux
(76 ◦C) and a solution of triphosgene (3.13 g) in ethyl acetate (9.5 ml) was slowly added
under stirring. After a clear solution was formed, 75 ml of heptane was slowly added under
good stirring. The solution was cooled to –10 ◦C, kept overnight at this temperature, and
then rapidly filtered. The solid NCA was recrystallized twice from ethyl acetate/heptane
1:4 (v/v), washed twice with heptane, and dried in vacuum at room temperature.21
Polybutadiene-block -poly(ethylene oxide)-block -poly(γ-benzyl l-glutamate)
(PB-b-PEO-b-PBLE):
PB-b-PEO-NH2 and BLE-NCA were weighted in separate two-neck flasks and dried over-
night at room temperature in vacuum. The flasks were filled with argon and DMF (distilled
J. Am. Chem. Soc. 89
from CaH2 and from P2O5) was added (3 ml and 5 ml, respectively). The mixtures were
stirred at room temperature until complete dissolution, and then the solution of the NCA
was added to the polymer via a transfer needle. The combined solution was stirred for
3 days at 60 ◦C, and then the solution was cooled down to room temperature and con-
centrated to 3 ml. The product was afterwards precipitated into diethyl ether and dried
under reduced pressure.1H NMR: 819 BLE repeating units, SEC: PDI = 1.4 (apparent polydispersity index) (see
Supporting Information, Figures SI-1 and SI-2).
Poly(4-(2-(amino hydrochloride)-ethylthio)-butylene)-block -poly(ethylene oxide)-block -
poly(γ-benzyl l-glutamate) (PA-b-PEO-b-PBLE):
In a 25 ml three-necked round-bottom flask, PB-b-PEO-b-PBLE (0.150 g) and 2-
aminoethanethiol hydrochloride (0.023 g) were dissolved in 5 mL DMF. Under stirring,
the solution was saturated with nitrogen for 30 minutes. Azoisobutyronitrile (AIBN, 0.004
g) was then added, and the solution was stirred for 24 h at 60 ◦C. The product was pre-
cipitated into diethyl ether, filtered, redissolved in DMF/water 1:1 (v/v) and dialyzed
against deionized water. After freeze-drying, the triblock copolymer with pendant amine
groups was obtained as a white powder.
About 30 amino groups should be attached to the α-chain end of PEO-b-PBLE, conside-
ring an efficiency of thiol addition of ∼75% (see ref. 20).
Poly(4-(2-amino-ethylthio)-butylene)-block -poly(ethylene oxide)-block -poly(l-glutamate)
(Polyamine-b-PEO-b-PLE):
The Polyamine-b-PEO-b-PBLE (0.100 g) was dissolved in a mixture of DMF (5 ml) and
water (5 ml), and the solution was saturated with nitrogen for 10 minutes. 0.1 N NaOH
(0.5 ml) was added under stirring, and the solution was stirred overnight at room tempe-
rature. The solution was then dialyzed and freeze-dried to obtain the triblock copolymer
Polyamine-b-PEO-b-PLE.
Modification of AFM tips. Epoxy-functionalized AFM tips for the covalent attach-
ment of polyamines were obtained by treating the Si3N4-tip (Microlever, Veeco Instru-
ments) with (3-glycidyloxypropyl)trimethoxysilane for 30 s, rinsing with toluene and water
for three times. Afterwards the polymers were immediately attached to the AFM tip by
soaking it in an aqueous solution of Polyamine-b-PEO-b-PLE (concentration 0.25 mg/ml)
for 90 minutes. After rinsing with water, the modified tip was dried with nitrogen.
AFM desorption experiments. In desorption experiments17,22−25 single polymer
chains covalently attached to the AFM tip are adsorbed on a solid surface and after-
wards successively desorbed by separating tip and surface. When the tip is approaching
the bare surface, polymers will adsorb onto it. When retracting the AFM tip the molecules
successively desorb from the surface. Thereby desorption takes place under equilibrium

90 Interaction Forces of Poly(l-glutamic acid) with Calcite Crystals
Figure 2. Attachment of PEO-b-PLE carrying primary amine functions at the α-chain end to
an epoxy-functionalized AFM tip.
conditions because of the much faster dynamics of the polymer-surface contacts in compa-
rison to the retraction velocity of the AFM tip (ca. 1 µm/s). In other words, the polymers
are highly mobile on the surface and are able to rearrange on the surface rather than
being pinned to the surface.26 As a consequence, the polymer chains are simply “pulled-
off” from the surface and the desorption process is not loading-rate dependent, i.e. the
detected force is not a function of the retraction velocity of the cantilever. Under these
conditions the desorption process manifests itself as a plateau of constant force in the
force-distance curves. The height of the force plateau represents the magnitude of the
desorption force between the polymer chain and the surface, the mean desorption force is
obtained by a statistical analysis. Note that the desorption force can only be determined
with high accuracy from the last plateau (Fdes in Figure 3) as no intermolecular interac-
tions are contributing here.
In the case of low lateral mobility of the polymers, the observed force-extension traces are
significantly altered - the flat desorption plateaus pass into stretching curves (from which
the elasticity of single polymer chains can be deduced) or a combination of both.26,27
However, if the lateral mobility of the polymers is high as throughout in the experiments
described here, the molecules rearrange on the surface to maximize the adsorption ent-
halpy. Flat force plateaus in the force-extension spectra are then obtained even on rough
surfaces (e.g. etched silicon nitride).28,29 That is, the surface roughness or surface structu-
res (e.g. steps on the calcite surface) are not reflected in the measurements curves under
these conditions.
Moreover, the distance at which the plateau force drops to zero (plateau length) denotes
the complete detachment of the polymer from the surface and thus the number of obser-
ved plateaus equals the number of desorbed polymer chains.

J. Am. Chem. Soc. 91
Figure 3. Illustration of a typical single molecule desorption experiment with polymer chains
covalently attached to the tip of an AFM cantilever.
The AFM desorption measurements were conducted with a home-build instrument. No-
minal spring constants of the cantilevers were calibrated using the thermal oscillation
method. Due to the fact that the calculated spring constants may have deviations of up
to 10%, a single tip was used for an entire set of measurement series for being able to
monitor minute force differences. Thereby, every measurement series consists of 750-1000
force-distance curves. As a consequence, the binding of the polymers to the tip had to
be very robust as with every tip on the order of 20000 force-distance curves had to be
recorded. The usage of a polyamine-block for attaching the molecules to the tip proved
to be highly efficient and long-term stable due to the multiple binding sites.
The covalent attachment of the block copolymer PEO273-b-PLE819 to the AFM tip allows
for studying the interaction of both the PEO and the PLE with the calcite surface in a
single experiment. Figure 4 shows a force plateau as obtained by continuously desorbing
the block copolymer from the calcite (104) face in an aqueous solution with 10 mM CaCl2.
It may be important to point out that due to the attachment of the polymer to the AFM
tip via the amine functions, first the PEO block is desorbed and then the PLE block (see
Figures 2 & 3). This means that at distances larger than the contour length of the PEO273
(∼100 nm) the measured desorption force exclusively originates from the desorption of
PLE monomers.

92 Interaction Forces of Poly(l-glutamic acid) with Calcite Crystals
The interaction force of the PLE is slightly higher than that of PEO, as qualitatively
expected, because PEO is supposed not to adsorb strongly onto a calcite crystal.30 This
is reflected by a sharp transition in force at a distance, which coincides with the contour
length of the PEO273 block (∼100 nm). Note that in Figure 4 the desorption of a single
PEO-b-PLE polymer can be seen, whereas the staircase like pattern in Figure 3 arises
from the desorption of several polymer chains. In the curve presented in Figure 3 the force
transition between the two blocks as shown in Figure 4 is not visible as it is generally
only rarely observed. This is first of all because PEO often does not adsorb on the calcite
surface as was shown in desorption experiments with Polyamine-b-PEO273 on calcite (data
not shown). However, if a desorption plateau was observed, the desorption force equals
the values as found for the PEO in the block copolymer. The finding of rare desorption
events but still “high” desorption force has already been reported in the literature before
for the adsorption of poly(acrylic acid) on self-assembled monolayers.23 In addition to the
reduced PEO adsorption, the “unspecific” peak at small distances in the force-extension
curves often extends to the distance regime where the force transition is expected and
therefore covers the force transition. This is in particular true when several polymers are
adsorbed to the surface and/or the transition distance is shifted to shorter lengths due to
the attachment point of the polymer on the curved AFM tip. Moreover, as soon as several
polymers are desorbed in parallel, intramolecular interactions also contribute, smearing
out the force transition such that it is not detectable any more.
Figure 4. Two force versus distance curves of PEO-b-PLE obtained upon successive desorption
from the calcite (104) surface. At a distance of about 100 nm the transition from desorbing ethy-
lene oxide monomers to glutamate monomers can be seen. If the transition occurs at distances
smaller than 100 nm this is most probably due to the attachment point of the polymer at the
curved AFM tip. The force regime is about 60 pN, the difference in force about 5 pN.
The strength of single molecule desorption measurements, namely the measurement of in-
teraction forces with high precision and the possibility to resolve minute force differences

J. Am. Chem. Soc. 93
is illustrated in Figure 5. Therein a series of force-distance curves is shown, in which the
same PEO-b-PLE molecule was probed over a thousand times. Calcite (104) was used as
solid surface. In the case of occasional contribution of a second chain two plateaus can be
seen in the spectra. The force transition between the two blocks is not observed here as
the unspecific adsorption peak at small distances exceeds the transition regime.
The mean desorption force of the glutamic acid with the calcite crystal is obtained by a
statistical analysis of the plateau force of all curves that exhibit plateaus longer than 200
nm. In this case the PEO block with its contour length of 100 nm is not able to alter the
interaction of the PLE with the calcite surface. The resulting force histogram is shown in
the inset of Figure 5. A typical value for the full width at half maximum (fwhm) is 6 pN,
thus the quantification of the mean desorption forces is possible with a precision of 1-2
pN.
Figure 5. Measurement series consisting of 1000 force-distance curves (10 mM CaCl2, pH
6). Note that only plateaus originating from desorption of PLE can be seen here because the
unspecific adsorption peak at small distances hides desorption of PEO. In all curves the same
molecule is probed. In addition from time to time a second molecule participates. The mean
interaction force is obtained via statistical analysis of the plateau forces (see inset). A typical
value for fwhm of the force histograms is 6 pN.
Calcite crystals. Calcite (104) was provided by R. U. Barz (Institut fur Mineralogie,
LMU Munchen) as well as crystallized by Y. Luo (MPI-KG). In the desorption measure-
ments no differences in the desorption forces were found for the different samples. Calcite
(100) was purchased from MTI Corporation (Richmond, USA).

94 Interaction Forces of Poly(l-glutamic acid) with Calcite Crystals
The Calcite (104) surface and (100) surface both consist of alternating Ca-atoms and
CO3-groups. Differences between the two crystal faces exist in the distance of neighboring
Ca-CO3 and the orientation of CO3-groups (see Supporting Information, Figures SI-5
and SI-6). However, calcite surfaces are not atomically flat in solution and can reform
in solution by etch pits or dissolution-recrystallization. Even stable (104) cleavage planes
reconstruct in moist air through pit formation and film growth.31
Control measurements with poly(l-glutamic acid) Poly(l-glutamic acid) was ob-
tained from Sigma-Aldrich as sodium salt with a molar mass of 750-5000 g/mol (CAS
Number 26247-79-0). Due to the broad molar mass distribution, mass/volume was cho-
sen as the polymer concentration unit instead of molar concentration to have a constant
number of monomer units independent of the polymer molar mass. A 1 mg/ml polymer
solution was titrated with 10 mM CaCl2 solution (see Supporting Information, Figure SI-
3). ζ-potentials were determined with a Zetasizer (Malvern Instruments). Added CaCl2concentrations were chosen for a Ca2+ saturated polyanion solution on basis of the CaCl2titration results (see Supporting Information, Figure SI-4).
Results and Discussion
pH-dependent interaction forces between PLE and calcite (104). The crystalli-
zation process in presence of polymeric additives is strongly dependent on the experimen-
tal conditions like pH or ionic strength of the solution. This was empirically demonstrated
for BaSO4 which has the advantage of a single polymorph with constant morphology over
a wide range of pH and experimental conditions. However, the crystal morphologies could
be varied to a large extent by different polymer additives32 and different pH conditions –
especially for polycarboxylates.33 A general correlation between pH-variation and crystal
morphology could not be established so far.
Desorption measurements were conducted in aqueous 10 mM CaCl2 solution at varying
pH between 6 and 12 and the mean desorption forces between PLE and calcite (104)
were analyzed (see Figure 6). Thereby, the same mean desorption force of ca. 64 pN was
obtained for pH 6 and pH 11 and a slight increase of ca. 4 pN was visible around pH 8.6.
This maximum position of the desorption force in Figure 6 corresponds to the literature
documented point of zero charge (pzc), which was reported to be between pH 8.2 and
9.5.34,35 Therefore, at pH > 10 the calcite surface and the PLE are expected to be nega-
tively charged resulting in a repulsive electrostatic contribution to the desorption force.
As the pKa of the PLE is < pH 636 an electrostatic attraction between the positively
charged calcite surface37−40 and the negatively charged polymer should be expected at
pH 6 - 8 resulting in the highest desorption force in absence of Ca2+. However, this is
clearly not observed in Figure 6 as our experiments were conducted in an excess of 10 mM
Ca2+ and more importantly, the desorption force stays constant below pH 7 and above

J. Am. Chem. Soc. 95
Figure 6. Mean desorption forces in dependence of the pH of the aqueous CaCl2 solution. Each
circle represents an independent measurement series as shown in Figure 3. Error bars represent
the fwhm of the force histograms. An increased force is observed only between pH 8 and 9. In
that regime, the calcite point of zero charge (pzc) is expected.
pH 10.
Based on the interaction forces between PLE and calcite (104) in dependence of the salt
concentration of the aqueous solution (see further below, Figure 7) some additional com-
ments can be given on the pH-dependent interaction forces. First, when screening all
electrostatic interactions between polymer and calcite surface at high salt concentrations,
the desorption force equals the desorption force found at pH 8 – 9. One can therefore
conclude that no electrostatic interactions are contributing to the overall desorption force
in this regime. Second, when decreasing the salt concentration (increasing electrostatic
interactions) at pH 6, the desorption force drops down. That is, the electrostatic inter-
action between polymer and surface is repulsive. From the shape of the curve in Figure
6 one would then conclude that the electrostatic interaction at pH > 9 is repulsive, too.
However, note that due to the small force differences as obtained as a function of the pH,
electrostatic interaction are supposed to be weak. This corresponds either to a weakly
charged polymer, a weakly charged surface or both.
It is known that complexation of Ca2+ and polymers bearing carboxylic groups can occur
as a function of the accessible carboxylate functions41,42 introducing positive charges into
the side chains. We have therefore looked at the Ca2+ binding of PLE at the relevant pH
values by titration experiments and found the expected higher Ca2+ binding at higher
pH as compared to the lower pH (see Supporting Information). Electrokinetic measure-
ments further showed that the ζ-potential of poly(l-glutamic acid) saturated with Ca2+
in solution is still negative (–10 mV at pH 6 and –35 mV at pH 11), but considerably less
negative than that of the polymer itself (–65 mV) (see Supporting Information). Reason
for this is the partial neutralization of the polymer due to the Ca2+ coordination. Nevert-
96 Interaction Forces of Poly(l-glutamic acid) with Calcite Crystals
heless, a further shift of the ζ-potential occurs upon addition of a large excess of Ca2+,
from –35 mV to –20 mV at pH 11 (see Figure SI-4).
The Ca2+ coordination to carbonate groups can be expected in a similar manner as to the
polymer carboxyl groups, which leads to the repulsion of a polymer with pH-dependent
negative charge from an almost neutral crystal surface. This could be an explanation for
the repulsive components yielding the reduced desorption force observed at pH > 10.
At the pzc, one expects an equal distribution of calcium and carbonate ions at the surface.
When decreasing the pH from pH > 10 to pzc, the calcite surface becomes more and more
uncharged and with it the electrostatic repulsion between PLE and calcite less and less
pronounced. As a consequence, the measured desorption forces rise in that pH regime.
For pH < pzc the electrostatic interaction between PLE and calcite is repulsive again,
such that the maximum of the desorption force in Figure 6 reflects the pzc of the calcite
surface.
The observed results for the desorption force at pH < 8, namely a weak electrostatic repul-
sion between PLE and calcite, were the most unexpected findings of the pH-dependent
measurements. At this pH (pH < pzc) the calcite surface has to be expected as Ca2+
terminated, but the polymer will still be neutral to slightly negatively charged (see abo-
ve). In other words, even in presence of Ca2+ in solution a marginal higher desorption
force than at pH = pzc would be expected. However, this conclusion is drawn from a
separate consideration of the properties of the polymer and calcite surface, but not as a
whole. In agreement to our findings for pH <8, namely that the polymer interacts with a
seemingly negatively charged calcite surface at pH < pzc, Seitz et al. found an attracti-
ve/repulsive electrostatic interactions between poly(vinyl amine)/poly(acrylic acid) and
calcite in NaCl solution at pH 6. This also corresponded to a seemingly negatively charged
calcite surface.17
When comparing desorption measurement series in dependence of the pH, qualitative dif-
ferences in adsorption behavior were observed. At pH > 10 the probability of observing
desorption events in the force-extension spectra is decreased (e.g. the consecutive observa-
tion of a thousand desorption plateaus as shown in Figure 3 is extremely unlikely), which
is also reflected in the smaller number of data points in this pH regime in Figure 6. That
is, for PLE molecules adsorption on the calcite surface is less favorable at pH > 10 than at
pH < 8. These different adsorption characteristics may also be regarded as a hint that the
mechanisms that result in the repulsion between PLE and calcite are different for the two
pH regimes. For pH > 10, PLE and calcite are similarly charged and therefore experience
“real” electrostatic repulsion, which may act as an adsorption barrier. For pH < 8, PLE
and calcite are expected to be oppositely charged so that adsorption may be advanta-
geous. In this case one would have to conclude that the measured electrostatic repulsive
force is induced by the adsorption of the PLE on the calcite surface. ζ-potentials indicate
further Ca2+ coordination by the polymer at Ca2+ excess, which would be expected near
the calcite surface under the conditions at pH < pzc.

J. Am. Chem. Soc. 97
In general, the properties of surface adsorbed polyelectrolytes can be significantly changed
with respect to the same molecules in solution, e.g. the dissociation equilibrium can vary
upon adsorption.43−45 Such effects may be even more pronounced at dielectric bounda-
ries due to image charge interactions, which are for example opposing at low dielectric
surfaces.46,47 In particular, charge reversal has been predicted for semiflexible polyelectro-
lytes on charged planar surfaces.48,49
Our findings reveal that the simple epitaxial or even electrostatic view on polymer-crystal
interactions is too simplified to explain the experimental findings and that quantitative
AFM force spectroscopy can yield atomic details of the additive interaction with a crystal
surface in a quantitative manner. Moreover, they point out the ability of this technique to
monitor even small differences in molecular properties arising from the adsorption of po-
lyelectrolyte molecules on charged surfaces. However, further experiments will be needed
to elucidate the detailed individual contributions of the polymer upon interaction with a
crystal surface.
pCa-dependent interaction forces between PLE and calcite (104) / calcite
(100) Concluded from the above results, the synthesis of biomimetic materials on the
basis of calcium carbonates may further be crucially dependent on the calcium concentra-
tion. Among the polymer-crystal interactions, electrostatic ones should be most affected
by a variation of the ionic strength of the solution. The importance of electrostatic inter-
actions was recently pointed out by Volkmer et al., who found that the charge density of
an organic template layer is of importance for tuning the CaCO3 crystallization process
with respect to polymorph selection and crystal orientation under monolayers.50
Desorption experiments were performed at pH 6 of an aqueous solution containing bet-
ween 0.1 mM and 1 M CaCl2. The corresponding mean desorption forces plotted versus
pCa = –log10[Ca], with [Ca] being the concentration of Ca2+ ions in solution, are shown
in Figure 7 for two very similar calcite faces: (104) and (100). For both surfaces a similar
behavior and force differences smaller than 10 pN were observed. It was found that the
desorption forces are highly reproducible at salt concentrations 0 < pCa < 2.5 and non-
reproducible at pCa > 2.5 (see Figure 7).
For interpretation of the findings, two salt dependent contributions to the desorption force
have to be considered: electrostatic screening and polymer charge density.17 In Debye-
Huckel-approximation the electrostatic contribution to the desorption force is proportio-
nal to the surface potential σ, the Debye screening length κ−1 (∝[Ca]−0.5) and the linear
(polymer) charge density τ : Fel ∝ σ · κ−1 · τ . The desorption force then consists of a
non-Coulomb contribution F0 and the electrostatic desorption force Fel. The experimen-
tal data were therefore fit by the following formula: Fdes = F0 + α · σ · τ · [Ca]−0.5 with α
being a constant and [Ca] the fit variable. The surface potential σ was also regarded as
constant.
At high salt concentrations the polymer is maximal charged (τ = 1) and the desorption

98 Interaction Forces of Poly(l-glutamic acid) with Calcite Crystals
Figure 7. Mean desorption forces in dependence of Ca-concentration in solution (pCa = -
log10[Ca]) for A) calcite (104) and B) calcite (100) at pH 6. Two independent measurement series
as shown in Figure 3 were performed at every pCa value (small symbols). In the regime pCa
< 2.5 the measured desorption forces are highly reproducible; large symbols represent weighted
averages of the two data points. Data points were fit by F = F0 + α · σ · τ · [Ca]−0.5 with α =
const., the surface potential σ = const. and the polymer charge density τ . For τ = 1 (dotted
curve) the fit function shows the dependence of the desorption force on electrostatic screening
(Debye screening length κ−1 ∝ [Ca]−0.5); a variable charge density due to e.g. charge regulation
mechanisms was modeled with a titration behavior, τ = 1/(1+exp[(pCa-pD)/t]) (solid line).
force is a function of the ionic strength of the solution. However, τ = 1 does not corre-
spond to a fully charged PLE polymer under the given experimental conditions because
of Ca2+ complexation (see above). At pCa = 0 electrostatic interactions between polymer
and surface are almost completely screened, i.e. Fdes ≈ F0. When decreasing the calcium
concentration to pCa = 1, the PLE is still charged (τ = 1) but electrostatic interactions
with the calcite are less screened and not negligible any more, i.e. Fel 6= 0. In this regime
of “high” ionic strengths, the desorption force decreases proportional to the Debye scree-
ning length (dotted lines in Figure 7). This means that a repulsive interaction, Fel < 0,
between PLE and calcite surface has to be assumed at pH 6! It may be interesting to

J. Am. Chem. Soc. 99
note that the ratio of the fitted surface potentials σ104/σ100 = 1.7 is of the same order of
magnitude as the ratio of the density of ions at the surface (number of ions divided by the
surface area, see also Supporting Information), ρ104/ρ100 = 2.1. This may be interpreted
as a hint that the differences in the measured desorption force between the two crystal
surfaces are caused by different electrostatic interactions.
With decreasing salt concentrations, a phenomenon known as charge regulation has to
be taken into account.49,51 The charge density of all objects with dissociable groups as
for example weak polyelectrolytes is a function of the salt concentration due to repulsive
charge interactions within the polymer. These intramolecular repulsions counter the dis-
sociation reaction of the carboxylic groups of the poly(l-glutamic acid). As electrostatic
interactions are stronger at low salt concentrations (less screening), charge regulation is
more pronounced, too. Thus, the polymer charge density decreases with decreasing salt
concentration. Using the same argument, the charge density of a surface adsorbed poly-
mer is furthermore altered by the surface charges and vice versa.
In order to fit the experimental data the polymer charge density was modeled with a titra-
tion behavior in dependence of pCa (τ = 1/(1+exp[(pCa-pD)/t]), solid lines in Figure 7).
Deflection points of the titration functions were found to be at pD104 = 1.6 for the calcite
(104) and at pD100 = 2.0 for the calcite (100) surface. This finding is in qualitative agree-
ment with the surface charge densities of the calcite surfaces. The larger charge density
of the calcite (104) surface in comparison to the calcite (100) surface leads to a reduction
of the polymer charge already at higher salt concentrations, i.e. lower pCa values.
The desorption forces in the non-reproducible regime at low salt concentrations (pCa ≈3) are dependent on the AFM tip, i.e. the set of molecules. This may again be correlated
with the complexation of Ca2+ ions by the PLE polymer. Due to the attachment process
of the triblock polymer to the AFM tip, the number of bound polymer chains cannot be
controlled and is not known as generally much more polymers are bound to the tip than
seen in the experiments (e.g. because of the tip’s curvature). Thus, the degree of Ca2+
complexation at low salt concentrations, when the number of carboxylic groups in the
PLE polymers is comparable to the number of available Ca2+ ions in solution, may de-
pend on the used AFM tip. However, the effect may also be caused by the calcite surface
itself as in electrophoretic mobility studies a variation of the ζ-potential of calcite (104)
was observed at a similar salt concentration.34
The results on the two calcite faces (104) and (100) shown in Figure 7 indicate that the
desorption forces are delicately dependent on electrostatic interactions. It is a remarkable
observation that significant differences of the desorption forces could be detected for the
structurally similar calcite faces (see e.g. pCa = 2 in Figure 7).
100 Interaction Forces of Poly(l-glutamic acid) with Calcite Crystals
Conclusions
In polymer controlled crystallization processes small variations on the molecular level can
result in large morphological effects on the macroscopic level. We quantitatively investiga-
ted the molecular forces between poly(l-glutamic acid) and calcite on the single molecule
level and showed that a variation of pH and calcium concentration of the solution as well
as a variation of the crystal face led to variations of the interaction forces of comparable
strength. The observations underline that a complex interplay of molecular interactions
has to be assumed for polypeptide-mineral-systems. We demonstrated that quantitative
AFM-based desorption measurements are able to enlighten this interplay on the basis of
the molecular interaction forces with very high precision although the nature of the de-
tected interactions is not yet clear in all cases. In particular, this approach should also be
able to give insight into the dynamics of crystal growth in the presence of polymers as it
involves not only the adsorption, but also the (transient) desorption and conformational
rearrangements of polymer chains at the mineral surface. This could help to correlate
molecular interactions and conformations with macroscopic crystal properties and thus
to control the crystallization and materials properties.
Acknowledgment. Helpful discussions with Dr. Paul Bowen (EPFL, Lausanne), Prof.
Lennart Bergstrom (University of Stockholm), Prof. Thomas Vilgis (MPI Mainz) and
Prof. Roland Netz (TU Munchen) are gratefully acknowledged. We thank Margit Barth
(MPI-KG) for the assistance with the CaCl2 titrations of poly(l-glutamic acid) and Hei-
di Zastrow (MPI-KG) for ζ-potential measurements. This work was supported by the
Deutsche Forschungsgemeinschaft (grants CO 194/1-1, SE 888/3-1 and SFB 486) and the
Fonds der chemischen Industrie.
Supporting Information Available: Polymer synthesis (1H NMR, SEC), titration
of poly(l-glutamic acid) with CaCl2 at different pH, ζ-potential measurements of po-
ly(l-glutamic acid), and illustrations of calcite (104) and (100) surfaces. This material is
available free of charge via the Internet at http://pubs.acs.org.
References
(1) Mann, S. Biomineralization: Principles and Concepts in Bioinorganic Materials
Chemistry ; Oxford University Press: New York, 2001.
(2) Lowenstam, H. A.; Weiner, S. On Biomineralization; Oxford University Press:
New York, 1989.
(3) Simkiss, K.; Wilbur, K. M. Biomineralization: cell biology and mineral deposition;
Academic Press: San Diego, 1989.
(4) Wheeler, A. P.; Sikes, C. S.; Williams, R. J. P., Ed.; VCH: Weinheim, 1989, p 95.
(5) Gotliv, B. A.; Kessler, N.; Sumerel, J. L.; Morse, D. E.; Tuross, N.; Addadi, L.;
J. Am. Chem. Soc. 101
Weiner, S. ChemBioChem 2005, 6, 304-314.
(6) Weiner, S. Calcif. Tissue Int. 1979, 29, 163-167.
(7) Wheeler, A. P.; Low, K. C.; Sikes, S.; Wheeler, A. P., Ed.; American Chemical
Society: Washington DC, 1991, p 72.
(8) Xu, A. W.; Ma, Y. R.; Colfen, H. J. Mater. Chem. 2007, 17, 415-449.
(9) Colfen, H. Top. Curr. Chem. 2007, 271, 1-77.
(10) Colfen, H. Macromol. Rapid Commun. 2001, 22, 219-252.
(11) Yu, S. H.; Colfen, H. J. Mater. Chem. 2004,14, 2124-2147.
(12) Addadi, L.; Berkovitchyellin, Z.; Weissbuch, I.; Vanmil, J.; Shimon, L. J. W.;
Lahav, M.; Leiserowitz, L. Angew. Chem. - Int. Ed. 1985, 24, 466-485.
(13) Addadi, L.; Weiner, S. Angew. Chem. - Int. Ed. 1992, 31, 153-169.
(14) Shi, W. Y.; Wang, F. Y.; Xia, M. Z.; Lei, W.; Zhang, S. G. Acta Chim. Sinica 2006,
64, 1817-1823.
(15) Wang, T. X.; Reinecke, A.; Colfen, H. Langmuir 2006, 22, 8986-8994.
(16) Colfen, H.; Antonietti, M. Angew. Chem. - Int. Ed. 2005, 44, 5576-5591.
(17) Seitz, M.; Friedsam, C.; Jostl, W.; Hugel, T.; Gaub, H. E. ChemPhysChem 2003,
4, 986-990.
(18) Smith, B. L.; Schaffer, T. E.; Viani, M.; Thompson, J. B.; Frederick, N. A.;
Kindt, J.; Belcher, A.; Stucky, G. D.; Morse, D. E.; Hansma, P. K. Nature 1999,
399, 761-763.
(19) Kataoka, K.; Harada, A.; Nagasaki, Y. Adv. Drug Delivery Rev. 2001, 47, 113-131.
(20) Justynska, J.; Hordyjewicz, Z.; Schlaad, H. Polymer 2005, 46, 12057-12064.
(21) ISOCHEM. French Patent EP 1 201 659 A1, 2002.
(22) Hugel, T.; Grosholz, M.; Clausen-Schaumann, H.; Pfau, A.; Gaub, H.; Seitz, M.
Macromolecules 2001, 34, 1039-1047.
(23) Friedsam, C.; Becares, A. D.; Jonas, U.; Seitz, M.; Gaub, H. E. New J. Phys. 2004,
6, 9.
(24) Cui, S. X.; Liu, C. J.; Wang, Z. Q.; Zhang, X. Macromolecules 2004, 37, 946-953.
(25) Chatellier, X.; Senden, T. J.; Joanny, J. F.; di Meglio, J. M. Europhys. Lett. 1998,
41, 303-308.
(26) Kuhner, F.; Erdmann, M.; Sonnenberg, L.; Serr, A.; Morfill, J.; Gaub, H. E.
Langmuir 2006, 22, 11180-11186.
(27) Hugel, T.; Seitz, M. Macromol. Rapid Commun. 2001, 22, 989-1016.
(28) Sonnenberg, L.; Parvole, J.; Kuhner, F.; Billon, L.; Gaub, H. E. Langmuir 2007,
23, 6660-6666.
(29) Sonnenberg, L.; Parvole, J.; Borisov, O.; Billon, L.; Gaub, H. E.; Seitz, M.
Macromolecules 2006, 39, 281-288.
(30) Colfen, H.; Qi, L. M. Chem.-Eur. J. 2001, 7, 106-116.
(31) Kendall, T. A.; Martin, S. T. J. Phys. Chem. A 2007, 111, 505-514.
(32) Qi, L. M.; Colfen, H.; Antonietti, M. Angew. Chem.-Int. Ed. 2000, 39, 604.
102 Interaction Forces of Poly(l-glutamic acid) with Calcite Crystals
(33) Qi, L. M.; Colfen, H.; Antonietti, M. Chem. Mater. 2000, 12, 2392-2403.
(34) Moulin, P.; Roques, H. J. Colloid Interface Sci. 2003, 261, 115-126.
(35) Churchill, H.; Teng, H.; Hazen, R. M. Am. Mineral. 2004, 89, 1048-1055.
(36) Schlaad, H. Adv. Polym. Sci. 2006, 202, 53-73.
(37) Vancappellen, P.; Charlet, L.; Stumm, W.; Wersin, P. Geochim. Cosmochim. Acta
1993, 57, 3505-3518.
(38) Fenter, P.; Geissbuhler, P.; DiMasi, E.; Srajer, G.; Sorensen, L. B.; Sturchio, N. C.
Geochim. Cosmochim. Acta 2000, 64, 1221-1228.
(39) Pokrovsky, O. S.; Mielczarski, J. A.; Barres, O.; Schott, J. Langmuir 2000, 16,
2677-2688.
(40) Lin, Y. P.; Singer, P. C. Geochim. Cosmochim. Acta 2005, 69, 4495-4504.
(41) Madsen, F.; Peppas, N. A. Biomaterials 1999, 20, 1701-1708.
(41) Kriwet, B.; Kissel, T. Int. J. Pharm. 1996, 127, 135-145.
(43) Burke, S. E.; Barrett, C. J. Langmuir 2003, 19, 3297-3303.
(44) Sukhishvili, S. A.; Granick, S. Langmuir 2003, 19, 1980-1983.
(45) Xie, A. F.; Granick, S. Nat. Mater. 2002, 1, 129-133.
(46) Netz, R. R. J. Phys.: Condens. Matter 2003, 15, S239-S244.
(47) Netz, R. R. Phys. Rev. E 1999, 60, 3174-3182.
(48) Netz, R. R.; Joanny, J. F. Macromolecules 1999, 32, 9013-9025.
(49) Boroudjerdi, H.; Kim, Y. W.; Naji, A.; Netz, R. R.; Schlagberger, X.; Serr, A.
Phys. Rep. 2005, 416, 129-199.
(50) Volkmer, D.; Fricke, M.; Agena, C.; Mattay, J. J. Mater. Chem. 2004, 14,
2249-2259.
(51) Friedsam, C.; Gaub, H. E.; Netz, R. R. Europhys. Lett. 2005, 72, 844-850.

J. Am. Chem. Soc. 103
Supporting Information
Polymer synthesis
Polybutadiene-block -poly(ethylene oxide)-block -poly(γ-benzyl l-glutamate) (PB-b-PEO-
b-PBLE):
Figure SI-1. 1H NMR spectrum (400.1 MHz, solvent: DMF-d7)
of PB-b-PEO-b-PBLE.
Figure SI-2. Size-
exclusion chromato-
gram (eluent: THF) of
PB-b-PEO-b-PBLE.

104 Interaction Forces of Poly(l-glutamic acid) with Calcite Crystals
Titration of poly(l-glutamic acid) with CaCl2
Figure SI-3. Titration of 80 ml of a 1 mg/ml solution of poly(l-glutamic acid) sodium salt
with 10 mM CaCl2 at different pH. The titration speed of the CaCl2 solution was 4 ml/h. The
y-axis displays the Ca2+ concentration in solution measured by a Ca2+ sensitive electrode. It is
clearly evident that the polymer binds more Ca2+ at higher pH.
Zeta-potential measurements of poly(l-glutamic acid)
Figure SI-4. ζ-potential of a poly(l-glutamic acid) sodium salt solution with added CaCl2solution at different pH values. 160 µmol CaCl2 correspond to 14400 s in Figure SI-3, where at
all pH, excess Ca2+ is already found in solution. Nevertheless, addition of a large excess of Ca2+
(1600 µmol) gives a less negative ζ-potential than for 160 µmol CaCl2. The dashed line at –65
mV indicates the reference of the pure polymer solution.

J. Am. Chem. Soc. 105
Calcite surfaces
Side view:
Figure SI-5. Calcite surface cuts; left: calcite (104), right: calcite (100).
Top view:
Figure SI-6. Unit cells of the calcite surfaces; top: calcite (104), bottom: calcite (100).

106 Interaction Forces of Poly(l-glutamic acid) with Calcite Crystals

107
E Novel Method for Generation of Additive-Free
High Energy Crystal Faces and their Reconstruc-
tion in Solution
Yufei Luo, Lars Sonnenberg and Helmut Colfen
Abstract Additive-free high-energy faces of CaCO3 in the calcite modification were
synthesized and found to reconstruct fast into the stable (104) faces in solution within
two hours, which is not observed in the bad solvent ethanol. (104) faces can be detected
by single molecule force spectroscopy. A novel embedding process of calcite crystals with
defined exposed surfaces generated on a self-assembled surfactant monolayer into a silica
monolith is described as well as the time resolved analysis of the reconstruction of unsta-
bilized high-energy surfaces which is faster than assumed from the equilibrium Wulff rule.
Crystal engineering is of great importance in science and industry as the properties of
crystalline systems depend on their morphology. According to Wulff’s rule,1 the thermo-
dynamic prediction of the crystal morphology is the minimum of the sum of the products
between surface area and surface energy for the different faces of a crystal. Crystal faces
with low surface energy therefore get exposed in the equilibrium morphology.
In order to change the morphology of a crystal by changing the surface energy of selected
crystal faces, a large variety of additives or templates can be applied including polymers,2
monolayers,3−9 low molar mass substances10 or even simple ions.11 However, for some
applications, pure crystal surfaces are needed, which are not covered by an additive. If
they have a high surface energy, these surfaces should not be stable according to Wulff’s
rule and get reconstructed to the equilibrium morphology. It was therefore the aim of this
work to synthesize additive free high energy crystal surfaces and to investigate, in how far,
and how fast non-stabilized high-energy crystal faces undergo reconstruction in solution
systems. We chose calcium carbonate (CaCO3) due to its great scientific and industrial
importance.12,13 For this crystal system, stabilized high-energy faces are frequently found
like for example the (001) face in the biomineral aragonite.14 The stable calcite polymorph
has a typical rhombohedral equilibrium shape exposing six (104) faces. Therefore, we can
expect to detect possible surface reconstruction effects of high-energy surfaces by means
of surface sensitive scanning techniques like scanning force microscopy (SFM).

108 Additive-Free High Energy Crystal Faces (in Solution)
We synthesized different calcite high-energy surfaces on self-assembled monolayers
(SAM) of HS(CH2)15COOH (Aldrich, 90%) on silver coated mica by literature repor-
ted methods.15 The monolayers were formed by exposing the silver coated surfaces to a
10 mM solution of the thiol in ethanol for 24 h, followed by washing with ethanol and
distilled water. The substrates were then stuck on supports and placed upside-down in
10 mM CaCl2 solution in a closed desiccator containing vials of NH4HCO3. To minimize
contamination of the SAMs, the substrates were placed into the CaCl2 solution immedia-
tely after they were taken out of the thiol solution. The vials with CaCl2 and NH4HCO3
were closed with parafilm and three needle holes were punched into the film. Experiments
were carried out at room temperature for 24h. Small calcite crystals about 0.1-0.5 mm in
diameter were then formed on the surfaces.
We then embedded the calcite crystals on the surface into a silica monolith. In a 25 ml
beaker, tetramethylorthosilicate (TMOS, 10 g) and deionized water (2 g) were mixed and
HCl (0.01 M, 0.6 ml) was added to catalyze the reaction. After sonicating the reaction
mixture for 20 min, the silica sol was formed. The sonicated sol (1 ml) was mixed with
Na2HPO3 (1 ml, 0.01 M, pH 6.0) and afterwards, the mica chip with the calcite crystals
was put into the beaker with the calcite crystals facing the sol. The samples were aged
and dried for 1 week. Afterwards, they were calcined at 400◦C in an oven for 4 hours to
remove the thiol. Thermogravimetry (data not shown) shows that already after 20 min
of a 20 K/min heating ramp, 89% of the thiol is removed at 400◦C. After this treatment,
the mica chip could be easily removed from the silica monolith with the now embedded
calcite crystals. These calcite crystals now expose their triangular high energy surfaces
(001) & (012) at the monolith surface and were used for the further investigations. The
whole process is illustrated in Fig. 1.
The identification of the high-energy calcite surfaces in the silica monolith was carried
out via their interface angles. Identification of crystal faces by their interfacial angles may
become a difficult issue when the crystal under consideration is viewed under an angle
differing from 90◦ with respect to the surface to be identified. In such case, the determi-
ned interfacial angles will be different from their true values. However, this problem was
clearly circumvented by the strategy of embedding the calcite crystals grown in oriented
fashion on a self assembled monolayer (SAM) into a silica monolith, which after complete
removal of the organics (by thermal treatment) ensures that the crystal faces are viewed
exactly from their previous contact side with the SAM.
Therefore, the exposed calcite surfaces could be identified by the angles between the fa-
ces using light microscopy (Olympus BX 41 optical microscope equipped with a digital
camera Olympus Camedia C-5060, 5.1 Megapixel and polarization filters). For the (012)
faces, the ideal angles are 51.95◦, 76.11◦ and 51.95◦. For the (001) face, they are all 60◦
as determined by calculations using Cerius2 (Accelrys). These high-energy surfaces can
either expose only Ca2+ or CO2−3 on the surface (Fig. 2, computer calculations of the
surfaces). As a test, the freshly prepared surfaces were immersed in a solution of 0.01 M
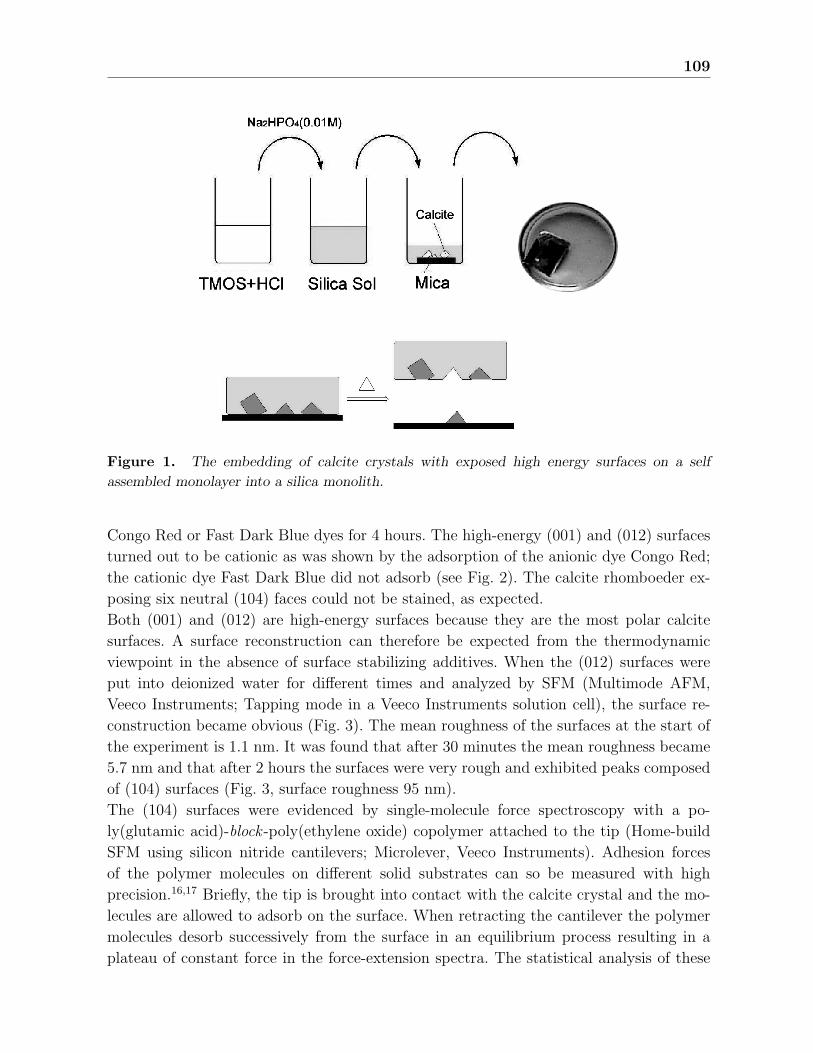
109
Figure 1. The embedding of calcite crystals with exposed high energy surfaces on a self
assembled monolayer into a silica monolith.
Congo Red or Fast Dark Blue dyes for 4 hours. The high-energy (001) and (012) surfaces
turned out to be cationic as was shown by the adsorption of the anionic dye Congo Red;
the cationic dye Fast Dark Blue did not adsorb (see Fig. 2). The calcite rhomboeder ex-
posing six neutral (104) faces could not be stained, as expected.
Both (001) and (012) are high-energy surfaces because they are the most polar calcite
surfaces. A surface reconstruction can therefore be expected from the thermodynamic
viewpoint in the absence of surface stabilizing additives. When the (012) surfaces were
put into deionized water for different times and analyzed by SFM (Multimode AFM,
Veeco Instruments; Tapping mode in a Veeco Instruments solution cell), the surface re-
construction became obvious (Fig. 3). The mean roughness of the surfaces at the start of
the experiment is 1.1 nm. It was found that after 30 minutes the mean roughness became
5.7 nm and that after 2 hours the surfaces were very rough and exhibited peaks composed
of (104) surfaces (Fig. 3, surface roughness 95 nm).
The (104) surfaces were evidenced by single-molecule force spectroscopy with a po-
ly(glutamic acid)-block -poly(ethylene oxide) copolymer attached to the tip (Home-build
SFM using silicon nitride cantilevers; Microlever, Veeco Instruments). Adhesion forces
of the polymer molecules on different solid substrates can so be measured with high
precision.16,17 Briefly, the tip is brought into contact with the calcite crystal and the mo-
lecules are allowed to adsorb on the surface. When retracting the cantilever the polymer
molecules desorb successively from the surface in an equilibrium process resulting in a
plateau of constant force in the force-extension spectra. The statistical analysis of these

110 Additive-Free High Energy Crystal Faces (in Solution)
Figure 2. Staining of different calcite crystal surfaces with anionic Congo Red and cationic
Fast Dark Blue dyes. Upper row: (104), Center row: Left: (001), Center (012), Right (012);
Lower row. Atomar display of the different calcite surfaces.
Figure 3. Time-dependent SFM-imaging of calcite (012) surfaces (1×1 µm2).
plateau forces leads to the mean adhesion force of the polymer on the surface.
Adhesion forces for poly(glutamic acid) on different calcite faces in aqueous solution con-
taining 10 mM CaCl2 were investigated: 65 pN (104), 66 pN (012) and 58 pN (100). The

111
given forces are the averages of two measurement series, each including 750 – 1000 force-
extension curves. Each measurement series was done on (104), (100) & (012) using the
same AFM tip to maximize the accuracy of the measurements (this avoids the ca. 10%
uncertainty for the forces, which is generated by cantilever calibration). The well-defined
force histograms as obtained with this type of measurements allow for the determination
of the adhesion forces with a precision of ca. 2 pN.18
The measured adhesion forces can therefore be regarded equal for the (104) and (012) sur-
face, while a difference was observed for the (100) face. In principle, for a cationic (012)
face a higher adhesion force is expected meaning that the (012) has to have transformed
into a crystal face which is more similar to (104) than the (100) plane. This supports that
the (012) surface recontructs into a (104) face under the given experimental conditions.
The reconstruction of the (012) to the (104) faces is so significant, that it becomes even
visible in a light microscope (Fig. 4). This result clearly shows that the (012) surfaces
are not stable in water and are reconstructed to (104) faces forming calcite rhombohedra
already within two hours. The same result was obtained, when the (012) surfaces were
exposed to saturated CaCO3. This is supportive of a dissolution-recrystallization mecha-
nism rather than an etching process, which could lead to similar surface morphologies.
Figure 4. Surface reconstruction of a calcite (012) surface observed with polarized light mi-
croscopy.
Our data are in qualitative agreement with the literature reported dynamic nature of
calcite surfaces. Even on the stable (104) faces, the formation of holes and hillocks of up
to 10 calcite monolayers was observed on freshly cleaved faces in presence of moisture19
and very recently the calcite (104) surface reconstruction in moist air was suggested to
lead to islands of hydrated CaCO3.20 A small 0.06 nm calcite surface reconstruction was
also observed by rotation of a part of the carbonate groups around the C-O bond axis.21
However, other investigations reported no reconstruction of calcite (104) in moisture.22
The above literature results on calcite (104) reconstruction suggest that the reconstructi-
on we observed for (001) and (012) is a dissolution-recrystallization process rather than

112 Additive-Free High Energy Crystal Faces (in Solution)
an etching process, which is supported by the observation that the surface reconstruction
also takes place in saturated CaCO3. To test the role of a good solvent, we performed the
same measurements as shown in Fig. 4 for the high-energy surfaces in absolute ethanol
(a poor solvent). Here, the surface did not change over the time period of 1 day (data
not shown), demonstrating that the reconstruction process is indeed mediated by a good
solvent (Etching as well as dissolution-recrystallization process). Further support comes
from the finding that the surfaces were stable for a long time when kept in a dry environ-
ment.
In summary, we presented a novel method to prepare defined additive free high ener-
gy calcite faces. In addition, we could reveal that high energy calcite surfaces cannot
exist in solution of a good solvent if they are not stabilized by additives. Instead, they
get reconstructed within two hours to form stable (104) faces, which could be evidenced
by single molecule force spectroscopy as a method, which is sensitively able to distin-
guish between different crystal faces. Whether the surfaces reconstruct via etching or
dissolution-recrystallization can not unequivocally be stated but the fact that the surface
transformation is also observed in saturated CaCO3 solution supports the dissolution-
recrystallization mechanism. Surfaces are stable and do not reconstruct when kept in dry
environment or in a bad solvent.
Our results have impact on crystal design in general and can be expected to be quite
universally valid. Crystals with high-energy surfaces, which can be generated by kinetic
crystallization pathways cannot be kept in a solvent for a long time because their surfaces
will get reconstructed. The construction of the equilibrium morphology is a relatively fast
process, although the Wulff construction is an equilibrium consideration. This points to-
wards the need for surface stabilization of high-energy surfaces, which is the only reason,
why such faces can be observed at all in biominerals and synthetic crystals formed in the
presence of additives.
Acknowledgment We thank Helmut Schlaad for helpful discussions and the Max
Planck Society as well as the German Research Foundation DFG (grants CO 194/1-1
and SE 888/3-1) for financial support. Anne Heilig is acknowledged for the time resolved
SFM measurements.
References
(1) Wulff, G., Z. Krystallogr. 1901, 34, 449-530.
(2) Yu, S. H.; Colfen, H., J. Mater. Chem. 2004, 14, 2124-2147.
(3) Mann, S.; Archibald, D. D.; Didymus, J. M.; Douglas, T.; Heywood, B. R.;
Meldrum, F. C.; Reeves, N. J., Science 1993, (261), 1286-1292.
(4) Heywood, B. R., Chem. Mater. 1994, 6, 311-318.
(5) Berman, A.; Ahn, D. J.; Lio, A.; Salmaeron, M.; Reichert, A.; Charych, D., Science
113
1995, 269, 515-518.
(6) Berman, A.; Charych, D., J. Cryst. Growth 1999, (198-199), 796-801.
(7) Aizenberg, J.; Black, A. J.; Whitesides, G. M., Nature 1999, 398, 495-498.
(8) Han, Y.-J.; Aizenberg, J., Angew. Chem. Int. Ed. 2003, 42, 3668-3670.
(9) Travaille, A. M.; Kaptijn, L.; Verwer, P.; Hulsken, B.; Elemans, J. A. A. W.;
Nolte, R. J. M.; van Kempen, H., J. Am. Chem. Soc. 2003, 125, 11571-11577.
(10) Mann, S.; Didymus, J. M.; Sanderson, N. P.; Aso-Samper, E. J.; Heywood, B. R.,
J. Chem. Soc. Faraday Trans. 1 1990, 86, 1873-1880.
(11) Titiloye, J. O.; Parker, S. C.; Osguthorpe, D. J.; Mann, S., J. Chem. Soc. Chem.
Commun. 1991, 20, 1494-1496.
(12) Meldrum, F. C., Int. Mater. Rev. 2003, 48, 187-224.
(13) Colfen, H., Curr. Opin. Colloid Interface Sci. 2003, 8, 23-31.
(14) Falini, G.; Albeck, S.; Weiner, S.; Addadi, L., Science 1996, 271, 67-69.
(15) Aizenberg, J.; Black, A. J.; Whitesides, G. M., J. Am. Chem. Soc. 1999, 121,
4500-4509.
(16) Hugel, T.; Seitz, M., Macromol. Rapid Commun. 2001, 22, 989-1016.
(17) Seitz, M.; Friedsam, C.; Jostl, W.; Hugel, T.; Gaub, H. E., ChemPhysChem 2003,
4, 986-990.
(18) Sonnenberg, L.; Parvole, J.; Kuhner, F.; Billon, L.; Gaub, H. E., Langmuir 2007,
23, 6660-6666.
(19) Stipp, S. L. S.; Gutmannsbauer, W.; Lehmann, T., Amer. Mineralog. 1996, 81, 1-8.
(20) Kendall, T. A.; Martin, S. T., J. Phys. Chem. A 2007, 111, 505-514.
(21) Jin, M. X.; Shimada, E.; Ikuma, Y., J. Ceram. Soc. Jap. 1999, 107, 1166-1170.
(22) Magdans, U.; Gies, H.; Torrelles, X.; Rius, J., Eur. J. Mineral. 2006, 18, 83-91.

Danksagung
Mein Dank gilt Prof. Hermann Gaub fur die Moglichkeit meine Dissertation in seiner
Gruppe (Gambicrew) an der LMU unter exzellenten Arbeitsbedingungen angefertigt
haben zu konnen. In den zahlreichen wissenschaftlichen Diskussionen und durch die
weitreichenden Gestaltungsfreiheiten konnte ich viel lernen und neue Einblicke in die
Forschungslandschaft gewinnen.
Herzlich bedanken mochte ich mich ebenfalls bei Dr. Markus Seitz, der nicht nur
die interessanten Projekte der Biomineralisation und der gepfropften Polymere initiiert
hat, sondern auch nach Verlassen seiner Universitatslaufbahn stets bereit war, die
Projekte weiterzuverfolgen und mich zu unterstutzen.
Prof. Roland Netz danke ich fur die Ubernahme des Zweitgutachtens.
Fur die hervorragende Zusammenarbeit und die zahlreichen Diskussionen rund um
die Biomineralisation danke ich Dr. Helmut Colfen und Dr. Helmut Schlaad. Yufei Luo
danke ich fur die Synthese der Blockcopolymere, die Herstellung der Hochenergiekristall-
flachen und die Beantwortung der vielen kleinen Fragen.
Mein Dank geht ebenso nach Frankreich an Dr. Laurent Billon und Dr. Oleg Bori-
sov, zum einen fur die vielen Diskussionen in Bezug auf gepfropfte Polymere, zum
anderen fur die informative und angenehme Zeit in Pau im Rahmen des DAAD Procope
Austauschprojekts. Dr. Julien Parvole danke ich fur die Synthese der Polymermonolagen,
sowie deren chemische Charakerisierung.
Bei Prof. Thorsten Hugel mochte ich mich fur die vielen Diskussionen und hilfrei-
chen Tipps rund um die Desorptionsmessungen bedanken.
Ferner haben auch alle Mitglieder der Gambicrew, die mir durch Diskussionen,
Ratschlage, tatkraftige Unterstutzung oder die nette Atmosphare am Lehrstuhl geholfen
haben, ein großes Dankeschon verdient.
Meinem Gegenuber Stefan Kufer danke ich fur das Korrekturlesen und die vielen privaten
und wissenschaftlichen Diskussionen. Ebenfalls danke ich dem Polymerreibungsteam
Ferdinand Kuhner und Matthias Erdmann fur Diskussionen. Matthias danke ich daruber-
hinaus fur das Korrekturlesen der Arbeit. Weiterhin danke ich meinem Werkstudenten
Lorenz Rognoni fur die Hilfe beim Aufbau und Testen des AFM, Angelika Kardinal
fur die Herstellung der DNA-Proben und Martin Benoit fur die Unterstutzung beim
AFM-Basteln.

Allen voran mochte ich mich aber herzlich bei Barbara fur die uneingeschrankte
Unterstutzung und die vielen schonen gemeinsamen Momente bedanken. Meinen Eltern
und meiner Oma danke ich fur die Unterstutzung wahrend des gesamten Studiums.
Mein Dank gilt auch Wolfgang und Maria fur das Interesse an meiner Arbeit und das
Korrekturlesen. Schlussendlich danke ich noch Moritz, dass ich nicht immer alleine ins
Institut radeln musste.