affordable energy efficiency practices for new single family homes
TRANSCRIPT
1
AFFORDABLE ENERGY EFFICIENCY PRACTICES FOR NEW SINGLE FAMILY HOMES IN ALACHUA COUNTY
By
CHRISTOPHER S. HUDSON
A THESIS PRESENTED TO THE GRADUATE SCHOOL OF THE UNIVERSITY OF FLORIDA IN PARTIAL FULFILLMENT
OF THE REQUIREMENTS FOR THE DEGREE OF MASTER OF ENGINEERING
UNIVERSITY OF FLORIDA
2008
2
© 2008 Christopher S. Hudson
3
To my family; Mom, Dad, and Sarah For your support and encouragement in all of my academic endeavors
4
ACKNOWLEDGMENTS
I would like to thank Dr. Ralph Ellis for his assistance and supporting my topic. Your
open door policy helped more than you know. My gratitude to Dr. Charles Kibert for his
expertise and guidance in green building construction. Finally, I thank my family and friends for
their encouragement.
5
TABLE OF CONTENTS page
ACKNOWLEDGMENTS ...............................................................................................................4
LIST OF TABLES...........................................................................................................................8
LIST OF FIGURES .......................................................................................................................10
ABSTRACT...................................................................................................................................11
CHAPTER
1 INTRODUCTION ..................................................................................................................12
Statement of Problem/Importance of Energy Efficient Homes..............................................12 Objective.................................................................................................................................13 Contribution to Alachua County Homes ................................................................................13
2 LITERATURE REVIEW .......................................................................................................14
Net Zero Energy Homes .........................................................................................................14 Passive Solar Design...............................................................................................................15 Individual Traditional End-Use Components and Design......................................................16
Roof Design and Materials..............................................................................................16 Overhangs and Shading...................................................................................................17 Windows..........................................................................................................................18 Insulation .........................................................................................................................19 HVAC..............................................................................................................................19
Heating .....................................................................................................................20 Air conditioning .......................................................................................................20 Air ducts ...................................................................................................................21 Ventilation................................................................................................................22
Hot Water Heater.............................................................................................................22 Types ........................................................................................................................22 Energy types and costs .............................................................................................23 Reducing hot water demand.....................................................................................24
Other End-Use Components ...................................................................................................24 Lighting ...........................................................................................................................25 Major Appliances ............................................................................................................25
Dishwasher ...............................................................................................................25 Clothes washers........................................................................................................26 Dryers .......................................................................................................................26 Refrigerators.............................................................................................................26 Oven/stove................................................................................................................27
Electronics .......................................................................................................................27 Phantom Loads .......................................................................................................................27
6
Solar Panels ............................................................................................................................28 Mounting the arrays.........................................................................................................29 Geographic location.........................................................................................................29
Residents Habits .....................................................................................................................30 Conclusion ..............................................................................................................................30
3 METHODOLOGY .................................................................................................................34
4 RESULTS AND ANALYSIS.................................................................................................35
Section 1: Model House Plans................................................................................................35 Section 2: Components ...........................................................................................................36
Low-End Components.....................................................................................................36 HVAC system ..........................................................................................................36 Lights........................................................................................................................36 Roof and overhangs..................................................................................................36 Windows...................................................................................................................37 Roof insulation .........................................................................................................37 Exterior paint............................................................................................................37 Hot water heater .......................................................................................................37 Appliances................................................................................................................37
High-End Components ....................................................................................................38 HVAC system ..........................................................................................................38 Lights........................................................................................................................38 Roof and overhangs..................................................................................................39 Windows...................................................................................................................39 Roof Insulation.........................................................................................................39 Exterior paint............................................................................................................39 Solar hot water heater...............................................................................................39 The PV System.........................................................................................................40 Appliances................................................................................................................40
Section 3: Household Energy Consumption Analysis............................................................41 Model House with Low-End Components Energy Summary.........................................41 Model House with Effects of Upgrading Individual Components Energy
Summaries....................................................................................................................41 All High-End Components Energy Summary.................................................................42
Section 4: Component and Appliance Simple Payback Period and SIR Analysis .................42 Individual Components Analysis ....................................................................................43 ENERGY STAR Appliances Analysis............................................................................44
Section 5: Favorable Components Analysis ...........................................................................44 Favorable Components and Appliances Energy Summary .............................................44 SIR and Payback Summary for Upgrades .......................................................................45
Section 6: Life Cycle Cost Analysis with Financing..............................................................45
5 CONCLUSIONS AND RECOMMENDATIONS.................................................................61
Conclusions.............................................................................................................................61

7
Recommendations...................................................................................................................62 APPENDIX
A COMPONENTS LIFE CYCLE COST ANALYSIS..............................................................63
B BAPPLIANCE LIFE CYCLE COST ANALYSIS ................................................................82
LIST OF REFERENCES...............................................................................................................85
BIOGRAPHICAL SKETCH .........................................................................................................88
8
LIST OF TABLES
Table page 2-1 Best Practices List..............................................................................................................33
4-1 Low-End Components Summary.......................................................................................51
4-2 High-End Components Summary ......................................................................................52
4-3 Rebates Summary ..............................................................................................................52
4-4 Electricity End Use Summary for Model Home and Individual Upgraded Components .......................................................................................................................53
4-5 Hot Water Gas Consumption Summary ............................................................................53
4-6 Model House Florida Building Code Summary ................................................................54
4-7 Individual High-End vs. Low-End Components SIR and Payback Summary ..................54
4-8 ENERGY STAR vs. Non-ENERGY STAR Appliances SIR and Payback Summary......54
4-9 Energy End Use Comparisons ...........................................................................................55
4-10 SIR, Simple Payback Period, and Cost Premium of All Upgrades and Favorable SIR Upgrades without Financing ..............................................................................................56
4-11 LCC for Financing All Upgrades vs. None .......................................................................57
4-12 LCC for Financing Favorable SIR Upgrades vs. None .....................................................59
A-1 Low-E Windows Life Cycle Cost Analysis.......................................................................63
A-2 CFL Life Cycle Cost Analysis...........................................................................................64
A-3 Solar Hot Water Heater Life Cycle Cost Analysis ............................................................66
A-4 Insulation Life Cycle Cost Analysis ..................................................................................68
A-5 Light Colored Exterior Paint Life Cycle Cost Analysis ....................................................70
A-6 White Metal Roof and Large Overhangs Life Cycle Cost Analysis..................................72
A-7 HVAC System Life Cycle Cost Analysis ..........................................................................74
A-8 PV System Life Cycle Cost Analysis ................................................................................76
A-9 Favorable SIR Components Life Cycle Cost Analysis......................................................78
9
A-10 All Upgraded Components Life Cycle Cost Analysis .......................................................80
B-1 ENERGY STAR Washing Machine Life Cycle Cost Analysis.........................................82
B-2 ENERGY STAR Dishwasher Life Cycle Cost Analysis...................................................83
B-3 ENERGY STAR Refrigerator Life Cycle Cost Analysis ..................................................84
10
LIST OF FIGURES
Figure page 2-1 Example of Properly Sized Overhang................................................................................31
2-2 Factors for Overhang Equation..........................................................................................32
4-1 Floor Plan...........................................................................................................................46
4-2 Elevation View...................................................................................................................47
4-3 Model Home Energy Summary .........................................................................................48
4-4 All High-End Components and Appliances Energy Summary..........................................49
4-5 Favorable SIR Components and Appliances Energy Summary ........................................50
11
Abstract of Thesis Presented to the Graduate School of the University of Florida in Partial Fulfillment of the Requirements for the Degree of Master of Engineering
AFFORDABLE ENERGY EFFICIENCY PRACTICES FOR NEW SINGLE FAMILY HOMES IN ALACHUA COUNTY
By
Christopher S. Hudson
May 2008
Chair: Ralph D. Ellis Major: Civil Engineering
Energy efficiency practices are generally ignored in affordable housing because of the
additional upfront costs for better materials, designs, and components. However, savings in
energy often offsets the higher initial costs and can add value to the home, be cheaper to
maintain, and reduce utility bills.
Our objective was to explore best practices in energy efficiency for the Florida climate in
an effort to create a net zero energy home and compare the additional costs to energy savings.
Upgrades to the roof and overhangs, windows, insulation, hot water heater, paint, lights, major
appliances, and adding solar panels were all looked at to determine if the added costs were
worthwhile investments. Results show that all of the upgrades individually, with the exception
of the roof and overhangs, windows, and washing machine, proved to be a good investment.
Results of my study could help homeowners, contractors, and subcontractors justify additional
costs in energy efficiency upgrades.
12
CHAPTER 1 INTRODUCTION
In today’s construction industry it is quite common for contractors to complete a job for
the lowest cost possible, especially when the project is affordable housing. There is a misbelief
that higher initial costs in energy efficient designs, materials, and appliances are not worth the
additional costs. There are many energy efficient designs and components that cost little to
nothing up front. Residents in affordable housing are the ones most in need of lowering their
utility bills and with a fast payback period of the additional costs associated with energy efficient
practices.
Statement of Problem/Importance of Energy Efficient Homes
“Florida’s per capita residential electricity demand is among the highest in the country”
(Energy Information Administration, 2008). The climate in Florida is unlike most of the United
States and promotes higher electricity consumption (through a cooling end use) for two reasons:
(1) humidity and (2) high temperatures during the long summer.
Affordable homes are notorious for consuming high amounts of electricity because of a
lower quality of design, poor construction practices, components, and appliances. With
mortgage payments, one knows what they are getting into before moving into a home. However,
utility bills vary month to month and come in second (behind mortgage) on the amount spent on
a home. The “affordable” home may not be quite what it seemed because of poor energy
efficiency. Residents may not be able to afford the cost of utilities along with their low monthly
mortgages. With the cost of energy rising, energy efficiency in the residential sector needs to be
addressed.

13
Objective
Our objective was to determine combinations of affordable housing components and
appliances that are energy and cost efficient with a short payback period. Energy consumption
will be estimated by the software “EnergyGauge USA – FlaRes 2007” for a three bedroom, two
bathroom home based on housing plans obtained from Habitat for Humanity. Energy saving
comparisons will be made for high-end vs. low-end roofs, insulation levels, HVAC systems, hot
water heaters, lights, windows, and appliances. Solar hot water heaters and photovoltaic (PV)
systems will also be considered. Finally, the payback periods and savings-to-investment ratio
(SIR) from electricity and natural gas savings for the upgrades will be determined.
Contribution to Alachua County Homes
The contribution of this research is developing a list of energy efficient upgrades for homes
that have short payback periods and a positive SIR. Contractors and homeowners looking to
determine which upgrades are worthwhile if keeping initial costs low is an issue could use this
list. It could also assist local utility companies in determining what types of energy efficiency
upgrades to give rebates for. Since many of the assumptions made are specific to Alachua
County, energy savings would vary for other areas of Florida.
14
CHAPTER 2 LITERATURE REVIEW
Net Zero Energy Homes
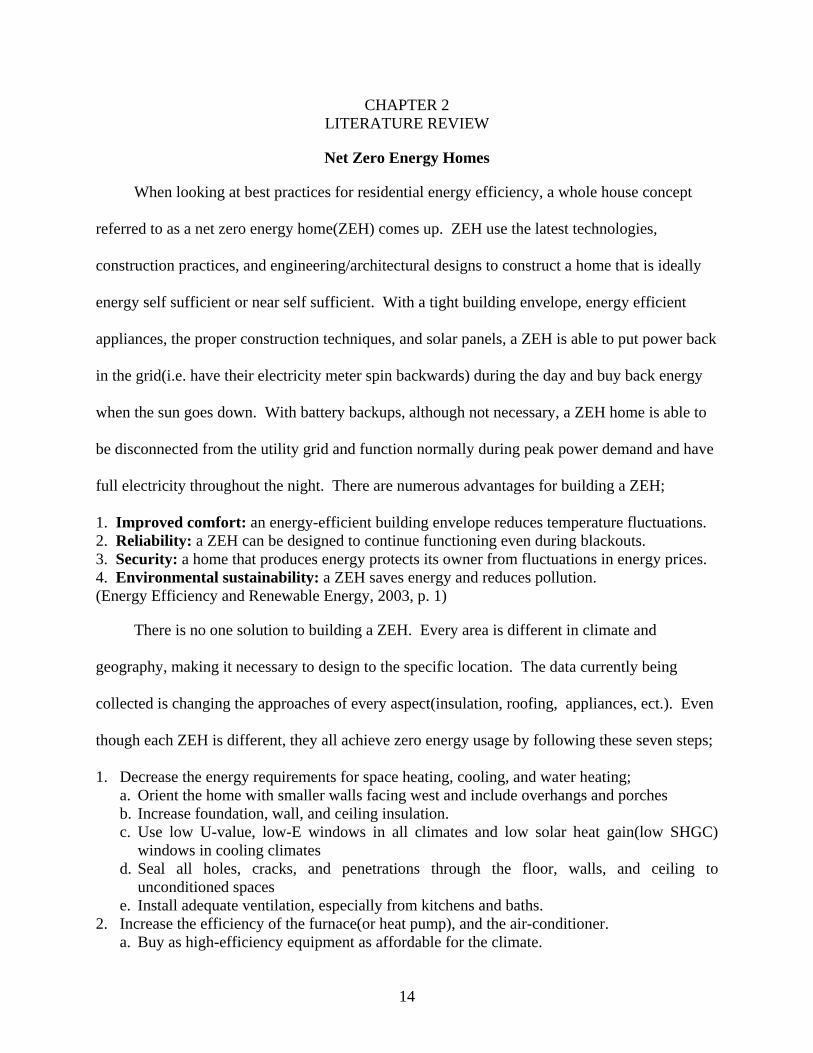
When looking at best practices for residential energy efficiency, a whole house concept
referred to as a net zero energy home(ZEH) comes up. ZEH use the latest technologies,
construction practices, and engineering/architectural designs to construct a home that is ideally
energy self sufficient or near self sufficient. With a tight building envelope, energy efficient
appliances, the proper construction techniques, and solar panels, a ZEH is able to put power back
in the grid(i.e. have their electricity meter spin backwards) during the day and buy back energy
when the sun goes down. With battery backups, although not necessary, a ZEH home is able to
be disconnected from the utility grid and function normally during peak power demand and have
full electricity throughout the night. There are numerous advantages for building a ZEH;
1. Improved comfort: an energy-efficient building envelope reduces temperature fluctuations. 2. Reliability: a ZEH can be designed to continue functioning even during blackouts. 3. Security: a home that produces energy protects its owner from fluctuations in energy prices. 4. Environmental sustainability: a ZEH saves energy and reduces pollution. (Energy Efficiency and Renewable Energy, 2003, p. 1)
There is no one solution to building a ZEH. Every area is different in climate and
geography, making it necessary to design to the specific location. The data currently being
collected is changing the approaches of every aspect(insulation, roofing, appliances, ect.). Even
though each ZEH is different, they all achieve zero energy usage by following these seven steps;
1. Decrease the energy requirements for space heating, cooling, and water heating; a. Orient the home with smaller walls facing west and include overhangs and porches b. Increase foundation, wall, and ceiling insulation. c. Use low U-value, low-E windows in all climates and low solar heat gain(low SHGC)
windows in cooling climates d. Seal all holes, cracks, and penetrations through the floor, walls, and ceiling to
unconditioned spaces e. Install adequate ventilation, especially from kitchens and baths.
2. Increase the efficiency of the furnace(or heat pump), and the air-conditioner. a. Buy as high-efficiency equipment as affordable for the climate.
15
b. Design the supply and return duct system appropriately and seal tightly using approved tapes or mastic.
c. Consider ground-source heat pump technology where space and cost conditions permit. d. Where climate-appropriate consider alternative cooling systems such as ventilation only or
evaporative coolers. 3. Install a solar hot water pre-heat system, an efficient backup water heater, and an efficient
distribution system: a. Consider a parallel, small diameter piping system for the hot water outlets. b. Install low-flow fixtures. c. Choose water heating equipment with a high Energy Factor. d. Look for a knowledgeable solar hot water installation company. e. Evaluate solar systems using the “Solar Rating and Certification Corporation(SRCC)”.
4. Install efficient lighting fixtures: a. Consider permanent fluorescent fixtures in as many locations as possible. b. Look for the ENERGY STAR label.
5. Install efficient appliances: a. Include the refrigerator, dishwasher, and laundry appliances. b. Look for the ENERGY STAR label. c. Compare appliance efficiencies.
6. Install a properly sized photovoltaic(PV) system: a. Look for a knowledgeable solar PV installation company. b. Evaluate tax and other incentives. c. Use PVWATTS for a quick estimate of PV output. d. Find a Certified Solar PV Installer form the North American Board of Certified Energy
Practitioners. 7. Turn off lights, computers, and appliances when not in use. (Toolbase Services, 2008)
Ultimately the occupants determine if the home uses no net energy. They must be aware
of usage patterns(number seven on the list), perform all routine maintenance on appliances and
equipment, and have a good understanding on all the energy saving features of the home. Even
though an owner might have a ZEH, if they waste energy, the home will not perform as
designed.
Passive Solar Design
Properly designed homes can use geometry, overhangs, technology, the sun, and wind to
help reduce energy demands. Humans have used this technique, called passive solar design, for
thousands of years. Passive solar design is climate and site specific. There is an increase in

16
initial costs for design and materials but decreases the amount of energy consumed and the size
of A/C and heating units needed.
Different passive solar design techniques are used for reducing the need for cooling and
heating but the design needs to account for both. A tight building envelope and proper
insulation holds in heat during the winter and cold air during the summer. Overhangs are
designed to lower solar heat gain on windows during the summer months and allow for it during
the winter. The sun’s path is different during the summer and winter allowing for this to
happen. Although not always possible, the building should be oriented with the long axis
running east/west within 30 degrees. Passive solar heating techniques are much further
developed and wider known to designers than cooling techniques, but it can be accomplished.
Homes can be designed to be cooler by taking advantage of shading(overhangs and natural
vegetation), special ventilation, dehumidifying equipment, and solar cooling.
Individual Traditional End-Use Components and Design
Cooling, heating, and hot water are considered the traditional end-use energy consumers.
This section will discuss best practices in proper selection, designs, and reducing the demand
created by these systems. While some of the components and ideas discussed can be used for
either heating or cooling end use dominated climates, this section is meant to address the later.
Roof Design and Materials
Roofs play one of the largest roles in lowering cooling costs. With most of the roof
exposed to the sun nearly all day, it is the area of the house responsible for the most solar heat
gain. This heat gain is transferred to the attic and from there to the inside of a home, causing the
air conditioner to cycle more often to maintain a cool temperature. There are numerous ways to
minimize this solar gain caused by the roof, options include; properly selecting roof material and
color, adding a radiant barrier, adequate ventilation, and insulation.
17
The most significant improvement in lowering solar heat gain caused from the roof is the
color and materials used. Light colors and reflective materials can lower attic temperatures by
more than 30 degrees Fahrenheit over the traditional dark colored asphalt roofs that are in-place
on most homes(Parker and Sherwin, 1998). Popular material choices include tile, metal, and
asphalt shingles. White tile followed by white painted metal are the two best choices for
materials.
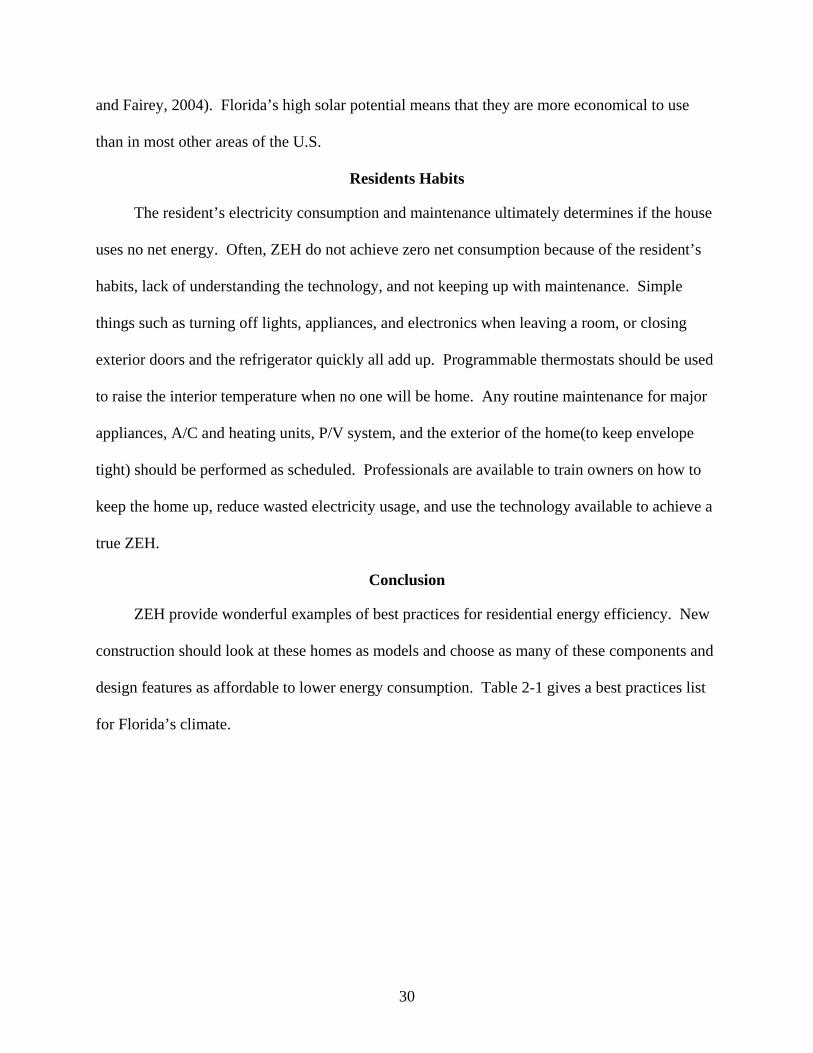
Overhangs and Shading
While shading the entire building is important, it is essential to properly shade areas with
windows. Windows are a major contributor to solar heat gain. Because of Florida’s long
summer and need for cooling, the optimal design for overhangs is larger than most other places
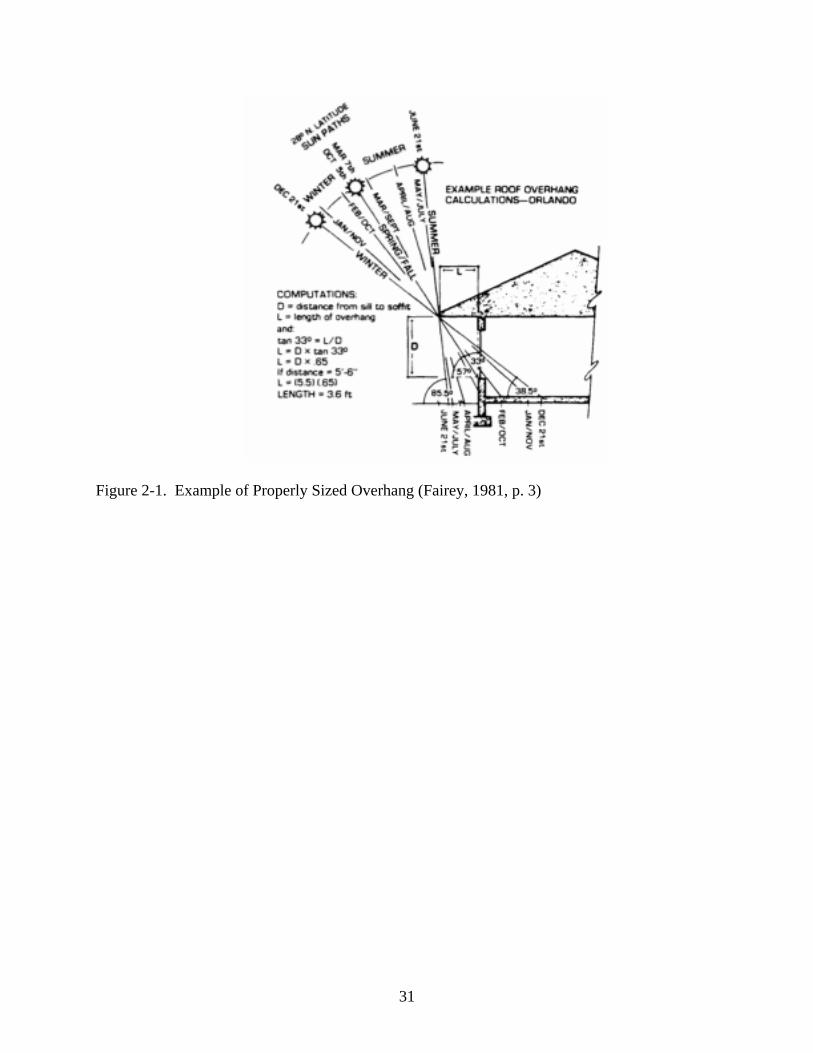
in the country. The Florida Solar Energy Center(FSEC) has performed a study and gives an
equation for the optimal roof overhang design as; Length of Overhang (L) = Distance from sill to
soffit(D) * Factor(F). The factor is determined by latitude. See figures 2-1 and 2-2 for an
example equation and the factors (Fairey, 1981, p. 3).
Placing a long porch on the south side of the home is a better option than overhangs in the
same location.
In cooling climates, particularly effective strategies include preferential use of north-facing windows along with generously shaded south-facing windows. Shading from landscaping, overhangs, shutters, and solar window screens helps lower heat gain on windows that receive full sun (Energy Efficiency and Renewable Energy, 2000, p. 2).
Windows should be placed where trees and buildings will shade them, preventing the full solar
heat gain caused by the sun. Using trees for shade also allows for wind to blow more freely on a
home and through windows, further cooling it.
18
Windows
Window type, size, and placement are all very important in determining which ones to use.
The window’s U-value(measurement of heat transfer through a material) should be carefully
selected. A low U-value loses less heat than a higher value. The Solar Heat Gain
Coefficient(SHGC) measures how much solar radiation is absorbed and transferred inside, the
higher the value the more heat is allowed inside. SHGC can also be referred to as Shading
Coefficient(SC). To convert SC to SHGC, multiply SC by 0.87(SHGC=0.87*SC). Visible
Transfer(VT) is a measurement of how much visible light passes through a window, a low value
will let in less light. Choosing the proper VT rating is site specific rather than climate. If there
are tree’s, buildings, ect. near the window, a higher VT rating would be desirable otherwise
interior lights would have to be turned on to be able to see comfortably. The National
Fenestration Rating Council(NFRC) places stickers with the U-value, SHGC, and VT ratings on
many new windows to help buyers make the best decision.
Picking out windows is not just an issue of efficiency, owners want them to be
aesthetically pleasing, allow little sound to transfer in or out, have low glare, and allow enough
light inside to name a few features. But to generalize, windows should have both a low U-Value
and SGHC for Florida’s climate. Having too low of a SGHC value lowers the VT, causing the
windows to be very dark. An occupant would have to use interior lighting during the day to be
able to see comfortably, so a site-specific median must be found. A higher VT value is needed
for windows shaded by trees and buildings than a window that is not. High efficiency frames
must accompany these windows for them to function at their full potential. The clear conclusion
by McCluney and Gueymard (1993) was:
The lower the shading coefficient of the glazing system, the lower the energy cost of the window. Increasing the resistance of the glass and frame to conductive heat transfers(lower the U-factor), has little or in some cases small negative impacts on the
19
energy efficiency of the glazing system. Lowered U-factors can lower peak electric demands... (McCluney and Gueymard, 1993, p. 2)
Insulation
Thermal resistance(R-value) is how insulation is rated. The higher the R-value, the better
the insulation is as long as it has been installed properly with no gaps or holes. Insulation is
placed in both the walls and attic. For new construction there are numerous choices available for
insulation, but loose-fill and batt insulation are the most common. Loose-fill is usually installed
by spraying it in place with special equipment. Batt insulation comes in large rolls that are rolled
out and trimmed to fit. For both types, the thickness determines the R-value obtained.
Obviously higher R-values work better, but the whole design must be looked at to determine the
necessary R-value needed for a ZEH.
Careful installation procedures are necessary for the insulation to function properly.
Insulation coverage should be uniform and leave no gaps. All holes and cracks should be sealed
that lead from inside the home to the attic with the proper caulk or expanding foam. Vents
should not be obstructed by insulation. Attic insulation works very well when combined with a
radiant barrier.
HVAC
HVAC is an acronym for heating, ventilation, and air-conditioning. HVAC systems can
improve comfort by controlling the temperature and humidity inside of a building. With heating
accounting for 7% and A/C accounting for 33% of the energy consumed in existing Florida
homes, a properly designed HVAC is a necessity for a ZEH (Parker, 2002). A heater or A/C unit
that is too large or small wastes energy and air ducts need to be the properly sized. Professionals
are capable of designing a system that is specific to heating and cooling loads, insulation levels,
and room sizes.
20
Heating
Although only accounting for 7% of residential energy usage in Florida, heating systems
can not be ignored completely (Parker, 2002). It would be very uncomfortable during the winter
to not have heat in northern Florida. A higher initial investment in energy efficient heating
equipment might be beneficial in the northern parts of Florida. Furnaces, boilers, and heat pumps
are common heating systems. Heat pumps should be considered for homes in the Southern part
of the country because of their numerous advantages:
• Cleaner energy-heat pumps use coolant and run on electricity, furnaces and boilers use oil or natural gas for fuel
• Also functions as an A/C unit-the process can be reversed and a heat pump can cool air during the summer.
• Heat pumps can function very quietly.
• Winter temperatures-heat pumps start to loose efficiency at low temperatures(30-40 degrees Fahrenheit), which is not really a problem in Florida.
Heating efficiency can be measured in either coefficient of performance(COP), energy
efficiency ratio(EER), or heating season performance factor(HSPF). While each of these values
mean something a little different, a higher value indicates a more efficient unit.
Air conditioning
There are two types of air conditioning(A/C), central and single room units. Central A/C
uses one unit to cool the air and ducts to deliver it. Single room units do not require ducts and
will only cool one room. Central A/C is more common in new homes and provides uniform
temperatures throughout a home if everything is installed properly. Two things must be
considered when selecting an A/C unit, the efficiency and the size.
An air conditioners efficiency is rated in seasonal energy efficiency rating(SEER). SEER
is calculated from the total number of British Thermal Units (BTU) of heat removed from the air
21
divided by the total amount of energy used by the unit. The higher a SEER value is, the more
efficient the unit is. Currently SEER values range from 13 to 21, with 13 being the minimum
value allowed for new units mandated by the federal government.
Air conditioners are sized in tons. One ton is equal to 12,000 Btu’s per hour. To be
energy efficient, a professional must properly size an A/C unit. If the unit is too small, it will
waste energy by running more often, if the unit is too large it will lose energy efficiency. Sizing
is based upon the necessary cooling loads, not a home’s square footage.
Air ducts
A properly designed and sized air-duct system can improve efficiency of a central heater
and A/C unit. One of the easiest ways to improve efficiency is to place the air-ducts inside the
air-conditioned space. Common practice is to place the in the attic and walls. Ducts in the
conditioned space offers the advantage of delivering the cooled/heated air through the interior
and not the hot/freezing attic or walls, reducing the cycle time necessary of the unit. Also, any
leaks from the ducts will be leaked into where it should be going in the first place. Air-duct
sizing is determined after the heater and A/C unit is selected because the blower helps determine
the necessary size. Return ducts should be placed high on walls and grilles or jumper ducts
placed above door-frames to help increase air flow and keep pressures balanced. The duct
system should be designed at the same time as the rest of the house to keep the supply ducts
length to a minimum and avoid any interference from wires, pipes, frames, ect.
The objectives of good design are occupant comfort, proper air distribution, economical heating and cooling system operation, and economical duct installation. The outcome of the duct design process will be a duct system(supply and return plenums, ducts, fittings, boots, grilles, and registers) that 1. Provides conditioned air to meet all room heating and cooling loads 2. Is properly sized so that the pressure drop across the air handler is within manufacturer
and design specifications 3. Is sealed to provide proper air flow and to prevent air from entering the house or duct
system from polluted zones

22
4. Has balanced supply and return air flows to maintain a neutral pressure in the house. 5. Minimizes duct air temperature gains or losses between the air handler and supply
outlets, and between the return register and air handler (Energy Efficiency and Renewable Energy, 2003, p.1).
Ventilation
Ventilation is very important to the indoor air quality and the overall comfort level. Since a
tight envelope is very desirable, ventilation is necessary to control humidity levels and to get
fresh outdoor air inside. There are many design approaches and different technologies available
depending upon the location, square footage, ceiling heights, wall locations, ect.
Either the cooling coils of an A/C unit or separate dehumidification devices can control
humidity levels inside. Because of the high outside temperatures and humidity in Florida, it is
generally more cost effective to use the A/C unit for dehumidification. Properly sizing the heater
and A/C unit has a large impact on humidity.
Whether operating with continuous fan operation, as is common in commercial applications, or in the AUTO fan mode, as most residential systems do, dehumidification performance degrades at part-load conditions. Over sizing air-conditioning equipment increases the times spent at part load and results in higher space humidity levels (Shirey, Henderson, and Raustad, 2006, p. 4).
Hot Water Heater
When selecting a proper and efficient hot water heater, numerous options must be factored
into the decision. Besides the different types of heaters, one must take into consideration the
type of energy it uses, the size, energy efficiency, and annual operating costs.
Types
Five types of water heaters are available: conventional storage, demand heaters, heat pump
water heaters, solar water heaters, and tank-less coil heaters.
1. Conventional storage: water is constantly heated and stored in a tank. Since the tank is kept full, energy can be lost through constant heating. “However, you can find some storage water

23
heater models with heavily insulated tanks, which significantly reduce standby heat losses, lowering the annual operating costs.“ (Energy Efficiency and Renewable Energy, 2005).
2. Demand heaters: water is heated when needed. There is no storage tank and energy consumption can be lowered because there are no standby energy losses. Shortages can occur if there is a high demand for the hot water(i.e. taking a shower and doing laundry simultaneously). Demand heaters can be used throughout a home or assist a solar water heater. “For homes that use 41 gallons or less of hot water daily, demand water heaters can be 24%–34% more energy efficient than conventional storage tank water heaters” (Energy Efficiency and Renewable Energy, 2005).
3. Heat pump: uses the heat pump to provide hot water. Can use either tanks to store hot water or be heated on demand if using a geothermal system. This system costs more than a conventional storage hot water heater, but should have lower operating costs (Energy Efficiency and Renewable Energy, 2005).
4. Solar water heaters: separated into two types, active(contains circulating pumps) and passive(no pumps). Both types contain a storage tank and solar collector. Active systems cost more but have efficiency. Passive systems require less maintenance and usually have longer life spans. The goal for both systems is to use the sun to heat all or most of the water needed. It is not uncommon to have a demand heater to help during peak demands and during cloudy days (Energy Efficiency and Renewable Energy, 2005).
5. Tank-less coil: very similar to demand heaters, tank-less coil systems use the heating system to provide hot water when needed. These can be very efficient if used in the north during the heating season, but should not be used in Florida, thus they will not be discussed in detail.
Energy types and costs
Hot water heaters can run on electricity, natural gas, propane, solar, geothermal, or fuel oil.
Depending upon the utilities provided in the area and heater type, only some of these energy
options will be available. Storage, demand, and heat pump systems use an Energy Factor (EF) to
determine efficiency. The manufacturer provides the EF for the unit.
The energy factor (EF) indicates a water heater's overall energy efficiency based on the amount of hot water produced per unit of fuel consumed over a typical day. This includes the following: * Recovery efficiency – how efficiently the heat from the energy source is transferred to the water * Standby losses – the percentage of heat loss per hour from the stored water compared to the heat content of the water (water heaters with storage tanks) * Cycling losses – the loss of heat as the water circulates through a water heater tank, and/or inlet and outlet pipes. (Energy Efficiency and Renewable Energy, 2005)
24
Operating costs are determined by the amount of energy consumed multiplied by the unit
cost of that type of energy. While having an efficient unit reduces the amount of energy needed,
it does not necessarily result in lower operating costs if the unit cost of energy is high in the area.
Example, an efficient system that is powered by propane(high unit cost) might cost more to
operate than an inefficient system that is powered by electricity(low unit cost).
Reducing hot water demand
One of the easiest ways to reduce the energy needed for water heating is to reduce the
amount consumed. Installing low flow pipes, faucets, and shower heads throughout the home
can have a large impact on the amount of water used. Using cold water for laundry and having a
dishwasher that heats its own water saves on consumption as well. The U.S. Department of
Energy suggests insulating the storage tank and pipes, lowering the hot water temperature, using
a drain-water heat recovery system, or installing a timer to the system to turn on and off when
needed will all reduce operating costs. All of these options can be added to existing systems, but
are less expensive if installed initially. Finally, placing the water heater in the middle of a home
lowers energy consumption by reducing the length of pipe that the hot water travels through.
Other End-Use Components
Other end-uses are anything other than cooling, heating, or hot water that consumes
energy.
Historically, most of the energy consumed by the U.S. residential sector has been for space heating, cooling, and water heating- what we call the ‘traditional’ end-uses. The ‘Other’ end-uses(appliances, lighting, electronics, and miscellaneous equipment), however, have grown to the point that they account for over half of residential electricity use (Brown, Rittelmann, Parker, and Homan, 2006, p. 9-37).
This is due to the growing number of items being plugged in. Energy efficient appliances and
user conservation efforts must be taken to reduce the demand caused by these other end-uses.
25
Lighting
Energy efficient lighting is easy to install, just select the proper wattage bulbs. Every
light in the house should be a Compact Fluorescent Light(CFL). Chose ENERGY STAR
certified CFL bulbs over non-certified.
CFL’s are far superior to the cheaper incandescent bulbs currently being used because: 1. ENERGY STAR qualified bulbs use about 75 percent less energy than standard
incandescent bulbs and last up to 10 times longer 2. Save about $30 or more in electricity costs over each bulb's lifetime 3. Produce about 75 percent less heat, so they're safer to operate and can cut energy costs
associated with home cooling 4. Are available in different sizes and shapes to fit in almost any fixture, for indoors and
outdoors (U.S. Environmental Protection Agency and U.S. Department of Energy, 2008)
CFL bulbs have one downside over incandescent bulbs, they contain mercury. Mercury levels
vary in different bulbs. When disposing of CFL’s, it is best to take the bulbs directly to a
recycling center instead of putting them in a bin. This practice ensures the bulb is not broken en
route. If one were to break in the home, the EPA clean up procedures for mercury can be seen at
http://www.epa.gov/mercury/spills/index.htm#flourescent.
Major Appliances
Although every appliance is important; dishwashers, clothes washers, dryers and
refrigerators are the largest energy consumers in this category. Most units will have a yellow
“Energy Guide” sticker that estimates the amount of kilowatts(kW) the appliance uses in a year.
Again, look for the ENERGY STAR certified models and compare efficiencies of different
models to select the best unit one can afford. Also, using the proper settings/modes saves energy
consumption. Refer to the ENERGY STAR website for lists of approved appliances.
Dishwasher
New ENERGY STAR dishwashers have better energy and water efficiency than standard
models. Most of the energy they consume is in the form of hot water. Use the air-dry option
26
instead of the heat-drying option to save further energy. Finally, only operate the dishwasher
with a full load.
Clothes washers
New clothes washers have statistics provided by the manufacturer that include the amount
of water used per year, amount of electricity used per year, Modified Energy Factor(MEF), and a
water factor. “The Modified Energy Factor (MEF) measures the energy used during the washing
process, including machine energy, water heating energy, and dryer energy. The higher the MEF,
the more efficient the clothes washer is.” (U.S. Environmental Protection Agency and U.S.
Department of Energy, 2008). The water factor is the amount of water used in gallons per load
divided by the cubic feet of the unit. A low water factor is desirable. To conserve energy, use
cold water, only wash full loads, and use a longer spin cycle to remove more moisture before
drying.
Dryers
Clothes dryers for the most part use about the same amount of energy. ENERGY STAR
does not put a sticker on any dryer unit. All a dryer really does is remove moisture from wet
clothes, so to lower the energy consumption reduce the moisture by using the spin cycle in the
washer. Most new units have a moisture sensor option that will shut the dryer off when the
clothes are dry instead of running for a set amount of time. Use this feature over setting a timer
to conserve energy.
Refrigerators
Select only refrigerators with the ENERGY STAR sticker on it, they are at least 15% more
efficient than the minimum requirements. Gains in efficiency are from more insulation, better
compressors, and more efficient defrosting settings. Placing the unit where cool air can circulate
to condensers, correctly setting the temperatures, and keeping the unit full can conserve energy.
27
The most efficient models are compact, have the freezer above the refrigerator, have door access
ice and filtered water, moisture control settings, and a manual defroster.
Oven/stove
These units are all about the same in efficiency. Users are able to improve efficiency by
using the correct size burner, keeping burners and oven clean, and covering pots with lids to
reduce cooking time.
Electronics
ENERGY STAR rates nearly every type of electronic device(telephones, TV’s, DVD
players, sound systems, ect.). The main difference in most of these vs. non-ENERGY STAR
certified is they contain a feature that consumes much less energy when the unit is off. Also, use
only ENERGY STAR power adaptors, they save an average of 30% more energy(U.S.
Environmental Protection Agency and U.S. Department of Energy, 2008). Finally, occupants
should be aware of turning off electronics when not in use.
Phantom Loads
Many appliances still consume energy when turned off. This small amount of energy is
called a “phantom load” or standby loss. Devices such as TVs, DVD/VCRs, microwaves, coffee
makers, answering machines, ect. will add up quickly in wasting unnecessary energy. “The
average U.S. household has about 40 to 60 W of continuous phantom loads running day in and
day out. On average, this amounts to approximately 1,200 WH per day or 1.2 KWH per day”
(Schwartz, 2007, p. 64).
Eliminating these loads can be fairly easy. Simply unplugging everything after it is
through being used or having all plugs go into a power strip with an on/off button is the easiest
for existing homes. A switch next to the light switch in every room that turns the power on or
off into the outlets for the room is another option. The most difficult phantom load to reduce is
28
the TV. If it is completely turned off, a TV will lose it’s channel memory and take a bit longer to
turn on when desired. A battery could be installed into a TV that stores the channel memory
when shut off and charges when in use.
Solar Panels
Photovoltaic(PV), more commonly known as solar panels are absolutely necessary for a
ZEH. They collect energy from the sunlight and turns it into electricity. PV systems consist of
numerous solar cells connected together to form a PV module. Many modules are then
connected together to form a PV array. Arrays are rated by the maximum amount of watts they
can produce. The electricity produced is Direct Current(DC) and inverters can be used to
convert this from DC to Alternating Current(AC).
There are two types of systems, grid tied or off-grid. Grid tied systems use an inverter and
a two-way power meter to put electricity directly into the power grid. These systems do not
require any battery backups, are cheaper, and smaller. The disadvantage is if the grid is turned
off (a blackout), the PV system will not supply any electricity. Grid tied systems can be a hybrid
system with a battery back up that will supply electricity during blackouts. Off-grid systems use
a charge controller and battery back-ups. The charge controller keeps the batteries from
overcharging and the batteries store extra “emergency” electricity. If the batteries are fully
charged, the extra electricity then goes to the home. Inverters are optional, but if one is not
going to be used every appliance must use DC (most use AC) electricity. Off-grid systems are a
bit more complicated to install, do not use any electricity from a grid, and are more expensive,
but are able to function during blackouts.
The amount of electricity generated by the PV array depends upon the geographical
location, time of day, season, local landscape, and local weather (Energy Efficiency and
Renewable Energy, 2005). More electricity is produced the longer the sun is out each day
29
(summer is better than winter), if it is a clear day (not overcast), and if there is no shade
obstructing the PV array (trees, buildings, ect.). Sizing the system should be done after
determining how much electricity is consumed during a typical hot summer day to ensure zero
net energy is used.
After a system is installed an independent contractor should test it to determine how it is
functioning. This ensures it is working properly and gives data on how much electricity the PV
system is producing. http://www.dsireusa.org/ contains a list of all the rebates that can be applied
to qualified PV systems.
Mounting the arrays
The arrays will collect the most energy if the sun is always at a 90-degree angle. There
are two ways to mount the arrays, directly to the roof or use a mechanical system that changes
the angle. The first option is much cheaper to install and maintain but not as efficient.
Mechanical trackers can be used to tilt the arrays at the optimum angle the entire time the sun is
out. These trackers are expensive and the moving parts will have some maintenance issues. If
trackers are not going to be used, the panels should be properly angled for the summer and
winter to get the most out of the mid day sun. The optimum angles are determined by the
latitude and tilt of the earth. A specialist should be used to install and determine the angle. Here
in Florida, it is best to have as much of the PV system facing south as possible.
Geographic location
A different amount of solar radiation reaches the ground depending upon the geographic
location, angle of panels, and direction they are facing. A study with 2kW systems in the U.S.,
showed the South-West (Arizona, Nevada, ect.) to have the highest solar potential(up to 8.5
kWh/day), but Florida has a solar potential between 7 to 7.5 kWh/day(Lombardi, Parker, Vieira,
30
and Fairey, 2004). Florida’s high solar potential means that they are more economical to use
than in most other areas of the U.S.
Residents Habits
The resident’s electricity consumption and maintenance ultimately determines if the house
uses no net energy. Often, ZEH do not achieve zero net consumption because of the resident’s
habits, lack of understanding the technology, and not keeping up with maintenance. Simple
things such as turning off lights, appliances, and electronics when leaving a room, or closing
exterior doors and the refrigerator quickly all add up. Programmable thermostats should be used
to raise the interior temperature when no one will be home. Any routine maintenance for major
appliances, A/C and heating units, P/V system, and the exterior of the home(to keep envelope
tight) should be performed as scheduled. Professionals are available to train owners on how to
keep the home up, reduce wasted electricity usage, and use the technology available to achieve a
true ZEH.
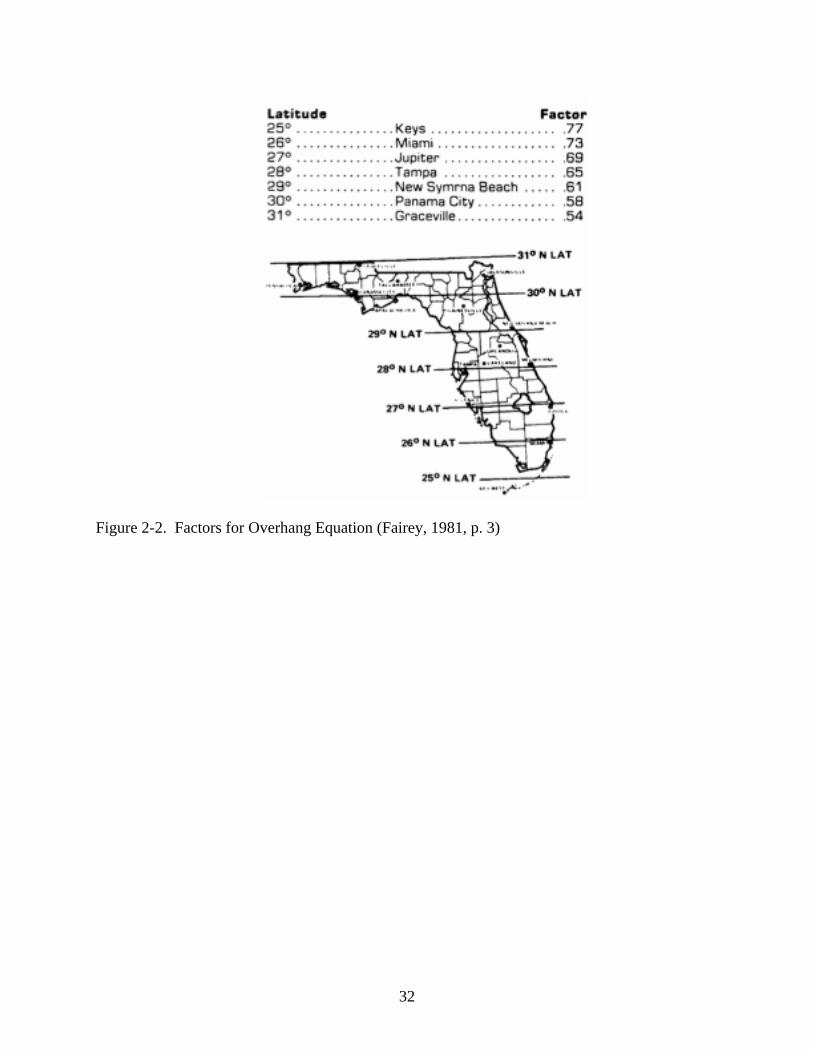
Conclusion
ZEH provide wonderful examples of best practices for residential energy efficiency. New
construction should look at these homes as models and choose as many of these components and
design features as affordable to lower energy consumption. Table 2-1 gives a best practices list
for Florida’s climate.
31
Figure 2-1. Example of Properly Sized Overhang (Fairey, 1981, p. 3)
32
Figure 2-2. Factors for Overhang Equation (Fairey, 1981, p. 3)
33
Table 2-1. Best Practices List
Passive Solar Design Orient long-axis as close to East-West as possible. Shade East and South walls/roof with vegetation if possible. Keep envelope tight
Roof Reduce solar heat gain by selecting light colors and reflective
materials
Overhangs Properly size overhangs based on window locations and latitude of
home
Windows Select as low a U-value and SHGC that still allows adequate light in
to see comfortably Insulation Properly install with no gaps or holes. Select high R-values
HVAC System
Get as high SEER/HSPF unit as possible. Minimize duct length and place in the conditioned space. Use professional to size system,
ducts, and supplies/return locations.
Hot Water Heater Reduce demand using low-flow fixtures and pipes. Centrally locate unit. Use a tank-less demand and solar water heater in combination
Lights Use CFL bulbs in every socket
Appliances
Select ENERGY STAR when available. Clean when necessary, only do full loads, and turn off when not in use. Use energy saving
features if available
Solar Panels Have array face South. Make sure sun hitting array is not obstructed
by buildings or vegetation
34
CHAPTER 3 METHODOLOGY
The goal of this thesis is to determine cost effective energy upgrades for a new home with
a short payback period that can justify the additional upfront costs. For the analysis period, 30-
years was selected based upon the common mortgage for a new home. The research contained
six steps.
1. Habitat for Humanity provided plans for a three bedroom, two bathroom 1,288 square foot home. The plans were then altered slightly to maximize the south facing roof area to allow for a large photovoltaic array and solar hot water heater to face the ideal direction.
2. Prices for individual components were researched. Quotes from local contractors were obtained for HVAC systems, roofs, solar hot water systems, PV arrays, and windows. Two quotes were obtained from each of the contractors with the exception of the PV arrays and solar hot water heater. The purpose of the two quotes was to be able to compare prices for top-of-the-line to low-end components. For small appliances, comparisons were made between ENERGY STAR and non-ENERGY STAR approved units. Prices and energy consumption were obtained for similar sized units from stores such as Home Depot, Lowe’s, and Sears.
3. Data for a model house was entered into Energy Gauge using the low-end components to get a baseline of the energy consumed per year. Next, the household energy consumption was obtained for upgrading each of the following individually: (1) HVAC system (2) lights (3) roof and overhangs (4) windows (5) using light colored exterior paint (6) adding more insulation (7) adding a PV system and (8) adding a solar hot water heater. These components were all looked at together in an attempt to create a ZEH and individually to see what their independent contributions to energy savings were.
4. The energy savings in step three were compared to the additional initial cost of the component. A simple payback period and savings-to-investment ratio (SIR) was determined for each of the components. The discount rate and inflation percentage used were obtained from the White House’s Office of Management and Budget (OMB). Inflation for utilities was determined by averaging GRU’s 5-year rate projections.
5. An analysis of the components with a favorable SIR and short payback period were looked at together to determine if they were still beneficial. When energy saving components are combined, the total amount of energy saved diminishes. The upgraded combinations were examined in Energy Gauge and another SIR and payback period for the combinations was determined.
6. Finally, an analysis was performed to determine if all of the upgraded components and all of the upgrades with favorable SIR’s were still beneficial if financed fully. The loan rate was obtained from Bank of America on January 29th, 2008.
35
CHAPTER 4 RESULTS AND ANALYSIS
The findings of this study are presented below in six sections.
1. The model house plans and alterations made to them.
2. All of the individual high-end and low-end components selected. Also included are their costs, characteristics, and rebates if applicable.
3. A household energy consumption analysis of the model house, the model house with each of the eight upgrades individually, and all eight upgrades combined with ENERGY STAR appliances were performed.
4. A 30-year life cycle cost analysis to determine the SIR and simple payback period of the energy savings for the eight individual components vs. the model house. For the appliances, a 10-year life cycle cost analysis of the ENERGY STAR appliances vs. non-ENERGY STAR was performed.
5. The individual components and appliances that had favorable SIR and payback periods were analyzed in combination and household energy consumption determined again with Energy Gauge. A SIR and simple payback period was determined for this combination and all eight upgrades combined with ENERGY STAR appliances.
6. Finally, a life cycle cost analysis for financing all of the upgrades vs. none of the upgrades and the favorable SIR upgrades vs. none was performed.
Section 1: Model House Plans
Housing plans were obtained from Habitat for Humanity. The floor plans provided were
still in permit review and none of these models have been built at the time of writing. Plans were
for a 1288 square foot three bedroom, two bathroom home. The only modifications to the floor
plan were the windows, as the original plans contained none. The researcher added six 4’ by 3’,
two 5’ by 3’, and two 6’ by 3’ windows for a total area of 138 square feet. Windows were placed
3’-8” from the ground to allow the south facing windows the best passive solar shading during
the summer and solar heat gain during the winter when overhangs were upgraded to 3’.
The plans contained no elevation views and the researcher designed the roof. The roof is
hipped with two different slopes of 5/12 and 12/12. The reason why the later slope is much
36
higher was to get enough south facing roof area to accommodate a 3.6 kW PV system along with
a solar hot water heater. Floor plans can be seen in figure 4-1 and elevation views in figure 4-2.
Section 2: Components
This section is divided into two for the low-end components selected for the model house
and the high-end components selected for the attempted ZEH.
Low-End Components
For the low-end components an effort was made to select the cheapest available.
Contractors were asked to give a quote for the lowest cost items they would install. Appliances
were selected based on low cost and the ability to get a comparable sized one that was ENERGY
STAR certified. A summary of the low-end components can be seen in table 4-1.
HVAC system
A 2.5-ton Goodman heat pump was quoted at $4,884.00 from Bertie Heating & Air
Conditioning, Inc. located in Gainesville. The heat pump is rated at SEER 13 and HSPF 7.7.
The quote includes the installation cost of the ductwork located in the attic. The duct system has
8 supplies and 4 returns and is adequately sized for the heating and cooling needs of the home.
Ducts were assumed to have average leakage.
Lights
Incandescent light bulbs were chosen throughout the model house. Cost was assumed to
be $0.20 for each 60-watt bulb with a life of 1,000 hours. 16 fixtures were designed for
throughout the home. Each fixture was assumed to be used for 1,000 hours each year.
Roof and overhangs
For the roof, a simple dark composite shingle roof with 1’ overhangs was chosen. Because
of the high humidity in Florida, these roofs generally last about 15 years before needing to be
replaced. In Energy Gauge the estimated solar absorbance level for the material type and color
37
was 0.96. The cost of materials and labor was quoted at $3,860.00 with a 5-year warranty from
Perry Roofing Contractors, located in Gainesville.
Windows
All ten windows in the model house are clear single pane with metal frames. National
Fenestration Rating Council (NFRC) rates all ten with a U-Factor of 1.13 and a SHGC of 0.71.
A quote was obtained from Windowman in Gainesville for $1,301.44 for the materials and labor
to install all ten.
Roof insulation
R19 batt roles were chosen for the roof insulation at a price of $681.45 from Lowe’s. The
installation was assumed to be uniform with no area missing insulation.
Exterior paint
A light gray colored paint was chosen for the exterior color. It was in the median of values
for solar absorbance level in Energy Gauge with 0.75.
Hot water heater
A 40-gallon gas Whirlpool hot water heater was selected with an energy factor of 0.59.
The price was $289.00 from www.lowes.com. The location of the tank was assumed to be in the
interior (in the laundry room) with a set temperature of 120 degrees. Energy Gauge estimates a
four-person household uses 60 gallons of hot water a day.
Appliances
The following were assumed for the major appliances and miscellaneous loads in the
house:
• 3.2 ft3 Whirlpool washing machine for $350.00 from Home Depot. Uses 418 kWh/year • 18.2 ft3 Kenmore refrigerator for $430.00 from www.sears.com. Uses 479 kWh/year • 24 inch Tappan dishwasher for $198.00 from www.lowes.com. Uses 432 kWh/year • Range was assumed to use 530 kWh/year
38
• Ceiling fans were assumed to use 59 kWh/year • Dryer was assumed to use 624 kWh/year • Miscellaneous loads were assumed to use 2773 kWh/year High-End Components
For the high-end components, contractors were asked to give quotes on the most energy
efficient systems they could install. All appliances selected were ENERGY STAR certified and
similar in size as the one’s for the low-end model house. The goal of selecting the high-end
components was to make the total energy consumed in the household as low as possible and
attempt a ZEH. A summary of the high-end components can be seen in table 4-2 and rebates in
table 4-3.
HVAC system
A 2-ton Carrier heat pump was quoted at $8,245.00 from Bertie Heating & Air
Conditioning, Inc. It was rated at SEER 17 and HSPF 8.5 and is eligible for a $300.00 rebate
from GRU. The ductwork (for $500.00, included in the quote) for this system was sealed better
and located in the interior space of the home. For an additional $195.00, a programmable
thermostat was selected to automatically raise or lower the temperature at set times to conserve
energy. Due to the high level of insulation and interior ductwork, this system is oversized and
could have been a 1.5-ton unit. Unfortunately, high SEER heat pumps start at 2-ton units. All of
the 1.5-ton units available were SEER 13, the minimum allowed by the government.
Lights
CFL lights were selected for every fixture. The CFL equivalent of a 60-watt incandescent
bulb is 13-watts. Price was assumed at $1.66 per bulb and a life span of 8,000 hours. Each
fixture was assumed used for 1,000 hours a year.
39
Roof and overhangs
A white metal roof with 3’ overhangs was quoted from Perry Roofing Contractors for
$12,850.00. Energy Gauge estimated the solar absorbance level for the material and color roof at
0.3. Metal roofs last generally between 40-60 years and this one came with a 25-year
manufacturer’s warranty.
Windows
All ten windows are low-e double pane with vinyl frames. National Fenestration Rating
Council (NFRC) rates all ten with a U-Factor of 0.56 and a SHGC of 0.32. Windowman quoted
these windows for $2,324.40 for the materials and labor.
Roof Insulation
R30 batt roles were chosen for the roof insulation at a price of $835.12 from Lowe’s. The
installation was assumed to be uniform with no area missing insulation.
Exterior paint
Any light colored paint will have a lower solar absorbance than darker colors. For this
home, a blue color was chosen with a solar absorbance of 0.51 from Energy Gauge. The only
absorbance levels lower were shades of white, green, and gravel exteriors.
Solar hot water heater
A ProgressivTube passive solar hot water heater with backup tank-less demand heater was
quoted for $6,000.00 from www.solardirect.com for materials and installation. This system is
eligible for total of $3,000.00 in rebates from the federal government, state of Florida, and GRU.
Rebates from the federal government are in the form of a tax credit. GRU and Florida will issue
the rebate in the form of a check. The solar system is 8’ x 4’-2” and collects hot water into a 50-
gallon tank. The panels for the system rest directly on the roof facing south with no added angle.
The loss coefficient was obtained from the Solar Rating and Certification Corporation. Included

40
in the package was a Takagi Flash T-K Jr. natural gas tank-less heater to provide any additional
hot water needed. The tank-less system has an energy factor of 0.83 and capable of delivering
up to 5.8 gallons per minute of hot water.
The PV System
A 3.6 kW PV array package from www.solardirect.com was quoted for $33,000.00 for
materials and installation and is eligible for $21,800.00 in rebates. Forms of rebates are the same
as they are for the solar hot water heater. The system contains 18 Sanyo 200-watt modules and a
Fronius IG4000 grid-tie inverter with 94.4% efficiency in converting DC electricity to AC. Each
module is 51.9” x 35.2”, weighs 30.86 lbs. faces south, and are at the same angle as the roof. All
of the specifications for the modules were obtained from the manufacturer.
Appliances
The following were assumed for the major appliances and miscellaneous loads in the
house:
• 3.1 ft3 ENERGY STAR Frigidaire washing machine for $600.00 from www.sears.com. Uses 210 kWh/year
• 18.2 ft3 ENERGY STAR Kenmore refrigerator for $500.00 from www.sears.com. Uses 407 kWh/year
• 24” ENERGY STAR Whirlpool dishwasher for $228.00 from www.lowes.com. Uses 371 kWh/year
• Range was assumed to use 530 kWh/year
• Ceiling fans were assumed to use 59 kWh/year
• Dryer was assumed to use 624 kWh/year
• Miscellaneous loads were assumed to use 2335 kWh/year
ENERGY STAR does not rate ranges, ceiling fans, or dryers and the assumed kWh/year
didn’t change during any analysis. Miscellaneous loads dropped 438 kWh/year (365 * 1.2
41
kWh/day) if power strips were used for appliances and turned off when not in use to eliminate
phantom loads (Schwartz, 2007, p. 64).
Section 3: Household Energy Consumption Analysis
Energy Gauge allows the user to enter data that is very site and component specific to
determine the energy usage. The following assumptions were made:
• Location: Gainesville • No shading trees or adjacent buildings • Slab is on grade • Full attic, hipped roof with a slope of 5/12 and radiant barrier • 10’ exterior wood framed walls with R-11 insulation • Insulated exterior doors • Air handler and hot water heater located in the interior • No garage, sunspace, or added mass to the home
When all of the high-end upgrades were looked at together, the only different assumption
made in Energy Gauge was the house had “good” envelope tightness. The model home used
“average” for the energy analysis.
Model House with Low-End Components Energy Summary
Energy Gauge estimated the model house consumed 9,884 kWh/year and 148 Therms/year
for hot water heating. Interior temperatures were assumed to be 76 degrees when cooling and 68
degrees when heating. This home passes building code by a marginal score of 30.21, anything
over 31.25 is a failing score. The electricity end use summary can be seen in table 4-4, the gas
summary in table 4-5, and the building code summary in table 4-6. The Energy Gauge energy
summary can be seen in figure 4-3.
Model House with Effects of Upgrading Individual Components Energy Summaries
As expected, the largest electricity savings were from upgrading the HVAC system, which
reduced total consumption by 13.8%. Next came upgrading the lights to CFL (7.94%), using
low-e windows (3.16%), white metal roof and 3’ overhangs (2.67%), R30 insulation (1.7%), and
42
finally changing the color (0.71%). The solar hot water system reduced natural gas consumption
by 68.92%. The electricity end-use summary for all of the upgrades can be seen in table 4-4 and
the gas summary in table 4-5.
All High-End Components Energy Summary
When all of the high-end components were used along with ENERGY STAR appliances
and better envelope tightness, Energy Gauge estimated the home consumed 6,300 kWh of
electricity and 46 Therms of natural gas per year. The PV system produced 5,428 kWh to drop
the net total electricity consumption to 872 kWh. Energy end use summary of all the high-end
components can be seen in table 4-9. The Energy Gauge energy summary can be seen in figure
4-4.
Section 4: Component and Appliance Simple Payback Period and SIR Analysis
For sections 4, 5, and 6 the following assumptions were made:
• Current electricity rate of $0.10/kWh • Current natural gas rate of $1.72/therm • Electricity inflation of 4.1% • Natural gas inflation of 6.0% • A 30 year discount rate of 4.9% • A 10 year discount rate of 4.6% • A 30 year general inflation rate of 2.1% • A 10 year general inflation rate of 2.0%
Utility inflation rates were determined by averaging GRU’s 5-year utility rate projections.
Discount rates and general inflation rates were taken from the 2008 projections from the White
House Office of Management and Budget. Components were looked at for a 30-year period and
ENERGY STAR appliances for a 10-year period. A simple payback and SIR table for all the
individual components is in table 4-7 and all the appliances in table 4-8. For components, the
30-year life cycle cost analysis can be seen in appendix A and the 10-year life cycle cost analysis
for appliances in appendix B.

43
Individual Components Analysis
Of all the components, upgrading the lights to CFL’s had the shortest payback period (0.33
years) and highest SIR (79.171). These bulbs use less than a quarter of the energy consumed by
incandescent bulbs, last 8 times as long before burning out, and cost just a bit more than
incandescent bulbs after having to pay for replacement. Furthermore, CFL’s reduce cooling
demands by putting out less heat than incandescent bulbs. Next came upgrading the insulation
from R19 to R30 with payback period of 8.79 years and an SIR of 2.919. Changing the paint
color to one with a lower solar absorbance saved 70 kWh a year, amounting to roughly $7.00 in
energy savings the first year. Over the 30-year period with electricity inflation, the paint color
saved over $400. These three upgrades would be very easy to perform in new or existing houses.
Both the PV system and solar hot water heater had favorable SIR’s (1.039 and 1.565) and
payback periods of 19.82 years and 14.58 years respectively. These numbers are largely
influenced by the amount of rebates available for them. If the rebates were not available, the PV
system would have an unfavorable SIR and the solar hot water heater’s SIR would drop to 1.088.
Both of these systems would be favorable to install if one had the means for a large down
payment and not finance for a long time.
Upgrading to the high SEER/HSPF heat pump and interior ducts had a favorable SIR of
1.101 and payback period of 22.93 years. These numbers would have been better if the system
was properly sized. Upgrading the insulation, HVAC system, and placing the ducts in the
interior not only saves energy, but also reduces the size of the heat pump necessary, further
reducing initial costs. When these upgrades were used, the heat pump only needed to be a 1.5
ton unit. Without any of these upgrades a 2.5 ton unit was required. While the HVAC upgrades
are favorable, they would have better results in a larger home.
44
The roof with large overhangs and low-e windows were the only two components with an
unfavorable SIR of 0.365 and 0.814 respectively. The payback period for the roof came at 45
years, which was the time the composite shingles needed to be replaced for a third time. By this
time, the metal roof would be getting close to needing to be replaced as well. Payback period for
the windows was 31.50 years. Double pane windows offer an advantage of reducing the sound
transmitted from outside to inside and vise versa. This is usually considered as a benefit even
though there is no monetary amount associated with it.
ENERGY STAR Appliances Analysis
Of the three appliances looked at, only two of them had a favorable SIR. The ENERGY
STAR dishwasher had an SIR of 3.013 and a payback period of 4.08 years. The refrigerator had
an SIR of 1.407 and payback of 9.34 years. The upgraded washing machine had an SIR of 0.844
and payback period of 11.04 years, over the 10-year analysis period. Water usage was not taken
into account for the dishwasher or washing machine, which would have improved the SIR and
payback periods slightly for both.
Section 5: Favorable Components Analysis
As determined in section 4, the upgraded HVAC system, lights, insulation, paint, solar hot
water heater, and PV system had favorable SIR’s when looked at individually. All six of these
components, a lighter colored exterior paint, and an ENERGY STAR dishwasher and refrigerator
were looked at in combination. Envelope tightness was assumed to be “good” in Energy Gauge
and the miscellaneous loads without the phantom loads were used in this analysis.
Favorable Components and Appliances Energy Summary
When the favorable SIR components and appliances looked at in combination, the house
consumed 6,783 kWh of electricity, produced 5,428 kWh from the PV panels, and consumed 46
Therms of natural gas per year. Of the electricity, 1,297kWh was used for cooling, 573 kWh for
45
heating, 210 kWh for lighting, and 4703 kWh for all other loads. The price premium for the
upgrades with favorable SIR’s was $42,543.16 vs. $52,807.12 for all the upgrades. The
favorable SIR components and appliance house consumed 483 kWh more than all of the
upgraded features and 8,529 kWh less than the model home. Table 4-9 shows the energy end
use for the model, all high-end upgrades, and the favorable SIR upgrades. The Energy Gauge
energy summary can be seen in figure 4-5.
SIR and Payback Summary for Upgrades
For the performing all the favorable SIR upgrades, the simple payback period was 16.24
years and had an SIR of 1.217. For performing all of the upgrades, the simple payback period
was 24.65 years and had and SIR of 1.053. These numbers show both options are favorable if
the additional costs can be paid upfront. Table 4-10 shows a summary of the SIR, simple
payback period, cost premium and total energy savings. Appendix A shows the detailed 30-year
life cycle cost analysis.
Section 6: Life Cycle Cost Analysis with Financing
Most people would be unable to come up with the additional $42,534.16 for the favorable
SIR upgrades or the $52,807.12 for all the upgrades upfront and need to finance it as part of the
30-year mortgage. For both analyses, the rebates received in year 2 were put toward the
principle to end the loan payments early associated with the upgrades. An estimated 30-year
financing rate of 5.875% was obtained from Bank Of America. SIR equaled 0.830 for financing
the favorable SIR upgrades and equaled 0.555 for financing all of the upgrades. Table 4-11
shows the LCC for performing all of the upgrades vs. none and table 4-12 shows the LCC for
performing upgrades with favorable SIR vs. none.

46
Figure 4-1. Floor Plan
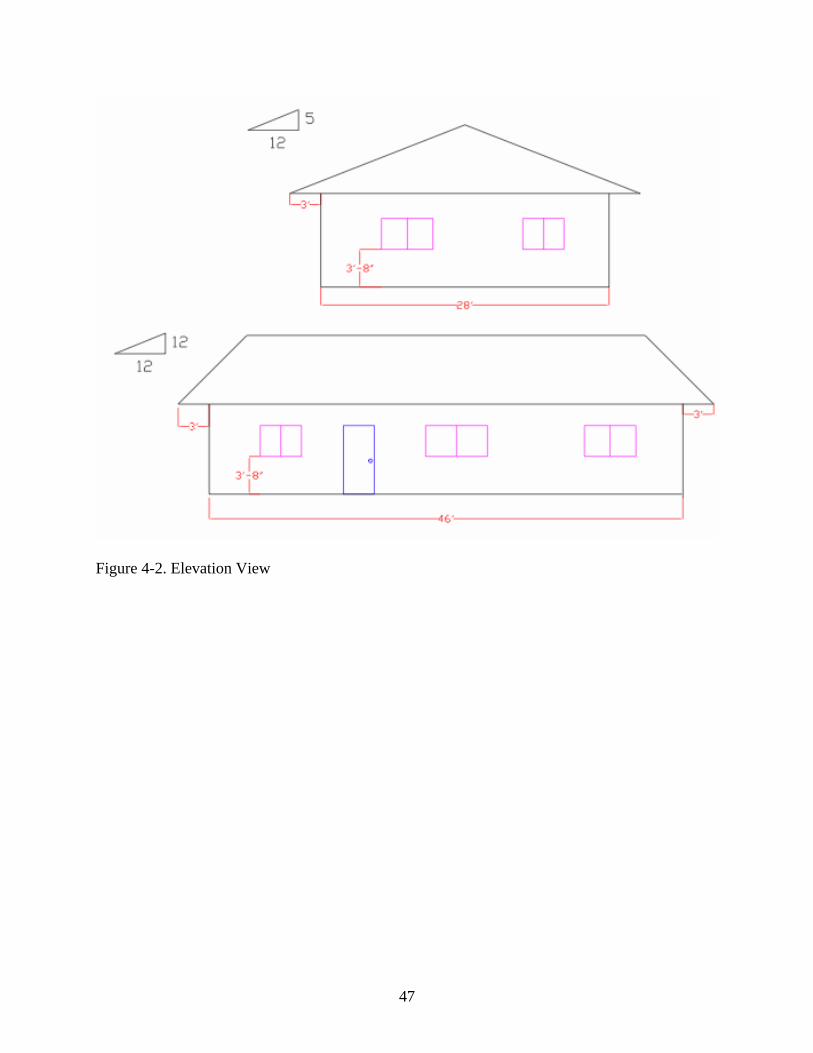
47
Figure 4-2. Elevation View
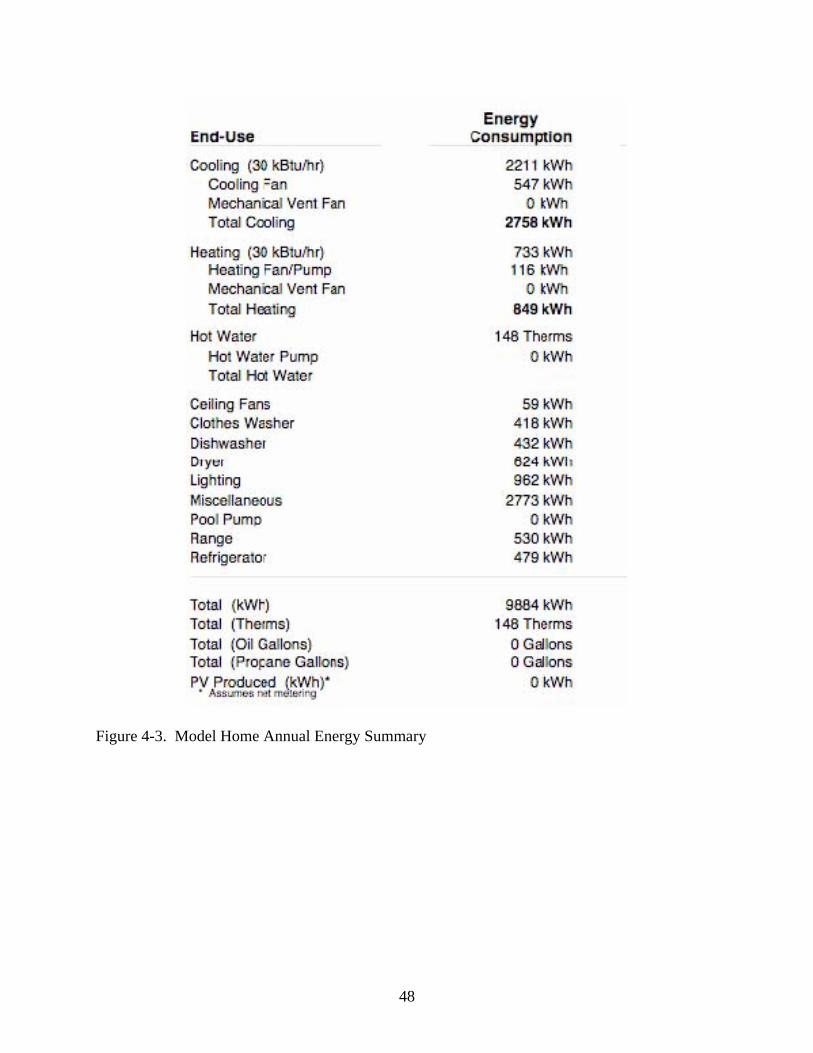
48
Figure 4-3. Model Home Annual Energy Summary
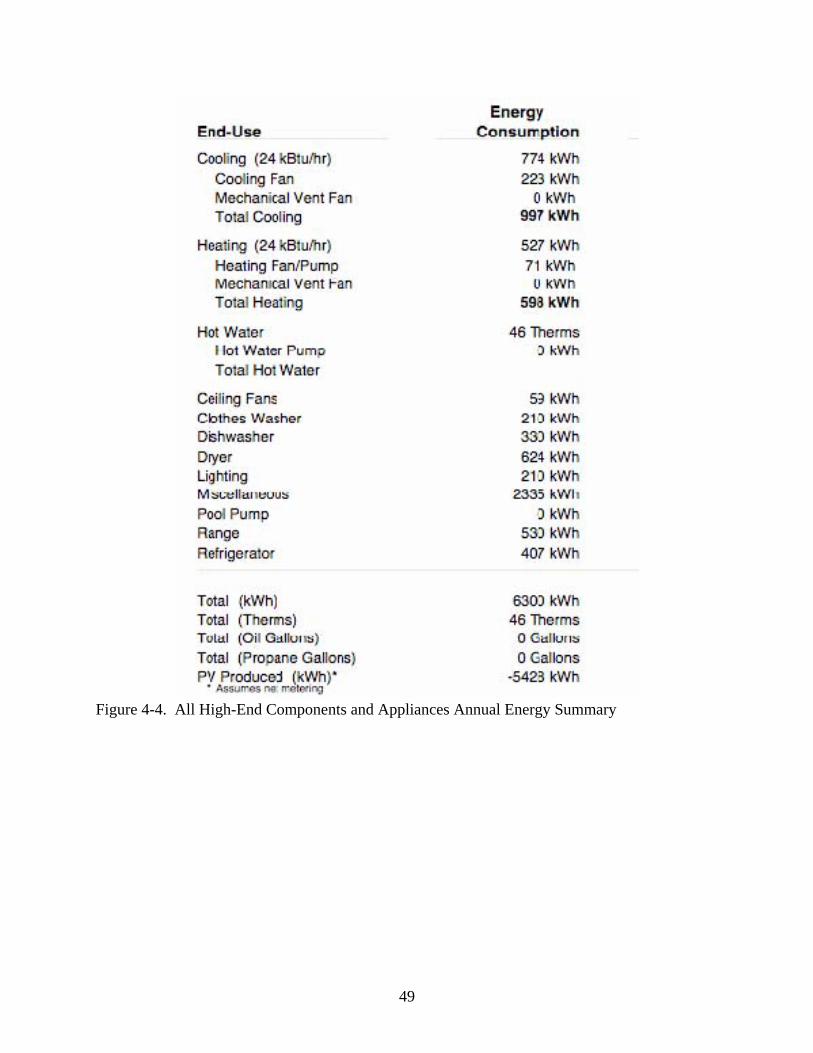
49
Figure 4-4. All High-End Components and Appliances Annual Energy Summary
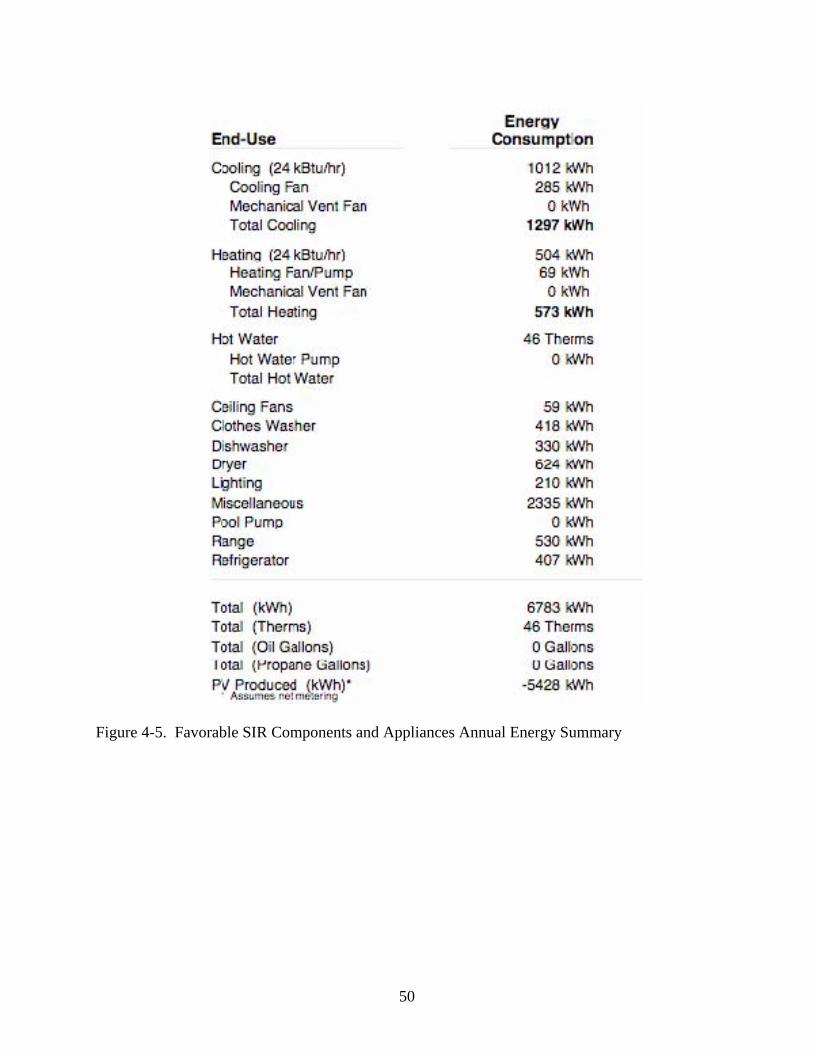
50
Figure 4-5. Favorable SIR Components and Appliances Annual Energy Summary

51
Table 4-1. Low-End Components Summary Description Quantity Unit Cost Total Cost
HVAC
2.5 ton Goodman heat pump. SEER 13, HSPF 7.7. Air-ducts in attic with average leakage 1 $4,884.00 $4,884.00
Digital Thermostat 1 $0.00 $0.00 Lights Incandescent, 60-watts 16 $0.20 $3.12 Roof and Overhangs Dark Composition Shingles, 1' O.H. 1 $3,860.00 $3,860.00
Windows Clear Single Pane, U-factor=1.13, SHGC=0.71. Metal frames 1 $1,301.44 $1,301.44
Roof Insulation Batt R-19 1 $681.45 $681.45 Exterior Paint 0.75 solar absorbance on all walls 0 $0.00 $0.00
Hot Water Heater
Gas Whirlpool #BFG1F4040S3NOV. 40 gallon tank 1 $289.00 $289.00
Washing Machine 3.2 ft3 Whirlpool #WTW5200S 1 $350.00 $350.00 Refrigerator 18.2 ft3 Kenmore #6580 1 $430.00 $430.00 Dishwasher 24" Tappan #TDB210RFS 1 $198.00 $198.00 Total Cost $11,997.01
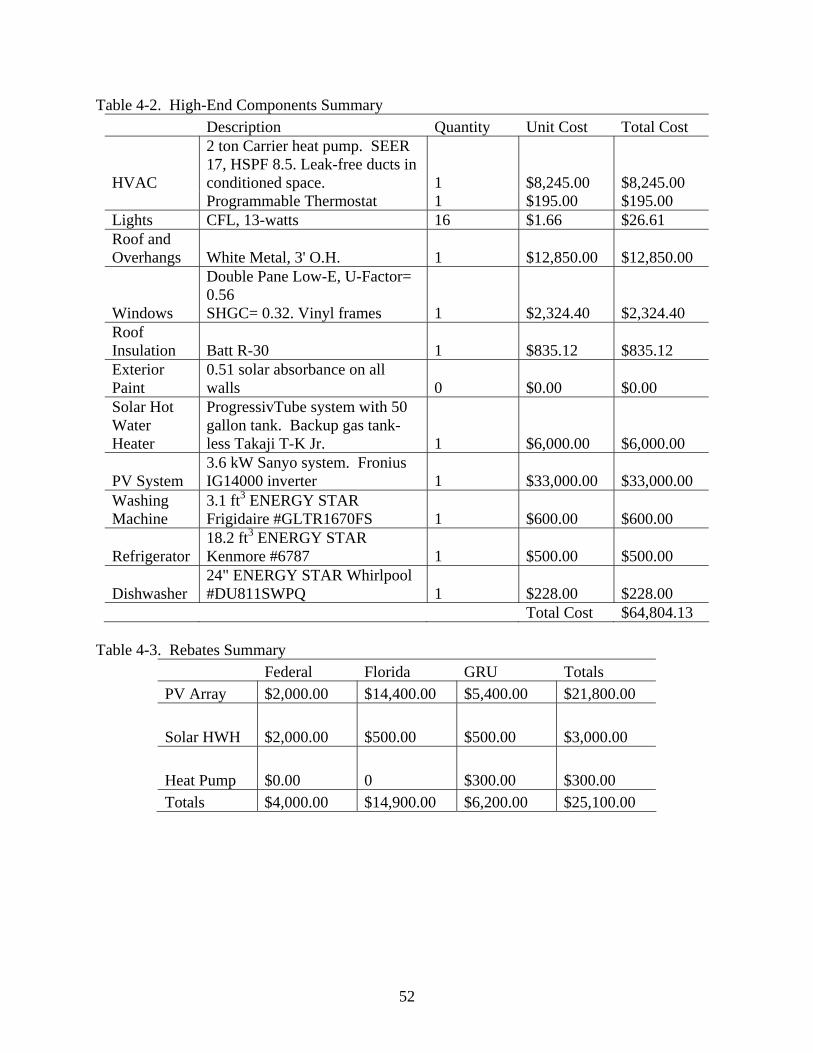
52
Table 4-2. High-End Components Summary Description Quantity Unit Cost Total Cost
HVAC
2 ton Carrier heat pump. SEER 17, HSPF 8.5. Leak-free ducts in conditioned space. 1 $8,245.00 $8,245.00
Programmable Thermostat 1 $195.00 $195.00 Lights CFL, 13-watts 16 $1.66 $26.61 Roof and Overhangs White Metal, 3' O.H. 1 $12,850.00 $12,850.00
Windows
Double Pane Low-E, U-Factor= 0.56 SHGC= 0.32. Vinyl frames 1 $2,324.40 $2,324.40
Roof Insulation Batt R-30 1 $835.12 $835.12 Exterior Paint
0.51 solar absorbance on all walls 0 $0.00 $0.00
Solar Hot Water Heater
ProgressivTube system with 50 gallon tank. Backup gas tank-less Takaji T-K Jr. 1 $6,000.00 $6,000.00
PV System 3.6 kW Sanyo system. Fronius IG14000 inverter 1 $33,000.00 $33,000.00
Washing Machine
3.1 ft3 ENERGY STAR Frigidaire #GLTR1670FS 1 $600.00 $600.00
Refrigerator 18.2 ft3 ENERGY STAR Kenmore #6787 1 $500.00 $500.00
Dishwasher 24" ENERGY STAR Whirlpool #DU811SWPQ 1 $228.00 $228.00
Total Cost $64,804.13 Table 4-3. Rebates Summary
Federal Florida GRU Totals PV Array $2,000.00 $14,400.00 $5,400.00 $21,800.00
Solar HWH $2,000.00 $500.00 $500.00 $3,000.00
Heat Pump $0.00 0 $300.00 $300.00 Totals $4,000.00 $14,900.00 $6,200.00 $25,100.00
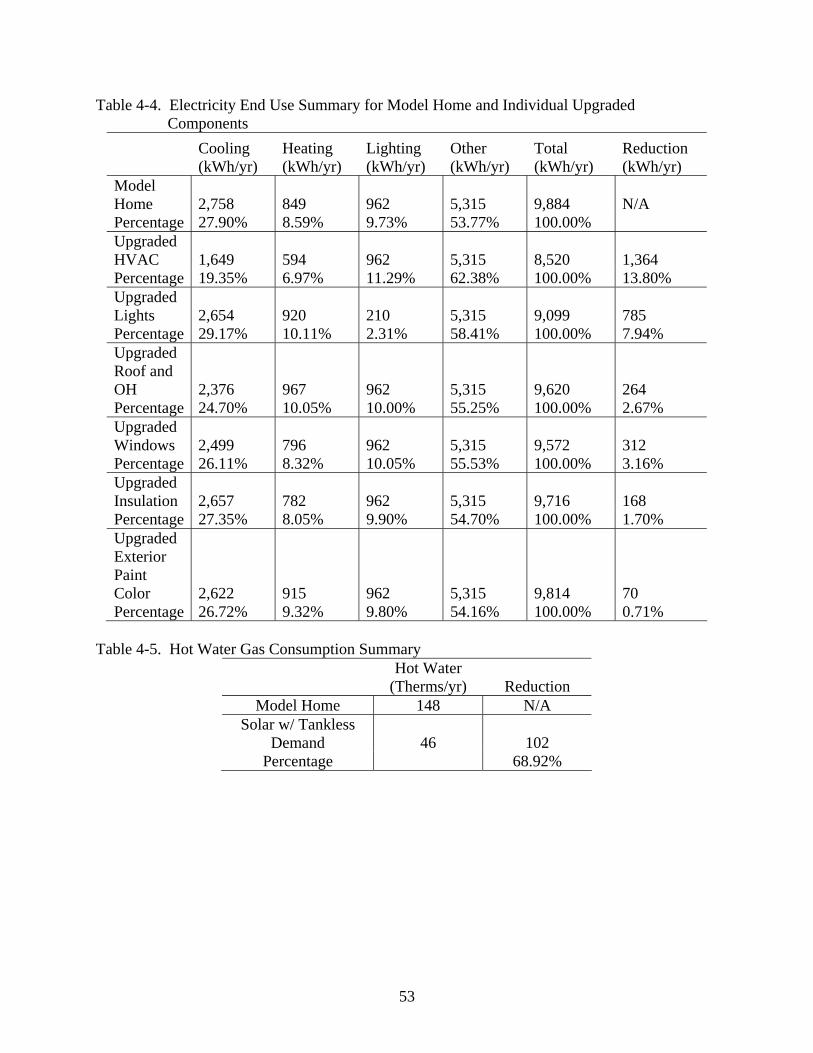
53
Table 4-4. Electricity End Use Summary for Model Home and Individual Upgraded Components
Cooling (kWh/yr)
Heating (kWh/yr)
Lighting (kWh/yr)
Other (kWh/yr)
Total (kWh/yr)
Reduction (kWh/yr)
Model Home 2,758 849 962 5,315 9,884 N/A Percentage 27.90% 8.59% 9.73% 53.77% 100.00% Upgraded HVAC 1,649 594 962 5,315 8,520 1,364 Percentage 19.35% 6.97% 11.29% 62.38% 100.00% 13.80% Upgraded Lights 2,654 920 210 5,315 9,099 785 Percentage 29.17% 10.11% 2.31% 58.41% 100.00% 7.94% Upgraded Roof and OH 2,376 967 962 5,315 9,620 264 Percentage 24.70% 10.05% 10.00% 55.25% 100.00% 2.67% Upgraded Windows 2,499 796 962 5,315 9,572 312 Percentage 26.11% 8.32% 10.05% 55.53% 100.00% 3.16% Upgraded Insulation 2,657 782 962 5,315 9,716 168 Percentage 27.35% 8.05% 9.90% 54.70% 100.00% 1.70% Upgraded Exterior Paint Color 2,622 915 962 5,315 9,814 70 Percentage 26.72% 9.32% 9.80% 54.16% 100.00% 0.71%
Table 4-5. Hot Water Gas Consumption Summary
Hot Water
(Therms/yr) Reduction Model Home 148 N/A
Solar w/ Tankless Demand 46 102
Percentage 68.92%
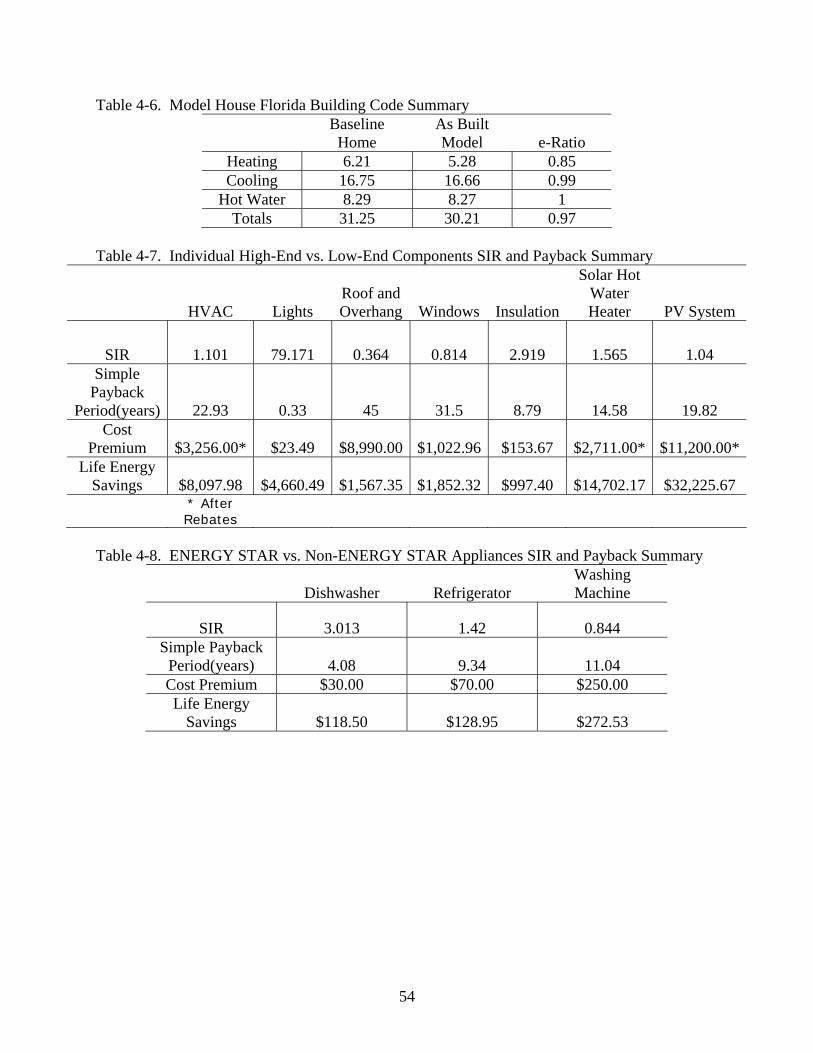
54
Table 4-6. Model House Florida Building Code Summary
Baseline
Home As Built Model e-Ratio
Heating 6.21 5.28 0.85 Cooling 16.75 16.66 0.99
Hot Water 8.29 8.27 1 Totals 31.25 30.21 0.97
Table 4-7. Individual High-End vs. Low-End Components SIR and Payback Summary
HVAC Lights Roof and Overhang Windows Insulation
Solar Hot Water Heater PV System
SIR 1.101 79.171 0.364 0.814 2.919 1.565 1.04 Simple
Payback Period(years) 22.93 0.33 45 31.5 8.79 14.58 19.82
Cost Premium $3,256.00* $23.49 $8,990.00 $1,022.96 $153.67 $2,711.00* $11,200.00*
Life Energy Savings $8,097.98 $4,660.49 $1,567.35 $1,852.32 $997.40 $14,702.17 $32,225.67
* After Rebates
Table 4-8. ENERGY STAR vs. Non-ENERGY STAR Appliances SIR and Payback Summary
Dishwasher Refrigerator Washing Machine
SIR 3.013 1.42 0.844 Simple Payback
Period(years) 4.08 9.34 11.04 Cost Premium $30.00 $70.00 $250.00 Life Energy
Savings $118.50 $128.95 $272.53

55
Table 4-9. Energy End Use Comparisons
Model Home All High-End
Upgrades
Favorable SIR
Upgrades Cooling(kWh) 2,758 997 1,297
27.90% 15.83% 19.12% Heating(kWh) 849 598 573
8.59% 9.49% 8.45% Lighting(kWh) 962 210 210
9.73% 3.30% 3.11% Other(kWh) 5,315 4,495 4,703
53.77% 71.35% 69.34% SubTota(kWh) 9,886 6,300 6,783
100.00% 100.00% 100.00% PV System(kWh) 0 5,428 5,428
0 86.16% 80.02% Net Total(kWh) 9,886 872 1,355
Hot Water(Therms) 148 46 46
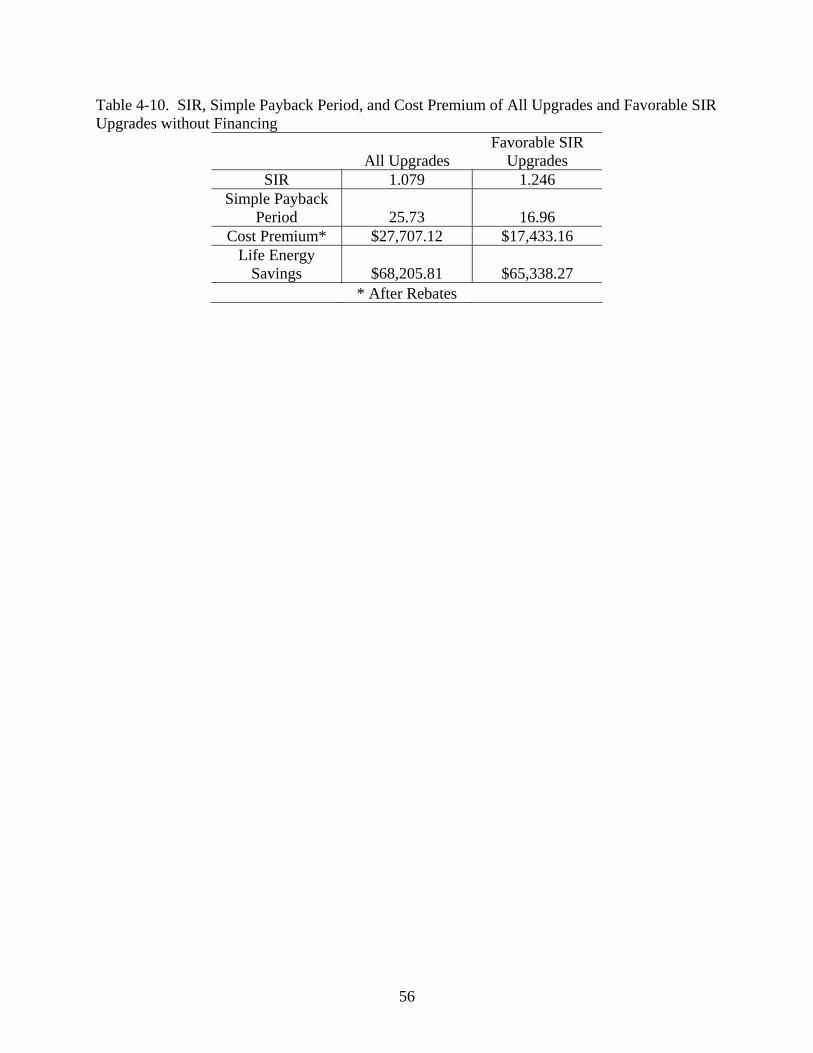
56
Table 4-10. SIR, Simple Payback Period, and Cost Premium of All Upgrades and Favorable SIR Upgrades without Financing
All Upgrades Favorable SIR
Upgrades SIR 1.079 1.246
Simple Payback Period 25.73 16.96
Cost Premium* $27,707.12 $17,433.16 Life Energy
Savings $68,205.81 $65,338.27 * After Rebates
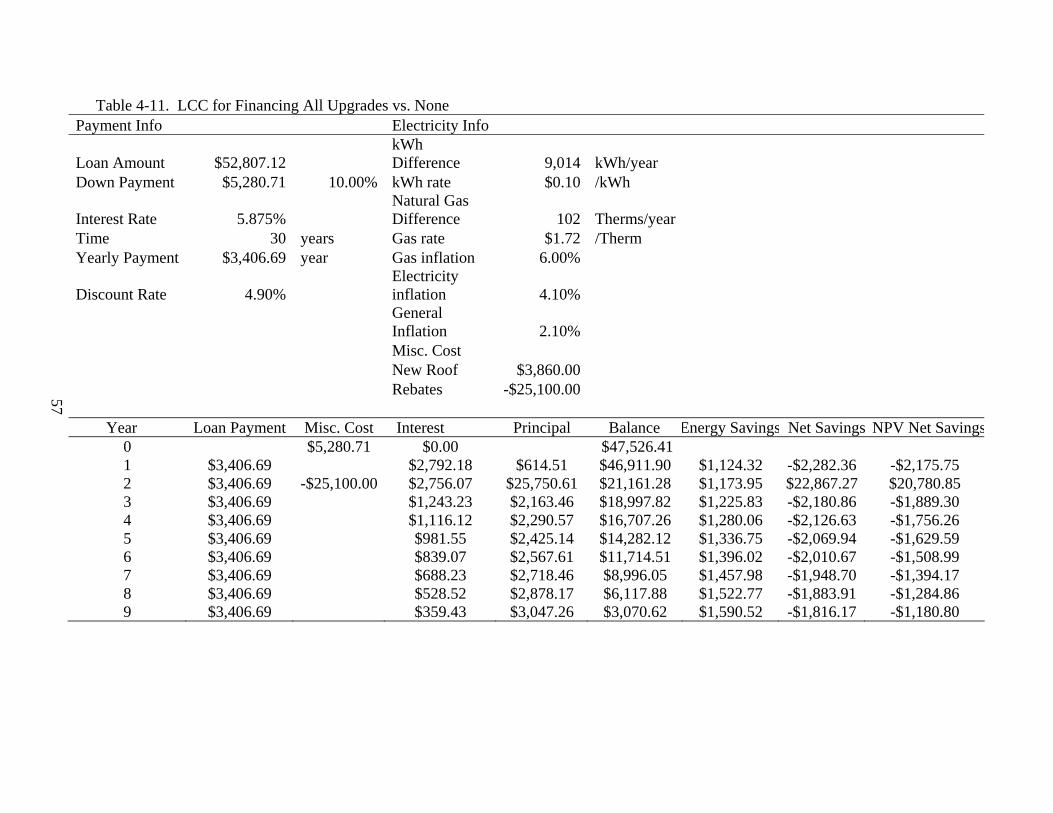
57
Table 4-11. LCC for Financing All Upgrades vs. None Payment Info Electricity Info
Loan Amount $52,807.12 kWh Difference 9,014 kWh/year
Down Payment $5,280.71 10.00% kWh rate $0.10 /kWh
Interest Rate 5.875% Natural Gas Difference 102 Therms/year
Time 30 years Gas rate $1.72 /Therm Yearly Payment $3,406.69 year Gas inflation 6.00%
Discount Rate 4.90% Electricity inflation 4.10%
General Inflation 2.10%
Misc. Cost New Roof $3,860.00 Rebates -$25,100.00
Year Loan Payment Misc. Cost Interest Principal Balance Energy Savings Net Savings NPV Net Savings0 $5,280.71 $0.00 $47,526.41 1 $3,406.69 $2,792.18 $614.51 $46,911.90 $1,124.32 -$2,282.36 -$2,175.75 2 $3,406.69 -$25,100.00 $2,756.07 $25,750.61 $21,161.28 $1,173.95 $22,867.27 $20,780.85 3 $3,406.69 $1,243.23 $2,163.46 $18,997.82 $1,225.83 -$2,180.86 -$1,889.30 4 $3,406.69 $1,116.12 $2,290.57 $16,707.26 $1,280.06 -$2,126.63 -$1,756.26 5 $3,406.69 $981.55 $2,425.14 $14,282.12 $1,336.75 -$2,069.94 -$1,629.59 6 $3,406.69 $839.07 $2,567.61 $11,714.51 $1,396.02 -$2,010.67 -$1,508.99 7 $3,406.69 $688.23 $2,718.46 $8,996.05 $1,457.98 -$1,948.70 -$1,394.17 8 $3,406.69 $528.52 $2,878.17 $6,117.88 $1,522.77 -$1,883.91 -$1,284.86 9 $3,406.69 $359.43 $3,047.26 $3,070.62 $1,590.52 -$1,816.17 -$1,180.80
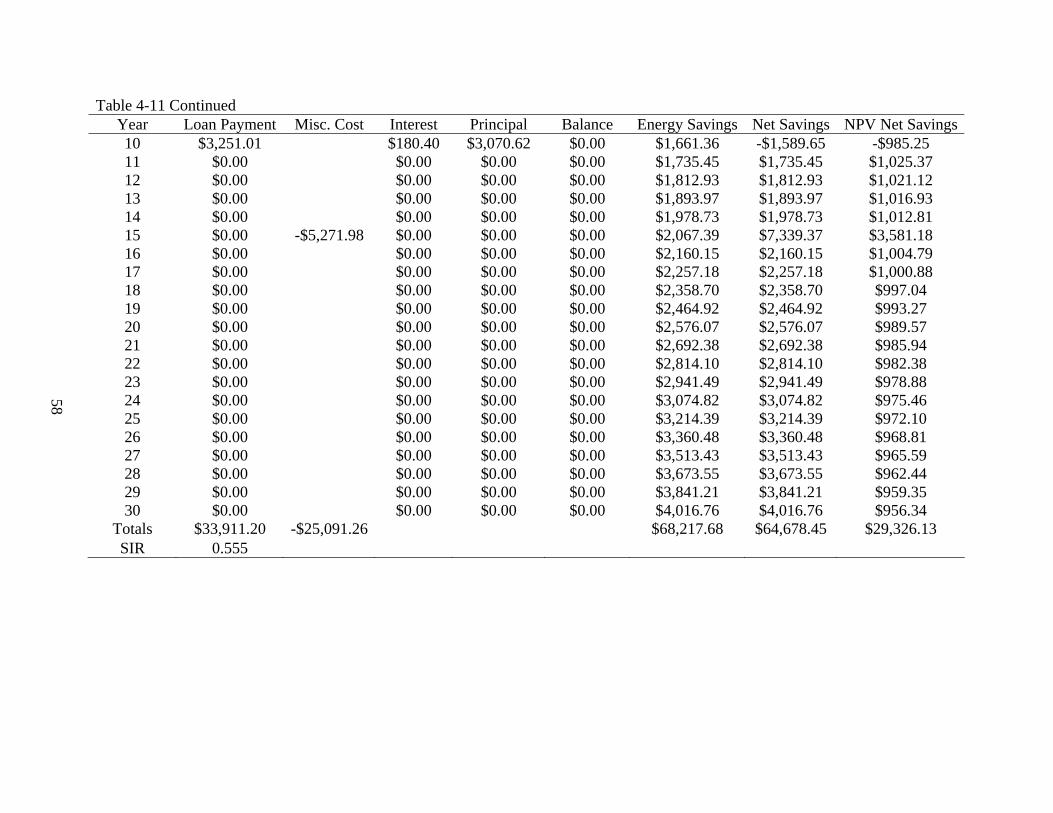
58
Table 4-11 Continued Year Loan Payment Misc. Cost Interest Principal Balance Energy Savings Net Savings NPV Net Savings 10 $3,251.01 $180.40 $3,070.62 $0.00 $1,661.36 -$1,589.65 -$985.25 11 $0.00 $0.00 $0.00 $0.00 $1,735.45 $1,735.45 $1,025.37 12 $0.00 $0.00 $0.00 $0.00 $1,812.93 $1,812.93 $1,021.12 13 $0.00 $0.00 $0.00 $0.00 $1,893.97 $1,893.97 $1,016.93 14 $0.00 $0.00 $0.00 $0.00 $1,978.73 $1,978.73 $1,012.81 15 $0.00 -$5,271.98 $0.00 $0.00 $0.00 $2,067.39 $7,339.37 $3,581.18 16 $0.00 $0.00 $0.00 $0.00 $2,160.15 $2,160.15 $1,004.79 17 $0.00 $0.00 $0.00 $0.00 $2,257.18 $2,257.18 $1,000.88 18 $0.00 $0.00 $0.00 $0.00 $2,358.70 $2,358.70 $997.04 19 $0.00 $0.00 $0.00 $0.00 $2,464.92 $2,464.92 $993.27 20 $0.00 $0.00 $0.00 $0.00 $2,576.07 $2,576.07 $989.57 21 $0.00 $0.00 $0.00 $0.00 $2,692.38 $2,692.38 $985.94 22 $0.00 $0.00 $0.00 $0.00 $2,814.10 $2,814.10 $982.38 23 $0.00 $0.00 $0.00 $0.00 $2,941.49 $2,941.49 $978.88 24 $0.00 $0.00 $0.00 $0.00 $3,074.82 $3,074.82 $975.46 25 $0.00 $0.00 $0.00 $0.00 $3,214.39 $3,214.39 $972.10 26 $0.00 $0.00 $0.00 $0.00 $3,360.48 $3,360.48 $968.81 27 $0.00 $0.00 $0.00 $0.00 $3,513.43 $3,513.43 $965.59 28 $0.00 $0.00 $0.00 $0.00 $3,673.55 $3,673.55 $962.44 29 $0.00 $0.00 $0.00 $0.00 $3,841.21 $3,841.21 $959.35 30 $0.00 $0.00 $0.00 $0.00 $4,016.76 $4,016.76 $956.34
Totals $33,911.20 -$25,091.26 $68,217.68 $64,678.45 $29,326.13 SIR 0.555
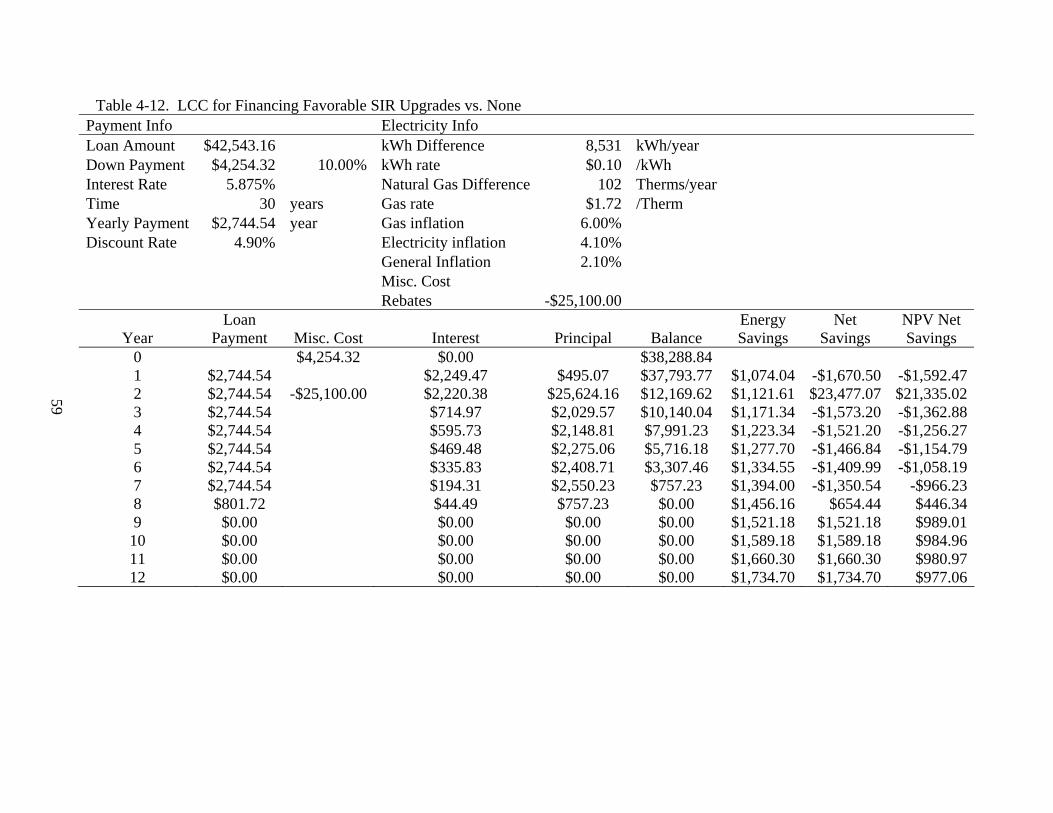
59
Table 4-12. LCC for Financing Favorable SIR Upgrades vs. None Payment Info Electricity Info Loan Amount $42,543.16 kWh Difference 8,531 kWh/year Down Payment $4,254.32 10.00% kWh rate $0.10 /kWh Interest Rate 5.875% Natural Gas Difference 102 Therms/year Time 30 years Gas rate $1.72 /Therm Yearly Payment $2,744.54 year Gas inflation 6.00% Discount Rate 4.90% Electricity inflation 4.10% General Inflation 2.10% Misc. Cost Rebates -$25,100.00
Year Loan
Payment Misc. Cost Interest Principal Balance Energy Savings
Net Savings
NPV Net Savings
0 $4,254.32 $0.00 $38,288.84 1 $2,744.54 $2,249.47 $495.07 $37,793.77 $1,074.04 -$1,670.50 -$1,592.47 2 $2,744.54 -$25,100.00 $2,220.38 $25,624.16 $12,169.62 $1,121.61 $23,477.07 $21,335.02 3 $2,744.54 $714.97 $2,029.57 $10,140.04 $1,171.34 -$1,573.20 -$1,362.88 4 $2,744.54 $595.73 $2,148.81 $7,991.23 $1,223.34 -$1,521.20 -$1,256.27 5 $2,744.54 $469.48 $2,275.06 $5,716.18 $1,277.70 -$1,466.84 -$1,154.79 6 $2,744.54 $335.83 $2,408.71 $3,307.46 $1,334.55 -$1,409.99 -$1,058.19 7 $2,744.54 $194.31 $2,550.23 $757.23 $1,394.00 -$1,350.54 -$966.23 8 $801.72 $44.49 $757.23 $0.00 $1,456.16 $654.44 $446.34 9 $0.00 $0.00 $0.00 $0.00 $1,521.18 $1,521.18 $989.01 10 $0.00 $0.00 $0.00 $0.00 $1,589.18 $1,589.18 $984.96 11 $0.00 $0.00 $0.00 $0.00 $1,660.30 $1,660.30 $980.97 12 $0.00 $0.00 $0.00 $0.00 $1,734.70 $1,734.70 $977.06
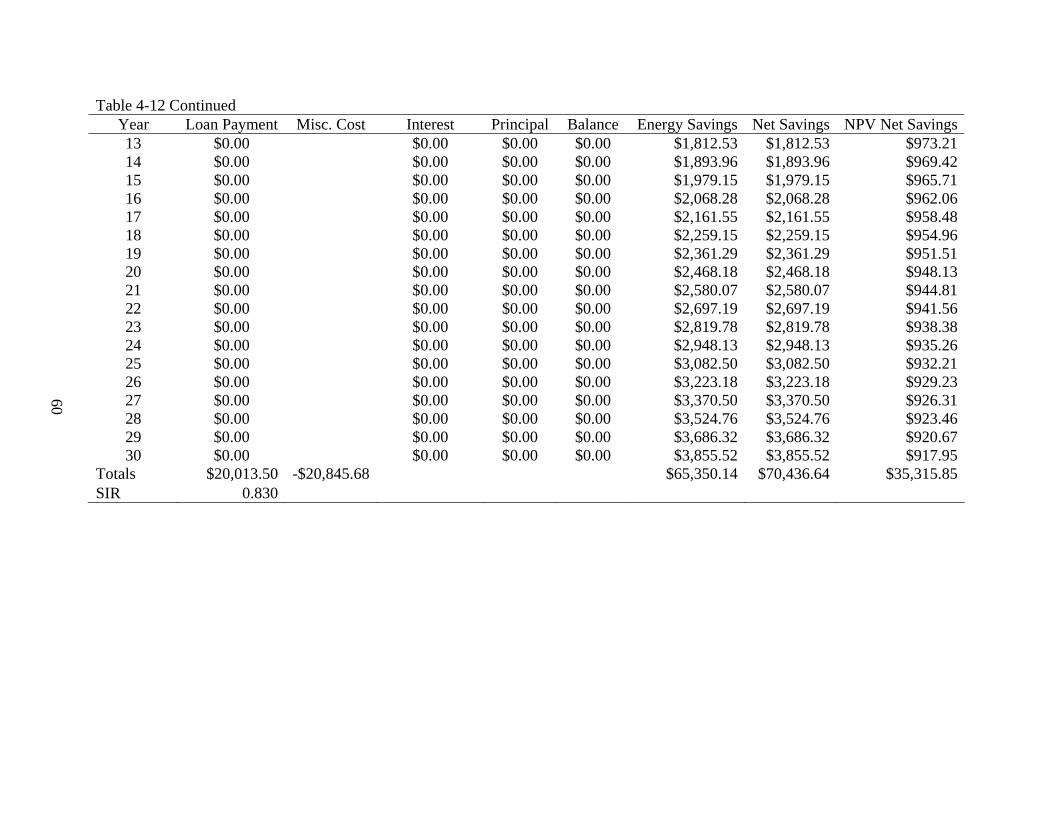
60
Table 4-12 Continued Year Loan Payment Misc. Cost Interest Principal Balance Energy Savings Net Savings NPV Net Savings 13 $0.00 $0.00 $0.00 $0.00 $1,812.53 $1,812.53 $973.21 14 $0.00 $0.00 $0.00 $0.00 $1,893.96 $1,893.96 $969.42 15 $0.00 $0.00 $0.00 $0.00 $1,979.15 $1,979.15 $965.71 16 $0.00 $0.00 $0.00 $0.00 $2,068.28 $2,068.28 $962.06 17 $0.00 $0.00 $0.00 $0.00 $2,161.55 $2,161.55 $958.48 18 $0.00 $0.00 $0.00 $0.00 $2,259.15 $2,259.15 $954.96 19 $0.00 $0.00 $0.00 $0.00 $2,361.29 $2,361.29 $951.51 20 $0.00 $0.00 $0.00 $0.00 $2,468.18 $2,468.18 $948.13 21 $0.00 $0.00 $0.00 $0.00 $2,580.07 $2,580.07 $944.81 22 $0.00 $0.00 $0.00 $0.00 $2,697.19 $2,697.19 $941.56 23 $0.00 $0.00 $0.00 $0.00 $2,819.78 $2,819.78 $938.38 24 $0.00 $0.00 $0.00 $0.00 $2,948.13 $2,948.13 $935.26 25 $0.00 $0.00 $0.00 $0.00 $3,082.50 $3,082.50 $932.21 26 $0.00 $0.00 $0.00 $0.00 $3,223.18 $3,223.18 $929.23 27 $0.00 $0.00 $0.00 $0.00 $3,370.50 $3,370.50 $926.31 28 $0.00 $0.00 $0.00 $0.00 $3,524.76 $3,524.76 $923.46 29 $0.00 $0.00 $0.00 $0.00 $3,686.32 $3,686.32 $920.67 30 $0.00 $0.00 $0.00 $0.00 $3,855.52 $3,855.52 $917.95
Totals $20,013.50 -$20,845.68 $65,350.14 $70,436.64 $35,315.85 SIR 0.830
61
CHAPTER 5 CONCLUSIONS AND RECOMMENDATIONS
This thesis has shown which energy efficiency upgrades to a home are better investments
than others for Gainesville’s hot climate. Some components did not provide a favorable return
on the investment and can not currently be justified. Others proved to be great investments and
easy to incorporate into any new or existing home.
Conclusions
The 1,288 square foot model home consumed 9,886 kWh of electricity and 148 Therms of
natural gas per year if low-end components were selected and narrowly passed building code.
With all of the proposed upgrades at an additional cost of $52,807.12 before rebates, net
electricity consumption dropped to 872 kWh and natural gas consumption to 46 Therms. When
only upgraded components with favorable SIR’s were selected, at an additional cost of
$42,543.16 before rebates, net electricity consumption was 1355 kWh and natural gas
consumption 46 Therms. It was determined that both of these options were unfavorable if they
needed to be fully financed in a mortgage, but if not, then they were both worthwhile.
When all of the component options were looked at individually, most proved to be cost
efficient when financing wasn’t an issue. The only three options that had unfavorable SIR’s
were upgrading to a white metal roof with large overhangs, low-e windows, and an ENERGY
STAR washing machine.
The positive results for the solar hot water heater and PV system were heavily influenced
by the amount of rebates available for them. The federal rebates are available until the end of
2008, GRU rebates until September 30, 2008, and the Florida rebates until the middle of 2010.
If these rebate programs are not renewed these results will change significantly.
62
Recommendations
The future of this research should be reexamined with different assumed values for
discount rates and utility inflation rates. The results obtained in this thesis are highly dependent
upon the expected rise in cost for electricity and natural gas. A slight change in any of these
three assumptions would influence many of the components that had SIR values near 1.00.
Another recommendation is to perform the study with a larger home or when 1.5-ton high
SEER units become available. The cooling cost per square foot would drop with a properly
sized HVAC system and have a better SIR ratio. Furthermore, owners of a larger home would
be more likely to have the financial means for many of the energy efficiency upgrades.
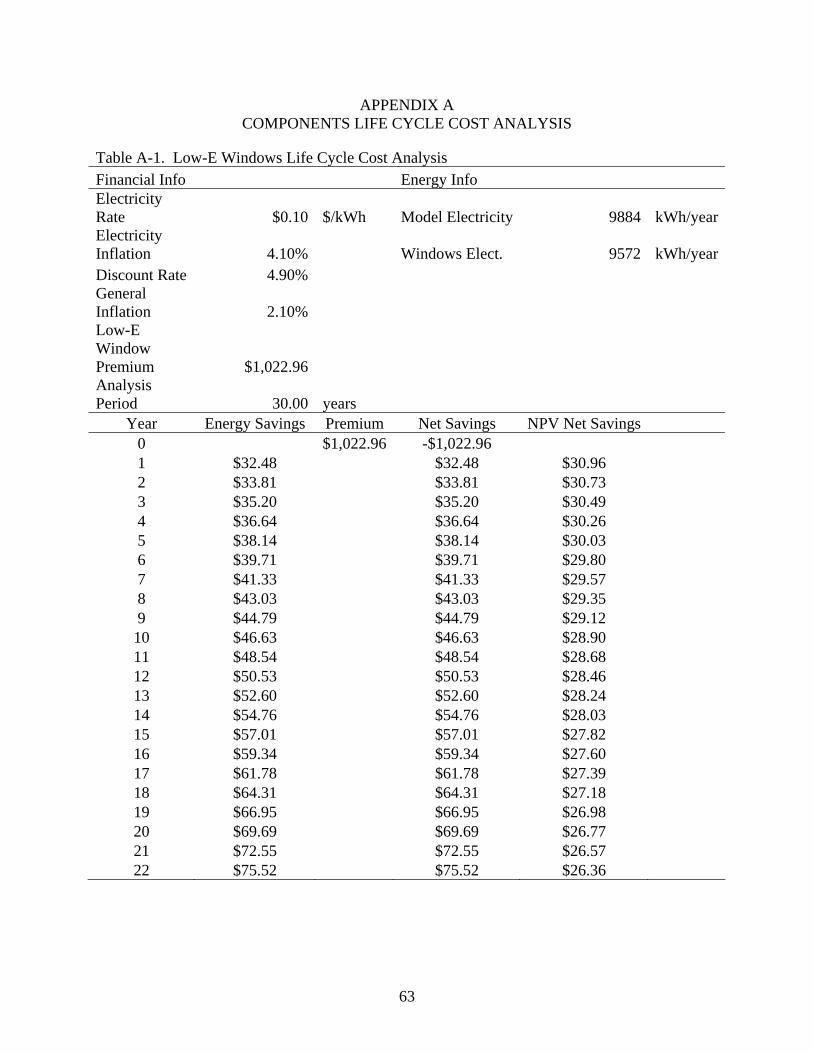
63
APPENDIX A COMPONENTS LIFE CYCLE COST ANALYSIS
Table A-1. Low-E Windows Life Cycle Cost Analysis Financial Info Energy Info Electricity Rate $0.10 $/kWh Model Electricity 9884 kWh/year Electricity Inflation 4.10% Windows Elect. 9572 kWh/year Discount Rate 4.90% General Inflation 2.10% Low-E Window Premium $1,022.96 Analysis Period 30.00 years
Year Energy Savings Premium Net Savings NPV Net Savings 0 $1,022.96 -$1,022.96 1 $32.48 $32.48 $30.96 2 $33.81 $33.81 $30.73 3 $35.20 $35.20 $30.49 4 $36.64 $36.64 $30.26 5 $38.14 $38.14 $30.03 6 $39.71 $39.71 $29.80 7 $41.33 $41.33 $29.57 8 $43.03 $43.03 $29.35 9 $44.79 $44.79 $29.12 10 $46.63 $46.63 $28.90 11 $48.54 $48.54 $28.68 12 $50.53 $50.53 $28.46 13 $52.60 $52.60 $28.24 14 $54.76 $54.76 $28.03 15 $57.01 $57.01 $27.82 16 $59.34 $59.34 $27.60 17 $61.78 $61.78 $27.39 18 $64.31 $64.31 $27.18 19 $66.95 $66.95 $26.98 20 $69.69 $69.69 $26.77 21 $72.55 $72.55 $26.57 22 $75.52 $75.52 $26.36

64
Table A-1 Continued Year Energy Savings Premium Net Savings NPV Net Savings 23 $78.62 $78.62 $26.16 24 $81.84 $81.84 $25.96 25 $85.20 $85.20 $25.77 26 $88.69 $88.69 $25.57 27 $92.33 $92.33 $25.37 28 $96.11 $96.11 $25.18 29 $100.05 $100.05 $24.99 30 $104.15 $104.15 $24.80
Totals $1,852.32 $1,022.96 $829.36 $833.10 SIR 0.814397512
Simple Payback Period 31.50 years
Table A-2. CFL Life Cycle Cost Analysis Financial Info Energy Info Electricity Rate $0.10 $/kWh
Model Electricity 9884 kWh/year
Electricity Inflation 4.10%
With CFL Electricity 9099 kWh/year
Discount Rate 4.90% General Inflation 2.10% CFL Cost $26.61 8,000 hours Incandescent Cost $3.12 1,000 hours Light Use 1000 hours/year Analysis Period 30.00 years
Year Energy Savings Misc. Cost Net Savings NPV Net Savings 0 $23.49 -$23.49 1 $81.72 -$3.19 $84.90 $80.94 2 $85.07 -$3.25 $88.32 $80.26 3 $88.56 -$3.32 $91.88 $79.59 4 $92.19 -$3.39 $95.58 $78.93
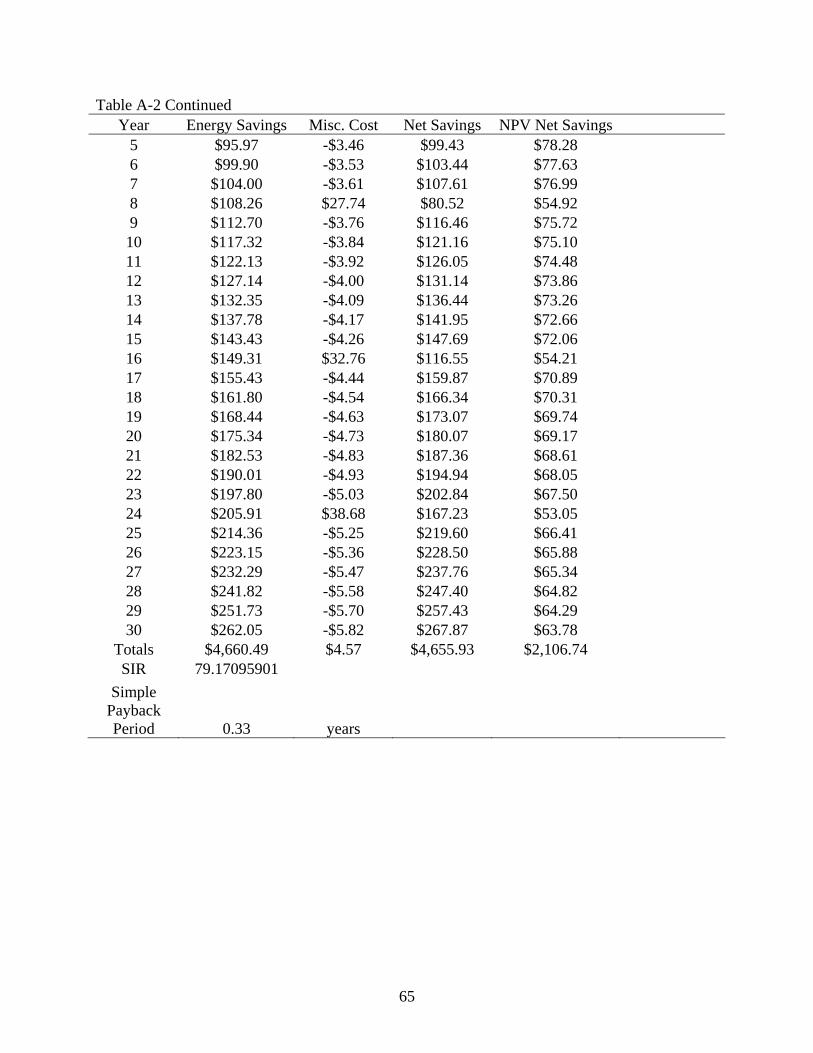
65
Table A-2 Continued Year Energy Savings Misc. Cost Net Savings NPV Net Savings
5 $95.97 -$3.46 $99.43 $78.28 6 $99.90 -$3.53 $103.44 $77.63 7 $104.00 -$3.61 $107.61 $76.99 8 $108.26 $27.74 $80.52 $54.92 9 $112.70 -$3.76 $116.46 $75.72 10 $117.32 -$3.84 $121.16 $75.10 11 $122.13 -$3.92 $126.05 $74.48 12 $127.14 -$4.00 $131.14 $73.86 13 $132.35 -$4.09 $136.44 $73.26 14 $137.78 -$4.17 $141.95 $72.66 15 $143.43 -$4.26 $147.69 $72.06 16 $149.31 $32.76 $116.55 $54.21 17 $155.43 -$4.44 $159.87 $70.89 18 $161.80 -$4.54 $166.34 $70.31 19 $168.44 -$4.63 $173.07 $69.74 20 $175.34 -$4.73 $180.07 $69.17 21 $182.53 -$4.83 $187.36 $68.61 22 $190.01 -$4.93 $194.94 $68.05 23 $197.80 -$5.03 $202.84 $67.50 24 $205.91 $38.68 $167.23 $53.05 25 $214.36 -$5.25 $219.60 $66.41 26 $223.15 -$5.36 $228.50 $65.88 27 $232.29 -$5.47 $237.76 $65.34 28 $241.82 -$5.58 $247.40 $64.82 29 $251.73 -$5.70 $257.43 $64.29 30 $262.05 -$5.82 $267.87 $63.78
Totals $4,660.49 $4.57 $4,655.93 $2,106.74 SIR 79.17095901
Simple Payback Period 0.33 years
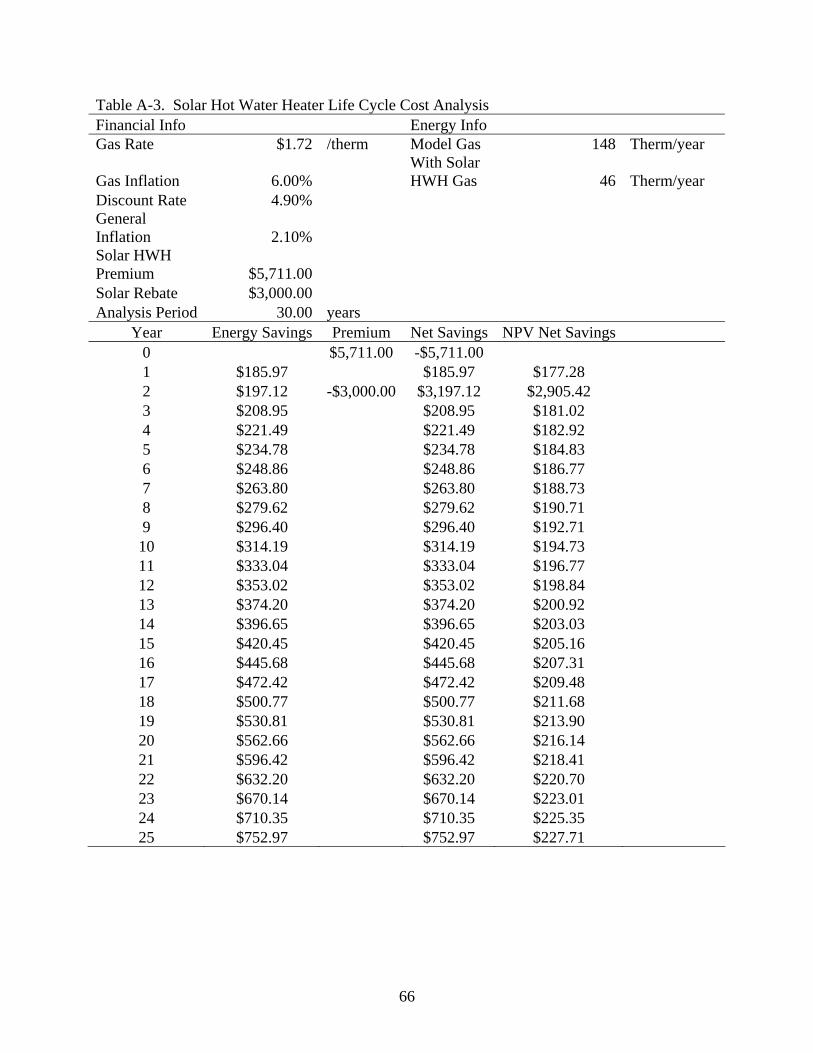
66
Table A-3. Solar Hot Water Heater Life Cycle Cost Analysis Financial Info Energy Info Gas Rate $1.72 /therm Model Gas 148 Therm/year
Gas Inflation 6.00% With Solar HWH Gas 46 Therm/year
Discount Rate 4.90% General Inflation 2.10% Solar HWH Premium $5,711.00 Solar Rebate $3,000.00 Analysis Period 30.00 years
Year Energy Savings Premium Net Savings NPV Net Savings 0 $5,711.00 -$5,711.00 1 $185.97 $185.97 $177.28 2 $197.12 -$3,000.00 $3,197.12 $2,905.42 3 $208.95 $208.95 $181.02 4 $221.49 $221.49 $182.92 5 $234.78 $234.78 $184.83 6 $248.86 $248.86 $186.77 7 $263.80 $263.80 $188.73 8 $279.62 $279.62 $190.71 9 $296.40 $296.40 $192.71 10 $314.19 $314.19 $194.73 11 $333.04 $333.04 $196.77 12 $353.02 $353.02 $198.84 13 $374.20 $374.20 $200.92 14 $396.65 $396.65 $203.03 15 $420.45 $420.45 $205.16 16 $445.68 $445.68 $207.31 17 $472.42 $472.42 $209.48 18 $500.77 $500.77 $211.68 19 $530.81 $530.81 $213.90 20 $562.66 $562.66 $216.14 21 $596.42 $596.42 $218.41 22 $632.20 $632.20 $220.70 23 $670.14 $670.14 $223.01 24 $710.35 $710.35 $225.35 25 $752.97 $752.97 $227.71

67
Table A-3 Continued Year Energy Savings Premium Net Savings NPV Net Savings 26 $798.14 $798.14 $230.10 27 $846.03 $846.03 $232.51 28 $896.79 $896.79 $234.95 29 $950.60 $950.60 $237.42 30 $1,007.64 $1,007.64 $239.91
Totals $14,702.17 $2,711.00 $11,991.17 $8,938.39 SIR 1.565118946
Simple Payback Period* 14.58 years
*Includes rebate

68
Table A-4. Insulation Life Cycle Cost Analysis Financial Info Energy Info
Electricity Rate $0.10 $/kWh Model Electricity 9884 kWh/year
Electricity Inflation 4.10%
With R30 Insulation Elect. 9716 kWh/year
Discount Rate 4.90% General Inflation 2.10% Insulation Premium $153.67 Analysis Period 30.00 years
Year Energy Savings Premium Net Savings NPV Net Savings 0 $153.67 -$153.67 1 $17.49 $17.49 $16.67 2 $18.21 $18.21 $16.54 3 $18.95 $18.95 $16.42 4 $19.73 $19.73 $16.29 5 $20.54 $20.54 $16.17 6 $21.38 $21.38 $16.05 7 $22.26 $22.26 $15.92 8 $23.17 $23.17 $15.80 9 $24.12 $24.12 $15.68 10 $25.11 $25.11 $15.56 11 $26.14 $26.14 $15.44 12 $27.21 $27.21 $15.33 13 $28.32 $28.32 $15.21 14 $29.49 $29.49 $15.09 15 $30.70 $30.70 $14.98 16 $31.95 $31.95 $14.86 17 $33.26 $33.26 $14.75 18 $34.63 $34.63 $14.64 19 $36.05 $36.05 $14.53 20 $37.53 $37.53 $14.41 21 $39.06 $39.06 $14.31 22 $40.67 $40.67 $14.20 23 $42.33 $42.33 $14.09 24 $44.07 $44.07 $13.98 25 $45.88 $45.88 $13.87 26 $47.76 $47.76 $13.77

69
Table A-4 Continued Year Energy Savings Premium Net Savings NPV Net Savings 27 $49.71 $49.71 $13.66 28 $51.75 $51.75 $13.56 29 $53.87 $53.87 $13.46 30 $56.08 $56.08 $13.35
Totals $997.40 $153.67 $843.73 $448.59 SIR 2.919178735 Simple Payback Period 8.79 years

70
Table A-5. Light Colored Exterior Paint Life Cycle Cost Analysis Financial Info Energy Info
Electricity Rate $0.10 /kWh Model Electricity 9884 kWh/year
Electricity Inflation 4.10%
With Light Colored Paint Elect. 9814 kWh/year
Discount Rate 4.90% General Inflation 2.10% Paint Premium $0.00 Analysis Period 30.00 years
Year Energy Savings Premium Net Savings NPV Net Savings 0 $0.00 $0.00 1 $7.29 $7.29 $6.95 2 $7.59 $7.59 $6.89 3 $7.90 $7.90 $6.84 4 $8.22 $8.22 $6.79 5 $8.56 $8.56 $6.74 6 $8.91 $8.91 $6.69 7 $9.27 $9.27 $6.63 8 $9.65 $9.65 $6.58 9 $10.05 $10.05 $6.53 10 $10.46 $10.46 $6.48 11 $10.89 $10.89 $6.43 12 $11.34 $11.34 $6.39 13 $11.80 $11.80 $6.34 14 $12.29 $12.29 $6.29 15 $12.79 $12.79 $6.24 16 $13.31 $13.31 $6.19 17 $13.86 $13.86 $6.15 18 $14.43 $14.43 $6.10 19 $15.02 $15.02 $6.05 20 $15.64 $15.64 $6.01 21 $16.28 $16.28 $5.96 22 $16.94 $16.94 $5.91 23 $17.64 $17.64 $5.87 24 $18.36 $18.36 $5.83 25 $19.11 $19.11 $5.78 26 $19.90 $19.90 $5.74 27 $20.71 $20.71 $5.69

71
Table A-5 Continued Year Energy Savings Premium Net Savings NPV Net Savings 28 $21.56 $21.56 $5.65 29 $22.45 $22.45 $5.61 30 $23.37 $23.37 $5.56
Totals $415.59 $0.00 $415.59 $186.91 Save 70 kWh/year Payback is immediate
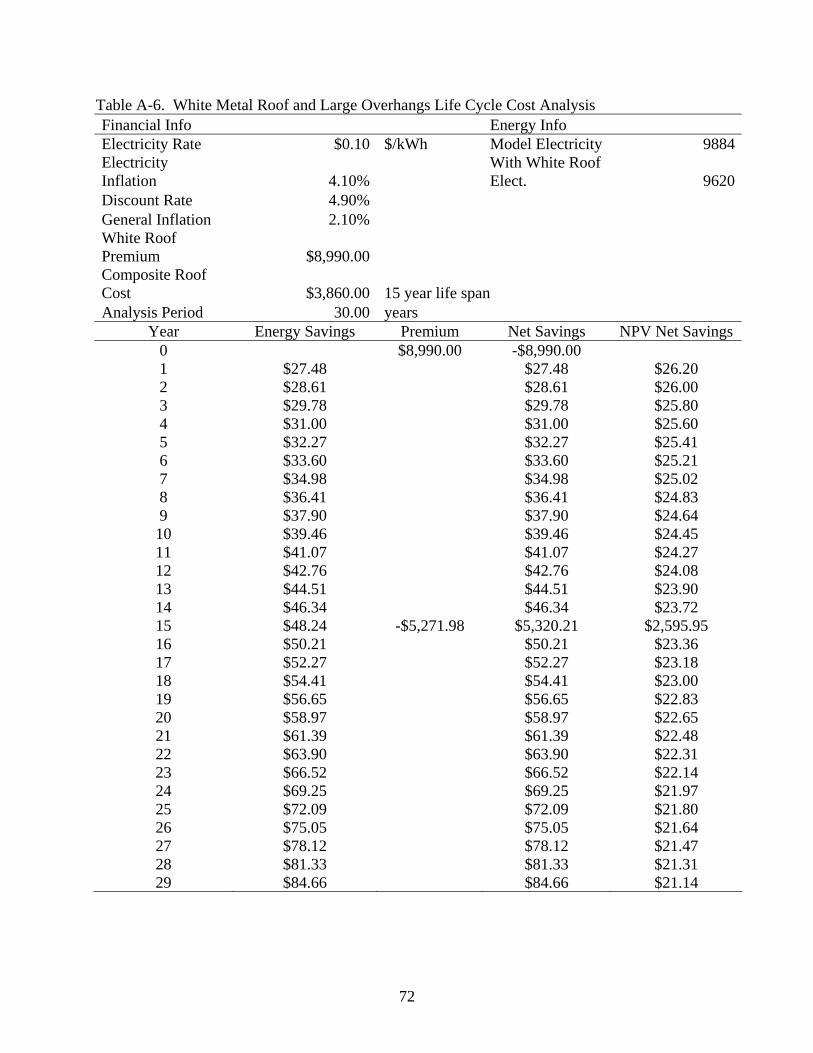
72
Table A-6. White Metal Roof and Large Overhangs Life Cycle Cost Analysis Financial Info Energy Info Electricity Rate $0.10 $/kWh Model Electricity 9884 Electricity Inflation 4.10%
With White Roof Elect. 9620
Discount Rate 4.90% General Inflation 2.10% White Roof Premium $8,990.00 Composite Roof Cost $3,860.00 15 year life span Analysis Period 30.00 years
Year Energy Savings Premium Net Savings NPV Net Savings 0 $8,990.00 -$8,990.00 1 $27.48 $27.48 $26.20 2 $28.61 $28.61 $26.00 3 $29.78 $29.78 $25.80 4 $31.00 $31.00 $25.60 5 $32.27 $32.27 $25.41 6 $33.60 $33.60 $25.21 7 $34.98 $34.98 $25.02 8 $36.41 $36.41 $24.83 9 $37.90 $37.90 $24.64 10 $39.46 $39.46 $24.45 11 $41.07 $41.07 $24.27 12 $42.76 $42.76 $24.08 13 $44.51 $44.51 $23.90 14 $46.34 $46.34 $23.72 15 $48.24 -$5,271.98 $5,320.21 $2,595.95 16 $50.21 $50.21 $23.36 17 $52.27 $52.27 $23.18 18 $54.41 $54.41 $23.00 19 $56.65 $56.65 $22.83 20 $58.97 $58.97 $22.65 21 $61.39 $61.39 $22.48 22 $63.90 $63.90 $22.31 23 $66.52 $66.52 $22.14 24 $69.25 $69.25 $21.97 25 $72.09 $72.09 $21.80 26 $75.05 $75.05 $21.64 27 $78.12 $78.12 $21.47 28 $81.33 $81.33 $21.31 29 $84.66 $84.66 $21.14
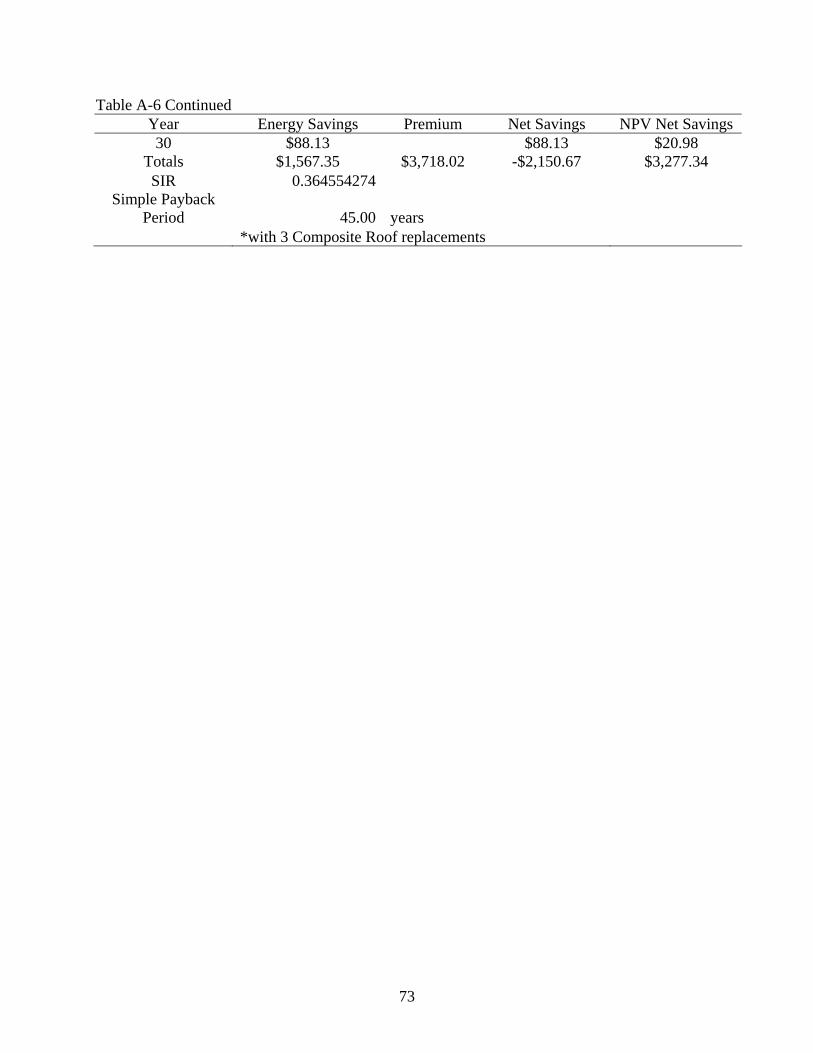
73
Table A-6 Continued Year Energy Savings Premium Net Savings NPV Net Savings 30 $88.13 $88.13 $20.98
Totals $1,567.35 $3,718.02 -$2,150.67 $3,277.34 SIR 0.364554274
Simple Payback Period 45.00 years
*with 3 Composite Roof replacements
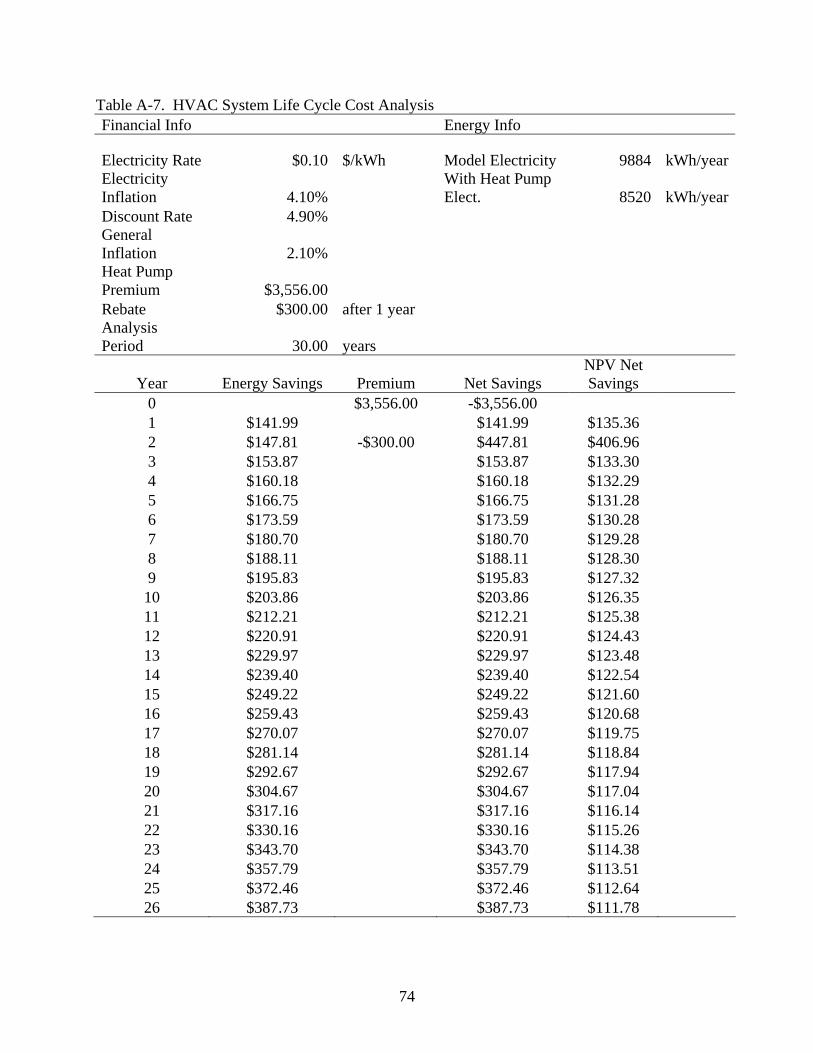
74
Table A-7. HVAC System Life Cycle Cost Analysis Financial Info Energy Info
Electricity Rate $0.10 $/kWh Model Electricity 9884 kWh/year Electricity Inflation 4.10%
With Heat Pump Elect. 8520 kWh/year
Discount Rate 4.90% General Inflation 2.10% Heat Pump Premium $3,556.00 Rebate $300.00 after 1 year Analysis Period 30.00 years
Year Energy Savings Premium Net Savings NPV Net Savings
0 $3,556.00 -$3,556.00 1 $141.99 $141.99 $135.36 2 $147.81 -$300.00 $447.81 $406.96 3 $153.87 $153.87 $133.30 4 $160.18 $160.18 $132.29 5 $166.75 $166.75 $131.28 6 $173.59 $173.59 $130.28 7 $180.70 $180.70 $129.28 8 $188.11 $188.11 $128.30 9 $195.83 $195.83 $127.32 10 $203.86 $203.86 $126.35 11 $212.21 $212.21 $125.38 12 $220.91 $220.91 $124.43 13 $229.97 $229.97 $123.48 14 $239.40 $239.40 $122.54 15 $249.22 $249.22 $121.60 16 $259.43 $259.43 $120.68 17 $270.07 $270.07 $119.75 18 $281.14 $281.14 $118.84 19 $292.67 $292.67 $117.94 20 $304.67 $304.67 $117.04 21 $317.16 $317.16 $116.14 22 $330.16 $330.16 $115.26 23 $343.70 $343.70 $114.38 24 $357.79 $357.79 $113.51 25 $372.46 $372.46 $112.64 26 $387.73 $387.73 $111.78
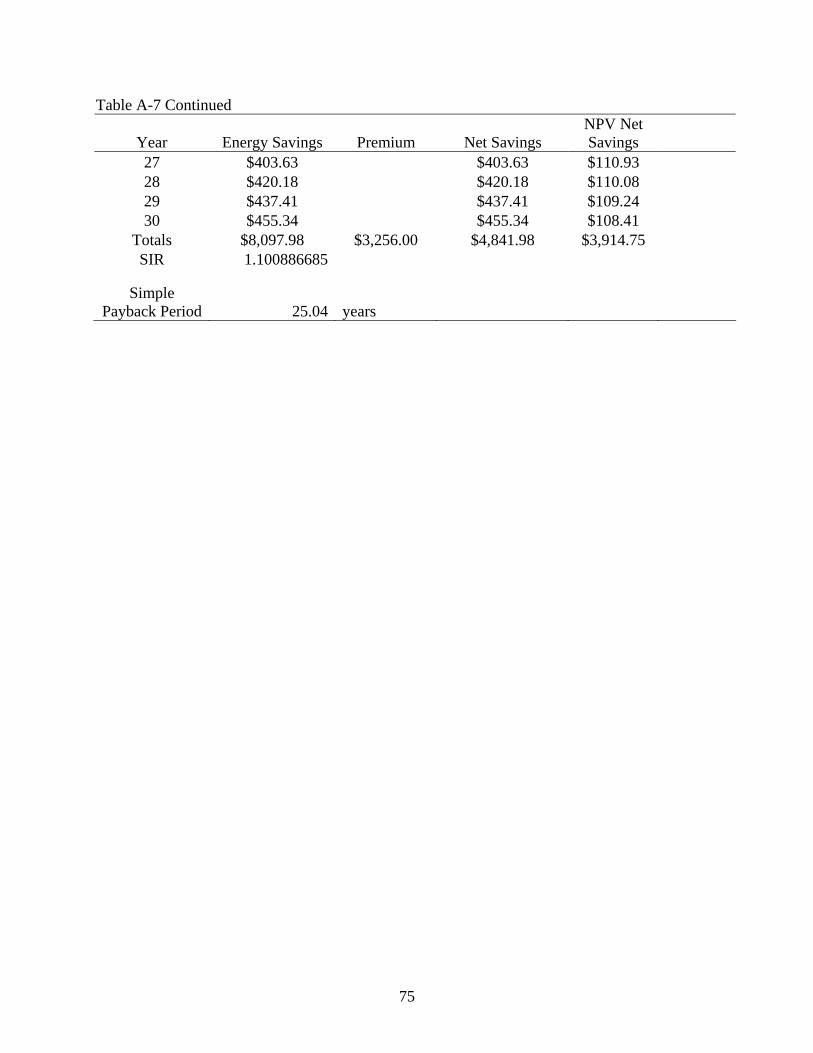
75
Table A-7 Continued
Year Energy Savings Premium Net Savings NPV Net Savings
27 $403.63 $403.63 $110.93 28 $420.18 $420.18 $110.08 29 $437.41 $437.41 $109.24 30 $455.34 $455.34 $108.41
Totals $8,097.98 $3,256.00 $4,841.98 $3,914.75 SIR 1.100886685
Simple Payback Period 25.04 years

76
Table A-8. PV System Life Cycle Cost Analysis Financial Info Energy Info Electricity Rate $0.10 /kWh
Model Electricity 9884 kWh/yr
Electricity Inflation 4.10%
With PV Elect. 4456
kWh/yr
Discount Rate 4.90% General Inflation 2.10%
PV System Premium $33,000.00
PV System Rebate $21,800.00 after 2 years
Analysis Period 30.00 years
Year Energy Savings Premium Net Savings
NPV Net Savings
0 $33,000.00 -$33,000.00 1 $565.05 $565.05 $538.66 2 $588.22 -$21,800.00 $22,388.22 $20,345.51 3 $612.34 $612.34 $530.48 4 $637.45 $637.45 $526.43 5 $663.58 $663.58 $522.42 6 $690.79 $690.79 $518.43 7 $719.11 $719.11 $514.48 8 $748.59 $748.59 $510.55 9 $779.29 $779.29 $506.66 10 $811.24 $811.24 $502.80 11 $844.50 $844.50 $498.96 12 $879.12 $879.12 $495.16 13 $915.16 $915.16 $491.38 14 $952.69 $952.69 $487.63 15 $991.75 $991.75 $483.91 16 $1,032.41 $1,032.41 $480.22 17 $1,074.74 $1,074.74 $476.56 18 $1,118.80 $1,118.80 $472.93 19 $1,164.67 $1,164.67 $469.32 20 $1,212.42 $1,212.42 $465.74 21 $1,262.13 $1,262.13 $462.19 22 $1,313.88 $1,313.88 $458.66 23 $1,367.75 $1,367.75 $455.17 24 $1,423.83 $1,423.83 $451.70 25 $1,482.20 $1,482.20 $448.25
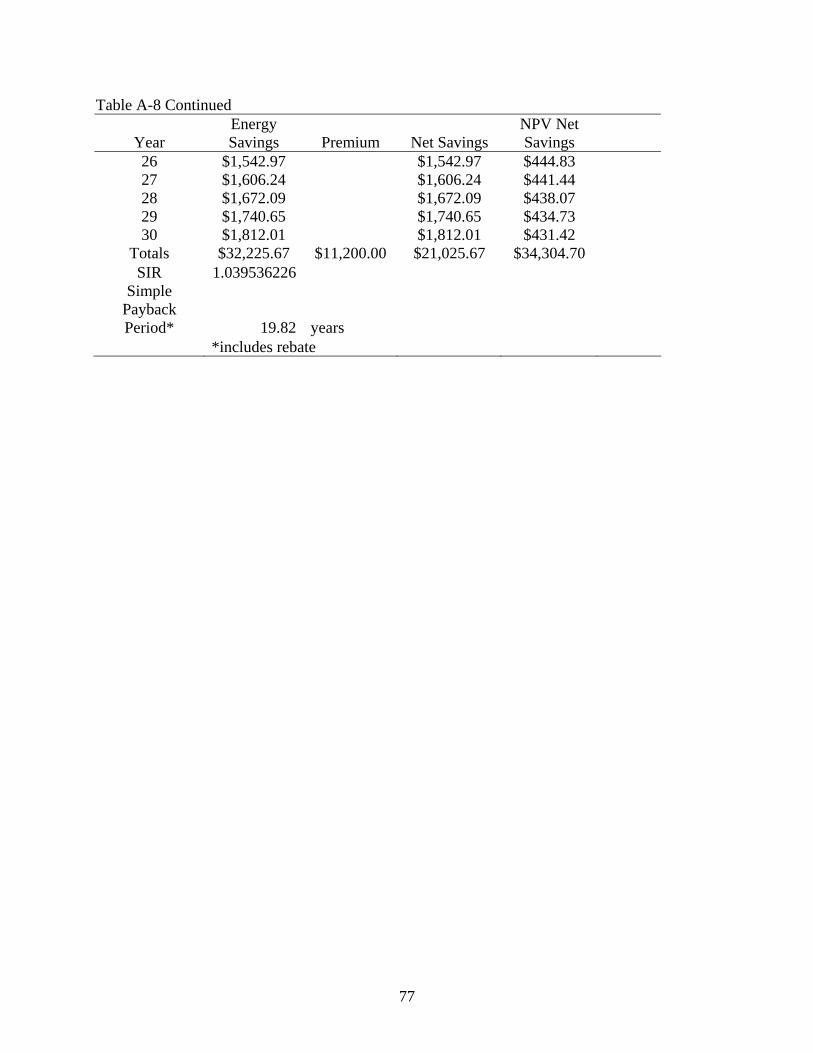
77
Table A-8 Continued
Year Energy Savings Premium Net Savings
NPV Net Savings
26 $1,542.97 $1,542.97 $444.83 27 $1,606.24 $1,606.24 $441.44 28 $1,672.09 $1,672.09 $438.07 29 $1,740.65 $1,740.65 $434.73 30 $1,812.01 $1,812.01 $431.42
Totals $32,225.67 $11,200.00 $21,025.67 $34,304.70 SIR 1.039536226
Simple Payback Period* 19.82 years
*includes rebate

78
Table A-9. Favorable SIR Components Life Cycle Cost Analysis Financial Info Energy Info Electricity Rate $0.10 $/kWh Model Electricity 9,884 kWh/year Gas Rate $1.72 $/therm Model Gas 148 Therm/year
Electricity Inflation 4.10%
With Upgraded Components Elect. 1,355 kWh/year
Gas Inflation 6.00% With Upgraded Components Gas 46 Therm/year
Discount Rate 4.90% General Inflation 2.10% Premium $42,543.16 Rebates $25,100.00 Analysis Period 30.00 years
Year Energy Savings Costs Net Savings NPV Net Savings 0 $42,543.16 -$42,543.16 1 $1,073.84 $1,073.84 $1,023.68 2 $1,121.40 -$25,100.00 $26,221.40 $23,828.95 3 $1,171.12 $1,171.12 $1,014.55 4 $1,223.10 $1,223.10 $1,010.09 5 $1,277.46 $1,277.46 $1,005.70 6 $1,334.30 $1,334.30 $1,001.38 7 $1,393.73 $1,393.73 $997.13 8 $1,455.89 $1,455.89 $992.94 9 $1,520.89 $1,520.89 $988.82
10 $1,588.88 $1,588.88 $984.77 11 $1,659.99 $1,659.99 $980.79 12 $1,734.38 $1,734.38 $976.87 13 $1,812.20 $1,812.20 $973.02 14 $1,893.61 $1,893.61 $969.24 15 $1,978.78 $1,978.78 $965.53 16 $2,067.90 $2,067.90 $961.88 17 $2,161.15 $2,161.15 $958.30 18 $2,258.73 $2,258.73 $954.79
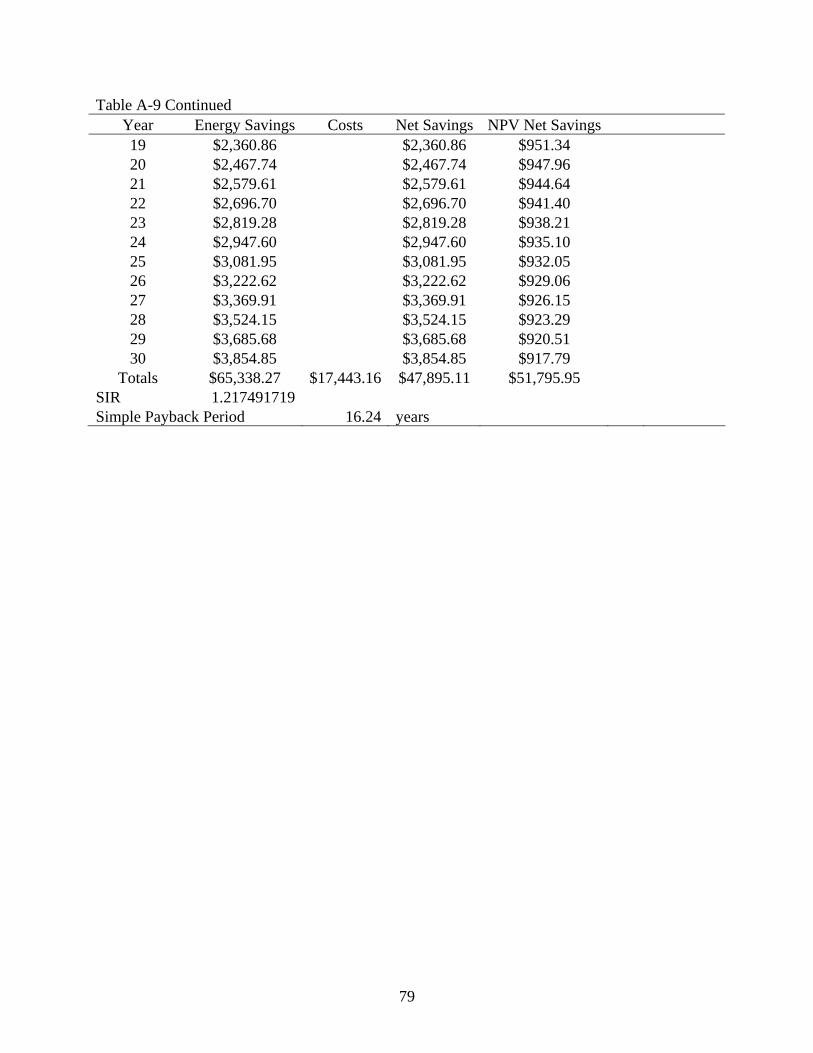
79
Table A-9 Continued Year Energy Savings Costs Net Savings NPV Net Savings 19 $2,360.86 $2,360.86 $951.34 20 $2,467.74 $2,467.74 $947.96 21 $2,579.61 $2,579.61 $944.64 22 $2,696.70 $2,696.70 $941.40 23 $2,819.28 $2,819.28 $938.21 24 $2,947.60 $2,947.60 $935.10 25 $3,081.95 $3,081.95 $932.05 26 $3,222.62 $3,222.62 $929.06 27 $3,369.91 $3,369.91 $926.15 28 $3,524.15 $3,524.15 $923.29 29 $3,685.68 $3,685.68 $920.51 30 $3,854.85 $3,854.85 $917.79
Totals $65,338.27 $17,443.16 $47,895.11 $51,795.95 SIR 1.217491719 Simple Payback Period 16.24 years
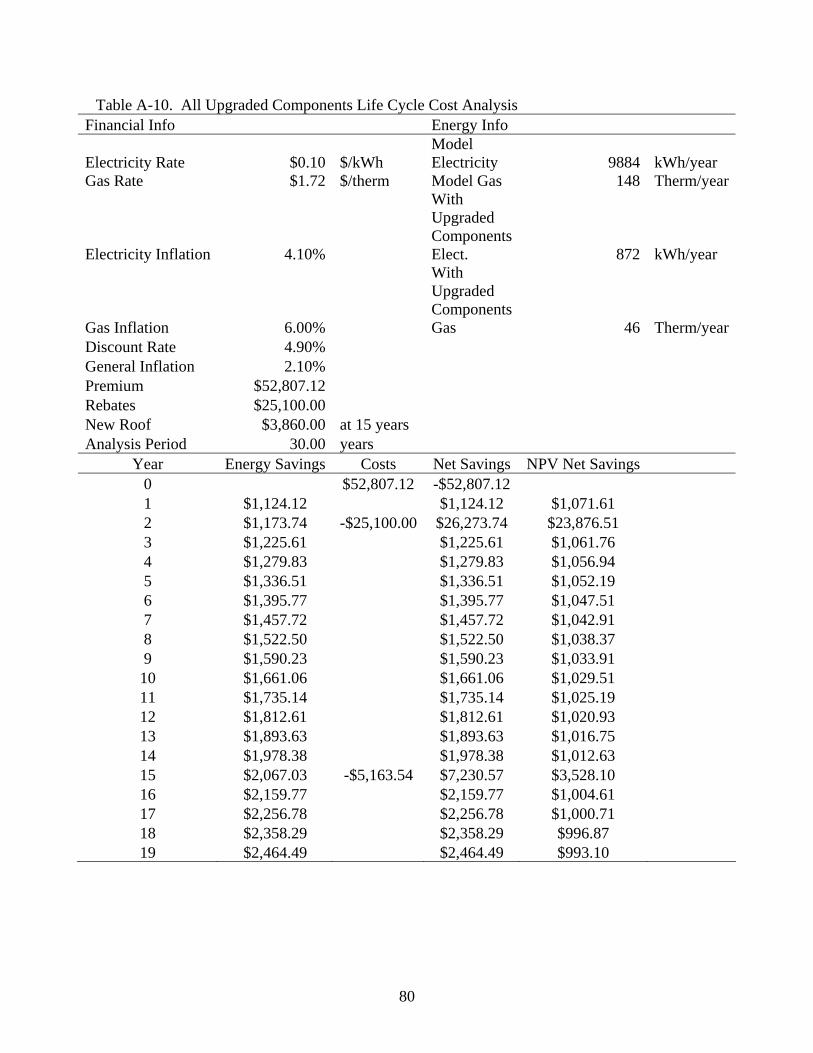
80
Table A-10. All Upgraded Components Life Cycle Cost Analysis Financial Info Energy Info
Electricity Rate $0.10 $/kWh Model Electricity 9884 kWh/year
Gas Rate $1.72 $/therm Model Gas 148 Therm/year
Electricity Inflation 4.10%
With Upgraded Components Elect. 872 kWh/year
Gas Inflation 6.00%
With Upgraded Components Gas 46 Therm/year
Discount Rate 4.90% General Inflation 2.10% Premium $52,807.12 Rebates $25,100.00 New Roof $3,860.00 at 15 years Analysis Period 30.00 years
Year Energy Savings Costs Net Savings NPV Net Savings 0 $52,807.12 -$52,807.12 1 $1,124.12 $1,124.12 $1,071.61 2 $1,173.74 -$25,100.00 $26,273.74 $23,876.51 3 $1,225.61 $1,225.61 $1,061.76 4 $1,279.83 $1,279.83 $1,056.94 5 $1,336.51 $1,336.51 $1,052.19 6 $1,395.77 $1,395.77 $1,047.51 7 $1,457.72 $1,457.72 $1,042.91 8 $1,522.50 $1,522.50 $1,038.37 9 $1,590.23 $1,590.23 $1,033.91 10 $1,661.06 $1,661.06 $1,029.51 11 $1,735.14 $1,735.14 $1,025.19 12 $1,812.61 $1,812.61 $1,020.93 13 $1,893.63 $1,893.63 $1,016.75 14 $1,978.38 $1,978.38 $1,012.63 15 $2,067.03 -$5,163.54 $7,230.57 $3,528.10 16 $2,159.77 $2,159.77 $1,004.61 17 $2,256.78 $2,256.78 $1,000.71 18 $2,358.29 $2,358.29 $996.87 19 $2,464.49 $2,464.49 $993.10

81
Table A-10 Continued 20 $2,575.62 $2,575.62 $989.40 21 $2,691.91 $2,691.91 $985.77 22 $2,813.61 $2,813.61 $982.21 23 $2,940.98 $2,940.98 $978.72 24 $3,074.30 $3,074.30 $975.29 25 $3,213.84 $3,213.84 $971.93 26 $3,359.91 $3,359.91 $968.65 27 $3,512.84 $3,512.84 $965.43 28 $3,672.94 $3,672.94 $962.28 29 $3,840.57 $3,840.57 $959.19 30 $4,016.09 $4,016.09 $956.18
Totals $68,205.81 $22,543.58 $45,662.23 $55,605.15 SIR 1.052985803 Simple Payback Period 24.65 years
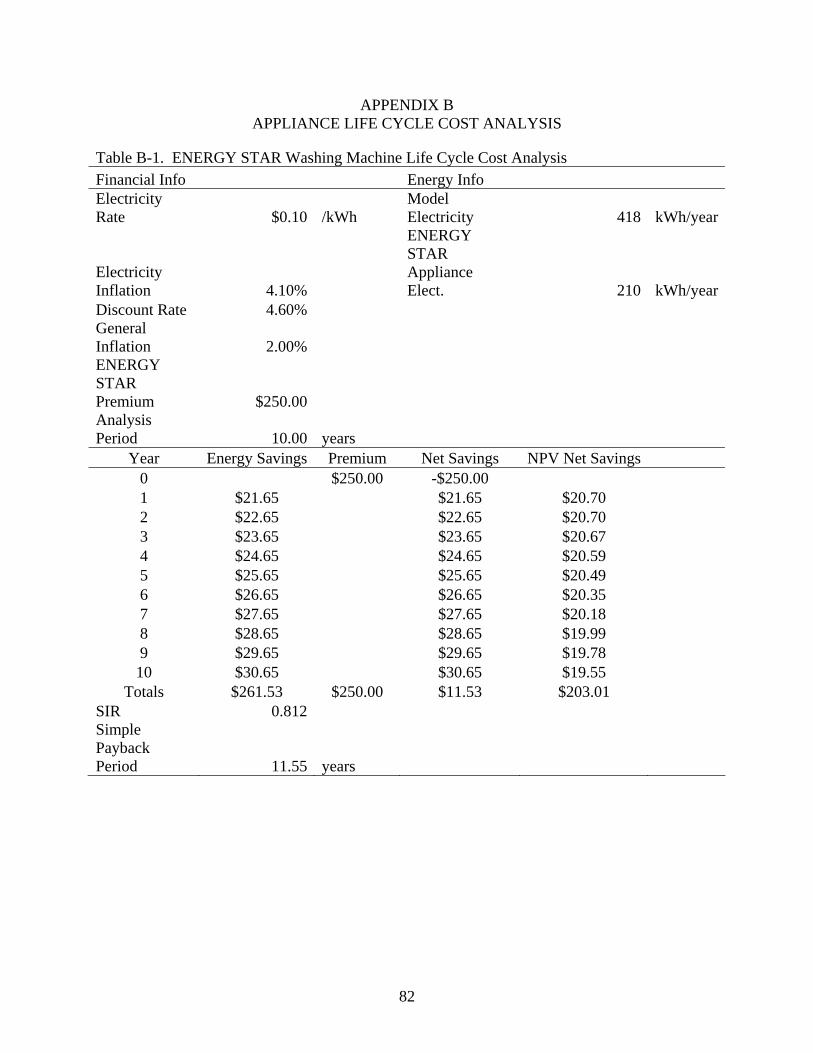
82
APPENDIX B APPLIANCE LIFE CYCLE COST ANALYSIS
Table B-1. ENERGY STAR Washing Machine Life Cycle Cost Analysis Financial Info Energy Info Electricity Rate $0.10 /kWh
Model Electricity 418 kWh/year
Electricity Inflation 4.10%
ENERGY STAR Appliance Elect. 210 kWh/year
Discount Rate 4.60% General Inflation 2.00% ENERGY STAR Premium $250.00 Analysis Period 10.00 years
Year Energy Savings Premium Net Savings NPV Net Savings 0 $250.00 -$250.00 1 $21.65 $21.65 $20.70 2 $22.65 $22.65 $20.70 3 $23.65 $23.65 $20.67 4 $24.65 $24.65 $20.59 5 $25.65 $25.65 $20.49 6 $26.65 $26.65 $20.35 7 $27.65 $27.65 $20.18 8 $28.65 $28.65 $19.99 9 $29.65 $29.65 $19.78 10 $30.65 $30.65 $19.55
Totals $261.53 $250.00 $11.53 $203.01 SIR 0.812 Simple Payback Period 11.55 years
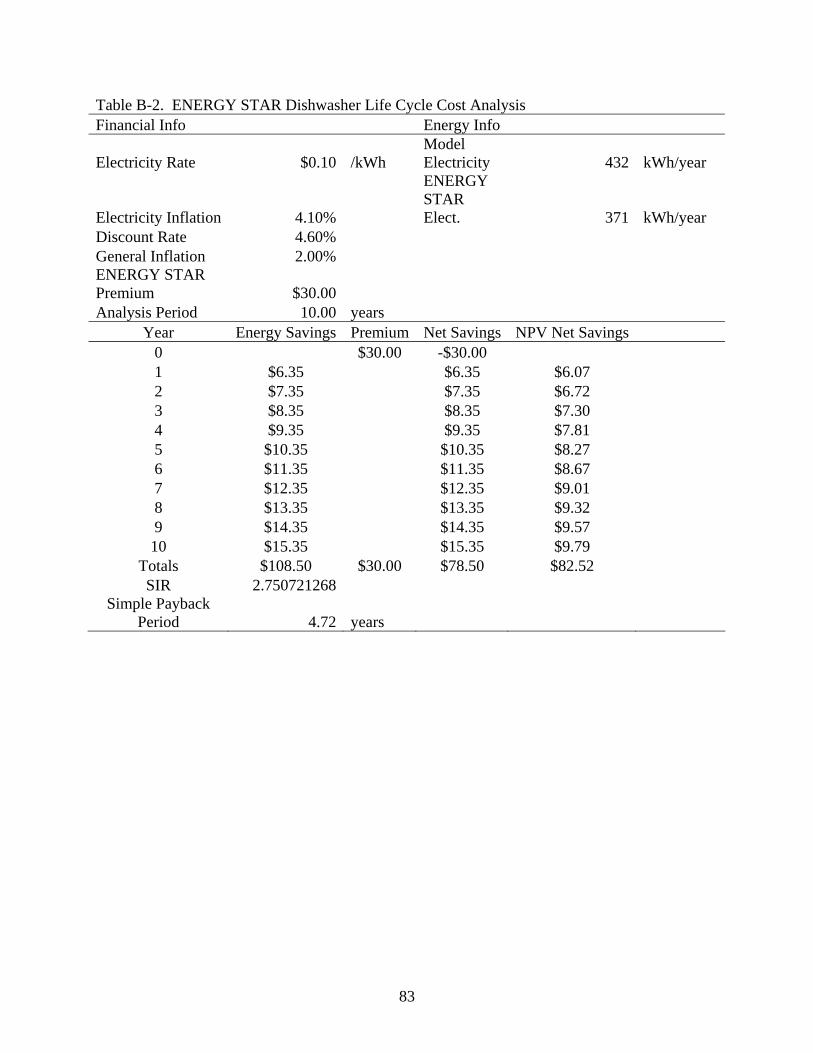
83
Table B-2. ENERGY STAR Dishwasher Life Cycle Cost Analysis Financial Info Energy Info
Electricity Rate $0.10 /kWh Model Electricity 432 kWh/year
Electricity Inflation 4.10%
ENERGY STAR Elect. 371 kWh/year
Discount Rate 4.60% General Inflation 2.00% ENERGY STAR Premium $30.00 Analysis Period 10.00 years
Year Energy Savings Premium Net Savings NPV Net Savings 0 $30.00 -$30.00 1 $6.35 $6.35 $6.07 2 $7.35 $7.35 $6.72 3 $8.35 $8.35 $7.30 4 $9.35 $9.35 $7.81 5 $10.35 $10.35 $8.27 6 $11.35 $11.35 $8.67 7 $12.35 $12.35 $9.01 8 $13.35 $13.35 $9.32 9 $14.35 $14.35 $9.57 10 $15.35 $15.35 $9.79
Totals $108.50 $30.00 $78.50 $82.52 SIR 2.750721268
Simple Payback Period 4.72 years
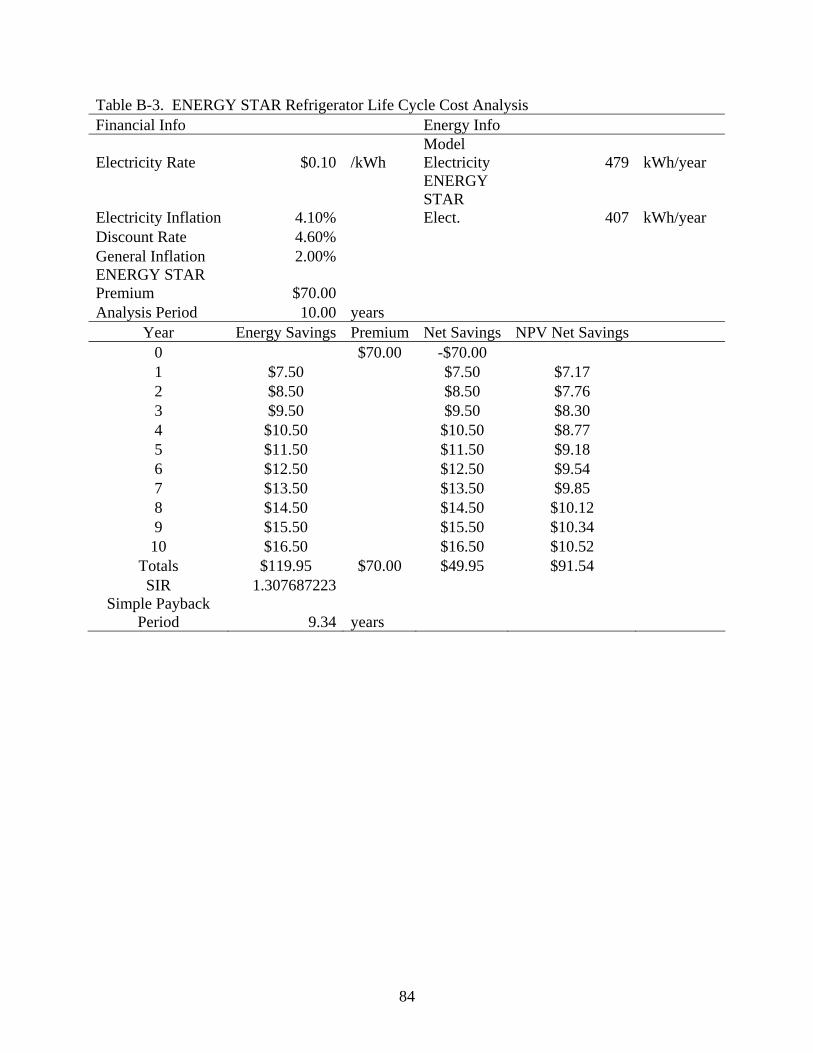
84
Table B-3. ENERGY STAR Refrigerator Life Cycle Cost Analysis Financial Info Energy Info
Electricity Rate $0.10 /kWh Model Electricity 479 kWh/year
Electricity Inflation 4.10%
ENERGY STAR Elect. 407 kWh/year
Discount Rate 4.60% General Inflation 2.00% ENERGY STAR Premium $70.00 Analysis Period 10.00 years
Year Energy Savings Premium Net Savings NPV Net Savings 0 $70.00 -$70.00 1 $7.50 $7.50 $7.17 2 $8.50 $8.50 $7.76 3 $9.50 $9.50 $8.30 4 $10.50 $10.50 $8.77 5 $11.50 $11.50 $9.18 6 $12.50 $12.50 $9.54 7 $13.50 $13.50 $9.85 8 $14.50 $14.50 $10.12 9 $15.50 $15.50 $10.34 10 $16.50 $16.50 $10.52
Totals $119.95 $70.00 $49.95 $91.54 SIR 1.307687223
Simple Payback Period 9.34 years
85
LIST OF REFERENCES
Brown, R., Rittelmann, W., Parker, D., and Homan, G. 2006. Appliances, Lighting, Electronics, and Miscellaneous Equipment Electricity Use in New Homes. Florida Solar Energy Society: FSEC-CR-1675-06. Cocoa, FL.
Energy Efficiency and Renewable Energy. 2003. Air Distribution System Design. U.S. Department of Energy: DOE/G0102002-0782. Washington, DC. Energy Efficiency and Renewable Energy. 2000. Passive Solar Design. U.S. Department of Energy: DOE/GO10099-790. Washington, DC. Energy Efficiency and Renewable Energy. 2005. Conventional Storage Water Heaters. U.S. Department of Energy. Washington, DC. Available at http://www.eere.energy.gov/consumer/your_home/water_heating/index.cfm/mytopic=12980. Accessed on February 5, 2008. Energy Efficiency and Renewable Energy. 2005. Demand (Tankless or Instantaneous) Water Heaters. U.S. Department of Energy. Washington, DC. Available at http://www.eere.energy.gov/consumer/your_home/water_heating/index.cfm/mytopic=12820. Accessed on February 5, 2008. Energy Efficiency and Renewable Energy. 2005. Determining Energy Efficiency of Storage, Demand, and Heat Pump Water Heaters. U.S. Department of Energy. Washington, DC. Available at http://www.eere.energy.gov/consumer/your_home/water_heating/index.cfm/mytopic=13000. Accessed on February 5, 2008.
Energy Efficiency and Renewable Energy. 2005. Heat Pump Water Heaters. U.S. Department of Energy. Washington, DC. Available at http://www.eere.energy.gov/consumer/your_home/water_heating/index.cfm/mytopic=12840. Accessed on February 5, 2008. Energy Efficiency and Renewable Energy. 2003. Moving Toward Zero Energy Homes. U.S. Department of Energy: DOE/GO-102003-1828. Washington, DC. Energy Efficiency and Renewable Energy. 2000. Passive Solar Design. U.S. Department of Energy: DOE/GO10099-790. Washington, DC. Energy Efficiency and Renewable Energy. 2005. Solar Radiation Basics. U.S. Department of Energy. Washington, DC. Available at http://www.eere.energy.gov/consumer/renewable_energy/solar/index.cfm/mytopic=50012. Accessed on February 5, 2008. Energy Efficiency and Renewable Energy. 2005. Solar Water Heaters. U.S. Department of Energy. Washington, DC. Available at
86
http://www.eere.energy.gov/consumer/your_home/water_heating/index.cfm/mytopic=12850. Accessed on February 5, 2008. Energy Information Administration. 2008. State Energy Profiles: Florida. U.S. Department of Energy. Washington, DC. Available at http://tonto.eia.doe.gov/state/state_energy_profiles.cfm?sid=FL. Accessed on February 5, 2008. Fairey, P.W. 1981. Concepts in Passive Design #1 Roof Overhangs. Florida Solar Energy Center: FSEC-DN-1. Cocoa, FL. Lombardi, M., Parker, D., Vieira, R., and Faiery, P. 2004. Geographic Variation in Potential of Rooftop Residential Photovoltaic Electric Power Production in the United States. American Council for an Energy Efficient Economy. Washington, DC. Available at http://www.fsec.ucf.edu/en/publications/html/FSEC-PF-380-04/. Accessed on February 5, 2008. McCluney, R., and Gueymard, C. 1993. Selecting Windows for South Florida Residences. Florida Solar Energy Society Contract Report: FSEC-CR-1691-93. Cocoa, FL. Parker, D., and Sherwin, J. 1998. Monitored Summer Peak Attic Air Temperatures in Florida Residences. Presented at The 1998 ASHRAE Annual Meeting. Toronto, Canada. Available at http://www.fsec.ucf.edu/en/publications/html/FSEC-PF-336-98/index.htm. Accessed on February 5, 2008. Parker, D. 2002. Research Highlights From A Large Scale Residential Monitoring Study In A Hot Climate. Florida Solar Energy Society: FSEC-PF-369-02. Cocoa, FL. Parker, D., and Sherwin, J. 1998. Monitored Summer Peak Attic Air Temperatures in Florida Residences. Florida Solar Energy Society. Cocoa, FL. Available at http://www.fsec.ucf.edu/en/publications/html/FSEC-PF-336-98/index.htm. Accessed on February 5, 2008. Schwartz, J. 2007. Finding the Phantoms: Eliminate Standby Energy Loss. Home Power: 117, 64. Ashland, OR. Shirey III, D., Henderson Jr., H., and Raustad, R. 2006. Understanding the Dehumidification Performance of Air-Conditioning Equipment at Part-Load Conditions. Florida Solar Energy Society: FSEC-CR-1537-05. Cocoa, FL. Toolbase Services. 2008. Seven Steps to a ZEH. NAHB Research Center. Upper Marlboro, MD. Available at http://www.toolbase.org/Home-Building-Topics/zero-energy-homes/seven-steps-zeh. Accessed on February 5, 2008.
87
U.S. Environmental Protection Agency and U.S. Department of Energy. 2008. Clothes Washers. ENERGY STAR. Washington, DC. Available at http://www.energystar.gov/index.cfm?c=cfls.pr_cfls. Accessed on February 5, 2008. U.S. Environmental Protection Agency and U.S. Department of Energy. 2008. Compact Fluorescent Light Bulbs. ENERGY STAR. Washington, DC. Available at http://www.energystar.gov/index.cfm?c=cfls.pr_cfls. Accessed on February 5, 2008. U.S. Environmental Protection Agency and U.S. Department of Energy. 2008. External Power Adapters. ENERGY STAR. Washington, DC. Available at http://www.energystar.gov/index.cfm?c=ext_power_supplies.power_supplies_consumers Accessed on February 5, 2008.

88
BIOGRAPHICAL SKETCH
Christopher S. Hudson received his high school diploma from Hollywood Hills High
School in Hollywood, Florida, in 2001. Immediately after graduating high school, he was
accepted to the University of Florida, Gainesville, in August 2001 and received his Bachelor of
Science in civil engineering in May 2006. In August 2006, Christopher started his Master of
Engineering in civil engineering focusing in construction management at the University of
Florida where he graduated in May 2008. As a graduate student he worked as a teaching
assistant for his friend Dr. Fazil Najafi. Upon graduating Christopher accepted a position with
the Los Angeles County Public Works Department in Alhambra, California.