affirmative action and application strategies: evidence
TRANSCRIPT

NO 362
Affirmative Action and Application Strategies: Evidence from Field Experiments in Columbia Ritwik Banerjee Marcela Ibanez Gerhard Riener Soham Sahoo April 2021

IMP RIN T DICE DISCUSSION PAPER Published by: Heinrich-Heine-University Düsseldorf, Düsseldorf Institute for Competition Economics (DICE), Universitätsstraße 1, 40225 Düsseldorf, Germany www.dice.hhu.de Editor: Prof. Dr. Hans-Theo Normann Düsseldorf Institute for Competition Economics (DICE) Tel +49 (0) 211-81-15125, E-Mail [email protected] All rights reserved. Düsseldorf, Germany 2021. ISSN 2190-9938 (online) / ISBN 978-3-86304-361-2 The working papers published in the series constitute work in progress circulated to stimulate discussion and critical comments. Views expressed represent exclusively the authors’ own opinions and do not necessarily reflect those of the editor.
Affirmative Action and Application Strategies:Evidence from Field Experiments in Colombia
Ritwik BanerjeeIndian Institute of Management
Bangalore, India
Marcela IbanezGeorg-August-Universitat Gottingen
Gerhard RienerHeinrich-Heine-Universitat Dusseldorf
Soham SahooIndian Institute of Management
Bangalore, India
April 2021
AbstractAffirmative action changes incentives at all stages of the employment process. In thispaper, we study the effects of affirmative action statements in job ads on i) the effortexpended on the application process and ii) the manifestation of emotions, as measuredby the textual analysis of the content of the motivation letter. To this end, we usedata from two field experiments conducted in Colombia. We find that in the Controlcondition, women spend less time in the application process relative to men. Besides,female motivation letters exhibit lower levels of emotion, as measured by valence, arousal,and dominance. However, those differences vanish in the affirmative action treatmentwhen we announced to job-seekers that half of the positions were reserved for women.In the Affirmative Action condition, the time dedicated by women significantly increasedand the motivation letters written by the female candidates showed a significant increasein the expression of positive emotions. The results indicate that affirmative action policiescan have significant encouraging effects on both effort and appeal of job applications ofwomen, thereby reducing the gender gap in these outcomes. (JEL: C91, J15, M52)
Keywords: Gender, Labor economics, Field experiment.
1. Introduction
Affirmative action (AA) is often a contested policy in the quest for morediversity within organizations. Critics argue that such policies could result inreverse discrimination and loss of efficiency (Coate and Loury, 1993; Welch,1976), which is undesirable from a deontological and economic perspective.In this paper, we revisit the question on the impact of AA by analyzing theconsequences of this policy in the provision of effort and self-presentation of job
Acknowledgments: This research has primarily been funded by the Courant Research Centerfor Poverty, Equity and Growth, University of Gottingen. We thank Priyama Majumdar forexcellent research assistance. Corresponding author for this paper: Marcela Ibanez
E-mail: [email protected] (Banerjee); [email protected] (Ibanez); [email protected](Riener); [email protected] (Sahoo)

Banerjee et. al. Affirmative Action and Applications 2
seekers in the context of a real job offer. The behaviour at the application stageitself is relevant as it determines the appeal of the applicant, the probability ofbeing employed, and influences the quality of a match.
What effect can we expect from affirmative action statements in jobadvertisements on our outcome variables? Economic theory provides diversepredictions on the impacts of affirmative action on ex-ante effort provision(Fang and Moro, 2011). For example, Coate and Loury (1993) show thataffirmative action can decrease incentives for ex-ante effort if the employers fillthe quotas by assigning the intended beneficiaries to less skilled jobs. Similarly,Franke (2012) shows that AA can cause inefficient outcomes when there isconsiderable heterogeneity in qualifications between beneficiaries and non-beneficiaries of the policy. However, affirmative action policy can have positiveeffects on ex-ante effort provision when both groups have equal opportunityto win the competition (Fain, 2009) and when affirmative action increasescompetition (Balart, 2011).
Moreover, AA can also influence self-presentation. As people build mentalmodels of decision situations and interpret cues according to long learnedpatterns (Hoff and Stiglitz, 2016), AA can influence the language used in a jobapplication context. As women perceive fair treatment and increased chancesof being employed, these cues can lead to more positive views of the job andincrease a female applicant’s confidence.
We address this question using two large field experiments with 4480 job-seekers in Colombia. Despite remarkable progress in reducing educationalgender gaps and increasing female labor force participation, women still faceworse employment prospects than men in most of the countries. According tothe 2018 data from the UNESCO Institute for Statistics and ILOSTAT, inColombia, women represented a larger share of enrolled students in secondaryand tertiary education (51.2% and and 53.9%, respectively). However, womenare 30 percent less likely to participate in the labor market, receive on average11 percent lower wages, and have a 2 percentage point higher unemploymentrate than men (Cepeda Emiliani and Baron, 2012).
Similar to Flory et al. (2015), we use an online recruitment strategy thatproceeds in two steps. First, we build a database with over four thousand job-seekers who are interested in supporting field data collection in Colombia. Atthis stage, we obtain the job-seekers’ basic socioeconomic characteristics suchas gender, residence, area of study, and the number of years of experience. Ina second step, we invite all job seekers to apply to the position by completinga longer application process. We vary the information that we give such thathalf of the job-seekers are informed that the employer is an equal opportunityemployer and that at least half of the hired assistants will be women. The rest ofthe participants receive this information only after they submit the applicationform. This randomized treatment design allows us to examine the effect ofaffirmative action, while maintaining the ex-post information content in thetwo treatments identical. We compare (i) the language the applicants used

Banerjee et. al. Affirmative Action and Applications 3
to present themselves in their motivation letters using techniques from naturallanguage processing (NLP) and (ii) the effort they spent during the applicationprocedure. Both of our outcomes of interest influence hiring decisions and hence,contribute to the differential allocation of jobs over gender.
To assess the emotional content of an applicant’s language, we apply apopular natural language processing technique—sentiment analysis—on theletters of motivation and estimate how AA affects written emotional states,particularly with respect to valence, arousal, and dominance.1 Using thismethod, we can assess how applicants self-presentation is affected by AA. Thesecond metric we use is how diligently job seekers engage with the applicationthat we proxy with minutes invested in filling out the form. Besides, we usealternative measures of effort such as the proportion of questions they answered,the proportion of pages they visited, and whether the applicant had visited thelast page of the application form or not.
Do AA statements have heterogeneous effects on women and men? Wefind that in the absence of affirmative action, women exhibit lower levelsof emotion in the statement of motivation and spend less effort in the jobapplication process compared to men. While women spent the same time asmen filling the application, they visited a lower proportion of pages, answereda lower proportion of questions, and were less likely to visit the last page inthe control condition. The AA treatment significantly increases the degree ofemotion and effort that women put into the application process relative tothe baseline, suggesting that it changes job seeker perception of the decisionsituation. Affirmative action leads to a significant reduction in the gender gapin effort and self-presentation of applicants in the application process and hasno adverse effects for male job seekers.
Our paper contributes to various strands of the literature. First, laboratory-based experiments showed that AA can help to reduce gender gaps in selectionin competitive environments, attracting relatively more skillful candidates andwithout discouraging the ones ‘penalized’ by affirmative action (Niederle et al.,2013; Balafoutas and Sutter, 2012; Beaurain and Masclet, 2016). Moreover,AA did not reduce effort or cooperativeness irrespective of whether the ruleis exogenous or endogenously selected (Dulleck et al., 2017; Calsamiglia et al.,2013; Balafoutas and Sutter, 2012; Balafoutas et al., 2016). However, thereis relatively little field evidence on the impact of affirmative action policieson sorting in the labor market. Leibbrandt and List (2018) found that AAstatements can backfire, reducing applications from the ethnic minority groupsthey intend to benefit. However, using field experiments, Ibanez and Riener(2017) demonstrated that AA (quotas or preferential treatment) is effective atclosing gender gaps in application submissions and that this was not associated
1. The partition of emotions into these three parts goes back to Mehrabian and Russell(1974) For a review of the literature on sentiment analysis based on texts, see Khan et al.(2016).

Banerjee et. al. Affirmative Action and Applications 4
with sorting out of the most qualified job seekers. We extend this line of researchto consider the effect of AA statements on the effort put into the job applicationprocess.
Second, while recent experiments studied interventions which reduce searchcosts for the unemployed (Kircher et al., 2015) or looked at changes in the searchrequirements (Arni and Schiprowski, 2019), there is very little research ongender differences in effort provided during the application process. This gendergap, distinct from the gender gap in representation arising out of selection,may have an important effect on the subsequent differences in competitiveness.Our finding shows that there are significant gender gaps in effort during thejob application process. This is important as it suggests that gender gaps inrepresentation are observed not only at the extensive but also at the intensivemargin. AA statements not only affect selection attracting more women, thewomen who choose to apply, exert more effort. The reduction in the gendergap, in the presence of affirmative actions, may go a long way in helping usunderstand the mechanisms through which such policies help increase greaterrepresentation of women in jobs.
We also contribute to the application of text analysis to economics (seereview articles by Algaba et al., 2020; Gentzkow et al., 2019a; Varian, 2014;Kumar and Jaiswal, 2020). Text analysis has been used to predict stock markets(Tetlock, 2007; Das and Chen, 2007; Chen et al., 2014; Jiang et al., 2019;Siganos et al., 2014), proxy corruption, discrimination and geopolitical risks(Groseclose and Milyo, 2005; Gentzkow et al., 2019b; Saiz and Simonsohn, 2013;Campante and Do, 2014; Stephens-Davidowitz, 2014), and predict economicactivity and employment (Baker et al., 2016; Da et al., 2015). However, littleis known about how job advertisement changes the applicants’ use of languagein their motivation letters. Textual features may contribute to success in jobapplication and evaluation. For example, Brandt and Herzberg (2020) foundcritical language, use of prepositions and short text to be positively correlatedwith success in job placement, while Abe (2009) shows that positive evaluationsof interns are linked to the use of positive language in their written samples. Weemploy sentiment analysis—a technique from the toolkit of NLP—to analyzethe content of motivation letters of job applicants and the effects of AA on thesame.
The remaining paper is organized as follows: Section 2 describes theliterature and lays out the research hypotheses. Section 3 presents the researchdesign and the main experimental treatment. Section 4 presents the key resultswhile Section 5 offers concluding remarks.
2. Experimental Design and Procedures
Our data comes from two independent field experiments conducted inColombia. In both experiments, we recruited research assistants to work on

Banerjee et. al. Affirmative Action and Applications 5
collecting data for research projects of two of the coauthors of this paper. Theexperiments were similar in content and structure, but were implemented in twodifferent years. We refer to them as Assistant 1 and Assistant 2 experiment,respectively. The recruitment strategy used in the experiments is similar toFlory et al. (2015) and, as described in detail in Ibanez and Riener (2017),comprises two main stages.
Stage 1: Recruitment of Job Seekers
To build a pool of job seekers, we announced the positions through newspapers,university employment boards, social media, and email lists. We providedgeneral information about the positions to attract a large pool of job seekersinterested in the positions. In particular, we informed that we were recruitingresearch assistants who had completed or were close to completing a bachelor’sdegree in any area of study. No previous work experience was requested. Job-seekers were asked to fill out a statement of interest form. The announcementelicited great interest and in the experiments 4480 individuals expressed interestin the position.
Stage 2: Recruitment of Job Applicants
In this stage, we gave all job seekers detailed information on the conditionsof employment, job responsibilities, salary, and duration of the contract. Inaddition, the sample of participants who were randomly allocated to theaffirmative action treatment (AA) received the information that the employerwas an equal opportunity employer and that half of the positions were reservedfor women. Job-seekers in the AA treatment saw the following statement(translated from Spanish):
The University of [. . . ] is an equal opportunity employer. To increase femaleparticipation in areas where women are up to now underrepresented, a minimumof 50% of the hired assistants will be women.
We stratified treatment assignment based on participants’ gender (maleor female), degree of study (master or not), and area of residence (Bogotaor not). To achieve ex-post equality of information, participants allocatedto the control group received information on equal opportunity policies onlyafter completing the application process. Variation of the time when job-seekers received information on the use of affirmative action policies allowsus to causally identify the impact of affirmative action statements without anydifference in the final information available in the two treatments.
In this stage, job-seekers could start filling out a lengthy applicationquestionnaire. They had access to a personalized page and could complete theapplication form over different sessions, saving the information and continuingthe application over several days. However, a strict deadline was set after whichno application was accepted.

Banerjee et. al. Affirmative Action and Applications 6
To complete the application, participants needed to obtain supportinginformation such as grade certificates or detailed information on previousemployer contact information, write a motivation letter, and perform varioustests of qualification. This demanding and time-consuming stage increased thecost of the application (time required). We interpret this time spent on theapplication as a measure of the effort that participants put in completing theapplication (preparing to compete in the selection process).
The top 10 applicants were invited for an interview. In the Assistant 1experiment, three candidates (all of them women) were employed. InAssistant 2, we hired 22 applicants, half of whom were women. Fieldexperiments that go over multiple sessions and that are not conducted at thesame time could suffer from information spillover. We tried to minimize thisby opening the position at the same time and by recording the starting timeof the applications, to control for potential timing effects.
2.1. Outcome variables
The outcome variables can be grouped into two broad categories: (i) themotivation letter and (ii) measured engagement with the application form.
Motivation letter. Applicants where requested to write a motivation letterarguing why they could be good candidates for the job. We use NaturalLanguage Processing (NLP) techniques to analyze the emotional state of theapplicant, as perceived from the contents of the motivation letter. We performsentiment analysis by using a standard library to assign scores of valence,arousal and dominance on each word and phrase found in the text of thestatement of motivation (Warriner et al., 2013). While valence gives a measureof how pleasant a word or a phrase is, arousal and dominance measure theintensity of emotion and the degree of control, respectively.
Engagement with application procedure. We have four measures of theapplicant’s engagement with the application process. We recorded the timefor which the applicants had each page of the application questionnaire open.Time invested in the application process is a good proxy of effort as the uniqueformat of the questionnaire meant that it was impossible for candidates tosimply copy the contents of their curriculum vitae on to the questionnaire.Many sections required applicants to search for detailed information and inputit separately. Besides, Calafiore and Damianov (2011) show that time spent one-learning web-platform is associated with better test scores. To assess whethersubjects reached the last page of the application questionnaire, we used anindicator variable equal to one for participants who reached the final page.This includes participants who visited the page but might have not completedthe full application. This variable also acts as a proxy for effort as participantsmight scroll through the pages to better prepare to complete the application.
We also record the proportion of questions completed. The two experimentsused slightly different versions of the application form. To account for this

Banerjee et. al. Affirmative Action and Applications 7
difference, we use as outcome variable the proportion of questions filled. Asparticipants provided more detailed information, the employers can betterassess the quality of the candidates. Moreover, more experienced candidateswould have additional information to provide. The last indicator we use isthe proportion of pages visited : Participants could complete up to 7 pagesin Assistant 1 and 5 pages in Assistant 2, this measure captures how farparticipants progressed in preparing the application.
2.2. Hypothesis
Completing a job application is costly in terms of the time spent in the process,but can be associated with a higher probability to be employed. Agents willselect the optimal level of effort to maximize the expected utility:
v = π(e)w − c(e)
In the optimum, the marginal return to effort is equal to the marginalcost of effort: ∂π
∂ew − ∂c∂e = 0. Since our sample comprises mainly students in
their last year of undergraduate education, it is reasonable to assume that themarginal cost of effort is similar across genders. However, in a discriminatorylabor market that —on average— favors male candidates, women on averageexpect a lower likelihood of being employed πf < πm and lower wages wf < wmthan male job seekers. When a non-discriminatory firm does not signal its type,we can therefore expect that women would be less likely to invest effort incompleting the application. First, the marginal return to effort is lower ∂π/∂e.Second, the marginal value of effort is lower wf < wm. We hypothesize:
Hypothesis 1. In the baseline treatment, female applicants provide lowereffort than male applicants.
If indeed women anticipate discrimination in the labor market, they may getdiscouraged and consequently, invest lower effort in the job application. Firmsthat voluntarily use AA policies signal a non-discriminatory type, increasingthe perceived chances for women of being employed compared to firms that donot signal the preference for gender equity. This can lead to an increase in theeffort that a female applicant puts in the job application, which leads to ournext hypothesis.
Hypothesis 2. The amount of effort provided by women in the job applicationprocess is higher in the presence of affirmative action.
Given role expectations under standard recruitment procedures (Hoff andStiglitz, 2016), we expect that women use less positive language in all threedimensions in their motivation letter compared to men.

Banerjee et. al. Affirmative Action and Applications 8
Hypothesis 3. Women manifest a lower set of positive affective emotions inthe motivation letter than men in a standard recruitment procedure.
Affirmative action changes the social environment as it may signal adifferent set of expectations on the appropriate level of positive emotions inlanguage of the protected group and hence increases the emotional count oftheir language. Hence, we formulate the following hypothesis:
Hypothesis 4. Women show a larger set of positive affective emotions withinthe motivation letter in the presence of an affirmative action compared to astandard recruitment procedure.
3. Results
3.1. Summary statistics of the two experiments
In the first stage, following the job announcements, we received the statement ofinterest from 4480 people (2217 and 2263 people for Assistant 1 and Assistant 2,respectively). Half of the applicants for each position were assigned to theaffirmative action treatment condition, with about 55% females in Assistant 1and 50% females in Assistant 2. In the second stage, 2144 job seekers startedthe application process. In Assistant 1, about 55% of the job applicants werefemale, while in Assistant 2, 49% were female. Our main interest in this paperis to analyze the gender differences in the effort for job application at this stage.Table A.1 in the Appendix gives a detailed account of the statistics related tothe recruitment process at each stage.
Table A.4 in the Appendix presents the treatment-wise demographiccharacteristics of the participants in each stage according to whether theystarted the application process. We separately test whether the observablecharacteristics are different between control and treatment within each stageand report the p-values in Col (5) and (6). We find no evidence that thetreatment and control are systematically different on the basis of the observablecharacteristics in either of the two treatments in stage 1. Moreover, we comparethe observable characteristics of job applicants versus job seekers (Stage 2 vs.Stage 1) and report the p-values in columns (7) and (8) for the control andtreatment groups, respectively. We find that the p-values are less than 0.05for a few observables2, suggesting that there is some evidence of selection. Toaddress this issue, the regression analysis on the intensive margin effects usesinverse probability weights following Wooldridge (2007). This method has been
2. Throughout the paper, we report two-sided tests and refer to results as (weakly/highly)significant if the two-tailed test’s p-value is smaller than 0.05 (0.10 / 0.01).

Banerjee et. al. Affirmative Action and Applications 9
widely used in the literature to account for the problem of non-random sampleselection (Elfenbein et al., 2010; Fitzgerald et al., 1998).
3.2. Treatment differences in the main outcomes of interest
In the analysis, we pool data from Assistant 1 and Assistant 2 experiments andestimate the following linear probability model:
Outcomei = α+ β1AAi + β2Femalei + β3AAi × Femalei + β4Xi + εi
where Outcomei represents the following four metric measuring effort ofthe ith individual in our set-up: duration of time spent on the application(standardized), whether the last page has been visited, the proportion ofquestions filled out, and the proportion of pages visited.3 AAi is a dummyvariable indicating whether the participant was in the treatment group andFemale takes value equal to one for female participants and zero otherwise.Our main parameters of interest are β1 and β3, which measure the effect ofAffirmative Action (AA) on male applicants and the gender gap, respectively.Additional control variables included in the vector X are a dummy variableindicating whether the observation is from Assistant 1 or 2, applicant’s age,and whether the applicant holds a master’s degree.4
First, we estimate the model considering the pool of all job seekers, i.e., allthose who expressed interest in the position following the job announcement.In this case, the outcome variables take the value zero for those who did notstart the application process.5 Thus, the estimation captures the total effect onthe extensive and intensive margin of effort provision. Second, to focus on effortprovision on the intensive margin, we estimate the model only with the pool ofjob applicants, i.e., those who participated in stage 2 of the application processwhere they would fill out an application questionnaire. Here, to address theissue of selection, if any, between stage 1 and stage 2, our estimation uses theinverse probability weighting method. Hence, the observations are weightedby inverse of the probability of occurrence in stage 2.6 Further, we follow
3. We use the mean and standard deviation of the male applicants in the control group tostandardize the outcome variable (i.e. calculate the z-score) wherever relevant.
4. As a robustness test we estimate the model separately for Assistant 1 and 2 where weinclude additional control variables specific to the experiment.
5. We present OLS estimates in the main tables as we are interested in the average marginaleffects of AA treatment by gender, for which linear models are suitable (Angrist and Pischke,2008). However, in a robustness analysis we also estimate other appropriate nonlinear modelssuch as tobit, probit, and fractional probit and present the results in the Appendix. Theresults are not sensitive to the choice of models.
6. We obtain the probability of selecting into stage 2 by taking the entire sample andestimating a probit model that includes AA, all the control variables including gender, and

Banerjee et. al. Affirmative Action and Applications 10
Young (2018) and use randomization statistical inference to test for overallexperimental significance. The reported p-values in the figures and tables arecorrected using Young’s randcmd command in Stata. In terms of the numberof hypotheses we correct for, we have of four outcomes analyzed in Table B.1,three in Table C.1 and two additional outcomes in Table D.1. We test threecoefficients (AA, Female, AA×Female) for each and this gives us a total of 27hypotheses, for which we correct the p-values.
Panel A in Figure 1 presents the estimated coefficients for the total effectsand Panel B presents the estimated coefficients for the intensive margin effects.7
Qualitatively, the results are similar irrespective of whether we focus on thetotal effort (Panel A) or effort on the intensive margin (Panel B). The resultssuggest that in the absence of AA policy, women are significantly less likely tovisit the last page, fill out a lower proportion of questions, and visit a lowerproportion of pages than males, providing support for Hypothesis 1. WhenAA is introduced, females, relative to males, increase the amount of time theyspend in filling out the application by 20.4% of a standard deviation and this issignificant at 1% level (col (2)). Likewise, the likelihood of visiting the last pageincreases by 5.8 percentage points for females compared to males due to AAtreatment. Considering the proportion of questions filled out and the proportionof pages visited by the applicants, we find that gender parity increases byabout 3.7–3.9 percentage points under AA treatment, with the estimates beingsignificant at the 5% level. This result is in line with Hypothesis 2. While thereis greater gender equality in effort provision, are the corresponding outcomesof males adversely affected by AA treatment? Other than the amount of timespent in filling out the application form, we did not find evidence that menput less effort in the AA treatment. Overall, the results from Table B.1 suggestthat AA closes the gender gap in effort provision during the application processrelative to the baseline.
We present the results separately for Assistant 1 and 2 in the Appendix inTables B.2 and B.3. We broadly find similar patterns suggesting that femalesspend significantly less effort on job application relative to males in the absenceof AA, especially in the Assistant 1 experiment. The AA treatment changes thedirection of the gender gap in favor of females in both experiments, with the
their interactions. The inverse of the predicted probabilities for each observation is used asweights while estimating the regressions to capture effort on the intensive margin. We alsoget similar results when we don’t use inverse probability weights; these results are availableon request.
7. Panel A in Table B.1 reports the estimation results for the complete sample, while PanelB present the results for the sample that began the application process. For each outcomeof interest, we present the results with and without the socioeconomic controls.

Banerjee et. al. Affirmative Action and Applications 11
effects being more precise for the Assistant 2 experiment. The point estimatesare also very similar to those obtained in Table B.1.8
As discussed in Section 2, respondents in Assistant 1 are asked to write astatement of motivation as a part of their application. We perform sentimentanalysis to assign scores of valence (pleasantness), arousal (the intensity ofemotion provoked), and dominance (the degree of control exerted) to theapplication letters. The scores are then demeaned and divided by standarddeviation to make them comparable. We then estimate Equation 3.2 using thestandardized scores as the dependent variable. Figure 2 presents the estimatedcoefficients for the total effect (Panel A) and intensive margin (Panel B), withcorrected p-values for multiple hypothesis testing.9 We report the results ofthe specification that includes demographic controls and the total numberof words in the motivation letter. The results show that in the absence ofAA, the motivation letters written by females systematically exhibited lowervalence, arousal, and dominance than the ones written by males. This isconsistent with existing literature in psychology, which finds that women adoptsignificantly more emotion regulation strategies in communication compared tomen (Nolen-Hoeksema, 2012; Tamres et al., 2002), and supports Hypothesis 3.The AA treatment decreases the gender gap in the emotional value of themotivation letter. In particular, valence increased by 7.3%, arousal increasedby 7.9%, and dominance increased by 6.3% of a standard deviation for femalescompared to males, as a response to the AA treatment. Correcting for multiplehypothesis testing, we find that at the intensive margin, the treatment effectsof AA on valence and arousal are significant at the 5% level, while that ofdominance is significant at the 10% level. Hence, the results provide support forHypothesis 4 and indicate that the statements of motivation written by femalesin the AA treatment exhibited more pleasantness and intensity of emotion.These attributes are significant predictors of how an applicant is viewed byan employer and eventually how successful the job applicant is (Abe, 2009;Brandt and Herzberg, 2020). Overall, women exhibit higher emotions in theAA treatment and this may be a result of encouragement due to the fact thatan AA policy is in place. AA has no significant effect on male applicants’sentiments in the motivation letter.
8. The fact that the point estimates are directionally consistent, quantitatively similarbut sometimes statistically insignificant indicates that the tests are possibly under-poweredwhen conducted separately for Assistant 1.
9. The estimation results are reported in Table C.1. We use three types of specifications:one that does not include any control variables, including demographic controls, andincluding the total number of words present in the statement of motivation.

Banerjee et. al. Affirmative Action and Applications 12
Figure 1. Effect of Affirmative Action treatment on application-effort in Assistant-Pooled
Note: The figure plots the treatment effects of Affirmative Action in the Assistant-Pooled data.Panel (A) plots the coefficients for the total effects (or ITT) by including those who did not fillout the application eventually. Panel (B) plots the coefficients for the intensive margin effects byexcluding those who did not apply. The regressions control for age and a dummy for masters’degree. The p-values are obtained using randomization inference (Young, 2018) and are correctedfor multiple hypotheses testing using Westfall-Young multiple-testing methods.
Figure 2. Effect of Affirmative Action treatment on sentiment in Assistant-1
Note: The figure plots the treatment effects of Affirmative Action on sentiments in the Assistant-1data. Panel (A) plots the coefficients for the total effects (or ITT) by including those who did notfill out the application eventually. Panel (B) plots the coefficients for the intensive margin effectsby excluding those who did not apply. The regressions control for age and a dummy for masters’degree. The p-values are obtained using randomization inference (Young, 2018) and are correctedfor multiple hypotheses testing using Westfall-Young multiple-testing methods.

Banerjee et. al. Affirmative Action and Applications 13
4. Discussion and Conclusion
The effort and diligence shown by applicants in the job application process areoften important signals for employers and shape their hiring decisions. However,the job advertisement itself may influence a job seeker’s motivation to engagewith the job application. We investigate how affirmative action statementswithin application procedures influence the effort put into the applicationprocess and the style of the motivation letter.
Our findings show that there is a significant gender gap in applicants’ effortand motivation in job applications. Without affirmative action, female jobseekers engage less in the application procedure than males. Besides, female jobseekers use language that is less dominant and shows lower levels of valence andarousal, which can be interpreted as having lower confidence. Hence, differencesin application could partly help to explain the gender gaps in the employmentof otherwise equivalent candidates. Affirmative action compensates for thisdifference by encouraging women to put in more effort and boosting confidenceamong women. The incentive effects for men are smaller in size and statisticallyindistinguishable from zero, indicating that the cost of affirmative action at thismargin is low. This suggests that affirmative action policies positively influencefemale engagement in the application process, leading to a more favorable self-presentation that is likely to result in better chances of being hired.
We identify directions for future research to better understand the behaviorof applicants under affirmative action. A caveat of our study is that while thefirst stage of our experiment aimed at recruiting a large pool of applicants,we cannot rule out that women might have been discouraged in the first stageitself. If that is the case, our study might underestimate the initial gender gapin effort and confidence in the application. The context of our study considersa typical middle income country, where women on average reach a highereducation level than men. In this framework, the effect of AA policies is toincrease competition among participants who otherwise have equal changes toget employed. As implied by the theoretical models of Fain (2009) and Balart(2011), our findings confirm that AA increases incentives to provide effort.Future work should assess the validity of our results in contexts where there ismore heterogeneity between beneficiaries and non-beneficiaries of AA in termsof the level of education.
One explanation of the gender difference in language use is broughtforward by Hoff and Stiglitz (2016). As subjects may interpret decisionsituations according to contextual factors, AA might lead them to perceivethe environment differently and change self-presentation. Whether this is dueto strategic considerations of the applicant or a subconscious reaction toaffirmative action statements, we can not determine and hence should besubject to further investigation. In job applications, candidates are confrontedwith different expectations of role-conforming behavior: While assertivenessoften is considered important to be successful in a job, it is seen as an asset for

Banerjee et. al. Affirmative Action and Applications 14
male applicants only (Brescoll and Uhlmann, 2008). This poses a dilemma forfemale candidates: Although job-relevant, showing increased levels of emotionat presentation may reduce the chances of obtaining a job. This channeldeserves exploration in future research, as these double standards can constitutea source of gender imbalance not only in applications, but in the job itself,posing problems for firms in managing diverse teams.

Banerjee et. al. Affirmative Action and Applications 15
References
Abe, Jo Ann A. (2009). “Words that predict outstanding performance.” Journalof Research in Personality, 43(3), 528–531.
Algaba, Andres, David Ardia, Keven Bluteau, Samuel Borms, and Kris Boudt(2020). “Econometrics meets sentiment: An overview of methodology andapplications.” Journal of Economic Surveys, 34(3), 512–547.
Angrist, Joshua D and Jorn-Steffen Pischke (2008). Mostly harmlesseconometrics: An empiricist’s companion. Princeton university press.
Arni, Patrick and Amelie Schiprowski (2019). “Job search requirements, effortprovision and labor market outcomes.” Journal of Public Economics, 169,65–88.
Baker, Scott R, Nicholas Bloom, and Steven J Davis (2016). “Measuringeconomic policy uncertainty.” The quarterly journal of economics, 131(4),1593–1636.
Balafoutas, Loukas, Brent Davis, and Matthias Sutter (2016). “Affirmativeaction or just discrimination? A study on the endogenous emergence ofquotas.” Journal of Economic Behavior & Organization. Tex.owner: gerhardtex.publisher: Elsevier tex.timestamp: 2016.08.16.
Balafoutas, Loukas and Matthias Sutter (2012). “Affirmative Action PoliciesPromote Women and Do Not Harm Efficiency in the Laboratory.” Science,335(6068), 579–582. Citation Key Alias: BalafoutasSutter2012.
Balart, Pau (2011). “Equality of opportunity and evaluation accuracyin asymmetric rank-order tournaments.” Tech. rep., University ofthe Baleares, URL http://paubalart.com/wp--content/uploads/2012/07/Eop--and--EP--in--ROT--working4.pdf.
Beaurain, Guillaume and David Masclet (2016). “Does affirmative actionreduce gender discrimination and enhance efficiency? New experimentalevidence.” European Economic Review, 90, 350–362.
Brandt, Pia Magdalena and Philipp Yorck Herzberg (2020). “Is a cover letterstill needed? Using LIWC to predict application success.” InternationalJournal of Selection and Assessment.
Brescoll, Victoria L. and Eric Luis Uhlmann (2008). “Can an Angry WomanGet Ahead?: Status Conferral, Gender, and Expression of Emotion in theWorkplace.” Psychological Science, 19(3), 268–275.
Calafiore, Pablo and Damian S. Damianov (2011). “The Effect of Time SpentOnline on Student Achievement in Online Economics and Finance Courses.”The Journal of Economic Education, 42(3), 209–223.
Calsamiglia, Caterina, Joerg Franke, and Pedro Rey Biel (2013). “The incentiveeffects of affirmative action in a real-effort tournament.” Journal of PublicEconomics, 98, 1531. Tex.owner: gerhard tex.timestamp: 2016.08.16.
Campante, Filipe R and Quoc-Anh Do (2014). “Isolated capital cities,accountability, and corruption: Evidence from US states.” AmericanEconomic Review, 104(8), 2456–81.

Banerjee et. al. Affirmative Action and Applications 16
Cepeda Emiliani, Laura and Juan D Baron (2012). “Educational segregationand the gender wage gap for recent college graduates in Colombia.” Tech.rep., IZA.
Chen, Hailiang, Prabuddha De, Yu Jeffrey Hu, and Byoung-Hyoun Hwang(2014). “Wisdom of crowds: The value of stock opinions transmitted throughsocial media.” The Review of Financial Studies, 27(5), 1367–1403.
Coate, Stephen and Glenn Loury (1993). “Antidiscrimination enforcement andthe problem of patronization.” The American Economic Review, p. 9298.
Da, Zhi, Joseph Engelberg, and Pengjie Gao (2015). “The sum of all FEARSinvestor sentiment and asset prices.” The Review of Financial Studies, 28(1),1–32.
Das, Sanjiv R and Mike Y Chen (2007). “Yahoo! for Amazon: Sentimentextraction from small talk on the web.” Management science, 53(9), 1375–1388.
Dulleck, Uwe, Yumei He, Michael P Kidd, and Juliana Silva-Goncalves (2017).“The impact of affirmative action: Evidence from a cross-country laboratoryexperiment.” Economics Letters, 155, 67–71.
Elfenbein, Daniel W, Barton H Hamilton, and Todd R Zenger (2010).“The small firm effect and the entrepreneurial spawning of scientists andengineers.” Management Science, 56(4), 659–681.
Fain, James R (2009). “Affirmative action can increase effort.” Journal of LaborResearch, 30(2), 168175.
Fang, Hanming and Andrea Moro (2011). “Theories of statistical discriminationand affirmative action: A survey.” In Handbook of social economics, vol. 1,pp. 133–200. Elsevier.
Fitzgerald, John, Peter Gottschalk, and Robert Moffitt (1998). “An Analysisof Sample Attrition in Panel Data: The Michigan Panel Study of IncomeDynamics.” Journal of Human Resources, pp. 251–299.
Flory, Jeffrey A., Andreas Leibbrandt, and John List (2015). “Do competitivework places deter female workers? A large scale natural field experiment ongender differences in job entry decisions.” Review of Economic Studies, 82(1),122155.
Franke, Jorg (2012). “Affirmative action in contest games.” European Journalof Political Economy, 28(1), 105118.
Gentzkow, Matthew, Bryan Kelly, and Matt Taddy (2019a). “Text as data.”Journal of Economic Literature, 57(3), 535–74.
Gentzkow, Matthew, Jesse M Shapiro, and Matt Taddy (2019b). “Measuringgroup differences in high-dimensional choices: method and application tocongressional speech.” Econometrica, 87(4), 1307–1340.
Groseclose, Tim and Jeffrey Milyo (2005). “A measure of media bias.” TheQuarterly Journal of Economics, 120(4), 1191–1237.
Hoff, Karla and Joseph E. Stiglitz (2016). “Striving for balance in economics:Towards a theory of the social determination of behavior.” Journal ofEconomic Behavior & Organization, 126, 25 – 57. Thriving through Balance.

Banerjee et. al. Affirmative Action and Applications 17
Ibanez, Marcela and Gerhard Riener (2017). “Sorting through AffirmativeAction: Three Field Experiments in Colombia.” Journal of Labor Economics,36(2), 437–478.
Jiang, Fuwei, Joshua Lee, Xiumin Martin, and Guofu Zhou (2019). “Managersentiment and stock returns.” Journal of Financial Economics, 132(1), 126–149.
Khan, Muhammad Taimoor, Mehr Durrani, Armughan Ali, Irum Inayat,Shehzad Khalid, and Kamran Habib Khan (2016). “Sentiment analysis andthe complex natural language.” Complex Adaptive Systems Modeling, 4(1),1–19.
Kircher, Philipp, Paul Muller, Michele Belot, et al. (2015). “Does searchingbroader improve job prospects? a field experiment.” In 2015 Meeting Papers,530, Society for Economic Dynamics.
Kumar, Akshi and Arunima Jaiswal (2020). “Systematic literature reviewof sentiment analysis on Twitter using soft computing techniques.”Concurrency and Computation: Practice and Experience, 32(1), e5107. E5107CPE-18-1167.R1.
Leibbrandt, Andreas and John A List (2018). “Do equal employmentopportunity statements backfire? Evidence from a natural field experimenton job-entry decisions.” Tech. rep., National Bureau of Economic Research.
Mehrabian, Albert and James A. Russell (1974). Approach to EnvironmentalPsychology. MIT Press, Cambridge, MA, USA.
Niederle, Muriel, Carmit Segal, and Lise Vesterlund (2013). “How costlyis diversity? Affirmative action in light of gender differences incompetitiveness.” Management Science, 59(1), 1–16.
Nolen-Hoeksema, Susan (2012). “Emotion Regulation and Psychopathology:The Role of Gender.” Annu. Rev. Clin. Psychol., 8(1), 161–187.
Saiz, Albert and Uri Simonsohn (2013). “Proxying for unobservable variableswith internet document-frequency.” Journal of the European EconomicAssociation, 11(1), 137–165.
Siganos, Antonios, Evangelos Vagenas-Nanos, and Patrick Verwijmeren (2014).“Facebook’s daily sentiment and international stock markets.” Journal ofEconomic Behavior & Organization, 107, 730–743.
Stephens-Davidowitz, Seth (2014). “The cost of racial animus on a blackcandidate: Evidence using Google search data.” Journal of Public Economics,118, 26–40.
Tamres, Lisa K., Denise Janicki, and Vicki S. Helgeson (2002). “Sex Differencesin Coping Behavior: A Meta-Analytic Review and an Examination ofRelative Coping.” Pers. Soc. Psychol. Rev., 6(1), 2–30.
Tetlock, Paul C (2007). “Giving content to investor sentiment: The role ofmedia in the stock market.” The Journal of finance, 62(3), 1139–1168.
Varian, Hal R (2014). “Big data: New tricks for econometrics.” Journal ofEconomic Perspectives, 28(2), 3–28.

Banerjee et. al. Affirmative Action and Applications 18
Warriner, Amy Beth, Victor Kuperman, and Marc Brysbaert (2013). “Normsof valence, arousal, and dominance for 13,915 English lemmas.” BehaviorResearch Methods, 45(4), 1191–1207.
Welch, Finis (1976). “Employment quotas for minorities.” Journal of PoliticalEconomy, 84(4, Part 2), S105–S141.
Wooldridge, Jeffrey M (2007). “Inverse probability weighted estimation forgeneral missing data problems.” Journal of Econometrics, 141(2), 1281–1301.
Young, Alwyn (2018). “Channeling Fisher: Randomization Tests and theStatistical Insignificance of Seemingly Significant Experimental Results.”The Quarterly Journal of Economics, 134(2), 557–598.

Banerjee et. al. Affirmative Action and Applications 19
Appendix A: Recruitment: Summary Statistics

Banerjee et. al. Affirmative Action and Applications 20
!
TableA.1.
Rec
ruit
men
tP
roce
ss
Sta
ge
Ass
ista
nt
1(A
1)
Ass
ista
nt
2(A
2)
Obse
rvati
on
%F
emale
Obse
rvati
on
%F
emale
Contr
ol
%F
emale
AA
Tre
at
%F
emale
Contr
ol
%F
emale
AA
Tre
at
%F
emale
Sta
ge
1:
Job-S
eeker
s1108
55.0
51109
55.2
855.1
61131
50.1
31132
50.2
750.2
0Sta
ge
2:
Job
Applica
nts
545
54.1
3553
55.1
554.6
4532
48.5
0533
50.2
849.3
9

Banerjee et. al. Affirmative Action and Applications 21
TableA.2.
Sum
mary
Sta
tist
ics
of
Ass
ista
nt
1
Vari
able
Definit
ion
Mean
Sta
ndard
Devia
tion
Fem
ale
=1
iffe
male
,0
ifm
ale
0.5
50.5
0A
ge
Age
inyea
rs35.6
46.4
2M
ast
er=
1if
has
mast
er’s
deg
ree,
0oth
erw
ise
0.1
00.3
0C
oca
Reg
ion
=1
ifre
cruit
edfo
rC
oca
regio
n,
0if
recr
uit
edfo
rT
obaco
regio
n0.6
70.4
7B
ogota
=1
iflo
cate
din
Bogota
,0
oth
erw
ise
0.3
60.4
8M
oti
vati
on
count
Num
ber
of
word
sin
state
men
tof
moti
vati
on
92.9
9102.3
4O
utc
om
es
Vale
nce
Sco
re|M
oti
vati
on
count>
0*
Vale
nce
score
from
state
men
tof
moti
vati
on
89.6
077.7
7V
ale
nce
Sco
re*
Vale
nce
score
from
state
men
tof
moti
vati
on,
mis
sing
valu
esre
pla
ced
by
036.3
366.2
3A
rousa
lSco
re|M
oti
vati
on
count>
0*
Aro
usa
lsc
ore
from
state
men
tof
moti
vati
on
61.6
454.2
8A
rousa
lSco
re*
Aro
usa
lsc
ore
from
state
men
tof
moti
vati
on,
mis
sing
valu
esre
pla
ced
by
024.9
945.9
4D
om
inance
Sco
re|M
oti
vati
on
count>
0*
Dom
inance
score
from
state
men
tof
moti
vati
on
90.5
078.2
9D
om
inance
Sco
re*
Dom
inance
score
from
state
men
tof
moti
vati
on,
mis
sing
valu
esre
pla
ced
by
036.7
066.7
8T
ime
Sp
ent*
Tim
esp
ent
inco
mple
ting
the
ques
tionnair
ein
stage
2(i
nhours
)87.8
2129.0
0P
rop
ort
ion
of
pages
vis
ited
Pro
port
ion
of
the
tota
lpages
com
ple
ted
inth
est
age
2ques
tionnair
e0.8
20.3
2P
rop
ort
ion
of
ques
tions
filled
Pro
port
ion
of
the
tota
lques
tions
answ
ered
inth
est
age
2ques
tionnair
e0.7
80.3
3L
ast
page
vis
ited
=1
ifvis
ited
the
last
page
of
stage
2su
rvey
,0
oth
erw
ise
0.3
60.4
8
Sam
ple
size
-st
age
12217
Sam
ple
size
-st
age
21098
Note:
Th
evari
ab
les
mark
edw
ith
*h
ave
bee
nst
an
dard
ized
by
dem
ean
ing
an
dd
ivid
ing
by
the
stan
dard
dev
iati
on
,b
efore
they
wer
eu
sed
for
an
aly
sis.

Banerjee et. al. Affirmative Action and Applications 22
TableA.3.
Sum
mary
Sta
tist
ics
of
Ass
ista
nt
2
Vari
able
Definit
ion
Mean
Sta
ndard
Devia
tion
Fem
ale
=1
iffe
male
,0
ifm
ale
0.5
00.5
0A
ge
Age
inyea
rs31.6
17.1
4M
ast
er=
1if
has
mast
er’s
deg
ree,
0oth
erw
ise
0.0
90.2
9R
elati
ve
Gra
de
Gra
de
rela
tive
tom
axim
um
mark
sin
the
most
rece
nt
educa
tional
pro
gra
m0.8
40.0
9T
ime
Pre
fere
nce
Tim
eP
refe
rence
3.2
82.0
4R
isk
Pre
fere
nce
Ris
kP
refe
rence
5.7
52.3
0C
RT
score
Sco
reon
Cognit
ive
Refl
ecti
ve
Tes
t1.3
61.1
6E
xtr
aver
sion
Big
5P
erso
nality
Tes
tSco
re:
Extr
aver
sion
6.0
31.4
9A
gre
eable
nes
sB
ig5
Per
sonality
Tes
tSco
re:
Agre
eable
nes
s4.3
91.2
9C
onsc
ienti
ousn
ess
Big
5P
erso
nality
Tes
tSco
re:C
onsc
ienti
ousn
ess
9.4
11.0
1N
euro
tici
smB
ig5
Per
sonality
Tes
tSco
re:N
euro
tici
sm4.2
91.4
8O
pen
nes
sB
ig5
Per
sonality
Tes
tSco
re:O
pen
nes
s8.3
41.5
4O
utc
om
es
Tim
eSp
ent*
Tti
me
spen
tin
com
ple
ting
the
ques
tionnair
ein
stage
2(i
nhours
)0.5
30.2
2P
rop
ort
ion
of
pages
vis
ited
Pro
port
ion
of
the
tota
lpages
com
ple
ted
inth
est
age
2ques
tionnair
e0.4
50.5
0P
rop
ort
ion
of
ques
tions
filled
Pro
port
ion
of
the
tota
lques
tions
answ
ered
inth
est
age
2ques
tionnair
e0.4
50.4
9L
ast
page
vis
ited
=1
ifvis
ited
the
last
page
of
stage
2su
rvey
,0
oth
erw
ise
0.4
40.5
0
Sam
ple
size
-st
age
12263
Sam
ple
size
-st
age
21065
Note:
Th
evari
ab
les
mark
edw
ith
*h
ave
bee
nst
an
dard
ized
by
dem
ean
ing
an
dd
ivid
ing
by
the
stan
dard
dev
iati
on
,b
efore
they
wer
eu
sed
for
an
aly
sis.

Banerjee et. al. Affirmative Action and Applications 23
TableA.4.
Bala
nce
acr
oss
trea
tmen
tsand
stages
Sta
ge
1Sta
ge
2C
om
pari
sons
(1)
(2)
(3)
(4)
(5)
(6)
(7)
(8)
Contr
ol
Tre
atm
ent
Contr
ol
Tre
atm
ent
p-v
alu
es(1
)-
(2)
p-v
alu
es(3
)-
(4)
p-v
alu
es(3
)-
(3’)
p-v
alu
es(4
)-
(4’)
Ass
ista
nt
1F
emale
0.5
50.5
50.5
40.5
50.9
20.7
30.5
40.9
4A
ge
35.5
635.7
235.4
635.3
20.5
40.7
10.6
00.0
4M
ast
er0.1
10.0
90.1
10.0
70.1
50.0
20.8
50.0
1C
oca
Reg
ion
0.6
70.6
70.6
10.6
50.9
90.1
50.0
00.2
0B
ogota
0.3
60.3
50.4
00.4
00.9
50.9
60.0
20.0
1N
1108
1109
545
553
Ass
ista
nt
2F
emale
0.5
00.5
00.4
80.5
00.9
50.5
60.3
00.9
9A
ge
31.6
931.5
331.2
130.7
70.5
90.2
50.0
40.0
0M
ast
er0.0
90.1
00.0
60.0
80.5
20.4
0.0
00.0
3R
elati
ve
Gra
de
0.8
40.8
50.8
40.8
50.3
10.2
60.8
30.2
9R
isk
Pre
fere
nce
5.7
45.7
75.6
85.7
90.8
20.4
30.3
70.7
6T
ime
Pre
fere
nce
3.2
93.2
73.2
83.3
00.7
60.8
60.7
90.6
3C
RT
score
1.3
71.3
51.4
81.4
40.5
60.5
50.0
00.0
1E
xtr
aver
sion
5.9
96.0
75.9
86.0
30.1
70.5
50.8
30.3
8A
gre
eable
nes
s4.3
84.4
04.3
34.4
60.6
90.1
0.1
80.1
5C
onsc
ienti
ousn
ess
9.4
39.3
99.3
89.4
00.4
00.8
10.1
80.8
0N
euro
tici
sm4.3
04.2
94.2
34.2
40.9
20.9
00.1
90.3
3O
pen
nes
s8.3
48.3
38.2
38.3
60.8
10.1
80.0
20.5
5Sam
ple
Siz
e1131
1132
532
533
Note:
Col
(7)
rep
ort
sth
ep
-valu
esfr
om
com
pari
ng
the
contr
ol
gro
up
inst
age
2w
ith
those
wh
ow
ere
inco
ntr
ol
gro
up
inst
age
1b
ut
not
inth
eco
ntr
ol
gro
up
inst
age
2(d
enote
dby
(3’)
).L
ikew
ise,
col
(8)
rep
ort
sth
ep
-valu
esfr
om
com
pari
ng
the
trea
tmen
tgro
up
inst
age
2w
ith
those
wh
ow
ere
inth
etr
eatm
ent
gro
up
inst
age
1bu
tn
ot
inst
age
2(d
enote
dby
(4’)
).

Banerjee et. al. Affirmative Action and Applications 24
Appendix B: Outcomes: Time and effort

Banerjee et. al. Affirmative Action and Applications 25
TableB.1.
Ass
ista
nt
Poole
d
Tim
esp
ent
(sta
ndard
ized
)L
ast
page
vis
ited
Pro
port
ion
of
ques
tions
filled
Pro
port
ion
of
pages
vis
ited
VA
RIA
BL
ES
(1)
(2)
(3)
(4)
(5)
(6)
(7)
(8)
A.
Tota
lE
ffect
AA
-0.1
12
-0.1
11
-0.0
20
-0.0
19
-0.0
17
-0.0
17
-0.0
18
-0.0
18
p-v
alu
e(0
.000)
(0.0
00)
(0.2
17)
(0.2
08)
(0.1
66)
(0.1
61)
(0.1
72)
(0.1
67)
p-v
alu
e(c
orr
ecte
d)
(0.0
03)
(0.0
05)
(0.2
73)
(0.2
61)
(0.2
16)
(0.2
08)
(0.2
18)
(0.2
15)
Fem
ale
-0.0
41
-0.0
43
-0.0
58
-0.0
59
-0.0
48
-0.0
49
-0.0
51
-0.0
52
p-v
alu
e(0
.249)
(0.2
20)
(0.0
00)
(0.0
00)
(0.0
00)
(0.0
00)
(0.0
00)
(0.0
00)
p-v
alu
e(c
orr
ecte
d)
(0.3
29)
(0.3
00)
(0.0
04)
(0.0
05)
(0.0
11)
(0.0
10)
(0.0
09)
(0.0
08)
AA
*F
emale
0.1
46
0.1
43
0.0
56
0.0
54
0.0
45
0.0
44
0.0
48
0.0
46
p-v
alu
e(0
.000)
(0.0
00)
(0.0
06)
(0.0
05)
(0.0
07)
(0.0
07)
(0.0
10)
(0.0
09)
p-v
alu
e(c
orr
ecte
d)
(0.0
09
)(0
.010)
(0.0
36)
(0.0
34)
(.0110)
(0.0
39)
(0.0
52)
(0.0
42)
Const
ant
0.0
08
0.2
48
0.3
91
0.5
03
0.4
03
0.5
24
0.4
29
0.5
55
p-v
alu
e(0
.790)
(0.0
23)
(0.0
00)
(0.0
00)
(0.0
00)
(0.0
00)
(0.0
00)
(0.0
00)
Obse
rvati
ons
4,4
08
4,4
08
4,4
08
4,4
08
4,4
08
4,4
08
4,4
08
4,4
08
R-s
quare
d0.0
02
0.0
06
0.0
09
0.0
12
0.0
04
0.0
09
0.0
04
0.0
08
B.
Inte
nsi
ve
Marg
ins
Eff
ect
AA
-0.1
84
-0.1
84
-0.0
16
-0.0
16
-0.0
11
-0.0
11
-0.0
12
-0.0
12
p-v
alu
e(0
.000)
(0.0
00)
(0.4
27)
(0.4
20)
(0.3
78)
(0.3
73)
(0.3
88)
(0.3
84)
p-v
alu
e(c
orr
ecte
d)
(0.0
08)
(0.0
08)
(0.4
67)
(0.4
57)
(0.4
22)
(0.4
18)
(0.4
14)
(0.4
15)
Fem
ale
0.0
02
0.0
02
-0.0
63
-0.0
63
-0.0
45
-0.0
45
-0.0
47
-0.0
47
p-v
alu
e(0
.972)
(0.9
75)
(0.0
00)
(0.0
00)
(0.0
00)
(0.0
00)
(0.0
00)
(0.0
00)
p-v
alu
e(c
orr
ecte
d)
(0.9
70)
(0.9
81)
(0.0
01)
(0.0
01)
(0.0
01)
(0.0
01)
(0.0
01)
(0.0
02)
AA
*F
emale
0.2
05
0.2
04
0.0
57
0.0
58
0.0
37
0.0
37
0.0
39
0.0
39
p-v
alu
e(0
.001)
(0.0
01)
(0.0
04)
(0.0
03)
(0.0
12)
(0.0
10)
(0.0
11)
(0.0
10)
p-v
alu
e(c
orr
ecte
d)
(0.0
07)
(0.0
07)
(0.0
09)
(0.0
08)
(0.0
17)
(0.0
14)
(0.0
23)
(0.0
21)
Const
ant
-0.0
06
0.0
66
0.7
64
0.7
14
0.7
88
0.7
66
0.8
39
0.8
13
p-v
alu
e(0
.850)
(0.5
59)
(0.0
00)
(0.0
00)
(0.0
00)
(0.0
00)
(0.0
00)
(0.0
00)
Obse
rvati
ons
2,1
44
2,1
44
2,1
44
2,1
44
2,1
44
2,1
44
2,1
44
2,1
44
R-s
quare
d0.0
07
0.0
07
0.0
75
0.0
76
0.0
56
0.0
56
0.0
55
0.0
55
Oth
erco
ntr
ols
No
Yes
No
Yes
No
Yes
No
Yes
Note:
OL
Sre
gre
ssio
nre
sult
sfo
rth
ep
oole
dd
ata
from
Ass
ista
nt
1an
dA
ssis
tant
2are
rep
ort
ed.
All
regre
ssio
ns
mod
els
incl
ud
ea
du
mm
yfo
rA
ssis
tant
2.
Cols
(1),
(3),
(5)
an
d(7
)re
port
the
resu
lts
wit
hou
tco
ntr
ols
,w
hile
cols
(2),
(4),
(6)
an
d(8
)re
port
the
resu
lts
wit
hco
ntr
ols
.T
he
contr
ol
vari
ab
les
incl
ud
eth
eap
plica
nt’
sage
an
dw
het
her
the
ap
pli
cant
hold
sa
mast
er’s
deg
ree.
Th
ees
tim
ate
sin
the
seco
nd
pan
el(i
nte
nsi
ve
marg
in)
are
wei
ghte
dby
inver
sep
rob
ab
ilit
yw
eights
.R
ob
ust
stan
dard
erro
rscl
ust
ered
at
the
ap
plica
nt’
sp
lace
/u
niv
ersi
tyof
ori
gin
.’p
-valu
e’p
rese
nts
the
un
corr
ecte
dp
-valu
es,w
hile
’p-v
alu
e(c
orr
ecte
d)’
pre
sents
the
p-v
alu
esco
rrec
ted
for
mu
ltip
lehyp
oth
esis
test
ing.

Banerjee et. al. Affirmative Action and Applications 26
TableB.2.
Ass
ista
nt
1
Tim
esp
ent
(sta
ndard
ized
)L
ast
page
vis
ited
Pro
port
ion
of
ques
tions
filled
Pro
port
ion
of
pages
vis
ited
Vari
able
s(1
)(2
)(3
)(4
)(5
)(6
)(7
)(8
)A
.T
ota
leff
ect
AA
-0.1
39***
-0.1
40***
0.0
06
0.0
04
-0.0
01
-0.0
02
-0.0
00
-0.0
01
(0.0
39)
(0.0
39)
(0.0
18)
(0.0
18)
(0.0
15)
(0.0
15)
(0.0
15)
(0.0
15)
Fem
ale
-0.0
05
-0.0
12
-0.0
56**
-0.0
60***
-0.0
50**
-0.0
56***
-0.0
48**
-0.0
54**
(0.0
50)
(0.0
48)
(0.0
22)
(0.0
21)
(0.0
21)
(0.0
20)
(0.0
21)
(0.0
21)
AA
*F
emale
0.1
53***
0.1
53**
0.0
34+
0.0
35+
0.0
32+
0.0
33+
0.0
29
0.0
30
(0.0
58)
(0.0
60)
(0.0
23)
(0.0
23)
(0.0
22)
(0.0
21)
(0.0
22)
(0.0
22)
Const
ant
0.0
00
0.0
37
0.3
84***
0.3
49***
0.4
00***
0.3
99***
0.4
23***
0.4
19***
(0.0
40)
(0.1
36)
(0.0
20)
(0.0
45)
(0.0
19)
(0.0
45)
(0.0
20)
(0.0
45)
Obse
rvati
ons
2,2
17
2,2
17
2,2
17
2,2
17
2,2
17
2,2
17
2,2
17
2,2
17
R-s
quare
d0.0
04
0.0
09
0.0
03
0.0
17
0.0
02
0.0
18
0.0
02
0.0
19
B.
Inte
nsi
ve
marg
ineff
ect
AA
-0.2
28***
-0.2
27***
0.0
13
0.0
11
-0.0
01
-0.0
01
0.0
02
0.0
02
(0.0
65)
(0.0
64)
(0.0
31)
(0.0
31)
(0.0
23)
(0.0
23)
(0.0
22)
(0.0
22)
Fem
ale
0.0
04
0.0
02
-0.0
93***
-0.0
93***
-0.0
79***
-0.0
79***
-0.0
72***
-0.0
72***
(0.0
75)
(0.0
74)
(0.0
34)
(0.0
32)
(0.0
27)
(0.0
26)
(0.0
26)
(0.0
25)
AA
*F
emale
0.2
40***
0.2
37**
0.0
48
0.0
50
0.0
44+
0.0
44+
0.0
35
0.0
35
(0.0
90)
(0.0
92)
(0.0
37)
(0.0
37)
(0.0
29)
(0.0
29)
(0.0
26)
(0.0
26)
Const
ant
0.0
02
0.0
21
0.7
66***
0.5
89***
0.7
97***
0.6
94***
0.8
45***
0.7
26***
(0.0
53)
(0.1
83)
(0.0
20)
(0.0
51)
(0.0
14)
(0.0
38)
(0.0
15)
(0.0
33)
Obse
rvati
ons
1,0
98
1,0
98
1,0
98
1,0
98
1,0
98
1,0
98
1,0
98
1,0
98
R-s
quare
d0.0
10
0.0
11
0.0
09
0.0
18
0.0
09
0.0
16
0.0
09
0.0
19
Oth
erco
ntr
ols
No
Yes
No
Yes
No
Yes
No
Yes
Note:
OL
Sre
gre
ssio
nre
sult
sfo
rA
ssis
tant
1.
Cols
(1),
(3),
(5)
an
d(7
)re
port
the
resu
lts
wit
hou
tco
ntr
ols
,w
hile
cols
(2),
(4),
(6)
an
d(8
)re
port
the
resu
lts
wit
hco
ntr
ols
.T
he
contr
ol
vari
ab
les
incl
ud
eage,
ad
um
my
for
mast
er’s
deg
ree,
ad
um
my
for
Bogota
an
da
du
mm
yfo
rC
oca
regio
n.
Th
ees
tim
ate
sin
the
seco
nd
pan
el(i
nte
nsi
ve
marg
in)
are
wei
ghte
dby
inver
sep
rob
ab
ilit
yw
eights
.R
ob
ust
stan
dard
erro
rscl
ust
ered
at
the
ap
plica
nt’
sp
lace
/u
niv
ersi
tyof
ori
gin
are
rep
ort
edin
pare
nth
eses
.***
p<
0.0
1,
**
p<
0.0
5,
*p<
0.1
,+
p<
0.1
5

Banerjee et. al. Affirmative Action and Applications 27
TableB.3.
Ass
ista
nt
2
Tim
esp
ent
(sta
ndard
ized
)L
ast
page
vis
ited
Pro
port
ion
of
ques
tions
filled
Pro
port
ion
of
pages
vis
ited
Vari
able
s(1
)(2
)(3
)(4
)(5
)(6
)(7
)(8
)A
.T
ota
leff
ect
AA
-0.0
87***
-0.0
79**
-0.0
43***
-0.0
37**
-0.0
32**
-0.0
26*
-0.0
34**
-0.0
28*
(0.0
32)
(0.0
34)
(0.0
16)
(0.0
17)
(0.0
14)
(0.0
14)
(0.0
16)
(0.0
16)
Fem
ale
-0.0
78**
-0.0
36
-0.0
58***
-0.0
33*
-0.0
46***
-0.0
23
-0.0
53***
-0.0
29+
(0.0
34)
(0.0
38)
(0.0
17)
(0.0
18)
(0.0
15)
(0.0
17)
(0.0
16)
(0.0
18)
AA
*F
emale
0.1
45***
0.1
20**
0.0
75***
0.0
60**
0.0
57**
0.0
42*
0.0
65***
0.0
50**
(0.0
52)
(0.0
56)
(0.0
25)
(0.0
26)
(0.0
22)
(0.0
23)
(0.0
24)
(0.0
24)
Const
ant
0.0
21
0.4
10*
0.4
79***
0.8
66***
0.4
51***
0.7
95***
0.4
79***
0.8
69***
(0.0
55)
(0.2
32)
(0.0
34)
(0.1
04)
(0.0
31)
(0.0
99)
(0.0
34)
(0.1
06)
Obse
rvati
ons
2,1
91
2,1
52
2,1
91
2,1
52
2,1
91
2,1
52
2,1
91
2,1
52
R-s
quare
d0.0
01
0.0
16
0.0
02
0.0
19
0.0
01
0.0
19
0.0
02
0.0
19
B.
Inte
nsi
ve
marg
ineff
ect
AA
-0.1
69**
-0.1
71***
-0.0
46**
-0.0
47**
-0.0
23+
-0.0
23+
-0.0
28
-0.0
28
(0.0
66)
(0.0
63)
(0.0
22)
(0.0
22)
(0.0
15)
(0.0
15)
(0.0
21)
(0.0
20)
Fem
ale
-0.0
22
-0.0
37
-0.0
29
-0.0
29
-0.0
09
-0.0
10
-0.0
19
-0.0
20
(0.0
73)
(0.0
68)
(0.0
24)
(0.0
24)
(0.0
17)
(0.0
18)
(0.0
26)
(0.0
26)
AA
*F
emale
0.2
24***
0.2
34***
0.0
66***
0.0
64***
0.0
30**
0.0
29**
0.0
44**
0.0
42**
(0.0
79)
(0.0
74)
(0.0
19)
(0.0
18)
(0.0
14)
(0.0
13)
(0.0
18)
(0.0
18)
Const
ant
0.0
13
-0.4
90
0.9
56***
1.2
44***
0.9
02***
1.1
15***
0.9
57***
1.2
48***
(0.0
30)
(0.4
25)
(0.0
14)
(0.0
70)
(0.0
10)
(0.0
53)
(0.0
13)
(0.0
58)
Obse
rvati
ons
1,0
28
1,0
28
1,0
28
1,0
28
1,0
28
1,0
28
1,0
28
1,0
28
R-s
quare
d0.0
05
0.0
23
0.0
05
0.0
19
0.0
03
0.0
19
0.0
03
0.0
18
Oth
erco
ntr
ols
No
Yes
No
Yes
No
Yes
No
Yes
Note:
OL
Sre
gre
ssio
nre
sult
sfo
rA
ssis
tant
2.
Cols
(1),
(3),
(5)
an
d(7
)re
port
the
resu
lts
wit
hou
tco
ntr
ols
,w
hile
cols
(2),
(4),
(6)
an
d(8
)re
port
the
resu
lts
wit
hco
ntr
ols
.T
he
contr
ol
vari
ab
les
incl
ud
eage,
du
mm
yfo
rm
ast
er’s
deg
ree,
rela
tive
gra
de,
risk
pre
fere
nce
,ti
me
pre
fere
nce
,C
RT
score
an
dth
eb
igfi
ve
per
son
ali
tytr
ait
s.T
he
esti
mate
sin
the
seco
nd
pan
el(i
nte
nsi
ve
marg
in)
are
wei
ghte
dby
inver
sep
rob
ab
ilit
yw
eights
.R
ob
ust
stan
dard
erro
rscl
ust
ered
at
the
ap
plica
nt’
sp
lace
/u
niv
ersi
tyof
ori
gin
are
rep
ort
edin
pare
nth
eses
.***
p<
0.0
1,
**
p<
0.0
5,
*p<
0.1
,+
p<
0.1
5

Banerjee et. al. Affirmative Action and Applications 28
Appendix C: Sentiment Analysis

Banerjee et. al. Affirmative Action and Applications 29
TableC.1.
Sen
tim
ent
Analy
sis
(Ass
ista
nt
1)
Vale
nce
score
Aro
usa
lsc
ore
Dom
inance
score
VA
RIA
BL
ES
(1)
(2)
(3)
(4)
(5)
(6)
(7)
(8)
(9)
A.
Tota
lE
ffects
AA
-0.0
48
-0.0
44
-0.0
20
-0.0
49
-0.0
45
-0.0
21
-0.0
47
-0.0
43
-0.0
19
p-v
alu
e(0
.165)
(0.1
78)
(0.2
17)
(0.1
56)
(0.1
67)
(0.2
10)
(0.1
77)
(0.1
91)
(0.2
67)
p-v
alu
e(c
orr
ecte
d)
(0.2
64)
(0.2
87)
(0.3
24)
(0.2
59)
(0.2
74)
(0.3
14)
(0.2
75)
(0.2
97)
(0.3
74)
Fem
ale
-0.1
01
-0.1
25
-0.0
39
-0.1
03
-0.1
26
-0.0
41
-0.0
99
-0.1
23
-0.0
37
p-v
alu
e(0
.017)
(0.0
01)
(0.0
31)
(0.0
14)
(0.0
01)
(0.0
22)
(0.0
17)
(0.0
01)
(0.0
61)
p-v
alu
e(c
orr
ecte
d)
(0.0
84)
(0.0
23)
(0.1
17)
(0.0
77)
(0.0
19)
(0.1
02)
(0.0
87)
(0.0
21)
(0.1
50)
AA
*F
emale
0.1
12
0.1
08
0.0
40.1
16
0.1
12
0.0
43
0.1
07
0.1
03
0.0
34
p-v
alu
e(0
.052)
(0.0
45)
(0.0
32)
(0.0
44)
(0.0
36)
(0.0
29)
(0.0
66)
(0.0
57)
(0.0
86)
p-v
alu
e(c
orr
ecte
d)
(0.1
40)
(0.1
31)
(0.1
06)
(0.1
27)
(0.1
19)
(0.1
14)
(0.1
62)
(0.1
46)
(0.1
86)
Const
ant
-0.0
00
0.2
84
-0.5
33
-0.0
00
0.2
87
-0.5
32
0.0
00
0.2
92
-0.5
26
(1.0
00)
(0.1
06)
(0.0
00)
(1.0
00)
(0.1
12)
(0.0
00)
(1.0
00)
(0.1
04)
(0.0
00)
Obse
rvati
ons
2,2
17
2,2
17
2,2
17
2,2
17
2,2
17
2,2
17
2,2
17
2,2
17
2,2
17
R-s
quare
d0.0
01
0.0
24
0.9
37
0.0
02
0.0
24
0.9
38
0.0
01
0.0
25
0.9
39
B.
Inte
nsi
ve
marg
ineff
ect
AA
-0.0
87
-0.0
78
-0.0
31
-0.0
90
-0.0
81
-0.0
33
-0.0
86
-0.0
76
-0.0
29
p-v
alu
e(0
.206)
(0.2
25)
(0.2
59)
(0.1
95)
(0.2
09)
(0.2
30)
(0.2
21)
(0.2
42)
(0.3
13)
p-v
alu
e(c
orr
ecte
d)
(0.2
92)
(0.3
09)
(0.3
49)
(0.2
84)
(0.2
96)
(0.3
19)
(0.3
09)
(0.3
23)
(0.4
00)
Fem
ale
-0.1
55
-0.1
83
-0.0
72
-0.1
58
-0.1
86
-0.0
75
-0.1
50
-0.1
78
-0.0
67
p-v
alu
e(0
.018)
(0.0
04)
(0.0
18)
(0.0
13)
(0.0
03)
(0.0
11)
(0.0
20)
-0.0
05
(0.0
44)
p-v
alu
e(c
orr
ecte
d)
(0.0
75)
(0.0
31)
(0.0
74)
(0.0
64)
(0.0
24)
(0.0
61)
(0.0
78)
(0.0
34)
(0.1
17)
AA
*F
emale
0.1
84
0.1
76
0.0
73
0.1
90
0.1
82
0.0
79
0.1
74
0.1
66
0.0
63
p-v
alu
e(0
.067)
(0.0
57)
(0.0
30)
(0.0
57)
(0.0
45)
(0.0
23)
(0.0
86)
(0.0
74)
(0.0
79)
p-v
alu
e(c
orr
ecte
d)
(0.1
44)
(0.1
34)
(0.0
85)
(0.1
34)
(0.1
20)
(0.0
80)
(0.1
72)
(0.1
62)
(0.1
57)
Const
ant
-0.0
06
0.3
81
-0.8
97
-0.0
05
0.3
89
-0.8
95
-0.0
07
0.3
95
-0.8
83
p-v
alu
e(0
.943)
(0.1
36)
(0.0
00)
(0.9
53)
(0.1
40)
(0.0
00)
(0.9
38)
(0.1
30)
(0.0
00)
Obse
rvati
ons
1,0
98
1,0
98
1,0
98
1,0
98
1,0
98
1,0
98
1,0
98
1,0
98
1,0
98
R-s
quare
d0.0
03
0.0
30
0.9
11
0.0
03
0.0
31
0.9
13
0.0
03
0.0
31
0.9
14
Oth
erco
ntr
ols
No
Yes
Yes
No
Yes
Yes
No
Yes
Yes
Sta
tem
ent
length
No
No
Yes
No
No
Yes
No
No
Yes
Note:
OL
Sre
gre
ssio
nre
sult
sof
the
senti
men
tan
aly
sis
on
the
state
men
tof
moti
vati
on
(SoM
)fr
om
Ass
ista
nt
1are
rep
ort
ed.
Cols
(1),
(4)
an
d(7
)re
port
the
resu
lts
wit
hou
tco
ntr
ols
,w
hile
cols
(2),
(5)
an
d(8
)re
port
the
resu
lts
wit
hco
ntr
ols
.T
he
contr
ol
vari
ab
les
incl
ud
eage,
ad
um
my
for
mast
er’s
deg
ree,
ad
um
my
for
Bogota
an
da
du
mm
yfo
rC
oca
regio
n.
Cols
(3),
(6)
an
d(9
)fu
rth
erin
clu
des
the
len
gth
(nu
mb
erof
word
s)of
the
SoM
.T
he
esti
mate
sin
the
seco
nd
pan
el(i
nte
nsi
ve
marg
in)
are
wei
ghte
dby
inver
sep
rob
ab
ilit
yw
eights
.R
ob
ust
stan
dard
erro
rscl
ust
ered
at
the
ap
plica
nt’
sp
lace
/u
niv
ersi
tyof
ori
gin
are
rep
ort
edin
pare
nth
eses
.’p
-valu
e’p
rese
nts
the
un
corr
ecte
dp
-valu
es,
wh
ile
’p-v
alu
e(c
orr
ecte
d)’
pre
sents
the
p-v
alu
esco
rrec
ted
for
mu
ltip
lehyp
oth
esis
test
ing.
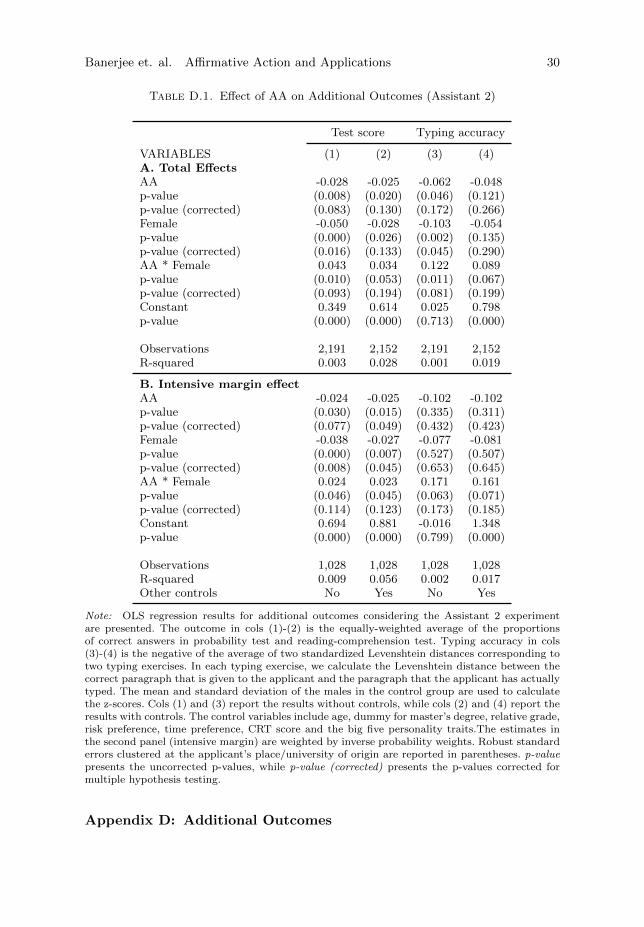
Banerjee et. al. Affirmative Action and Applications 30
Table D.1. Effect of AA on Additional Outcomes (Assistant 2)
Test score Typing accuracy
VARIABLES (1) (2) (3) (4)A. Total EffectsAA -0.028 -0.025 -0.062 -0.048p-value (0.008) (0.020) (0.046) (0.121)p-value (corrected) (0.083) (0.130) (0.172) (0.266)Female -0.050 -0.028 -0.103 -0.054p-value (0.000) (0.026) (0.002) (0.135)p-value (corrected) (0.016) (0.133) (0.045) (0.290)AA * Female 0.043 0.034 0.122 0.089p-value (0.010) (0.053) (0.011) (0.067)p-value (corrected) (0.093) (0.194) (0.081) (0.199)Constant 0.349 0.614 0.025 0.798p-value (0.000) (0.000) (0.713) (0.000)
Observations 2,191 2,152 2,191 2,152R-squared 0.003 0.028 0.001 0.019
B. Intensive margin effectAA -0.024 -0.025 -0.102 -0.102p-value (0.030) (0.015) (0.335) (0.311)p-value (corrected) (0.077) (0.049) (0.432) (0.423)Female -0.038 -0.027 -0.077 -0.081p-value (0.000) (0.007) (0.527) (0.507)p-value (corrected) (0.008) (0.045) (0.653) (0.645)AA * Female 0.024 0.023 0.171 0.161p-value (0.046) (0.045) (0.063) (0.071)p-value (corrected) (0.114) (0.123) (0.173) (0.185)Constant 0.694 0.881 -0.016 1.348p-value (0.000) (0.000) (0.799) (0.000)
Observations 1,028 1,028 1,028 1,028R-squared 0.009 0.056 0.002 0.017Other controls No Yes No Yes
Note: OLS regression results for additional outcomes considering the Assistant 2 experimentare presented. The outcome in cols (1)-(2) is the equally-weighted average of the proportionsof correct answers in probability test and reading-comprehension test. Typing accuracy in cols(3)-(4) is the negative of the average of two standardized Levenshtein distances corresponding totwo typing exercises. In each typing exercise, we calculate the Levenshtein distance between thecorrect paragraph that is given to the applicant and the paragraph that the applicant has actuallytyped. The mean and standard deviation of the males in the control group are used to calculatethe z-scores. Cols (1) and (3) report the results without controls, while cols (2) and (4) report theresults with controls. The control variables include age, dummy for master’s degree, relative grade,risk preference, time preference, CRT score and the big five personality traits.The estimates inthe second panel (intensive margin) are weighted by inverse probability weights. Robust standarderrors clustered at the applicant’s place/university of origin are reported in parentheses. p-valuepresents the uncorrected p-values, while p-value (corrected) presents the p-values corrected formultiple hypothesis testing.
Appendix D: Additional Outcomes

Banerjee et. al. Affirmative Action and Applications 31
Appendix E: Robustness check specifications

Banerjee et. al. Affirmative Action and Applications 32
TableE.1.
Ass
ista
nt
Poole
d-
Robust
nes
sA
naly
sis
wit
hA
lter
nati
ve
Model
s
Tim
esp
ent
(hours
)L
ast
page
vis
ited
Pro
port
ion
of
ques
tions
filled
Pro
port
ion
of
pages
vis
ited
To
bit
mod
elP
robi
tm
odel
Fra
ctio
na
lP
robi
tm
odel
Fra
ctio
na
lP
robi
tm
odel
Vari
able
s(1
)(2
)(3
)(4
)(5
)(6
)(7
)(8
)
AA
-10.0
04***
-9.9
72***
-0.0
50
-0.0
50
-0.0
32
-0.0
31
-0.0
34
-0.0
32
(3.3
97)
(3.5
58)
(0.0
41)
(0.0
39)
(0.0
34)
(0.0
34)
(0.0
36)
(0.0
36)
Fem
ale
-4.5
81
-4.8
19
-0.1
50***
-0.1
52***
-0.1
12***
-0.1
15***
-0.1
16***
-0.1
19***
(4.2
57)
(4.3
58)
(0.0
36)
(0.0
37)
(0.0
33)
(0.0
34)
(0.0
36)
(0.0
36)
AA
*F
emale
12.6
57**
12.2
69**
0.1
44***
0.1
41***
0.0
98**
0.0
94**
0.1
02**
0.0
98**
(5.7
62)
(6.0
85)
(0.0
50)
(0.0
49)
(0.0
46)
(0.0
45)
(0.0
51)
(0.0
49)
Const
ant
-3.6
87
26.3
15
-0.2
78***
0.0
16
-0.2
55***
0.0
58
-0.1
88***
0.1
33
(13.7
41)
(26.6
42)
(0.0
54)
(0.1
47)
(0.0
51)
(0.1
33)
(0.0
54)
(0.1
37)
Obse
rvati
ons
4,4
80
4,4
80
4,4
08
4,4
08
4,4
80
4,4
80
4,4
80
4,4
80
Oth
erco
ntr
ols
No
Yes
No
Yes
No
Yes
No
Yes
Note:
Coeffi
cien
tsfr
om
alt
ern
ati
ve
non
-lin
ear
mod
els
esti
mati
ng
tota
leff
ect
usi
ng
poole
dd
ata
from
Ass
ista
nt
1an
dA
ssis
tant
2are
rep
ort
ed.A
llre
gre
ssio
ns
mod
els
incl
ud
ea
du
mm
yfo
rA
ssis
tant
2.
Cols
(1),
(3),
(5)
an
d(7
)re
port
the
resu
lts
wit
hou
tco
ntr
ols
,w
hile
cols
(2),
(4),
(6)
an
d(8
)re
port
the
resu
lts
wit
hco
ntr
ols
.T
he
contr
ol
vari
ab
les
incl
ud
eth
eap
plica
nt’
sage
and
wh
eth
erth
eap
plica
nt
hold
sa
mast
er’s
deg
ree.
Rob
ust
stan
dard
erro
rscl
ust
ered
at
the
ap
plica
nt’
sp
lace
/u
niv
ersi
tyof
ori
gin
are
rep
ort
edin
pare
nth
eses
.***
p<
0.0
1,
**
p<
0.0
5,
*p<
0.1
,+
p<
0.1
5

Banerjee et. al. Affirmative Action and Applications 33
TableE.2.
Ass
ista
nt
1-
Robust
nes
sA
naly
sis
wit
hA
lter
nati
ve
Model
s
Tim
esp
ent
(hours
)L
ast
page
vis
ited
Pro
port
ion
of
ques
tions
filled
Pro
port
ion
of
pages
vis
ited
To
bit
mod
elP
robi
tm
odel
Fra
ctio
na
lP
robi
tm
odel
Fra
ctio
na
lP
robi
tm
odel
Vari
able
s(1
)(2
)(3
)(4
)(5
)(6
)(7
)(8
)
AA
-16.9
65***
-17.0
29***
0.0
15
0.0
12
-0.0
04
-0.0
06
-0.0
01
-0.0
03
(6.3
51)
(6.5
19)
(0.0
46)
(0.0
47)
(0.0
39)
(0.0
40)
(0.0
38)
(0.0
40)
Fem
ale
-7.8
26
-10.0
21
-0.1
50**
-0.1
65***
-0.1
33**
-0.1
49***
-0.1
24**
-0.1
41**
(9.8
59)
(9.7
22)
(0.0
60)
(0.0
59)
(0.0
56)
(0.0
55)
(0.0
56)
(0.0
55)
AA
*F
emale
21.0
17*
20.8
53*
0.0
92+
0.0
94+
0.0
86+
0.0
88+
0.0
76
0.0
78
(11.2
90)
(11.9
09)
(0.0
62)
(0.0
63)
(0.0
57)
(0.0
58)
(0.0
56)
(0.0
57)
Const
ant
-31.9
67***
171.7
08***
-0.2
96***
-0.3
90***
-0.2
54***
-0.2
54**
-0.1
93***
-0.2
04*
(8.8
14)
(3.5
48)
(0.0
54)
(0.1
21)
(0.0
48)
(0.1
20)
(0.0
51)
(0.1
17)
Obse
rvati
ons
2,2
17
2,2
17
2,2
17
2,2
17
2,2
17
2,2
17
2,2
17
2,2
17
Oth
erco
ntr
ols
No
Yes
No
Yes
No
Yes
No
Yes
Note:
Coeffi
cien
tsfr
om
alt
ern
ati
ve
non
-lin
ear
mod
els
esti
mati
ng
tota
leff
ect
usi
ng
poole
dd
ata
from
Ass
ista
nt
1are
rep
ort
ed.A
llre
gre
ssio
ns
mod
els
incl
ud
ea
du
mm
yfo
rA
ssis
tant
2.
Cols
(1),
(3),
(5)
an
d(7
)re
port
the
resu
lts
wit
hou
tco
ntr
ols
,w
hile
cols
(2),
(4),
(6)
an
d(8
)re
port
the
resu
lts
wit
hco
ntr
ols
.T
he
contr
ol
vari
ab
les
incl
ud
eage,
ad
um
my
for
mast
er’s
deg
ree,
ad
um
my
for
Bogota
an
da
du
mm
yfo
rC
oca
regio
n.
Rob
ust
stan
dard
erro
rscl
ust
ered
at
the
ap
plica
nt’
sp
lace
/u
niv
ersi
tyof
ori
gin
are
rep
ort
edin
pare
nth
eses
.***
p<
0.0
1,
**
p<
0.0
5,
*p<
0.1
,+
p<
0.1
5
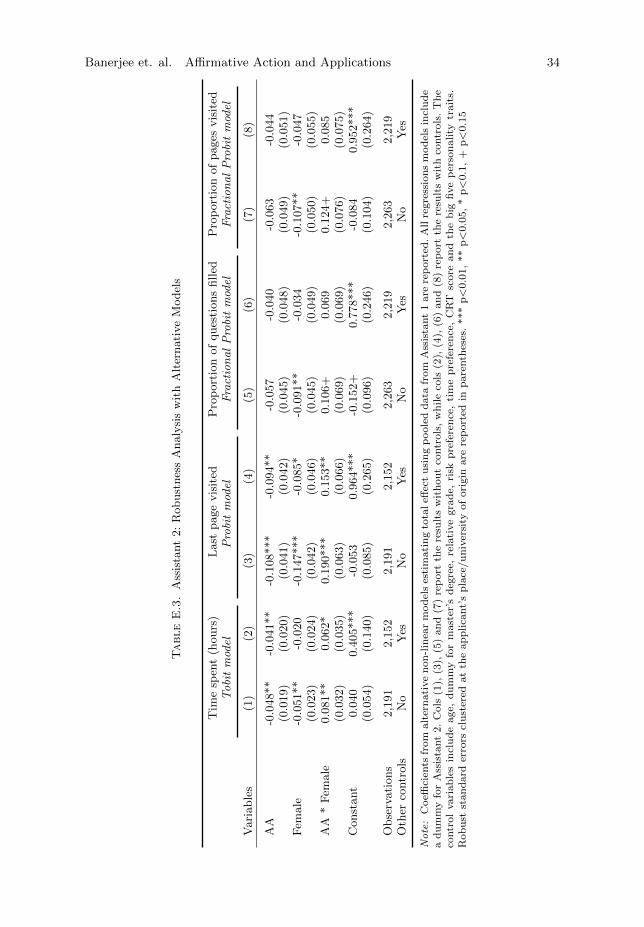
Banerjee et. al. Affirmative Action and Applications 34
TableE.3.
Ass
ista
nt
2:
Robust
nes
sA
naly
sis
wit
hA
lter
nati
ve
Model
s
Tim
esp
ent
(hours
)L
ast
page
vis
ited
Pro
port
ion
of
ques
tions
filled
Pro
port
ion
of
pages
vis
ited
To
bit
mod
elP
robi
tm
odel
Fra
ctio
na
lP
robi
tm
odel
Fra
ctio
na
lP
robi
tm
odel
Vari
able
s(1
)(2
)(3
)(4
)(5
)(6
)(7
)(8
)
AA
-0.0
48**
-0.0
41**
-0.1
08***
-0.0
94**
-0.0
57
-0.0
40
-0.0
63
-0.0
44
(0.0
19)
(0.0
20)
(0.0
41)
(0.0
42)
(0.0
45)
(0.0
48)
(0.0
49)
(0.0
51)
Fem
ale
-0.0
51**
-0.0
20
-0.1
47***
-0.0
85*
-0.0
91**
-0.0
34
-0.1
07**
-0.0
47
(0.0
23)
(0.0
24)
(0.0
42)
(0.0
46)
(0.0
45)
(0.0
49)
(0.0
50)
(0.0
55)
AA
*F
emale
0.0
81**
0.0
62*
0.1
90***
0.1
53**
0.1
06+
0.0
69
0.1
24+
0.0
85
(0.0
32)
(0.0
35)
(0.0
63)
(0.0
66)
(0.0
69)
(0.0
69)
(0.0
76)
(0.0
75)
Const
ant
0.0
40
0.4
05***
-0.0
53
0.9
64***
-0.1
52+
0.7
78***
-0.0
84
0.9
52***
(0.0
54)
(0.1
40)
(0.0
85)
(0.2
65)
(0.0
96)
(0.2
46)
(0.1
04)
(0.2
64)
Obse
rvati
ons
2,1
91
2,1
52
2,1
91
2,1
52
2,2
63
2,2
19
2,2
63
2,2
19
Oth
erco
ntr
ols
No
Yes
No
Yes
No
Yes
No
Yes
Note:
Coeffi
cien
tsfr
om
alt
ern
ati
ve
non
-lin
ear
mod
els
esti
mati
ng
tota
leff
ect
usi
ng
poole
dd
ata
from
Ass
ista
nt
1are
rep
ort
ed.A
llre
gre
ssio
ns
mod
els
incl
ud
ea
du
mm
yfo
rA
ssis
tant
2.
Cols
(1),
(3),
(5)
an
d(7
)re
port
the
resu
lts
wit
hou
tco
ntr
ols
,w
hile
cols
(2),
(4),
(6)
an
d(8
)re
port
the
resu
lts
wit
hco
ntr
ols
.T
he
contr
ol
vari
ab
les
incl
ud
eage,
du
mm
yfo
rm
ast
er’s
deg
ree,
rela
tive
gra
de,
risk
pre
fere
nce
,ti
me
pre
fere
nce
,C
RT
score
an
dth
eb
igfi
ve
per
son
ality
trait
s.R
ob
ust
stan
dard
erro
rscl
ust
ered
at
the
ap
plica
nt’
sp
lace
/u
niv
ersi
tyof
ori
gin
are
rep
ort
edin
pare
nth
eses
.***
p<
0.0
1,
**
p<
0.0
5,
*p<
0.1
,+
p<
0.1
5

Banerjee et. al. Affirmative Action and Applications 35
TableE.4.
Sen
tim
ent
Analy
sis
(Ass
ista
nt
1)
usi
ng
Tobit
Model
Vale
nce
Sco
reA
rousa
lsc
ore
Dom
inance
score
Vari
able
s(1
)(2
)(3
)(4
)(5
)(6
)(7
)(8
)(9
)
AA
-3.5
08
-3.2
93
-1.3
61
-2.5
26
-2.3
70
-1.0
51
-3.4
78
-3.2
34
-1.2
79
(4.8
32)
(4.7
62)
(1.8
02)
(3.3
52)
(3.2
92)
(1.2
92)
(4.9
02)
(4.8
14)
(1.8
97)
Fem
ale
-17.1
38**
-20.4
11***
-5.4
93***
-11.9
73**
-14.2
55***
-3.9
28***
-17.0
76**
-20.4
14***
-5.3
18***
(8.2
34)
(7.8
64)
(1.8
64)
(5.6
31)
(5.3
69)
(1.2
22)
(8.1
75)
(7.7
88)
(2.0
22)
AA
*F
emale
14.5
29*
14.2
62+
4.3
55**
10.3
08*
10.1
23*
3.3
01**
14.1
63+
13.8
73+
3.7
96*
(8.7
90)
(8.7
30)
(1.9
01)
(6.0
10)
(5.9
39)
(1.3
30)
(8.8
31)
(8.7
24)
(2.0
11)
Const
ant
-28.9
87***
130.6
35***
28.0
53***
-20.2
55***
-3.0
46
-20.3
44***
-29.1
77***
-3.6
39
-28.5
73***
(6.2
57)
(6.2
64)
(2.0
34)
(4.8
36)
(4.6
43)
(1.2
96)
(6.2
53)
(6.6
02)
(1.8
84)
Obse
rvati
ons
2,2
17
2,2
17
2,2
17
2,2
17
2,2
17
2,2
17
2,2
17
2,2
17
2,2
17
Oth
erco
ntr
ols
No
Yes
Yes
No
Yes
Yes
No
Yes
Yes
Sta
tem
ent
length
contr
ol
No
No
Yes
No
No
Yes
No
No
Yes
Note:
Coeffi
cien
tsfr
om
Tob
itm
od
els
for
the
senti
men
tan
aly
sis
on
the
state
men
tof
moti
vati
on
(SoM
)fr
om
Ass
ista
nt
1are
rep
ort
ed.
Cols
(1),
(4)
an
d(7
)re
port
the
resu
lts
wit
hou
tco
ntr
ols
,w
hile
cols
(2),
(5)
an
d(8
)re
port
the
resu
lts
wit
hco
ntr
ols
.T
he
contr
ol
vari
ab
les
incl
ud
eage,
ad
um
my
for
mast
er’s
deg
ree,
ad
um
my
for
Bogota
an
da
du
mm
yfo
rC
oca
regio
n.C
ols
(3),
(6)
an
d(9
)fu
rth
erin
clu
des
the
len
gth
(nu
mb
erof
word
s)of
the
SoM
.R
ob
ust
stan
dard
erro
rscl
ust
ered
at
the
ap
plica
nt’
sp
lace
/u
niv
ersi
tyof
ori
gin
are
rep
ort
edin
pare
nth
eses
.***
p<
0.0
1,
**
p<
0.0
5,
*p<
0.1
,+
p<
0.1
5

PREVIOUS DISCUSSION PAPERS
362 Banerjee, Ritwik, Ibanez, Marcela, Riener, Gerhard and Sahoo, Soham, Affirmative Action and Application Strategies: Evidence from Field Experiments in Columbia, April 2021.
361 Wellmann, Nicolas and Czarnowske, Daniel, What Would Households Pay for a Reduction of Automobile Traffic? Evidence From Nine German Cities, March 2021.
360 Haucap, Justus, Moshgbar, Nima and Schmal, Wolfgang Benedikt, The Impact of the German “DEAL” on Competition in the Academic Publishing Market, March 2021.
359 Korff, Alex, Competition in the Fast Lane – The Price Structure of Homogeneous Retail Gasoline Stations, January 2021.
358 Kiessling, Lukas, Chowdhury, Shyamal, Schildberg-Hörisch, Hannah and Sutter, Matthias, Parental Paternalism and Patience, January 2021.
357 Kellner, Christian, Le Quement, Mark T. and Riener, Gerhard, Reacting to Ambiguous Messages: An Experimental Analysis, December 2020.
356 Petrishcheva,Vasilisa, Riener, Gerhard and Schildberg-Hörisch, Hannah, Loss Aversion in Social Image Concerns, November 2020.
355 Garcia-Vega, Maria, Kneller, Richard and Stiebale, Joel, Labor Market Reform and Innovation: Evidence from Spain, November 2020. Published in: Research Policy, 50 (2021), 104213.
354 Steffen, Nico, Economic Preferences, Trade and Institutions, November 2020.
353 Pennerstorfer, Dieter, Schindler, Nora, Weiss, Christoph and Yontcheva, Biliana, Income Inequality and Product Variety: Empirical Evidence, October 2020.
352 Gupta, Apoorva, R&D and Firm Resilience During Bad Times, October 2020.
351 Shekhar, Shiva and Thomes, Tim Paul, Passive Backward Acquisitions and Downstream Collusion, October 2020. Forthcoming in: Economics Letters.
350 Martin, Simon, Market Transparency and Consumer Search – Evidence from the German Retail Gasoline Market, September 2020.
349 Fischer, Kai and Haucap, Justus, Betting Market Efficiency in the Presence of Unfamiliar Shocks: The Case of Ghost Games during the COVID-19 Pandemic, August 2020.
348 Bernhardt, Lea, Dewenter, Ralf and Thomas, Tobias, Watchdog or Loyal Servant? Political Media Bias in US Newscasts, August 2020.
347 Stiebale, Joel, Suedekum, Jens and Woessner, Nicole, Robots and the Rise of European Superstar Firms, July 2020.
346 Horst, Maximilian, Neyer, Ulrike and Stempel, Daniel, Asymmetric Macroeconomic Effects of QE-Induced Increases in Excess Reserves in a Monetary Union, July 2020.
345 Riener, Gerhard, Schneider, Sebastian O. and Wagner, Valentin, Addressing Validity and Generalizability Concerns in Field Experiments, July 2020.

344 Fischer, Kai and Haucap, Justus, Does Crowd Support Drive the Home Advantage in Professional Soccer? Evidence from German Ghost Games during the COVID-19 Pandemic, July 2020.
343 Gösser, Niklas and Moshgbar, Nima, Smoothing Time Fixed Effects, July 2020.
342 Breitkopf, Laura, Chowdhury, Shyamal, Priyam, Shambhavi, Schildberg-Hörisch, Hannah and Sutter, Matthias, Do Economic Preferences of Children Predict Behavior?, June 2020.
341 Westphal, Matthias, Kamhöfer, Daniel A. and Schmitz, Hendrik, Marginal College Wage Premiums under Selection into Employment, June 2020.
340 Gibbon, Alexandra J. and Schain, Jan Philip, Rising Markups, Common Ownership, and Technological Capacities, June 2020.
339 Falk, Armin, Kosse, Fabian, Schildberg-Hörisch, Hannah and Zimmermann, Florian, Self-Assessment: The Role of the Social Environment, May 2020.
338 Schildberg-Hörisch, Hannah, Trieu, Chi and Willrodt, Jana, Perceived Fairness and Consequences of Affirmative Action Policies, April 2020.
337 Avdic, Daniel, de New, Sonja C. and Kamhöfer, Daniel A., Economic Downturns and Mental Wellbeing, April 2020.
336 Dertwinkel-Kalt, Markus and Wey, Christian, Third-Degree Price Discrimination in Oligopoly When Markets Are Covered, April 2020.
335 Dertwinkel-Kalt, Markus and Köster, Mats, Attention to Online Sales: The Role of Brand Image Concerns, April 2020.
334 Fourberg, Niklas and Korff, Alex, Fiber vs. Vectoring: Limiting Technology Choices in Broadband Expansion, April 2020. Published in: Telecommunications Policy, 44 (2020), 102002.
333 Dertwinkel-Kalt, Markus, Köster, Mats and Sutter, Matthias, To Buy or Not to Buy? Price Salience in an Online Shopping Field Experiment, April 2020. Revised version published in: European Economic Review, 130 (2020), 103593.
332 Fischer, Christian, Optimal Payment Contracts in Trade Relationships, February 2020.
331 Becker, Raphael N. and Henkel, Marcel, The Role of Key Regions in Spatial Development, February 2020.
330 Rösner, Anja, Haucap, Justus and Heimeshoff, Ulrich, The Impact of Consumer Protection in the Digital Age: Evidence from the European Union, January 2020. Published in: International Journal of Industrial Organization, 73 (2020), 102585.
329 Dertwinkel-Kalt, Markus and Wey, Christian, Multi-Product Bargaining, Bundling, and Buyer Power, December 2019. Published in: Economics Letters, 188 (2020), 108936.
328 Aghelmaleki, Hedieh, Bachmann, Ronald and Stiebale, Joel, The China Shock, Employment Protection, and European Jobs, December 2019.
327 Link, Thomas, Optimal Timing of Calling In Large-Denomination Banknotes under Natural Rate Uncertainty, November 2019.

326 Heiss, Florian, Hetzenecker, Stephan and Osterhaus, Maximilian, Nonparametric Estimation of the Random Coefficients Model: An Elastic Net Approach, September 2019.
325 Horst, Maximilian and Neyer, Ulrike, The Impact of Quantitative Easing on Bank Loan Supply and Monetary Policy Implementation in the Euro Area, September 2019. Published in: Review of Economics, 70 (2019), pp. 229-265.
324 Neyer, Ulrike and Stempel, Daniel, Macroeconomic Effects of Gender Discrimination, September 2019.
323 Stiebale, Joel and Szücs, Florian, Mergers and Market Power: Evidence from Rivals’ Responses in European Markets, September 2019.
322 Henkel, Marcel, Seidel, Tobias and Suedekum, Jens, Fiscal Transfers in the Spatial Economy, September 2019.
321 Korff, Alex and Steffen, Nico, Economic Preferences and Trade Outcomes, August 2019.
320 Kohler, Wilhelm and Wrona, Jens, Trade in Tasks: Revisiting the Wage and Employment Effects of Offshoring, July 2019. Forthcoming in: Canadian Journal of Economics.
319 Cobb-Clark, Deborah A., Dahmann, Sarah C., Kamhöfer, Daniel A. and Schildberg-Hörisch, Hannah, Self-Control: Determinants, Life Outcomes and Intergenerational Implications, July 2019.
318 Jeitschko, Thomas D., Withers, John A., Dynamic Regulation Revisited: Signal Dampening, Experimentation and the Ratchet Effect, July 2019.
317 Jeitschko, Thomas D., Kim, Soo Jin and Yankelevich, Aleksandr, Zero-Rating and Vertical Content Foreclosure, July 2019. Forthcoming in: Information Economics and Policy.
316 Kamhöfer, Daniel A. und Westphal, Matthias, Fertility Effects of College Education: Evidence from the German Educational Expansion, July 2019.
315 Bodnar, Olivia, Fremerey, Melinda, Normann, Hans-Theo and Schad, Jannika, The Effects of Private Damage Claims on Cartel Stability: Experimental Evidence, June 2019.
314 Baumann, Florian and Rasch, Alexander, Injunctions Against False Advertising, October 2019 (First Version June 2019). Published in: Canadian Journal of Economics, 53 (2020), pp. 1211-1245.
313 Hunold, Matthias and Muthers, Johannes, Spatial Competition and Price Discrimination with Capacity Constraints, May 2019 (First Version June 2017 under the title “Capacity Constraints, Price Discrimination, Inefficient Competition and Subcontracting”). Published in: International Journal of Industrial Organization, 67 (2019), 102524.
312 Creane, Anthony, Jeitschko, Thomas D. and Sim, Kyoungbo, Welfare Effects of Certification under Latent Adverse Selection, March 2019.
311 Bataille, Marc, Bodnar, Olivia, Alexander Steinmetz and Thorwarth, Susanne, Screening Instruments for Monitoring Market Power – The Return on Withholding Capacity Index (RWC), March 2019. Published in: Energy Economics, 81 (2019), pp. 227-237.

310 Dertwinkel-Kalt, Markus and Köster, Mats, Salience and Skewness Preferences, March 2019. Published in: Journal of the European Economic Association, 18 (2020), pp. 2057–2107.
309 Hunold, Matthias and Schlütter, Frank, Vertical Financial Interest and Corporate Influence, February 2019.
308 Sabatino, Lorien and Sapi, Geza, Online Privacy and Market Structure: Theory and Evidence, February 2019.
307 Izhak, Olena, Extra Costs of Integrity: Pharmacy Markups and Generic Substitution in Finland, January 2019.
Older discussion papers can be found online at: http://ideas.repec.org/s/zbw/dicedp.html

www.dice.hhu.de
Heinrich-Heine-Universität Düsseldorf Düsseldorfer Institut für Wettbewerbsökonomie (DICE) Universitätsstraße 1, 40225 Düsseldorf
ISSN 2190-992X (online) ISBN 978-3-86304-361-2