afa protective systems, inc. 2015 annual … · •installation, maintenance and testing of...
TRANSCRIPT

AFA PROTECTIVE SYSTEMS, INC.
2 0 1 5 A N N UA L R E P O R T
AFA’s Central Station service consists of a detecting system installed in subscribers’
premises and frequently owned, serviced, monitored, inspected and maintained by AFA.
The vast majority of signals from subscribers’ premises are transmitted to AFA’s Central
Stations via subscribers’ telephone lines, GSM cellular networks or over the Internet. AFA presently
operates redundant UL Listed and FM Approved state-of-the-art computerized Central Stations
servicing the United States. Our Central Stations operate twenty-four hours a day, seven days
a week and monitor AFA subscriber locations, as well as locations for customers of approximately
130 Alarm Dealers who do not have their own central stations. Upon receipt of an alarm signal,
AFA personnel take the appropriate action, which may include alerting Fire or Police Departments,
verifying an alarm condition, notifying its subscribers, and dispatching AFA personnel or other
response agents to the protected premises.
Corpor ate profile
Originally founded in 1873, AFA has provided uninterrupted central station alarm service to its customers
for longer than anyone in the industry.

•Fire detection systems;
•Burglar and vandalism protection;
•Monitoring of subscriber-owned systems;
•Access control systems;
•Smoke detection;
•Installation, maintenance and testing of high-rise life safety systems;
•Sprinkler alarm supervision;
•Elevator alarm supervision;
•Closed circuit TV (CCTV) systems;
•Remote video surveillance;
•Video verification of alarm;
•Industrial process supervision, including temperature;
•Sump pump and air conditioning supervision;
•Flood detection;
•Boiler supervision;
•Remote access to and control of alarm system;
•Investigator response.
The majority of the Company’s revenues comes from the sale and installation of specialized alarm systems including sophisticated high-rise fire and life safety systems which the Company designs and installs to meet proliferating fire and life safety codes. The Company is also a provider of video surveillance systems and intrusion related services whereby customers can remotely view and control their own systems.
AFA does not manufacture detecting equipment. Technology continues to change rapidly and new equipment is so readily available that AFA can better meet subscribers’ needs by selecting quality products available from the industry’s top suppliers.
AFA’s core revenues include the recurring annual service fees paid by customers for Central Station monitoring, inspection and maintenance services.
1
the primary sCope of afa’s serviCes inCludes:

In 2015, the Company was beset with a number of obstacles resulting in its inability to meet expectations. The combination of the continued underperformance of our Southern branches, the previously reported early year loss of a substantial portion of business from our largest account, increased healthcare costs and the interim cost of transitioning to our new executive team was more than the rest of our business could offset, thereby resulting in decreased earnings for the year. Still, through it all we have seen enough positive signs to encourage our belief that we are on the right course and will see more positive results in the near future.
Net income in 2015 amounted to $538,000 or $3.32 per share as compared to $1,532,000 or $9.47 per share in 2014. Cash flow from operating activities in 2015 amounted to $5,336,000 or $32.98 per share as compared to $1,865,000 or $11.52 per share in 2014. Overall revenues fell from the prior year: $76,355,000 in 2015 as compared to $79,827,000 in 2014.
The Company’s gross rate of attrition for the year came in at 7.9%, consistent with the prior year and well below the industry norm. The aforementioned singular loss of ongoing business did however, negatively impact what would have otherwise been improvements in many meaningful categories. In particular, annual recurring revenue decreased during the year by $159,000, new sales bookings amounted to $38,491,000 and our year-end backlog was $14,398,000. While these were below last year’s results, it is important to note that the overall fall off was substantially mitigated by improvements in business with other existing and new customers.
Our National Accounts Division experienced an overall decline during the year, as a direct result of the ongoing loss from our largest account or just under 30% of its total business. However, as expected, that particular loss freed up the branch to pursue other, more profitable opportunities. Consequently, despite the significant loss, we already have seen noticeable growth from other National Accounts, both in the form of additional business from other existing accounts and the addition of totally new accounts. During the year, the Division added five new chain accounts as well as extended and expanded the scope of services for many existing accounts. In fact, by year end, for the first time ever our National Accounts Division was doing more business
with its other accounts than it was doing with its largest account. Thus, we believe the customer mix and resulting exposure is much more favorable going forward than it ever was before.
The most positive thing to report about 2015 is that all of our Northern branches performed well. The New York branch had another good year. New booked sales and profits were up slightly, and its gross attrition was limited to just 6.2%. Even more encouraging has been its start in 2016 where early on the branch has delivered exceptional sales bookings.
The New England branch continued the rebound it began last year. Although its profitability was down, its sales bookings for the year were up 60%, which is further indication of its return to being a solid contributor going forward.
Both of our New Jersey branches had good years, although slightly below expectations. The larger Northern New Jersey office increased sales bookings by 17% but experienced a few large losses that dampened its overall results. Still, it generated meaningful profits, retained most of its recurring revenue base and entered the new year with an increased backlog of work. The Southern New Jersey office experienced its best year ever with increases in sales, profitability and recurring revenues.
The Mid-Atlantic branch’s results continued to improve and achieved double-digit growth in profitability and recurring revenues.
The story was markedly different in our Southern branches. Our Georgia branch, for many years a bright spot, had a down year. Perennially a victim of low margins, the branch was for the first time unprofitable despite good sales volume and a healthy recurring revenue base. Although we recognized this trend during the year and made changes to address the problem, it was not enough to totally alter the outcome for 2015. This issue has been addressed going into 2016 by emphasizing our ongoing sales efforts in the branch to be more focused on profitability and recurring revenue.
Despite our restructuring last year, our North Carolina branch continued to disappoint and we finally decided to eliminate our commercial operation in the region. The new emphasis for the
2
AFA Protective Systems, Inc. and Subsidiaries letter to our shareholders

branch is two-fold: 1) to retain our original residential operation based in Fayetteville with the goals of maintaining our recurring revenue base, offering enhanced services and generating an operating profit, and 2) maintaining a workforce based in the Charlotte area to handle our National Accounts needs in the region. Since we have implemented these changes our losses from this area have ceased.
While the operating results at our Florida branch were below expectations, the branch generated a small profit as well as an increase in new sales bookings of 30%, leading us to believe it is on the right track going forward.
Our industry now seems to be at a crossroad. For at least a decade, it was generally thought that the residential sector was more valuable than commercial business. However, during the past year the “experts” have become more enamored with the commercial sector, where we are mostly concentrated. We believe there are three reasons for this shift. First, the residential market is even more competitive than the commercial market. Second, the residential market is more susceptible to attack from new entrants currently outside of the industry. Third, the increasing availability of “Do It Yourself” systems is perceived to be a definite threat to alarm providers in the residential market as opposed to the commercial market, where the systems are more sophisticated, more code driven, and “Do It Yourself” is not an option.
In addition, over the past nine months there has been significant merger and acquisition activity involving many of the major players in the industry. Based on past experience, in such an environment we believe the integration experience those players will face in 2016 will present new opportunities for other companies, including our Company, to take advantage of.
Nevertheless, we still have to fully resolve the ongoing matter of what has evidently now become an industry-wide issue of shrinking margins on outright sales. In recent years, I have reported that this has been a major negative influence on our earnings capabilities. Last year, we began to seriously address the issue by forcing our branches to get better pricing and be more diligent in cost control; and we did see a marginal increase in
our gross margins during the year. However, it was not enough to alter our recent perception that the outright sale business model—especially in the bid market arena—may not be the best use of our resources. Historically, the commercial alarm industry was strictly a service and lease business model. That changed during the 1970’s and 1980’s, as most major competitors felt the need to compete with non-traditional new entrants into the industry. While in the beginning there was definitely some immediate cash flow benefit to the outright sale model, we believe the proliferation of competitors in recent years, including electrical contractors, has made this segment so competitive that it has become difficult to attain acceptable margins. As a result, we have recently embarked upon and are currently examining whether, where and to what extent we should continue selling and installing pure outright sales unassociated with any recurring revenue stream.
Earlier I alluded to transition in our executive team. During 2015, we welcomed two new members, Ronald Rothman and Joseph Goren. Mr. Rothman has assumed the role of Senior Vice President of Sales and Business Development. He came to us with over 30 years of experience in the manufacturing side of the industry during which time he has been honored multiple times and is an inductee of the Security Systems & Integration Hall of Fame. Mr. Goren is our new Chief Financial Officer who fit into our organization virtually seamlessly and is already intimately involved with assisting us in making all strategic decisions.
Given all of the foregoing, forecasting the future, especially the near future, is difficult. However, based upon the measures we have taken thus far and our early sales results this year, we do believe that we should see an overall improvement in operating results during 2016.
Robert D. KleinmanChairman and Chief Executive Officer
3

December 31, 2015 2014ASSetS
Current assets Cash and cash equivalents $ 2,637,952 $ 1,256,134 Accounts receivable, net of allowance for doubtful accounts 12,260,141 16,737,561 Inventories, net 3,953,785 4,833,918 Prepaid expenses and other current assets 1,103,307 541,075 Total current assets 19,955,185 23,368,688Property, plant and equipment, net 7,026,045 7,225,051 Goodwill and intangible assets, net 5,636,273 6,198,482 Other assets 89,625 100,785 Total assets $32,707,128 $36,893,006 LiAbiLitieS And ShArehoLderS’ equityCurrent liabilities Current portion of long-term debt $ 1,289,048 $ 4,116,721 Accounts payable 3,437,920 5,034,365 Accrued expenses and other current liabilities 4,150,446 4,435,385 Deferred revenues 6,115,731 6,061,183 Total current liabilities 14,993,145 19,647,654 Long-term debt 3,756,938 3,093,605 Deferred income taxes 1,312,766 1,634,599 Pension obligation 2,252,686 2,288,843 Accrued postretirement benefits 108,896 207,556 Deferred revenues 2,114,150 2,038,634 Fair value of interest rate swaps 12,930 69,228 Total liabilities 24,551,511 28,980,119 commitmentS And contingencieSShareholders’ equity Common stock, $1 par value; 1,500,000 shares authorized; 161,768 and 161,868 shares issued and outstanding in 2015 and 2014, respectively 161,768 161,868 Additional paid-in capital 3,055,449 3,055,349 Accumulated other comprehensive loss (2,124,078) (2,152,648) Retained earnings 7,062,478 6,848,318 Total shareholders’ equity 8,155,617 7,912,887 Total liabilities and shareholders’ equity $32,707,128 $36,893,006 The accompanying notes are an integral part of these consolidated financial statements.
4
AFA Protective Systems, Inc. and Subsidiaries Consolidated BalanCe sheets

Years Ended December 31, 2015 2014Revenues Sales $45,337,695 $48,330,463 Service 31,016,879 31,496,073 76,354,574 79,826,536 Costs and expenses Cost of sales 33,897,732 35,920,819 Cost of services, exclusive of depreciation and amortization 20,623,227 20,289,753 Depreciation and amortization 2,238,354 2,356,242 Selling, general, and administrative 18,506,852 18,526,149 75,266,165 77,092,963 Income from operations 1,088,409 2,733,573 Interest and dividend income 106,049 60,132 Interest expense (175,713) (203,448) Income before provision for income taxes 1,018,745 2,590,257 Provision for income taxes 481,000 1,058,000 Net income $ 537,745 $ 1,532,257 Earnings per share $ 3.32 $ 9.47 Weighted average number of shares outstanding 161,768 161,868 Dividends per share $ 2.00 $ 2.00 Comprehensive income Net income $ 537,745 $ 1,532,257 Unrealized gain (loss) on minimum pension and postretirement liability, net of taxes 25,506 (813,182) Interest rate swap, net of taxes 3,064 (10,734) Comprehensive income $ 566,315 $ 708,341 The accompanying notes are an integral part of these consolidated financial statements.
5
AFA Protective Systems, Inc. and Subsidiaries Consolidated statements of inCome and Comprehensive inCome

Accumulated Additional Other Number of Common Paid-in Comprehensive Retained Shares Stock Capital Loss Earnings TotalBalances at December 31, 2013 161,868 $161,868 $3,055,349 $(1,328,732) $5,639,797 $7,528,282 Net income for the year — — — — 1,532,257 1,532,257 Cash dividends ($2.00 per share) — — — — (323,736) (323,736)Unrealized gain (loss) on minimum pension and postretirement liability, net — — — (813,182) — (813,182) Interest rate swap, net — — — (10,734) — (10,734) Balances at December 31, 2014 161,868 161,868 3,055,349 (2,152,648) 6,848,318 7,912,887 Net income for the year — — — — 537,745 537,745 Cash dividends ($2.00 per share) — — — — (323,585) (323,585) Purchase and retirement of common stock (100) (100) 100 — — —Unrealized gain (loss) on minimum pension and postretirement liability, net — — — 25,506 — 25,506Interest rate swap, net — — — 3,064 — 3,064 Balances at December 31, 2015 161,768 $161,768 $3,055,449 $(2,124,078) $7,062,478 $8,155,617 The accompanying notes are an integral part of these consolidated financial statements.
6
AFA Protective Systems, Inc. and Subsidiaries Consolidated statements of shareholders’ equityYears Ended December 31, 2015 and 2014

Years Ended December 31, 2015 2014Cash flows from operating activities Net income $ 537,745 $ 1,532,257 Adjustments to reconcile net income to net cash provided by operating activities Depreciation and amortization 2,238,354 2,356,242 Deferred income taxes (321,833) (675,976) Gain on interest rate swap (53,234) (87,380) Changes in operating assets and liabilities Accounts receivable 4,477,420 (1,986,506) Inventories 880,133 (353,691) Prepaid expenses and other current assets (562,232) 117,101 Other assets 351 6,944 Accounts payable (1,596,445) 890,318 Accrued expenses and other current liabilities (284,939) (325,378) Deferred revenues 130,064 (74,044) Accrued pension and postretirement benefits (109,311) 465,458 Net cash provided by operating activities 5,336,073 1,865,345 Cash flows from investing activities Capital expenditures (1,445,837) (1,460,966) Acquisitions of alarm contracts (20,495) — Net cash used in investing activities (1,466,332) (1,460,966) Cash flows from financing activities Dividends paid (323,585) (323,736) Purchase and retirement of common stock — — Proceeds from borrowings–line of credit 2,600,000 1,000,000 Proceeds from borrowings–second term loan 2,000,000 3,000,000 Repayments of line of credit (3,600,000) (3,000,000) Repayments of mortgage note (2,113,388) (308,907) Repayments of term loan (1,050,950) (1,011,388) Net cash used in financing activities (2,487,923) (644,031) Net increase (decrease) in cash and cash equivalents 1,381,818 (239,652) Cash and cash equivalents Beginning 1,256,134 1,495,786 Ending $ 2,637,952 $ 1,256,134 Supplemental disclosures of cash flow information Cash paid for: Income taxes $ 1,004,387 $ 998,915 Interest 223,620 331,070 The accompanying notes are an integral part of these consolidated financial statements.
7
AFA Protective Systems, Inc. and Subsidiaries Consolidated statements of Cash flows
1. organization and Basis of presentationDescription of the Business
AFA Protective Systems, Inc. and Subsidiaries (the “Company”) is engaged in the installation, operation, maintenance and sale of protective systems to safeguard life and property from a variety of hazards. Operations are conducted primarily in the eastern United States.
Basis of PresentationThe financial statements include the accounts of AFA Protective
Systems, Inc. and its subsidiaries, all of which are wholly owned. All intercompany balances and transactions have been eliminated in consolidation.
2. summary of signifiCant aCCounting poliCiesUse of Estimates
The preparation of financial statements in conformity with accounting principles generally accepted in the United States of America requires management to make estimates and assumptions that affect the reported amounts of assets, liabilities, and disclosure of contingent assets and liabilities at the date of the financial statements, and the reported amounts of revenue and expenses during the reporting period. Actual results could differ from those estimates. Significant estimates include accounting for long-term contracts, the allowance for doubtful accounts, inventory obsolescence, depreciation and amortization, pension and postretirement benefits and income taxes.
Cash and Cash EquivalentsCash and cash equivalents include short-term investments with
original maturities of 90 days or less. At December 31, 2015 and 2014, cash and cash equivalents included money market funds of $86,839 and $91,043, respectively. Cash and cash equivalents held at financial institutions may at times exceed federally insured amounts. The Company believes it mitigates its risks by investing in or through major financial institutions.
Accounts ReceivableAccounts receivable are carried at original invoice amount less
an estimate made for doubtful receivables based on a review of all outstanding amounts on a regular basis. Management determines the allowance for doubtful accounts by regularly evaluating individual customer receivables and considering a customer’s financial condition, credit history and current economic conditions. Accounts receivable are written off when deemed uncollectible. Recoveries of accounts receivable previously written off are recorded when received.
InventoriesInventories consist of finished goods, work in progress and parts
which are carried at the lower of cost (on a first-in, first-out basis) or market. Inventory reserves, which are charged to cost of sales are established for slow moving, excess and obsolete stock on hand and are re-evaluated periodically to give effect to sales results and changing market conditions.
Property, Plant and EquipmentProperty, plant and equipment are recorded at their historical
cost and depreciated over their estimated useful lives, which range from 3 to 30 years. Maintenance and repairs are charges to expense as incurred; renewals and improvements that extend the life of the asset are capitalized. Upon retirement or sale, the asset cost and related accumulated depreciation are eliminated from the respective accounts and the resulting gains or loss, if any, is included in the results of operations for the year. Leasehold improvements are amortized over the shorter of the lease term or remaining useful life of the related assets.
Central station equipment, equipment in subscribers’ premises and other equipment are depreciated primarily by accelerated methods. The straight-line method is used for buildings and leasehold improvements. For income tax purposes, installation costs are deducted as incurred and accelerated methods and rates are used for all other assets.
Impairment of Long-Lived AssetsLong-lived assets are reviewed for impairment whenever events
or changes in business circumstances indicate the carrying value of the assets may not be recoverable. In reviewing for impairment, the Company compares the carrying value of the assets to the estimated undiscounted future cash flows expected from the use of the assets and their eventual disposition. When the estimated undiscounted future cash flows are less than their carrying amount, an impairment loss is recognized equal to the difference between the assets’ fair value and its carrying amount. The Company believes the future cash flows to be received from its long-lived assets exceed the assets’ carrying value, and accordingly, the Company has not recognized any impairment losses for the years ended December 31, 2015 and 2014.
Goodwill and Intangible AssetsThe Company follows the provisions of Accounting Standards
Codification (“ASC”) 350 “Goodwill and Other Intangible Assets.” Goodwill reflects the cost of an acquisition in excess of the fair values assigned to identifiable net assets acquired. Goodwill and indefinite lived intangible assets are not amortized but instead are reviewed annually for impairment or more frequently if impairment indicators arise. The Company tests for impairment whenever events or changes in circumstances indicate that the carrying amount of goodwill or other intangible assets may not be recoverable or at least annually at December 31 of each year. In the event that the Company determines that the value of goodwill or
8
AFA Protective Systems, Inc. and Subsidiaries notes to Consolidated finanCial statements
other intangible assets have become impaired, the Company will incur a charge for the amount of the impairment during the fiscal period in which the determination is made. The Company completed its review and determined there was no impairment during the years ended December 31, 2015 and 2014. Identifiable intangible assets represent primarily alarm contracts arising from acquisitions and are amortized on a straight-line basis over their estimated useful lives.
Fair Value of Financial InstrumentsIn assessing the fair value of financial instruments at December 31,
2015 and 2014, the Company has used a variety of methods and assumptions, which were based on estimates of market conditions and risks existing at the time. The fair value of financial instruments, including cash and cash equivalents, accounts receivable, accounts payable and accrued expenses, approximate their carrying value because of the current nature of these instruments. The carrying value of the Company’s long-term borrowings at December 31, 2015 and 2014 approximate fair value as interest rates approximate current market rates based on their variable nature. The Company believes its mortgage interest rate reflects current market rates. The Company’s interest rate swaps have been measured at fair value under the same principles.
Derivative Financial InstrumentsThe Company accounts for derivative instruments in accordance
with ASC 815 “Derivatives and Hedging.” ASC 815 requires that the Company recognize all derivatives as assets or liabilities and measure those instruments at fair value. The Company uses derivatives primarily for the purpose of hedging exposure to changes in interest rates. The Company recognized a gain on an interest rate swap that does not qualify for hedge accounting of $51,194 and $94,680 for the years ended December 31, 2015 and December 31, 2014, respectively. The fair value of the swap was ($51,194) at December 31, 2014 and was recorded based on current market rates at that time. The swap expired during July 2015.
On February 5, 2014, the Company entered into an interest rate swap that qualifies for hedge accounting. The fair value of the swap liability is $11,850 and $18,034 at December 31, 2015 and 2014, respectively.
On October 29, 2015, the Company entered into a second interest rate swap that qualifies for hedge accounting. The fair value of the swap liability is $1,080 at December 31, 2015.
Comprehensive IncomeASC 220 “Comprehensive Income,” establishes rules for
the reporting and display of comprehensive income and its components in the consolidated financial statements. Comprehensive income consists of net income, unrealized gains or losses on minimum pension and postretirement liability, and the fair value of its interest rate swaps related to its term loans, net of income taxes.
Revenue RecognitionService charges to alarm system subscribers, for services to be
rendered over a maximum period of one year, are deferred and taken into income as earned over the service period. Advance service billings on new subscribers are also deferred and reflected in income over a five-year period, the term of most contracts. For income tax purposes, the Company reports advance billings as income in the year billed. Selling expenses in connection with obtaining new subscribers are charged to income from operations as incurred.
The percentage-of-completion method is used for the recognition of revenue from sales of security systems under long-term contracts in accordance with ASC 605-35 “Revenue Recognition—Construction Type and Production Type Contracts,” and is based on the ratio of costs incurred to date on the contract to total estimated contract costs, after providing currently for all known or anticipated losses. Due to uncertainties inherent in the estimation process, it is possible that completion costs will be revised in the near term. Such revisions to costs and income are recognized in the period in which the revisions are determined.
Advertising CostsCosts for advertising are expensed when incurred. Advertising
expense was approximately $300,637 and $318,489 for the years ended December 31, 2015 and 2014, respectively.
Earnings per ShareEarnings per share is computed by dividing net income
by the weighted average number of shares outstanding during the reporting period. The Company has no additional dilutive securities.
Income TaxesDeferred income taxes are provided for the tax effects of
differences between the financial reporting and tax bases of the Company’s assets and liabilities at the enacted tax rates in effect for the years in which the differences are expected to reverse. The Company evaluates the recoverability of deferred tax assets and establishes a valuation allowance when it is more likely than not that some portion or all of the deferred tax assets will not be realized.
The Company recognizes tax liabilities when, despite the Company’s belief that its tax return positions are supportable, the Company believes that certain positions may not be fully sustained upon review by tax authorities. Benefits from tax positions are measured at the largest amount of benefit that is greater than 50 percent likely of being realized upon settlement. To the extent that the final tax outcome of these matters is different than the amounts recorded, such differences impact income tax expense in the period in which such determination is made. Interest and penalties, if any, related to accrued liabilities for tax positions are included in interest expense.
9

Concentration of Credit RiskFinancial instruments, which potentially subject the Company
to concentrations of credit risk, are primarily trade accounts receivable. Customers in the commercial real estate industry, principally commercial building properties, account for a substantial portion of trade receivables. Credit risk with respect to trade receivables is generally minimized due to the large corporations and other organizations the Company services. Accounts receivable due from a major customer amounted to approximately $1,054,119 and $3,958,746 at December 31, 2015 and 2014, respectively. Billings to this customer amounted to $8,087,369 and $14,518,383 for the years ended December 31, 2015 and 2014, respectively.
Subsequent EventsThe Company evaluated all events or transactions that occurred
after the balance sheet date of December 31, 2015 through April 13, 2016, the date it issued these consolidated financial statements. Any subsequent events that required recognition or disclosure have been reflected in these consolidated financial statements.
3. aCCounts reCeivaBleAccounts receivable consists of the following:
December 31, 2015 2014Trade receivables, including progress bills and amounts due on completed contracts $11,047,081 $14,661,026 Costs and estimated earnings in excess of billings on uncompleted contracts 1,363,060 2,226,535 12,410,141 16,887,561 Less: Allowance for doubtful accounts (150,000) (150,000) $12,260,141 $16,737,561
Cost and estimated earnings on uncompleted contracts and related amounts billed were as follows:
December 31, 2015 2014Costs incurred on uncompleted contracts $ 4,064,118 $ 6,259,828 Estimated earnings 1,249,558 1,769,809 5,313,676 8,029,637 Less: Billings to date (4,180,091) (6,298,825) 1,133,585 1,730,812Costs and estimated earnings in excess of billings (included in accounts receivable) (1,363,060) (2,226,535)Billings in excess of costs (included in accrued expenses and other current liabilities) $ (229,475) (495,723)
Costs and estimated earnings in excess of billings on uncompleted contracts arise in the consolidated balance sheets when revenues have been recognized but the amounts cannot be billed under the terms of the contracts. Such amounts are recoverable from customers based upon various measures of performance, including achievement of certain milestones or completion of the contract. Substantially all amounts recorded as costs and estimated earnings in excess of billings on uncompleted contracts at December 31, 2015, are expected to be billed and collected within one year.
4. property, plant and equipment, netProperty, plant and equipment, net consists of the following:
Estimated December 31, Lives 2015 2014Land $ 242,000 $ 242,000 Buildings 30 4,679,235 4,679,235 Equipment in subscribers’ premises 10-25 11,905,801 12,246,527 Central station and other equipment 3-10 3,652,029 3,889,046 Installations in progress * 481,205 431,125 20,960,270 21,487,933 Less: Accumulated depreciation (13,934,225) (14,262,882) $ 7,026,045 $ 7,225,051
* Depreciation expense commences once equipment is fully installed and operational.
Depreciation expense was $1,644,843 and $1,755,082 for the years ended December 31, 2015 and 2014, respectively.
10
AFA Protective Systems, Inc. and Subsidiaries notes to Consolidated finanCial statements (continued)
$

5. goodwill and intangiBle assets, netGoodwill and intangible assets, net consists of the
following:
Estimated December 31, Lives 2015 2014Goodwill — $ 441,301 $ 441,301 Alarm contracts and contract intangibles 4-15 years 7,005,035 6,984,540 Non compete and other agreements 5 years 86,845 86,845 Gross goodwill and intangibles 7,533,181 7,512,686Less: Accumulated amortization (1,896,908) (1,314,204) Goodwill and intangible assets, net $ 5,636,273 $ 6,198,482
Amortization of intangible assets was $582,704 and $582,904 during the years ended December 31, 2015 and 2014, respectively. Future estimated amortization expense is as follows as of December 31, 2015:
Years ending December 31,2016 $ 581,576 2017 571,275 2018 563,778 2019 563,6882020 441,323 Thereafter 2,473,332 $ 5,194,972
6. other assetsOther assets consist of the following:
December 31, 2015 2014Debt issue costs, net $ — $ 10,807 Other 89,625 89,978 $89,625 $100,785
7. aCCrued expenses and other Current liaBilitiesAccrued expenses and other current liabilities consist of
the following:
December 31, 2015 2014Salaries, wages and vacation $2,767,811 $2,403,873 Employee benefit plan contribution — 134,586 Current portion of liability for postretirement benefits 16,700 23,800 Income taxes payable 853 132,265Billings in excess of costs 229,475 495,723Healthcare costs payable 525,000 500,000 Other 610,607 745,138 $4,150,446 $4,435,385
8. long-term deBtLong-term debt consists of the following:
December 31, 2015 2014Line of credit $ — $ 1,000,000Term loan 3,093,605 4,096,938 Second term loan 1,952,381 — Mortgage note — 2,113,388 5,045,986 7,210,326 Less: Current portion (1,289,048) (4,116,721)Long-term debt $ 3,756,938 $ 3,093,605
On June 1, 2005, the Company obtained a $4,400,000 ten-year mortgage from its primary bank collateralized by three buildings owned by the Company whose carrying value at December 31, 2015 and 2014 was approximately $786,000 and $940,000, respectively. Repayment is to be made in equal monthly installments of $37,249 based on an amortization schedule of fifteen years with interest of LIBOR plus 1.52%. In connection with the mortgage loan, the Company entered into an interest rate swap agreement (the “Swap”) with its primary bank to effectively fix its variable interest rate at 6.05%. The Swap was not treated as a hedge and had a fair value at December 31, 2014 of ($51,194), which was based on the current market rate at that time. The Swap and mortgage matured on July 15, 2015 and the outstanding principal balance of $1,951,801 was repaid with available cash and $1,600,000 of borrowings from the Company’s working capital line of credit.
On December 1, 2010, the Company obtained a $5,500,000 five-year term loan from its primary bank collateralized by a blanket U.C.C. filing against its assets. Repayment is to be made in monthly principal installments of $91,667 with an interest rate of LIBOR plus 1.75%. On January 31, 2014, the Company refinanced its term loan combining outstanding advances of $3,000,000 on its working capital line of credit
11

with the balance due on its term loan. The new $5,108,307 five-year term loan maintains the same terms and conditions as the loan it superseded, with repayment to be made in monthly principal installments of $83,611 with an interest rate of LIBOR plus 1.75%. In connection with the refinanced term loan, the Company entered into a new interest rate swap to fix its interest rate at 2.98% over the life of the term loan, which swap matures in 2019. The Company’s bank debt has been classified in accordance with the new financing terms.
On October 26, 2015, the Company obtained a second term loan combining outstanding advances of $1,400,000 on its working capital line of credit and $600,000 of additional borrowings. The new $2,000,000 five-year term loan maintains the same terms and conditions as the other existing term loan, with repayment to be made in monthly principal installments of $23,809 with an interest rate of LIBOR plus 1.75%. In connection with the second term loan, the Company entered into a new interest rate swap to fix its interest rate at 3.12% over the life of the term loan, which swap matures in 2020. The Company’s bank debt has been classified in accordance with the new financing terms.
The term loan agreements contain various restrictive covenants which include, but are not limited to, maintenance of certain income to debt service ratios and certain adjusted earnings requirements, as defined.
During October 2015, in conjunction with the new term loan, the Company increased its available working capital line of credit with its primary bank from $3,600,000 to $5,600,000. The line of credit is collateralized by a blanket U.C.C. filing against its assets and expires July 31, 2016. Interest is payable at LIBOR plus 2.10%. Use of the funds are unrestricted. As of December 31, 2015, the Company had no outstanding advances against its line of credit.
Future maturities of long-term debt are as follows:
Years ending December 31,2016 $1,289,048 2017 1,289,048 2018 1,289,048 2019 369,320 2020 809,522 $5,045,986
12
AFA Protective Systems, Inc. and Subsidiaries notes to Consolidated finanCial statements (continued)
9. deferred revenuesDeferred revenues consist of annual service and other charges and advance service charges. Annual service and other charges
represent customer billings for services not yet rendered for which the maximum billing period is one year and have been reflected as a current liability. Advance service charges consist of charges billed to customers at the time of new installations. The portion of these charges expected to be recognized within one year has been classified as current on the consolidated balance sheets at December 31, 2015 and 2014. An analysis of deferred revenues is as follows:
Annual Service Advance and Other Service Charges Charges TotalBalances at December 31, 2013 $ 5,063,467 $ 3,110,394 $ 8,173,861 Billings 30,336,410 1,085,619 31,422,029 Amortizations to income (30,317,694) (1,178,379) (31,496,073)Balances at December 31, 2014 5,082,183 3,017,634 8,099,817 Billings 29,863,695 1,283,248 (31,146,943) Amortizations to income (29,897,647) (1,119,232) (31,016,879)Balances at December 31, 2015 $ 5,048,231 $ 3,181,650 $ 8,229,881
10. Common stoCkIssuance of Employee Stock Appreciation Rights
The Company issued stock appreciation rights to certain employees in January 2013 and 2007 which will be payable only upon sale of the Company or change in its control, as defined. Since the sale of the Company or change in its control, as defined, are contingent events, no compensation expense will be recorded until such events are probable.

11. inCome taxesComponents of the provision for income taxes are as follows:
December 31, 2015 2014CurrentFederal $ 666,539 $ 926,502State and local 155,338 257,975 821,877 1,184,477DeferredFederal (296,034) (123,534) State and local (44,843) (2,943) (340,877) (126,477) $ 481,000 $1,058,000
A reconciliation of the federal statutory rate and the Company’s effective tax rate follows: 2015 2014Federal statutory rate 34.0% 34.0%State and local income taxes, net of federal income tax benefit 7.2 6.7Other items 6.0 0.1 Effective rate 47.2% 40.8%
The effective tax rate differed from the federal statutory tax rate primarily as result of state income taxes, tax credits and certain nontaxable income.
The tax effects of the significant temporary differences which comprise the deferred tax assets and liabilities at December 31 are as follows:
December 31, 2015 2014Deferred Tax AssetsAdvance service revenue $ 1,371,700 $ 1,200,700Benefit plans 957,896 1,014,400Other 101,600 130,800 Deferred tax assets 2,431,196 2,345,900 Deferred Tax LiabilitiesIntangibles (1,373,062) (1,535,299) Depreciation (2,266,800) (2,343,400)Other (104,100) (101,800) Net deferred tax liabilities $(1,312,766) $(1,634,599)
Liabilities for uncertain tax positions reflected as of December 31, 2015 are not significant and it is not anticipated that they will materially change in the next 12 months. With limited exceptions, the Company is no longer subjected to tax audits by taxing authorities for years through 2011 for all jurisdictions. Although the outcome of tax audits is always uncertain, the Company believes that its tax positions will generally be sustained under audit.
Interest expense and penalties related to income tax matters are recognized as a component of interest expense. For the years ended December 31, 2015 and 2014, the Company did not record any liabilities or expenses related to tax penalties and related interest.
12. pension and postretirement BenefitsThe Company maintains a noncontributory defined benefit
pension plan for its hourly union employees who meet certain requirements of age, length of service and hours worked per year. The benefits provided are based upon years of service and the employee’s compensation during the last five years of employment. The Company’s funding policy is to contribute annually at least the minimum amount required by Federal regulations. Effective October 15, 1996, the collective bargaining agreement covering the New York/New Jersey union employees was terminated following a strike, which resulted in a workforce reduction. Accordingly, the plan was amended effective December 31, 1996, to eliminate benefit accruals for the remaining New York/New Jersey employees. Effective January 1, 1997, the plan was further amended to provide those participants whose benefits were frozen due to the termination of the union agreement, to have their benefits determined using the method applicable for early retirement if they continue in service until then. In conjunction with the Company’s collective bargaining agreement effective August 1, 2007 covering its Massachusetts union employees effective February 1, 2008, the plan was amended to eliminate benefit accruals for the Massachusetts employees, and new employees are no longer eligible to enter the plan.
The Company provides certain health care and life insurance benefits to retired employees who have attained age 62 or 20 years of service at the date of retirement, whichever is later. Eligible retirees under age 65 are covered by the Company’s health insurance plan, at a cost to the retiree equal to the Company’s cost for an active employee. After attaining age 65, an eligible retiree’s health care benefit coverage becomes coordinated with Medicare, with the retiree paying a portion of the cost of the coverage in excess of certain amounts. Effective December 31, 1996, the Company eliminated future benefits for employees who had not already retired or had given notice of retirement at that date. The Company’s funding policy is generally to pay covered expenses as they are incurred.
13

14
AFA Protective Systems, Inc. and Subsidiaries notes to Consolidated finanCial statements (continued)
The following is a reconciliation of the benefit obligation, fair value of plan assets and funded status of the Company’s defined benefit and other postretirement benefit plans measured at December 31, 2015 and 2014, respectively:
Other Pension Benefits Postretirement Benefits 2015 2014 2015 2014Change in Benefit ObligationBenefit obligation at beginning of year $ 8,556,425 $ 7,058,743 $ 231,356 $ 224,871Service cost — — — —Interest cost 335,133 324,502 7,132 7,770 Change in assumptions (387,368) — (85,822) —Actuarial (gain) loss 293,320 1,450,019 (12,025) 16,897Benefits paid (289,557) (276,839) (15,045) (18,182)Benefit obligation at end of year $ 8,507,953 $ 8,556,425 $ 125,596 $ 231,356 Change in Plan AssetsFair value of plan assets at beginning of year $ 6,267,582 $ 6,037,355 $ — $ —Actual return on plan assets (22,758) 307,066 — — Employer contribution 300,000 200,000 15,045 18,182Benefits paid (289,557) (276,839) (15,045) (18,182)Fair value of plan assets at end of year $ 6,255,267 $ 6,267,582 $ — $ — Benefit obligations in excess of fair value $(2,252,686) $(2,288,843) $ (125,596) $(231,356)
The change in actuarial assumptions for the pension benefits relates to the use of an updated mortality table and the change in discount rate. The discount rate is updated annually for the determination of net periodic pension cost. Also, the Plan actuary has reviewed and assessed a new mortality table, the scale MP 2015 table, in determining the actuarial present value of accumulated plan benefits at the end of the year. The change in actuarial assumptions for the postretirement benefits primarily relates to a change in the claims rate for certain participants.
Amounts recognized in the consolidated balance sheet consist of: Other Pension Benefits Postretirement Benefits 2015 2014 2015 2014Noncurrent pension liability $(2,252,686) $(2,288,843) $ — $ —Current portion of liability for postretirement benefits — — (16,700) (23,800)Noncurrent liability for postretirement benefits — — (108,896) (207,556) Net amount recognized $(2,252,686) $(2,288,843) $(125,596) $(231,356)
Amounts recognized in accumulated other comprehensive loss consist of:
Other Pension Benefits Postretirement Benefits 2015 2014 2015 2014Actuarial loss $3,480,737 $3,407,334 $46,868 $162,780 Total $3,480,737 $3,407,334 $46,868 $162,780
The amounts shown above have been recognized in accumulated other comprehensive loss totaling $2,116,408, net of deferred income tax assets of $1,411,196, at December 31, 2015, and accumulated other comprehensive loss totaling $2,141,914, net of deferred income tax assets of $1,428,200, at December 31, 2014.

Amounts recorded in other comprehensive loss consist of:
Other Pension Benefits Postretirement Benefits 2015 2015 Before Tax Net of Before Tax Net of Tax (Expense) Tax Tax (Expense) Tax Amount or Benefit Amount Amount or Benefit AmountNet actuarial (gain) loss arising during the year $247,082 $98,833 $148,249 $ (97,847) $(39,139) $(58,708)Less: Amortization included in net periodic pension cost 173,679 69,472 104,207 18,065 7,226 10,839 Net change during the year $ 73,403 $29,361 $ 44,042 $(115,912) $(46,365) $(69,547)
Components of net periodic pension and other postretirement benefits cost:
Other Pension Benefits Postretirement Benefits 2015 2014 2015 2014Interest cost $ 335,133 $ 324,502 $ 7,132 $ 7,770 Expected return on plan assets (318,372) (304,947) — —Amortization of net losses 173,679 91,167 18,065 18,248 Total $ 190,440 $ 110,722 $25,197 $26,018
Amounts recorded in accumulated other comprehensive loss expected to be recognized as a component of net periodic pension cost in 2016 are as follows: Other Pension Postretirement Benefits BenefitsActuarial loss $162,222 $4,438 Total $162,222 $4,438 Weighted average assumptions used to determine the benefit obligation and net periodic pension and other postretirement benefits cost as of and for the years ended December 31:
Other Pension Benefits Postretirement Benefits 2015 2014 2015 2014Discount rate used for net periodic cost 3.85% 4.71% 3.25% 3.69% Discount rate used for benefit obligation 4.19% 3.85% 3.34% 3.25%Expected return on plan assets 5.10% 5.10% — —
The expected return on plan assets has been determined based on historical rates of return.The assumed increase in health care cost trend rate at the end of 2015 was 8%, gradually decreasing to 5% by the year 2019 and is
expected to remain at that level thereafter. A one percentage point increase or decrease in these trend rates would not have a significant effect on the accumulated benefit obligation at December 31, 2015 and the net periodic pension and other postretirement benefits cost for 2015.
15

Plan AssetsAssets are primarily invested in the General Account of Principal
Mutual Life Insurance Company, which provides the contract and cashout value of the account. The Company’s defined benefit plan investment strategy is to invest the assets in a conservative portfolio that provides an acceptable return with low down-side risk. Preservation of capital is of primary importance. The funds are invested principally in guaranteed investment contracts which are reinvested in new contracts upon expiration and stock in the Principal Financial Group, Inc. Such investments are deemed Level 3 and Level 2 financial instruments, respectively, as defined in Note 13. Management believes that General Investment Account is a low-risk fixed income investment, consistent with the defined benefit plan’s strategy. The breakdown of the cashout value of the assets as of December 31, 2015 and 2014 is as follows:
2015 2014General Investment Account 93.2% 92.4%Stock Separate Account 6.8% 7.6%
Cash FlowsBenefit payments, which reflect expected future service, as
appropriate, expected to be paid for the next ten years are as follows: Other Pension PostretirementYears ending December 31, Benefits Benefits2016 $ 424,900 $ 16,700 2017 450,200 15,500 2018 472,700 14,400 2019 482,400 13,200 2020 481,400 12,000 Thereafter 2,471,600 44,000 $4,783,200 $115,800
Substantially all non-union salaried employees of the Company were covered by another defined contribution pension plan. Contributions under the plan were based on specified percentages of the compensation of covered employees less forfeitures, if any. There is no unfunded past service cost for this plan. In January 2010, the Company terminated the plan and offered its employees covered by this plan to fully participate in the Company’s 401K Plan discussed in the following paragraph. There was no pension expense for this plan for either of the years ended December 31, 2015 and 2014.
In connection with the aforementioned curtailment of the defined benefit pension plan, effective December 1, 1996 and the curtailment of the defined contribution plan discussed above, the Company established a 401(k) savings plan covering all eligible employees. Under the plan, employees may
contribute up to certain percentages of their pretax earnings, subject to the Internal Revenue Service annual contribution limit. The Company can make nonmatching and matching contributions for all eligible employees. Company contributions to the plan amounted to $496,196 and $494,382 for the years ended December 31, 2015 and 2014, respectively.
13. fair value of finanCial instrumentsThe Company measures fair value as the price that would
be received to sell an asset or paid to transfer a liability in the principal or most advantageous market in an orderly transaction between market participants. As such, fair value is a market-based measurement that should be determined based on assumptions that market participants would use in pricing an asset or liability. As a basis for considering assumptions, generally accepted accounting principles establishes a three-level hierarchy for fair value measurements based upon the transparency of inputs to the valuation of an asset or liability as of the measurement date:
• Level 1—Observable inputs to the valuation methodology are quoted prices (unadjusted) for identical assets or liabilities in active markets;
• Level 2—Inputs to the valuation methodology include quoted prices for similar assets or liabilities in active markets, and inputs that are observable for the asset or liability, either directly or indirectly, for substantially the same term of the financial instrument; and
• Level 3—Unobservable inputs to the valuation methodology in which there is little or no market data and which are significant to the fair value measurement.
The fair value hierarchy gives the highest priority to quoted prices in active markets for identical assets or liabilities (Level 1) and the lowest priority to unobservable inputs (Level 3). If the inputs used to measure the financial instruments fall within different levels of the hierarchy, the categorization is based on the lowest level input that is significant to the fair value measurement of the instrument.
In general, fair value is based upon quoted market prices, where available. If such quoted market prices are not available, fair value is based upon internally developed models that primarily use, as inputs, observable market-based parameters. Valuation adjustments may be made to ensure that financial instruments are recorded at fair value. These adjustments may include amounts to reflect counterparty credit quality and counterparty creditworthiness, among other things, as well as unobservable parameters. Any such valuation adjustments are applied consistently over time. The Company’s valuation methodologies may produce a fair value calculation that may not be indicative of net realized value or reflective of future values. While management believes the Company’s valuation methodologies are appropriate and consistent with other market participants, the use of different methodologies or assumptions to determine the fair value of certain financial instruments could result in different estimates of fair value at the reporting date.
16
AFA Protective Systems, Inc. and Subsidiaries notes to Consolidated finanCial statements (continued)

17
Cash equivalents consisting of money market funds are reported at fair value utilizing Level 1 Inputs. The General investment account is a contract provision that allows a fixed interest account in a group contract with the underlying investment custodian, which primarily consists of intermediate-term, fixed income investment and is reported
utilizing Level 3 Inputs. The Stock separate account consists of equities and is reported at fair value utilizing Level 2 Inputs. Derivatives are reported at fair value utilizing Level 2 Inputs. The Company obtained dealer quotations to assist in the valuation of its interest rate swaps.
Level 1 Level 2 Level 3 Total FairDecember 31, 2015 Inputs Inputs Inputs ValueCash equivalents $86,839 $ — $ — $ 86,839 General investment account — — 5,831,083 5,831,083 Stock separate account — 424,184 — 424,184 Derivative liabilities — 12,930 — 12,930
Level 1 Level 2 Level 3 Total FairDecember 31, 2014 Inputs Inputs Inputs ValueCash equivalents $91,043 $ — $ — $ 91,043 General investment account — — 5,791,572 5,791,572 Srock separate account — 476,010 — 476,010Derivative liabilities — 69,228 — 69,228
The following table sets forth a summary of changes in fair value of the pension’s Level 3 investments for the years ended December 31, 2015 and 2014: 2015 2014Balances at January 1, $5,791,572 $5,595,419 Deposits 300,000 200,000 Investment return 29,068 272,992 Benefit payments and credits (289,557) (276,839) Balances at December 31, $5,831,083 $5,791,572
14. Commitments and ContingenCiesLeases
The Company is obligated under the terms of noncancelable operating leases for office, storage and operating facilities (real property) through 2020 for approximate aggregate minimum rentals of $3,294,300 as follows:
Years ending December 31, 2016 $1,001,4002017 659,5002018 585,4002019 568,1002020 400,500Thereafter 79,400 $3,294,300
Certain leases are renewable and substantially all leases provide for payment of various cost escalations. Rent expense for all operating leases, including motor vehicles, was approximately $2,230,000 and $2,262,000 for the years ended December 31, 2015 and 2014, respectively.
OtherVarious claims incident to the ordinary course of business,
some of which have resulted in litigation, are pending against the Company. In the opinion of management, disposition of these matters will not have a material adverse effect on its consolidated financial position, results of operations or cash flows.

To the Board of Directors ofAFA Protective Systems, Inc.:
We have audited the accompanying consolidated financial statements of AFA Protective Systems, Inc. and its subsidiaries, which comprise the consolidated balance sheets as of December 31, 2015 and 2014, and the related consolidated statements of income and comprehensive income, shareholders’ equity, and of cash flows for the years then ended.
Management’s Responsibility for the Consolidated Financial StatementsManagement is responsible for the preparation and fair presentation of the consolidated financial statements in accordance with
accounting principles generally accepted in the United States of America; this includes the design, implementation, and maintenance of internal controls relevant to the preparation and fair presentation of consolidated financial statements that are free from material misstatement, whether due to fraud or error.
Auditor’s ResponsibilityOur responsibility is to express an opinion on the consolidated financial statements based on our audits. We conducted our
audits in accordance with auditing standards generally accepted in the United States of America. Those standards require that we plan and perform the audit to obtain reasonable assurance about whether the consolidated financial statements are free from material misstatement.
An audit involves performing procedures to obtain audit evidence about the amounts and disclosures in the consolidated financial statements. The procedures selected depend on our judgment, including the assessment of the risks of material misstatement of the consolidated financial statements, whether due to fraud or error. In making those risk assessments, we consider internal controls relevant to the Company’s preparation and fair presentation of the consolidated financial statements in order to design audit procedures that are appropriate in the circumstances, but not for the purpose of expressing an opinion on the effectiveness of the Company’s internal controls. Accordingly, we express no such opinion. An audit also includes evaluating the appropriateness of accounting policies used and the reasonableness of significant accounting estimates made by management, as well as evaluating the overall presentation of the consolidated financial statements. We believe that the audit evidence we have obtained is sufficient and appropriate to provide a basis for our audit opinion.
OpinionIn our opinion, the consolidated financial statements referred to above present fairly, in all material respects, the financial position
of AFA Protective Systems, Inc. and its subsidiaries at December 31, 2015 and 2014, and the results of their operations and their cash flows for the years then ended in accordance with accounting principles generally accepted in the United States of America.
Melville, New YorkApril 13, 2016
18
AFA Protective Systems, Inc. and Subsidiaries report of independent auditors
19
AFA Protective Systems, Inc. and Subsidiaries seleCted finanCial data
AFA Protective Systems, Inc. and Subsidiaries market priCes and dividend information
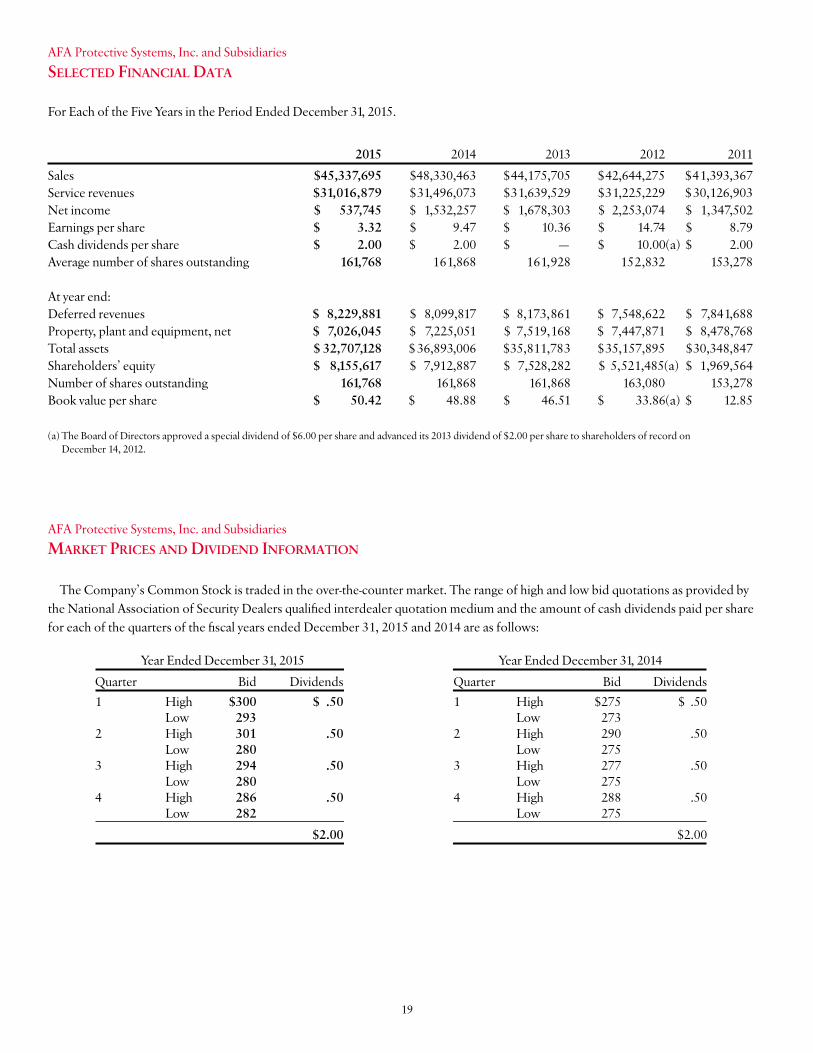
The Company’s Common Stock is traded in the over-the-counter market. The range of high and low bid quotations as provided by the National Association of Security Dealers qualified interdealer quotation medium and the amount of cash dividends paid per share for each of the quarters of the fiscal years ended December 31, 2015 and 2014 are as follows:
Year Ended December 31, 2015 Year Ended December 31, 2014 Quarter Bid Dividends Quarter Bid Dividends 1 High $300 $ .50 1 High $275 $ .50 Low 293 Low 273 2 High 301 .50 2 High 290 .50 Low 280 Low 275 3 High 294 .50 3 High 277 .50 Low 280 Low 275 4 High 286 .50 4 High 288 .50 Low 282 Low 275 $2.00 $2.00
For Each of the Five Years in the Period Ended December 31, 2015. 2015 2014 2013 2012 2011Sales $45,337,695 $48,330,463 $44,175,705 $42,644,275 $41,393,367Service revenues $31,016,879 $31,496,073 $31,639,529 $31,225,229 $ 30,126,903Net income $ 537,745 $ 1,532,257 $ 1,678,303 $ 2,253,074 $ 1,347,502Earnings per share $ 3.32 $ 9.47 $ 10.36 $ 14.74 $ 8.79Cash dividends per share $ 2.00 $ 2.00 $ — $ 10.00(a) $ 2.00Average number of shares outstanding 161,768 161,868 161,928 152,832 153,278 At year end: Deferred revenues $ 8,229,881 $ 8,099,817 $ 8,173,861 $ 7,548,622 $ 7,841,688 Property, plant and equipment, net $ 7,026,045 $ 7,225,051 $ 7,519,168 $ 7,447,871 $ 8,478,768Total assets $ 32,707,128 $ 36,893,006 $35,811,783 $ 35,157,895 $30,348,847 Shareholders’ equity $ 8,155,617 $ 7,912,887 $ 7,528,282 $ 5,521,485(a) $ 1,969,564Number of shares outstanding 161,768 161,868 161,868 163,080 153,278 Book value per share $ 50.42 $ 48.88 $ 46.51 $ 33.86(a) $ 12.85 (a) The Board of Directors approved a special dividend of $6.00 per share and advanced its 2013 dividend of $2.00 per share to shareholders of record on
December 14, 2012.

20
exeCutive offiCe
155 Michael Drive Syosset, NY 11791 (516) 496-2322
regional offiCes
florida
6013 Benjamin Road Suite 201 Tampa, FL 33634 (727) 556-2905
217 Altamonte Commerce Blvd. Suite 1234 Altamonte Springs, FL 32714 (407) 812-9200
6535 Nova Drive Suite 111 Davie, FL 33317 (954) 473-0022
georgia 805C Franklin Court Marietta, GA 30067 (770) 794-9000
metropolitan new york 519 Eighth Avenue New York, NY 10018 (212) 279-5000
170 Eileen Way Syosset, NY 11791 (516) 496-2322
10 Skyline Drive Hawthorne, NY 10532 (914) 347-5481
mid-atlantiC 4643 Benson Avenue Halethorpe, MD 21227 (410) 247-8305
520 Fellowship Road Suite D-404 Mt. Laurel, NJ 08054 (856) 231-4242
national aCCounts 150 Wood Road Suite 301 Braintree, MA 02184 (781) 848-6200
new england 200 High Street Boston, MA 02110 (617) 772-5900
48 Capital Drive Wallingford, CT 06492 (203) 265-0202
240 Chestnut Street Warwick, RI 02888 (401) 461-2770
new Jersey 961 Joyce Kilmer Avenue North Brunswick, NJ 08902 (732) 846-4000
north Carolina 894-D Elm Street Fayetteville, NC 28303 (910) 423-4054
1135 Four Lakes Drive Suite G Matthews, NC 28105 (704) 246-7920
AFA Protective Systems, Inc. and Subsidiaries exeCutive and regional offiCes

4
Corporate information
Board of direCtors
Asher Bernstein President, Bernstein Management Corp., a real estate company, New York, NY
Stephen Hess* President, Hess Associates, Manhasset, NY
Stephen Genatt* President, Genatt Associates, New Hyde Park, NY
David M. Kleinman Vice President and Secretary, AFA Protective Systems, Inc.
Richard D. Kleinman President, AFA Protective Systems, Inc.
Robert D. Kleinman Chairman of the Executive Committee and Board of Directors, AFA Protective Systems, Inc.
Fredric Mack Partner, The Mack Company Fort Lee, NJ
Thomas Von Essen Independent consultant in the fire safety industry and former Fire Commissioner of the City of New York
*Members of Audit Committee
offiCers
Robert D. Kleinman Chairman of the Board of Directors, Chief Executive Officer and General Counsel
Richard D. Kleinman President and Chief Operating Officer
Ronald K. Rothman Senior Vice President of Sales and Business Development
Stephen P. Hyle Vice President and Director of National Accounts
David M. Kleinman Vice President and Secretary
Joseph H. Goren Chief Financial Officer and Treasurer
registrar and transfer agent
Computershare, Inc. 480 Washington Boulevard, 29th Floor Jersey City, NJ 07310
independent auditors
PricewaterhouseCoopers LLP 401 Broad Hollow Road Melville, NY 11747
annual meeting
The Annual Meeting of Stockholders will be held on Tuesday, June 7 at 11:30 a.m. at the Company’s Corporate Headquarters, 155 Michael Drive, Syosset, New York. All stockholders are invited to attend. A formal Notice of Meeting accompanies this report.

AFA Protective SyStemS, inc.155 Michael DriveSyosset, NY 11791
Telephone: 516-496-2322Fax: 516-496-2848
www.afap.com