aerosol characterization at the saharan aeronet site ... · aerosol characterization at the saharan...
TRANSCRIPT

Atmos. Chem. Phys., 14, 11753–11773, 2014www.atmos-chem-phys.net/14/11753/2014/doi:10.5194/acp-14-11753-2014© Author(s) 2014. CC Attribution 3.0 License.
Aerosol characterization at the Saharan AERONET siteTamanrassetC. Guirado1,2, E. Cuevas2, V. E. Cachorro1, C. Toledano1, S. Alonso-Pérez2,3,4, J. J. Bustos2, S. Basart5,P. M. Romero2, C. Camino2, M. Mimouni 6, L. Zeudmi6, P. Goloub7, J. M. Baldasano5,8, and A. M. de Frutos1
1Atmospheric Optics Group, University of Valladolid (GOA-UVA), Valladolid, Spain2Izaña Atmospheric Research Center (IARC), State Meteorological Agency of Spain (AEMET),Santa Cruz de Tenerife, Spain3Institute of Environmental Assessment and Water Research, Spanish National Research Council (CSIC),Barcelona, Spain4Universidad Europea de Canarias, Laureate International Universities, La Orotava, Spain5Earth Sciences Department, Barcelona Supercomputing Center-Centro Nacional de Supercomputación,BSC-CNS, Barcelona, Spain6Office National de la Météorologie, Direction Méteo Regionale Sud, Tamanrasset, Algeria7Laboratoire d’Optique Atmosphérique, Université des Sciences et Technologies de Lille, Lille, France8Environmental Modeling Laboratory, Technical University of Catalonia, Barcelona, Spain
Correspondence to:C. Guirado ([email protected])
Received: 28 March 2014 – Published in Atmos. Chem. Phys. Discuss.: 24 June 2014Revised: 1 September 2014 – Accepted: 25 September 2014 – Published: 11 November 2014
Abstract. More than 2 years of columnar atmosphericaerosol measurements (2006–2009) at the Tamanrasset site(22.79◦ N, 5.53◦ E, 1377 m a.s.l.), in the heart of the Sahara,are analysed. Aerosol Robotic Network (AERONET) level2.0 data were used. The KCICLO (K is the name of a con-stant andciclo means cycle in Spanish) method was appliedto a part of the level 1.5 data series to improve the qualityof the results. The annual variability of aerosol optical depth(AOD) and Ångström exponent (AE) has been found to bestrongly linked to the convective boundary layer (CBL) ther-modynamic features. The dry-cool season (autumn and win-ter) is characterized by a shallow CBL and very low meanturbidity (AOD ∼ 0.09 at 440 nm, AE∼ 0.62). The wet-hotseason (spring and summer) is dominated by high turbidityof coarse dust particles (AE∼ 0.28, AOD∼ 0.39 at 440 nm)and a deep CBL. The aerosol-type characterization showsdesert mineral dust as the prevailing aerosol. Both pure Saha-ran dust and very clear sky conditions are observed depend-ing on the season. However, several case studies indicate ananthropogenic fine mode contribution from the industrial ar-eas in Libya and Algeria. The concentration weighted trajec-tory (CWT) source apportionment method was used to iden-
tify potential sources of air masses arriving at Tamanrassetat several heights for each season. Microphysical and opticalproperties and precipitable water vapour were also investi-gated.
1 Introduction
The regional characterization of mineral dust, particularlyclose to source areas, has become a valuable tool for re-searchers from different fields. It will lead to reducing someexisting uncertainties about direct radiative forcing by atmo-spheric aerosols (Forster et al., 2007), and to a better un-derstanding about the potential impact of aerosol on humanhealth and air quality (e.g. De Longueville et al., 2010; Perezet al., 2012).
The Sahara and its margins are the largest and most contin-uous dust sources in the world. Several satellite and ground-based observation analyses have led to identifying the base ofthe Ahaggar and Tibesti mountains and the Bodélé Depres-sion as the major sources in this area (Goudi and Middle-ton, 2001; Prospero et al., 2002; Ginoux et al., 2012). During
Published by Copernicus Publications on behalf of the European Geosciences Union.

11754 C. Guirado et al.: Aerosol characterization at the Saharan AERONET site Tamanrasset
recent years, several field campaigns in different locationsfocused on the analysis of Saharan dust features (Todd etal., 2013, and references therein). In particular, Tamanras-set (main city in the Hoggar, also known as Ahaggar Moun-tains, in Algeria) hosted a specific soil and aerosol sam-pling analysis at the beginning of the 1980s (D’Almeidaand Schütz, 1983), the African turbidity monitoring network(1980–1984) for climate modelling purposes (D’Almeida,1986, 1987), and the more recent African Monsoon Multi-disciplinary Analysis (AMMA) campaign (Redelsperger etal., 2006).
During AMMA’s intensive observation periods in 2006,Tamanrasset was a fully equipped ground-based station foraerosol and radiation measurements. This campaign has pro-vided comprehensive analysis of several features at Taman-rasset and the Hoggar Mountains (e.g. Flamant et al., 2007;Bou Karam et al., 2008; Cuesta et al., 2008, 2009, 2010). Inaddition, aerosol observations carried out at Tamanrasset in2006 have been part of selected aerosol data sets used for sev-eral model validations (e.g. Toledano et al., 2009; Hausteinet al., 2009, 2012; Su and Toon, 2011). In spite of these stud-ies, limited aerosol observations, mainly confined to shorterperiod campaigns, are available for this area which is strate-gically located in the heart of the Sahara.
Consequently, Tamanrasset was considered to be a keyplace to initiate the Saharan Air Layer Analysis and Mon-itoring (SALAM) project as part of the Global Atmo-spheric Watch (GAW) twinning cooperation program be-tween l’Office Nationale de la Météorologie (ONM, Alge-ria) and the Meteorological State Agency of Spain (AEMET,formerly INM) through the Izaña GAW station (Canary Is-lands, Spain). In the framework of this project, at the endof September 2006, a Cimel sun photometer was set up atTamanrasset and integrated into the Aerosol Robotic Net-work (AERONET). In 2010 the station was incorporatedinto the World Meteorological Organization (WMO) Sandand Dust Storm Warning Advisory and Assessment System(SDS-WAS) Regional Center for Northern Africa, MiddleEast and Europe (http://sds-was.aemet.es/) for near-real timeand long-term dust model evaluation. The new aerosol dataset from Tamanrasset has been used for a preliminary char-acterization of aerosol properties (Guirado et al., 2011), forspace-based remote sensing evaluation (e.g. Schuster et al.,2012), and for model validation (e.g. Tegen et al., 2013). Re-garding dust optical properties, Kim et al. (2011) provide ananalysis of the single scattering albedo, asymmetry param-eter, real refractive index, and imaginary refractive index atseveral stations, including Tamanrasset from 2006 to 2009.
The present work focuses on a detailed characterizationof aerosol properties at the Tamanrasset site. Very prelim-inary results, briefly shown by Guirado et al. (2011), havebeen carefully revised and extended taking into account cor-rected data. The KCICLO (K is the name of a constant andciclo means cycle in Spanish) method has been used to cor-rect the aerosol optical depth (AOD) and the Ångström expo-
nent (AE) time series. Specific characterizations have beenmade for the first time: annual evolution and seasonal fea-tures of precipitable water vapour (PWV), fine mode frac-tion (FMF), and aerosol microphysics, as well as an identi-fication of potential source regions. The paper is structuredas follows: measurement site, data sets and tools used are de-scribed in Sect. 2. In Sect. 3.1 the main aerosol and PWVseasonal features are analysed, an aerosol-type classifica-tion is performed and microphysical and optical propertiesare discussed. In Sect. 3.2 the concentration weighted tra-jectory method is used to identify potential source regions.In Sect. 3.3 the transport of anthropogenic fine aerosols toTamanrasset is discussed. In Sect. 4 the main concludingpoints are provided.
2 Methodology
2.1 Unique characteristics of the Tamanrasset site
On 30 September 2006, a sun photometer was installed onthe roof of the main building of the Regional MeteorologicalCenter (Direction Météo Régional Sud, Office National dela Météorologie, Algeria) at Tamanrasset (22.79◦ N, 5.53◦ E,1377 m a.s.l.) in southern Algeria. Tamanrasset is free fromindustrial activities and is representative of pure desert dustaerosols (Guirado et al., 2011). It is near dust sources locatedin Mali, southern Algeria, Libya and Chad, on the north-ern edge of the zonal dust pathway identified by the MISR(Multi-angle Imaging SpectroRadiometer, onboard NASA’sTerra satellite) AOD retrieval (Fig. 8). Moreover, this ge-ographical location is very significant since ground-basedmeasurements of atmospheric constituents from continentalAfrica are very limited, especially in the surrounding areaof Tamanrasset. This station is involved in several interna-tional measurement programs such as the Global ClimateObserving System (GCOS) – Upper-Air Network (GUAN),the Baseline Surface Radiation Network (BSRN), and theGAW program of the WMO.
The climate of the region is modulated by the influence ofthe monsoon during summer and the westerly winds duringthe rest of the year (Cuesta et al., 2008). In July and Augusteasterly winds, moist air masses and scarce rainfall are theprevailing weather conditions. In September the influence ofthe westerly winds appears at high altitude and draws suc-cessively closer to the ground until the end of autumn. Thissystem is maintained, although wind strengths vary, duringthe winter and even springtime until June when the influenceof the easterly winds starts in layers close to the ground (Du-bief, 1979). The winter season is characterized by dry con-ditions and occasional midlevel and cirrus clouds (Cuesta etal., 2008).
Atmos. Chem. Phys., 14, 11753–11773, 2014 www.atmos-chem-phys.net/14/11753/2014/

C. Guirado et al.: Aerosol characterization at the Saharan AERONET site Tamanrasset 11755
2.2 Cimel sun photometer data set
2.2.1 AERONET data
The Cimel sun photometer (model CE-318 operating at 340,380, 440, 500, 670, 870, 940 and 1020 nm nominal wave-lengths) installed at Tamanrasset is one of the standard in-struments in AERONET. Data acquisition protocols, cali-bration procedures and data processing methods have beenextensively described (Holben et al., 1998; Dubovik et al.,2000; Smirnov et al., 2000; O’Neill et al., 2003). Solar ex-tinction measurements are used to compute AOD at eachwavelength, except for the 940 nm channel, used to retrievePWV (Eck et al., 1999). AE, which is a measure of the AODspectral dependence with the wavelength of incident light, isa qualitative indicator of the aerosol’s predominant particlesize and it can be computed for two or more wavelengths(Schuster et al., 2006). For climatological studies, linearfit determination of AE in the 440–870 nm range is com-puted for three or four nominal wavelengths (440 nm, 500 nmwhen available, 670 nm, and 870 nm). AERONET FMF fromthe spectral deconvolution algorithm (SDA; O’Neill et al.,2003) has also been included in the present analysis. Further-more, several aerosol microphysical and optical propertiesretrieved from the AERONET inversion algorithm (Dubovikand King, 2000; Dubovik et al., 2006) are discussed. Par-ticularly, particle size distribution, volume concentration, ef-fective radius, as well as single scattering albedo, asymme-try factor, and complex refractive index are analysed becausethey are closely related to aerosol radiative effects.
The AOD uncertainty is approximately 0.01–0.02 (spec-trally dependent, with higher errors in the UV) and it al-ters the AE by 0.03–0.04 (Eck et al., 1999; Schuster et al.,2006). The PWV uncertainty is estimated to be± 10 % (Hol-ben et al., 2001). The amplitude of the errors of the derivedparameters from SDA retrieval varies as the inverse of the to-tal AOD. In addition to measurement errors, there are errorsin the AOD retrieval due to the uncertainty in the assumedvalues of the spectral curvature in each mode (O’Neill etal., 2001), which are most critical in coarse mode-dominatedconditions. Dubovik et al. (2002) provide a detailed descrip-tion of the expected error in aerosol size distribution, com-plex refractive index, and single scattering albedo.
At present, AERONET level 2.0 data from Tamanrasset isonly available from October 2006 to February 2009, exceptfrom 18 November 2007 to 20 June 2008. Data for the periodFebruary 2009–October 2012 will likely never be promotedto level 2.0, and level 1.5 data in this period do not have thesufficient quality to be properly corrected with the KCICLOmethod that will be discussed below. Data after November2012 are expected to achieve AERONET level 2.0 and mightbe incorporated in the future to perform a relatively longer-term analysis. Long AOD data series fulfilling the highestquality criteria are difficult to obtain in remote stations suchas Tamanrasset, in which the annual exchange of instruments
is difficult, and where dust events lead to dirt accumulatingon the optics. Intense dust storms cause a rapid accumula-tion of dust while less intense dust transport leads to a moreprogressive build up of dust on the optics. These inconsisten-cies are difficult to correct and deteriorate the quality of themeasurements.
2.2.2 KCICLO correction
The analysis of the AOD period from 18 November 2007to 20 June 2008 reveals a systematic and strong AOD andAE fictitious diurnal cycle, most likely caused by dirt onthe sun photometer’s front windows (Guirado et al., 2011).Other possible causes, such as the effect of temperature onthe detector and incorrect sun-pointing, were analysed anddiscarded. Measurements corresponding to 340 and 500 nmdid not achieve level 2.0 in the entire analysed period due tothe significant degradation of these filters.
The KCICLO method is used to detect, evaluate and cor-rect possible calibration problems, after discarding a real at-mospheric effect or instrument malfunctions (Cachorro et al.,2004, 2008a). Particularly, the obstruction in the optical path,due to dirt on the sun photometer’s front windows, leads toa distinct and artificial diurnal cycle pattern that can be cor-rected using the KCICLO method. This fictitious diurnal cy-cle is due to the systematic absolute error in the AOD mea-surements as a consequence of calibration errors (Romeroand Cuevas, 2002): the magnitude of this absolute error isgreatest at midday because it varies as the inverse of the so-lar air mass (Cachorro et al., 2008a). This method introducesa constantK defined as the ratio between “incorrect” cur-rent and true calibration constants.K quantifies calibrationfactor error in such a way thatK = 1 corresponds to a cor-rect calibration constant andK > 1 (K < 1) will result in anoverestimation (underestimation) of the current calibrationconstant and a convex (concave) curve shape in the diurnalcycle (Cachorro et al., 2004, 2008a). The relative differencesof AOD between AERONET level 2.0 and KCICLO data se-ries are estimated to be 8.5 % (or about 0.01 in absolute AODvalues) and 2.4 % for AE (Cachorro et al., 2008b).
The application of this in situ correction-calibration proce-dure requires a sufficient number of clear-sky and stable daysfor a given period to be corrected. The selected days mustfulfil a set of requirements about air mass range (higher than4 and typically between 1.7 and 6), turbidity (AOD (440 nm)< 0.12 and variability lower than 5 % in the specified air massrange), number of data points (at least 12 per day), and stan-dard deviation of the fit to quantify the calibration factor er-ror (lower than 0.01) (Cachorro et al., 2008a). Therefore, thesuccessful application of the KCICLO method over a givenperiod is associated with a sufficient number of days (5–10 %) fulfilling all the above-mentioned requirements. As aconsequence, the application of the method is not always fea-sible at all stations or at all periods of time. The KCICLO
www.atmos-chem-phys.net/14/11753/2014/ Atmos. Chem. Phys., 14, 11753–11773, 2014

11756 C. Guirado et al.: Aerosol characterization at the Saharan AERONET site Tamanrasset
Figure 1. (a)AE in the range 440–870 nm and(b) AOD at 440 nmshown with and without the KCICLO correction from 15 March to1 April 2008 (refer to legend for colour description). Two differentcorrections were applied before and after 23 March. AE and AODare dimensionless parameters.
Table 1.Dimensionless meanK values and standard deviation (SD)for each channel and for each period of correctiona.
1020 nm 870 nm 675 nm 440 nm 380 nm
18 November 2007–22 March 2008
K 0.9945 1.0085 1.0281 1.0716 1.1092SD 0.0190 0.0200 0.0219 0.0257 0.0289
23 March 2008–20 June 2008
K 1.0674 1.0783 1.0943 1.1224 1.1600SD 0.0093 0.0093 0.0079 0.0082 0.0090
a Data from 88 days fulfilling the requirements for applying the KCICLOmethod have been used to compute the meanK values for the first period and6 days for the second one.
method has been previously used to correct the AOD dataseries (e.g. Toledano et al., 2007; Barreto el al., 2014).
At Tamanrasset, a sufficient number of days (94) from18 November 2007 to 20 June 2008 were available to prop-erly apply the KCICLO method and complete the AOD/AEdata set. This method confirmed a calibration shift betweenNovember 2007 and June 2008. Only two different correc-tion periods, i.e. two different types of lens contamination(amount of dirt and lenses affected), were detected and thecorresponding meanK values (Table 1) were computed. Partof the original and the corrected AOD and AE data for bothperiods is shown in Fig. 1. Note that the fictitious diurnal cy-cle is largely reduced both in the AOD and the derived AE.
Additionally, it was possible to apply an external qual-ity control of the KCICLO correction. Since 1995, in theframework of the GAW program, a J-309 handheld sun pho-tometer (Reddy, 1986) supplied by the National Oceanic and
Figure 2. Dimensionless correlation between AERONET AOD at440 nm and NOAA AOD at 500 nm for time coincident data (within15 minutes). The AERONET level 2.0 data (light green) cover theperiod from October 2006 to February 2009. The AERONET level1.5 data from November 2007 to June 2008 are shown before (grey)and after (dark green) applying the KCICLO correction. Each dataset is shown together with their linear regression line. The solidblack line is the 1:1 reference line.
Atmospheric Administration (NOAA) has been operated atTamanrasset. The photometer is characterized by a 2.5◦ fullangle field of view and two 10 nm bandwidth filters centred at386 and 506 nm, respectively. AOD measurements at 500 nmtaken at 09:00, 12:00 and 15:00 UTC (universal time coor-dinated) were used in this work. Data from October 2006to February 2009 were compared to the closest AERONETmeasurements at 440 nm (± 15 min as time coincident cri-terion). The AOD measurement scatter plot between NOAAand three AERONET data sets is shown in Fig. 2 and the cor-responding linear regression parameters are provided in Ta-ble 2. After applying the KCICLO correction the correlationcoefficient increases to 0.981 for this period (0.968 beforecorrection).
2.2.3 Time series
Following the data processing and quality control proce-dures described above, AERONET level 2.0 and KCICLO-corrected level 1.5 data (AOD and AE) were used for aerosolcharacterization. Due to the degradation of the 500 nm fil-ter, AOD measurements at 440 nm were selected for anal-ysis. However, since AOD at 500 nm is more suitable forsatellite and modelling comparisons, it was estimated fromAOD (440 nm) and AE (440–670–870 nm) applying theÅngström power law (Ångström, 1929). With regard to thePWV record, AERONET level 1.5 measurements were notaffected by any fictitious diurnal cycle. The water vapouroptical depth, and consequently the PWV product, is notstrongly affected by obstructions in the optical path becausethe calculation algorithm is based on a subtraction of exper-imental measurements (Schmid et al., 2001). Therefore, theanalysed PWV data series comprised AERONET levels 2.0and 1.5 when level 2.0 was not available. Limitations and
Atmos. Chem. Phys., 14, 11753–11773, 2014 www.atmos-chem-phys.net/14/11753/2014/

C. Guirado et al.: Aerosol characterization at the Saharan AERONET site Tamanrasset 11757
Table 2.Least squares linear fit results (dimensionless) between the NOAA handheld sun photometer AOD measurements and three Cimelsun photometer AOD data sets (AERONET level 1.5 before and after KCICLO correction, and AERONET level 2.0). The parameters are thefollowing: slope of the regression, Y intercept, correlation coefficient (R2), root-mean-square error (RMSE), and number of observations.
Before KCICLO After KCICLO AERONET qualitycorrection correction assured (level 2.0)
Slope 1.15± 0.02 1.07± 0.01 1.02± 0.01Y intercept 0.031± 0.006 −0.014± 0.004 0.001± 0.001R2 0.968 0.981 0.983RMSE 0.044 0.031 0.024No. observations 450 450 1241
special features regarding the analysed AERONET inversionretrievals for single scattering albedo and complex refractiveindex will be discussed in Sect. 3.1.4. All the analysed daily,monthly, and seasonal averages have been calculated fromthe corresponding sun photometer single measurements.
2.3 Ancillary data
2.3.1 Meteorological radiosonde data
A GCOS-GUAN meteorological radiosonde (Vaisala RS92)is launched twice a day (at 00:00 UTC and 12:00 UTC)at Tamanrasset airport: data available at the Universityof Wyoming web site (http://weather.uwyo.edu/upperair/sounding.html). Radiosonde data at 12:00 UTC were usedfor calculation of the convective boundary layer (CBL) topaltitude from 2006 to 2009. The criteria used to accountfor the overshooting thermals are1θ/1z ≥ 0.0025 K m−1
and θtop− θbase≥ 1 K, where1θ/1z is the potential tem-perature lapse rate andθtop and θbase refer to the top andbase of the layer, respectively (Heffter, 1980; Cuesta et al.,2008). Additionally, PWV retrieved from radiosonde wascompared with corresponding AERONET PWV as will beshown in Sect. 3.1.5. Estimated PWV precision of the ra-diosonde RS92 is around 5 % but for very dry conditions it isabout 10–20 % (Miloshevich et al., 2009).
2.3.2 Aerosol extinction vertical profiles
The Cloud-Aerosol Lidar with Orthogonal Polarization(CALIOP) is an elastic-backscatter lidar on board the Cloud-Aerosol Lidar and Infrared Pathfinder Satellite Observation(CALIPSO). CALIOP emits linearly polarized light at 532and 1064 nm to provide vertically resolved observations ofaerosols and clouds on a global scale (Hunt et al., 2009;Winker et al., 2009). Aerosol extinction features at certainheights have being identified using CALIOP level 2 version3.01 extinction profiles at 532 nm over Tamanrasset (withina 1.5◦ radius) with a vertical resolution of 60 m (below20.2 km height) and a horizontal resolution of 5 km. Datafrom the period 2007–2008, downloaded from the NASAdatabase (https://eosweb.larc.nasa.gov/cgi-bin/searchTool.
cgi?Dataset=CAL_IIR_L1-Prov-V1-10), have been filteredfollowing the methodology of Tesche et al. (2013).
2.3.3 Concentration weighted trajectory method
The concentration weighted trajectory (CWT) source appor-tionment method (Seibert et al., 1994; Hsu et al., 2003) wasused to identify pathways of aerosol-laden air masses forthe period 2006–2009 in the dry season (from Novemberto February) and the wet season (from April to September).The resulting information about air mass pathways was com-bined with the information about aerosol source regions re-ported by several authors (Sect. 3.2, Fig. 8) to detect poten-tial sources affecting Tamanrasset. This method combinesdata measured at the receptor site with air mass back tra-jectories. Although this method was originally designed andwidely used for weighting trajectories with concentrationsmeasured at a receptor site, we used AERONET daily AODand AE observations at Tamanrasset to identify aerosol con-tent and type, respectively. A similar approach to connectdistinct sources with different aerosol types has been previ-ously performed by other authors (e.g. Naseema Beegum etal., 2012). A weighted AOD or AE value is assigned to eachgrid cell by averaging the values associated with the trajecto-ries crossing that grid cell:
Cij =
(N∑
k=1
nijk
)−1
·
N∑k=1
Cknijk, (1)
whereCij is the averaged weighted AOD or AE value in the(i,j) grid cell,Ck is the AOD or AE value observed at the re-ceptor point on arrival ofkth trajectory,N is the total numberof trajectories, andnijk is the number of thekth-trajectoryend points in the (i,j) grid cell, i.e. the time spent in theij thcell by thekth trajectory. The denominator corresponds to(i,j) grid cell number density. In order to reduce the uncer-tainty caused by cells with few trajectory end points, an arbi-trary weight functionWij (Polissar et al., 1999) was applied:
www.atmos-chem-phys.net/14/11753/2014/ Atmos. Chem. Phys., 14, 11753–11773, 2014

11758 C. Guirado et al.: Aerosol characterization at the Saharan AERONET site Tamanrasset
Wij =
1.00 80< nij
0.70 20< nij ≤ 800.42 10< nij ≤ 200.05 nij ≤ 10
, (2)
wherenij is the number of trajectory end points that fall inthe (i,j) grid cell.
Three-dimensional 5-day back trajectories were calculatedwith a 1-hour time resolution using the Hybrid Single Parti-cle Lagrangian Integrated Trajectory Model (HYSPLIT) ver-sion 4.0 (Draxler and Hess, 1998). The end point was setat Tamanrasset (22.790◦ N, 5.530◦ E), and back trajectorieswere calculated at ground level, 2600 and 5600 m aboveground level (a.g.l.) for each day in the period 2006–2009 at12:00 UTC with wind fields from the GDAS meteorologicaldata set. The vertical model velocity was taken into account.
TheCij ·Wij values in the geographical domain longitude(30◦ W, 30◦ E) and latitude (5◦ N, 50◦ N) were mapped sep-arately for the dry and the wet seasons and for back trajecto-ries ending at the three levels mentioned above. These mapswere examined to identify potential source areas or pathwaysof polluted air masses. The CWT method is able to distin-guish major sources from moderate ones (Hsu et al., 2003).
Besides the CWT analysis, potential source contributionfunction (PSCF) maps (Ashbaugh et al., 1985) were also ob-tained in order to identify the direction and sources of airmasses causing high AOD and AE values at Tamanrasset.The PSCF method estimates the conditional probability ofeach pixel of the geographical domain being a source loca-tion, using back trajectories arriving at the study site. The re-sults are plotted on a map describing the spatial distributionof potential source regions. We used the same back trajecto-ries, AOD and AE values and the arbitrary weight function,Eq. (2), for both the PSCF and CWT methods. Our resultingPSCF maps are in good agreement with those from CWT. Weonly show CWT results because they provided the same in-formation on potential source locations plus additional infor-mation on the intensity of the sources, as already mentioned.
3 Results and discussion
3.1 Aerosol and precipitable water vapourcharacterization
3.1.1 Aerosol temporal evolution and statistics
From October 2006 to February 2009, a total of 31 800cloud-free valid AOD observations from 790 days (92 % ofthe days in the period) are available. After the KCICLO cor-rection, AOD and AE values are globally lower (around 8 and17 %, respectively) than the time series shown by Guiradoet al. (2011). The AOD, AE and FMF monthly statistics arepresented in Fig. 3a, b, and c, respectively. AOD remains sta-
Figure 3. Monthly box-and-whisker plot of daily(a) AOD at440 nm,(b) AE in the range 440–870 nm, and(c)FMF at 500 nm forthe study period at Tamanrasset. Open dots are mean values; greyshaded area indicates the range of values between the mean plus orminus the standard deviation; boxes show 25th, median and 75thpercentiles; and whiskers extend from each end of the box to themost extreme values within 1.5 times the interquartile range. AOD,AE and FMF are dimensionless parameters.
ble around 0.1 from November to February (absolute mini-mum of 0.07 in January). Conversely, AOD exceeds 0.3 fromApril to September reaching an absolute maximum of 0.43 inJune (Fig. 3a, Table 3). High AOD variability (standard de-viation > 0.30) is observed for high monthly AOD records(from April to August except May) while the lower variabil-ity (standard deviation around 0.10) coincides with the lowerAOD observations (from November to January). During theperiod analysed, March and October act as transition monthsbetween the two main seasons. Similar results were reportedby Kim et al. (2011) from a different approach. Their analy-sis was limited to “dust aerosol” properties by selecting datawith large AOD (≥0.4) and very low AE (≤0.2). Accord-ing to these criteria, non dust aerosols were identified fromNovember to February at the Tamanrasset station.
Atmos. Chem. Phys., 14, 11753–11773, 2014 www.atmos-chem-phys.net/14/11753/2014/

C. Guirado et al.: Aerosol characterization at the Saharan AERONET site Tamanrasset 11759
Table 3.Monthly means of AOD, AE, and PWV for the period October 2006 to February 2009 at Tamanrasseta.
Month AOD (440 nm)b AE (440–670–870 nm)b PWV (cm) No. of days
January 0.07 (0.08) 0.69 (0.25) 0.37 (0.16) 93February 0.12 (0.15) 0.49 (0.23) 0.48 (0.23) 66March 0.23 (0.22) 0.31 (0.17) 0.57 (0.37) 62April 0.40 (0.39) 0.19 (0.11) 0.64 (0.29) 60May 0.37 (0.22) 0.15 (0.08) 0.99 (0.29) 62June 0.43 (0.34) 0.17 (0.14) 0.97 (0.26) 60July 0.39 (0.32) 0.32 (0.20) 1.15 (0.24) 62August 0.41 (0.34) 0.44 (0.33) 1.39 (0.45) 62September 0.33 (0.24) 0.36 (0.20) 1.22 (0.32) 61October 0.20 (0.14) 0.41 (0.22) 1.01 (0.28) 93November 0.10 (0.06) 0.54 (0.21) 0.68 (0.24) 90December 0.09 (0.12) 0.72 (0.25) 0.49 (0.26) 93
a Corresponding standard deviations are shown in brackets.b Dimensionless.
The annual cycle of AE and FMF is the opposite of AOD(Fig. 3). The dry season is characterized by higher AE andFMF values, reaching a maximum in January (0.69 and 0.58,respectively) and December (0.72 and 0.57, respectively) anddecreasing until May (minimum of 0.15 and 0.24, respec-tively). A secondary maximum is observed in August withAE and FMF values of 0.44 and 0.38, respectively, associ-ated with a decrease of the coarse mode and a slight increaseof the fine mode. Such increase will be analysed in detail inSect. 3.3.
Concerning the pattern shown in Fig. 3, Cuesta etal. (2008) identified a marked seasonal evolution of atmo-spheric aerosol content and its optical properties linked tothe monsoon regime throughout 2006. Guirado et al. (2011)stated the clear and opposite seasonal cycle of AOD and AE,compared them with the CBL, and defined a dry-cool season(autumn and winter) and a wet-hot season (spring and sum-mer). The CBL, PWV, and corrected AOD and AE time se-ries are presented in Fig. 4. Daily mean AOD at 500 nm wasestimated (not shown for the sake of brevity). Relative differ-ences between AOD at 500 and 440 nm were mainly below0.01, except for AOD values above 0.1 that were sometimeshigher (0.04 as maximum). The dry-cool season is charac-terized by low AOD (∼ 0.09 at 440 nm), not very low AEvalues (∼ 0.62) and low PWV (∼ 0.51 cm). The wet-hot sea-son is characterized by higher mean AOD (∼ 0.39), lowerAE (∼ 0.28), and double the autumn–winter PWV values(∼ 1.06 cm). A statistical summary of the data series is givenin Table 4.
A strong and thick CBL drives the wet season (Fig. 4a).The properties of the transported air masses are a part ofthe atmospheric phenomena that have an influence on theevolution of the CBL height throughout the year (Cuesta etal., 2008). Moreover, this evolution is linked to the seasonalclimatic features at Tamanrasset, described at the end ofSect. 2.1. The wet season, affected by the monsoon regime,
Figure 4. Time series of(a) CBL height (metres above groundlevel) determined from the 12:00 UTC soundings (violet trian-gles) in Tamanrasset (reprinted from Guirado et al., 2011), andAERONET daily mean values of(b) PWV (mm), (c) AOD at440 nm, and(d) AE in the range 440–870 nm (refer to legend forcolour description). Solid lines correspond to 30-day moving aver-ages. AOD and AE are dimensionless parameters.
www.atmos-chem-phys.net/14/11753/2014/ Atmos. Chem. Phys., 14, 11753–11773, 2014

11760 C. Guirado et al.: Aerosol characterization at the Saharan AERONET site Tamanrasset
Table 4. Statistics of AOD, AE, and PWV from October 2006 toFebruary 2009 at Tamanrasseta.
AOD (440)b AE (440–670–870)b PWV (cm)
Dry season (342 days)
Mean 0.09 0.62 0.51SD 0.10 0.25 0.25Median 0.06 0.62 0.45Min. 0.01 0.08 0.06Max. 0.90 1.26 1.41
Wet season (367 days)
Mean 0.39 0.28 1.06SD 0.31 0.22 0.40Median 0.29 0.20 1.03Min. 0.04 0.01 0.22Max. 2.18 1.28 2.71
a Mean, standard deviation, median, minimum, maximum and number of days areshown for the dry season (November–February) and for the wet season(April–September). March and October are considered transition months.bDimensionless.
is characterized by strong and frequent mineral dust storms(Guirado et al., 2011) when the deep CBL favours the verticalmixing of lifted dust layers (Cuesta et al., 2009). In this pe-riod, the fully developed CBL (4–6 km a.g.l.) coincides withthe higher AOD and PWV records at Tamanrasset. On thecontrary, during the rest of the year the prevailing dry west-erly flow leads to a shallow CBL (1–2 km a.g.l.) with lowerAOD and PWV records. These results are in agreement withCuesta et al. (2008), who reported a summer season driven bya 5–6 km deep layer which evolved from a 1.5–2 km shallowlayer in winter during 2006.
Guirado et al. (2011) showed overall frequency histogramsof AOD and AE. Due to the observed seasonal pattern, fre-quency distributions of AOD and AE for the dry and wet sea-sons are shown in Fig. 5. AOD shows a unimodal positivelyskewed distribution for both seasons. The wet season modalvalue is 0.15 (but only 35 % of the data are below 0.15) whilethe dry season mode is narrower (90 % of the data are below0.15) and centred at 0.1. These features lead to a wider dis-tribution for the whole data set, centred at 0.1 and showing60 % of AOD data below 0.15 (Guirado et al., 2011), whatindicates a cleaner atmosphere than sites located in the Sahelwhere about 85 % of the AOD values are above 0.15 (Basartet al., 2009). This could be partly explained by the stationheight. On the contrary, AE shows a bimodal distribution forboth seasons. The dry season distribution is slightly bimodal(0.4 and 0.7 modal values) and symmetrical (mean and me-dian AE are equal as it can be seen in Table 4). Whereasthe AE in the wet season distribution is positively skewedshowing a narrowed first mode centred at 0.15 and a lesspronounced but wider second mode centred at 0.4 (whichcoincides with the modal value of the first mode of the dryseason).
Figure 5. Relative frequency (RF) and cumulative frequency (CF)of (a) AOD at 440 nm and(b) AE in the range 440–870 nm atTamanrasset. Histograms are shown separately for the dry and thewet seasons (refer to legend for colour and symbol description).AOD and AE are dimensionless parameters.
3.1.2 Aerosol classification
Guirado et al. (2011) used the graphical method proposedby Gobbi et al. (2007) to identify aerosol types at Taman-rasset. This method relies on the combined analysis of AE(440–870 nm) and its spectral curvature, represented by theÅngström exponent differenceδAE = AE(440–670nm) −
AE(670–870nm). These coordinates are linked to FMF (%)and aerosol fine mode size (µm) (Fig. 6) by reference pointscorresponding to bimodal size distributions of spherical par-ticles which have been determined using the Mie theory onthe basis of the typical refractive index of urban/industrialaerosol (m = 1.4−0.001i). The assumption of spherical par-ticles is not expected to significantly impact the results(Gobbi et al., 2007). Regarding the sensitivity of the graph-ical method to the refractive index, the level of indetermi-nation is of the order of± 25 % for aerosol fine mode ra-dius (Rf) and ± 10% for FMF computed both for refrac-tive index varying betweenm = 1.33−0.000i (typical of wa-ter droplets) andm = 1.53− 0.003i (typical of mineral dustaerosols). This method was applied to AERONET level 2.0observations which verify AOD > 0.15. This limit was se-lected in order to avoid errors larger than∼ 30% in AE andδAE, as advised by Gobbi et al. (2007). Basart et al. (2009)applied this graphical methodology to track and characterize
Atmos. Chem. Phys., 14, 11753–11773, 2014 www.atmos-chem-phys.net/14/11753/2014/

C. Guirado et al.: Aerosol characterization at the Saharan AERONET site Tamanrasset 11761
Figure 6. Ångström exponent difference,δAE = AE(440,675) −
AE(675,870), as a function of AE and AOD (refer to legend forcolour and symbol description) at the Tamanrasset site (10 460 ob-servations) (reprinted from Guirado et al., 2011). Strong dust events(red rectangle) and a mixture of different aerosol types (green rect-angle) are indicated.δAE, AOD and AE are dimensionless parame-ters.
mixtures of pollution and mineral dust, confirming the ro-bustness of the method. Since∼ 95 % of AOD observationsduring the dry season are below 0.15 (Fig. 5a), the graph-ical method performed only for this period would not berepresentative. Thus, the same graph shown by Guirado etal. (2011), corresponding to the whole data set, was analysed.
The aerosol features at Tamanrasset (Fig. 6) are similar tothose found at other arid and desert areas, such as Banizom-bou or Saada, reported by Basart et al. (2009). Large varia-tions of AOD with AE almost inversely proportional to AODare shown, thus higher extinctions are linked to larger parti-cles. In addition,δAE is negative or slightly positive indicat-ing a large dominance of the one-particle mode. Typical pureSaharan dust conditions (red rectangle in Fig. 6) are charac-terized by high-extinction values (AOD > 0.7) with AE < 0.3andδAE < 0 that correspond to FMF < 40 % andRf ∼ 0.3 µm.Aerosols presenting higher AOD (up to 0.4) than expectedfor AE values ranging between 0.6 and 1.1 are observed in8.7 % of the cases (green rectangle in Fig. 6). They are char-acterized by variableδAE, FMF andRf ranging between−0.3 and 0.2, 30 and 70 %, and 0.10 and 0.20 µm, respec-tively. This pattern can be associated with a mixture of min-eral dust and smaller particles of another origin (Basart etal., 2009) and is observed during summer. Biomass burningfine particles are discarded because they are emitted in wintertime in the Sahel region. Thus, fine particles may have an ur-ban or industrial origin as indicated by Guirado et al. (2011).This will be discussed in Sect. 3.3.
3.1.3 Aerosol microphysics
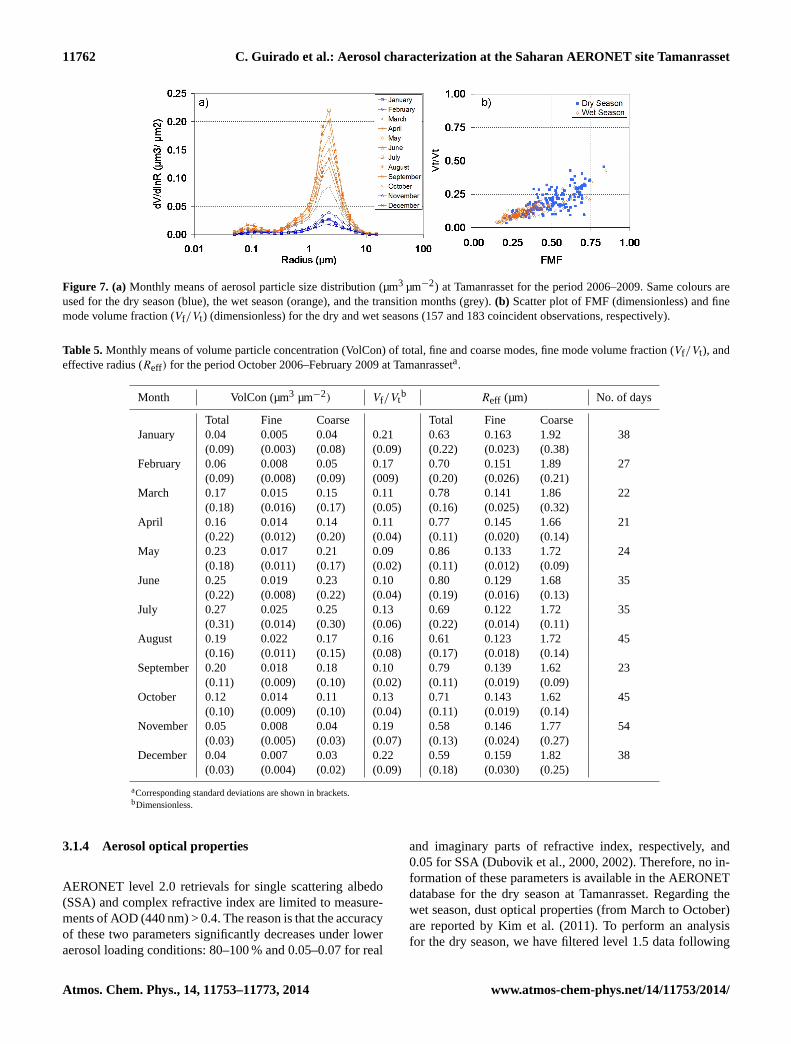
Multiannual monthly means of particle size distribution andvolume concentration have been analysed for the period2006–2009 (Fig. 7a, Table 5). A slight bimodality is observedwith a strong predominance of coarse mode and a quite stablecoarse-modal geometrical radius throughout the year withvalues of around 2.24 µm. This value is within the radius in-terval (1–3.5 µm) of maximum aerosol volume distributionsreported by Ryder et al. (2013) in their comparison of aircraftcampaigns performed in the central Sahara since 2000. At2.24 µm, the coarse mode volume concentration is lower dur-ing the dry season (∼ 0.03 µm3 µm−2 in December), whenminimum AOD values are recorded, and then starts to growpeaking in July (∼ 0.25 µm3 µm−2). Standard deviations areof the same order as mean values (Table 5) indicating highvariability of daily measurements. The fine mode concentra-tion shows the same seasonal pattern as the coarse mode butwith values decreased by a factor of∼ 10 (wet season) and∼ 6 (dry season). The presence of both submicron and coarsemodes throughout the year was also observed by Cuesta etal. (2008) through the analysis of in situ aerosol size dis-tributions at Tamanrasset in 2006. They reported variabilitybetween the two modes lower than 10–15 % regardless of theseason.
Daily fine mode volume fraction (Vf/Vt) ranges between0.03 and 0.46 (Fig. 7b) showing the dominance of the coarsemode. However, as it was discussed about FMF in Sect. 3.1.1and 3.1.2, fine or coarse particles dominate the contributionto total AOD depending on the season. The relationship be-tween these two fine mode quantitative parameters is shownin Fig. 7b. During the dry season, FMF andVf/Vt are roughlylinearly related. During the wet season, coarse particles dom-inate in terms of both optical depth and volume concentra-tion. However, few measurements meeting FMF > 0.5 andVf/Vt > 0.25 are found in the wet season and most of themare linked to the fine aerosol presence analysed in Sect. 3.3.
Total effective radius follows an expected opposite sea-sonal pattern to AE, showing (Table 5) a maximum in May(0.86 µm), a minimum in November–December (∼ 0.58 µm)and a secondary minimum in August (0.61 µm). Regard-ing fine mode effective radius, it reaches a maximum dur-ing the dry season (∼ 0.16 µm in January and December)and decreases toward the lowest values in July and August(∼ 0.12 µm), a seasonal trend nearly the opposite of AOD.Similarly, the coarse mode effective radius shows the high-est mean value in January (1.92 µm) and appears to be al-most stable during the wet season ranging between 1.62 and1.72 µm. This last result, coarse mode effective radius de-creasing for higher coarse mode concentrations under desertdust conditions (Table 5), has been previously reported andlinked to a practically monomodal volume particle size dis-tribution (e.g. Prats et al., 2011, and references therein).
www.atmos-chem-phys.net/14/11753/2014/ Atmos. Chem. Phys., 14, 11753–11773, 2014
11762 C. Guirado et al.: Aerosol characterization at the Saharan AERONET site Tamanrasset
Figure 7. (a) Monthly means of aerosol particle size distribution (µm3 µm−2) at Tamanrasset for the period 2006–2009. Same colours areused for the dry season (blue), the wet season (orange), and the transition months (grey).(b) Scatter plot of FMF (dimensionless) and finemode volume fraction (Vf/Vt) (dimensionless) for the dry and wet seasons (157 and 183 coincident observations, respectively).
Table 5.Monthly means of volume particle concentration (VolCon) of total, fine and coarse modes, fine mode volume fraction (Vf/Vt), andeffective radius (Reff) for the period October 2006–February 2009 at Tamanrasseta.
Month VolCon (µm3 µm−2) Vf/Vtb Reff (µm) No. of days
Total Fine Coarse Total Fine CoarseJanuary 0.04
(0.09)0.005(0.003)
0.04(0.08)
0.21(0.09)
0.63(0.22)
0.163(0.023)
1.92(0.38)
38
February 0.06(0.09)
0.008(0.008)
0.05(0.09)
0.17(009)
0.70(0.20)
0.151(0.026)
1.89(0.21)
27
March 0.17(0.18)
0.015(0.016)
0.15(0.17)
0.11(0.05)
0.78(0.16)
0.141(0.025)
1.86(0.32)
22
April 0.16(0.22)
0.014(0.012)
0.14(0.20)
0.11(0.04)
0.77(0.11)
0.145(0.020)
1.66(0.14)
21
May 0.23(0.18)
0.017(0.011)
0.21(0.17)
0.09(0.02)
0.86(0.11)
0.133(0.012)
1.72(0.09)
24
June 0.25(0.22)
0.019(0.008)
0.23(0.22)
0.10(0.04)
0.80(0.19)
0.129(0.016)
1.68(0.13)
35
July 0.27(0.31)
0.025(0.014)
0.25(0.30)
0.13(0.06)
0.69(0.22)
0.122(0.014)
1.72(0.11)
35
August 0.19(0.16)
0.022(0.011)
0.17(0.15)
0.16(0.08)
0.61(0.17)
0.123(0.018)
1.72(0.14)
45
September 0.20(0.11)
0.018(0.009)
0.18(0.10)
0.10(0.02)
0.79(0.11)
0.139(0.019)
1.62(0.09)
23
October 0.12(0.10)
0.014(0.009)
0.11(0.10)
0.13(0.04)
0.71(0.11)
0.143(0.019)
1.62(0.14)
45
November 0.05(0.03)
0.008(0.005)
0.04(0.03)
0.19(0.07)
0.58(0.13)
0.146(0.024)
1.77(0.27)
54
December 0.04(0.03)
0.007(0.004)
0.03(0.02)
0.22(0.09)
0.59(0.18)
0.159(0.030)
1.82(0.25)
38
aCorresponding standard deviations are shown in brackets.bDimensionless.
3.1.4 Aerosol optical properties
AERONET level 2.0 retrievals for single scattering albedo(SSA) and complex refractive index are limited to measure-ments of AOD (440 nm) > 0.4. The reason is that the accuracyof these two parameters significantly decreases under loweraerosol loading conditions: 80–100 % and 0.05–0.07 for real
and imaginary parts of refractive index, respectively, and0.05 for SSA (Dubovik et al., 2000, 2002). Therefore, no in-formation of these parameters is available in the AERONETdatabase for the dry season at Tamanrasset. Regarding thewet season, dust optical properties (from March to October)are reported by Kim et al. (2011). To perform an analysisfor the dry season, we have filtered level 1.5 data following
Atmos. Chem. Phys., 14, 11753–11773, 2014 www.atmos-chem-phys.net/14/11753/2014/
C. Guirado et al.: Aerosol characterization at the Saharan AERONET site Tamanrasset 11763
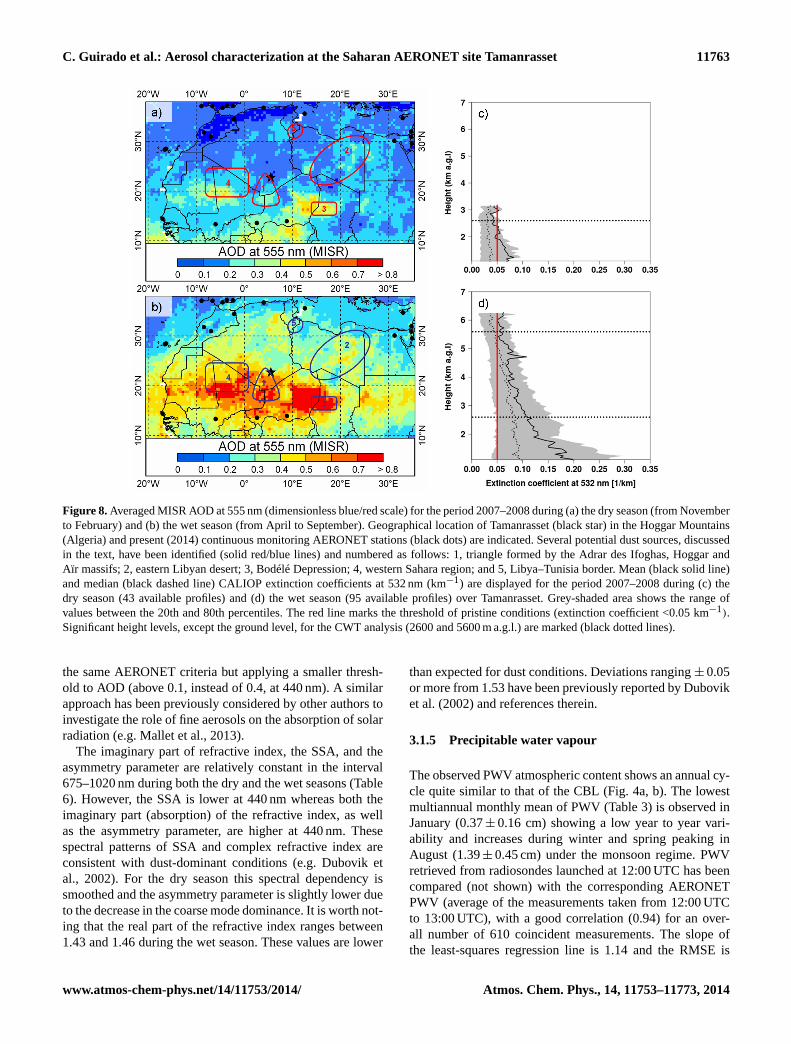
Figure 8.Averaged MISR AOD at 555 nm (dimensionless blue/red scale) for the period 2007–2008 during (a) the dry season (from Novemberto February) and (b) the wet season (from April to September). Geographical location of Tamanrasset (black star) in the Hoggar Mountains(Algeria) and present (2014) continuous monitoring AERONET stations (black dots) are indicated. Several potential dust sources, discussedin the text, have been identified (solid red/blue lines) and numbered as follows: 1, triangle formed by the Adrar des Ifoghas, Hoggar andAïr massifs; 2, eastern Libyan desert; 3, Bodélé Depression; 4, western Sahara region; and 5, Libya–Tunisia border. Mean (black solid line)and median (black dashed line) CALIOP extinction coefficients at 532 nm (km−1) are displayed for the period 2007–2008 during (c) thedry season (43 available profiles) and (d) the wet season (95 available profiles) over Tamanrasset. Grey-shaded area shows the range ofvalues between the 20th and 80th percentiles. The red line marks the threshold of pristine conditions (extinction coefficient <0.05 km−1).Significant height levels, except the ground level, for the CWT analysis (2600 and 5600 m a.g.l.) are marked (black dotted lines).
the same AERONET criteria but applying a smaller thresh-old to AOD (above 0.1, instead of 0.4, at 440 nm). A similarapproach has been previously considered by other authors toinvestigate the role of fine aerosols on the absorption of solarradiation (e.g. Mallet et al., 2013).
The imaginary part of refractive index, the SSA, and theasymmetry parameter are relatively constant in the interval675–1020 nm during both the dry and the wet seasons (Table6). However, the SSA is lower at 440 nm whereas both theimaginary part (absorption) of the refractive index, as wellas the asymmetry parameter, are higher at 440 nm. Thesespectral patterns of SSA and complex refractive index areconsistent with dust-dominant conditions (e.g. Dubovik etal., 2002). For the dry season this spectral dependency issmoothed and the asymmetry parameter is slightly lower dueto the decrease in the coarse mode dominance. It is worth not-ing that the real part of the refractive index ranges between1.43 and 1.46 during the wet season. These values are lower
than expected for dust conditions. Deviations ranging± 0.05or more from 1.53 have been previously reported by Duboviket al. (2002) and references therein.
3.1.5 Precipitable water vapour
The observed PWV atmospheric content shows an annual cy-cle quite similar to that of the CBL (Fig. 4a, b). The lowestmultiannual monthly mean of PWV (Table 3) is observed inJanuary (0.37± 0.16 cm) showing a low year to year vari-ability and increases during winter and spring peaking inAugust (1.39± 0.45 cm) under the monsoon regime. PWVretrieved from radiosondes launched at 12:00 UTC has beencompared (not shown) with the corresponding AERONETPWV (average of the measurements taken from 12:00 UTCto 13:00 UTC), with a good correlation (0.94) for an over-all number of 610 coincident measurements. The slope ofthe least-squares regression line is 1.14 and the RMSE is
www.atmos-chem-phys.net/14/11753/2014/ Atmos. Chem. Phys., 14, 11753–11773, 2014
11764 C. Guirado et al.: Aerosol characterization at the Saharan AERONET site Tamanrasset
Table 6. Seasonal means (dimensionless) of SSA, real and imaginary parts of the refractive index (Ref. index), and asymmetry parameter(Asym.) at 440, 675, 870 and 1020 nma. Number of daily available observations (N) is also indicated.
Wet Season Dry Season
440 675 870 1020 N 440 675 870 1020 N
SSAb 0.90(0.01)
0.96(0.01)
0.97(0.01)
0.98(0.01)
53 0.93(0.02)
0.95(0.02)
0.96(0.02)
0.96(0.02)
27
Real Ref.indexb
1.45(0.03)
1.47(0.02)
1.44(0.02)
1.43(0.02)
53 1.41(0.03)
1.42(0.03)
1.42(0.03)
1.42(0.03)
27
Imaginary Ref.indexb
0.004(0.001)
0.002(0.001)
0.002(0.001)
0.001(0.001)
53 0.004(0.001)
0.003(0.001)
0.003(0.001)
0.003(0.001)
27
Asym.c 0.76(0.03)
0.74(0.03)
0.74(0.02)
0.75(0.02)
183 0.75(0.03)
0.74(0.03)
0.73(0.03)
0.74(0.03)
157
a Corresponding standard deviations are shown in brackets.b Level 2.0 for the wet season and level 1.5 filtered for the dry season.c Level 2.0 for the wet and the dry season.
1.15 mm. These results are in good agreement with sim-ilar comparisons, such as that performed by Schneider etal. (2010), who reported a correlation of 0.96 between 675AERONET and radiosonde coincident measurements (1 houras temporal coincidence criterion) at the Izaña station.
3.2 Potential source regions
3.2.1 Concentration weighted trajectory analysis
Recently, several comprehensive reviews of potential dustsources in Northern Africa (e.g. Formenti et al., 2011; Gi-noux et al., 2012) have been provided. However, our goal isto identify the potential dust sources affecting the Tamanras-set station. This study has been performed through the anal-ysis of primary air mass pathways and their relationship withAERONET AOD and AE measurements at Tamanrasset.
CALIOP aerosol extinction profiles at 532 nm (Fig. 8c, d)have been analysed to link aerosol extinctions and air masspathways at certain heights. The 20th percentile of the extinc-tion in the wet season (Fig. 8d) has been selected as a thresh-old of pristine conditions. The features of the CBL top identi-fied from CALIOP agree quite well with those obtained fromthe radiosondes. Taking into account the averaged CALIOPprofiles, HYSPLIT back trajectories at several heights havebeen calculated for each day of the period 2007–2008. Theend-point heights of the back trajectories have been selectedaccording to the CBL top height during both the dry andthe wet seasons. The three selected height levels provide in-formation about air mass transport near the surface (groundlevel), at an intermediate layer (2600 m a.g.l.), which is justabove the CBL top in the dry season and within the CBLduring the wet season, as well as at 5600 m a.g.l., above theCBL (free troposphere) all year long (Figs. 4a, 8c, d). A firstcluster analysis was performed using thek-means clusteringalgorithm following the Jakob and Tselioudis (2003) proce-dure. However, no conclusive results were found due to the
variability of the cluster classification obtained for each sea-son (dry and wet) and for each altitude. For this reason theCWT method was applied to AOD and AE parameters.
Air mass back trajectories at 2600 and 5600 m a.g.l. showa westerly component in the dry season (Fig. 9c, d), drivenby the general circulation, since these levels correspond tothe free troposphere over the relatively low CBL top. Thedry season is characterized by low AOD and rather high AEassociated with short air mass back trajectories at groundlevel from the first quadrant (Fig. 9a, b). Dust source re-gions identified as 1 and 2 in Fig. 8 might potentially affectTamanrasset in this season. The region located in the triangleformed by Adrar des Ifoghas, Hoggar Mountains and the AïrMassif (dust source 1; Fig. 8), has been previously identified(D’Almeida, 1986; Prospero, 2002; Schepanski et al., 2009;Alonso-Pérez et al., 2012) as a Saharan dust source formedby a drainage system of ephemeral rivers and streams. Thissource is sensitive to the effects of mesoscale winds inten-sified by the orography (Ginoux et al., 2012). A second po-tential dust source (dust source 2; Fig. 8) extends from thenorthwest side of the Tibesti Mountains in Chad over theeastern Libyan Desert (D’Almeida, 1986; Caquineau et al.,2002; Prospero, 2002; Ginoux et al., 2012). This source isformed by a large basin with sand seas and the northern partis marked with a chain of wadis (and associated complexesof salt/dry lakes). It is active during much of the year but it isespecially intense in May–June.
In relation to AE (Fig. 9b), the highest values (smaller par-ticles) are found around Tamanrasset. It could be the resultof a mixture of desert dust and local pollution produced bycooking and heating bonfires with firewood, common in thisregion, which is not well dispersed by the low-level atmo-spheric circulation. The potential influence of biomass burn-ing from the Sahel region to Tamanrasset during the dry sea-son can be considered as nonexistent according to the CWTanalysis.
Atmos. Chem. Phys., 14, 11753–11773, 2014 www.atmos-chem-phys.net/14/11753/2014/

C. Guirado et al.: Aerosol characterization at the Saharan AERONET site Tamanrasset 11765
Figure 9.CWT maps at ground level for (a) AOD and (b) AE, and HYSPLIT back trajectories ending at (c) 2600 and (d) 5600 m a.g.l. duringthe dry season (from November to February). Refer to dimensionless white/red scales for colour description of AOD and AE. Tamanrassetis located at the intersection of the four quadrants.
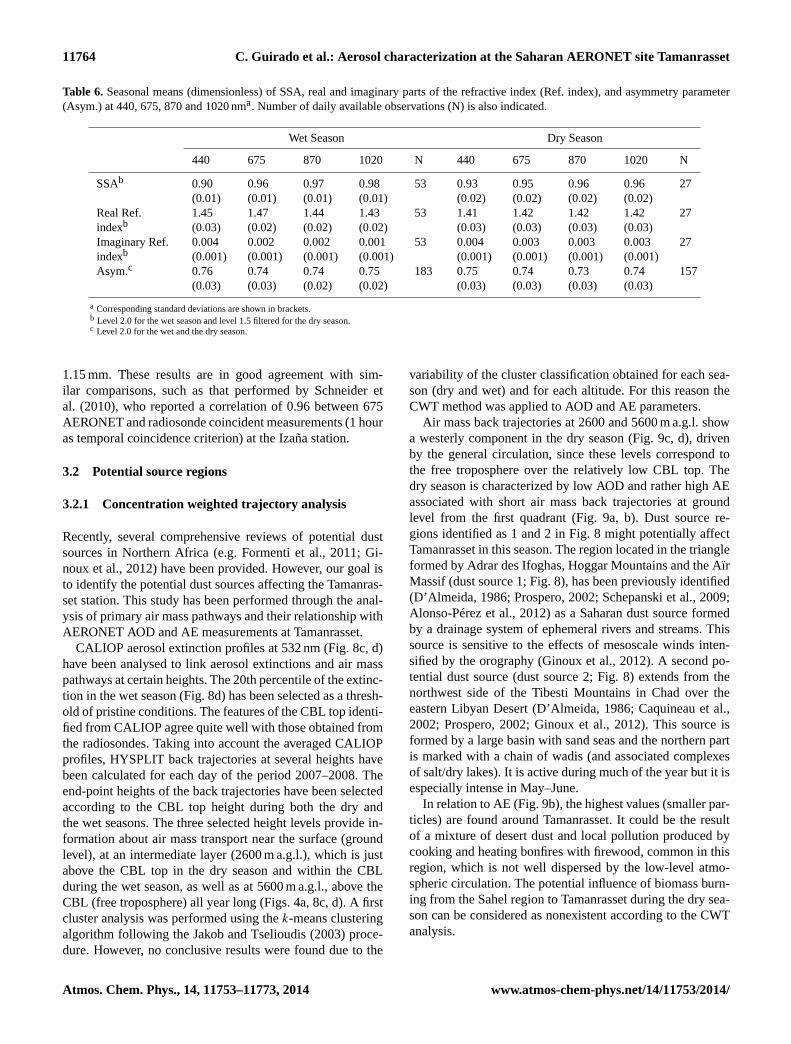
In the wet season, only the 5600 m a.g.l. level is over thetop of a high CBL typical of summertime, showing mainlywesterly trajectories (Fig. 10e). CWT analysis for AOD andAE at ground and 2600 m a.g.l. levels give similar resultssuggesting a well-mixed CBL in this season. AOD and AECWT plots at ground level and 2600 m a.g.l. (Fig. 10a–d)show a curved dust pathway with relatively high values ofAE (smaller particles) from northern central Libya passingover dust sources 1 and 2 as occurs in the dry season. Asecond curved dust pathway from the Libya–Tunisia bor-der (Caquineau et al., 2002) (dust source 5; Fig. 8) is ob-served to transport larger particles (low AE) to Tamanrassetat ground level. A few air mass trajectories originate from thewest passing over the large dust source 4 (Fig. 8) located innorthern Mali, northern Mauritania and the western flanks ofthe Hoggar Mountains (Prospero, 2002; Brooks and Legrand,2003, Alonso-Pérez et al., 2012). It is a complex distributionof dust sources with extensive dune systems that are particu-larly active from April to September.
Regarding one of the most significant dust sources in theworld, the Bodélé Depression (Goudi and Middleton, 2001;Prospero, 2002; Brooks and Legrand, 2003) (dust source 3,Fig. 8), CWT analysis shows that it is a minor dust sourceaffecting Tamanrasset.
3.2.2 Mesoscale convective system analysis
Mesoscale weather systems (dry boundary layer convection,“haboob” dust storms, nocturnal low-level jets, and southerlymonsoon flow) influence dust emission, transport, and depo-sition over the central western Sahara (Marsham et al., 2008,2013; Knippertz and Todd, 2010, 2012; Ashpole and Wash-ington, 2013). During 2006, Cuesta et al. (2008) observedseveral summertime dust transport events over Tamanras-set associated with MCSs (mesoscale convective systems).However, MCSs cannot be well captured by global meteo-rological models or regional dust models (Marsham et al.,2011; Heinold et al., 2013) nor by the HYSPLIT back-trajectory parameterization. Consequently, we performed anadditional analysis to identify the influence of MCSs on dusttransport events over Tamanrasset.
We have analysed 21 episodes of MCSs that have beenselected through comparison between observed AERONETAOD and NMMB/BSC-Dust model AOD over Taman-rasset in the period 2007–2008 (Fig. 11). The simula-tion of the Non-hydrostatic Multiscale Model (NMMB)Barcelona Supercomputing Center (BSC) v1 is generatedusing the National Center for Environmental Prediction(NCEP) reanalysis-2 (1◦ grid) and initial and boundary con-ditions from the Global Land Data Assimilation System(GLDAS). The resolution is set at 0.5◦ in the horizontal
www.atmos-chem-phys.net/14/11753/2014/ Atmos. Chem. Phys., 14, 11753–11773, 2014
11766 C. Guirado et al.: Aerosol characterization at the Saharan AERONET site Tamanrasset
Figure 10.CWT maps for AOD and AE at (a and b) ground level and (c and d) 2600 m a.g.l., and (e) HYSPLIT back trajectories ending at5600 m a.g.l., during the wet season (from April to September). Refer to dimensionless white/red scales for colour description of AOD andAE. Tamanrasset is located at the intersection of the four quadrants.
and to 40 hybrid sigma-pressure model layers in the verti-cal. A detailed description of the model is provided by Pérezet al. (2011). The NMMB/BSC-Dust model properly repro-duces dust transport associated with synoptic-scale meteoro-logical processes observed during most of the year (Fig. 11).However, from June to September, although the AOD trend iswell reproduced, the model is not capable of capturing strongand fast dust outbreaks associated with MCSs. The summer-time observation-model AOD discrepancies have been usedto identify the potential MCSs affecting Tamanrasset. Theconvective origin of each event has been evaluated by usinghigh temporal and spatial RGB (red, green, blue) dust com-posites from the Meteosat Second Generation-Spinning En-hanced Visible and Infrared Imager (MSG-SEVIRI) sensorcombined with European Centre for Medium-range Weather
Forecasts (ECMWF) ERA-Interim reanalysis data from theIFS-Cy31r model analysis. Satellite information and mete-orological data were jointly computed and visualized withMcIDAS (Man computer Interactive Data Access System)software.
Once we have identified and confirmed all the MCS eventsimpacting Tamanrasset, the Moderate Resolution ImagingSpectroradiometers (MODIS) Deep Blue 550 nm AOD re-trieval has been used in a similar approach to Roberts (2014)and Roberts et al. (2014). The advantage of the MODISDeep Blue aerosol retrieval algorithm regarding other satel-lite products over bright surfaces in the visible (such asdeserts) is that the former employs radiances from the bluechannels where the surface reflectance is relatively low (Hsuet al., 2004; 2006). The MODIS Deep Blue composite AOD
Atmos. Chem. Phys., 14, 11753–11773, 2014 www.atmos-chem-phys.net/14/11753/2014/

C. Guirado et al.: Aerosol characterization at the Saharan AERONET site Tamanrasset 11767
Figure 11. AERONET (green dots) and NMMB/BSC-Dust (blackdots) AOD daily mean values for the period 2007–2008.
and AOD anomaly (calculated over the 2007–2008 summer-time mean value) have been analysed to identify dust upliftsources associated with the 21 daily episodes of maximumAOD driven by MCS events (Fig. 12).
Several regions with high AOD, including the surroundingarea of Tamanrasset, are shown in the MODIS Deep Blueaveraged AOD map (Fig. 12a). However, a strong positiveAOD anomaly (above 0.20) is only shown south of Taman-rasset (Fig. 12b), matching with dust source 1 and surround-ings (Fig. 8), as a consequence of the presence of MCSs inthis area modulated by northward displacement of the in-tertropical discontinuity (ITD). The HYSPLIT back trajec-tories show that air flow arriving to Tamanrasset during theseevents comes from the positive AOD anomaly region southof Tamanrasset. Simultaneously, a negative AOD anomalyobserved over eastern Mali is likely caused by rainfall asso-ciated with MCSs, since on previous days to those in whicha model-observation AOD anomaly is observed, the nega-tive AOD anomaly is located further to the east, in Niger(Fig. 12c). These results are in good agreement with Roberts(2014) and Roberts et al. (2014), who analysed 31 anoma-lously rainy episodes in the Sahara and northern Sahel linkedto dust uplift in the area.
3.3 Case study: anthropogenic aerosols
Evidence of the arrival of fine particles to Tamanrasset dur-ing summer has been observed, in agreement with Cuesta etal. (2008) and Guirado et al. (2011). The former reported asmall but non-negligible contribution of fine particles to thetotal AOD throughout 2006. The multiannual monthly meansof AE and FMF (Fig. 3) show a local maximum in August,i.e. a decrease of the coarse mode and a slight increase of thefine mode. In addition, a mixture of fine aerosols and mineraldust has been identified mainly in July, August and Septem-ber (Fig. 6). The potential sources of these fine particles areindicated by the CWT maps for AE (Fig. 10b, d) showing
smaller particles arriving at Tamanrasset primarily from cen-tral Libya through a well-defined transport pathway.
Frequent mixing of particulate pollutants with desert dustin the Saharan Air Layer (SAL) was reported by Rodríguezet al. (2011). In the Izaña GAW observatory (Tenerife), theyobserved that dust exported from North Africa to the NorthAtlantic was mixed with fine nitrate and ammonium sulphateparticles linked to emissions from oil refineries and powerplants in Algeria, Morocco and Tunisia. The CWT maps(Fig. 10) indicate Libya and Algeria as sources of the pol-lutants affecting Tamanrasset. Industrial activities in thesecountries were identified using the Defense MeteorologicalSatellite Program (DMSP) night-time light product (Elvidgeet al., 1997). The DMSP Operational Linescan System (OLS)has the capability to derive night-time lights of the worlddata sets and distinguish four primary types of lights: humansettlements such as cities, towns, and villages (white), fires(red), gas flares (green), and heavily lit fishing boats (blue).Green light areas (Fig. 13) identified the location of gas flares(i.e. oil wells, refineries, or chemical plants) in Algeria andLibya.
The residence time index (Alonso-Pérez et al., 2007) ac-counts for the percentage of time that an air parcel remainedover a horizontal grid cell defined in a geographical domainbefore reaching a receptor site at a predefined altitude range.This index has been used to select several case studies offine aerosol transport to Tamanrasset from some regions ofLibya and Algeria, as suggested by Guirado et al. (2011).Residence time has been computed for these predefined re-gions from 5-day HYSPLIT back trajectories at ground leveland 2600 m a.g.l. end-point altitudes.
Nine days in July, August and September 2007 and Au-gust 2008 characterized by daily mean AE above 0.70 havebeen displayed in Fig. 13. Most of the trajectories both atground level and 2600 m a.g.l. cross the western part of thenorthern Libyan gas flare zone and the industries locatedin the southwest. These trajectories are up to 32 % of thetime over the predefined Libyan zone. They are character-ized by higher AE (∼ 0.90) than the average correspondingto the wet season (AE∼ 0.28). On 29 August 2008 the backtrajectory arriving at Tamanrasset at 2600 m a.g.l. shows airmass transport over the Algerian gas flares with AE∼ 0.73(Fig. 13). It should be noted that optical properties of anthro-pogenic aerosols show significant variability depending ondifferent factors (Dubovik et al., 2002). In spite of this, avail-able filtered level 1.5 optical properties for the nine eventshave been analysed (not shown). Two different patterns havebeen identified. On the one hand, a slight decrease in SSAand smaller differences between SSA at 440 nm and at the675–1020 nm interval have been observed, indicating thepresence of other absorbing particles apart from dust, suchas organic or elemental carbon. On the other hand, severalevents in August 2008 show slight SSA spectral dependencyand values around∼ 0.96 (whereas the August mean valueis around 0.89) indicating the presence of sulphate and/or
www.atmos-chem-phys.net/14/11753/2014/ Atmos. Chem. Phys., 14, 11753–11773, 2014

11768 C. Guirado et al.: Aerosol characterization at the Saharan AERONET site Tamanrasset
Figure 12. Composite MODIS Deep Blue 550 nm (a) AOD and AOD-averaged anomaly corresponding (b) to the 21 days of maximum(Dmax) AOD at Tamanrasset during MCS events, and (c) to the previous day for each maximum AOD event (Dmax -1). The Tamanrassetstation is marked with a black star. Two-day HYSPLIT back trajectories arriving at Tamanrasset at ground level (black solid lines) are alsodisplayed in panel (a).
nitrate aerosols. These results agree with the Rodríguez etal. (2011) observations.
4 Summary and conclusions
Tamanrasset is a strategic site for aerosol research placed inthe heart of the Sahara. An aerosol characterization at thissite has been provided based on more than 2 years (October2006–February 2009) of AERONET level 2.0 and KCICLO-corrected Cimel sun photometer measurements. The top ofthe CBL over Tamanrasset has been characterized by bothradiosonde data and CALIOP extinction vertical profiles. Astrong seasonal cycle linked to the CBL is observed. Thedry-cool season (November–February) is characterized by ashallow CBL, low AOD (∼ 0.09 at 440 nm), moderate-lowAE values (∼ 0.62) and low PWV (∼ 0.51 cm). The wet-hotseason (April–September) is characterized by a deep CBL,higher AOD (∼ 0.39 at 440 nm), low AE (∼ 0.28) and higherPWV (∼ 1.06 cm) and it is affected by strong and frequentdust storms. March and October are considered transition
months. The AOD shows the same but opposite seasonalcycle to the AE and FMF. AOD remains stable around 0.1from November to February but exceeds 0.3 from April toSeptember, reaching an absolute maximum of 0.43 in June.The maximum AE and FMF observations are reached in De-cember (0.72 and 0.57, respectively) and January (0.69 and0.58, respectively), tending to decrease until May (minimumof 0.15 and 0.25, respectively). Minimum PWV is recordedin January (0.37± 0.16 cm) whereas maximum values arereached in August (1.39± 0.45 cm) linked to the monsoonregime.
Coarse mode (modal radius around 2.24 µm) prevails overthe fine mode (modal radius around 0.10 µm) showing lowervolume concentrations during the dry season and maxima inJuly. Spectral patterns of SSA and complex refractive indexalso indicate coarse mode dominance conditions. However,FMF and fine mode volume fraction show values correspond-ing to fine mode dominance in terms of optical depth, andcoarse mode dominance in terms of volume concentrationduring the dry season. In addition, around 60 % of the AOD
Atmos. Chem. Phys., 14, 11753–11773, 2014 www.atmos-chem-phys.net/14/11753/2014/

C. Guirado et al.: Aerosol characterization at the Saharan AERONET site Tamanrasset 11769
Figure 13. HYSPLIT back trajectories arriving at Tamanrasset (blue pin) at ground level (red lines) and 2600 m a.g.l. (yellow lines) aredisplayed for several case studies. DMSP night-time lights (shown as background) identify gas flares (green colour).
measurements are below 0.15, showing a cleaner atmospherethan sites located in the Sahel. The AE dry season distribu-tion is slightly bimodal (0.4 and 0.7 modal values) and sym-metrical, indicating a similar frequency for the two differ-ent particle populations (desert dust and background condi-tions). During the wet season AE shows two clear modes, anarrowed first mode centred at 0.15 (high dust events) anda smaller but wider mode centred at 0.4 (background condi-tions).
The aerosol-type characterization at Tamanrasset indicatesdesert mineral dust is the prevailing aerosol. Higher extinc-tions linked to larger particles and dominance of the one-particle mode have been identified by the observation oflarge variations of AOD, AE almost inversely proportionalto AOD, and the Ångström exponent difference (δAE), neg-ative or slightly positive. Moreover, typical pure Saharandust conditions have been observed, i.e. high-extinction val-ues (AOD > 0.7) with AE < 0.3 andδAE < 0 correspondingto FMF < 40 % and fine mode radius (Rf) of around 0.3 µm.However, an anthropogenic fine mode contribution has beenfound mixed with mineral dust (8.7% of total cases), i.e.AOD of up to 0.4 for AE values ranging between 0.6 and 1.1andδAE, FMF andRf between−0.3 and 0.2, 30 and 70 %,and 0.10 and 0.20 µm, respectively.
Potential sources of the air masses arriving at Tamanras-set have been identified: the triangle formed by Adrar desIfoghas, Hoggar Mountains and Aïr Massif; a complex dis-tribution of dust sources including northern Mali, northernMauritania and the western flanks of the Hoggar Mountains;and the eastern Libyan Desert. However, the Bodélé Depres-sion has been found to be a minor potential source at Taman-
rasset. Dust uplift sources associated with summertime MCSevents located south of Tamanrasset have been also identi-fied.
Evidence of the arrival of fine particles to Tamanrasset dur-ing summer has been detected and nine events of polluted airmasses coming from urban/industrial areas in Libya and Al-geria have been shown.
Acknowledgements.The AERONET sun photometer at Tamanras-set has been calibrated within AERONET-EUROPE TNA supportedby the PHOTONS and RIMA networks and partially financed bythe European Community – Research Infrastructure Action underthe Seventh Framework Programme (FP7/2007-2013) “Capacities”specific programme for Integrating Activities, ACTRIS grantagreement no. 262254. The authors gratefully acknowledge theNOAA Air Resources Laboratory (ARL) for the provision of theHYSPLIT transport and dispersion model and READY website(http://ready.arl.noaa.gov) used in this publication. We also thankGoogle Earth™. Financial support from the Spanish MINECO(projects CGL2011-23413, CGL2012-33576 and CGL2012-37505)is also gratefully acknowledged. We are particularly grateful tothe Tamanrasset Global Atmospheric Watch (GAW) station’s staff(l’Office National de la Météorologie, Algeria) for supporting themeasurement program. J. M. Baldasano and S. Basart acknowledgethe Supercomputación y eCiencia project (CSD2007-0050) fromthe Consolider-Ingenio 2010 and Severo Ochoa (SEV-2011-00067)programs of the Spanish Government. We also acknowledge ourcolleague Dr. Celia Milford for improving the English language ofthe manuscript.
Edited by: W. Lahoz
www.atmos-chem-phys.net/14/11753/2014/ Atmos. Chem. Phys., 14, 11753–11773, 2014

11770 C. Guirado et al.: Aerosol characterization at the Saharan AERONET site Tamanrasset
References
Alonso-Pérez, S., Cuevas, E., Querol, X., Viana, M., andGuerra, J. C.: Impact of the Saharan dust outbreaks onthe ambient levels of total suspended particles (TSP) inthe Marine Boundary Layer (MBL) of the Subtropical East-ern North Atlantic Ocean, Atmos. Environ., 41, 9468–9480,doi:10.1016/j.atmosenv.2007.08.049, 2007.
Alonso-Pérez, S., Cuevas, E., Querol, X., Guerra, J. C.,and Pérez, C.: African dust source regions for observeddust outbreaks over the Subtropical Eastern North At-lantic region above 25◦ N, J. Arid Environ., 78, 100–109,doi:10.1016/j.jaridenv.2011.11.013, 2012.
Ångström, A.: On the atmospheric transmission of sun radiation andon dust in the air, Geogr. Ann., 2, 156–166, 1929.
Ashbaugh, L. L., Malm, W. C., and Sadeh, W. D.: A residence timeprobability analysis of sulfur concentrations at Grand CanyonNational Park, Atmos. Environ., 19, 1263–1270, 1985.
Ashpole, I. and Washington, R.: Intraseasonal variability and atmo-spheric controls on daily dust occurrence frequency over the cen-tral and western Sahara during the boreal summer, J. Geophys.Res. Atmos., 118, 12915–12926, doi:10.1002/2013JD020267,2013.
Barreto, A., Cuevas, E., Pallé, P., Romero, P.M., Almansa, F., andWehrli, C.: Recovering Long-term Aerosol Optical Depth Series(1976–2012) from an Astronomical Potassium-based ResonanceScattering Spectrometer, Atmos. Meas. Tech. Discuss., 7, 4093–4121, doi:10.5194/amtd-7-4093-2014, 2014.
Basart, S., Pérez, C., Cuevas, E., Baldasano, J. M., and Gobbi, G. P.:Aerosol characterization in Northern Africa, Northeastern At-lantic, Mediterranean Basin and Middle East from direct-sunAERONET observations, Atmos. Chem. Phys., 9, 8265–8282,doi:10.5194/acp-9-8265-2009, 2009.
Bou Karam, D., Flamant, C., Knippertz, P., Reitebuch, O., Pelon, J.,Chong, M., and Dabas, A.: Dust emissions over the Sahel asso-ciated with the West African monsoon intertropical discontinuityregion: a representative case-study, Q. J. Roy. Meteor. Soc., 134,621–634, doi:10.1002/qj.244, 2008.
Brooks, N. and Legrand, M.: Dust variability over northern Africaand rainfall in the Sahel, in: Linking Climate Change to LandSurface Change, edited by: McLaren, S. J. and Kniverton, D. R.,Kluwer Academic Publishers, Dordrecht, Netherlands, 1–25,2003.
Cachorro, V. E., Romero, P. M., Toledano, C., Cuevas, E., andde Frutos, A. M.: The fictitious diurnal cycle of aerosol op-tical depth: a new approach for in situ calibration and cor-rection of AOD data series, Geophys. Res. Lett., 31, L12106,doi:10.1029/2004GL019651, 2004.
Cachorro, V. E., Toledano, C., Berjón, A., de Frutos, A. M.,Torres, B., Sorribas, M., and Laulainen, N. S.: An “insitu” calibration correction procedure (KCICLO) based onAOD diurnal cycle: application to AERONET–El Arenosillo(Spain) AOD data series, J. Geophys. Res., 113, D12205,doi:10.1029/2007JD009673, 2008a.
Cachorro, V. E., Toledano, C, Sorribas, M., Berjón, A., de Fru-tos, A. M., and Laulainen, N.: An “in situ” calibration-correctionprocedure (KCICLO) based on AOD diurnal cycle: comparativeresults between AERONET and reprocessed (KCICLO method)AOD-alpha data series at El Arenosillo, Spain, J. Geophys. Res.,113, D02207, doi:10.1029/2007JD009001, 2008b.
Caquineau, S., Gaudichet, A., Gomes, L., and Legrand, M.: Min-eralogy of Saharan dust transported over northwestern tropicalAtlantic Ocean in relation to source regions, J. Geophys. Res.,107, AAC 4-1–AAC 4-12, doi:10.1029/2000JD000247, 2002.
Cuesta, J., Edouart, D., Mimouni, M., Flamant, P. H., Loth, C.,Gibert, F., Marnas, F., Bouklila, A., Kharef, M., Ouchene, B.,Kadi, M., and Flamant, C.: Multiplatform observations of theseasonal evolution of the Saharan atmospheric boundary layer inTamanrasset, Algeria, in the framework of the African MonsoonMultidisciplinary Analysis field campaign conducted in 2006,J. Geophys. Res., 113, D00C07, doi:10.1029/2007JD009417,2008.
Cuesta, J., Marsham, J. H., Parker, D. J., and Flamant, C.: Dynami-cal mechanisms controlling the vertical redistribution of dust andthe thermodynamic structure of the West Saharan atmosphericboundary layer during summer, Atmos. Sci. Lett., 10, 34–42,doi:10.1002/asl.207, 2009.
Cuesta, J., Lavaysse, C., Flamant, C., Mimouni, M., and Knip-pertz, P.: Northward bursts of the West African monsoon leadingto rainfall over the Hoggar Massif, Algeria, Q. J. Roy. Meteor.Soc., 136, 174–189, doi:10.1002/qj.439, 2010.
D’Almeida, G. A.: A model for Saharan dust transport, J. Clim.Appl. Meteorol., 25, 903–916, 1986.
D’Almeida, G. A.: On the variability of desert aerosol radiativecharacteristics, J. Geophys. Res., 92, 3017–3026, 1987.
D’Almeida, G. A. and Schütz, L.: Number, mass and volume dis-tributions of mineral aerosols and soils of Sahara, J. Clim. Appl.Meteorol., 22, 233–243, 1983.
De Longueville, F., Hountondji, Y. C., Henry, S., and Ozer, P.: Whatdo we know about effects of desert dust on air quality and humanhealth in West Africa compared to other regions?, Sci. Total En-viron., 409, 1–8, doi:10.1016/j.scitotenv.2010.09.025, 2010.
Draxler, R. R. and Hess, G. D.: An overview of the HYSPLIT_4modelling system for trajectories, dispersion, and deposition,Aust. Meteorol. Mag., 47, 295–308, 1998.
Dubief, J.: Review of the North African climate with particular em-phasis on the production of eolian dust in the Sahel Zone and inthe Sahara, in: Saharan Dust: Mobilization, Transport, Deposi-tion, edited by: Morales, C., John Wiley and Sons Ltd., Hoboken,NJ, 27–48, 1979.
Dubovik, O. and King, M. D.: A flexible inversion algorithm forretrieval of aerosol optical properties from sun and sky radiancemeasurements, J. Geophys. Res., 105, 20673–20696, 2000.
Dubovik, O., Smirnov, A., Holben, B. N., King, M. D., Kauf-man, Y. J., Eck, T. F., and Slutsker, I.: Accuracy assessments ofaerosol optical properties retrieved from Aerosol Robotic Net-work (AERONET) Sun and sky radiance measurements, J. Geo-phys. Res., 105, 9791–9806, 2000.
Dubovik, O., Holben, B. N., Eck, T. F., Smirnov, A., Kaufman, Y. J.,King, M. D., Tanré, D., and Lutsker, I.: Variability of absorptionand optical properties of key aerosols types observed in world-wide locations, J. Atmos. Sci., 59, 590–608, 2002.
Dubovik, O., Sinyuk, A., Lapyonak, T., Holben, B. N.,Mishchenko, M., Yang, P., Eck, T. F., Volten, H., Muñoz, O.,Veihelmann, B., van der Zande, W. J., Leon, J.-F., Sorokin, M.,and Slutsker, I.: Application of spheroid models to account foraerosol particle nonsphericity in remote sensing of desert dust, J.Geophys. Res., 111, D11208, doi:10.1029/2005JD006619, 2006.
Atmos. Chem. Phys., 14, 11753–11773, 2014 www.atmos-chem-phys.net/14/11753/2014/

C. Guirado et al.: Aerosol characterization at the Saharan AERONET site Tamanrasset 11771
Eck, T. F., Holben, B. N., Reid, J. S., Dubovik, O., Smirnov, A.,O’Neill, N. T., Slutsker, I., and Kinne, S.: Wavelength depen-dence of the optical depth of biomass burning, urban, and desertdust aerosol, J. Geophys. Res., 104, 31333–31350, 1999.
Elvidge, C. D., Baugh, K. E., Kihn, E. A., Kroehl, H. W., andDavis, E. R.: Mapping of city lights using DMSP OperationalLinescan System data, Photogramm. Eng. Rem. S., 63, 727–734,1997.
Flamant, C., Chaboureau, J.-P., Parker, D. J., Taylor, C. M., Cam-mas, J.-P., Bock, O., Timouk, F., and Pelon, J.: Airborne obser-vations of the impact of a convective system on the planetaryboundary layer thermodynamics and aerosol distribution in theinter-tropical discontinuity region of the West African Monsoon,Q. J. Roy. Meteor. Soc., 133, 1175–1189, doi:10.1002/qj.97,2007.
Formenti, P., Schütz, L., Balkanski, Y., Desboeufs, K., Ebert, M.,Kandler, K., Petzold, A., Scheuvens, D., Weinbruch, S., andZhang, D.: Recent progress in understanding physical and chem-ical properties of African and Asian mineral dust, Atmos. Chem.Phys., 11, 8231–8256, doi:10.5194/acp-11-8231-2011, 2011.
Forster, P., Ramaswamy, V., Artaxo, P., Berntsen, T., Betts, R., Fa-hey, D. W., Haywood, J., Lean, J., Lowe, D. C., Myhre, G.,Nganga, J., Prinn, R., Raga, G., Schulz, M., and Dorland, R. V.:Changes in atmospheric constituents and in radiative forcing, in:Climate Change 2007: The Physical Science Basis, Contributionof Working Group I to the Fourth Assessment Report of the Inter-governmental Panel on Climate Change, edited by: Solomon, S.,Qin, D., Manning, M., Chen, Z., Marquis, M., Averyt, K. B., Tig-nor, M., and Miller, H. L., Cambridge University Press, Cam-bridge, UK and New York, NY, USA, 129–234, 2007.
Ginoux, P., Prospero, J. M., Gill, T. E., Hsu, N. C., andZhao, M.: Global-scale attribution of anthropogenic and nat-ural dust sources and their emission rates based on MODISDeep Blue aerosol products, Rev. Geophys., 50, RG3005,doi:10.1029/2012RG000388, 2012.
Gobbi, G. P., Kaufman, Y. J., Koren, I., and Eck, T. F.: Classificationof aerosol properties derived from AERONET direct sun data,Atmos. Chem. Phys., 7, 453–458, doi:10.5194/acp-7-453-2007,2007.
Goudie, A. S. and Middleton, N. J.: Saharan dust storms: nature andconsequences, Earth-Sci. Rev., 56, 179–204, doi:10.1016/S0012-8252(01)00067-8, 2001.
Guirado, C., Cuevas, E., Cachorro, V. E., Mimouni, M., Zeudmi, L.,Toledano, C., Alonso-Pérez, S., Basart, S., Blarel, L., Goloub, P.,and Baldasano, J. M.: Preliminary characterization of columnaraerosols properties (AOD–AE) at the Saharan Tamanrasset (Al-geria) station, Óptica Pura y Aplicada, 44, 635–639, 2011.
Haustein, K., Pérez, C., Baldasano, J. M., Müller, D., Tesche, M.,Schladitz, A., Freudenthaler, V., Heese, B., Esselborn, M.,Weinzierl, B., Kandler, K., and von Hoyningen-Huene, W.: Re-gional dust model performance during SAMUM 2006, Geophys.Res. Lett., 36, L03812, doi:10.1029/2008GL036463, 2009.
Haustein, K., Pérez, C., Baldasano, J. M., Jorba, O., Basart, S.,Miller, R. L., Janjic, Z., Black, T., Nickovic, S., Todd, M. C.,Washington, R., Müller, D., Tesche, M., Weinzierl, B., Esselborn,M., and Schladitz, A.: Atmospheric dust modeling from mesoto global scales with the online NMMB/BSC-Dust model – Part2: Experimental campaigns in Northern Africa, Atmos. Chem.Phys., 12, 2933–2958, doi:10.5194/acp-12-2933-2012, 2012.
Heffter, J. L.: Air Resources Laboratories Atmospheric Transportand Dispersion Model (ARL-ATAD), Air Resources Laborato-ries, Silver Spring, Maryland, 1980.
Heinold, B., Knippertz, P., Marsham, J. H., Fiedler, S., Dixon,N. S., Schepanski, K., Laurent, B., and Tegen, I.: The role ofdeep convection and nocturnal low-level jets for dust emissionin summertime West Africa: Estimates from convection per-mitting simulations, J. Geophys. Res. Atmos., 118, 4385–4400,doi:10.1002/jgrd.50402, 2013.
Holben, B. N., Eck, T. F., Slutsker, I., Tanré, D., Buis, J. P., Setzer,A., Vermote, E., Reagan, J. A., Kaufman, Y. J., Nakajima, T.,Lavenu, F., Jankowiak, I., and Smirnov, A.: AERONET – a fed-erated instrument network and data archive for aerosol character-ization, Remote Sens. Environ., 66, 1–16, 1998.
Holben, B. N., Tanré, D., Smirnov, A., Eck, T. F., Slutsker, I.,Abuhassan, N., Newcomb, W. W., Schafer, J. S., Chatenet,B., Lavenu, F., Kaufman, Y. J., Vande Castle, J., Setzer, A.,Markham, B., Clark, D., Frouin, R., Halthore, R., Karneli, A.,O’Neill, N. T., Pietras, C., Pinker, R. T., Voss, K. and Zibordi,G.: An emerging ground-based aerosol climatology: aerosol opti-cal depth from AERONET, J. Geophys. Res., 106, 12067–12097,doi:10.1029/2001JD900014, 2001.
Hsu, Y. K., Holsen, T. M., and Hopke, P. K.: Comparison of hy-brid receptor models to locate PCB sources in Chicago, Atmos.Environ., 37, 545–562, 2003.
Hsu, N. C., Tsay, S.-C., King, M. D., and Herman, J. R.: Aerosolproperties over bright-reflecting source regions, IEEE T. Geosci.Remote Sens., 42, 557–569, 2004.
Hsu, N. C., Tsay, S.-C., King, M. D., and Herman, J. R.: Deep Blueretrievals of Asian aerosol properties during ACE-Asia, IEEE T.Geosci. Remote Sens., 44, 3180–3195, 2006.
Hunt, W. H., Winker, D. M., Vaughan, M. A., Powell, K. A., Lucker,P. L., and Weimer, C.: CALIPSO lidar description and perfor-mance assessment, J. Atmos. Oceanic Technol., 26, 1214–1228,doi:10.1175/2009JTECHA1223.1, 2009.
Jakob, C. and Tselioudis, G.: Objective identification of cloudregimes in the Tropical Western Pacific, Geophys. Res. Lett., 30,2082, doi:10.1029/2003GL018367, 2003.
Kim, D., Chin, M., Yu, H., Eck, T. F., Sinyuk, A., Smirnov, A.,and Holben, B. N.: Dust optical properties over North Africaand Arabian Peninsula derived from the AERONET dataset,Atmos. Chem. Phys., 11, 10733–10741, doi:10.5194/acp-11-10733-2011, 2011.
Knippertz, P. and Todd, M. C.: The central west Saharan dusthot spot and its relation to African easterly waves andextratropical disturbances, J. Geophys. Res., 115, D12117,doi:10.1029/2009JD012819, 2010.
Knippertz, P. and Todd, M. C.: Mineral dust aerosols over theSahara: Meteorological controls on emission and transportand implications for modeling, Rev. Geophys. 50, RG1007,doi:10.1029/2011RG000362, 2012.
Mallet, M., Dubovik, O., Nabat, P., Dulac, F., Kahn, R., Sciare, J.,Paronis, D., and Léon, J. F.: Absorption properties of Mediter-ranean aerosols obtained from multi-year ground-based remotesensing observations, Atmos. Chem. Phys., 13, 9195–9210,doi:10.5194/acp-13-9195-2013, 2013.
Marsham, J. H., Parker, D. J., Grams, C. M., Taylor, C. M.,and Haywood, J. M.: Uplift of Saharan dust south of the
www.atmos-chem-phys.net/14/11753/2014/ Atmos. Chem. Phys., 14, 11753–11773, 2014

11772 C. Guirado et al.: Aerosol characterization at the Saharan AERONET site Tamanrasset
intertropical discontinuity, J. Geophys. Res., 113, D21102,doi:10.1029/2008JD009844, 2008.
Marsham, J. H., Knippertz, P., Dixon, N. S., Parker, D. J.,and Lister, G. M. S.: The importance of the representationof deep convection for modeled dust-generating winds overWest Africa during summer, Geophys. Res. Lett., 38, L16803,doi:10.1029/2011GL048368, 2011.
Marsham, J. H., Hobby, M., Allen, C. J. T., Banks, J. R., Bart,M., Brooks, B. J., Cavazos-Guerra, C., Engelstaedter, S., Gas-coyne, M., Lima, A.R., Martins, J. V., McQuaid, J. B., O’Leary,A., Ouchene, B., Ouladichir, A., Parker, D. J., Saci, A., Salah-Ferroudj, M., Todd, M. C., and Washington, R.: Meteorology anddust in the central Sahara: Observations from Fennec supersite-1during the June 2011 Intensive Observation Period, J. Geophys.Res. Atmos., 118, 4069–4089, doi:10.1002/jgrd.50211, 2013.
Miloshevich, L. M., Vömel, H., Whilteman, D. N., and Leblanc, T.:Accuracy assessment and correction of Vaisala RS92 radiosondewater vapor measurements, J. Geophys. Res., 114, D11305,doi:10.1029/2008JD011565, 2009.
Naseema Beegum, S., Krishna Moorthy, K., Gogoi, Mukunda M.,Suresh Babu, S., and Pandey, S. K.: Multi-year investigations ofaerosols from an island station, Port Blair, in the Bay of Bengal:climatology and source impacts, Ann. Geophys., 30, 1113–1127,doi:10.5194/angeo-30-1113-2012, 2012.
O’Neill, N. T., Dubovik, O., and Eck, T. F.: Modified Ångström ex-ponent for the characterization of submicrometer aerosols, Appl.Optics, 40, 2368–2375, 2001.
O’Neill, N. T., Eck, T. F., Smirnov, A., Holben, B. N., and Thulasir-aman, S.: Spectral discrimination of coarse and fine mode opticaldepth, J. Geophys. Res., 108, 4559, doi:10.1029/2002JD002975,2003.
Pérez, C., Haustein, K., Janjic, Z., Jorba, O., Huneeus, N., Bal-dasano, J. M., Black, T., Basart, S., Nickovic, S., Miller, R.L., Perlwitz, J. P., Schulz, M., and Thomson, M.: Atmosphericdust modeling from meso to global scales with the onlineNMMB/BSC-Dust model – Part 1: Model description, annualsimulations and evaluation, Atmos. Chem. Phys., 11, 13001–13027, doi:10.5194/acp-11-13001-2011, 2011.
Perez, L., Tobías, A., Querol, X., Pey, J., Alastuey, A., Díaz, J., andSunyer, J.: Saharan dust, particulate matter and cause-specificmortality: a case–crossover study in Barcelona (Spain), Environ.Int., 48, 150–155, doi:10.1016/j.envint.2012.07.001, 2012.
Polissar, A. V., Hopke, P. K., Paatero, P., Kaufmann, Y. J.,Hall, D. K., Bodhaine, B. A., Dutton, E. G., and Harris, J. M.:The aerosol at Barrow, Alaska: long-term trends and source lo-cations, Atmos. Environ., 33, 2441–2458, 1999.
Prats, N., Cachorro, V. E., Berjón, A., Toledano, C., and De Fru-tos, A. M.: Column-integrated aerosol microphysical proper-ties from AERONET Sun photometer over southwestern Spain,Atmos. Chem. Phys., 11, 12535–12547, doi:10.5194/acp-11-12535-2011, 2011.
Prospero, J. M., Ginoux, P., Torres, O., Nicholson, S. E., andGill, T. E.: Environmental characterization of global sources ofatmospheric soil dust identified with the nimbus 7 total ozonemapping spectrometer (TOMS) absorbing aerosol product, Rev.Geophys., 40, 1002, doi:10.1029/2000RG000095, 2002.
Reddy, P. J.: Instructions for J-Series Handheld Sunphotometer,NOAA, Boulder, 1986.
Redelsperger, J.-L., Thorncroft, C., Diedhiou, A., Lebel, T.,Parker, D., and Polcher, J.: African monsoon multidisciplinaryanalysis – an international research project and field campaign,B. Am. Meteorol. Soc., 87, 1739–1746, doi:10.1175/BAMS-87-12-1739, 2006.
Roberts, A. J.: Anomalously heavy rainfall and dust in the arid Sa-hara and northern Sahel, in: Convective Episodes near the In-tertropical Discontinuity in Summertime West Africa: Represen-tation in Models and Implications for Dust Uplift, PhD thesis,University of Leeds, Leeds, UK, 2014.
Roberts, A. J., Knippertz, P., and Marsham, J. H.: The Formationof Convectively Generated Dusty Episodes in the Sahara duringSummer, DUST-2014, International Conference on AtmosphericDust, Castellaneta Marina, Italy, June 1–6, 2014.
Rodríguez, S., Alastuey, A., Alonso-Pérez, S., Querol, X.,Cuevas, E., Abreu-Afonso, J., Viana, M., Pérez, N., Pandolfi, M.,and de la Rosa, J.: Transport of desert dust mixed with NorthAfrican industrial pollutants in the subtropical Saharan AirLayer, Atmos. Chem. Phys., 11, 6663–6685, doi:10.5194/acp-11-6663-2011, 2011.
Romero, P. M. and Cuevas, E.: Diurnal variation of the aerosol op-tical depth: artifact or reality?, in: Proceeding of 3a AsambleaHispano Portuguesa de Geofísica y Geodesia, Valencia, Spain,4–8 February 2002, 2, 1252–1256, 2002.
Ryder, C. L., Highwood, E. J., Rosenberg, P. D., Trembath, J.,Brooke, J. K., Bart, M., Dean, A., Crosier, J., Dorsey, J., Brind-ley, H., Banks, J., Marsham, J. H., McQuaid, J. B., Sodemann, H.,and Washington, R.: Optical properties of Saharan dust aerosoland contribution from the coarse mode as measured during theFennec 2011 aircraft campaign, Atmos. Chem. Phys., 13, 303–325, doi:10.5194/acp-13-303-2013, 2013.
Schepanski, K., Tegen, I., Todd, M. C., Heinold, B., Bönisch, G.,Laurent, B., and Macke, A.: Meteorological processes forcingSaharan dust emission inferred from MSG-SEVIRI observationsof subdaily dust source activation and numerical models, J. Geo-phys. Res., 114, D10201, doi:10.1029/2008JD010325, 2009.
Schmid, B., Michalsky, J. J., Slater, D. W., Barnard, J. C.,Halthore, R. N., Liljegren, J. C., Holben, B. N., Eck, T. F.,Livingston, J. M., Russell, P. B., Ingold, T., and Slutsker, I.:Comparison of columnar water-vapor measurements from so-lar transmittance methods, Appl. Optics, 40, 1886–1896,doi:10.1364/AO.40.001886, 2001.
Schneider, M., Romero, P. M., Hase, F., Blumenstock, T.,Cuevas, E., and Ramos, R.: Continuous quality assessment of at-mospheric water vapour measurement techniques: FTIR, Cimel,MFRSR, GPS, and Vaisala RS92, Atmos. Meas. Tech., 3, 323–338, doi:10.5194/amt-3-323-2010, 2010.
Schuster, G. L., Dubovik, O., and Holben, B. N.: Angstrom expo-nent and bimodal aerosol size distributions, J. Geophys. Res.,111, D07207, doi:10.1029/2005JD006328, 2006.
Schuster, G. L., Vaughan, M., MacDonnell, D., Su, W., Winker, D.,Dubovik, O., Lapyonok, T., and Trepte, C.: Comparison ofCALIPSO aerosol optical depth retrievals to AERONET mea-surements, and a climatology for the lidar ratio of dust, Atmos.Chem. Phys., 12, 7431–7452, doi:10.5194/acp-12-7431-2012,2012.
Atmos. Chem. Phys., 14, 11753–11773, 2014 www.atmos-chem-phys.net/14/11753/2014/

C. Guirado et al.: Aerosol characterization at the Saharan AERONET site Tamanrasset 11773
Seibert, P., Kromp-Kolb, H., Baltensperger, U., Jost, D. T.,Schwikowski, M., Kasper, A., and Puxbaum, H.: Trajectory anal-ysis of aerosol measurements at High Alpine Sites, in: Transportand Transformation of Pollutants in the Troposphere, edited by:Borrell, P. M., Borrell, P., Cvitas, T., and Seiler, W., AcademicPublishing, Den Haag, 689–693, 1994.
Smirnov, A., Holben, B. N., Eck, T. F., Dubovik, O., andSlutsker, I.: Cloud screening and quality control algorithms forthe AERONET data base, Remote Sens. Environ., 73, 337–349,2000.
Su, L. and Toon, O. B.: Saharan and Asian dust: similarities anddifferences determined by CALIPSO, AERONET, and a coupledclimate-aerosol microphysical model, Atmos. Chem. Phys., 11,3263–3280, doi:10.5194/acp-11-3263-2011, 2011.
Tegen, I., Schepanski, K., and Heinold, B.: Comparing two yearsof Saharan dust source activation obtained by regional modellingand satellite observations, Atmos. Chem. Phys., 13, 2381–2390,doi:10.5194/acp-13-2381-2013, 2013.
Tesche, M., Wandinger, U., Ansmann, A., Althausen, D.,Müller, D., and Omar, A. H.: Ground-based validation ofCALIPSO observations of dust and smoke in the CapeVerde region, J. Geophys. Res. Atmos., 118, 2889–2902,doi:10.1002/jgrd.50248, 2013.
Todd, M. C., Allen, C. J. T., Bart, M., Bechir, M., Bentefouet, J.,Brooks, B. J., Cavazos-Guerra, C., Clovis, T., Deyane, S., Dieh,M., Engelstaedter, S., Flamant, C., Garcia–Carreras, L., Gan-dega, A., Gascoyne, M., Hobby, M., Kocha, C., Lavaysse, C.,Marsham, J. H., Martins, J. V., McQuaid, J. B., Ngamini, J. B.,Parker, D. J., Podvin, T., Rocha-Lima, A., Traore, S., Wang, Y.,and Washington, R.: Meteorological and dust aerosol conditionsover the western Saharan region observed at Fennec Supersite-2during the intensive observation period in June 2011, J. Geophys.Res.-Atmos., 118, 8426–8447, doi:10.1002/jgrd.50470, 2013.
Toledano, C., Cachorro, V. E., Berjon, A., de Frutos, A. M., Sor-ribas, M., de la Morena, B. A., and Goloub, P.: Aerosol opti-cal depth and Ångström exponent climatology at El ArenosilloAERONET site (Huelva, Spain), Q. J. Roy. Meteor. Soc., 133,795–807, doi:10.1002/qj.54, 2007.
Toledano, C., Wiegner, M., Garhammer, M., Seefeldner, M.,Gasteiger, J., Müller, D., and Koepke, P.: Spectral aerosol op-tical depth characterization of desert dust during SAMUM 2006,Tellus B, 61, 216–228, doi:10.1111/j.1600-0889.2008.00382.x,2009.
Winker, D. M., Vaughan, M. A., Omar, A., Hu, Y., Pow-ell, K. A., Liu, Z., Hunt, W. H., and Young, S. A.:Overview of the CALIPSO mission and CALIOP data pro-cessing algorithms, J. Atmos. Ocean. Tech., 26, 2310–2323,doi:10.1175/2009JTECHA1281.1, 2009.
www.atmos-chem-phys.net/14/11753/2014/ Atmos. Chem. Phys., 14, 11753–11773, 2014