aeroelastic investigation of different deck sections for ... 4/issue 12/ijeit1412201506_09.pdf ·...
TRANSCRIPT

ISSN: 2277-3754
ISO 9001:2008 Certified International Journal of Engineering and Innovative Technology (IJEIT)
Volume 4, Issue 12, June 2015
49
Abstract— Computational fluid dynamics (CFD) simulations
appear to be a strong competitor to wind tunnel tests which are
expensive, require a scale model and a time consuming tool in
designing bridges, therefore there is a strong claim to replace
them with CFD. Analyses are carried out for four deck cross
sections by secondary development of CFD software Ansys
Fluent, establishing a dimensional bending and torsional
fluid-structure interaction (FSI) numerical model to calculate the
flutter critical wind speed. Steady and unsteady simulations have
been computed in order to judge the feasibility of CFD
simulations in the early stage design of long span bridges.
Additionally, a realizable (κ-ε) model with enhanced wall
treatment and a (κ-ω SST) turbulence model have been
considered to verify their performance in bridge aerodynamics
problems. It has been found that static aerodynamic coefficients
have been correctly modeled using a steady simulation, while the
flutter critical wind speed is judged from the time history of
unsteady simulations for stationary deck sections. The validity of
the simulation method was verified by comparison of the
simulation results with the work done by other researchers.
Index Terms— Bridge aeroelasticity, Computational fluid
dynamics, Critical flutter wind speed, Suspension bridges
I. INTRODUCTION
Wind load is one of the most important design loads in civil
engineering structures, especially for long span bridges with
low damping and high flexibility. Deck sections of long span
bridges are one type of bluff bodies that are usually elongated
with sharp corners that make the flow around them to cause
aerodynamic instabilities. Such instabilities may cause
serious catastrophic structural failure such as, the Old
Tacoma Narrows Bridge collapse in 1940. Suspension
bridges not only must be designed to support static wind
forces like lift, drag and moment created by the mean wind,
but also the dynamic loads created by an interaction between
the wind forces and structural motions which is known as
aeroelasticity. Deck models are used in wind tunnel tests to
obtain aerodynamic and aeroelastic information. However,
with computer technology and CFD evolution, a lot of these
models can also be analyzed by numerical simulations. Flutter
occurs due to a structure and wind interaction where the wind
speed has passed the critical speed of flutter and negative
damping develops [1]. If a structure is experiencing
oscillation a positive damping will slowly decrease the
amplitude of displacement, on the other hand flutter increases
the amplitude of the oscillation as time continues [2].Fig. 1
shows a sinusoidal representation of both positive and
negative damping phenomena.
(a) Positive damping (b) Negative damping
Fig. 1 Example of positive and negative damping [3]
Galloping, vortex shedding vibrations, and flutter are the
most aeroelastic phenomena that can be seen in long span
suspension bridges. Only the last phenomenon will be studied
in the present work and will be focused on producing reliable
results over a range of different bridge deck sections,
establishing a dimensional bending and torsional
fluid-structure interaction numerical model and a finite
element solver to calculate the critical wind speed of flutter
for different deck sections and determining whether the
computational method can lead to a reduction in the number
of expensive physical model tests.
II. METHODOLOGY
A. Numerical Simulation Principle
The structure is regarded as a mass, spring and damping
system. A schematic diagram of numerical simulation is
shown in Fig.2. Fluid control equations for incompressible
flow are given in Equations (1) and (2) which represent the
continuity and the Navier-Stokes equation respectively. The
first step to ascertain the aerodynamic response of the
considered bridge deck types is computation of the
aerodynamic force coefficients (Cd,Cl,Cm).After getting these
coefficients, forces (FD,FL,M) can be easily calculated by
Equations (3) , (4) and (5) [4]. Fig.3 shows criteria for the
aerodynamic forces and moment. Equations (6) and (7) are
the governing structural equations for the heaving and
torsional mode [2].
Aeroelastic Investigation of Different Deck
Sections for Suspension Bridges by Numerical
Analysis Ahmed Abdel-Aziz, Walid A.Attia

ISSN: 2277-3754
ISO 9001:2008 Certified International Journal of Engineering and Innovative Technology (IJEIT)
Volume 4, Issue 12, June 2015
50
[Eqn. 1]
[Eqn. 2]
FD=0.5 U2BCd [Eqn. 3]
FL=0.5 U2BCl [Eqn. 4]
M=0.5 U2B
2Cm [Eqn. 5]
.. . m h (t) +Ch h (t) + Kh h (t) = FL (t) [Eqn. 6]
. .
Iα (t) + Cα α (t) + Kα α (t) = M (t) [Eqn. 7]
Fig. 2 Schematic diagram of numerical simulation.
Fig. 3 Sign criteria for the aerodynamic Forces [4].
Where:
V, p and t: Velocity, pressure, time respectively.
: Air density.
: Air dynamic viscosity.
FD, FL, M: Drag force, lift force, and moment respectively.
Cd, Cl, Cm: Coefficients of drag force, lift force, and moment
respectively.
U: Reference velocity.
B: Bridge width.
m: Deck mass per unit length.
I: Mass moment of inertia about shear center per unit length.
Ch, Cα: Structural damping coefficients.
Kh, Kα: Translational and rotational spring stiffness.
.. . h(t) , h(t) , h(t): : Instantaneous bending acceleration, velocity
and displacement respectively.
.. .
α (t), α (t) , α (t): Instantaneous torsional acceleration, velocity
and displacement respectively.
The critical velocity for bridges is calculated using FSI.
The aeroelastic stability is observed from the free motion of
the bridge deck for various wind speeds. The procedure of
FSI simulation in every wind speed is shown in Fig.4.
Fig. 4 Procedure of FSI in every wind speed [5]
Before calculating the time step, the preliminary value of
bending and torsional acceleration, velocity, and
displacement are set to be zero [5, 6].For every time step the
pressure and velocity are computed around the bridge deck
for the given position by solving the continuity and
Navier-Stokes equations as Equations (1) and (2).Then the
aerodynamic force coefficients acting on the bridge deck are
calculated by using Equations (4) and (5). This can be done
by Fluent [7, 8].
Lift pressure force and moment are represented by the
force in y-direction and the force that causes rotation
respectively. Lift force is applied at the center of gravity and
the moment is applied at the shear center, then the lift and
moment are extracted into structural dynamic Equations (6)
and (7). Then they are solved by using The Newmark-β
method to get the displacements for the heave and pitch.
These displacements are applied in a rigid body fashion and
the grid is updated. The velocity of the grid is applied from
one time step to the next one by dividing the time step size in
different positions. This process is repeated for several time
steps. Then the velocity of the grid is extracted in the Navier
stokes equation to account and simulate deck movement by a
dynamic mesh technique. This can be done by secondary
development of Ansys Fluent which program code is
embedded in it by the user defined function (UDF)
Simulations of wind speed ends if the displacement divergent
or decaying is observed. The critical velocity of flutter is
found by plotting the time history of the structure motion
induced response.

ISSN: 2277-3754
ISO 9001:2008 Certified International Journal of Engineering and Innovative Technology (IJEIT)
Volume 4, Issue 12, June 2015
51
B. Numerical Simulation Model
Four bridge deck sections were studied numerically using a
CFD software in order to create an empirical reference set for
numerical investigations. Among these deck sections is deck
section (1) which is the same section as that of the Great Belt
East Bridge in Denmark .Table 1 shows all full scale
parameters of it. All deck sections have the same width of
31m and the same height of 4 m. Fig.5 shows the geometric
definitions of them. CFD methodology for both steady and
unsteady simulations is shown in Fig.6. 2D analyzed sections
have been modeled by the incompressible turbulence of the
Navier-Stokes equations. There are two different equations of
Reynolds Averaged Navier-Stokes (RANS) that have been
employed in the simulations: realizable (κ-ε) model with
enhanced wall treatment and (κ-ω SST) Shear-Stress
Transport.
At the inlet and outlet boundaries Dirichlet conditions have
been committed; however at deck sections surface no-slip
conditions have been imposed. The turbulent flow
characteristics have been defined with respect to the intensity
and viscosity ratio. For the pressure-velocity a coupling
implicit scheme for second-order and PISO algorithm are
used. It is found that the PISO scheme for pressure-velocity
coupling provides faster convergence for transient flow than
the standard SIMPLE approach [7, 9].
The time step was equal to 0.001 in the transient state
simulations for (t*) equal to 60 seconds and the number of
iterations per each time step was 10. Unsteady simulations
continued until a periodic behavior was reached.
Computations have been carried out on core i7, 2.10 GHz,
and physical memory 8.00 GB.
Table 1 Full scale properties of the deck section (1) [1]
Parameters Units Values
Natural vertical
frequency (fv)
Hz 0.097
Natural torsional
frequency (ft)
Hz 0.27
Mass per unit length (m) kg/m 23 687
Mass moment of inertia
about shear center per unit
length (I)
Kg.m2/m 2.501 x10⁶
Equivalent spring stiffness
for vertical bending mode
per unit length (Kh)
Kg/m2 878.506
Equivalent spring stiffness
for torsional mode per unit
length (Kα)
Kg.m/m 7.194 x10⁵
Fig. 5 Geometric definition of the deck cross sections
Fig. 6 Flow chart for “CFD methodology" over bridge deck
The height of the fluid domain is10 B and the length is16 B
where (B) is the deck width. Rigid mesh grid is used in the
inner region while stationary mesh grid is used in the outer
region. Dynamic mesh grid is between the rigid mesh and
stationary mesh. The width and height of the rigid mesh are
about two times and one times the width of the deck section
respectively. Both the width and height of the dynamic mesh
grid are about six times the width of the deck section. Fig.7
shows the domain regions and dimensions.
Fig. 7 Domain regions and dimensions [5].
When the deck section vibrates, the rigid mesh grid follows
the deck section synchronously. The static grid stays
stationary while the shape and dimension of the dynamic
mesh changes constantly. In the region which is far away from
the deck section, the size of the mesh grid is big. On the
contrary, in the region which is near the deck section is small.
The mesh information and size are defined by the number
of cells, nodes, and faces. Fig.8 and Table 2 show the

ISSN: 2277-3754
ISO 9001:2008 Certified International Journal of Engineering and Innovative Technology (IJEIT)
Volume 4, Issue 12, June 2015
52
definition of them. The whole numerical grids of the four
deck sections are shown in Fig.9.
Fig. 8 Definition of cells, nodes, and face [7]
Table 2 Mesh information for studied deck sections
(CFD-Model)
Deck No. Cells Nodes Faces
1 97360 53996 151356
2 95212 47969 143181
3 226424 113734 340158
4 155062 78274 233336
The flow runs from the left to the right. The left side is
considered as the inflow boundary specified with the velocity
inlet. On the other right side there is an exit boundary
specified with pressure outlet equal to zero. The upper and
lower sides are specified as symmetrical. The deck edges are
considered as a wall with no-slip boundary conditions.
a) Deck section (1)
b) Deck section (2)
c) Deck section (3)
d) Deck section (4)
Fig. 9 Whole mesh for different deck sections
III. SIMULATION RESULTS
A. Steady Aerodynamic Force Coefficients
In order to validate the cross -sectional geometry adopted
for suspension bridges, the finite volume grid and the 2D
approach in the CFD analysis of the deck are used. Static
aerodynamic coefficients have been computed assuming
steady state for each deck. The aerodynamic coefficients have
been computed for Reynolds number equal to 2.5x10⁵ based
on the deck width with different angles of attack in the range
of -10º to 10º with step 1º.
Two different Reynolds averaged turbulence models have
been considered:
1- Realizable (k-ε) with enhanced wall treatment.
2-Shear-Stress Transport (κ-ω SST).
In each case of studied turbulence models a second order
scheme was used. The number of chosen iterations was 2000
in steady state simulations.
In Fig.10 the computed static aerodynamic force
coefficients are presented along with the experimental results
obtained by Félix [4] for the same Reynolds number and
section (deck section 1).The computational results are very
close to that obtained from wind tunnel tests. There are no
significant differences in the results offered by (k-ε) and (k-ω
SST) turbulence models. In general the static aerodynamic
coefficients computed with (k-ε) turbulence model are
slightly lower than those obtained using (k-ω SST) turbulence
model. From Fig.10 it can be concluded that mean force

ISSN: 2277-3754
ISO 9001:2008 Certified International Journal of Engineering and Innovative Technology (IJEIT)
Volume 4, Issue 12, June 2015
53
coefficients are in good agreement with the experimental data of the deck section (1).
(a) Lift coefficient (Cl) (b) Moment coefficient (Cm)
Fig. 10 Aerodynamic coefficients of deck section (1) for (Re=2.5x10⁵).
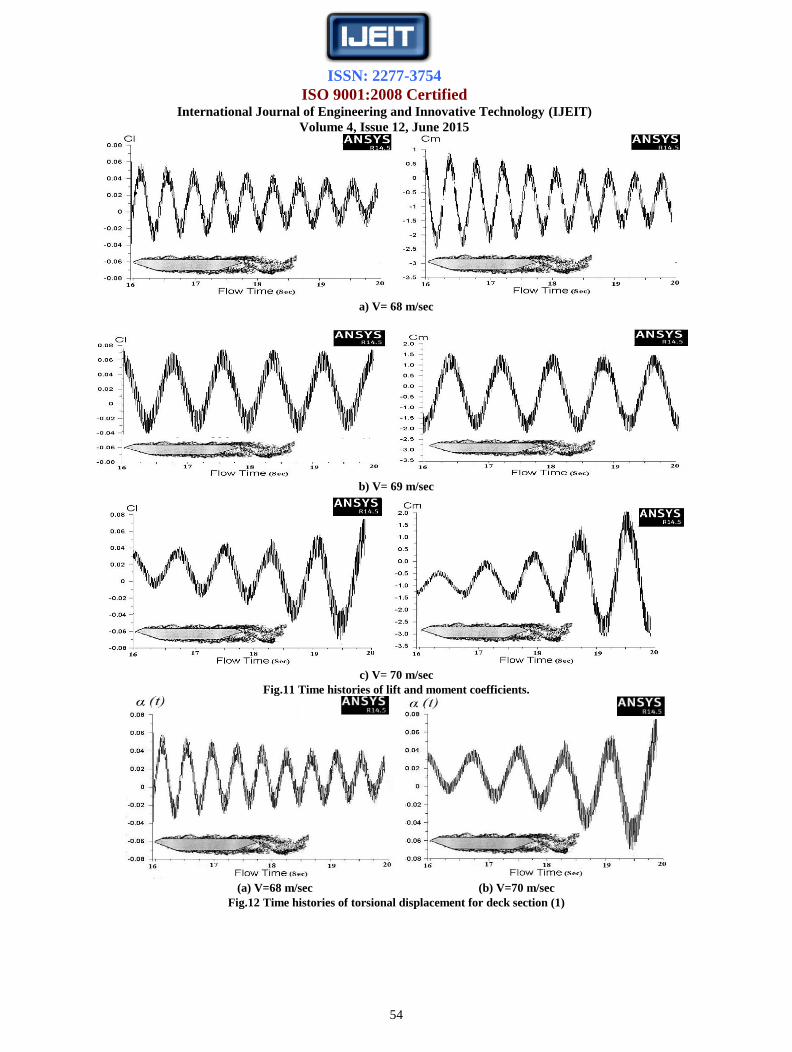
B. Unsteady Time History of Aerodynamic Coefficients
To find the critical wind speed of flutter for each deck cross section, time history analysis for aerodynamic coefficients and
vibrating motion should be applied by increasing the inlet velocity incrementally in different runs. When the aerodynamic
coefficients and motion amplitude started to grow (negative damping), the critical velocity was found. From Fig.s 11 and 12 for
deck section (1) it can be seen that:
When wind speed equals 68 m/sec, lift and moment coefficients decrease with the increase of time. This illustrates that the
total damping of the model is positive.
When wind speed equals 69 m/sec, lift and moment coefficients remain almost the same.
When wind speed reaches 70 m/sec, lift and moment coefficients increase with the increase of time. This illustrates that the
total damping of the model changes from positive to negative. So flutter critical wind speed equals 70 m/sec.
When flutter occurs, the torsional vibration frequency equals 0.2 Hz. Comparing this frequency with (fv, ft) shown in Table
1, flutter style for deck section (1) is bending torsional coupled flutter.
These previous investigations were repeated for deck sections 2, 3 and 4 until negative damping occurred in each deck section.
Table 3 and Fig.s 13, 14 and 15 show how critical wind speed of flutter is obtained from time history of unsteady simulations
for different deck sections.
Table 3 Getting flutter critical wind speed from time histories of unsteady simulations.
Deck cross section No. 1 2 3 4
The force acting on the deck gradually
decreased at inlet velocity equal (positive
damping)
68 m/sec 63 m/sec 60 m/sec 25 m/sec
The force acting on the deck gradually
increased at inlet velocity equal (negative
damping)
So Critical wind speed of flutter equal
70 m/sec
64 m/sec
61 m/sec
26 m/sec
ISSN: 2277-3754
ISO 9001:2008 Certified International Journal of Engineering and Innovative Technology (IJEIT)
Volume 4, Issue 12, June 2015
54
a) V= 68 m/sec
b) V= 69 m/sec
c) V= 70 m/sec
Fig.11 Time histories of lift and moment coefficients.
(a) V=68 m/sec (b) V=70 m/sec
Fig.12 Time histories of torsional displacement for deck section (1)

ISSN: 2277-3754
ISO 9001:2008 Certified International Journal of Engineering and Innovative Technology (IJEIT)
Volume 4, Issue 12, June 2015
55
(a) V=63 m/sec (b) V=64 m/sec
Fig.13 Time histories of torsional displacement for deck section (2).
(a) V=60 m/sec (b) V=61 m/sec
Fig.14 Time histories of torsional displacement for deck section (2).
(a) V=25 m/sec (b) V=26 m/sec
Fig.15 Time histories of torsional displacement for deck section (4).
C. Comparison of Results
Steady simulations of the deck configuration considering
Reynolds number equals 2.5x10⁵ and range of angles of
attack have offered aerodynamic coefficients close to those
obtained from wind tunnel tests for the same Reynolds
number as shown in Fig.10. The results of work done for
deck section 1 is compared with other researchers results as
shown in Table 4. The critical flutter velocity predicted in
the present work is in a good agreement with the wind
tunnel results.
Table 4 References of Flutter velocity for the Great Belt
East Bridge.
Reference Vcr (m/s)
(Numerical) Present work 70
(Numerical) Robert and Kenneth [10] 71.9
(Numerical) Hao Zhan [1] 69
(Wind Tunnel Tests) Hao Zhan [8] 73

ISSN: 2277-3754
ISO 9001:2008 Certified International Journal of Engineering and Innovative Technology (IJEIT)
Volume 4, Issue 12, June 2015
56
D. Improving aerodynamic performance
Since the streamline trapezoidal box girder like deck section
1 has proven that it is the best section in resisting wind flutter,
it is widely used in long span bridge design and construction
all over the world. To improve the aerodynamic stability
performance a guide wing on each side edge of the deck is
used as shown in Fig.16.
Guide Wing
Fig. 16 Outline of guide wing
The guide wing can smooth airflow while passing through
the section, hence the aerodynamic stability may be
strengthened. It is observed from Table 5 that a wider guide
wing can improve the aerodynamic stability distinctly. On the
other hand, the complexity of the structure design,
construction, and the maintenance cost will be increased. Table 5 Critical flutter wind speed with guide wings.
Vcr (m/s) Width of Guide Wing (m)
71.47 0.5
72.78 1
76.94 1.5
IV. CONCLUSIONS
The following points offer the major outcome of the present
study:
1. The shape of the bridge deck was a very important
cause of failure for the Tacoma Narrow's Bridge.
There for modern suspension bridges utilize
trapezoidal box type sections or sharp leading edges
sections like deck sections (1 and 2) and solid girders
must be avoided like deck section (4) .
2. The aerodynamics of bridge deck cross sections have
been fully described through CFD simulations by
using Ansys software.
3. Steady CFD simulation curves of the aerodynamic
coefficients have been evaluated for a wide range of
angles of attack and the computed results showed
acceptable agreement between experimental results
and simulation results for the same Reynolds number.
Both turbulence models (k-ε) and (k-ω SST) reveled
similar results.
4. Unsteady 2D simulations of time history analysis for
aerodynamic coefficients led to find the critical wind
speed of flutter by increasing the inlet velocity
incrementally in different runs. When the aerodynamic
coefficient and motion amplitude started growing
(negative damping), the critical wind speed was found.
5. The critical velocity for the onset of flutter was
predicted successfully and it is in a good agreement
with wind tunnel results and work done by other
researchers. The obtained critical flutter velocity for
deck (1) is 70 m/sec and agrees well with 73 m/s from
the wind tunnel measurements.
6. Using a guide wing can smooth airflow while passing
through the section and the aerodynamic stability will
be strengthened. On the other hand, the guide wing
will increase the complexity of the structure design,
construction and the maintenance cost.
7. FSI is considered as a direct simulation method for the
flutter stability of bridge deck and was developed
based on CFD software Fluent and proved to be useful
in the early aerodynamic design stage of long span
suspension bridges.
8. In the near future fluid-structure interaction (FSI)
based on computational fluid dynamics (CFD) will be
used in studying complex geometry decks of
suspension bridges considering details such as
guardrails, cables and aerodynamic appendages.
Refinements in processing time and semi-implicit
schemes can also be expected.
ACKNOWLEDGEMENT
I am very grateful to Prof.Eman EL-Shamy, Structural
Engineering Department, Zagazig University, Egypt for the
many valuable comments to the manuscript.
REFERENCES [1] Hao Zhan ,Tao Fang ,Zhiguo Zhang.(2013),"Flutter stability
studies of Great Belt East suspension bridge by two CFD
numerical simulation methods", 6th European & African
Conference on Wind Engineering, Robinson College,
Cambridge, UK, 7-11 July.
[2] W.M. Zhang, Y.J. Ge and M.L. Levitan (2011),"
Aerodynamic flutter analysis of a new suspension bridge with
double main spans", journal of Wind and Structures, 14 (3).
[3] Vikas Arora. (2015)," Hybrid Viscous-Structural Damping
Identification Method" Vibration Engineering and Technology
of Machinery, Mechanisms and Machine Science Vol.
23, 2015, pp 209-218.
[4] Félix Nieto, Ibuki Kusano, Santiago Hernández, José Á.
Jurado. (2010)," CFD analysis of the vortex-shedding response
of a twin-box deck cable-stayed bridge, The Fifth International
Symposium on Computational Wind Engineering Chapel Hill,
North Carolina, USA, 23-27 May.
[5] Xiaobing Liu, Zhengqing ,and Chenb Zhiwen Liu.(2012),
"Direct simulation method for flutter stability of bridge deck”,
The Seventh International Colloquium on Bluff Body
Aerodynamics and Applications (BBAA7),Shanghai, China;
2-6 September.
[6] Gergely Szabó, József Györgyi and Gergely Kristóf. (2012),
Advanced flutter simulation of flexible bridge decks, Coupled
Systems Mechanics, Vol. 1, No. 2 133-154.
[7] Ansys Help, Release 14.5 Documentation for Ansys, Fluid
Dynamics, Ansys Fluent, Innovative turbulence modeling: in
Ansys Fluent, (www.ansys.com).

ISSN: 2277-3754
ISO 9001:2008 Certified International Journal of Engineering and Innovative Technology (IJEIT)
Volume 4, Issue 12, June 2015
57
[8] Hao Zhan, Tao Fang.(2012), "Flutter stability studies of Great
Belt East Bridge and Tacoma Narrows Bridge by CFD
numerical simulation", The Seventh International Colloquium
on Bluff Body Aerodynamics and Applications (BBAA7)
,Shanghai, China; 2-6 September.
[9] Ashtiani Abdi, I. (2011) "Experimental and Numerical
Investigation of the Wind Effects on Long Span Bridge
Decks". Master's thesis, Middle East Technical University,
Turkey.
[10] Robert Stevens and Kenneth Simonsen. (2008), Master’s
degree in Civil and Structural Engineering at the University of
Aalborg.
AUTHOR BIOGRAPHY
First Author: PhD Student in Cairo University and Assistant Lecturer,
Civil Eng. Dept., Higher Technological Institute, 6 October, Egypt
E-mail:[email protected]
Second Author: Professor of theory of Structure, Cairo University, Giza,
Egypt
E-mail: [email protected]