aerodynamic performance of small-scale horizontal …
TRANSCRIPT

Research Article – JTEN – 2014 – 91
420
Journal of Thermal Engineering http://eds.yildiz.edu.tr/journal-of-thermal-engineering/Articles Yildiz Technical University Press, Istanbul, Turkey Manuscript Received December 30, 2014; Accepted January 24, 2015
Vol. 1, No. 3, pp. 420-432, July, 2015.
This paper was recommended for publication in revised form by Regional Editor Derya Burcu Özkan
AERODYNAMIC PERFORMANCE OF SMALL-SCALE HORIZONTAL AXIS WIND TURBINES UNDER TWO DIFFERENT EXTREME WIND CONDITIONS
*Emre ALPMAN
Marmara University Mechanical Engineering Department
Istanbul, Turkey
Keywords: Horizontal axis wind turbines, extreme wind conditions, computational fluid dynamics * Corresponding author, Phone: +90 216 348 02 92 / 546, Fax: +90 216 348 02 93
E-mail address: [email protected]
ABSTRACT Aerodynamic performance of two small-scale horizontal
axis wind turbines are analyzed under the extreme operating
gust and extreme direction change conditions with initial wind
speeds of 7, 10, 13, 15 and 20 m/s. Performance predictions are
performed using computational fluid dynamics, and time
variations of shaft torque and hub bending moment produced
by the turbines are presented and compared with each other.
Sectional flow field and sectional blade loading details along
with surface skin friction line predictions are also presented in
order to explain the loading behavior of the turbine blades at
the mentioned extreme wind conditions. Predictions show that
variations in wind speed and blade loadings are similar at low
wind speeds, however, this similarity degrades as the wind
speed increases. Also compared to wind speed changes,
aerodynamic forces are shown to adapt more slowly to wind
direction changes.
INTRODUCTION Wind turbine blades are aerodynamically designed by
searching for suitable design parameters that maximize the
energy production at low cost [1]. The annual energy
production of turbine at a given wind site should be calculated
for this purpose. This calculation is done by multiplying the
power produced at a given wind speed with the probability of
occurrence of that wind speed in a year, and then integrating
this product between cut-in and cut-out speeds of the turbine
[2]. Typically, steady state or time averaged power values
produced at corresponding wind speeds are used in annual
energy production calculations [3] -[9]. However, it is well-
known that a wind turbine spends majority of its life at
unsteady wind conditions [10]. Time dependent wind
conditions were shown to significantly affect the performance
of a wind turbine [11]. International Standard IEC 61400-1
outlines the minimum design requirements for horizontal axis
wind turbines (HAWT) [12]. According to this standard,
performance of a turbine and loading on its blades at extreme
wind conditions is one of the elements that must be considered
in order to ensure proper safety and reliability. Two of the
extreme wind conditions specified in this standard are the
extreme operating gust (EOG) where wind speed experiences
transient oscillations and the extreme direction change (EDC)
where the yaw error gradually increases from zero to a positive
value.
Wind turbine performance under unsteady wind conditions
has been analyzed in the literature using various techniques.
Storey et al. simulated turbine loads during extreme coherent
gust [13]. Here, the flow field was simulated using
computational fluid dynamics with Large Eddy Simulation for
turbulence and the effect of the turbines were introduced using
an actuator sector model [14]. Jeong et al. investigated the
effect of wake on the aeroelastic behavior of a HAWT under
sheared turbulent flow [15]. The predictions were performed
for normal wind profile and extreme wind shear conditions [12]
using blade element momentum theory and free wake method.
Kim et al. performed a comparison study for a two-bladed
HAWT during normal and extreme gust conditions [16] using
the aeroelastic code HAWC2 [17]. This code uses an extended
blade element momentum theory for aerodynamic calculations.
Extensions to the blade element momentum theory were
introduced to handle unsteady phenomena like dynamic inflow,
dynamic stall, etc. Qui et al. [18] remark the deficiency of blade
element momentum theory in simulating complex flows and
simulate unsteady aerodynamics of HAWTs in yawing and

Research Article
421
pitching conditions using a nonlinear lifting line method for
blade aerodynamics along with a free vortex method for the
wake. Their simulations showed that changes in yaw angle
affected the shaft torque considerably. Sezer-Uzol and Uzol
[19] analyzed the effect of steady and transient shear on the
wake structure and performance of a two bladed HAWT rotor
using vortex-lattice method. This method was also used by Jeon
et al. [20] for unsteady aerodynamics prediction of an off-shore
floating wind turbine in planform pitching motion. They
included the thickness and viscous effects to their predictions
using a nonlinear vortex correction method.
References [21] and [22] include unsteady aerodynamics
simulations performed for vertical axis wind turbines (VAWT).
In these references performance of straight bladed Darrieus
type turbines under fluctuating wind conditions were analyzed
by solving the unsteady Reynolds Averaged Navier Stokes
(URANS) equations around the blades. In both studies flow
around the straight blades was assumed to be two-dimensional.
This study includes performance predictions of two different
two-bladed HAWT rotors under the EOG and EDC conditions.
Here, flow field simulations are performed by solving URANS
equations in a flow domain surrounding both blades of the
rotors. This way; viscous, turbulence and three-dimensional
effects are all included in to the predictions. The first turbine
studied is the NREL Phase VI horizontal axis experimental
wind turbine [7]. It is a stall regulated turbine with a rated
power of 20 kW and rotor diameter of 10.06 m. The second
turbine has the same rated power and diameter with those of
NREL Phase VI but its blades were aerodynamically optimized
for maximum annual energy production using genetic algorithm
[6]. Blade parameters for optimizations were chord length and
twist angle distributions along the blade span, the pitch angle of
the blades and airfoil profiles for the root, primary and tip
portions of the blades [5], [6]. In Ref. [6] chord length and twist
angle distributions along the blade span were defined using
cubic Bezier curves with different number of control points. In
this study, the design obtained using three control points, which
yielded the best annual energy production value in [6], will be
used.
The analyses are performed at initial wind speeds of 7, 10,
13, 15 and 20 m/s. Here, the effect of wind shear was neglected
and oncoming wind distribution was assumed to be uniform. In
the extreme operating gust condition wind velocity remains
perpendicular to the rotor disc but its magnitude changes, while
in the extreme direction change case, the magnitude of the wind
speed remains constant but its direction changes. Unsteady
shaft torque, bending moment and power coefficient
predictions are presented for simulations of 15 seconds of real
time for both wind conditions.
Section 2 contains the methodology followed during this
study while the results obtained are presented and discussed in
section 3. Finally, conclusions are drawn in section 4.
NOMENCLATURE D Rotor diameter
Iref Expected value of turbulence intensity at 15 m/s
V(z,t) Wind Speed as a function of elevation and time
V(z) Normal wind profile
Vave Average wind velocity
Ve1 Extreme wind speed with a recurrence of one year
Vgust Hub height gust magnitude
Vhub Wind speed at hub location
Vref Reference wind velocity
t Time
T Gust or direction change period
z Elevation
zhub Hub elevation
θ(t) Yaw angle
θe Magnitude of the direction change
σ1 Turbulence standard deviation
Λ1 Longitudinal turbulence scale parameter at hub height
METHODOLOGY Flow field predictions were obtained using computational
fluid dynamics (CFD). FINE-TURBO package of NUMECA
software [23] was used to solve URANS equations around the
turbine blades. For numerical solutions a block structured mesh
consisting of nearly 4.2 million points was constructed using
AutoGrid5 package of NUMECA [23]. In order to use the same
mesh for both of the extreme wind speed cases, the mesh was
constructed for the full geometry (around both blades) in order
to account for non-symmetry that would occur for the EDC
case. The inflow boundary of the flow domain was located at
five blade radii upstream of the rotor while the outflow
boundary was located at ten blade radii downstream. The
external boundary was five blade radii away from center of
rotation. No-slip adiabatic wall conditions were imposed on the
solid boundaries along with a wall model for turbulence [23].
Spalart-Allmaras one equation turbulence model was used
during the computations [24]. Wind speed, air density and
molecular viscosity were specified at the inflow boundary. The
relevant values were obtained from [25]. Inflow conditions for
turbulent eddy viscosity was specified according to the
guidelines specified at [26] for external flows. Pressure was
specified at the outflow boundary and farfield boundary
conditions were applied at the external boundaries. The
resulting surface mesh around one of the NREL Phase VI
blades can be seen in Figure 1.
Figure 1. Surface mesh on one NREL Phase VI blade
Research Article
422
In the extreme operating gust model as given in IEC 61400-1 standard [12], the wind speed is defined as
���� �� � ����� �� ����� ��� ����� � �� ��� ����� �� �������� � ! � ! "��������������#$% &��% (1)
where V(z) is called the normal wind profile [12] and it defines
the vertical wind shear across the rotor. However, since wind
shear effects were neglected in this study, V(z) was taken to be
constant and equal to the initial wind speed at the hub. The T appearing in equation (1) was taken 10.5 seconds as suggested
in [12]. Vgust is the hub height gust magnitude [12] and is
defined as
����� � '()*���+��,- �.�/�� ��� 0 12-34�-� 562�78 (2)
where D is rotor diameter, Vhub is the wind speed at hub
location and σ1 is the turbulence standard deviation [12];
9- � :;,<�� +��.�/ = >� (3)
In equation (3) b = 5.6 m/s and Iref is the expected value of
turbulence intensity at 15 m/s [12]. From Table 1 of [12] Iref
was taken as 0.16. The longitudinal turbulence scale parameter
Λ1 at hub height z is calculated using [12]
?- � @� �������� ! A�'BC�'����� D A�' (4)
Extreme wind speed with a recurrence of one year, Ve1, is
defined as [12]
�,- � ���C�;,< � EEFGH�4�-- (5)
where reference velocity Vref is related to the average wind
velocity Vave according to [12]
�IJ, � �C��;,< (6)
Since wind shear effects were neglected in this study, the term
z/zhub in equation (5) was taken as 1.
In the extreme direction change model as given in IEC
61400-1 standard [12], the magnitude of the direction change,
which is limited to ±180° interval, is given by:
K, � L #M�N- * 12OFGH0-34�-� 562�7
8 (7)
Then, the direction change transient is calculated using
K��� � P Q�������������� �� R LK, �� ��� ���� �� ������������ � ! � ! "K, �������������� �� D " (8)
Here, the duration of the direction change, T, is taken as 6
seconds as suggested in [12]. The sign in equations (7) and (8)
is chosen such that the worst transient loading is observed [12].
In this study, this direction is selected to be positive.
RESULTS AND DISCUSSION Flow field predictions for the NREL Phase VI rotor and the
aerodynamically optimized rotor from reference [6] were
obtained for EOG and EDC conditions. Numerical solutions
were performed for initial wind speeds of 7, 10, 13, 15 and 20
m/s. During the computations, rotor blades of both turbines
were assumed to rotate at a constant angular speed of 72 rpm.
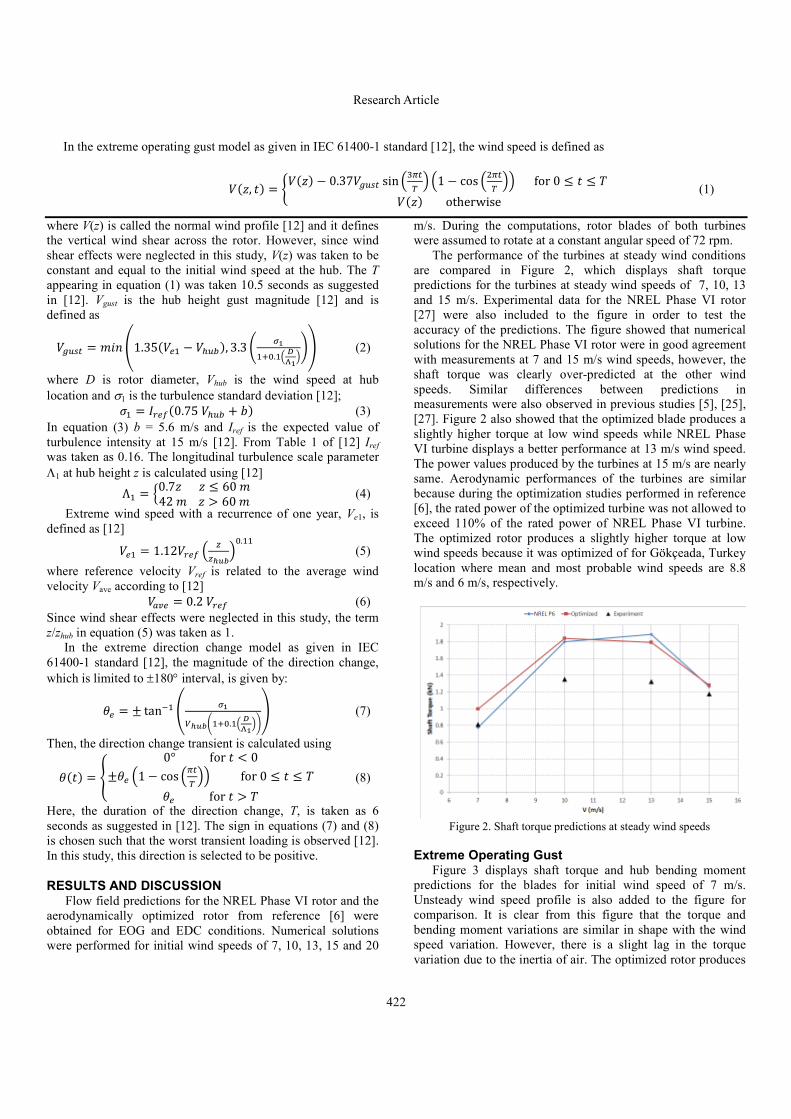
The performance of the turbines at steady wind conditions
are compared in Figure 2, which displays shaft torque
predictions for the turbines at steady wind speeds of 7, 10, 13
and 15 m/s. Experimental data for the NREL Phase VI rotor
[27] were also included to the figure in order to test the
accuracy of the predictions. The figure showed that numerical
solutions for the NREL Phase VI rotor were in good agreement
with measurements at 7 and 15 m/s wind speeds, however, the
shaft torque was clearly over-predicted at the other wind
speeds. Similar differences between predictions in
measurements were also observed in previous studies [5], [25],
[27]. Figure 2 also showed that the optimized blade produces a
slightly higher torque at low wind speeds while NREL Phase
VI turbine displays a better performance at 13 m/s wind speed.
The power values produced by the turbines at 15 m/s are nearly
same. Aerodynamic performances of the turbines are similar
because during the optimization studies performed in reference
[6], the rated power of the optimized turbine was not allowed to
exceed 110% of the rated power of NREL Phase VI turbine.
The optimized rotor produces a slightly higher torque at low
wind speeds because it was optimized of for Gökçeada, Turkey
location where mean and most probable wind speeds are 8.8
m/s and 6 m/s, respectively.
Figure 2. Shaft torque predictions at steady wind speeds
Extreme Operating Gust Figure 3 displays shaft torque and hub bending moment
predictions for the blades for initial wind speed of 7 m/s.
Unsteady wind speed profile is also added to the figure for
comparison. It is clear from this figure that the torque and
bending moment variations are similar in shape with the wind
speed variation. However, there is a slight lag in the torque
variation due to the inertia of air. The optimized rotor produces

Research Article
423
slightly higher torque than the NREL Phase VI rotor however;
its blades are subjected to considerably higher bending
moments. In [6], the blades were optimized for maximum
annual energy production; however, no constraint was
introduced to limit the thrust force or the bending moment
developing on the blades.
Figure 3. Variation of rotor torque (left) and hub bending moment (right) with time (EOG, V0 = 7 m/s)
In order to compare the flow fields over the blades of the
turbines, skin friction lines on the suction sides of the NREL
Phase VI (left column) and optimized (right column) rotor
blades at t = 5, 5.5, 6, 6.5 seconds are displayed in Figure 4.
Here, time increases from top to bottom. Converging of skin
friction lines as shown in the figure indicates flow separation. It
is clear that the separated region on the optimized blade is
larger than that on NREL Phase VI blade. This explains the
higher bending moment the optimized blade experiences.
Figure 4. Skin friction lines on the suction side of NREL Phase VI (left), and optimized (right) rotor blade at t = 5, 5.5, 6, 6.5 seconds.
Variation of power coefficients of the turbines in time are
shown in Figure 5. Here, the power coefficient is calculated
using the instantaneous wind speed. Although the predicted
torque variations were similar to wind speed variation,
predicted power coefficients shows an almost opposite
behavior. This indicates that the aerodynamic forces did not
develop as fast as the wind speed changed. One interesting
consequence of this can be observed at about the 8th
second
where the wind speed reaches its minimum. Here, the power
coefficient of the rotor temporarily exceeds 0.7 which is well
above the Betz limit [1].

Research Article
424
Figure 5. Variation of power coefficient with time (V0 = 7 m/s)
Shaft torque and hub bending moment predictions for the
blades for the initial wind speed of 10 m/s are displayed in
Figure 6. Unlike the predictions for the 7 m/s initial wind
speed, both torque and bending moment reach their maximum
values before the wind speed does. Here, the optimized blade
reaches its peak earlier than NREL Phase VI blade. In addition
to this, torque and bending moment predictions for the NREL
Phase VI rotor showed a faster increase between 3rd
and the 5th
seconds compared to the predictions for the optimized rotor.
Figure 7 displays the skin friction lines on the suction
sides of the blades plotted at t = 4, 4.5, 5, 5.5 and 6 seconds. A
close examination of these lines reveals that; the flow remains
attached around the leading edge of the NREL Phase VI blade,
especially at the outboard stations where the moment arm is
long. On the other hand, flow over the outboard stations of the
optimized blade is fully separated and there is a much smaller
region of attached flow around the leading edge at the mid
sections. Larger attached flow region on the suction side of the
NREL Phase VI turbine leads to a faster increase of its torque
output compared to that of the optimized rotor. However,
unexpectedly, the bending moment on NREL Phase VI rotor
also increases faster than and exceeds the bending moment of
the optimized rotor between 3rd
and the 5th
seconds. In order to
investigate this, sectional bending moments (per unit spanwise
length) at the 5th
second on different spanwise stations of the
blades are displayed in Figure 8. Here at 35% and 75% radius
stations, sectional bending moment on the NREL Phase VI
blade is slightly higher than that of the optimized blade.
However, this difference considerably increases at the 95%
radius station. This is mainly due to the airfoil sections used at
this outboard station. The NREL Phase VI blade has S809
airfoil profile [28] at all spanwise locations [7] . However, the
optimized blade has E387 airfoil profile [29] at the tip section
(> 90% radius) [5], [6]. S809 is 21% thick airfoil and it is
recommended as a “primary” airfoil for small wind turbines
[30]. Inspecting the table shown in [30], one can conclude that
thinner airfoils are more suitable for tip regions of wind turbine
blades. Being only 9.1% thick, E387 is originally designed for
sail planes [31] it has good drag characteristics at moderate and
high Reynolds numbers [31]. It is mainly this characteristic of
the E387 airfoil that kept the bending moment of the optimized
rotor below that of NREL Phase VI as the wind speed
increased.
Figure 6. Variation of rotor torque (left) and hub bending moment (right) with time (V0 = 10 m/s)

Research Article
425
Figure 7. Skin friction lines on the suction side of NREL Phase VI (left), and optimized (right) rotor blade at t = 4, 4.5, 5, 5.5, 6 seconds.
Figure 8. Sectional bending moment at different spanwise stations (V0
= 10 m/s)
Shaft torque and hub bending moment predictions for the
blades for initial wind speed of 13 m/s are displayed in Figure
9. In general, predictions showed a similar behavior to those
obtained for 10 m/s initial wind speed. However, the decrease
in the torque and the bending moment at about 8th
second is
greater than the corresponding drops around the 2.5th
second.
These are the times at which the wind speed reaches its
minimum value.
Figure 9. Variation of rotor torque (left) and hub bending moment (right) with time (V0 = 13 m/s)
Research Article
426
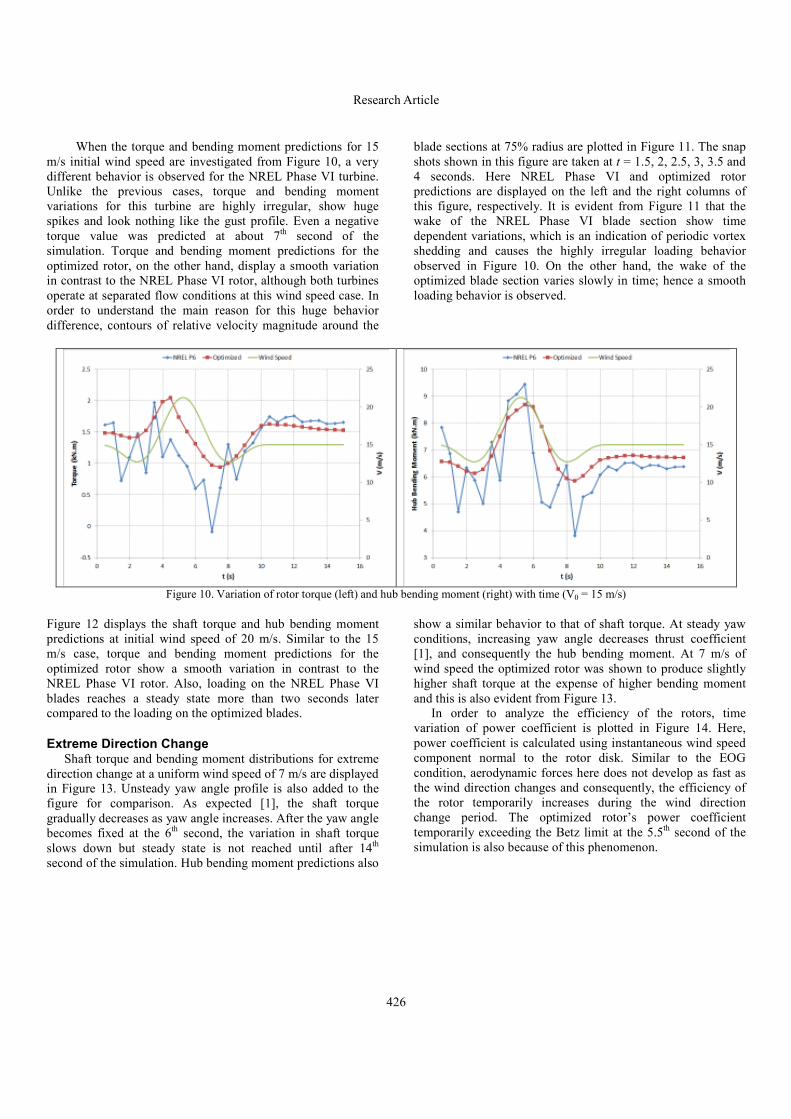
When the torque and bending moment predictions for 15
m/s initial wind speed are investigated from Figure 10, a very
different behavior is observed for the NREL Phase VI turbine.
Unlike the previous cases, torque and bending moment
variations for this turbine are highly irregular, show huge
spikes and look nothing like the gust profile. Even a negative
torque value was predicted at about 7th second of the
simulation. Torque and bending moment predictions for the
optimized rotor, on the other hand, display a smooth variation
in contrast to the NREL Phase VI rotor, although both turbines
operate at separated flow conditions at this wind speed case. In
order to understand the main reason for this huge behavior
difference, contours of relative velocity magnitude around the
blade sections at 75% radius are plotted in Figure 11. The snap
shots shown in this figure are taken at t = 1.5, 2, 2.5, 3, 3.5 and
4 seconds. Here NREL Phase VI and optimized rotor
predictions are displayed on the left and the right columns of
this figure, respectively. It is evident from Figure 11 that the
wake of the NREL Phase VI blade section show time
dependent variations, which is an indication of periodic vortex
shedding and causes the highly irregular loading behavior
observed in Figure 10. On the other hand, the wake of the
optimized blade section varies slowly in time; hence a smooth
loading behavior is observed.
Figure 10. Variation of rotor torque (left) and hub bending moment (right) with time (V0 = 15 m/s)
Figure 12 displays the shaft torque and hub bending moment
predictions at initial wind speed of 20 m/s. Similar to the 15
m/s case, torque and bending moment predictions for the
optimized rotor show a smooth variation in contrast to the
NREL Phase VI rotor. Also, loading on the NREL Phase VI
blades reaches a steady state more than two seconds later
compared to the loading on the optimized blades.
Extreme Direction Change Shaft torque and bending moment distributions for extreme
direction change at a uniform wind speed of 7 m/s are displayed
in Figure 13. Unsteady yaw angle profile is also added to the
figure for comparison. As expected [1], the shaft torque
gradually decreases as yaw angle increases. After the yaw angle
becomes fixed at the 6th
second, the variation in shaft torque
slows down but steady state is not reached until after 14th
second of the simulation. Hub bending moment predictions also
show a similar behavior to that of shaft torque. At steady yaw
conditions, increasing yaw angle decreases thrust coefficient
[1], and consequently the hub bending moment. At 7 m/s of
wind speed the optimized rotor was shown to produce slightly
higher shaft torque at the expense of higher bending moment
and this is also evident from Figure 13.
In order to analyze the efficiency of the rotors, time
variation of power coefficient is plotted in Figure 14. Here,
power coefficient is calculated using instantaneous wind speed
component normal to the rotor disk. Similar to the EOG
condition, aerodynamic forces here does not develop as fast as
the wind direction changes and consequently, the efficiency of
the rotor temporarily increases during the wind direction
change period. The optimized rotor’s power coefficient
temporarily exceeding the Betz limit at the 5.5th
second of the
simulation is also because of this phenomenon.

Research Article
427
Figure 11. Contours of relative velocity magnitude at 75% radius for NREL Phase VI (left) and optimized (right) turbines at t = 1.5, 2, 2.5, 3, 3.5 and
4 seconds.

Research Article
428
Figure 12. Variation of rotor torque (left) and hub bending moment (right) with time (V0 = 20 m/s)
Figure 13. Variation of rotor torque (left) and hub bending moment (right) with time (V = 7 m/s)
Figure 14. Variation of power coefficient with time (V = 7 m/s)
Shaft torque and hub bending moment predictions for 10
m/s wind speed are displayed in Figure 15. Similar to the
behavior observed for 7 m/s wind speed, both shaft torque and
hub bending moment gradually decreases with increasing yaw
angle. However, the amount of decrease for the NREL Phase
VI rotor was predicted to be more than the optimized rotor.
Also, for this wind speed the steady state is reached faster than
the 7 m/s wind speed case, however, one should also note that
the final yaw angle also decreased when the wind speed is
increased from 7 m/s to 10 m/s.
Figure 16 displays the torque and bending moment
predictions for wind speed of 13 m/s. As it was observed in the
previous cases, both loadings gradually decrease as yaw angle
increases. However, undershoots in the loadings were observed
towards the end of the direction change period. This was in
contrast to what was observed for the previous lower speed
cases. In addition to this, despite the higher initial torque output
of the NREL Phase VI rotor than the optimized rotor, the
latter’s output exceeds the formers once steady state is reached.

Research Article
429
Figure 15. Variation of rotor torque (left) and hub bending moment (right) with time (V = 10 m/s)
Figure 16. Variation of rotor torque (left) and hub bending moment (right) with time (V = 13 m/s)
Torque and bending moment predictions at 15m/s of wind
speed are displayed in Figure 17. Similar to what was
previously observed for the EOG condition with initial speed of
15 m/s, NREL Phase VI rotor again yields highly irregular and
oscillatory loading predictions at the initial phases of the
direction change. This is in contrast to smooth torque and
bending moment output of the optimized rotor. However, the
amplitude of the oscillations gradually decreases with time and
disappears once steady state is reached. Moreover, the final
torque output of both rotors is higher than their initial values
even though there is more than 40 degrees of yaw error.
Increasing yaw angle decreases the component of velocity
normal to the rotor disk. Therefore, the amount of air crossing
the rotor disk, and consequently the power available in the wind
decreases. This explains the decrease in the loadings observed
for the previous lower wind speeds. However, a decrease in the
velocity component normal to the disk also decreases the
effective angle of attack of the blade sections and consequently
diminishes the separated flow region on the suction side of the
blades. In order to visualize this, the skin friction lines plotted
on the suction side of the NREL Phase VI blades at the 4th
, 5th
,
6th
, 7th
and 8th
seconds of the simulation are shown in Figure 18.
The figure clearly shows that, initially the flow over the suction
sides of the blades is almost fully separated except at the
leading edge region close to the tip. However, separation line
moves downstream with time and consequently the size of the
attached flow region grows. This, not only increases the torque
output, but also decreases the bending loading.

Research Article
430
Figure 17. Variation of rotor torque (left) and hub bending moment (right) with time (V = 15 m/s)
Figure 18. Skin friction lines on the suction side of NREL Phase VI blades at t = 4, 5, 6, 7 and 8 seconds
Finally loading predictions for 20 m/s wind speed are displayed
in Figure 19. Here, torque and bending moment outputs of both
turbines show oscillatory behavior at all times during the
simulation. Again the amplitude of the oscillations decrease
with time however, a steady condition is never reached because
the flow remains separated on the suction sides of the blades at
this wind speed. At the same time, the effect of decreasing
angle of attack of the blades can again be seen by considering
the initial and final values of the torque and bending moment
predictions.

Research Article
431
Figure 19. Variation of rotor torque (left) and hub bending moment (right) with time (V = 20 m/s)
CONCLUSIONS
Performance of two horizontal axis wind turbines were
analyzed under extreme operating gust and extreme direction
change conditions with different initial wind speeds. In the
former condition, the magnitude of the wind speed changes
while its direction remains fixed, whereas in the latter condition
the direction of the wind changes while its speed remains
constant. The turbines studied were, the NREL Phase VI
turbine and a turbine which was optimized for maximum
annual energy production. Both turbines were two-bladed and
had a rotor diameter of 10.06m. Performance predictions were
performed using CFD and FINE-TURBO package of
NUMECA was used for this purpose. Shaft torque, hub bending
moment and power coefficient predictions were obtained and
presented.
Comparing the performance of the two turbines studied, it
was observed that the optimized turbine produced higher torque
than NREL Phase VI rotor at lower wind speeds. This was
expected because the aerodynamic optimization of this turbine
was performed for Gökçeada, Turkey where, the mean wind
speed is about 8.8 m/s and most probable wind speed is 6 m/s.
However, this higher torque production came at the expense of
higher bending loading on the blades compared to NREL Phase
VI turbine mainly due to a more severe flow separation
observed on the suction side of the optimized blades. As the
initial wind speed of the extreme operating gust condition was
increased to 10 and 13 m/s, torque production of NREL Phase
VI turbine experienced a higher increase during the gust period
compared to the optimized turbine. However, bending moment
loading on this turbine has also increased faster. A relatively
detailed analysis on sectional blade loadings showed that this
was mainly due to the airfoil section used at the tip region of
the blades. The thinner airfoil profile used at the tip section of
the optimized blade slowed the increase of the bending
moment. Further increase of the wind speed to 15 m/s led to a
highly irregular variation in torque and bending moment
produced by the NREL Phase VI rotor. However, these
variations remained smooth for the optimized rotor. A closer
look at the sectional flow characteristics of both turbines
revealed a periodic vortex shedding in the wake of the NREL
Phase VI blades while the wake of the optimized rotor was
observed to change slowly in time. This explained the sharp
changes in the loading of the NREL Phase VI rotor. Torque and
bending moment predictions for 20 m/s initial speed yielded a
similar behavior to that was observed for 15m/s.
In the extreme direction change condition, torque and
bending moment predictions showed a considerable decline
with increasing yaw angle at low wind speeds. The amount of
decline decreased as wind speed increased, however, one also
has to note that the final yaw angle decreased with increasing
wind speed. At higher wind speeds, on the other hand, the final
torque output was higher than its initial value even though the
yaw error decreases the magnitude of the wind speed
component normal to the rotor disk, and hence the power
available in the wind. This was mainly because the lower
normal wind speed component led to a decrease in the angle of
attack of the blade sections and this prevented or delayed flow
separation on the suction sides of the blades.
The following conclusions can be drawn when the results
are reviewed:
• At low wind speeds, variations in wind speed leads to
similar variations in blade loadings. However, this
similarity degrades as the wind speed increases.
• Aerodynamic forces do not develop as fast as the wind
speed changes; therefore, the instantaneous power
coefficient of a rotor may temporarily exceed the Betz
limit as the wind speed decreases.
• Using different airfoil sections at different parts of a
blade may significantly affect its load variations at
unsteady wind conditions.
• Compared to wind speed changes, aerodynamic forces
adapt more slowly to wind direction changes.
• Although increasing yaw angle decreases the power
available in the wind, at high wind speeds shaft torque
produced by the rotor may increase with increasing
yaw angle. This due to the fact that the effective angle

Research Article
432
of attack of the blades decrease with increasing yaw
angle and the flow which is initially separated may
eventually become attached.
REFERENCES [1] Burton, T., Sharpe, D., Jenkins, N. and Bossanyi, E., 2001.
Wind Energy Handbook, Chapter 3, John Wiley & Sons,
Ltd.
[2] Hansen, M. O. L., 2008. Aerodynamics of Wind Turbines,
Earthscan, ISBN: 978-1-84407-438-9.
[3] Ceyhan, O., 2008. Aerodynamic Design and Optimization of Horizontal Axis Wind Turbines by using BEM Theory and Genetic Algorithm, MS Thesis, Middle East Technical
University, Ankara, Turkey.
[4] Sagol, E., 2010. Site Specific Design Optimization of a Horizontal Axis Wind Turbine based on Minimum Cost of Energy, MS Thesis, Middle East Technical University,
Ankara, Turkey.
[5] Alpman, E., Kimilli, M. O., Erisik, A., and Sahin, E. 2014.
Site-Specific Optiomization of a Small Scale Horizontal
Axis Wind Turbine via Micro Genetic Algorithm. Isı Bilimi ve Tekniği Dergisi - Journal of Thermal Science and Technology, 34 (1), pp. 123 – 136.
[6] Alpman,E., 2014. Effect of Selection of Design Parameters
on the Optimization of a Horizontal Axis Wind Turbine via
Genetic Algorithm. Journal of Physics: Conference Series,
524, 012044.
[7] Giguere, P., Selig, M.S., 1999. Design of a Tapered and
Twisted Blade for the NREL Combined Experiment Rotor,
NREL/SR-500-26173.
[8] Eke, G. B., Onyewuidala, J. I., 2010. Optimization of Wind
Turbine Blades using Genetic Algorithm, Global Journal of Researches in Engineering, 10, pp. 22 – 26.
[9] Diaz-Casas, V., Becerra, J.-A., Lopez-Pena, F., Duro, R. J.,
2012. Wind Turbine Design through Evolutionary
Algorithms Based on Surrogate CFD Methods,
Optimization Engineering, DOI 10.1007/s11081-012-
9187-1.
[10] Leishman, J. G., 2002. Challenges in Modelling the
Unsteady Aerodynamics of Wind Turbines, Wind Energy,
5, pp. 85 – 132.
[11] Lubitz, W. D., 2014. Impact of Ambient Turbulence on
Performance of a Small Wind Turbine, Renewable Energy,
61, pp. 69 – 73.
[12] International Standard IEC 61400-1. Wind Turbines part 1:
Design Requirements, 2005.
[13] Storey, R. C., Norris, S. E., Cater, J.E., 2014. Modelling
Turbine Loads during an Extreme Coherent Gust using
Large Eddy Simulation, Journal of Physics: Conference Series, 524, 012177.
[14] Storey, R. C., Norris, S. E., Cater, J.E., 2014. An Actuator
Sector Method for Efficient Wind Turbine Simulation,
Wind Energy, DOI: 10.1002/we.1722.
[15] Jeong, M.-S., Kim, S.-W. Lee, I., Yoo, S.-J., 2014. Wake
Impacts on Aerodynamic and Aeroelastic Behaviors of a
Horizontal Axis Wind Turbine Blade for Sheared
Turbulent Flow, Journal of Fluids and Structures, 50, pp.
66 – 78.
[16] Kim. T., Petersen, M. M., Larsen, T. J., 2014. A
Comparison Study of the Two-Bladed Partial Pitch
Turbine During Normal Operation and Extreme Gust
Conditions, Journal of Physics: Conference Series, 524,
012065.
[17] http://www.hawc2.dk/
[18] Qui, Y.-X. Wang, X.-D., Kang, S., Zhao, M., Liang, Y.-J.,
2014. Predictions of Unsteady HAWT Aerodynamics in
Yawing and Pitching using Free-Vortex Method,
Renewable Energy, 70, pp. 93 – 106.
[19] Sezer-Uzol, N., Uzol, O., 2013. Effect of Steady and
Transient Wind Shear on the Wake Structure and
Performance of a Horizontal Axis Wind Turbine Rotor,
Wind Energy, 16, pp. 1-17.
[20] Jeon, M., Lee, S., Lee, S., 2014. Unsteady Aerodynamics
of Off-Shore Floating Wind Turbines in Platform Pitching
Motion using Vortex Lattice Method, Renewable Energy,
65, pp. 207 – 212.
[21] Wekesa, D. W., Wang, C., Wei, Y., Danao, L. A. M.,
2014. Influence of Operating Conditions on Unsteady
Wind Performance of Vertical Axis Wind Turbines
Operating within a Fluctuating Free-Stream: A Numerical
Study, Journal of Wind Engineering and Industrial Aerodynamics, 135, pp. 76 – 89.
[22] Wekesa, D. W., Wang, C., Wei, Y., Kamau, J. N., Danao,
L. A. M., 2015. A Numerical Analysis of Unsteady Wind
Site for Site Specific Vertical Axis Wind Turbine: A Case
Study for Marsabit and Garissa in Kenya, Renewable Energy, 76, pp. 648 – 661.
[23] http://www.numeca.com/index.php?id=turbomachine
[24] Spalart, P. R. and Allmaras, S. R., 1992. A One-Equation
Turbulence Model for Aerodynamic Flows, AIAA Paper, 92-0439.
[25] Sorensen, N. N., Michelsen, J. A. and Schreck, S., 2002.
Navier-Stokes Predictions of the NREL Phase VI Rotor in
the NASA Ames 80ft x 120ft Wind Tunnel, Wind Energy,
5, pp. 151 – 169.
[26] FINETM
/Turbo v8.7 User Manual, Numeca International,
2010.
[27] Simms, D., Schreck, S., Hand, M. and Fingersh, L. J.,
2001. NREL Unsteady Aerodynamics Experiment in the
NASA-Ames Wind Tunnel: A Comparison of Predictions
to Measurements. NREL/TP-500-29494.
[28] Somers, D. M., 1997. Design and Experimental Results for
the S809 Airfoil, NREL/SR-440-6918.
[29] Williamson, G. A., McGranahan, B. D., Broughton, B. A.,
Deters, R. W., Brandt, J. B., Selig, M. S., 2012. Summary
of Low-Speed Airfoil Data: Volume 5, University of Illinois Low Speed Airfoil Tests.
[30] https://wind.nrel.gov/airfoils/AirfoilList.html
[31] Selig, M. S., McGranahan, B. D., 2004. Wind Tunnel Tests
of Six Airfoils for Use on Small Wind Turbines, NREL/SR-500-34515.