aerial view of the northern part of mauritius indicating...
TRANSCRIPT

Aerial view of the northern part of Mauritius indicating land use change and potential threat of sea-level rise to the coastal zone.
Page 1 of 1cover
27/05/2004http://unfccc.int/resource/docs/natc/maunc1/cover/cover.htm

Page 1 of 1Preface
27/05/2004http://unfccc.int/resource/docs/natc/maunc1/preface/preface.html
Page 1 of 1foreword
27/05/2004http://unfccc.int/resource/docs/natc/maunc1/foreword/foreword.html

CONTRIBUTORS Contributors R. BIKOO Ministry of Public Utilities Port Louis, Mauritius
Y. BOODHOO Meteorological Services Vacoas, Mauritius
K.DEEPCHAND Mauritius Sugar Authority Port Louis, Mauritius
Y. K. DWARKA Remote Sensing Lab, Ministry of Agriculture, Food Technology and Natural Resources Port Louis, Mauritius
S. FACKNATH School of Agriculture, University of Mauritius Reduit, Mauritius
N.KHADUN National Transport Corporation Port Louis, Mauritius
R. KHUSHIRAM Ministry of Economic Development, Productivity and Regional Development Port Louis, Mauritius
B.LALLJEE School of Agriculture, University of Mauritius Reduit, Mauritius
M. LEE MAN YAN Meteorological Services Vacoas, Mauritius
C.MANRAJ Central Statistical Office Port Louis, Mauritius
A. R. NAYAMUTH Mauritius Sugar Industry Research Institute, Reduit, Mauritius
Page 1 of 2Contributors
27/05/2004http://unfccc.int/resource/docs/natc/maunc1/contributors.htm

Rduit, Mauritius
L. PERSAND Central Statistical Office Port Louis, Mauritius
S. RAGOONADEN Meteorological Services Vacoas, Mauritius
S. RAMEN Ministry of Health and Quality of Life Port Louis, Mauritius
P. RAMGOLAM Department of Environment Port Louis, Mauritius
S. N. SOK APPADU Meteorological Services Vacoas, Mauritius
R. R. VAGHJEE Meteorological Services Vacoas, Mauritius
Page 2 of 2Contributors
27/05/2004http://unfccc.int/resource/docs/natc/maunc1/contributors.htm
ACKNOWLEDGEMENTS
The preparation of the initial communication was funded by the Global Environment Facilities, through its implementing agency the United Nations Environment Programme and the US – Countries Studies Programme and their support are gratefully acknowledged.
Thanks also go to all institutions, departments and private sector organisations which provided the necessary inputs and contributed towards the finalization of this report.
A special acknowledgement is extended to Messrs D.S Ramen and B. Ramlowat who were responsible for typing the manuscript and for the artwork.
Page 1 of 2El-)I I"ORS
27/05/2004http://unfccc.int/resource/docs/natc/maunc1/acknowledment.htm

LIST OF ABBREVIATIONS AND ACRONYMS USED
AFRC Albion Fisheries Research Centre
Agric Agriculture
Ann Annual
ASLR Accelerated sea level rise
c.i.f. Cost, insurance and freight
CC Climate change
CCCM Canadian Climate Centre Model
CEB Central Electricity Board
CFCs Chlorofluorocarbons
CH4 Methane
CO Carbon monoxide
CO2 Carbon dioxide
COMESA Common Market for Eastern and Southern Africa
COP Conference of Parties
DOE Department of Environment
DPV Dual purpose vehicle
EPZ Export Processing Zone
f.o.b Free on board
FAD Fish aggregating device
FCCC Framework Convention on Climate Change
GCM General Circulation Model
GDFCF Gross Domestic Fixed Capital Formation
GDP Gross Domestic Product
Page 1 of 3List of Abbre
27/05/2004http://unfccc.int/resource/docs/natc/maunc1/listofabbre.htm

GEF Global Environment Facility
GFDL Geophysical Fluid Dynamics Laboratory
GHGs Greenhouse gases
GISS Goddard Institute for Space Sciences
GNP Gross National Product
H2O Water or water vapour
HFCs Hydrofluorocarbons
ICZM Integrated Coastal Zone Management
IDA International Development Association
IOC Indian Ocean Commission
IOR - ARC Indian Ocean Rim - Association for Regional Cooperation
IPCC Intergovernmental Panel on Climate Change
ITCZ Inter Tropical Convergence Zone
ktc kilotonne carbon
ktdm kilotonne dry matter
LPG Light Petroleum Gas
LUCF Land Use Change and Forestry
M million
MACOSS Mauritius Council of Social Services
MCA Mauritius College of the Air
MW Megawatt
N2O Nitrous oxide
NA Not available
NCC National Climate Committee
Page 2 of 3List of Abbre
27/05/2004http://unfccc.int/resource/docs/natc/maunc1/listofabbre.htm

NGO Non-governmental Organisation
NMVOC Non-methane volatile organic compound
NOAA National Oceanic and Atmospheric Administration
NOX Oxides of nitrogen
O3 Ozone
OAU Organization of African Unity
º C Degree Celcius
PFCs Perfluoro-carbons
MUR Mauritian rupee
SADC South African Development Community
SIDS Small Island Developing State
SO2 Sulphur dioxide
tdm Tonnes dry matter
TOE Tonne Oil Equivalent
UKMO United Kingdom Meteorological Office
UN United Nations
UNCED United Nations Conference on Environment and Development
UNEP United Nations Environment Programme
UNFCCC United Nations Framework Convention on Climate Change
USCSP United States Country Studies Program
WHO World Health Organisation
WMO World Meteorological Organisation
Page 3 of 3List of Abbre
27/05/2004http://unfccc.int/resource/docs/natc/maunc1/listofabbre.htm

EXECUTIVE SUMMARY
INTRODUCTION
At the United Nations Conference on Environment and Development (UNCED) held in Rio de Janeiro in June 1992 leaders and decision makers, from the Republic of Mauritius along with those from over a hundred and fifty states, signed "The United Nations Framework Convention on Climate Change". This instrument was designed to start the process of controlling emissions of greenhouse gases so as to reduce global warming and its resultant predicted sea level rise. The potential threats and risks from climate changes, especially when combined with the already existing environmental problems are of grave concern for the Republic of Mauritius. The Republic of Mauritius is a member of the Small Island Developing States (SIDS), and is conscious of the potential dangers related to climate change. It had the honour of being the first nation to have ratified the "UN Framework Convention on Climate Change" in September 1992, thus binding itself to the terms of the Convention, when it came into force in March 1994.
Under the Convention articles 4 and 12, all parties are required to submit their Initial Communication three years after the Convention came into force. Mauritius was scheduled to meet its commitment by the year 1997 but since financial assistance was provided in the same year, the limit was extended to 1998.
The ultimate objective of the Convention, and any related legal instruments that the Conference of Parties (COP) may adopt, is to achieve stabilization of greenhouse gas concentrations in the atmosphere at a level that would prevent "dangerous anthropogenic interference with the climate system". Such a level should be achieved within such a time frame that will allow ecosystems to adapt naturally to climate change, to ensure food production is not threatened and to enable sustainable economic development.
To promote refinement of future scenarios for climate change and the transparent exchange of information, Parties to the Convention are required to publish, update periodically and make available to the COP their national inventories of sources of greenhouse gases and removals by sinks. Comparable methodologies developed internationally and agreed upon by the COP should be used. In addition to cooperation in research, Parties are mandated to take climate change into account, to the extent possible, in relevant future social, economic, and environmental policies and actions.
Developing countries are viewed as potentially bearing inequitable amounts of potential risks and costs from climate change; islands and nations with low-lying coastal areas will be the front-line states, as damages occur.
NATIONAL ACTIVITIES
Preceding the political impetus to take action, the Mauritius Meteorological Services took the initiative in May 1990 to create a multi-sectoral National Climate Committee (NCC) involving all Institutions and Organizations with an interest in climate change which included relevant ministries, parastatal bodies, the private sector and non-governmental
Page 1 of 7INTRODUCTION
27/05/2004http://unfccc.int/resource/docs/natc/maunc1/executivesummary.htm

organisations (NGOs). The National Climate Committee, was formally established in June 1991 under the chairmanship of the Prime Minister's Office with the Director of the Meteorological Services acting as co-chairperson and had the following objectives:
monitor progress on the science of climate change evaluate the possible impacts of climate change on key sectors of the economy.
The NCC established four working groups and evaluated potential impacts of climate change on:
agriculture coastal zones energy and water resources, and human health and welfare
A fifth working group was established within the framework of the NCC, in January 1995, to collect all available information and prepare the National Inventory of Greenhouse Gas Emissions for the year 1990.
Subsequent meetings resulted in the preparation of recommendations for a Climate Change Action Plan that was submitted and approved by the Government and published in November 1998.
FINANCIAL AND TECHNICAL SUPPORT
The United States Country Studies Program (USCSP) for Climate Change was established to assist and provide support over fifty developing countries and countries with economies-in-transition. The objectives were to build up endogenous competence for effective participation in climate change decision-making, prepare national inventory of greenhouse gases (GHGs), assess potential impacts, develop strategies for coping and elaborate those schemes into a Climate Change Action Plan. Between 1995 and 1997 the United States Country Studies Program provided funding to assist the Government of the Republic of Mauritius to accomplish these tasks.
Studies conducted within this project are listed below:
Inventory of Greenhouse Gas Emissions for the year 1990, including sources and sinks of carbon dioxide, methane, nitrous oxide and other minor greenhouse gases. Assessment of coastal vulnerability to sea level rise (studies at targeted sites). Evaluation of impacts of climate change on local agriculture with emphasis on the sugar-producing industry as well as adaptive measures. Preliminary assessment of the vulnerability of fresh water resources to climate change and climate variability.
Mauritius is also one amongst the eight countries identified and funded by the United Nations Environment Programme (UNEP) to carry out "case studies" for determining the economic and development implications of greenhouse gas limitation. A full analysis of
Page 2 of 7INTRODUCTION
27/05/2004http://unfccc.int/resource/docs/natc/maunc1/executivesummary.htm

possible mitigation measures and calculations of their cost-effectiveness is being done under the umbrella of this study. Under the project "GF/2200-97-42 Mauritius: "Enabling Activities for the preparation of Initial National Communication related to the UN Framework Convention on Climate Change (UNFCCC)", the Republic of Mauritius was provided with additional financial support by the Global Environment Facility (GEF) through the United Nations Environment Programme (UNEP), its implementing agency, to complete its National Initial Communication. The Republic of Mauritius, a group of islands of volcanic origin, has a population of over 1.1 million for an area of about 2000 km2. About 46% of its area is agricultural, 31% constitutes forests, shrubs and grazing land while the remaining 23% is devoted to settlements, infrastructure and inland water resource systems. The country enjoys a mild maritime climate with summer extending from November to April and winter from June to September. Mauritius, the main island, receives an annual average rainfall of 2100 mm, with about 70% occurring in summer. Mean maximum temperature peaks to about 31º C in the coastal areas in summer while mean minimum temperature goes down to about 14º C over the high grounds in winter. Mauritius was classified among the uppermiddle income countries with a per capita income of US$ 3442 in 1995 and Human Development Index of 0.831. The agricultural sector accounted for 9.5% of GDP while the share of the manufacturing and quatenary sectors stood at 23.7% and 11% respectively. For the same year, the tourism sector represented some 15% of total foreign exchange earnings. The country depends on imported energy carriers and in 1995, petroleum products accounted for 58.2% of total primary energy, coal for 4.8% while the share from renewable sources were 37%. Final energy consumption was 758 000 Tonnes Oil Equivalent (TOE). The inventory of greenhouse gases (GHG) has been calculated on the basis of 1995 data, which closely resembled the 1994 figures and is more reliable. More than 95% of total emissions originated from energy production, transportation and manufacturing industries. The per capita Carbon emission was 0.434.
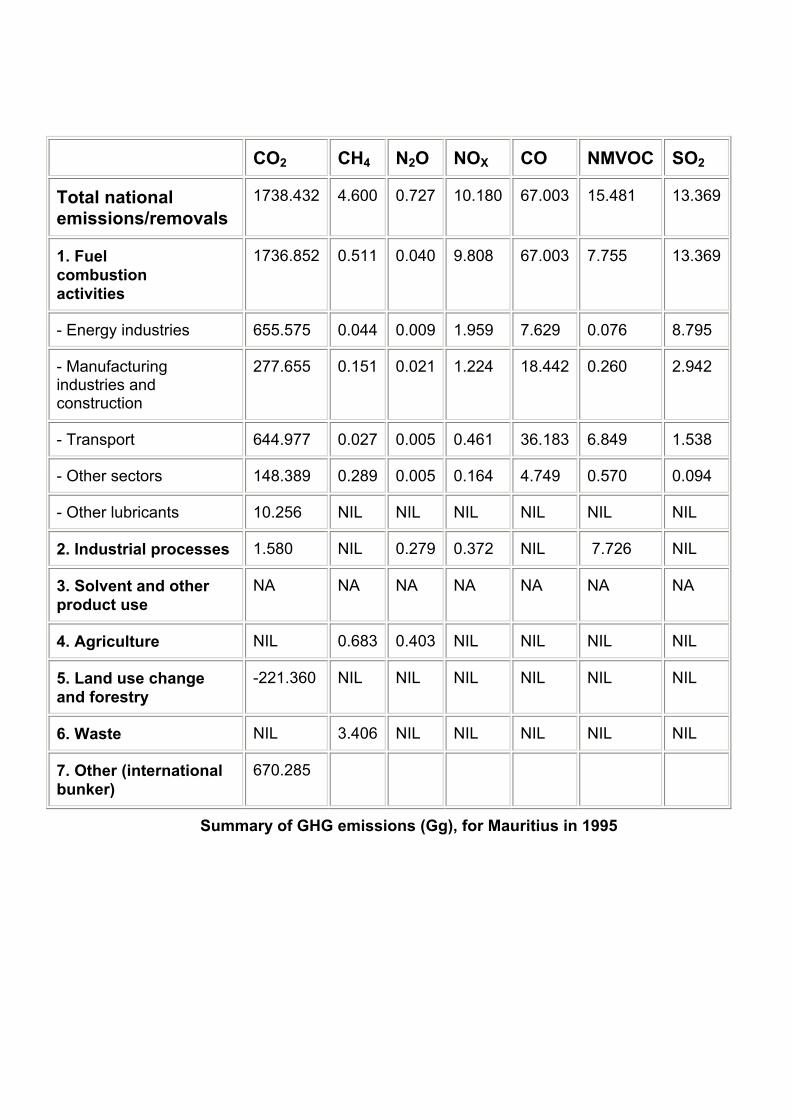
CO2 CH4 N2O NOX CO NMVOC SO2
Total national emissions/removals
1738.432 4.600 0.727 10.180 67.003 15.481 13.369
1. Fuel combustion activities
1736.852 0.511 0.040 9.808 67.003 7.755 13.369
- Energy industries 655.575 0.044 0.009 1.959 7.629 0.076 8.795
- Manufacturing industries and construction
277.655 0.151 0.021 1.224 18.442 0.260 2.942
- Transport 644.977 0.027 0.005 0.461 36.183 6.849 1.538
- Other sectors 148.389 0.289 0.005 0.164 4.749 0.570 0.094
- Other lubricants 10.256 NIL NIL NIL NIL NIL NIL
2. Industrial processes 1.580 NIL 0.279 0.372 NIL 7.726 NIL
3. Solvent and other product use
NA NA NA NA NA NA NA
4. Agriculture NIL 0.683 0.403 NIL NIL NIL NIL
5. Land use change and forestry
-221.360 NIL NIL NIL NIL NIL NIL
6. Waste NIL 3.406 NIL NIL NIL NIL NIL
7. Other (international bunker)
670.285
Summary of GHG emissions (Gg), for Mauritius in 1995

The four main cylinders of growth: agriculture, manufacturing, tourism and the quaternary sectors would be modernised and consolidated. Diversification from the monocrop sugar sector into high-value added products from cash crops would be further encouraged. The efficiency of production and marketing in the manufacturing sector would be improved for the country to move up-market into high-value added niches. While ensuring a delicate ecological balance, the tourist industry would be transformed to make Mauritius a top class quality destination providing the best services at low cost. The quatenary sector, comprising the new high-tech international financial services such as offshore banking, fund management, stock exchange and insurance is poised to become a lead sector and serve as the driving force behind the integration of the economy in the global market. Total energy requirements will be around 1.5 M TOE out of which 3500 - 4000 GWh electricity will be produced. Carbon dioxide emissions are projected to be around 6 x 10⁶ tonnes. Measures identified to reduce GHG emissions include:
• an increased use of biomass and other renewable energy sources • a shift from gasoline and diesel to LPG, together with other measures
such as improving fuel use efficiency, trip reduction and better traffic management in the transport sector
• the promotion of the use of solar water heaters, the introduction of energy efficiency home appliances and office equipment and increased public awareness on energy saving within the residential and commercial sectors
• the banning of burning sugar cane fields prior to harvest, reduction of the use of artificial fertilizers and encouraging integrated farming.

NEEDS FOR FURTHER TECHNICAL ASSISTANCE
One result of the assessment work conducted in Mauritius so far points out to the need for further investigation, research and analysis, as well as for technical training and transfer of environmentally friendly technologies from developed countries. Some funding will be made available through the United Nations under the Convention through the Global Environmental Facility, but other bilateral and multilateral sources must be tapped, both regionally and internationally. Specific areas, which need further attention and skilled personnel, include:
more sophisticated equipment to monitor coastal zone management activities training in predictive computer modeling and interpretation of models for global climate change scenarios, storm surge run-up, and integrated assessment models which include economic as well as meteorological data hardware and training in photovoltaic solar energy (installation, maintenance, trouble-shooting and repair) as well as other appropriate renewable energy technologies further research on optimal varieties of sugar cane including development, dissemination and experimentation with root stock to determine which cultivars may be able to withstand the predicted climatic changes increased usage of geographic information system software and further advanced training so that Mauritius can create layered resource maps in order to help planners update and fine-tune their awareness of vulnerabilities on a periodic basis
The vulnerability of key socio-economic sectors has been assessed and adaptation measures identified and evaluated. Incremental and climate change scenarios created from General Circulation Model outputs (GCM) and available meteorological data were used for the assessment. The accelerated sea-level rise projections adopted were 0.5, 1.0, 1.5 and 2.0 m.
The degree of vulnerability of the different sectors is very variable with the two most vulnerable being the coastal zone and the agricultural sectors. Accelerated sea-level rise is expected to result in land loss, beach erosion, damages to coastal infrastructure, degradation of coral reefs and loss of wetlands. Agricultural production will be affected through higher climate variability and extreme weather events with changes in crop development and phenology, more competition from weeds, higher incidence of pests and diseases and indirectly from availability of water resources and changes in soil physical and chemical properties. Coastal agriculture could be affected by land degradation. The risk of intrusion of salt water in coastal acquirers exists. Increased sea surface temperature, changes in nutrient availability, weather patterns, thermocline depth and warming of ocean basins will affect the fisheries industry. Some negative effects on the health and well being of the population are expected. Biodiversity will change with the possible loss of some species.
The country, due to constraints associated to small island states cannot adopt all identified adaptive measures. Some of these measures will be onerous with serious consequences on the economy of the country. Retreat and abandonment options to safeguard coastal resources are not applicable. Hence the protection and accommodation options would be more appropriate. Adaptation within the agricultural sector will come through changes in management and infrastructure rather than changes in land use. Adaptation measures for water resources are better management and the use of "gray" water. The best option for
Page 5 of 7INTRODUCTION
27/05/2004http://unfccc.int/resource/docs/natc/maunc1/executivesummary.htm
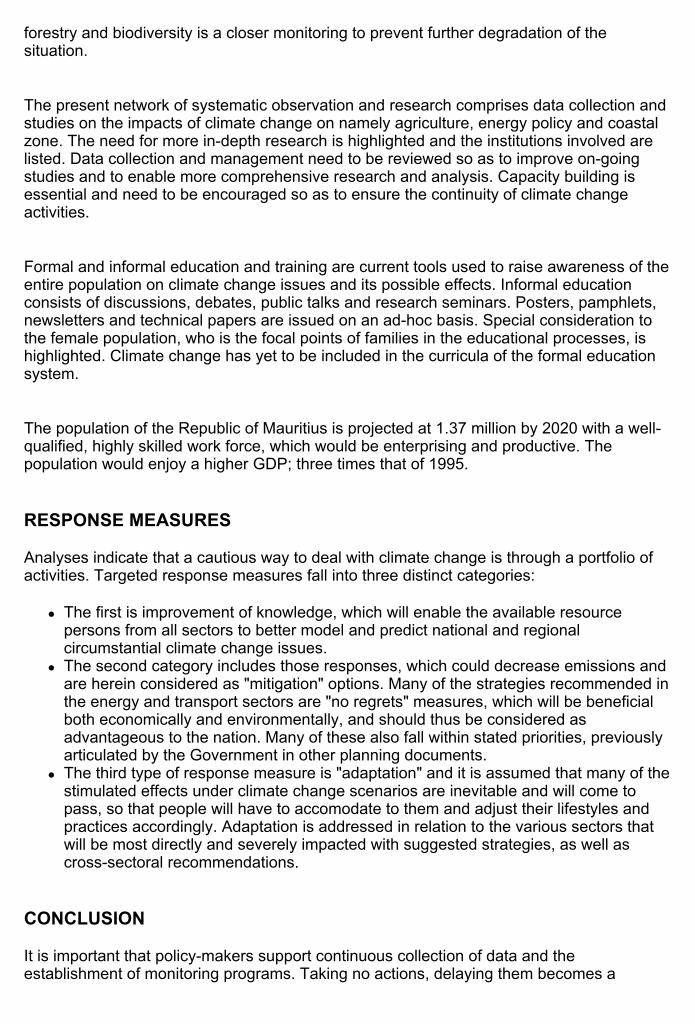
forestry and biodiversity is a closer monitoring to prevent further degradation of the situation.
The present network of systematic observation and research comprises data collection and studies on the impacts of climate change on namely agriculture, energy policy and coastal zone. The need for more in-depth research is highlighted and the institutions involved are listed. Data collection and management need to be reviewed so as to improve on-going studies and to enable more comprehensive research and analysis. Capacity building is essential and need to be encouraged so as to ensure the continuity of climate change activities.
Formal and informal education and training are current tools used to raise awareness of the entire population on climate change issues and its possible effects. Informal education consists of discussions, debates, public talks and research seminars. Posters, pamphlets, newsletters and technical papers are issued on an ad-hoc basis. Special consideration to the female population, who is the focal points of families in the educational processes, is highlighted. Climate change has yet to be included in the curricula of the formal education system.
The population of the Republic of Mauritius is projected at 1.37 million by 2020 with a well-qualified, highly skilled work force, which would be enterprising and productive. The population would enjoy a higher GDP; three times that of 1995.
RESPONSE MEASURES
Analyses indicate that a cautious way to deal with climate change is through a portfolio of activities. Targeted response measures fall into three distinct categories:
The first is improvement of knowledge, which will enable the available resource persons from all sectors to better model and predict national and regional circumstantial climate change issues. The second category includes those responses, which could decrease emissions and are herein considered as "mitigation" options. Many of the strategies recommended in the energy and transport sectors are "no regrets" measures, which will be beneficial both economically and environmentally, and should thus be considered as advantageous to the nation. Many of these also fall within stated priorities, previously articulated by the Government in other planning documents. The third type of response measure is "adaptation" and it is assumed that many of the stimulated effects under climate change scenarios are inevitable and will come to pass, so that people will have to accomodate to them and adjust their lifestyles and practices accordingly. Adaptation is addressed in relation to the various sectors that will be most directly and severely impacted with suggested strategies, as well as cross-sectoral recommendations.
CONCLUSION
It is important that policy-makers support continuous collection of data and the establishment of monitoring programs. Taking no actions, delaying them becomes a
Page 6 of 7INTRODUCTION
27/05/2004http://unfccc.int/resource/docs/natc/maunc1/executivesummary.htm

decision in itself, with costs multiplied in terms of future natural disasters such as an increase in cyclones and droughts, flood damages from storm surges, and a variety of other potential hazards resulting from climate change.
Page 7 of 7INTRODUCTION
27/05/2004http://unfccc.int/resource/docs/natc/maunc1/executivesummary.htm

CHAPTER 1 : NATIONAL CIRCUMSTANCES, 1995
BACKGROUND
General
Republic of Mauritius
The Republic of Mauritius consists of a main island, Mauritius, and a group of small islands scattered in the South West Indian Ocean namely: Rodrigues, the Cargados carajos St. Brandon, Agalega, Tromelin and the Chagos Archipelago Diego Garcia. The total land area of the Republic of Mauritius is 2040 km2. It is surrounded by coral reefs and is situated at about 2000 km off the East coast of Africa.
Exclusive Economic Zone
The Marine Exclusive economic Zone of the Republic of Mauritius is about 2 million km2 . It extends approximately from latitude 10°S to 20°S and from longitude 55° to 75°E.
GEOGRAPHY AND HISTORY OF MAURITIUS AND THE OUTER ISLANDS
Geography
Mauritius
Mauritius, an Indian Ocean island, is situated between latitudes 19°50’ south and 20°30’ south, and between longitudes 57°18’ east and 57°46’ east. It has a surface area of 1865 km2. The Island consists of an irregular Central Plateau surrounded by mountain ranges and plains. The Central Plateau has a mean elevation of about 300-400 m and rises to a maximum height of about 600 m in the South of the Island, the highest peak being 828 m. The Island is the result of four major volcanic activity periods between 7.8 million and 25 000 years ago.

Rodrigues
Rodrigues lies between latitudes 19°40’ and 19°46’ south and longitudes 63°20’ and 63°30’ east at about 720 km to the North East of Mauritius. It is the youngest of the Mascarene islands, is hilly and rocky with the highest peak rising to about 398m. Like Mauritius, it is made up of basaltic lavas but is also covered by volcanic dust in some areas. There are small areas in the South and the East where sand blown by wind has accumulated to form limestone rocks. Caves are found in these areas.
St. Brandon
St Brandon forms part of the Cargados Carajos shoals that are made up of numerous sand banks and are situated about 350 km off the North North-East of Mauritius. The main islet, Raphael island, lies at latitude 16°27’ south and longitude 59°36’ east. These sand banks undergo marked changes in their shorelines under the effects of extreme weather.

areas. There are small areas in the South and the East where sand blown by wind has accumulated to form limestone rocks. Caves are found in these areas.
St. Brandon
St Brandon forms part of the Cargados Carajos shoals that are made up of numerous sand banks and are situated about 350 km off the North North-East of Mauritius. The main islet, Raphael island, lies at latitude 16°27’ south and longitude 59°36’ east. These sand banks undergo marked changes in their shorelines under the effects of extreme weather.
Agalega
Agalega is made up of two small islands: North and South Islands, found approximately 1000 km north of Mauritius. The two islands are separated by a strip of shallow water about 1 km wide. At low tide, it is possible to walk from one island to the other. North Island lies between latitudes 10°20’ and 10°25’ south and longitudes 56°34’ and 56°38’ east. It has an elongated shape, extending along a northwest-southeast axis and is approximately 1 km wide. South Island also extends in a northwest-southeast axis, is pear-shaped and lies between latitudes 10°26’ and 10°28’ south and longitudes
Page 3 of 242.0 NATIONAL CIRCUMSTANCES 1995
27/05/2004http://unfccc.int/resource/docs/natc/maunc1/chap1/chapter1.htm

Agalega
Agalega is made up of two small islands: North and South Islands, found approximately 1000 km north of Mauritius. The two islands are separated by a strip of shallow water about 1 km wide. At low tide, it is possible to walk from one island to the other. North Island lies between latitudes 10°20’ and 10°25’ south and longitudes 56°34’ and 56°38’ east. It has an elongated shape, extending along a northwest-southeast axis and is approximately 1 km wide. South Island also extends in a northwest-southeast axis, is pear-shaped and lies between latitudes 10°26’ and 10°28’ south and longitudes 56°39’ and 56°42’ east. It is about 2 km at its widest part.
History
Mauritius was first visited by the Polynesians followed by the Arabs and the Portuguese. It was ultimately colonized by the Dutch on 20 September 1598 when Van Warwick took possession of the island and named it Mauritius. The first settlers arrived on the island, on 30 July 1638. The first birth was recorded on 14 November 1639. Sugar cane and the famous Javanese deer were introduced into the island during this period that also saw the extinction of the famous indigenous bird, the dodo. This period of colonization ended on the 16 of July 1658.
The first Frenchman, Guillaume Dufresne D’Arsel on board ‘Le Chasseur’ landed at Baie du Tombeau on 27 August 1715. The French officially took possession of the island on 20 September 1715. Under their rule, large expanses of land were allocated to French citizens willing to set up sugar cane plantations and this was the first step leading to the establishment of the agricultural base of the country. Slave labour was imported from Africa and Madagascar to work in the sugar cane plantations.
In their quest to control the route to the east the British conquered the island from the French in 1810. Inclusion in the British empire did not affect the country’s agriculture, culture and laws, as agreed under the Treaty of Paris signed in 1814, and English became the official language in 1827. After the abolition of slavery in 1835, indentured labourers were brought in from India to work in the cane plantations. A period of continuous infrastructural development followed alongside the expansion of the sugar industry. The end of the 19th century saw a continuous struggle for social and economic emancipation that resulted in the establishment of health and educational facilities. These socio-economic improvements prepared the population and paved the way towards Independence. Mauritius and its outer islands became Independent on 12 March 1968 and was proclaimed a Republic in March 1992.

The Mauritius Independence Order, which established a self-governing state, came into force on 12 March 1968, and was subsequently amended. Constitutional amendments providing for the adoption of republican status were approved by the Legislative Assembly henceforth known as the National Assembly on 10 December 1991, and came into effect on 12 March 1992. The main provisions of the revised Constitution are:
• The Head of State is the President of the Republic, who is elected by a simple majority of the National Assembly for a five-year term of office. The President appoints the Prime Minister in whom executive power is vested and, on the latter’s recommendation, other ministers.
• The council of ministers, which is headed by the Prime Minister, is appointed by the President and is responsible to the National Assembly.
• The National Assembly, which has a term of five years, comprises the Speaker, 62 members elected by universal adult suffrage, a maximum of eight additional members and the Attorney-General if not an elected member. The island of Mauritius is divided into 20 three-member constituencies for legilative elections. Rodrigues returns two members to the National Assembly. The official language of the National Assembly is English, but any member may address the Speaker in French.
• The eight additional members are best losers nominated by the electoral commissioner to maintain the ethnic balance in the National Assembly.
CLIMATE Mauritius and Rodrigues Mauritius and Rodrigues lie near the edge of the southern tropical belt and are free from the influence of large land masses or continents. They enjoy a mild maritime climate with summer extending from November to April and winter from June to September. May and October are transition months during which the weather is generally variable. Both islands are swept by trade winds throughout the year, except for some short periods, in summer months when tropical depressions approach the island. The trades are stronger and more persistent in winter when strong anticyclones pass to the south and close to the Mascarenes the islands of Reunion, Mauritius and Rodrigues. In summer, the trades are weaker as the subtropical anticyclones become less intensive and migrate polewards.
Weather systems that affect Mauritius and Rodrigues
Winter
Weather over the Mascarenes is dominated by anticyclones migrating equatorwards, and then moving eastwards along the southern high latitudes, during most of the winter months. Anticyclones are areas of high pressure around which winds blow in a counterclockwise direction southern hemisphere. These anticyclones bring cold air over the region and at times can penetrate up to latitude 10° south.
Cold fronts, a belt of active weather with cold air replacing warm tropical air, cross the latitudes of the Mascarenes at a frequency of about one per week, giving rise to rainy and chilly weather with sudden significant drops in air temperature.
In between the anticyclones, cool and fine weather prevails when Mauritius remains in a region of light wind conditions. Trades, blowing in winter months, are very strong and gusts reaching more than 70 km h-1 are often recorded.

Summer
Weather remains under the influence of systems coming mainly from the east. The sub-tropical anticyclones migrate further towards the pole and weaken at the same time giving rise to lighter trades over the region.
Low pressure areas and waves in the easterlies from the equatorial region, are frequently observed in the vicinity of the region and adverse weather conditions occur when these systems affect Mauritius or Rodrigues.
The Inter Tropical Convergence Zone, ITZC, a belt of thundery weather where air masses from both hemispheres meet, usually lies between latitudes 08° and 15° south. It influences weather at times over the region, giving rise to torrential rains.
Tropical Cyclones
The cyclonic season officially starts on 1 November and ends on 15 May. On average, ten named tropical depressions are tracked in the South-West Indian Ocean and of these, three reach tropical cyclone intensity. On average one tropical cyclone passes within 100 km of Mauritius each year.
Formation / Classification of Tropical Cyclones
Tropical Cyclones usually form on the Inter-tropical Convergence Zone ITCZ. Small waves, on the ITCZ develop into vortices that sometimes intensify into tropical storms. They are named on reaching moderate intensity.
Classification of tropical storms
Class Maximum wind speed kmh-
1 Tropical Storm below 61 Moderate Tropical Storm 62-88 Severe Tropical Storm 89-117 Tropical Cyclone 118-165 Intense Tropical Cyclone 166-212 Very Intense Tropical Cyclone above 212
Tracking of Tropical Cyclones
Tropical cyclones are tracked through satellite imageries: the NOAA polar-orbiting satellite and the METEOSAT geo-stationary satellite. Another operational tool is the use of the traditional weather chart analysis. The accuracy of locating the center position from chart analysis is poor, especially in areas where data is sparse, such as the South West Indian Ocean. Information from world centres also help in the positioning of tropical cyclone centres. Furthermore, when tropical cyclones arrive within 400 km of Mauritius, tracking becomes more accurate through the use of a 10 cm weather radar.
Cyclone Warning System
Whenever a tropical cyclone threatens Mauritius or Rodrigues, cyclone warnings are issued to enable inhabitants to take necessary precautions. The cyclone warning system comprises four classes of warnings each being determined by the degree of risk of cyclonic conditions. These warnings are issued taking into consideration the lead time necessary for the population to take precautionary measures.
Classes of warnings
Class I: 36-48 hours before Mauritius or Rodrigues is likely to be affected
Class II: as far as practicable, 12 hours of daylight lead time before the occurrence of gusts of 120 Km hr-1
Class III: as far as practicable, a lead time of 6 daylight hours before the advent of gusts of 120 Km hr-1
Class IV: gusts of the order of 120 Km hr-1 have occurred and are expected to continue

These cyclone warnings are disseminated through the radio, television, telephone and the press. A visual form of warning is also used, the number of red flags hoisted on public buildings indicates the class of warning in force.
Mauritius and Rodrigues are exposed to the risks of tropical cyclones. The latter's future behaviour under expected climate change scenarios, especially their intensities and destructive forces are being projected to be more severe. The impacts of tropical cyclones on the economies of small island states are well-known. Increased severity may cause greater setbacks to these economies which would take more time to recover.
Climate parameters
Rainfall
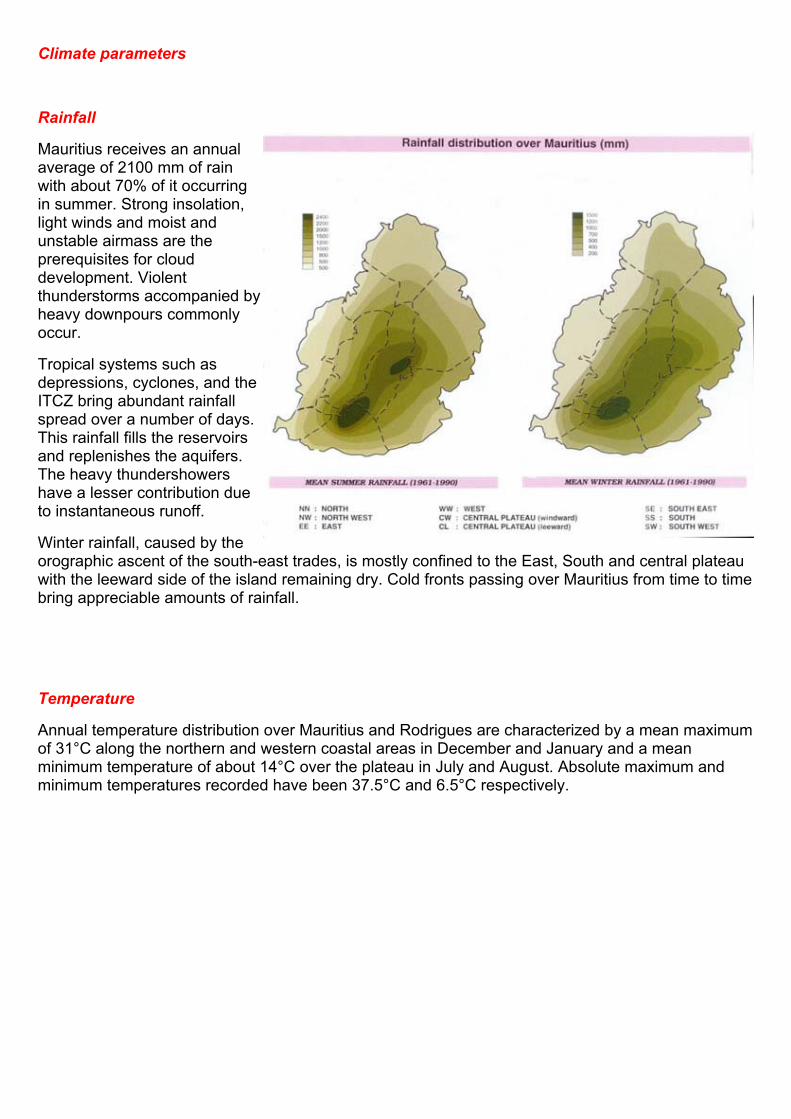
Mauritius receives an annual average of 2100 mm of rain with about 70% of it occurring in summer. Strong insolation, light winds and moist and unstable airmass are the prerequisites for cloud development. Violent thunderstorms accompanied by heavy downpours commonly occur.
Tropical systems such as depressions, cyclones, and the ITCZ bring abundant rainfall spread over a number of days. This rainfall fills the reservoirs and replenishes the aquifers. The heavy thundershowers have a lesser contribution due to instantaneous runoff.
Winter rainfall, caused by the orographic ascent of the south-east trades, is mostly confined to the East, South and central plateau with the leeward side of the island remaining dry. Cold fronts passing over Mauritius from time to time bring appreciable amounts of rainfall.
Temperature
Annual temperature distribution over Mauritius and Rodrigues are characterized by a mean maximum of 31°C along the northern and western coastal areas in December and January and a mean minimum temperature of about 14°C over the plateau in July and August. Absolute maximum and minimum temperatures recorded have been 37.5°C and 6.5°C respectively.

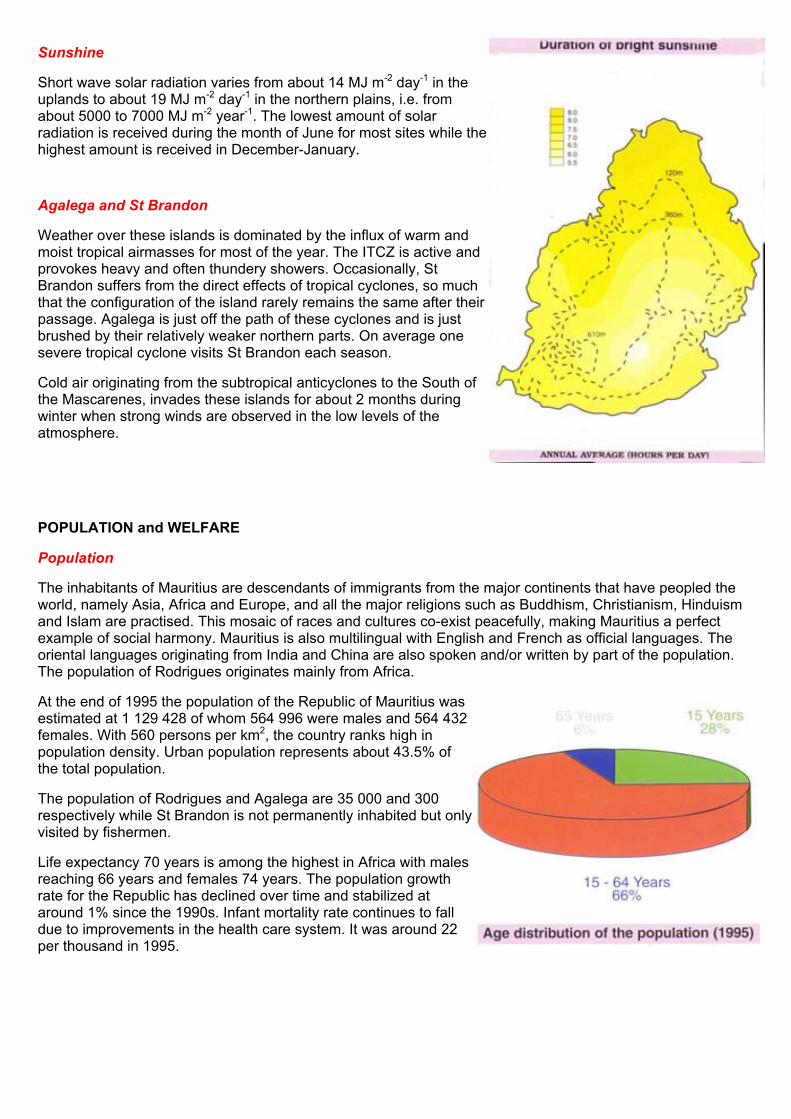
Sunshine
Short wave solar radiation varies from about 14 MJ m-2 day-1 in the uplands to about 19 MJ m-2 day-1 in the northern plains, i.e. from about 5000 to 7000 MJ m-2 year-1. The lowest amount of solar radiation is received
Page 10 of 242.0 NATIONAL CIRCUMSTANCES 1995
27/05/2004http://unfccc.int/resource/docs/natc/maunc1/chap1/chapter1.htm
Sunshine
Short wave solar radiation varies from about 14 MJ m-2 day-1 in the uplands to about 19 MJ m-2 day-1 in the northern plains, i.e. from about 5000 to 7000 MJ m-2 year-1. The lowest amount of solar radiation is received during the month of June for most sites while the highest amount is received in December-January.
Agalega and St Brandon
Weather over these islands is dominated by the influx of warm and moist tropical airmasses for most of the year. The ITCZ is active and provokes heavy and often thundery showers. Occasionally, St Brandon suffers from the direct effects of tropical cyclones, so much that the configuration of the island rarely remains the same after their passage. Agalega is just off the path of these cyclones and is just brushed by their relatively weaker northern parts. On average one severe tropical cyclone visits St Brandon each season.
Cold air originating from the subtropical anticyclones to the South of the Mascarenes, invades these islands for about 2 months during winter when strong winds are observed in the low levels of the atmosphere.
POPULATION and WELFARE
Population
The inhabitants of Mauritius are descendants of immigrants from the major continents that have peopled the world, namely Asia, Africa and Europe, and all the major religions such as Buddhism, Christianism, Hinduism and Islam are practised. This mosaic of races and cultures co-exist peacefully, making Mauritius a perfect example of social harmony. Mauritius is also multilingual with English and French as official languages. The oriental languages originating from India and China are also spoken and/or written by part of the population. The population of Rodrigues originates mainly from Africa.
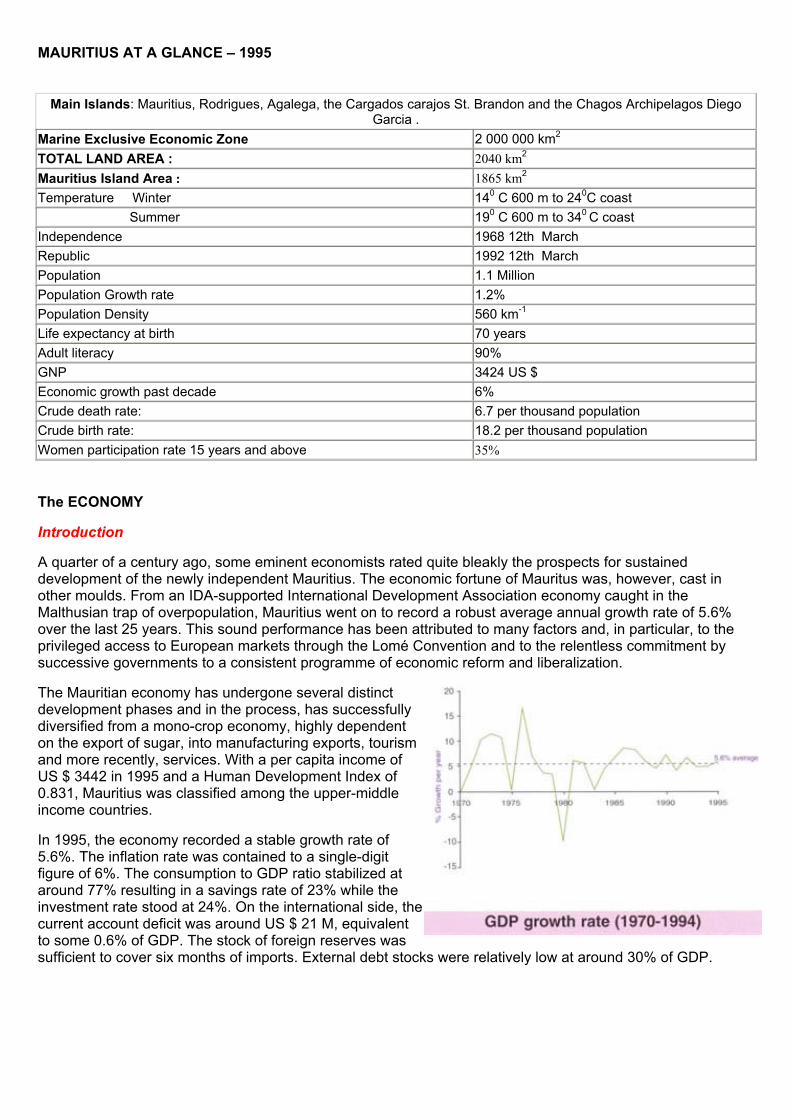
At the end of 1995 the population of the Republic of Mauritius was estimated at 1 129 428 of whom 564 996 were males and 564 432 females. With 560 persons per km2, the country ranks high in population density. Urban population represents about 43.5% of the total population.
The population of Rodrigues and Agalega are 35 000 and 300 respectively while St Brandon is not permanently inhabited but only visited by fishermen.
Life expectancy 70 years is among the highest in Africa with males reaching 66 years and females 74 years. The population growth rate for the Republic has declined over time and stabilized at around 1% since the 1990s. Infant mortality rate continues to fall due to improvements in the health care system. It was around 22 per thousand in 1995.

Welfare
Mauritius has established a comprehensive social welfare system with a wide range of assistance schemes such as old age pensions, basic widow’s pensions, basic invalid pension and other non-contributory social benefits to cater for the needy. There are programmes for poverty alleviation to ensure that the poor are not excluded from the mainstream of socio-economic development. The entire population has access to free medical services that has resulted in a very significant improvement in the health status of the population. Nearly 50% of the national budget is spent on the social sector.
The 1990 Population and Housing Census data indicated a general improvement in the living conditions of the population. The number of households having access to electricity and piped water has increased markedly to reach more than 90% in 1995.
Education and Training systems
The education system in Mauritius is a four-tiered one, consisting of the pre-primary, primary, secondary and tertiary levels. Mauritius is one of the few countries with free education from the pre-primary to the tertiary levels. Primary education is obligatory for all children between the ages of 4 and 11. Adult literacy rate is about 90%.
It should be noted that only 3% of the primary education population reach the tertiary level in Mauritius and have the possibility to study climate change issues. Such an important subject cannot be restricted to such a small percentage of the student population.
The Ministry of Education and Human Resources is laying strong emphasis to further promote science subjects at different levels in the national curriculum. One of the main objectives of this policy is to raise awareness on climate change issues.
Professional and Vocational training are offered by other institutions which also raise public awareness on environment and climate issues in relation to specific areas of interest.
Professional and Vocational training institutions:
• Industrial Vocational Training Board IVTB
• The Department of Environment DOE and its Information, Education and Resources Division
• National Parks and Conservation Service NPCS, forming part of the Ministry of Agriculture, Fisheries and Co-operatives MOAFCOOP
• Youth centres operating under Ministry of Youth and Sports MYS
• Mauritius Institute of Public Administration and Management MIPAM
• Mauritius College of the Air MCA
• Mahatma Gandhi Institute MGI
MAURITIUS AT A GLANCE – 1995
Main Islands: Mauritius, Rodrigues, Agalega, the Cargados carajos St. Brandon and the Chagos Archipelagos Diego Garcia .
Marine Exclusive Economic Zone 2 000 000 km2 TOTAL LAND AREA : 2040 km2 Mauritius Island Area : 1865 km2 Temperature Winter 140 C 600 m to 240C coast Summer 190 C 600 m to 340 C coast Independence 1968 12th March Republic 1992 12th March Population 1.1 Million Population Growth rate 1.2% Population Density 560 km-1 Life expectancy at birth 70 years Adult literacy 90% GNP 3424 US $ Economic growth past decade 6% Crude death rate: 6.7 per thousand population Crude birth rate: 18.2 per thousand population Women participation rate 15 years and above 35%
The ECONOMY
Introduction
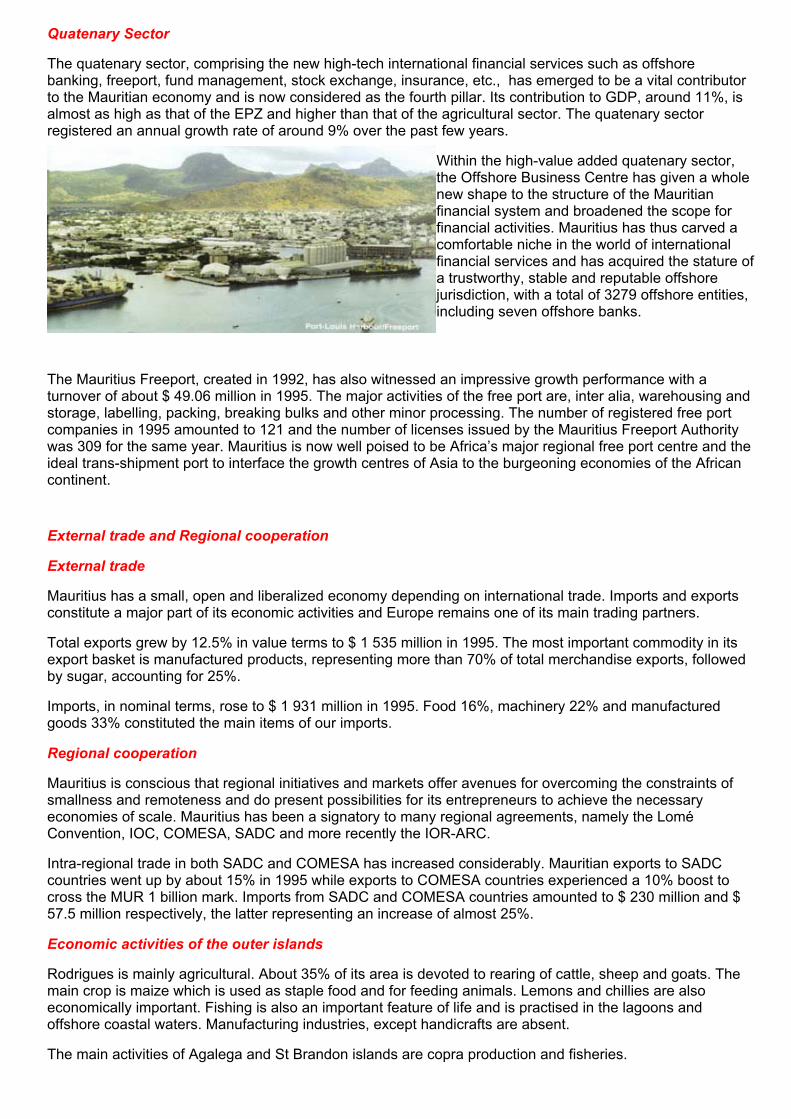
A quarter of a century ago, some eminent economists rated quite bleakly the prospects for sustained development of the newly independent Mauritius. The economic fortune of Mauritus was, however, cast in other moulds. From an IDA-supported International Development Association economy caught in the Malthusian trap of overpopulation, Mauritius went on to record a robust average annual growth rate of 5.6% over the last 25 years. This sound performance has been attributed to many factors and, in particular, to the privileged access to European markets through the Lomé Convention and to the relentless commitment by successive governments to a consistent programme of economic reform and liberalization.
The Mauritian economy has undergone several distinct development phases and in the process, has successfully diversified from a mono-crop economy, highly dependent on the export of sugar, into manufacturing exports, tourism and more recently, services. With a per capita income of US $ 3442 in 1995 and a Human Development Index of 0.831, Mauritius was classified among the upper-middle income countries.
In 1995, the economy recorded a stable growth rate of 5.6%. The inflation rate was contained to a single-digit figure of 6%. The consumption to GDP ratio stabilized at around 77% resulting in a savings rate of 23% while the investment rate stood at 24%. On the international side, the current account deficit was around US $ 21 M, equivalent to some 0.6% of GDP. The stock of foreign reserves was sufficient to cover six months of imports. External debt stocks were relatively low at around 30% of GDP.


Agricultural Sector
The Sugar industry has been the backbone of the Mauritian economy since the dawn of our economic history. It is still an important economic player, although in the diversification process it has been overtaken by the manufacturing sector both in terms of export earnings and employment. With a total cultivated area of 76 839 hectares in 1995, it accounted for about 88% of total arable land, 7% of GDP and about 13% of employment.
The sugar industry is expected to continue to be one of the important engines of growth in the future because of preferential prices on guaranteed markets. Mauritius has an ACP quota of 507 000 tonnes of sugar with the European Union under the Sugar Protocol and 13 000 tonnes with the USA. In June 1995, Mauritius benefited from an additional quota of 85 000 tons for the period July 1995 to June 2001 under the Special Preferential Agreement.
Manufacturing Sector
The major driving force of the Mauritian economy since the mid 1980s has been the manufacturing sector. The rapid growth in this sector was concentrated in the Export Processing Zone EPZ which now produces around 50% of total manufacturing value added. In 1995, the EPZ contributed to 10.3% of GDP, to some 28% of total employment and 70% of foreign earnings. EPZ production, growing at an average rate of 12%, is dominated by textiles and garments which account for 85% of total EPZ employment and 75% of EPZ export earnings.
Tourism Sector
The tourism industry has established itself as another of the main cylinders of growth. In 1995, tourist earnings grew by 9%, representing some 15% of total foreign exchange earnings. Our main source markets for the tourist sector continue to be Europe 55% followed by Réunion Island 19% and South Africa 10%. The number of tourist arrivals followed its upward trend to cross the 400 000 mark in 1995. Mauritius will continue to promote itself as a quality destination catering to the long haul high-spending end of the market.
Quatenary Sector
The quatenary sector, comprising the new high-tech international financial services such as offshore banking, freeport, fund management, stock exchange, insurance, etc., has emerged to be a vital contributor to the Mauritian economy and is now considered as the fourth pillar. Its contribution to GDP, around 11%, is almost as high as that of the EPZ and higher than that of the agricultural sector. The quatenary sector registered an annual growth rate of around 9% over the past few years.
Within the high-value added quatenary sector, the Offshore Business Centre has given a whole new shape to the structure of the Mauritian financial system and broadened the scope for financial activities. Mauritius has thus carved a comfortable niche in the world of international financial services and has acquired the stature of a trustworthy, stable and reputable offshore jurisdiction, with a total of 3279 offshore entities, including seven offshore banks.
The Mauritius Freeport, created in 1992, has also witnessed an impressive growth performance with a turnover of about $ 49.06 million in 1995. The major activities of the free port are, inter alia, warehousing and storage, labelling, packing, breaking bulks and other minor processing. The number of registered free port companies in 1995 amounted to 121 and the number of licenses issued by the Mauritius Freeport Authority was 309 for the same year. Mauritius is now well poised to be Africa’s major regional free port centre and the ideal trans-shipment port to interface the growth centres of Asia to the burgeoning economies of the African continent.
External trade and Regional cooperation
External trade
Mauritius has a small, open and liberalized economy depending on international trade. Imports and exports constitute a major part of its economic activities and Europe remains one of its main trading partners.
Total exports grew by 12.5% in value terms to $ 1 535 million in 1995. The most important commodity in its export basket is manufactured products, representing more than 70% of total merchandise exports, followed by sugar, accounting for 25%.
Imports, in nominal terms, rose to $ 1 931 million in 1995. Food 16%, machinery 22% and manufactured goods 33% constituted the main items of our imports.
Regional cooperation
Mauritius is conscious that regional initiatives and markets offer avenues for overcoming the constraints of smallness and remoteness and do present possibilities for its entrepreneurs to achieve the necessary economies of scale. Mauritius has been a signatory to many regional agreements, namely the Lomé Convention, IOC, COMESA, SADC and more recently the IOR-ARC.
Intra-regional trade in both SADC and COMESA has increased considerably. Mauritian exports to SADC countries went up by about 15% in 1995 while exports to COMESA countries experienced a 10% boost to cross the MUR 1 billion mark. Imports from SADC and COMESA countries amounted to $ 230 million and $ 57.5 million respectively, the latter representing an increase of almost 25%.
Economic activities of the outer islands
Rodrigues is mainly agricultural. About 35% of its area is devoted to rearing of cattle, sheep and goats. The main crop is maize which is used as staple food and for feeding animals. Lemons and chillies are also economically important. Fishing is also an important feature of life and is practised in the lagoons and offshore coastal waters. Manufacturing industries, except handicrafts are absent.
The main activities of Agalega and St Brandon islands are copra production and fisheries.

ENERGY
Primary energy
Indigenous energy resources of Mauritius are limited and consist mainly of biomass, hydro and fuelwood since the country has no known reserves of oil, gas or coal and no refinery. The country's requirements depend mainly on imported energy carriers. During the last ten years, the energy sector has witnessed sustained increase in primary energy, used mainly for industrial, transport, commercial and domestic sectors. The total primary energy requirements of Mauritius vary significantly and depend on the volume of bagasse, a by-product of the sugar industry, available for power generation by sugar factories. There are currently no major economic uses for bagasse other than power generation.
In 1995, petroleum products accounted for 58.2% of total primary energy followed by bagasse 32.5%, coal, 4.8% and hydro and fuelwood, 4.5%. Consumption of petroleum products was dominated by four types of fuels namely fuel oil, dual purpose kerosene, gasoil and light petroleum gas Lpg and their total imports reached 725 000 t in 1995.
Energy transformation and production
The lack of fossil energy carriers strongly characterized the energy transformation processes which means that non-indigenous carriers are imported in the form of their final use.
Energy conversion consists of four transformation segments namely:
• generation of electricity in oil-based power stations
• production of steam and generation of electricity from bagasse
• transformation of coal into electricity and
• production of small amounts of charcoal from fuel wood.
The Central Electricity Board CEB is the body, responsible for the production and distribution of electricity. It had an installed capacity of 365 MW of which the available capacity was limited to 312 MW because of permanent deratings due to ageing and other operational constraints. CEB operates eight hydroelectric plants with a combined capacity of 60 MW of which 15 MW can be considered firm. It also operates three heavy fuel power plants with an installed capacity of 173 MW and a kerosene fired gas turbine power station of 80 MW capacity. Thirteen sugar factories having an installed capacity of 52 MW, also provide surplus electricity to the CEB grid. The thermal power stations using imported fuel oil produced 788 GWh representing 75% of electricity generated in 1995. The hydro-power plants accounted for 13% and the sugar factories 12%. The most plentiful indigenous source of energy is bagasse. The seasonality and variability in sugar production require power plants at sugar mills to use the dual fuel system bagasse-cum-coal to supply power to the grid at guaranteed levels all year round. The hydroelectric potential of the country has largely been developed. The installed capacity of the plants in 1995 was about 60 MW. During the past ten years, output from hydro generation has been uneven, varying between 75 GWh and 148 GWh. The average annual output has been 108 GWh equivalent to about 24 000 tonnes of oil. The medium - to longer term prospects are that hydro generation would stagnate at around 130 GWh annually,
Consumption
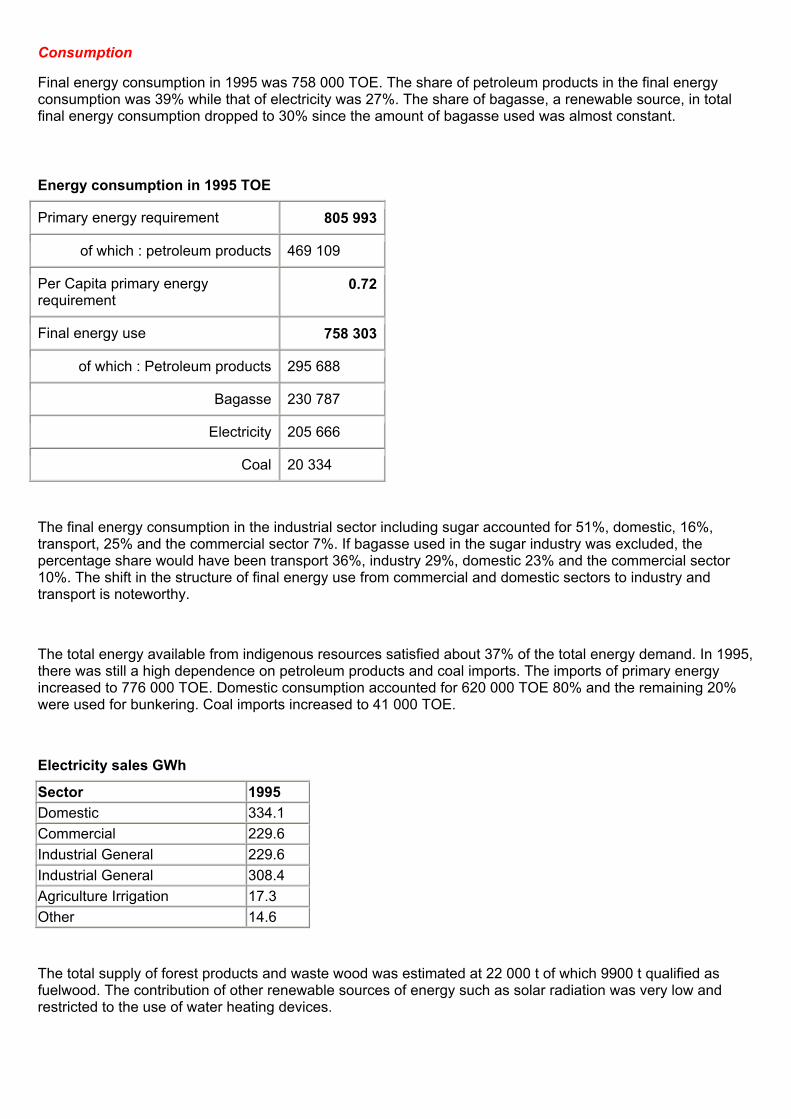
Final energy consumption in 1995 was 758 000 TOE. The share of petroleum products in the final energy consumption was 39% while that of electricity was 27%. The share of bagasse, a renewable source, in total final energy consumption dropped to 30% since the amount of bagasse used was almost constant.
Energy consumption in 1995 TOE
Primary energy requirement 805 993
of which : petroleum products 469 109
Per Capita primary energy requirement
0.72
Final energy use 758 303
of which : Petroleum products 295 688
Bagasse 230 787
Electricity 205 666
Coal 20 334
The final energy consumption in the industrial sector including sugar accounted for 51%, domestic, 16%, transport, 25% and the commercial sector 7%. If bagasse used in the sugar industry was excluded, the percentage share would have been transport 36%, industry 29%, domestic 23% and the commercial sector 10%. The shift in the structure of final energy use from commercial and domestic sectors to industry and transport is noteworthy.
The total energy available from indigenous resources satisfied about 37% of the total energy demand. In 1995, there was still a high dependence on petroleum products and coal imports. The imports of primary energy increased to 776 000 TOE. Domestic consumption accounted for 620 000 TOE 80% and the remaining 20% were used for bunkering. Coal imports increased to 41 000 TOE.
Electricity sales GWh
Sector 1995 Domestic 334.1 Commercial 229.6 Industrial General 229.6 Industrial General 308.4 Agriculture Irrigation 17.3 Other 14.6
The total supply of forest products and waste wood was estimated at 22 000 t of which 9900 t qualified as fuelwood. The contribution of other renewable sources of energy such as solar radiation was very low and restricted to the use of water heating devices.

TRANSPORT
The transportation sector can be divided into three main categories namely:
• agricultural
• commercial
• passenger transport. The total demand for transport in 1995 was 25 million tonnes of freight and 259 million passengers.
Essential travel for attending work or school represent 65% of the total passenger volume. The modal share in 1995 was 67% for buses, 27% for private cars and dual purpose vehicles DPV and 6% for motorcycles. As for freight transport, there is a tendency towards the use of vehicles with higher payloads in order to cater for bulk transportation and containerization to benefit from economies of scale. There is a large number of small trucks in use to satisfy the demand in the industrial and distributive trade sectors. As a result of an increase in mobility and government decision to grant custom duty concessions on the purchase of utility vehicles, cars and motorcycles, the vehicle fleet has grown at an average rate of 7% yearly. In 1995, the registered vehicle population was 191 000.
Distribution of vehicles in 1995
Type of vehicle Number
Light and heavy trucks 19 665
Buses 2660
Cars and DPVs 64 375
Motorcycles 97 810
Tractors and trailers 6490
All gasoline and about 44% of imported diesel were used in the transportation sector in 1995.
LAND USE CHANGE AND FORESTRY Land is a basic natural resource and is essential to sustainable development. It provides food, fodder, energy, settlements and industries. The growth in population, industrialization and urbanization has brought considerable changes in land use and hence cover. Land is being increasingly subjected to degradation due to lack of proper management stragtegies. Sustainable land development is crucial, especially for small island countries like Mauritius.
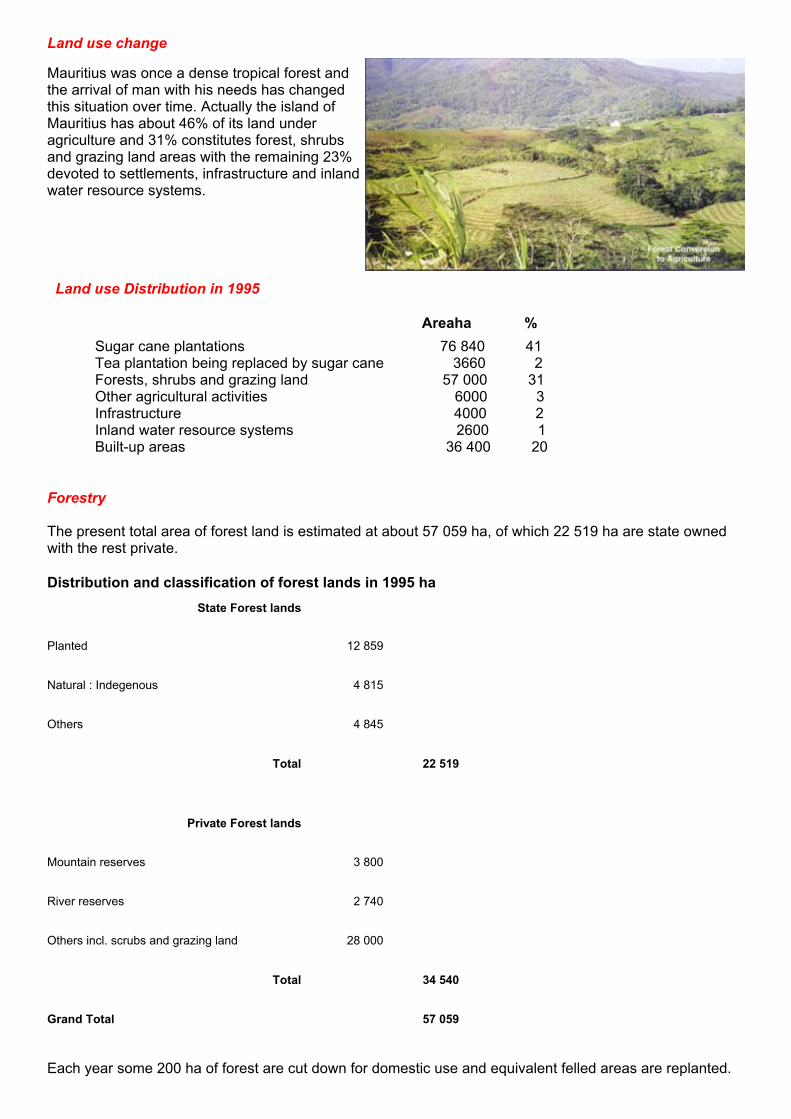
Land use change
Mauritius was once a dense tropical forest and the arrival of man with his needs has changed this situation over time. Actually the island of Mauritius has about 46% of its land under agriculture and 31% constitutes forest, shrubs and grazing land areas with the remaining 23% devoted to settlements, infrastructure and inland water resource systems.
Land use Distribution in 1995
Areaha % Sugar cane plantations 76 840 41 Tea plantation being replaced by sugar cane 3660 2 Forests, shrubs and grazing land 57 000 31 Other agricultural activities 6000 3 Infrastructure 4000 2 Inland water resource systems 2600 1 Built-up areas 36 400 20
Forestry The present total area of forest land is estimated at about 57 059 ha, of which 22 519 ha are state owned with the rest private. Distribution and classification of forest lands in 1995 ha
State Forest lands
Planted 12 859
Natural : Indegenous 4 815
Others 4 845
Total 22 519
Private Forest lands
Mountain reserves 3 800
River reserves 2 740
Others incl. scrubs and grazing land 28 000
Total 34 540
Grand Total 57 059
Each year some 200 ha of forest are cut down for domestic use and equivalent felled areas are replanted.
BIODIVERSITY
Prior to the arrival of man, Mauritius was home to a rich diversity of indigenous flora and fauna, of which most have now disappeared. Today less than 1% of the original indigenous vegetation remains and these areas have been declared as Nature Reserves.
Birds and bats, the only mammals before the arrival of man and a few hardy land animals established themselves to evolve into unique species on the island. With very few predators the birds which have aririved on the island also evolved into highly unusual and unique forms.
There has been a drastic decline in populations of endemic birds, reptiles and other animals, many of which are on the verge of extinction. Mauritius has the third largest number of threatened animal species in the world due to human activity.
List of endangered animal species in Mauritius
Common name Biological name Status
Echo Parakeet Psittacula echo Critical
Mauritius Fody Foudia rubra Very rare
Olive White-eye Zosterops chloronothos Very rare
Cuckoo Shrike Coracina typica Rare
Mauritius Kestrel Falco punctatus Endangered
Pink Pigeon Neseona mayeri Endangered
Rodrigues Fruit Bat Pteropus rodricensis Endangered
Rodrigues Warbler Brebornis rodricanus Very rare
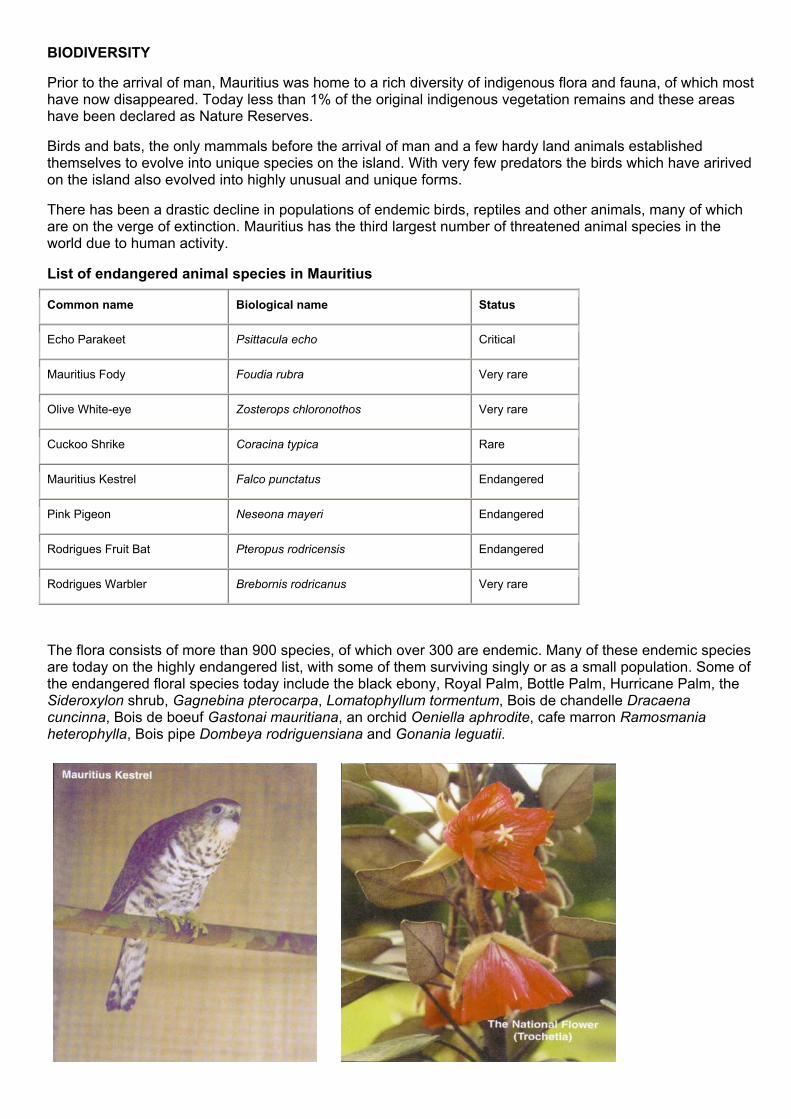
The flora consists of more than 900 species, of which over 300 are endemic. Many of these endemic species are today on the highly endangered list, with some of them surviving singly or as a small population. Some of the endangered floral species today include the black ebony, Royal Palm, Bottle Palm, Hurricane Palm, the Sideroxylon shrub, Gagnebina pterocarpa, Lomatophyllum tormentum, Bois de chandelle Dracaena cuncinna, Bois de boeuf Gastonai mauritiana, an orchid Oeniella aphrodite, cafe marron Ramosmania heterophylla, Bois pipe Dombeya rodriguensiana and Gonania leguatii.
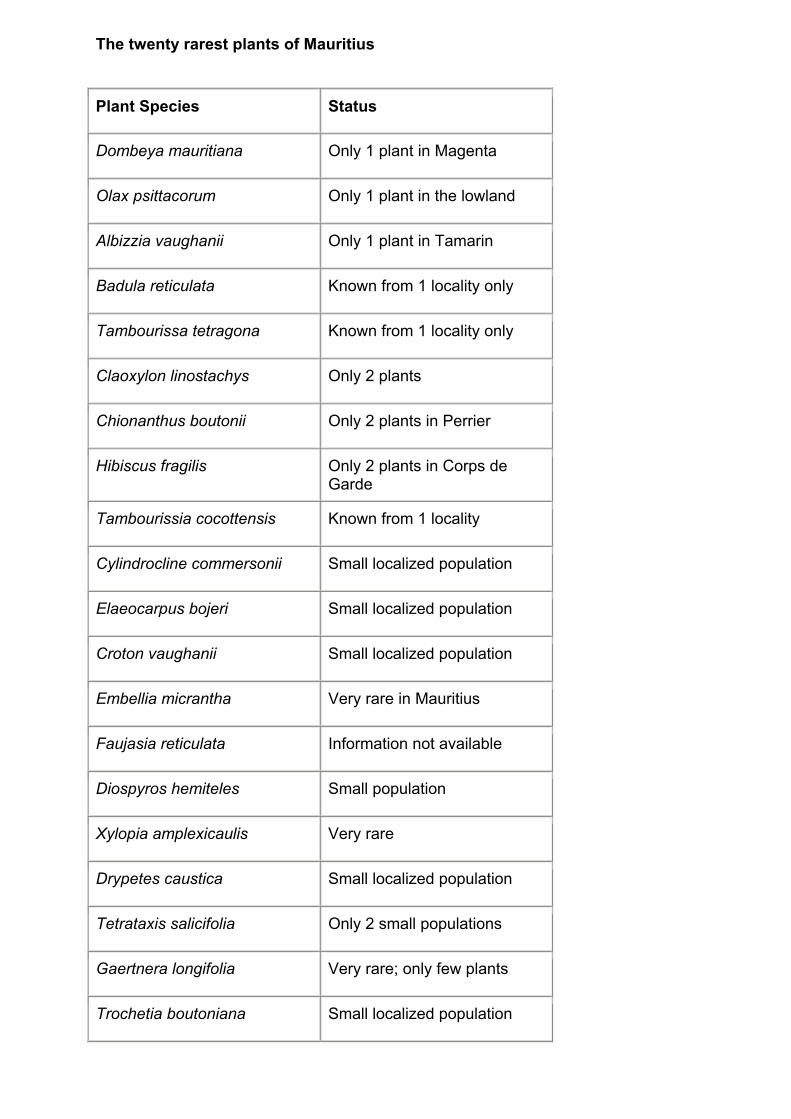
The twenty rarest plants of Mauritius
Plant Species Status
Dombeya mauritiana Only 1 plant in Magenta
Olax psittacorum Only 1 plant in the lowland
Albizzia vaughanii Only 1 plant in Tamarin
Badula reticulata Known from 1 locality only
Tambourissa tetragona Known from 1 locality only
Claoxylon linostachys Only 2 plants
Chionanthus boutonii Only 2 plants in Perrier
Hibiscus fragilis Only 2 plants in Corps de Garde
Tambourissia cocottensis Known from 1 locality
Cylindrocline commersonii Small localized population
Elaeocarpus bojeri Small localized population
Croton vaughanii Small localized population
Embellia micrantha Very rare in Mauritius
Faujasia reticulata Information not available
Diospyros hemiteles Small population
Xylopia amplexicaulis Very rare
Drypetes caustica Small localized population
Tetrataxis salicifolia Only 2 small populations
Gaertnera longifolia Very rare; only few plants
Trochetia boutoniana Small localized population

CHAPTER 2 : NATIONAL INVENTORY OF GREENHOUSE GASES
SUMMARY
In accordance with Article 4.1 a of the United Nations Framework Convention on Climate Change, all parties to the Convention are requested to update and report periodically on their national inventory of anthropogenic emissions and removals of greenhouse gases.
There is no primary fuel production in the Republic of Mauritius. Since all fuels are imported, the Republic is fully dependent on market vacillation and price fluctuation. Secondary fuel is imported for local consumption. Except for international marine and air bunkering, fossil fuel is not exported.
Greenhouse gas emissions and removals by sinks have been calculated for the year 1995, using the 1996 Intergovernmental Panel on Climate Change IPCC guidelines for the Preparation of National Communications, inclusive of all the six identified items.
Energy-related activities are the most significant contributors of greenhouse gases. Energy is produced mostly through the combustion of fossil fuels such as petroleum, natural gas and coal, which accounts for 90% of the total with the remaining 10% from hydropower and biomass.
Carbon Dioxide CO2 emissions 1995 Carbon dioxide is produced from a variety of fossil fuels used for activities such as public electricity production, transport, manufacturing industries, commercial and residential buildings. Industrial processes, agriculture, forestry and fisheries contribute insignificantly. Other gases like methane, nitrogen dioxide, nitrous oxides, carbon monoxide, non-methane volatile organic compounds and sulphur dioxide accounted for about 5% of the total greenhouse gas emission.


Non CO2 Emissions Gg
GAS CH4 N20 NOX CO NMVOC SO2 AMOUNT 4.600 0.727 10.180 67.003 15.481 13.369
INTRODUCTION
Climate Systems and Radiative Forces
Solar energy is the main source of power that drives the climate systems of the earth. About 70% of the short wave solar radiation is absorbed by the earth’s surface, oceans, ice caps and the lower atmosphere known as the troposphere. The rest is re-radiated into space. The absorbed short wave solar radiation is reflected back into the atmosphere in the form of out-going long wave infrared radiation. Some atmospheric gases, existing naturally in the atmosphere and known as greenhouse gases GHGs, can absorb or "trap" the outgoing long wave radiation emitted from the earth and re-radiate it back to the earth, thus keeping the earth and its atmosphere warmer than it should have been. In the long-term a balance is reached between the absorbed short wave solar radiation and the outgoing long-wave terrestrial radiation. The climatic and radiative balance, restored through this mechanism, resulted in a higher temperature on the earth’s surface thus permitting life to exist on the planet. Without the presence of these greenhouse gases, planet Earth would have been uninhabitable.
Greenhouse Gases
The naturally existing greenhouse gases are:
• water vapour H20
• carbon dioxide C02
• methane CH4
• nitrous oxide N20
• ozone 03
Man-made compounds such as chlorofluorocarbons CFCs, their substitute hydrofluorocarbons HFCs, and perfluorinated carbon PFCs also act as greenhouse gases. Other gases such as carbon monoxide C0, oxides of nitrogen N0X and non-methane volatile organic compounds NMVOC, contribute indirectly to the greenhouse effect. Sulphur dioxide S02 also contributes negatively to the greenhouse effect. Concentrations of these greenhouse gases are going up significantly in the atmosphere since the industrial revolution era, due to human activities. The massive injections of these GHGs in the atmosphere may upset the radiative balance of the atmosphere and could have severe impacts on climate systems, resulting in global warming and sea level rise.
INVENTORY PROCESS
Methodology and Data
The emission estimates, presented in this initial communication, were calculated according to the 1996 IPCC Revised Guidelines for National Inventory of Greenhouse Gas, to ensure that the emission inventory is consistent and comparable across sectors and between Parties. A copy, of the IPCC guideline worksheets and reporting tables, is appended in the annexes. The IPCC guidelines have been followed to the letter and all default values provided have been used.
Both the top-down and bottom-up approaches have been used for the preparation of this national inventory of greenhouse gases.
Sources of data
The data for energy production and consumption activities are based on the latest information and were obtained from the following sources:
o Energy balance for base year 1995
o Baseline scenario 1995-2020
o Central Statistical Office
o State Trading Corporation
o Central Electricity Board
o Bulk Bitumen Company Ltd
o Mauritius Marine Authority
o Mauritius Sugar Authority
o Ministry of Agriculture, Fisheries & Co-operatives - Forestry Department Data, for a particular item, were obtained from two or more sources at times. Discussions were held among concerned parties to arrive at the most viable and reliable information. Organization The National Inventory has been organised into six parts corresponding to the six major source categories, as described in the IPPC 1996 Guidelines. I. Energy Activities
A. Fuel Combustion Activities
o Energy Industries
o Transport
o Manufacturing Industries and Construction
o Other Sectors
o Other B. Fugitive Emissions
C. Memo Items

II. Industrial Processes
III. Solvent and other Product Use
IV. Agriculture
o Enteric fermentation
o Manure management
o Agricultural Soils
V. Land Use Change and Forestry
o Managed lands
o Grassland Conversion
o Managed Forests and
o Clearing Forests
Vl. Waste
o Solid waste disposal on land
o Waste water handling
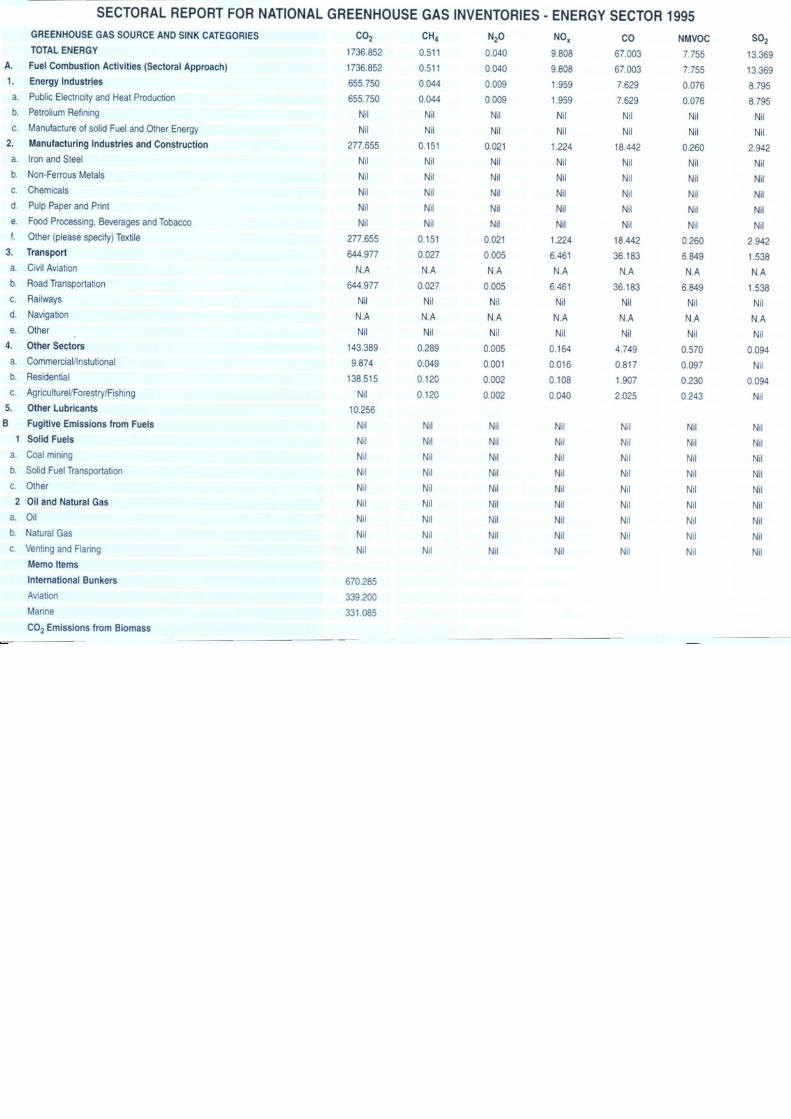
Uncertainty and limitation of emission estimates The uncertainties and limitations, as per IPCC guidelines, will be reflected in this chapter. EMISSIONS Energy GHG emissions were mainly from two fossil fuel types: liquid and solid fuel categories. Liquid fossil fuels consisted of gasoline, jet kerosene and other kerosene, gas/diesel oil, liquefied petroleum products Lpg and lubricants. Coking coal was the most commonly used solid fossil fuel. The total amount of GHG emissions for the energy sector was 1835.338 Gg, out of which 1736.852 Gg is directly from C02 emissions. C02 emissions, from fossil fuel, represented 99.9% of total emissions of carbon dioxide and 94% of all greenhouse gas emissions.

Public Electricity
The Republic relied heavily on fossil fuel for the production of electricity since other sources were limited. The resulting C02 emission from this activity totalled 655.575 Gg, representing 38% of total C02 emissions.
Transport
Road transport is the only available means to cater for passenger and freight displacement. The transport sector consumed 86 536 t of gasoline and 119 287 t of diesel, thus producing of C02 emissions of 644.977 Gg which represented 37% of total C02 emissions.
Manufacturing and Construction Industries
The major industries, in the Republic of Mauritius, comprised the following:
Sugar Textile Tobacco Stone crushing and block-making and Beverages and allied industries
In the sugar industry, bagasse is the main source of energy and any excess electricity produced is fed into the national power grid. Fossil fuels are mainly used for the production of steam and heat in the textile industry. Lpgis also used in relation to the spinning process. Electricity is the main source of energy for driving motors, lighting and air conditioning. CO2emissions from this sector accounted for about 16% of the total emissions and were estimated at 277.655 Gg.
Residential / Commercial Sectors
Energy needs in the residential/commercial sectors were met mainly from the following sources:
Kerosene
Page 8 of 16CHAPTER 2
28/05/2004http://unfccc.int/resource/docs/natc/maunc1/chap2/chapter2.htm
o Lpg
o Charcoals
o Fuel wood and
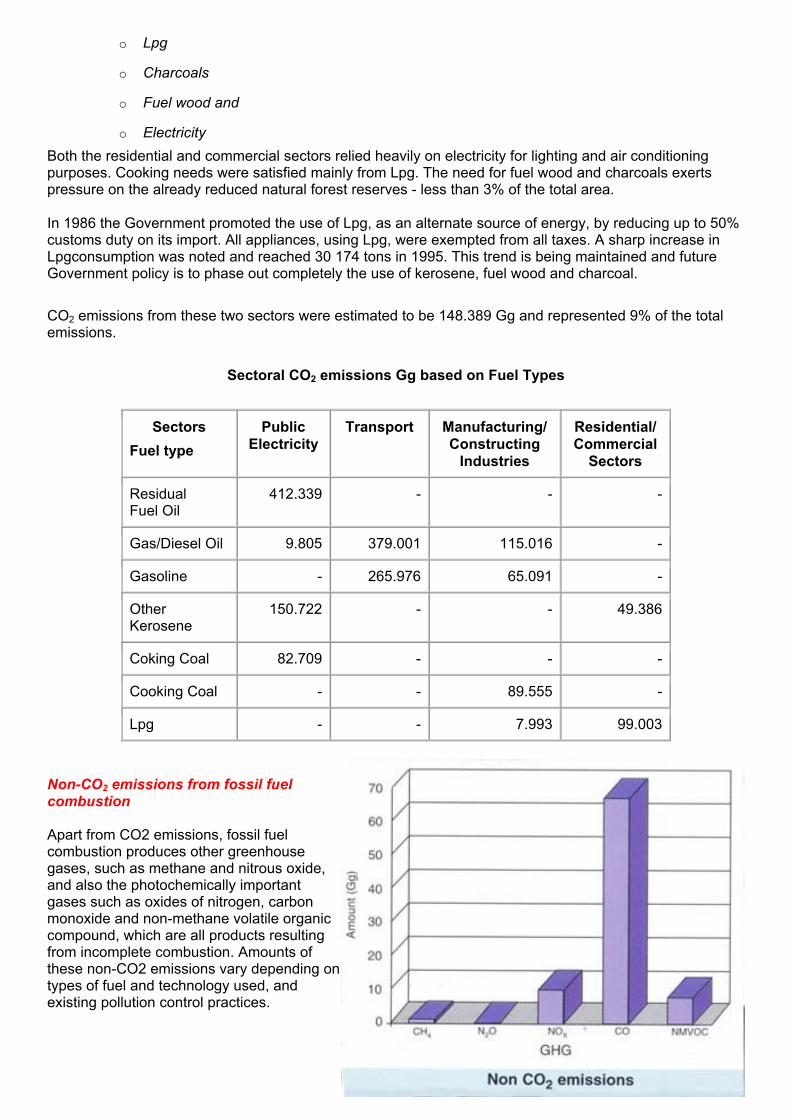
o Electricity Both the residential and commercial sectors relied heavily on electricity for lighting and air conditioning purposes. Cooking needs were satisfied mainly from Lpg. The need for fuel wood and charcoals exerts pressure on the already reduced natural forest reserves - less than 3% of the total area. In 1986 the Government promoted the use of Lpg, as an alternate source of energy, by reducing up to 50% customs duty on its import. All appliances, using Lpg, were exempted from all taxes. A sharp increase in Lpgconsumption was noted and reached 30 174 tons in 1995. This trend is being maintained and future Government policy is to phase out completely the use of kerosene, fuel wood and charcoal. CO2 emissions from these two sectors were estimated to be 148.389 Gg and represented 9% of the total emissions.
Sectoral CO2 emissions Gg based on Fuel Types
Sectors Fuel type
Public Electricity
Transport Manufacturing/ Constructing
Industries
Residential/ Commercial
Sectors
Residual Fuel Oil
412.339 - - -
Gas/Diesel Oil 9.805 379.001 115.016 -
Gasoline - 265.976 65.091 -
Other Kerosene
150.722 - - 49.386
Coking Coal 82.709 - - -
Cooking Coal - - 89.555 -
Lpg - - 7.993 99.003
Non-CO2 emissions from fossil fuel combustion Apart from CO2 emissions, fossil fuel combustion produces other greenhouse gases, such as methane and nitrous oxide, and also the photochemically important gases such as oxides of nitrogen, carbon monoxide and non-methane volatile organic compound, which are all products resulting from incomplete combustion. Amounts of these non-CO2 emissions vary depending on types of fuel and technology used, and existing pollution control practices.

Sulphur Dioxide Emissions from fossil fuel combustion
Varying proportions of sulphur are found in fossil fuels and during their combustion sulphur dioxide, which acts negatively on the greenhouse effect, is emitted. The amount of SO2 emissions depends on the sulphur content of the fuel, the sulphur retention in the ash, the abatement efficiency and other factors. Local figures provided by competent authorities for sulphur content of all imported fossil fuels have been taken into consideration in the calculations together with default values provided by IPCC.
SO2 emissions in 1995 were estimated at 13.369 Gg and details are presented in the summary table. Electricity production accounted for more than 66% of total SO2 emission.
Carbon stores in products
Bitumen and lubricants have been imported in l995 for non-energy application sectors such as road construction. The carbon stored has been estimated at 17.184 Gg.
Product Carbon stored Gg
Lubricants 2.833
Bitumen 14.351
Total 17.184
Fugitive Emissions
Coal mining, handling, production, processing, transport and use of oil and natural gas as well as the non-productive combustion and conversion of crude petroleum into a variety of sub-products are associated with fugitive emissions are not carried out in Mauritius. Therefore fugitive emissions from fuels are nil.
Memo items
International bunkers
International bunkering accounted for 670.285 Gg of CO2 emission in 1995 and the details are given in the table below.
Fuel type CO2 emission Gg
Jet Kerosene 339.200
Gas Diesel Oil 270.237
Residual Fuel oil 60.848
Total 670.285

INDUSTRIAL PROCESSES
Greenhouse gases are also produced, as residues of various non-energy related activities. These gases are emitted directly from the process itself, not as a result of energy consumption during the process.
The production processes, of interest to the Republic of Mauritius, are: • Lime production • Asphalt, used for tarring roads • Nitric Acid production and • Food and Beverages
The above-mentioned activities are carried out on a very small scale and contribute to the following emissions.
GHGs Amount Gg
Carbon Dioxide 1.580
Nitrous Oxide 0.279
Oxides of Nitrogen 0.372
NMVOC 7.726
SOLVENT AND OTHER PRODUCT USE
Solvent and other chemical products can produce emission of some greenhouse and photochemically important trace gases. Emission from this sector has not been calculated due to lack of sufficient data.
AGRICULTURE
The Republic of Mauritius depends almost entirely on imports for its main basic foodstuffs, except for vegetables. It has a very small livestock population. There is no cultivation of rice, no prescribed burning of savannas or field burning of agricultural residues. Mauritius is concerned with only enteric fermentation, manure management and agricultural soils on a very small scale only. Emissions from animal production and from animal waste management system are negligible.
The resulting methane emissions is summarised below:
Livestock type Population Enteric Fermentation
Manure Management
CH4 emission Gg
Dairy cattle 8500 306.00 8.50 0.314
Non Dairy cattle 8000 256.00 8.00 0.264
Sheep 1500 7.50 0.31 0.007
Goats 10000 50.00 2.20 0.052
Horses 500 9.00 1.10 0.010
Mules & Asses 25 0.25 - -
Swine 12000 12.00 24.00 0.036
TOTAL 640.75 44.11 0.683

LAND USE CHANGE AND FORESTRY
A wide variety of carbon and nitrogen trace gases are either emitted or absorbed in the biosphere. Any changes in the biosphere, through land use changes and forestry activities will modify the natural balance of these trace gases both in emissions and uptake. On the global scale the human activity which most affects the biosphere is deforestation, especially in the tropical region.
In this sector, the calculation of emissions focuses on four activities which act either as sources or sinks: o abandoning of managed lands o grassland conversion o managed forests o clearing forests
Abandoning of Managed lands Since land area in Mauritius is very limited, intensive agriculture is practiced on all suitable land and there is no abandoning of managed lands. Grassland conversion Under this item it is required to estimate the net CO2 emissions resulting from the conversion of grasslands into cultivated lands during the last 25 years up to the inventory year. Grassland conversion has been negligible, in the Republic, as there has been practically no grassland, which has been converted to cultivated land. Managed forests Forests are critical components of the climate system. Their potential for sequestering greenhouse gases is enormous, and they act as an additional "reservoir" for CO2 emissions. Prior to the 16th century, the whole island of Mauritius was covered with dense forests, mainly of tall, slow-growing trees. Unfortunately in the late 18th and early 19th century, most primary forests were cut down as land was converted for agricultural purposes. Forests were cut for timber to build boats and houses, for fuel wood and particularly to clear land for cane cultivation. Today less than 1% of the area of Mauritius is under some sort of native vegetation. In the National Inventory assessment survey for Mauritius, the CO2 uptake from changes in forests and other woody biomass stocks was analyzed and the results presented in the table below. Carbon Uptake by Forests
Plantations
Area kha Annual Growth Rate
tdm/ha
Annual Biomass Increment
ktdm
Carbon Fraction of Dry Matter
Total Carbon Uptake
Increment ktc Conifers 12.55 5.25 65.924 0.45 29.66
6
Casuarina 0.65 6.30 4.095 0.45 1.843
Nature Reserves
9.20 1.30 11.960 0.45 5.382
Exotic Scrubs
34.54 2.60 89.804 0.45 40.412
Total 56.94 77.303
Non Forest Trees Conifers Number of trees = 600,000 Annual growth Rate = 2.916 x 10³ kt dm

Annual Biomass increment = 600 x 2.916 x 103 = 1.749 ktdm Carbon Fraction of Dry Matter = 0.45 Carbon uptake Increment = 1.749 x 0.45 = 0.787 ktc
Carbon Uptake
Total Carbon uptake Increment = 77.303 + 0.787 = 78.090 ktc The annual biomass carbon removal is 17.749 ktc/yr Thus the net CO2 flux is 221.36 Gg
Forest clearing
The conversion of forests to permanent cropland or pasture is insignificant in Mauritius since the land area is small and limited. There is no remaining forestland that could be converted to cropland.
WASTE
Methane is one of the principal sources of greenhouse gases contributing to global warming, second only to carbon dioxide. Methane emissions originate from several sources including anaerobic decomposition of organic wastes in solid waste disposal sites, in sludge and residual solid by-products. In this sector, methane emission is calculated from solid waste disposal sites and from domestic and industrial waste water handling.
Solid waste disposal site on land
Anaerobic decomposition of organic matter in solid waste disposal sites by methanogenic bacteria results in methane emissions. The method used to calculate methane emission depends on the amount of waste disposed, the fraction of degradable organic carbon, the amount, which actually degrades, and the fraction of methane in landfill gas. It is also assumed that methane is released in the same year that the waste is placed in the disposal site. There is no sanitary landfill at present in Mauritius. Solid wastes are disposed of in about ten open disposal sites. No accurate data on the quantity of waste collected is available. In 1993, Scott Wilson Kirkpatrick, a consulting firm which prepared the "National Solid Waste Management Plan", estimated that the domestic waste produced per head is 0.6 kg per day. Since there has been a lot of waste burning in the open disposal sites, it is estimated that only 20% of the domestic waste disposed of, could be considered to be in the landfill sites. The calculations IPCC worksheet 6-1 have shown that the net methane emission from domestic solid waste disposal is 3.406 Gg.
Domestic waste water handling
Domestic waste water includes all liquid wastes from factories, hotels, restaurants and residential premises. Only parts of two urban districts of Port Louis and Plaines Wilhems have sewage facilities, representing only 20% of the population. At present all our waste water treatment works comprise of preliminary treatment, that is screening, removal of grit and disintegration of solids and then the effluents are disposed of through sea outfalls. There is no anaerobic treatment of sewerage and so no production of sewage sludge. The
Page 14 of 16CHAPTER 2
28/05/2004http://unfccc.int/resource/docs/natc/maunc1/chap2/chapter2.htm

remaining 80% of the population use septic tanks and on-site disposal systems.
Hence, no estimates of methane emissions from domestic waste water have been made.
Industrial Waste Water
Agro-industries and dye houses essentially produce the industrial waste water, and they are largely untreated. Many factories discharge their waste water into the subsoil. The sugar factories use their effluent for irrigation. In some cases, effluent is treated prior to disposal but most treatment plants provide for biological treatment by an oxidation process and a correction of pH. There is no anaerobic treatment of effluent. Thus, estimation of methane emission from industrial waste water has not been carried out.
CONCLUSION
Any adaptive or mitigation measure to be taken for the Republic of Mauritius, will have to be in the field of either electricity production or transportation. Increase in energy-efficient use of equipment in the manufacturing sectors will not only cut down cost of production but will also contribute to a decrease in GHG emission.
ANNEXES
Page 15 of 16CHAPTER 2
28/05/2004http://unfccc.int/resource/docs/natc/maunc1/chap2/chapter2.htm

Page 16 of 16CHAPTER 2
28/05/2004http://unfccc.int/resource/docs/natc/maunc1/chap2/chapter2.htm

CHAPTER 3 : VULNERABILITY AND ADAPTATION
INTRODUCTION
An assessment of a country's vulnerability is an evaluation and analysis of the scope and severity of potential impacts of climate changes on the natural environment, main sectors of the economy, human health and social activities.
An assessment of a country's adaptation is an identification and evaluation of changes in technologies, practices, and policies that can be adopted to prepare for adaptation to climate change impacts.
It has been widely recognized that small island states are highly vulnerable to climate change and the resulting sea-level rise. Adaptation to these changes, on which countries should mainly focus during the next decade, is one of the environmental challenges to be taken into consideration for sustainable development. Anticipatory actions should be taken to mitigate the negative effects of these changes and priority should be given to the implementation of remedial measures. One possibility is to integrate climate change in the socio-economic development and management programmes at government and non-government levels.
In Mauritius, key socio-economic sectors which inter-alia are most likely to be affected by climate change and sea level rise are:
coastal resources agriculture water resources fisheries health and well-being land use change and forestry and biodiversity
Sectoral impacts are identified and strategies are proposed to facilitate adaptation. These include revised management strategies to cope with the environmental stresses, contingency planning, research and development.
CLIMATE CHANGE SCENARIOS
Climate change scenarios are designed for use in identifying sectoral sensitivity to climate change and to show the potential magnitude of impacts but not to predict future climate.
Three basic options are available for creating climate change scenarios:
(i) general circulation models (GCM) (ii) incremental (iii) analogue.
Climate Change Scenarios
General circulation models (GCMs) are mathematical representations of atmosphere, ocean, and land surface processes. The GCMs are run for current climate (1 x CO2) and for
Page 1 of 12
27/05/2004file://D:\DOCUME~1\MANGOS~2\LOCALS~1\Temp\triKGOAC.htm

a doubling of carbon dioxide content (2 x CO2). Output from four GCMs, namely the Goddard Institute for Space Sciences (GISS) model, the Geophysical Fluid Dynamics Laboratory (GFDL) model, the Canadian Climate Centre Model (CCCM) and the British Meteorological Office Model (UK 89) have been analysed. The current output from all the GCMs (1 x CO2) is compared with long-term observed climate data to determine which GCM resembles most the current climate. GCM outputs and long-term observed climate data at Plaisance
Jan Feb Mar Apr May Jun Jul Aug Sep Oct Nov Dec Mean/Total
Observed
Maximum temperature(oC) 29.4 29.2 28.9 28.0 26.4 24.9 24.0 23.8 24.6 25.9 27.6 28.9 26.8
Minimum temperature (oC) 22.5 22.6 22.4 21.2 19.6 18.2 17.7 17.3 17.6 18.5 19.9 21.5 19.9
Monthly rainfall (mm) 249 220 289 208 165 115 130 87 64 57 88 177 154
Monthly solarradiation(MJm-2) 657 572 540 455 423 346 367 423 494 618 634 664 6193
CCCM
Temperature difference 2.21 2.09 2.26 2.37 2.39 2.39 2.56 2.66 2.62 2.57 2.48 2.41 2.42
Rainfall ratio 1.13 1.11 1.05 0.87 1.72 0.94 1.32 1.06 0.82 1.05 1.09 0.96 1.09
Radiation ratio 0.96 0.94 0.99 0.98 0.96 1.00 0.97 1.02 1.02 0.96 1.00 0.99 0.98
GFD3
Temperature difference 2.65 2.92 2.94 2.83 2.68 2.65 2.99 2.62 2.11 2.34 2.74 2.73 2.68
Rainfall ratio 0.65 0.69 1.19 0.79 0.98 0.94 0.98 0.84 0.95 1.05 1.73 1.55 1.03
Radiation ratio 1.06 1.11 1.09 1.04 0.98 1.22 1.10 1.06 0.97 1.05 1.01 1.08 1.06
GISS
Temperature difference 3.62 3.64 3.80 4.03 3.41 3.78 3.06 3.73 3.47 3.39 3.48 3.67 3.59
Rainfall ratio 1.00 0.96 1.26 1.46 1.61 1.33 1.07 1.23 1.24 0.90 1.13 1.04 1.19
Radiation ratio 1.01 1.03 1.01 1.02 1.02 1.06 1.02 1.03 1.03 1.02 0.99 1.00 1.02
UK89
Temperature difference 1.96 2.01 2.30 2.44 2.57 2.48 2.34 2.08 1.88 1.76 1.73 1.94 2.12
Rainfall ratio 0.54 0.78 1.01 0.80 1.96 0.90 0.69 0.88 0.70 0.57 0.91 0.71 0.87
Radiation ratio 1.04 1.01 1.01 1.04 0.99 1.00 1.01 1.00 0.98 0.96 0.99 1.00 1.00
Incremental Applying incremental changes to meteorological variables such as temperature and precipitation can also be used to construct climate change scenarios. Incremental changes have been combined with observed climate data to give an altered daily temperature and daily rainfall.
Incremental scenarios adopted + 2°C and 20% daily rainfall + 2°C and 10% daily rainfall + 2°C and 0 daily rainfall + 2°C and -10% daily rainfall + 2°C and -20% daily rainfall + 4°C and 20% daily rainfall + 4°C and 10% daily rainfall + 4°C and 0% daily rainfall + 4°C and -10% daily rainfall + 4°C and -20% daily rainfall
Analogue Historical warm periods can also be used to represent climate change. VULNERABILITY Coastal resources The coastline of Mauritius is undergoing pronounced morphological changes as a result of natural causes and anthropogenic activities. The natural phenomena are:
• tropical cyclones and • tidal waves.
The anthropogenic activities are:
• haphazard construction of ill-designed jetties and groynes • removal of sand • increasing infrastructural development • pollution • degradation of coral reefs
Accelerated sea-level rise (ASLR) would most likely worsen these problems. According to IPCC assessment, sea level is expected to rise between 15 to 95 cm with a best estimate of 50 cm by the year 2100. Sea- level rise projections of 0.5, 1.0, 1.5 and 2.0 m have also been used in case studies for Mauritius. The major impacts of sea-level rise in Mauritius are land loss, erosion of beaches, damage to coastal infrastructure, degradation of coral reefs and loss of wetlands. Land loss Mauritius is surrounded by many low lying areas which will most likely be affected by ASLR and increased flooding from storm surges due to an expected increase in the number and intensity of tropical cyclones as a consequence of global warming. Analysis of available 2m contour maps showed that the total coastal area under direct impact of sea-level rise will be of the order of 1030 ha representing about 0.5% of the island. This land loss represents the most valuable land assets of the country, which are a source of recreation and the main attraction of the tourist industry. The areas most at risk are located in the South-West and North as well as, the estuary of the rivulet Terre Rouge, a sanctuary, which welcomes a large number of migratory birds.

Coastal Erosion
Beach erosion is a constant threat to many areas around the island, caused mainly by ill-designed jetties/groynes. These have caused alterations in current directions with the result that erosion has shifted to other places. A recent survey revealed that there are more than 200 jetties/groynes, which have been illegally constructed.
Coastal segments where marked erosion have been identified are in the region of Flic-en-Flac (West), Le Morne (South-West), Riambel (South), Pointe d'Esny (South-East), Cap-Malheureux and Grand Bay (North). It has been observed that the coastline is receding by almost 1 m per year in some places. Sea level rise will enhance the erosion problems of already threatened regions and increase the vulnerability of other areas.
Coastal Infrastructure
Coast roads representing 5% of the sea front are located mainly in the southern and eastern regions. It has been estimated that about 12 km of main coast road and 25 km of secondary coast road could be at risk with a rise in sea level.
More than 1000 houses will be totally under threat and 100 units partly. Based on the occupancy rate of 4.7 per unit, it is estimated that almost 6000 people (0.6% of the population) would be affected.
Coral reefs
Coral reefs are also susceptible to climate change as this would lead to higher water temperatures and rising sea level. In many parts of the world reefs have undergone episodes of bleaching. During the recent El-Nino episode when a temperature increase of 2 °C above the mean was observed in the water surrounding the Seychelles, widespread coral bleaching occurred.
In Mauritius, coral bleaching has occasionally been observed and has been attributed mostly to pollution.
Coastal Wetlands
Coastal wetlands are mostly found at elevations below the highest tide of the year and above mean sea level. They usually oscillate and move in response to changes in sediment supply and relative sea-level rise. The rate at which wetlands migrate is still unknown.
In Mauritius, some wetlands have been backfilled for development purposes and this has caused flooding in other places.
Agriculture
Sugar production, the main agricultural activity, is a key element of the Mauritian economy
Page 4 of 12
27/05/2004file://D:\DOCUME~1\MANGOS~2\LOCALS~1\Temp\triKGOAC.htm

and is expected to continue for the forthcoming decades. The sugar industry together with other agricultural activities have a strong socio-economic bearing and need to be assessed for their vulnerability.
The impacts of climate change on agriculture were analysed using the following assumptions:
elevated levels of CO2/other GHGs on the physiology of crop plants and weeds
changes in climate parameters (temperature, precipitation and solar radiation) on plants and animals, and sea level rise on agricultural land
Direct effects of elevated CO2 and other greenhouse gases
The major effects of increased CO2 levels on productivity are through photosynthesis and respiration, as well as on water use, crop development and product quality. In most cases higher increases in productivity can be expected with the C3 plants compared to C4 plants (e.g., sugar cane). Total production of dry matter will increase, but not necessarily as sugar because of lower partitioning into sucrose. Sugar beet producers will benefit more than cane sugar producers. Weeds, mostly C3 plants, will grow more rapidly and hence compete more severely with sugar cane with possible negative effects on productivity.
Changes in the crop development and phenology can potentially cause shortening or lengthening of the crop cycle and may lead to decreases or increases in productivity. Structural changes especially in the carbohydrate status may affect the nutritional value, taste, storage quality and commercial value of some fruits and vegetables. Post-harvest losses may be higher in the case of flowers while the lower nitrogen content of fodder will mean reduced protein levels and hence diminished nutritional value for livestock.
Increases in atmospheric CO2 will lower crop water requirements by reducing transpiration per unit leaf area; its benefit cannot be quantified. Biological nitrogen fixation may increase or decrease and will result in different inputs of fertilizer.
Changes in climate parameters
Global warming is likely to lead to the following changes:
The productivity zones of some crops will change from the lowland areas to regions of higher altitudes. Sugar cane cultivation will become more profitable in the super humid zone and will compete with other crops and forestry. Vegetable crops cultivated in the highlands, and needing a cold climate for bulking might disappear being no longer productive. The duration of some crops will shorten with concurrent reductions in yield. Cropping calendars, flowering and productivity of some fruits and vegetables will be affected. Pastures that are actually in the low-lying dry areas may support fewer animals as a result of lower grazing potential. Livestock will be under higher stress and poultry production may decrease because of higher mortality rates.
Temperature increases will change and extend the geographical range of some insect
Page 5 of 12
27/05/2004file://D:\DOCUME~1\MANGOS~2\LOCALS~1\Temp\triKGOAC.htm

pests. The number of generations per year of some insects may increase with earlier establishment of the pest coinciding with vulnerable stages of crops and resulting in severe losses. Interspecific interactions between pests, their predators and parasites may change with integrated pest control becoming less effective.
Most agricultural diseases are expected to reach more severe levels under warmer conditions. Deseases caused by fungi and bacteria will become more recurrent in case warmer temperatures are accompanied with higher precipitation. The geographical range of the diseases also may change thus affecting susceptible cultivars grown in these areas.
The expected changes in rainfall amount, pattern and distribution make it difficult to assess its effect on agriculture. Relatively small changes in amount and seasonal distribution can have large effects on crop productivity in tropical areas. The magnitude and frequency of drought periods and heat stress could be of direct concern. There is a distinct possibility that sugarcane land in the sub-humid zone will become economically non-productive as a result of higher rates of evapotranspiration. Irrigation might have to be adopted in or extended to these areas.
Important indirect effects of climate change on agriculture come from concurrent effects on other physical systems. The most important is water resources and groundwater recharge.
The various impacts of climate change on crop and animal production could have higher order effects on income, employment, food production and exports. Production costs will change and may rise in terms of altered management requirements such as irrigation adoption or extension and reduction of pest and disease damages. Profitability at the national and farm level will change among other things because of changes in the production potential, in the costs of inputs and prices of outputs. The effect of climate change on a regional and international basis will also impede on profitability. This will in turn affect employment and the society.
Sea level rise
Agriculture and mangroves occupy about 45% of the coastal frontage. Agricultural activities will be under risk as a consequence of saline drift from sea-spray that will contribute to land degradation through salinisation of neighbouring soil. Mangroves are expected to retreat inland.
Concluding Remarks
The magnitude of change in the different climatic parameters will determine the vulnerability of our agricultural production and how many adaptive measures need be taken to maintain productivity. GCM outputs for Mauritius indicate that the increase in temperature will affect most of our agriculture. It is certain that all crops will not be affected to the same extent and that the same crop will respond differently in various regions. This will require different adaptive measures. Government may have to react to the effects of climate change at the regional and international levels even if effects at national level were negligible.
Water Resources
The fresh water supply of Mauritius comes from rivers, man-made lakes, natural lakes, and ground water basins. The 2100 mm mean annual rainfall is largely sufficient to replenish these water resources systems that have a total available storage capacity of the order of 460 Mm3. Both surface and underground water are utilized for domestic, industrial and
Page 6 of 12
27/05/2004file://D:\DOCUME~1\MANGOS~2\LOCALS~1\Temp\triKGOAC.htm

agricultural purposes. There is still potential to exploit additional ground water to cater for increasing demands. Average per capita water consumption was about 190 l day-1 in 1995.
Water quality is closely tied up with the management of the coastal system. Water intrusion, pesticide use, agrochemicals and haphazard disposal of waste may cause toxic chemicals to penetrate into the water resource systems. Used water from sugar mills is discharged into the rivers and ends up in the lagoon. Government is well aware of potential water pollution and has embarked on an aggressive program including monitoring of surface, ground and lagoon water with special attention paid to
effluents from industrial dying and washing.
Mauritius depends for 60% of its needs on underground water for domestic, industrial and agricultural purposes. Boreholes that are situated near the coast will be at risk due to salt-water intrusion.
Fisheries
Fisheries include coastal, banks and deep-sea fishing and aquaculture. Coastal fishery is the main source of fresh fish for the local markets. The annual production of fresh fish has stabilized at around 1600 t, peaking in the month of March. In August and September the catch usually decreases due to unfavourable weather.
Fish Aggregating Devices (FAD) installed by the Albion Fisheries Research Centre (AFRC) at various sites 1.5 to 12 km off the coast of Mauritius also play an important role in the supply of fresh pelagic fish to the local markets.
Fish obtained from sea banks represents 30% of the total fish consumption. The main banks exploited are the Nazareth and Saya de Malha along the Mauritius - Seychelles ridge and in the region of the Chagos, St Brandon and Albatros islands. The total annual catch from the banks was about 4400 t in 1995. Fishing on banks is mainly conducted when the weather is favourable.
The tuna-fishing zone lies between latitudes 4°N to 11°S and longitudes 50°E to 84°E and the regions around the Chagos are very productive. About 2800 t of tuna were landed in 1995: the main species being skipjack (67%), yellow fins (21%) and big-eye (10%).
Marine aquaculture focuses on shrimp farming and fresh aquaculture involves the fish "berri-rouge" and crayfish.
Climate change impacts on fish stocks and distribution can be assessed through variationsin water properties or indirectly through fising activities dependent on weather. Fish habitatand behaviour are directly related to climate.
Page 7 of 12
27/05/2004file://D:\DOCUME~1\MANGOS~2\LOCALS~1\Temp\triKGOAC.htm

directly related to climate.
Increased sea surface temperature
A rise in sea surface temperature causes:
decrease in the amount of oxygen. increase in growth of aquatic plants increase in metabolic rates of organisms
Though General Circulation Models (GCMs) outputs only provide for expected changes in air temperature, multiple-regression analysis used in the development of models has indicated a significant rise in sea surface temperature also.
The decrease in dissolved oxygen will affect fish population through:
• increased mortality of adults and juveniles
• reduction in growth
• lower survival rates of eggs and larvae
Nutrients
Nitrates, phosphates and silicates are important nutrients. Their concentrations are higher in deep water and replenishment of upper layers comes through vertical diffusion, overturning and upwelling. Changes in wind regime and ocean circulation are expected to impact on the intensities and location of upwelling areas and hence on the distribution of nutrients leading to changes in fish population and migration behaviour.
Changes in climatic conditions on fish yield
More frequent changes in the wind and thermal stratification regime will be detrimental to the fish population since larval survival will be affected. Higher frequencies of weather extremes are expected to affect fishing operations.
Tuna fishery
Tuna is a migratory species and the choice of the route is strongly determined by sea surface temperature. The 28°C isotherm has been found to coincide with concentrations of tuna.
The vertical distribution of biomass and fish depends on the depth of the thermocline. A deeper thermocline necessitates more investments for exploitation.
The effects of El Nino
It is predicted that El Nino occurrence will become more frequent, intense and of longer
Page 8 of 12
27/05/2004file://D:\DOCUME~1\MANGOS~2\LOCALS~1\Temp\triKGOAC.htm

duration with climate change. It has been observed that whenever a major El Nino occurs, warming also takes place in the other major ocean basins. Studies have also shown that El Nino will induce changes in ocean currents, upwelling and upper ocean heat content thus affecting size and location of fish stocks.
Health
Health is defined by the WHO as "… a state of complete physical, mental and social well-being and not merely the absence of disease or infirmity." Climate has been found to act on human health through its effect on ecosystems, water resources, food species, disease agents and vectors. Available data show some correlation between number of malaria cases and heavy rainfall episodes unless appropriate precautionary measures are taken. Marked outbreaks of flu are also noted during some months of the year as a result of fluctuating temperatures. It is therefore important to consider human health and well-being under a climate-change scenario.
Climate change is expected to have a negative impact on human health in Mauritius. A 2°C increase in the average temperature when added to the already sultry conditions prevailing during summer in the capital city and the other coastal areas will be detrimental to the health of elderly persons, small children and chronic invalids. Furthermore, a combination of such temperatures with high values of relative humidity is bound to be catastrophic to human health.
Urbanization is relatively dense, as most people prefer individual dwellings to apartment buildings. Large areas are being covered by concrete structures with few parks and gardens being accommodated. Residential buildings have been erected to serve more as shelters from strong cyclonic winds than as efficient energy-consuming units. During summer these get heated up by solar radiation and emit the stored heat at night thus considerably increasing indoor temperatures.
Air conditioning facilities are becoming an important household item and as the lower income group will not be able to afford such facilities, excess heat will become a major health problem. A nation that cannot rest and recover will not be productive and is most likely to suffer from cumulative distress.
Land use change and forestry
Land use change
Deforestation has had a very strong influence on land as a resource and climate changes will in turn compound the damage. These impacts will be discussed in terms of the effects of increased CO2 level and changes in climate parameters.
Increased CO2 level
Elevated CO2 level will alter the composition of plants and will result in organic matter with a high carbon:nitrogen and carbon:phosphorus ratio. Such organic matter has a low rate of decomposition thereby slowing nutrient recycling. The activity of decomposer micro-organisms will be reduced by the poorer quality of the plant material while fungi may thrive as a result of the higher carbon content of the litter. Changes in the flora and fauna of the soil may affect its physical and chemical properties in the long-term and may necessitate changes in land use.
Page 9 of 12
27/05/2004file://D:\DOCUME~1\MANGOS~2\LOCALS~1\Temp\triKGOAC.htm
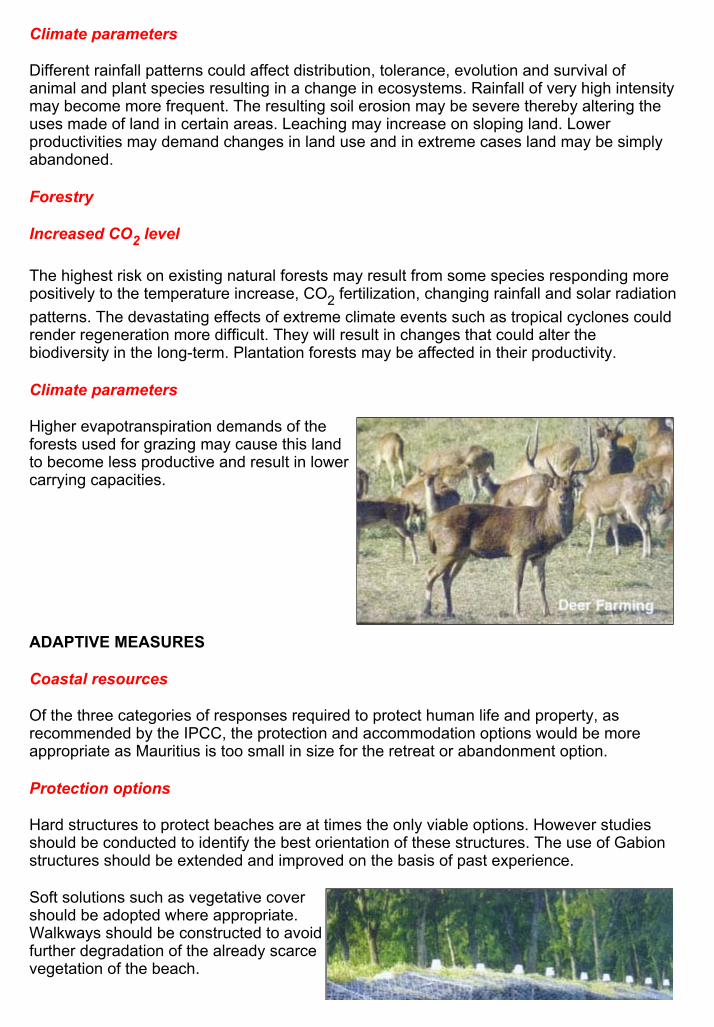
Climate parameters
Different rainfall patterns could affect distribution, tolerance, evolution and survival of animal and plant species resulting in a change in ecosystems. Rainfall of very high intensity may become more frequent. The resulting soil erosion may be severe thereby altering the uses made of land in certain areas. Leaching may increase on sloping land. Lower productivities may demand changes in land use and in extreme cases land may be simply abandoned.
Forestry
Increased CO2 level
The highest risk on existing natural forests may result from some species responding more positively to the temperature increase, CO2 fertilization, changing rainfall and solar radiation patterns. The devastating effects of extreme climate events such as tropical cyclones could render regeneration more difficult. They will result in changes that could alter the biodiversity in the long-term. Plantation forests may be affected in their productivity.
Climate parameters
Higher evapotranspiration demands of the forests used for grazing may cause this land to become less productive and result in lower carrying capacities.
ADAPTIVE MEASURES
Coastal resources
Of the three categories of responses required to protect human life and property, as recommended by the IPCC, the protection and accommodation options would be more appropriate as Mauritius is too small in size for the retreat or abandonment option.
Protection options
Hard structures to protect beaches are at times the only viable options. However studies should be conducted to identify the best orientation of these structures. The use of Gabion structures should be extended and improved on the basis of past experience.
Soft solutions such as vegetative cover should be adopted where appropriate. Walkways should be constructed to avoid further degradation of the already scarce vegetation of the beach.
Page 10 of 12
27/05/2004file://D:\DOCUME~1\MANGOS~2\LOCALS~1\Temp\triKGOAC.htm

Beach nourishment, a more popular form of erosion control, should be adopted. Future coastal protection should include beach restoration and maintenance as well as cyclone wave protection by dunes.
Accommodation options
The set back distance should be increased to beyond the present 15 m high-water mark. Steps should be taken to ensure that the removal of sand is completely banned as from the year 2001.
The existing passes through the reefs should not be enlarged and new passes should be avoided completely.
Agriculture, land use change and forestry
Agriculture
Agricultural systems have always adapted to changes and the magnitude and nature of the impacts will determine the degree of adjustment. It is certain that adaptation will depend on the degree of adoption of new technologies and management rules but will be constrained by economic and political factors. Expected adjustments will come through changes in land use, management and infrastructure. However, because of all the uncertainties linked with climate change it is very difficult to recommend specific options.
Changes in land use
The implementation of changes in land use does not seem to be a possible adaptive measure since land is a limited resource. A change in crop type also does not appear to be practicable. The cultivation of more drought resistant crop cultivars could be an interesting adaptive strategy for regions where soil moisture will become the limiting factor. A change in the harvest date can also be envisaged so as to make more efficient use of environmental resources.
Changes in management and infrastructure
As crop water requirements will increase under warmer conditions and with a possibility of poorer rainfall distributions, irrigation facilities will have to be extended.
Fertilizer use will change and increased amounts may be needed to counteract the effect of soil erosion and leaching. Farm infrastructure and practices may require changes to mitigate the effects of climate change.
Page 11 of 12
27/05/2004file://D:\DOCUME~1\MANGOS~2\LOCALS~1\Temp\triKGOAC.htm

Forestry
The best option appears to be closer monitoring for the prevention of further degradation. More adapted species can be introduced for exploitation in the plantation forests. The ecosystems need to be more closely monitored for prompt action in case the balance of species is affected. Tree plantation along river banks and motorways are to be envisaged.
Water resources
Adaptation options to maintain and ensure an adequate supply and quality of water are :
encouraging the use of "gray" water for secondary household use constructing rain catchment backup tanks monitoring groud-water sources in the outer islands increasing storage capacity.
Concluding Remarks
The magnitude of change in the different climatic parameters will determine the vulnerability of the different sectors and the extent to which adaptive measures need to be adopted to limit their effects. Decision-makers may have to react promptly to counteract the possible impacts of climate change.
Page 12 of 12
27/05/2004file://D:\DOCUME~1\MANGOS~2\LOCALS~1\Temp\triKGOAC.htm

CHAPTER 4 : SYSTEMATIC OBSERVATION AND RESEARCH
INTRODUCTION
The Republic of Mauritius, being vulnerable to impacts of climate change, is highly dedicated to systematic observation of climate data and has shown keen interest in related research. It is to be noted that the first climate observation in this part of the world was made in Mauritius in 1774. As a result, a broad understanding of climate processes over and around Mauritius has emerged.
Local scientists are actively participating in international activities to fullfill the commitments of the country towards the implementation of the Climate Change Convention and related programmes. Mauritius is fully involved in the activities of the following bodies:
Intergovernmental Panel for Climate Change (IPCC) World Climate Programme of the WMO Framework Convention on Climate Change (FCCC) and United Nations Environment Programme (UNEP).
There are well-established institutions to cater for research on the science of climate change. Studies are under way to address issues such as the GHG inventory, impacts and adaptation of vulnerable sectors.
DATA COLLECTION AND SYSTEMATIC OBSERVATION
Mauritius maintains a network of meteorological stations in the region. Observations are also received from ships, aircraft and drifting buoys. Other climatological observations are also made in the private sector on a voluntary basis. The National Meteorological Services maintain a well-organized data bank, which is easily accessible for research purposes.
An extensive network of hydrometric observations exists to monitor closely water resources and requirements.
A well-established system to record and analyse variations in crop productivity in relation to microclimates exists.
Variations in sea level are monitored from data collected at two stations, one in Mauritius and the other in Rodrigues. Observations on waves and sea surface temperature are made regularly. Seawater quality and the state of the reefs are also monitored.
The Central Statistical Office is responsible for keeping a data bank on socio-economic sectors. Monthly records of all disease occurrences are also kept.
RESEARCH INSTITUTIONS
The following institutions are involved in research on climate change issues:
Meteorological Services Ministry of Environment, Human Resources and Employment
Page 1 of 3CHAPTER 4
28/05/2004http://unfccc.int/resource/docs/natc/maunc1/chap4/chapter4.htm

• University of Mauritius • Mauritius Sugar Industry Research Institute • Ministry of Agriculture and Natural Resources • Ministry of Public Utilities • Agricultural Research Extension Unit • Tertiary Education Commission • Mauritius Research Council
ONGOING RESEARCH Research have been under way for some time and is continuing on the following aspects:
• modelling approach to assess the vulnerability and adaptation of the main crop, • sugar cane to different climate change scenarios • increasing energy efficiency of buildings • preparation of geomorphological and contour maps of the coast • shoreline changes • movement of pesticides and agrochemicals in the soil • increasing efficiency of energy production from biomass • transport efficiency • reduction in GHG emissions
The modelling approach was used by the Mauritius Sugar Industry Research Institute to assess the vulnerability of the sugar cane crop to climate change without catering for CO2 fertilization effects. The calibrated model was run for different sites to choose one representative of the island’s productivity. Four GCM outputs for the region with different combinations of rainfall and temperature increments were used with daily meteorological data of the chosen site to create the scenarios. The study revealed within its limits than sugar production was very vulnerable to climate changes. Production decreased by 32-57% with the GCM scenarios and from 3-81% with the incremental scenarios. The reductions resulted mainly from lower water use efficiencies and more than 20% rainfall was needed to offset a 2°C rise in temperature.
A new technique called Aerial videotape–assisted vulnerabiltiy analysis (AVVA), as recommended by the US country studies programme, has been used to prepare maps of the coatal geomorphology of Mauritius. It involves videotaping the coastline from a small plane at very low elevation. The AVVA approach is a quick, useful and cost effective tool for determining the impact of sea-level rise on coastal resources. The technique uses detailed field data to identify land and infrastructure that are at risk and determine adaptation measures. The coastline of Mauritius has been videotaped from a helicopter flying obliquely at an elevation of 30 to 50 m. The video film has been analysed and using the method provided on the Guideline for Vulnerability and Adaptation Assessment on coastal classification geomorphology (types of beaches and coastal low use) has been prepared.
Three adaptive options, namely irrigation, a change in variety type and a change in harvest date were evaluated using the modelling approach under GCM scenarios. The adoption of irrigation mitigated all impacts of climate change while a change in harvest date had no effect under the present production system. However, there could be beneficial production with the combination of irrigation adoption and a change in harvest date. The change in varieties showed that the genetic potential exists but will have to be incorporated in new varieties to tolerate changes.
Additional amounts of water needed for the adoption of irrigation, will range from 319 to 396 Mm3 according to the different GCM scenarios. Hydrologically, this will be possible but will be very costly in terms of extension of infrastructure and additional water storage capacity.
Four Profiles on the western coast at Flic-Flac, were surveyed and changes in the shoreline between 1975 and 1996 were estimated, using aerial photographs and site survey in 1996.
Profile No Changes in m
Rate of erosion (m/year)
No 1 +27.5 +1.3 No 2 (about 0.5 km from
No 1) +36.0 +1.7
No 3 (about 0.5 km from No 4) -6.3 -0.3
No 4 -12.0 -0.6

FUTURE RESEARCH More comprehensive research is required on the following:
• effect of CO2 fertilisation on crop growth, development and productivity • modelling of vegetative-climate interactions • climate change impacts on crops and animal production together with its economic
implications • effects of micro-organism activities on soil processes • genetic improvement of crops with higher water use efficiencies and more tolerant
to extreme weather events • effects of ozone levels on health • renewable energy sources • relationship between sea level and temperature and future trends • indirect effects of climate change on socio-economic sectors • human tolerance and physiological responses to climate factors
DATA BANKS Proper data organization is vital to address climate change issues. The present set up does not fulfill these requirements and there is a need to centralize all climate change related data. The location of such an important data bank should rest with the Central Statistical Office. CONCLUSION There is an urgent need for training so as to enable the adoption of the appropriate approach for research.

CHAPTER 5 : EDUCATION, TRAINING AND PUBLIC AWARENESS
INTRODUCTION
Scientists around the globe are researching the various aspects and magnitude of climate change. The majority of the world’s population including policy and decision makers, especially in the developing countries, has little knowledge, or none at all, of climate change, its implications and ramifications in their day to day activities, and on the nation as a whole. Education, training and awareness are therefore of utmost importance in the formation of environmentally aware and enlightened citizens.
Climate change, as a subject per se has not yet been included in the curricula of the formal education system in Mauritius since it is a new developing science. Incorporation of topics related to climate change in the curricula of primary and secondary education will provide the future generation with sufficient scientific understanding of global climate change and to take an intelligent and informed interest in the nation’s climate change policies.
Informal education can reach the largest number of individuals and is the most effective instrument in shaping public attitudes and behaviour. The advent of audiovisual technology, coupled with its increasing affordability and accessibility, and its use as tools of mass communication have made public outreach easier than ever before.
Adapting to climate change can be spontaneous or planned. Individuals, societies and cultures will adapt, over time, to climate change impacts without any external help. On the other hand, they may be provided with the necessary help to be able to adapt and/or minimize the negative effects more quickly.
Any plan of action must be based on an educated and informed decision, which is only possible if the people are given the essential training.
ACTIVITIES
‘Environment Clubs’ have been created in primary and secondary schools and the motivated and enthusiastic members have been given some information and training on climate change and its impacts. Art and essay competitions on climate related topics are organized by schools and/or the Ministry of Education, with the view to increase awareness among students.
Climate change and related issues have been included in various courses offered by the University of Mauritius, especially in Environmental Science, Agriculture and Engineering.
Discussions, debates, public talks, open seminars, research seminars and local workshops, organized by various organizations, help to encourage and stimulate interest in climate change and its environmental impacts among the population.
Formal links existing with universities abroad are being currently explored with the aim of utilizing these resources to train and/or upgrade national capabilities and understanding to enable exchange of ideas and sharing of information, and also to undertaking collaborative research on climate change issues. International activities further contribute to foster
Page 1 of 3CHAPTER 5
28/05/2004http://unfccc.int/resource/docs/natc/maunc1/chap5/chapter5.htm

collaborations.
Traditional teaching institutions periodically organize ‘open days’, exhibitions, and public lectures on climate change matters as part of their community service activities. The MCA produces awareness-promoting audiovisual materials in collaboration with different institutions in the country, and also produces educational programmes targeted to school-age children, tertiary-level students, as well as for the general public. The Information, Education and Resource Division of the DOE is actively involved in preparing sensitization and awareness programmes on environmental issues, and will soon set up a centralized resource library devoted to environment-related literature.
Posters and pamphlets on specific environmental matters help to promote environmental understanding and raise the level of public awareness in concrete, everyday terms.
ENVIRONEWS, a newsletter published on an ad hoc basis presents news items, brief articles and short technical papers on various aspects of the environment including climate change activities and sustainable development measures, has a wide circulation.
Newspapers, radio, TV, videotapes, posters, pamphlets, brochures and factsheets are some of the popular and easy methods of communication that are being used to target the largest audience. It is being envisaged to utilize computer diskettes, CD-ROM, multimedia kits and web sites to transfer information, and also to help educate the public at large. Information can be tapped via the Internet from home pages of local institutions.
The Mauritius Council of Social Services (MACOSS), an umbrella organisation which groups over a hundred NGOs, recently organized workshops on Environmental Education for its members, with the purpose of creating a pool of trainers in environmental education.
The female population represents about 50% of the total. Training centres, throughout the island organize education sessions and public activities to promote the quality of life of women in the country and a better understanding of national issues. This may range from simple personal habits, such as turning off the lights, to environmentally-friendly practices and lifestyles. It is said that "when you educate a man, you educate an individual, but when you educate a woman, you educate a family!"
Past learning, personal experiences and regular observations have shown people some of the rapid changes that occurred in the climate and their consequences. While not necessarily understanding the scientific principles of climate change as the underlying causes of these effects, people are nonetheless aware of them. Increasingly warmer seasons, erratic rainfall, droughts followed by exceptionally heavy rains, coastal erosion, landslides, dwindling numbers of certain animals and plants, reduced yields in agriculture, fisheries, are some of the observed facts people often comment upon. Such awareness among the public constitutes a resource base for non-formal education, which is being encouraged.
CONCLUSION
It is evident that irrespective of the type and methods of communication used to educate and create awareness about climate change matters, the basic message is clear: climate change poses a risk to future generations, and this risk needs to be taken seriously.
Page 2 of 3CHAPTER 5
28/05/2004http://unfccc.int/resource/docs/natc/maunc1/chap5/chapter5.htm

CHAPTER 6 : PROJECTIONS, POLICIES AND MEASURES
INTRODUCTION
Much has been achieved during the past 25 years since independence; but much still remains to be done in the forthcoming quarter of a century to the year 2020.
These future achievements will have to be made in a world context that is constantly changing and presents three particular challenges.
Global economy: The globalization of the economy will sharpen competition and make international competitiveness essential, particularly for small, open economies.
Population and resources: rapid population growth in some regions, together with economic expansion, will put increasing pressure on food supplies and other natural resources.
Climate Change: the threat of unlimited rises in temperature, sea level rise, changes in the hydrological cycle and shifts in the crop production belts, as a result of massive injections of greenhouse gases in the atmosphere would impact adversely on population mobility.
SOCIO-ECONOMIC AND POLITICAL - YEAR 2020
Social welfare
The Mauritian population is expected increase to 1.37 million by 2020, with the most economically active age groups representing about 69% of the total population. The proportion of young adults staying in the learning/training sphere will increase, resulting in the building up of a top quality work force which is expected to be enterprising, well qualified, highly skilled and productive. This will be crucial for the structural transformation of the economy. Tolerance and mutual respect for other communities and cultures will continue to be the key to social harmony.
The welfare state will be maintained but there would be changes in its organization and funding. The welfare state in Mauritius has so far not been a burden impeding sustained economic growth in the past but a major factor in the social cohesion that has been a pre-requisite for economic progress. The ageing of the population will be a problem.
Good quality education and a continuous programme of upgrading of human resources would ensure that every one contributes to socio-economic developments and shares fully in its benefits.
The slowing down in population growth should help in solving the housing problem.
Economy
Mauritius is aiming towards a thriving, competitive and modern society, where the population will enjoy a standard of living, with a GDP three times as great as in 1995.
This higher living standard is expected from an assumed annual average growth rate
Page 1 of 6CHAPTER 6
28/05/2004http://unfccc.int/resource/docs/natc/maunc1/chap6/chapter6.htm

of 5.6% over the next 25-year period.
In the region, it is becoming a leading centre for international financial services, including banking, insurance and also a secure, efficient, convenient and a pleasant place in which to do business.
Its liberal, well-regulated communication services and a highly efficient standard information technology infrastructure will be a major asset.
Mauritius expects to be an essential node in the various international networks. These well-established networks enable Mauritius to create its niche in international profit bearing flows.
Its adaptive and flexible education system promotes the concepts of multidisciplinarity and professionalism.
The fragile ecological balance is being maintained through sustainable land use and integrated coastal zone management.
Its has a well-developed supporting physical and social infrastructure.
Mauritius frames its aspirations in terms of quality rather than quantity.
Economic growth in Mauritius is more a matter of raising average returns to investment than increasing the investment ratio. The contribution of technical efficiency to future growth will thus have to be increased by a more determined push towards the international best technologies in the various sectors. This would require a concentrated effort on the acquisition, diffusion and use of modern technology that raises physical productivity as well as enhances quality, design and market response.
Institutions and economic operators, both from the public and private sectors, will have to think globally on international relations, diplomacy, marketing, etc. Acquiring the crucial market and political knowledge in advance, building the best contacts and positioning for a better deal will be the main elements of a winning globalization strategy.
Shifts from a custodial state to an enabling one, promoting co-operative partnership with private industry, the community and the individual will have to be encouraged. A cost-effective Government will be counter-balanced by a greater role of the private sector in the provision of essential services. Private industry will assume greater responsibility towards the community.
Agriculture
Agriculture, the first cylinder of growth, will have to include greater application of modern machinery, more efficient irrigation practices and improved crop varieties. Improved productivity while maintaining sugar production will release land for higher diversification into high-value added products of cash-crops.
Manufacturing
The next cylinder of growth is manufacturing. Modernization and consolidation will need to be encouraged with a move towards new technology and specialization to improve efficiency of production and marketing. Despite the inevitable opening of the world to free
Page 2 of 6CHAPTER 6
28/05/2004http://unfccc.int/resource/docs/natc/maunc1/chap6/chapter6.htm

trade, Mauritius will be able to move up-market into high-value added niches. Productivity, design and quality shall be the means for Mauritius to enhance its competitiveness on international markets.
Tourism
Tourism, the third cylinder of growth, will experience rapid transformation. Expansion of the tourist industry will continue while ensuring the delicate ecological balance. Globalization will certainly fuel the demand for international travel and both domestic and international flight companies will aggressively compete to provide best services at low cost. Mauritius will continue to remain a top class quality destination and in addition a meeting place for the people in the Indian Ocean Rim nations.
Quatenary sector
The quatenary sector, comprising the new high-tech international financial services, is poised to become a lead sector and an industry in its own right and serve as the driving force behind the integration of the economy in the global market. The quaternary sector is expected to contribute to around 28% of GDP. The highly specialized and high value-added services sector, particularly the financial services comprising: off-shore banking, fund management, stock exchange, insurance, etc, will occupy a dominant role in the economic activities. Other services that are likely to come up are publishing and pre-press printing activities, production of multimedia materials, professional tele-services, data-capturing, computer software services, information services related to manufacturing and freeport services.
Political
Political stability, founded on democratic institutions coupled with honest and efficient public administration operating in a transparent and predictable manner has been the pillar of past national successes. The maintenance of both of these is vital to the 2020 aspirations.
CO2 EMISSIONS
Carbon dioxide is the dominant greenhouse gas and it contributed to 94% of the total emissions of Mauritius. The main sources are combustion of fossil fuels for stationary energy and transport.
Energy
Page 3 of 6CHAPTER 6
28/05/2004http://unfccc.int/resource/docs/natc/maunc1/chap6/chapter6.htm

Energy Total energy requirements by 2020 will be around 1.5 M TOE. Electric power requirement is estimated at 3500-4000 GWh out of which about 30% could be generated mainly from bagasse. Improving generation efficiency and energy saving would result in a reduction of 30% of imported sources. Projections of total inland energy requirement (Tonne)
Actual Forecast
1995 2000 2005 2010 2015 2020
LPG 34 119 43 549 55 184 70 082 81 715 95 406
Gasoline 83 958 94 421 106 438 109 013 120 172 131 330
Kerosene 42 922 28 568 193 720 421 499 686 552 1 054 652
Diesel 120 307 146 062 170 450 196 693 216 988 268 242
Fuel Oil 182 746 172 755 168 859 111 794 168 436 128 194
Coal 63 086 275 876 277 468 279 142 280 900 282 749
Bagasse 1 639 810 1 600 000 1 600 000 1 600 000 1 600 000 1 600 000
Fuel wood 1300 625 18 1 1 1
Charcoal 1200 50 2 1 1 1
The adopted policy is to increase power generation from local resources namely bagasse, a by-product of the sugar industry with the necessary investments in technology. Innovative high technologies will be explored in joint ventures. The identified strategic initiatives are:
• close monitoring of the energy requirements • development of a master plan for energy generation from local resources to meet the increasing
demands • establish an energy saving programme
Measures worth considering for Mauritius are:
• increased use of biomass and adoption of more efficient technology such as gasification • use of methanol as fuel • use of solar energy, namely photo voltaic cells • maximise hydro power generation and water utilization • increase power generation from coal instead of petroleum products using cleaner and more
efficient technology. Transport The use of fossil fuels in the transportation sector accounts for about 30% of emissions in 1995 and it is projected that this will reach 40% by 2020.
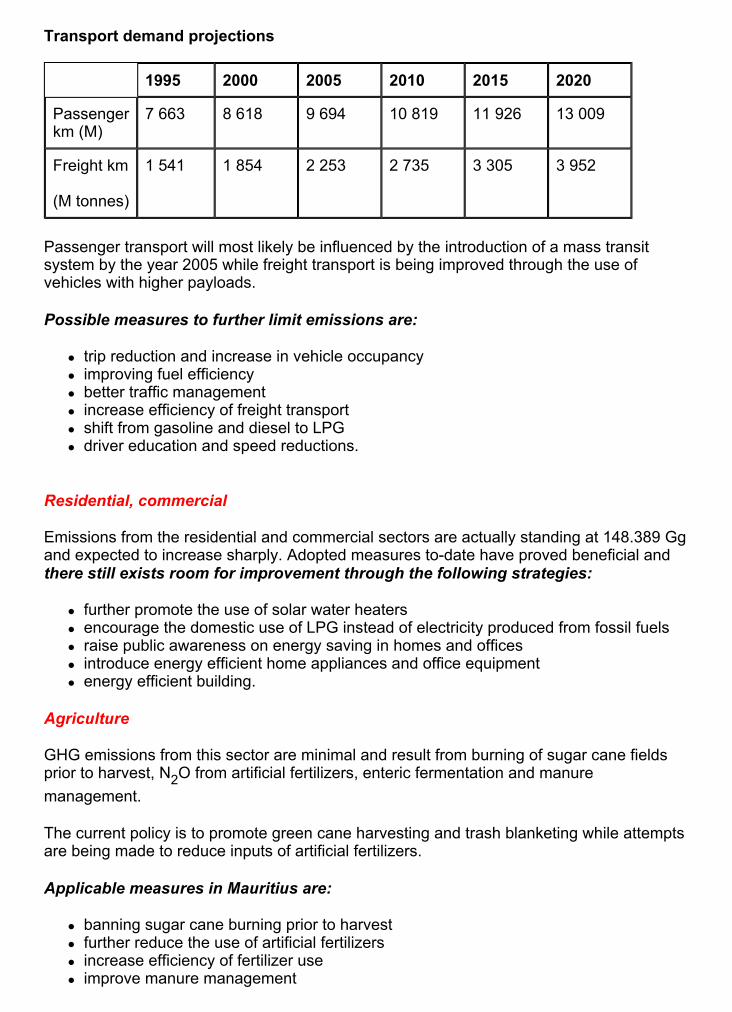
Transport demand projections
Passenger transport will most likely be influenced by the introduction of a mass transit system by the year 2005 while freight transport is being improved through the use of vehicles with higher payloads.
Possible measures to further limit emissions are:
trip reduction and increase in vehicle occupancy improving fuel efficiency better traffic management increase efficiency of freight transport shift from gasoline and diesel to LPG driver education and speed reductions.
Residential, commercial
Emissions from the residential and commercial sectors are actually standing at 148.389 Gg and expected to increase sharply. Adopted measures to-date have proved beneficial and there still exists room for improvement through the following strategies:
further promote the use of solar water heaters encourage the domestic use of LPG instead of electricity produced from fossil fuels raise public awareness on energy saving in homes and offices introduce energy efficient home appliances and office equipment energy efficient building.
Agriculture
GHG emissions from this sector are minimal and result from burning of sugar cane fields prior to harvest, N2O from artificial fertilizers, enteric fermentation and manure management.
The current policy is to promote green cane harvesting and trash blanketing while attempts are being made to reduce inputs of artificial fertilizers.
Applicable measures in Mauritius are:
banning sugar cane burning prior to harvest further reduce the use of artificial fertilizers increase efficiency of fertilizer use improve manure management
1995 2000 2005 2010 2015 2020
Passenger km (M)
7 663 8 618 9 694 10 819 11 926 13 009
Freight km (M tonnes)
1 541 1 854 2 253 2 735 3 305 3 952
Page 5 of 6CHAPTER 6
28/05/2004http://unfccc.int/resource/docs/natc/maunc1/chap6/chapter6.htm

improve quality of feed to reduce enteric fermentation encourage integrated farming.
Land use and Forestry
Mauritius with its limited land resource is not contributing to emissions through changes in land use and no significant evolution is expected in the future. It is projected that about 1% of agricultural land will be lost to urbanization. The forest areas are also not projected to change.
The forest areas declared as nature reserves and parks as well as mountain and river reserves are well protected by the necessary legislations and will continue to act as sinks.
Additional measures are:
prevent further degradation of forests tree plantation programme by individuals.
Waste management
Reduce waste volume Promote recycling
Page 6 of 6CHAPTER 6
28/05/2004http://unfccc.int/resource/docs/natc/maunc1/chap6/chapter6.htm
CHAPTER 7 : MITIGATION AND ADAPTATION OPTIONS
INTRODUCTION
Various mitigation and adaptation options have been identified within the Mauritian environment to reduce GHG emissions and to cope with climate changes. Some of these have already been implemented partially or totally according to the existing natural, social and economic context while others might be more difficult to address because of constraints. The non-exhaustive list of options and the contraints foreseen are given on a sectoral basis.
ENERGY AND INDUSTRY
Option Constraints or Challenges
Keep better statistics to allow easier and better data-gathering for periodic GHG inventories
Before doing initial survey, the statistics division and government was not aware that some information might be crucial and much of the information was grouped and needed to be split. As experience increases, knowledge will improve about what data may be useful to make energy projections and mitigation analyses. Statistics should be kept on import of vehicles, small motors, engines, household generators, industrial equipment, increase in use of certain appliances such as air conditioners and fans, etc.
Rodrigues and Outer atolls- assessment of energy requirements and best renewable energy options
For any systems that do get installed, on-site training of personnel to repair and maintain the systems will be crucial. Also, if wind energy is chosen on Rodrigues, the towers must be able to come down if a cyclone is predicted. Systems installed should be viable for commercial income-producing activities on a small-scale, as well as for household needs.
Electric company user fees should reflect the real cost of producing and distributing power
Customers will complain about price increases; the poor will be disadvantaged by higher bills.
Decrease dependency on fossil fuels while increasing use of renewable energy alternatives
Mauritius has significant potential to utilize many alternatives for generation of electricity; and with capital investment could provide almost all of the islands’ energy needs from a combination of biofuels (from sugar cane), photovoltaics (solar), wind power, ocean wave power, and ocean thermal energy conversion. Most of these would require tremendous initial capital investment, with benefits accruing in the long-term, both environmentally and economically. Decisions must be made at a high-level about what technologies to pursue.

Lower energy consumption through demand-side management energy efficiency and conservation programs and incentives
This would entail a variety of policies and measures including voluntary programs, tax refunds, consumer education, energy audits of businesses and industry, and perhaps initiation of a "green labelling" program for household appliances and office equipment. It has been successfully done in other countries and would probably work in Mauritius, if loopholes are closed (i.e. duty free shops must also comply).
Ban imports of high power consuming appliances; or give favoured import status to low-energy appliances
The economic costs and impacts of these types of policies for local businesses must be evaluated first.
The economic costs and impacts of these types of policies for local businesses must be evaluated first
Loss in revenue to government
Conduct a "turn off the lights" energy-awareness campaign for the holiday and tourism sector.
Materials would need to be printed in a multitude of foreign languages to be effective, or at the very minimum two or three.
A strategy is being devised to sensitize stakeholders on the need to adopt more efficient and cleaner production systems.
Stakeholders have reacted positively to the strategy. An energy awareness campaign is being worked out at the level of the Ministry of Industry.
TRANSPORT
Option Constraints or Challenges
Go forward on building a rapid public transport system, as projected, utilizing electric-powered vehicles
Funding will be crucial to do engineering, obtain equipment, and to purchase right of ways and land for construction
Ban visible emissions of fumes by initiating a "Clean Air Act"
If fines or penalties are to be charged, there must be an adequate number of meters to quantitatively measure emissions or else the legal challenges will swamp the court system
Encourage "carpooling" to government offices and large factories
Certain incentives can be offered, such as a special sticker which entitles the carpool driver to special parking privileges or the use of a fast traffic lane
Enforce maximum speed limits
A best effort is being made, with speeding fines and penalties, but public education could also tie reducing speed to decreased GHG emissions

Gradual introduction of unleaded gasoline
There will have to be a phase-in period of several years as gas pumps and car gas tanks will need to be converted. Also to be taken in consideration the lost difference and supply between leaded and unleaded fuel.
Public education program to "Ride the Bus"
"Coccooning" of people in private cars is a result of raise in standard of living and incomes. Private cars allow freedom to move around at will.
Encourage import of fuel efficient cars and vehicles; discourage the import of inefficient vehicles
A combination of public education and market-based incentives like lower customs fees and import duties could accomplish this
Research possibilities for economical fuel switching
The most promising option is possible local production of ethanol from sugar cane by-products; LPG technology is in its infancy but is a long-term future possibility. Private electric cars at this point are not a realistic option.
COASTAL ZONE
Option Constraints or Challenges
Continue meetings of the working committee on Integrated Coastal Zone Management (ICZM) to oversee the development of ICZM Plan for the South (funded by the Indian Ocean Commission) that includes CC and SLR concerns and adaptation strategies; this can then be used for a model to expand into all-island ICZM Plan
Any ICZM Plan must be incorporated into National Economic Development Plans; a Lead Ministry or Agency and key person should be named to coordinate efforts; they should be invested with the authority to make decisions; all stakeholders need to be represented including several levels of government, business and industry, port managers, recreational and tourist private sector, environmental NGOs, fishermen and users of resources in the coastal zone; they must participate and have input into the drafting of the plan and be allowed to comment significantly at every phase; plan must have a strong outreach and public-awareness component to ensure voluntary compliance.
Legislative and policy review of all laws pertaining to management of the coastal zone for coping with sea-level rise and non-living marine resources
This may have to be done by an outside consultant who can be completely impartial; this should also evaluate overlapping jurisdictions and responsibilities; any new laws drafted will need to be reviewed internally by attorneys for their appropriateness.
Fund regular periodic aerial photography of coastline, or aerial video vulnerability assessments, perhaps every 3 to 5 years
This is expensive, and outside donor agencies are not keen to fund it. Rodrigues and the Outer Atolls should be included in this

Establish mechanism to do systematic surveys of existing beaches, mangrove strands and coral reefs island-wide to create baseline maps
Healthy coral reefs are the best coastal protection Mauritius has, assuming the degradation is averted. Mangroves protect the shorelines. Monitoring is now being done on an ad hoc basis. It will require outside funding to do a thorough job. The government must be committed to regular monitoring, perhaps utilizing assistance from the recreation dive industry. Ideally, the maps will be incorporated on GIS computer software, to simplify analyses.
Computerize all valid historical maps and air photos and lay them over verified and ground truthed geological maps
This technique can give a quantitative estimate of coastal erosion over time, but is only as good as the quality of the maps used. It is still a very useful technique and someone should be trained in the methodology.
Investigate costs of beach replenishment using offshore sand
This is expensive and must be done continually, once begun. It may offer a solution for some hotels and resorts, however.
Research the costs and advantages of various types of hard protection for coasts including sloping sea -walls, revetments, offshore breakwaters, etc.
The gabions and poorly designed sea walls which have been built thus far are straight-up, or leveled stair-like and causing increased beach erosion in the places not protected by them. The design needs to be considered as a system, in terms of sand transport, change in current patterns and dissipation of wave energy action.
Establish regular beach monitoring program to evaluate erosion on a regular basis
Although initial baseline surveys need to be done by trained surveyors, the government could not afford to continually monitor. Possibly, local communities or University students could be trained to monitor beaches using low-tech methodologies.
Establish a coral reef monitoring program to evaluate degradation on a regular basis
This is also being done on an ad hoc basis. Possibly, this could be done by marine science students at the University or resort dive operators with proper training in transecting methods.
Establish marine parks and wet lands preserves to insure migration pathways for species as temperatures increase
Apart from possible land tenure issues; this could easily be done.
Request outside donor agency to supply SEAFRAME electronic tide gauge
This is best done if a regional network is established so that comparable levels of data are gathered around the Indian Ocean. Data may need to be analyzed out-of-country and transmitted to Met Services.

AGRICULTURE
Option Constraints or Challenges
Further research and experimentation with salt / drought tolerant and wind-resistant varieties of sugar cane
This may be done on a regional basis or in affiliation with other sugar-producing tropical islands such as Fiji, Cuba, Hawaii and Australia. It will require funding and a long time-scale to evaluate results, to experiment with culturing and testing under a variety of conditions.
Diversification of agricultural products for export and home consumption
Diversification has been recommended for a decade and is being done, but sugar is the most lucrative and the most hardy during cyclone conditions; there is potential to expand the cut flower industry and tropical fruit export but constraints include competition and need for air transport to markets.
Study the length of growing seasons and optimal time to harvest (sugar cane)
This could be undertaken by the Mauritius Sugar Industry Research Institute, but will require adequate funding.
FISHERIES
Option Constraints or Challenges
Data gathering for assessment of stock, sustainable yield and depletion
This is being done to some degree, both locally and regionally; a longer time series of data and better data will be needed to prepare for CC, including: habitats, hatching, migration in relation to sea temperatures.
Ban gill nets entirely, and other destructive fishing practices, as part of a ICZM Plan
Mesh size is being controlled; enforcement is difficult.
Participate in regional and international research on optimal temperature ranges for pelagic fish
Certain species of tuna have been shown to seek the ocean depth that is their optimal temperature; this has implications for investments in types of equipment and the technologies chosen to upgrade the commercial fishing industry.
Increase sea-food production from Aquaculture
This too may be proven to be vulnerable to sea temperature changes.
Collect data on ocean circulation changes as they relate to temperature & SLR
Much of this data is remotely sensed via satellite and very expensive to acquire.
FORESTRY
Option Constraints or Challenges
Preserve and conserve remaining forests
Forests are protected by law; private land-owners are given government assistance; much of what could be done is already being done.
Initiate aggressive tree-planting programs in urban areas and on private land
The expense is one constraint; also research into what species would increase biomass quickly is a consideration; government could perhaps give financial incentives to people who plant trees on private land.
Ban cutting of mangroves and protect mangrove forests as part of an ICZM
There are very few mangrove areas left in Mauritius to protect.
WASTE MANAGEMENT
Option Constraints or Challenges
Initiate education on recycling and composting and programs to reduce waste
Government must support this; private entrepreneurs will need to generate business utilizing and re-manufacturing recycled products, preferably on-island, since shipping off-island is not cost-effective; there needs to be a large public awareness and school outreach program and drop-off centers for recyclables need to be easily accessible to the general public.
Investigate the possibility of a gas-to energy power plant
Capital intensive; would require outside funding and technical expertise to implement. There may not be sufficient population or garbage generated to make this an effective mitigation option.
Study the effect of sewage outfalls on the coral reefs, as part of an ICZM Plan
Longer pipes may need to be constructed or other options for dealing with sewage considered if they are destroying the coral reefs, which are the best coastal protection for SLR.

WATER RESOURCES
Option Constraints or Challenges
Do measurement, mapping and computer modelling of the ground water lenses for atolls
The models have already been created (within the framework of the USCSP) and do exist, but someone locally has to be trained to understand them and run them.
Encourage the use of "gray water" for secondary household uses, through a massive public education campaign
This has been done successfully in many countries and is a fairly easy to implement.
Mass Construction of household back-up rain-catchment tanks
Water quality would need to be tested periodically; these would be useful during drought conditions
Put limitations on the use of water for crop irrigation
This policy could be very detrimental to large- and small-scale sugar cane growers and is not likely to be readily accepted
Efficient water resources management Training and capacity building
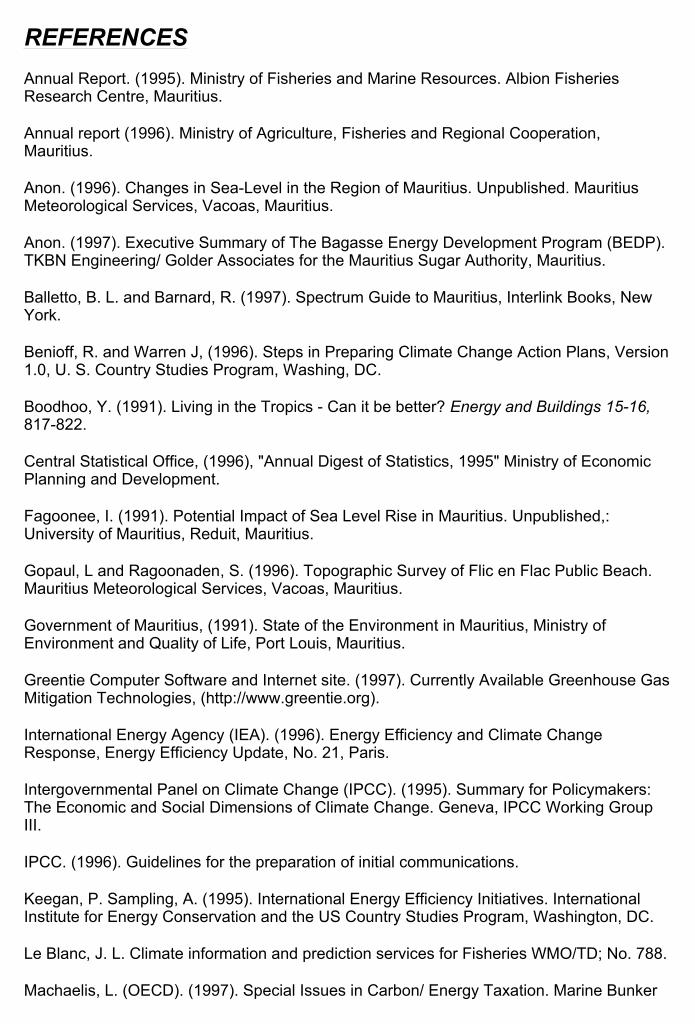
REFERENCES
Annual Report. (1995). Ministry of Fisheries and Marine Resources. Albion Fisheries Research Centre, Mauritius.
Annual report (1996). Ministry of Agriculture, Fisheries and Regional Cooperation, Mauritius.
Anon. (1996). Changes in Sea-Level in the Region of Mauritius. Unpublished. Mauritius Meteorological Services, Vacoas, Mauritius.
Anon. (1997). Executive Summary of The Bagasse Energy Development Program (BEDP). TKBN Engineering/ Golder Associates for the Mauritius Sugar Authority, Mauritius.
Balletto, B. L. and Barnard, R. (1997). Spectrum Guide to Mauritius, Interlink Books, New York.
Benioff, R. and Warren J, (1996). Steps in Preparing Climate Change Action Plans, Version 1.0, U. S. Country Studies Program, Washing, DC.
Boodhoo, Y. (1991). Living in the Tropics - Can it be better? Energy and Buildings 15-16, 817-822.
Central Statistical Office, (1996), "Annual Digest of Statistics, 1995" Ministry of Economic Planning and Development.
Fagoonee, I. (1991). Potential Impact of Sea Level Rise in Mauritius. Unpublished,: University of Mauritius, Reduit, Mauritius.
Gopaul, L and Ragoonaden, S. (1996). Topographic Survey of Flic en Flac Public Beach. Mauritius Meteorological Services, Vacoas, Mauritius.
Government of Mauritius, (1991). State of the Environment in Mauritius, Ministry of Environment and Quality of Life, Port Louis, Mauritius.
Greentie Computer Software and Internet site. (1997). Currently Available Greenhouse Gas Mitigation Technologies, (http://www.greentie.org).
International Energy Agency (IEA). (1996). Energy Efficiency and Climate Change Response, Energy Efficiency Update, No. 21, Paris.
Intergovernmental Panel on Climate Change (IPCC). (1995). Summary for Policymakers: The Economic and Social Dimensions of Climate Change. Geneva, IPCC Working Group III.
IPCC. (1996). Guidelines for the preparation of initial communications.
Keegan, P. Sampling, A. (1995). International Energy Efficiency Initiatives. International Institute for Energy Conservation and the US Country Studies Program, Washington, DC.
Le Blanc, J. L. Climate information and prediction services for Fisheries WMO/TD; No. 788.
Machaelis, L. (OECD). (1997). Special Issues in Carbon/ Energy Taxation. Marine Bunker
Page 1 of 3REFERENCES
27/05/2004http://unfccc.int/resource/docs/natc/maunc1/references.htm
Fuel Charges, International Energy Agency, "Policies and Measures for Common Action" Working Paper 11, Paris.
Mauritius. (1992). Expanding Horizons, World Bank, Washington, DC.
Mauritiius, (1989). Managing Success, World Bank, Washington, DC.
Meade J. E. (1968). The Economic and Social Structure of Mauritius. Cass F., & Co, U. K.
National Climate Committee- Mauritius. (1996), Report on National Workshop on Climate Change Activities. Mauritius Meteorological Services, Vacoas, Mauritius.
National Climate Committee- Mauritius. (1995). Report on One Day Seminar on Climate Change and its Impacts. Mauritius Meteorological Services, Vacoas, Mauritius.
National Climate Committee- Mauritius. (1997). The Economics of Greenhouse Gas Limitation, Phase 1, Technical mid-term report. (Unpublished).
Nayamuth, A.R. and Cheeroo-Nayamuth, F. C. (1998). Vulnerability and Adaptation Assessment of the Sugar Cane Crop to Climate Change in Mauritius. MSIRI, Reduit, Mauritius. (In Press).
Padya, B. M. (1984). The Climate of Mauritius, Second Edition, Meteorological Services, Vacoas, Mauritius.
Ramnauth, N. (1995). Vulnerability and Adaptation Assessments, Survey Activities at Pomponette. Meteorological Services, Vacoas: Mauritius.
Ragoonaden, S, et al. (1996). Coastal Geomorphology and Impacts of Sea-Level Rise on Coastal Zone with Adaptive Measures. Meteorological Services, Vacoas: Mauritius.
Ragoonaden, S. (1993). Mean Monthly Sea-level Variation and its relation to large scale ocean-circulation in the South West Indian Ocean Meteorological Services, Vacoas, Mauritius. (Unpublished).
Ragoonaden, S. (1993). Marine Pollution Monitoring in Our Lagoon and Open Sea. Meteorological Services, Vacoas, Mauritius. (Unpublished).
Ragoonaden, S. et al. (1996). The Island States at Risk; Mauritius Case. Meteorological Services, Vacoas, Mauritius.
Ragoonaden, S. (1995). Vulnerability and Adaptation Assessments: Climate Change Scenarios, Meteorological Services, Vacoas, Mauritius.
Rumsey, P and Flanigan. T. (1995). Standards and Labeling: The Philippines Residential Air Conditioner Program,: International Institute for Energy Conservation, Washington, DC.
Saha, T. R. and Jugessur.S. (1982). Analysis of Wave Recordings and the Estimation of Wave Power in Mauritius. University of Mauritius.
Sathaye, J. (1997). Achieving Sustainable Transportation: A Taxing Paradigm? Lawrence Berkeley National Laboratory, Berkeley, Calif.
Page 2 of 3REFERENCES
27/05/2004http://unfccc.int/resource/docs/natc/maunc1/references.htm

Sathaye, J and Meyers S. et al. (1995). Greenhouse Gas Mitigation Assessment: A Guidebook, Kluwer Academic Publishers, Dordrecht, The Netherlands.
Sok Appadu, S. N. and Ramgolam P. (1996). Mauritius National Inventory of Greenhouse Gases (1990). Mauritius Meteorological Services, Vacoas, Mauritius.
Titmuss R. M. and Abel-Smith B. (1968). Social policies and population growth in Mauritius, Frank Cass & Co. Ltd, U. K.
United Nations Framework Convention on Climate Change (UN FCCC). Policies and Measures for Possible Common Action. (Unpublished).
Veerasamy, S. (1995). Climate Variability and Sugar Production in Mauritius, Meteorological Services, Vacoas: Mauritius.
Vision 2020, The National Long-term Perspective Study. (1997). Ministry of Economic Development & Regional Co-operation, Mauritius.
World Health Organisation. (1996). Climate Change and human health. WHO, Geneva.
World Meteorological Organisation. (1996). Climate and human health. WMO No. 843, Geneva.
World Meteorological Organisation. (1996). Climate and Urban development. WMO No. 844, Geneva.
Page 3 of 3REFERENCES
27/05/2004http://unfccc.int/resource/docs/natc/maunc1/references.htm