aerial surveys of endangered · estimated median and mean (x) water depths at the location of...
TRANSCRIPT

----- - ----~-~------r--- ------ - ----
Aerial Surveys of EndangeredWhales in the Beaufort Sea,Fal11996
OCS StudyMMS 97-0016
\\\\ALASKA
\ \, \, \\ \
\
~..>.0-
\ .':~.'-':~: - ? :.:::•........-~. ..''"
IWSU.S. Department of the InteriorMinerals Management ServiceAlaska OCS Region

Any use of trade names is for description purposes only anddoes not constitute endorsement of these products
by the Minerals Management Service.

Aerial Surveys of EndangeredWhales in the Beaufort Sea,Fal11996
OCS StudyMMS 97·0016
u.S. Department of the InteriorMinerals Management ServiceAlaska OCS Region
Anchorage, Alaska1997
By Stephen D. Treacy, Research ManagerMMS Bowhead Whale Aerial Survey
1

ABSTRACT
This report describes field activities and data analyses for aerial surveys of bowhead whales conductedbetween 1 September 1996 and 10 October 1996 in the Beaufort Sea, primarily between 140oW. and157°W. longitudes south of 72°N. latitude. General ice cover during September and October 1996 wasrelatively light, although after mid-September higher sea-ice concentrations often prevailed in areas wherewhales were observed. The number of sightings of bowhead whales (n = 69) and the number of bowheadwhales counted (n = 114) during Fall 1996 were somewhat limited by local ice concentrations. The bowheadwhales, 617 belukha whales, 6 unidentified cetaceans, 3 bearded seals, 137 ringed seals, 10 polar bears,and 90 sets of polar bear tracks were observed in 1996 during 123.00 hours of survey effort that included59.53 hours on randomized transects. The initial sighting of bowhead whales in Alaskan waters occurredon 2 September. Of all bowhead whales observed, half (median) had been counted by 20 September. Thepeak count (mode) of 34 whales occurred on 26 September. The last sighting of a bowhead whale in theprimary study area occurred in so-percent ice in Block 11 on 5 October. Estimated median and mean (x)water depths at the location of bowhead whales sighted on randomized line transects during September andOctober 1996, 35.0 meters and 35.3 meters, respectively, are consistent with a previously noted trend forwhales to be located in shallower water during years of light ice cover.

ACKNOWLEDGMENTS
Project Management
Cleveland J. Cowles, Ph.D., SupervisorStephen D. Treacy, Research Manager
Minerals Management Service (MMS) Project Field Science
Stephen D. Treacy, Team Leader (Flights 1-23)Donald Hansen, Team Leader (Flights 24-34)Kyle Monkelien, Data Recorder-Observer (Flights 1-9)Kristopher Nuttall, Data Recorder-Observer (Flights 10-33)Michael Baffrey, Data-Recorder-Observer (Flight 34)Valerie Elliott, Primary Observer (Fljghts 1-6)Linda Reeves, Primary Observer (Flights 7-16)Michael Baffrey, Primary Observer (Flights 17-33)Kristopher Nuttall, Primary Observer (Flight 34)Caryn Smith, Alternate Observer (Flights 3-5)
iii
MMS Technical Support
Michael Baffrey, Field Equipment Coordinator
MMS Report Production
Warren Horowitz, Geographic Information System Cartography (all ArcView 3.0 maps)Colleen Ryan, Manuscript Editor
Contracting Officer's Administrative Representative - Aircraft Support
Stephen D. Treacy - MMS/Office of Aircraft Services (OAS) IA 05052
National Marine Fisheries Service (NMFS) Liaison
Ron Morris, NMFS, Anchorage, Alaska
We acknowledge the Department of the Interior, OAS, for making all aircraft arrangements; Dale Best, AlanFoster, Jim Larson, and Jeff Sharp (ERA Aviation) for piloting the Twin Otter; and Deadhorse Flight Servicefor providing us with daily telefaxes of local weather.
The project management acknowledges Dave Benner, National Oceanic and Atmospheric Administration(NOAA), National Ice Center, and Paul Seymour, Navy, Naval Ice Center, for providing draft sea-ice-severityrankings; Dave Luciano, Naval Ice Center, for analyzing sea-ice data from satellite imagery and othersources; and Eric Tran, Naval Ice Center, for programming and providing sea-ice concentrations inARC/INFO format.
We appreciate review comments on this and/or previous project reports by the NMFS, the State of Alaska,the North Slope Borough, the Indigenous People's Council for Marine Mammals, and Dr. Steven Swartz,formerly with the Marine Mammal Commission.
We thank MMS personnel Stan Ashmore for drafting Figure 18 (Corel Draw 7), Ida DeBock for draftingFigure 19 (AutoCAD, Autodesk, Inc.), Mazelle Parker for reformatting report tables (Corel WordPerfect 7),Tom Murrell for converting data and organizing project information on the Internet, Linda Reeves and LizWilliamson for administrative support, Marie Colver for secretarial support, and Harry Kugler for reportreproduction. Ann Treacy contributed the cover illustration.
?

v
CONTENTS
Page
ABSTRACT i
ACKNOWLEDGMENTS •...............................................•............. iii
I. INTRODUCTION " 1
II. METHODSAND MATERIALS 3A. Study Area ...............................................................• 3B. Equipment ...................................................•............ 3C. Aerial-Survey Design ...........................•....•..•......•............ 5D. Survey-Flight Procedures " " . . . . . . . . . .. 6E. Data Entry ....•..............•...... " " . . . . . . . . . . . . . . . . . . . . . . . . . . . . . . . . .. 6F. General Data Analyses 9G. Median and Mean Water Depth at Bowhead Sightings (Analysis Protocol) 11
III. RESULTS. . . . . . . . . . . . . . • . . . . . . . . . . . . . . . . . . . . . . . . . . . . . . . . . . . . . . . . . . . . . . . . . . .. 15A. Environmental Conditions 15B. Survey Effort ..... ;....................................................... 15C. Bowhead Whale (BaJaena mysticetus) Observations 15
1. Distribution .......................................•.................... 152. Migration Timing . . . . . . . . . . . . . . . . . . . . . . . . . . . . . . . . . . . . . . . . . . . . . . . . . . . . . . .. 353. Relative Abundance by Survey Blocks 354. Habitat Associations 395. Behavior, Swim Direction, and Speed 39
D. Other Marine Mammal Observations 431. Gray Whale (Eschrichtius robustus) . . . . . . . . . . . . . . . . . . . . . . . . . . . . . . . . . . . . . . .. 432. Belukha Whale (DeJphinapterus Jeucas) 433. Unidentified Cetaceans "......................................... 434. Bearded Seal (Erignathus barbatus) 475. Ringed Seal (Phoca hispida) 476. Pacific Walrus (Odobenus rosmarus) 477. Unidentified Pinnipeds . . . . . . . . . . . . . . . . . . . . . . . . . . . . . . . . . . . . . . . . . . . . . . . . . .. 478. Polar Bear (Ursus maritimus) 47
IV. DISCUSSION , 53A. General Comparisons with Previous Surveys (1979-1995) 53B. Median and Mean Water Depth at Bowhead Sightings (1982-1996) 53C. Potential Responses of Bowheads to Survey Aircraft 67D. Potential Effect of General Ice Cover on WPUE (1979-1996) 67E. Management Use of Real-Time Field Information 71F. Field Coordinations and Information Support 71
V. LITERATURECITED 73
APPENDICESAppendix A: Bowhead Whale Densities A-1Appendix B: Daily Flight Summaries. . . . . . . . . . . . . . . . . . . . • . . . . . . . . . . . . . . . • . . . . .. B-1
Glossary of Abbreviations, Acronyms, and Initialisms
1

FigureNumber Title Page
LIST OF FIGURES
1 Fall 1996StudyArea Showing SurveyBlocks 4
2 Regionsl,.II, and III and Selected Isobaths 12
3 Map of IceConcentrations in the BeaufortSea,23 August 1996 . . . . . . . . . . . . . . . . . . . . .. 16
4 Mapof Ice Concentrationsin the BeaufortSea, 30 August 1996 . . . . . . . . . . . . . . . . . . . . .. 17
5 Mapof Ice Concentrationsin the BeaufortSea, 6 September 1996 . . . . . . . . . . . . . . . . . . .. 18
6 Mapof Ice Concentrationsin the BeaufortSea, 13 September 1996 . . . . . . . . . . . . . . . . . .. 19
7 Mapof Ice Concentrationsin the BeaufortSea, 20 September 1996 . . . . . . . . . . . . . . . . . .. 20
8 Map of Ice Concentrationsin the BeaufortSea, 27 September 1996 ,. 21
9 Mapof Ice Concentrationsin the BeaufortSea, 4 October 1996 22
10 Mapof Ice Concentrationsin the BeaufortSea, 11 October 1996 23
11 CombinedFlightTracks, 1-15 September1996 24
12 CombinedFlightTracks, 16-30 September1996 25
13 CombinedFlightTracks, 1-9 October 1996 ..... , . . . . . . . . . . . . . . . . . . . . . . . . . . . . . . . .. 26
14 Map of BowheadWhale Sightings,1-15 September 1996 . . . . . . . . . . . . . . . . . . . . . . . . . .. 27
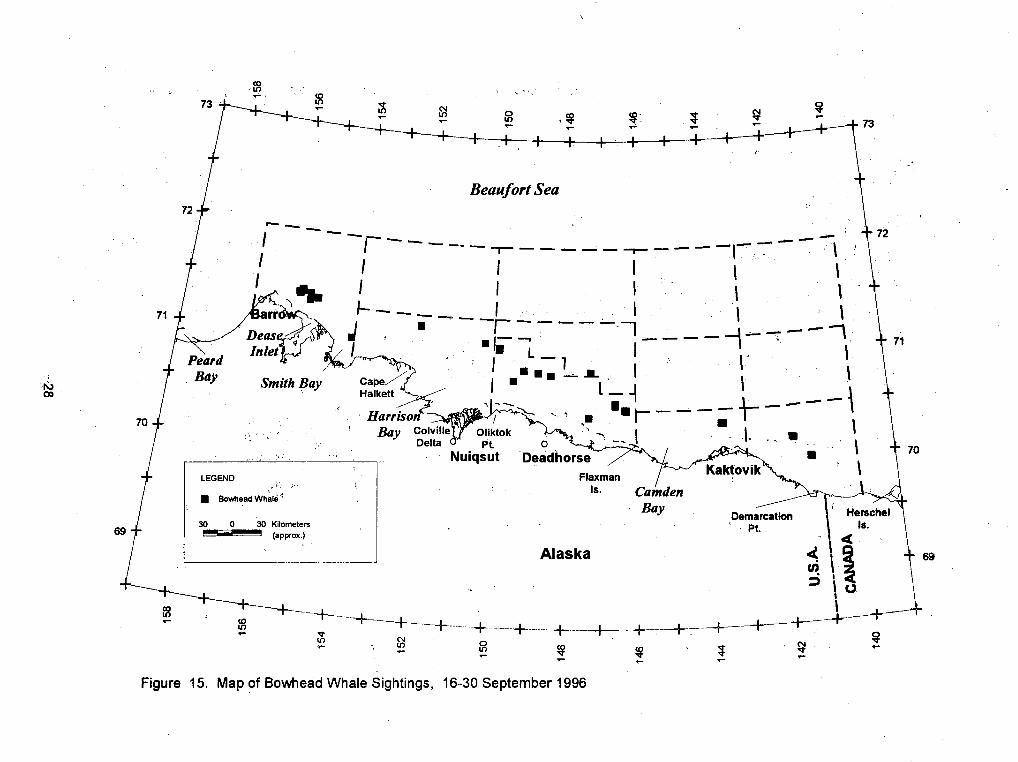
15 Map of BowheadWhale Sightings,16-30 September 1996 . . . . . . . . . . . . . . . . . . . . . . . . .. 28
16 Mapof BowheadWhale Sightings,1-9 October 1996 29
17 Mapof BowheadWhale Sightings,Fall 1996 30
18 Daily RelativeAbundanceand Sighting Rate of BowheadWhales,1 September-9October 1996 . . . . . . . . . . . . . . . . . . . . . . . . . . . . . . . . . . . . . . . . . . . . . . . . .. 36
19 SemimonthlySummaryof Swim Directionsfor BowheadWhales, Fall 1996 . . . . . . . . . . . .. 40
20 Mapof BelukhaWhale Sightings,Fall 1996 44
21 Map of UnidentifiedCetaceans,Fall 1996 , " 45
22 Map of BeardedSeal Sightings,Fall 1996 48
23 Mapof RingedSeal Sightings,Fall 1996 . . . . . . . . . . . . . . . . . . . . . . . . . . . . . . . . . . . . . . . .. 49
24 Map of PolarBear Sightings,Fall 1996 . . . . . . . . . . . . . . . . . . . . . . . . . . . . . . . . . . . . . . . . .. 50
25 Mapof Polar Bear Tracks, Fall 1996 51
26 MedianWater Depthat RandomSightingsof BowheadWhales, by Year, 1982-1996 54
vi

TableNumber Title Page
LIST OF TABLES
1 Data-Entry Sequence on the Portable Flight Computer 7
2 Operational Definitions of Observed Whale Behaviors. . . . . . . . . . . . . . . . . . . . . . . . . . . . .. 10
3 Aertat-Survey Effort in the Beaufort Sea, 1 September-9 October 1996,by SUNey Flight ".... 31
4 Summary of Marine Mammal Sightings, 1 September-9 October 1996,by SUNey Flight "............................ 33
5 Number of Sightings and Total Bowhead Whales Observed per Hour,1 September-9 October 1996, by Flight Day " . . . . . . . . . . . . . . . . . . . . . . .. 37
6 Semimonthly Relative Abundance (WPUE) of Bowhead Whales, by SUNeyBlock, Fall 1996 """ 38
7 Semimonthly Summary of Bowhead Whales Observed, by Water Depth atSighting Location, Fall 1996 .. " " " " " , 41
8 Semimonthly Summary of Bowhead Whales Observed, by Percent Ice CoverPresent at Sighting Location, Fall 1996 " " " ". 41
9 Semimonthly Summary of Bowhead Whales Observed, by Behavioral Category,Fall 1996 " . . . . . . . . . . . . . . . . . . . . . . . . . . . . . . . . . . . . . . . .. 42
10 Semimonthly Summary of Bowhead Whales Observed, by Swimming Speed.Fall 1996 " . " . . . . . . . .. 42
11 Bowhead Whale Relative Abundance (WPUE) by Beaufort Sea SUNey Blockduring September and October, 1979-1996 " "...... 55
12 Central-Tendency Statistics for Water Depth at Random Sightings of BowheadWhales (September-October), by Year and Region, 1982-1996 56
13 Interyear Correlation of the Median Water Depths at Random Bowhead WhaleSightings (September-October) Using the Mann-Whitney U Test, 1982-1996 61
14 Interyear Correlation of-the Mean Water Depths at Random Bowhead Whale Sightings(September-October) Using Analysis of Variants and the Tukey Test, 1982-1996 65
15 Relative Abundance (WPUE) of Bowhead Whales within the Primary Study Areaduring September and October, by Year and General Ice Coverage, 1979-1996 68
vii

I. INTRODUCTION
In 1953, the Outer Continental Shelf Lands Act (OCSLA) (43 USC 1331-1356) charged the Secretary of theInterior with the responsibility for administering minerals exploration and development of the OCS. The Actempowered the Secretary to formulataregulations so that its provisions might be met. The OCSLAAmendments of 1978 (43 USC 1802) established a policy for the management of oil and natural gas in theOCS and for protection of the marine and coastal environments. The amended OCSLA states that theSecretary of the Interior shall conduct studies in areas or regions of sales to ascertain the "environmentalimpacts on the marine and coastal environments of the outer Continental Shelf and the coastal areas whichmay be affected by oil and gas development" (43 USC 1346). .
Subsequent to the passage of the OCSLA, the Secretary of the Interior designated the Bureau of LandManagement (BLM) as the administrative agency responsible for leasing submerged Federal lands and theConservation Division of the U.S. Geological Survey for classification and evaluation of submerged Federallands and regulation of exploration and production. In 1982, the Minerals Management Service (MMS)assumed these responsibilities.
To provide information used in environmental impact statements and environmental assessments under theNational Environmental Policy Act of 1969 (42 USC 4321-4347), and to assure protection of marinemammals under the Marine Mammal Protection Act of 1972 (16 USC 1361-1407) and the EndangeredSpecies Act (ESA) of 1973 (16 USC 1531-1543), BLM funded num~rous studies involving acquisition andanalysis of marine mammal and other environmental data. '
1
In June 1978, BLM entered into an ESA Section.7 consultation with the National Marine Fisheries Service(NMFS). The purpose of the consultation was to determine the likely effects of the proposed Beaufort SeaOil and Gas Lease Sale on endangered bowhead (Balaena mysticetus) and gray (Eschrichtiu5 robustus)whales. After reviewing available information on the two species, NMFS determined that insufficientinformation existed to conclude whether the proposed Beaufort Sea sale was or was not likely to jeopardizethe continued existence of bowhead and gray whales. In August 1978, NMFS recommended studies to BLMthat would fill the information needs identified during the Section 7 consultation. Subsequent biologicalopinions for Arctic Region sales-including a regional biological opinion; a revised opinion relative to thejoint Federal/State lease area; and opinions on Sales 71 (issued in 1982), 87 (issued in 1983), 97 (issuedin 1987), and Arctic Region sales (issued in 1988)-recommended continuing studies of whale distributionand OCS-industry effects on bowhead whales (USDOC, NOAA, NMFS, 1982, 1983, 1987, 1988). The ArcticRegion Biological Opinion was used by NMFS for subsequent sales in the Beaufort Sea (Sale 124 in 1991and Sale 144 in 1996). These opinions also requested monitoring of bowhead whale presence duringperiods when geophysical exploration and drilling are occurring.
Following several years when drilling was limited to the period 1 November through 31 March (USDOI, MMS,1979), a variable 2-month seasonal-drilling restriction on fall exploratory activity in the joint Federal/StateBeaufort Sea sale area was implemented. The period of restriction would vary depending on bowheadwhale presence, and "this determination would require development of a monitoring program .... " (USDOI,MMS, 1982). SUbsequently, MMS (Alaska OCS Region) adopted an endangered whale-monitoring plan thatrequired aerial surveys. The Diapir Field Sale 87 Notice of Sale (NOS) (1984) states that "Bowhead whaleswill be monitored by the Government, the lessee, or both to determine their locations relative to operationalsites as they migrate through or adjacent to the sale area" (USDOI, MMS, 1984). Three subsequent leasesales in the Beaufort Sea, Sale 97 (1988), Sale 124 (1991), and Sale 144 (1996), have not included aseasonal drilling restriction. The NOS for each of these sales contains an Information to Lessees clausethat "MMS intends to continue its areawide endangered whale monitoring program in the Beaufort Seaduring exploration activities" (USDOI, MMS, 1988, 1991, 1996). The information gathered will provideadditional assistance to determine the extent, if any, of adverse effects on the species.
From 1979 to 1987, the MMS (formerly BLM) funded annual monitoring of endangered whales in' arcticwaters under Interagency Agreements with the Naval Ocean Systems Center (NOSC) and throughsubcontracts to SEACO, Inc. On 15 April 1987, a proposal for MMS scientists to conduct aerial surveys of

2
endangered whales was approved by the Associate Director for Offshore Minerals Management. The MMS .uses agency personnel to perform field work and reporting activities for the Beaufort Sea on an annualbasis. Previous survey reports are available for inspection at the Minerals Management Service, AlaskaOCS Region, Resource Center, 949 East 36th Avenue, Anchorage, Alaska 99508-4363.
The present goals of the ongoing program for monitoring endangered whales are to:
1. Provide real-time data to MMS and NMFS on the general progress of the fall migration of bowheadwhales across the Alaskan Beaufort Sea, for use in implementing overall limitations on seasonal drillingand geological/geophysical exploration;
2. Monitor temporal and spatial trends in the distribution. relative abundance, habitat, and behaviors (e.g.,feeding) of endangered whales in arctic waters;
3. Provide annual analyses of long-terminteryear trends in the median depth (or north-south positioning)of the migration axis of bowhead whales;
4. Provide an objective wide-area context for management interpretation of the overall fall migration ofbowhead whales and site-specific study results;
5. Monitor behaviors, swim directions, dive times, surfacing patterns, and tracklines of selected bowheadwhales;
6. Record and map belukha whale distribution and incidental sightings of other marine mammals; and
7. Determine seasonal distribution of endangered whales in other planning areas of interest to MMS.

II. METHODS AND MATERIALS
A. Study Area
The annual survey program is based on a design of random field transects within established geographicblocks in and adjacent to Chukchi and Beaufort Sea sale areas offshore of Alaska. The present study, whichwas focused on the bowhead whale migration from 1 September 1996 to 9 October 1996, included BeaufortSea Survey Blocks 1 through 12 (Fig. 1) between 140oW. and 15rW. longitude south of 72°N. latitude.
A large-scale Beaufort Gyre moves waters clockwise from the Canadian Basin westward in the deeperoffshore regions. Nearshore surface currents tend to follow local wind patterns and bathymetry, moving fromthe east in winter, with an onshore component, and to the west in summer, with an offshore component(Brower et aI., 1988).
In the Beaufort Sea, landfast ice forms during the fall and may eventually extend up to 50 kilometers (km)offshore by the end 01 winter (Norton and Weller, 1984). The pack ice, which includes multiyear iceaveraging 4 meters (m) in thickness, wiltl pressure ridges up to 50 m thick (Norton and Weller, 1984),becomes contiguous with the new and fast ice in latefall-ettectively closing off the migration corridor towestbound bowhead whales. From early November to mid-May" the Beaufort Sea normally remains almosttotally covered by ice considered too thick for whales to penetrate. 'In mid-May, a recurring flaw lead canform just seaward of the stable fast ice" ,fo,lIowedby decreasing ice conosntrasons (laBelle et aI., 1983) andlarge areas of open water in summer.
3
Local weather patterns affect the frequency and effectiveness of all marine aerial surveys, The presentstudy area is in the arctic climate zone, with mean temperatures at the Alaskan Beaufort Sea coastcommunities of Barrow, Lonely, Oliktok, arid Barter Island from -0.9°C to -0.1 °C during September and from-9.rC to -8.5°C during October. Precipitation in these communities occurred an average of 10 to 34percent of the time during September (snow with some rain) and 13 to 43 percent during October (almostall snow), with the heaviest precipitation at Barrow and Barter Island during both months. Fog (withoutprecipitation) reduces visibility approximately 11 to 19 percent of the time during September and 6 to 8percent of the time during October. Mean windspeed in the same communities is from 5 to 6 m per secondduring September and 5 to 7 m per second during October (Brower et aI., 1988).
Sea state is another environmental factor affecting visibility during aerial surveys. Surface waters in theBeaufort Sea are driven primarily by wind. Ocean waves are generally from northerly or easterly directionsduring September and October, during which time the ice pack continues to limit fetch. Because of the packice, significant wave heights are reduced by a factor of 4 from heights that would otherwise be expectedduring the open-water season. Wave heights greater than 0.5 m occurred in 23.9 to 38.9 percent ofobservations during September and 14.1 to 37.4 percent during October, with the greater percentage oflarger waves (>0.5 m) reported for the eastern third of the study area during both months. Wave heightsgreater than 3.5 m are not reported within the study area during September or October (Brower, 1988).
The study area contains sufficient zooplankton to support some feeding by bowhead whales. The availabilityof zooplankton during the fall would be expected to vary between years, geographic locations, and waterdepths in response to ambient oceanographic conditions. In September 1985 and 1986, averagezooplankton biomass in the Alaskan Beaufort Sea east of 144 oW. longitude was highest south of the 50-misobath in subsurface water (LGL Ecological Research Associates, Inc., 1987).
B. Equipment
The survey aircraft was a de Havilland Twin Otter Series 300 (call sign: N302EH). The aircraft wasequipped with medium-size bubble windows aft that afforded complete trackline viewing for a port observerand a starboard data recorder-observer. A third observer-navigator occupied the copilot seat, whichprovided good forward and side viewing. Each observer was issued a hand-held clinometer (Suunto) formeasuring the angle of inclination to the sighting location of endangered whales. Observers and pilots were

Demarcation HerschelPt. Is.
<c( 5l~ z::J\~
I,
coI/)
12
HarrisoBay Colville
Delta Pt.Nuiqsut
oDeadhorse
LEGEND
Alaska
30 0 30 60 Kilometers•••••• (approx.)
72
<0I/)•..
Figure 1. Fall 1996 Study Area Showing Survey Blocks
71
70
69

linked to common communication systems, and commentary could be recorded. The aircraft's maximumtime aloft under normal survey load was extended to approximately 8 hours (hr) through the use of asupplemental onboard fuel tank.
Avionics included a Flight Management System (FMS) by ARNAV Systems, Inc., part of which was a GlobalPositioning System (GPS). The FMS 5000, Model GPS-505, is a worldwide satellite-based system thatprovides continuous position updating (15-m precision) and survey navigation through preprogramming oftransect start and end points. Electronic signals from the GPS were converted into an RS 232 serial stream;and data were polled every second for automatic input of time, latitude, longitude, and flight altitude. TheGPS altitude (27-m precision) that was used exceeded the accuracy of the radar altimeter (32 m at the targetaltitude of 458 m). In the event of a system failure, the team leader could read directly from the aircraftinstrument panel for manual entry of this information into the computer. System components required 115-volt alternating current (AC) power, which was supplied by a direct current-AC invertor connected to theaircraft electrical bus.
A portable AST Premium Exec 386S)(/20 computing system was used aboard the aircraft to store andanalyze flight and observational data. A small, portable Kodak Diconix 150 Plus inkjet printer was used toproduce tractor-fed hard copy and to plot onboard flight maps.
Onboard safety equipment included an impact-triggered emergency locator transmitter (ELT) installed in theaircraft, a portable ELT in a 6-person Switlik Search and Rescue Life Raft, a portable aircraft-bandtransceiver, a portable GPS, cold-water immersion suits, Nomex flight suits, and emergency crash helmets.
Flight-following equipment used during the 1996 field season featured an experimental Radio DeterminationSatellite System (RDSS), developed by Mobile Datacom Corporation (MDC), that tracked the project aircraftover the Alaskan Beaufort Sea. The project tested the use of three toggled patch antennas, two of whichwere mounted externally on the aft section of the fuselage and one which was installed in the nose of theaircraft for greater radial coverage. Data on latitude, longitude, time, and other parameters were obtainedfrom the aircraft's GPS and broadcast every minute through the patch antennas to a satellite that wasstationary over the equator at 8rW. longitude. Real-time satellite signals were relayed to MDC inClarksburg, Maryland, where OAS queried the RDSS every 15 minutes to obtain current flight-followinginformation. The information was displayed as digital data on a computer screen and in the form of a mapfor visual tracking of the survey aircraft. When west of the satellite coverage area, an aircraft-band very-high-frequency radio was used to transmit periodic position data to Barrow Flight Service. During Fall 1996,a 3-way antenna system for tracking the survey aircraft-regardless of its heading-was tested for the firsttime in Alaska. In addition to RDSS flight following, the onboard transponder was set at a discreteidentification code for radar tracking by air-traffic-control personnel.
. C. Aerial-Survey Design
Aerial surveys were based out of Deadhorse, Alaska, from 1 September through 9 October 1996. The fieldschedule was designed to monitor the progress of the Fall 1996 bowhead migration across the AlaskanBeaufort Sea. All bowhead (and belukha) whales observed were recorded, along with incidental sightingsof other marine mammals. Particular emphasis was placed on regional surveys to assess fine-scale shiftsin the migration pathway of bowhead whales in this area and on the coordination of effort and managementof data necessary to support seasonal offshore-drilling and seismic-exploration regulations.
Daily flight patterns were based on sets of unique transect grids produced for each survey block. Transectgrids were derived by diViding each survey block into sections 30 minutes of longitude across. One of theminute marks along the northern edge of each section was selected at random to designate one end of atransect leg. The other endpoint of the transect leg was determined similarly using a separate randomlygenerated number along the southern edge of the same section. A straight line, representing one transectleg, was drawn between the two points. The same procedure was followed for all sections of the surveyblock. Transect legs were then connected alternately at their northernmost or southernmost ends to produceone continuous flight grid within each survey block. The use ofrandom-transect grids is a requirement for
5

----_ .._-------- ------------,
later analyses of median water depths at bowhead sightings based on line-transect theory (Cochran, 1963)and analyses of absolute densities based on strip-transect theory (Estes and Gilbert, 1978).
The selectior» of the survey blocks to be flown on a given day was nonrandom, based primarily on criteriasuch as reported or observed weather conditions over the study area and the level of offshore oil industryactivity in various areas. Weather permitting, the project also uses a semimonthly flight-hour goal for eachsurvey block allocated proportionately for survey blocks east of 154 oW. longitude and semimonthly timeperiods based on relative abundance ~f bowhead whales as determined from earlier fall migrations(1979-1986). Such allocations, detailed in our Project Management Plan (USDOI, MMS, 1996), greatly favorsurvey coverage in inshore Survey Blocks 1 through 7 and 11 (Fig. 1), since bowheads were rarely sightednorth of these blocks in previous surveys. The purpose of these survey-effort allocations was to increasethe sample size (n) of whale sightings within the primary migration corridor, thus increasing the power ofstatistical analysis within these inshore blocks.
Random-transect legs were used for obtaining data to analyze the migration axis, using a line-transectmodel, and to estimate whale density, using a strip-transect model. Nonrandom surveys were flown tofurther identify whales and their behaviors when sighted adjacent to a transect line or when in transit to atransect block.
D. Survey-Flight Procedures
During a typical flight, a "search" leg was flown to the target survey block, beginning a series ofrandom-transect legs (above) joined together by "connect" legs, followed by a search leg back to Deadhorse.Surveys generally were flown at a target altitude of 458 m. This altitude was maintained-when weather.permitted-in order to maximize visibility and minimize potential disturbance to marine mammals. Flightswere normally aborted when cloud ceilings were consistently less than 305 m or sea states were consistentlyabove Beaufort 4.
Port observers included a Primary Observer, whose field of vision through a bubble window included thetrackline directly below the aircraft to the horizon, the Pilot, and an occasional secondary observer-visitor,stationed aft at a flat window. Starboard observers included a Data Recorder-Observer; whose field ofvision through a bubble window was particularly focused on guarding the trackline, as well as a TeamLeader and a second Pilot, who were alternately stationed at an aft bubble window and the copilot's seat.
A clinometer was used to measure the angle of inclination to each sighting of endangered whales when theinitial sighting location was abeam of the aircraft.
When bowheads were encountered while surveying a transect line, the aircraft sometimes diverted fromtransect for brief (eto-rnlnute) periods and circled the whales to observe behavior, obtain better estimatesof their numbers, and determine whether calves were present. Any new sightings of whales made whilecircling were not counted as "on transect."
E. Data Entry
A computer program developed by project personnel was used to record all data. Time of day wasmaintained by the computer and recorded at each entry. Greenwich Mean Time, local time, latitude,longitude, and altitude as well as a question list and the main menu selections were shown continuously onthe computer monitor. The program is menu-driven, facilitating entry of a complete data sequence forsightings of endangered whales. An abbreviated data-entry format was available whenever several whalepods (theuseot the term pod includes sightings of any single animal or group of nearby animals whoseresplratlon patterns appear to be synchronous) were sighted within a short period of time. To avoid lumpingof sightings in areas where whales were extremely concentrated, an even shorter rapid-sighting update wasused. A position-update format inclUding data on weather, visibility, ice cover, and sea state was enteredat turning points •.when changes in environmental conditions were observed, and otherwise within 10-minuteintervals. All entries were coded to reflect the type of survey being conducted. Table 1 shows the data-entry
6

Table 1Data-Entry Sequence on the Portable Flight Computer
Polar BearlLarge Belukha
Position Whale Whale OtherSequence Update Sightings Sightings Species
1. Entry number X X X X2. Time X X X X3. Latitude X X X X4. Longitude X X X X5. Altitude X X X X6. Reason for entry X X X X7. Search type X X X X8. Species X X X9. Sighting cue X10. Habitat X X X11. Behavior X X X12. Size X13. Total number X X X14. Calf number X X X15. Clinometer angle X16. Side of plane X17. Swim direction X X18. Swim speed X19. Aircraft response X X X20. Repeat sighting X21. Observer X X22. Weather X X X X23. Visibility right X X X X24. Visibility left X X X X25. Ice coverage X X X X26. Ice type X X X X27. Sea state X X X X28. Water color X X X X
7

9
sequence used in 1996 and the questions used to prompt entry of observational data. All data entered weresimultaneously printed out in hard copy:' " "
The behavior, swim speed; and swim direction for observed whales represent what the pod as a whole wasdoing at the time it was first sighted. Behaviors were entered into one of 14 categories as noted on previous,surveys. These categories-breaching, cow-calf association, diving, feeding, flipper-slapping, log playing, 'mating, milling, resting, rolling, spy-hopping, swimming, tail-slapping, and underwater blowing-are definedin Table 2. Swimming speed was subjectively estimated by observing the time it took a whale to swim onebody length. An observed swimming rate of one body length per minute corresponded to an estimatedspeed of 1 km/hr; one body length per 30 seconds was estimated at 2 km/hr, and so on. Swimming speedand whale size were recorded by relative category (i.e., still, 0 km/hr; slow, 0-2 km/hr; medium, 2-4 km/hr;or fast, >4 km/hr; and calf [length less than half of accompanying adult], immature, adult, or large adult,respectively) rather than on an absolute scale. Swim direction was recorded in the field as a magnetic value,using the aircraft's compass.
Sea state was recorded according to the Beaufort scale outline in Piloting, Seamanship, and Small BoatHandling (Chapman, 1971). Ice type was identified using terminology presented in Naval HydrographicOffice Publication Number 609 (USDOD, Navy, 1956). Average ice cover within a few kilometers of theaircraft was estimated as a single percentage, regardless of ice type.
F. General Data Analyses
Preliminary data analysis was performed by a computer program-developed by project personnel-thatprovided daily summations of marine mammals observed, plus calculation of time and distance on transectlegs, connect legs, and general search portions of the flight. The analysis program provided options forediting the data file, calculating summary values, and printing various flight synopses.
Application software (Grapher, Golden Software, Inc.) was used to plot daily maps of aircraft tracklines andpositions of marine mammals observed. To function as a mapping package, coastlines were mapped usingan Altec digitizer; and all points on the maps were based on number of meters north or to one side of acentral meridian for Universal Transverse Mercator (UTM) Zone 6.
Tables showing the number of survey hours flown for individual days, half-months, or months were subjectto decimal-rounding errors and mayor may not add up to the grand total shown for the entire field season.For greatest accuracy and consistency, the total survey hours shown in tables was calculated separatelyfrom the cumulative total minutes flown over the entire field season.
An index of relative abundance was derived as whales per unit effort (WPUE = number of whales counted/hrof survey effort) per survey block for bowheads and belukhas. The timing of the 1996 bowhead migrationthrough the study area was analyzed as sightings per unit effort (SPUE = number of sightings counted/hrof survey effort) and WPUE per date. Because chance sightings of a few large groups of whales in a shortperiod of time might produce artificially high WPUE values in certain blocks, values based on at least 4.00hr of survey effort were distinguished when discussing relative abundance between areas.
Habitat preference was depicted as percentage of whales per ice class and percentage of whales per depthregime. Directionality of whale group headings was analyzed using Rayleigh's test (Batschelet, 1972) forall pods, excluding those that were resting, feeding, or milling. Directionality was analyzed as a True (T)heading, assuming a compass correction of -31 ° for the study area as a whole. Probabilities wereinterpolated from alpha values shown for calculated critical values of Rayleigh's z (Zar, 1984: Table B.32).Additional statistical comparisons, correlations, and regressions (Zar, 1984) were performed as appropriate.
The water depth at each bowhead sighting in the 1982-1996 database was derived using a computerprogram-DEPTH-that assigned a metric depth value averaged over gridded areas (each 3 minutes oflatitude by 10 minutes of longitude) in the Beaufort Sea west of 139°W. longitude and south of 72°N.

Table 2Operational Definitions of Observed Whale Behaviors
Behavior Definition
Breaching
Cow-Calf
Diving
Feeding
Flipper-Slapping
Log Playing
Mating
Milling
Resting
Rolling
Spy-Hopping
Swimming
Tail-Slapping
UnderwaterBlowing
Whale(s) launching upwards such that half to nearly all of the body is above the surfacebefore falling back into the water, usually on its side, creating an obvious splash.
Calf nursing; calf swimming within 20 m of an adult.
Whale(s) changing swim direction or body orientation relative to the water surface,resulting in submergence; mayor may not be accompanied by lifting the tail out of thewater.
Whale(s) diving repeatedly in a fixed general area, sometimes with mud streaming fromthe mouth and/or defecation observed upon surfacing. Feeding behavior is furtherdefined as synchronous diving and surfacing or echelon-formations at the surface withswaths of clearer water behind the whale(s), or as surface swimming with mouth agape.
Whale(s) floating on side, striking the water surface with pectoral flipper one or manytimes; usually seen within groups or when the slapping whale is touching another whale.
Whale(s) milling or thrashing about in association with a floating log.
Ventral-ventral orienting of two whales, often with one or more other whales present tostabilize the mating pair. Mating is often seen within a group of milling whales. Pairsmay appear to hold each other with their pectoral flippers and may entwine their tails.
Whale(s) swimming slowly at the surface in close proximity (within 100 m) to otherwhales, often with varying headings.
Whale(s) floating at the surface with head, or head and back exposed, showing nomovement; more commonly observed in heavy-ice conditions than in open water.
Whale(s) rotating on longitudinal axis, sometimes associated with mating.
Whale(s) extending head vertically out of the water such that up to one-third of thebody, including the eye, is above the surface.
Whale(s) proceeding forward through the water propelled by tail pushes.
Whale(s) floating horizontally or head-downward in the water, waving tail back andforth above the water and striking the water surface; usually seen in group situations.
Whale(s) exhaling while SUbmerged, thus creating a visible bubble.
10

latitude. Values assigned to each grid block were initially subjective and were averaged from depths readfrom NOAA Provisional Chart 16004.
Raw density estimates were calculated using a computer program-DENSITY-and are presented only forrelative comparison with similar values from previous survey reports. The program was based onstrip-transect-analyses methods using only sightings made while on random transect within 1 km of thetrackline. Density estimates were derived by survey block and are presented, with a description ofdensity-estimate methodologies, in Appendix A.
All maps in this report were prepared with application software (ArcView 3.0) based on UTM Zone 6 (centralmeridian = 14rW. longitude, reference latitude 0.00000, false easting 500000.00000, false northing0.00000, spheroid = GRS 80, scale factor = 0.99960).
11
Selected isobaths (60 m, 100 m, 500 m, 1,000 m, 2,000 m, 2,500 m, 3,000 m, and 3,500 m) were includedin Figure 2 for visual reference only and were not used in data analyses. A point file of ETOP05 5-minutegridded elevation data (USDOC, NOAA, National Geophysical Data Center, 1988) was downloaded fromthe National Geophysical Data Center Internet web site (http://www.ngdc.noaa.gov/mgg/global/etop05.html).ArcView Spatial Analyst was used with these data to generate isobaths.
Sea-ice concentrations were derived from the Beaufort Sea Ice Analysis provided by the National Ice Centerin Suitland, Maryland. The Beaufort Sea Ice Analysis shows average ice concentrations over the prior 2-to 3-day period based on visual, infrared, and synthetic-aperture-radar satellite imagery combined withreconnaissance, ship, and shore observations, including sea-ice observations made by the project.Polygons of ice concentrations in the Beaufort Sea for the period 23 August through 11 October weredownloaded from the National Ice Center Internet web site for the western Arctic (http://www.natice.noaa.gov) and imported into ArcView. Total sea-ice concentrations were edited from these polygons andspecially coded to distinguish O-percent, 1- to 19-percent, 20- to 39-percent, 40- to 59-percent, 60- to 79-percent, 80- to 94-percent, or 95- to 100-percent ice cover.
Survey effort and observed bowhead distribution were plotted semimonthly over the Beaufort Sea studyarea. Overall fall sightings of belukha whales, as well as incidental sightings of other marine mammals,were depicted on separate maps. Both effort and marine mammal sightings were included on daily flightmaps.
Overall, whale sightings were shown on distribution maps and entered into relative-abundance analyses,regardless of the type of survey leg (transect, search, or connect) being conducted or the prevailingenvironmental conditions (sea state, ice cover, etc.) when the sightings were made. As with previous reportsin this series (Treacy, 1988, 1989, 1990, 1991, 1992, 1993, 1994, 1995, 1996), repeat sightings or sightingsof dead marine mammals were not included in summary analyses or maps. Where tables and figuresexclude certain data, such exclusions are indicated in the captions.
G. Median and Mean Water Depth at Bowhead Sightings (Analysis Protocol)
An analysis protocol specifying the use of median water depth to detect interannual shifts in the bowheadmigration route was initially described in Chapters 4.2.3 and 5.3.3 of "Beaufort Sea Monitoring ProgramWorkshop Synthesis and Sampling Design Recommendations" (Houghton, Segar, and Zeh, 1984). Thepresent water-depth analyses provide biological information needed to test the following null hypothesesrecommended by the workshop:
HOI: The axis of the fall migration of bowhead whales will not be altered during periods of increasedOCS activities in the Alaskan Beaufort Sea.
H02: Changes in bowhead migration patterns are not related to OCS oil and gas development activity.

...•.N
73
72
71
HarrisoBay Colville
Delta Pt.Nuiqsut 70
Alaska
LEGEND
30 0 30 60 Kilometers1"""""1 (approx.)
oII)~
I~
HerschelIs.
~5i 69
I~\0I
\
~~
~
Bathymetryin Meters
Figure 2. Regions I, II, and III (used in medium-water-depth analyses) and Selected Isobaths

13
To define the migration axis, a separate file was created for bowhead whale sightings made while onrandom transects, regardless of distance from the transect line. The Beaufort Sea was divided into threeregions in order to analyze east-west components of the known fall-migration corridor. Region I wasdelimited by 1500W. and 153°30'W. longitudes, south of 72°N. latitude. Region II was between 146°W.and 1500W. longitudes, south of 71 °20'N. latitude. Region III was between 141 oW. and 146°W. longitudes,south of 71 °1O'N. latitude (Fig. 2). Because of the bathymetry of the Alaskan Beaufort Sea, a seawarddisplacement of the fall-migration route would be represented, via this analysis, as a shift to deeper waterand a greater median depth.
A computer program-NEWST AT-was used to analyze the file and describe central tendencies of waterdepths at bowhead whale sightings. The program was used to calculate median depth, mean depth,Standard Deviation (SO) about the mean, and overall depth range for Regions I, II, and III. NEWSTAT alsowas used to rank median depths from lowest to highest values. Upper and lower confidence limits forpopulation medians were calculated by hand (Zar, 1984: Table B.26). If sample sizes were large (n ~ 25),a large-sample approximation (Zar, 1984: Page 113) was used to calculate the upper and lower limits.
Confidence Intervals (CI) were calculated at the 1-percent level to reduce the probability of incorrectlypostulating a change in migration route when no change from other years had occurred. For example, theprobability of incorrectly determining that a change had occurred is approximately 23 percent if tested at the5-percent level, but only about 5 percent if tested at the 1-percent level (Houghton, Segar, and Zeh, 1984).
The NEWST AT program employed the Mann-Whitney U test to address the question of potential fine-scaleshifts in the axis of the bowhead whale fall-migration route. The Mann-Whitney U test is a nonparametricprocedure performed on ranked samples (Zar, 1984). The Normal Approximation to the Mann-Whitney Test(Zar, 1984: Page 142) was used to hand-calculate the value of Z for larger sample sizes. A series ofMann-Whitney paired comparisons were made on annual depth values, with each year compared to allothers such that annual and/or interannual shifts in migration route from 1982 to 1996 could be evaluated.Similar paired comparisons were made by region (I, II, and III) such that annual variations or potential shiftsin median depth could be assessed for these smaller areas. Probabilities were interpolated from alphavalues shown for calculated critical values of the Mann-Whitney U distribution (Zar, 1984: Table B.10).Application software (Systat 5.0) was used for graphing between-year median depths.
The NEWSTAT program compared mean water depths at bowhead sightings between years employing ananalysis of variance (AN OVA) and the Tukey test (Zar, 1984). Probabilities were estimated as alpha valuesshown for calculated critical values of the F and q distributions (Zar, 1984: Tables B.4 and B.5).

III. RESULTS
A. Environmental Conditions
General ice coverage in the Alaskan Beaufort Sea (Figs. 3-10) was light during the Fall 1996 surveys.During the last week of August (Figs. 3 and 4), the very heavy sea ice (>79%) was generally confined to theeastern third of the study area, with lighter ice concentrations «40%) inshore and open water west ofBarrow. By early September (Figs. 5 and 6), when surveys began, the very heavy sea ice (>79%) hadreceded to the northeast corner of the study area, with a broad area of very light ice « 20%) throughout thewestern half of the study area. By 20 September, very heavy sea ice (>79%) occupied the eastern half ofthe study area with some moderate (40-59%) or heavy (60-79%) sea ice near shore and increasingconcentrations of sea ice west of Deadhorse (Figs. 7 and 8). By 4 October (Fig. 9), near-solid sea ice (95-100%) covered the eastern half of the study area. By 11 October (Fig. 10), the entire study area was lockedin near-solid sea ice, except for asmall area of moderate (40-59%) sea ice just north of Barrow. Ice percentat each sighting of endangered whales is shown in Appendix B (Table B-1).
Other environmental conditions during Fall 1996 were considered good for observing whales at or near thesurface, permitting 34 flights during that time period. Sea states sometimes reduced the ability of observersto spot whales near the surface or at great distances from the transect centerline. Sea states at eachsighting of endangered whales are shown in Appendix B (Table B-1). Cloud ceilings over portions of thestudy area were often lower than the target-survey altitude of 458 m, most notably during the first week inSeptember.
15
B. Survey Effort
Daily totals of kilometers and hours flown per survey flight are shown in Table 3. A total of 26,008 km ofsurveys were flown in 123.00 hours (Table 3) in the study area at an average speed of 211.45 km/hr. Theaverage survey flight was 764.94 km, with flights ranging from 0 km to 1,514 km of over-water survey. Meansurvey time per flight was 3.62 hr (SD = 1.83, n = 34). A total of 13,056 km of random-transect lines wereflown in 59.53 hours (Table 3) at an average speed of 219.32 km/hr. These random transects constituted50.2 percent of the total kilometers flown and 48.40 percent of the total flight hours. The number of flighthours over each survey block is shown in subsequent analyses.
Day-to-day flight tracks are shown in Appendix B. Survey-flight lines are summarized by serntrncnthly periodin Figures 11 through 13.
During the first half of September, survey coverage ranged from 140oW. to 1'SrW.lbrrgiitlude'S, ~itIn· rmQs:ttof the effort within 50 nautical miles (nm) of shore (Fig. 11). There were 19.23 hours of random transectsflown from a total of 42.63 flight hours during this period (Table 3), constituting 32.3 percent and 34.7percent, respectively, of the total time spent in those effort categories.
During the second half of September, survey coverage ranged from 141 oW. to 156 oW. longitudes, mostlywithin 75 nm of shore (Fig. 12). There were 25.10 hours of random transects flown from 49.38 total flighthours during this period (Table 3), constituting 42.2 percent and 40.1 percent, respectively, of the total timespent in those effort categories.
From 1 through 9 October, survey coverage ranged from 143°W. to 15rW. longitudes, mostly within 75nm of shore (Fig. 13). There were 15.20 hours of random transects flown from 30.98 total flight hours duringthis period (Table 3), constituting 25.5 percent and 25.2 percent, respectively, of the total time spent in thoseeffort categories.
C. Bowhead Whale (Balaena mysticetus) .Observatlcns
1. Distribution: Sixty-nine sightings were made for a total of 114 bowhead whales observed duringFall-1996 surveys in the study area (Table 4 and Figs. 14-17), not counting repeat sightings. Relatively even

....•.m
Nto,....
72
71
II 0%
g1.19%
~ 20·39%
EQ) 40·59%30 0
1::::::160.79%
080-94%
D 95·100%
HarrisoBay Colville
Delta PlNuiqsut
aDeadhorse
FlaxmanIs.
..... ,~:~ 70
30 Kilometers(approx.)
DemarcationPt.
HerschelIs.
«~
I~\0,\
69
KEY
Alaska
Nto,....
oto,....
Figure 3. Map of Ice Concentrations in the Beaufort Sea, 23 August 1996
1.- ..._..

f'- .'00LO
....•.....•
.............................. . . . . . . . . . . . . . . . . . . . . . . . . . . . . . . .. . . . . . . . . . . . . . . . . .. . .. . . . . . . . . . .. . . . . . . . . . . . . . . . . .•• • • • • • • • • • •• • • •• • • • • • • • • •• • • • • • 1................................. . . . . . . . . . . . . . . . . . . . . . . . . . .. .. . - .
'" O:-:'.~
72
'71
11I0% LJ 60-79%
EJ 60-94%
[=J 95-100%
····························c·········......... "::::<»»»:::::::.: "\1:'<::::::~~&.~ .. . . . . . .. . . . . . . . . . . . . ... . ..... . . . . .. . ,.............. ' .. .. . . -: -: -: -: -: -: -: : : : : : : : :." ...•.• i .
a . . '".Deadhorse
70KEY
.m1-19%
691 ~ 20-39%'
~ 40-59%
30 0 30 KilometersLJ ~ ~_(ap::!.. 1
oo~---+ __';2 <0 ---+-..-.+LO.•....
Alaska 69
INLO.•.... o
LO.•....00·'<t.•....
N'<t.•....
o'<t..•....
Figure 4. Map of Ice Concentrations in the Beaufort Sea, 30 August 1996

...•.00
eoIf)~
'" 0If) 0 eo so '<t N '<t~ If) '<t '<t '<t '<t ~~ e-- ~ ~ ~ 73
71
»: . ..:::::<:?:~~\:: : : : : . : : : : :.:: : : : : ::'~>:~.'72. . . . .. . . . . .. . : .................... . " .- .' , .
. :.:.:.:.:.:.:.:.' '.. ' ' '.......... -J: ..:<'±«>~' ••..'.'•.
1::::::160-79%
.080-94%
D 95-100%
Cape///Halkett
HarrisoBay Colville
Delta Pt.Nuiqsut
FlaxmanIs.
Smith Bay
;------------------ ---.-KEY
Alaska 69
~-- .._.+..:......_-+----+----_.+--_ ...,--+--+_._+--+--+--If) N~ If)~ o
If)-e--
Figure 5. Map of Ice Concentrations in the Beaufort Sea, 6 September 1996

:::::::::::::\ \' ..... ... " ..... -:::-::::- >:'---~ ............ . . . . .. . . . ' ' .. . . . . .. . . . . .
••••• 0° •••••
lD +III.•... '<tIII N 0.•... III III ex> .lD.•... .•... '<t '<t.•... .•...
NIII.•...
Cape~Halkett
HarrisoBay Colville
Delta Pt.NuiqsutKEY
Alaska
II 0%
!m1-19%
~ 20·39%
E2!40-59%
30~~0 1IIIIIIIIII!~30_Kilometers1"'"""'1 (approx.)
I:::::: 160-79%
080-94%
095-100%
:.,
. . .. . . ........ 72. . . . . .. . . . . . . ' ... . . . . . ........, : .".' . ", ".' .•• • • 0'0 •••
• • 0· •••••" .. .. . . . . . ." "",' ..... .... . . . . . . • ••••• 0: ',." •••
• • • • • • • • •• • • • • • '0' '~, • • .- • •...........· .. '" .... ".......... '" .• •••••• 0' •• ,'. ,.", •• ' •••• "•••
FlaxmanIs.
HerschelIs.
c(.
4- ~ 69c4I~':) 10I,
0• N .... '<t
~ '<t.•...
.•... .•...
Figure 6. Map of Ice Concentrations in the Beaufort Sea, 13 September 1996

f8•..N a N ~10
10ClO co ~ ~ •..•.. •.. ~ .. ~ •..•.. •.. e-
. I· :+
..................... ~.~.~~~~rz
71
70
HerschelIs.
4(
~.
\~---~ .. ' ,0 J-
~ r ~- -+--~-- +. -',+-.+ +__+ + + +.__.+_..__.+- +--.-+ -_._...t--._~--10 N ~'f'"" IJ") ._~
1::::::]60,79%080•94%
CJ 95.100%.
30 Kilometers(approx)
Alaska
a10~
Figure 7. Map of Ice Concentrations in the Beaufort Sea, 20 September 1996

I\J....•.
ex>io.•..o'<te--
'f"
. . . . . . . . ~ . . . . " - ., . . . . . . . . .. . . . . . .. ... '.- ."'.' ~ . . . . . . . . . .
72...................... . . . . . . . . . . . . . . . . ;' .' . ~. .-' ...... . ' ' . ",. '.' ., \' ' ' .
71
70Bay
KEYII 0%m1-19%
E§S§ -20-39%
EQj40-59%- 30 0 30 Kilometers
~2S (approx.)
[::::::160-79%
080-94%
D95-100%
FlaxmanIs.
»->Demarcation
Pt.
Alaska 69
---+--:--------------------------------+-- ---Lex> -- -.------+__lO -+--_+.•.. ~ -----+-------+------+--~--+---
.••. '<t N
~ lO.•.. oio
---+-------+--+ + + -+------r-0
ex> (l) '<t N ;!'<t '<t '<t
'<t .•...•.. -e- -e--
Figure 8. Map of Ice Concentrations in the Beaufort Sea, 27 September 1996

71~
NN
HarrisoBay Colville
Delta Pt.NuiqsutKEY
_ 0% . r:::::] 60-79%
080-94%
D 95-100%
g1-19%
..,E§3§ 20-39%
.~ 40-59%30 0 30 Kilometersc::;;.-:::2!S
--DemarcationPt.
HerschelIs.
0(
< ~~ z::l\~
I .,Alaska
Figure 9. Map of Ice Concentrations in the Beaufort Sea, 4 October 1996
73
71
70
69

73
L:
Smith Bay
HarrisoBay Colville
Delta Pt..Nuiqsut
Alaska
+oI!l-e-
Figure 10. Map of Ice Concentrations in the Beaufort Sea, 11 October 1996
71
70
69

Beaufort Sea
- -...,----r-----~---~~-- .\I I II I I I
I I ..--r--r--tr- - ,...r - - - --:\
I I I
~~l1\#l IT11I~~~~ ---'-~1I\\
HarrisoBay Colville
Delta P . ~ _
NuiqsutLEGEND
Alaska
30 0 30 60 Kilometers!'""SMi ! (approx.)
»->:
DemarcationPt.
HerschelIs.
et~ ~~I~:J\O
I
\
._---------------
<X)---+--~II) (0 +------+ _+_ + ----+. . -+. +------+
~ '=t --~ -----+-----+---+-------+----+---.II) N 0
~ ~ ~ -~ ~ ~ ~
Figure 11. Combined Flight Tracks, 1-15 September 1996
72
71
70
69

'>...
Beaufort Sea'".,
. ----,- - - - -.-~.- --\-- ... :\
Ni0'1
LEGEND FlaxmanIs.
Demarcation. .Pt. ~- ~".., Herschel
Is.~ .,;.
~ ~~ z:J\~I
\
Alaska~ ,1'- ~ j. ~, ' •
Figure 12. Combined Flight Tracks, 16·30 September 1996
72
70
69

<t" N ~
-+-__~ -+--__. ~-_. ~ ' ! ~ ! '~ ...J..-----T" 73+ -+--+-----+--+-+--+ --+------1f-~+------+---+----
Beaufort Sea72
.Smith' Bay
-- -- ....,-.,..------ •....----\-- , \I I. I \I I .\ \
I ~----\I \
'- , 't-
__ l-- --- \
. I \\\
Harriso"-~ - ro&~~~~ ~~J.t-t-rBay Colville
Delta .Pt, ,_-Nuiqsut
LEGEND FlaxmanIs.30 0
M30 »->
DemarcationPt.
HerschelIs.
..(
c( ~~ z='\~
I,AlaskaL- _
<t"III- •...
.1 I 1
~NIII•...
Figure 13. Combined Flight Tracks, 1-9 October 1996
72
71
69

Nio oll)
'."
..~. ."
71
LEGEND
• BowheadWhale
30 0 30 Kilometers1"""""1 (approx.)
Demarcation, . Pt..·,.,.
\ HerschelIs.
.". '. c( .:« 5i~\~, -.,~
\ '
69Alaska
. ',~.
oll) ~....- '-",
Figure 14. Map of.Bowhead Whale Sightings, 1-15 September 1996
I----I-~~- --~~~--.-------...,-----\ . \I I I I -I I I I , \
I- - ~I __ - _ . I -, ,I .r----.-" _ -• '. ..--. -----1--\'- t.I~ .....~ - L - 1 - I , ' ,
I ••• ...:.......I _ \I· - l-1' __\
1.1------ __ +---,~I. \
o 'Lr-----;:~I~ .\. " • \Deadhorse •
\
; HerschelIs.
e(
i 69
\~,,--+- .._---+---+- .._--+-----+----+_ .._--+----- -+--r- ---+_ ..-+--+--+-+~--+-
:Jj N I . - ~•.. ~ g ~ ~ ~ ~
S~ith Bay
LEGEND
• BowheadWh~le'
30 0 30 Kilometers•••••• (approx.)
Beaufort Sea
---. Harrison
Bay ColvilleDelta
Alaska'----------------'
Figure 15. Map of Bowhead Whale Sightings, 16-30 September 1996
.J _
72
11
70

0~ ~ .~ N
ll'l "'"- •.. .-' .••. -+--+ 1- -to - 1- -l- I
Beaufort Sea
.. '-' ,-,--- -,- --. -- --I - - - - -r- - - - - - --r-7 - - -I-'~ """ '\, , I 1 \ ' \
, I I;, \ \~ !.. II- , ' I ',\' . \, • r-------,-....;,.-,' _ - - - - rl- -"',-"--"\
'.Jr- 1 L - 1 ,"'J " \,' , \ ,- - 1 \ \
I l-1 _-J-, ,----t--- \o ' -~ 1 'I ' \
Deadhorse \
Sinitli Bay
, ,._---_._ .._----_.---~--;---- ,
72
71
70
LEGEND
• Bowhead Whale
Alaska
Figure 16. Map of Bowhead Whale Sightings, 2-9 October 1996

Co)o
Alaska
73~ 0~ It)
--+--+--+-+----t-i -+-~---4--....__+__ .~----"-J.---+----".........-173
Beaufort Sea
.,r-- r -- -/.~..: ---T-----T----\---- \arr 1 " • J.!!...... _ _ I. I I \
J. ., -r------, \ --- \, ..,..-/._ 1-----\- l1 •• 1 .•. I\,\I· •- l \, ---. I.~ L - - 1
-".,.ftlliW5..// '~ -.' ,.,. -, - - - -I. - -, ,Oliktok' ..., I • iii. \Pl 0 l> • -- I •••
Nuiqsut Deadhorse • \. \Flaxman
Is.LEGEND
72
71
70
• Bowhead Whale .CamdenBay
30 o DemarcationPt.,·
HerschelIs.
Ill(
4. ~~I~:;)\0,
\
Figure 17. Map of Bowhead Whale Sightings, Fall 1996
69

Table 3Aerial-Survey Effort in the Beaufort Sea, 1-September-9 October 1996, by Survey Flight
TotalFlight Transect Connect Search Tptal Transect Survey
Day No. (km) (km) (km) (km) Time (hr) Time (hr)
2 Sep 1 476 166 237 879 , 2.15 4.775 Sep 2 674 106 350 1,130 3:08: 5.47
-;)' ':6 Sep 3 0 0 0 0 ' 0.00; 0.007 Sep 4 144 25 119 288 ' 0.65 1.408 Sep 5 62 0 344 406 ; 0.27 2·~O9 Sep 6 598 121 482 1,201 ' 2.75 5.62
10 Sep 7 726 156 483 1,365 ' 3.12' 6.2211 Sep 8 437 145 315 897 1.97, 4.1812 Sep 9 567 82 453 1,102 2.55 5·1213 Sep 10 444 83 603 1,130 2.07 5.1214 Sep 11 0 0 147 147 0.00, 0.7015 Sep 12 136 9 '242 ' 387 0.63' 1.8516 sep 13 214 25 640 879 1.05 4.3818 Sep 14 0 0 234 234 0.00 0.9219 Sep 15 435 149 335 919 . 2.05 4.5520 Sep 16 141 35 264 440 0.63_ 2.2320 Sep 17 355 67 82 504 1;'65' 2.3322 Sep 18 759 257 150 1,166 3.47 5.2823Sep 19 0 0 286 286 0.00' 1.42'24 Sep 20 366 150 253 769 1.68 3.52 "26 Sep 21 882 129 503 1,514 3.88 7.1227 Sep 22 277 40 149 466 1.27 2.~227 Sep 23 666 48 122 836 2.9(f 3.7528 Sep 24 476 46 346 868 2.23 4.2729 Sep 25 719 104 258 1,081 3,.35 5.1030Sep 26 220 41 204 465 0.93 2.20
1 Oct 27 768 91 321 1,180 ' 3.52 5.532 Oct 28 317 36 749 1,102 1.58 5.484 Oct 29 433 60 106 599 1.98 2.825 Oct 30 479 59 363 901 2.17 4.136 Oct 31 720 108 344 1,172 3.27 5.377 Oct 32 200 20 90 310 0.93 1.477 Oct 33 36 0 295 331 0.17 1.739 Oct 34 329 66 659 1,054 1.58 4.45
Total Semimonthly Effort
1-15Sep 4,264 893 3,775 8,932 19.23 42.6316-30 Sep 5,510 1,091 3,826 10;427 25.10 49.38
1-9 Oct 3,282 440 2,927 6,649 15.20 30.98
TOTAL " 13,056 2,424 10,528 26,008 '59.53 123.00
31

Table 4Summary of Marine Mammal Sightings, 1 September-9 October t996,by Survey Flight
(humber of sightingsinumber of animals) .
Flight Bowhead Gray Belukha Unidentified Bearded Ringed Pacific Unidentified Polar PB TracksDay No. Whale Whale Whale Cetacean Seal' Seal Walrus Pinniped Bear (PB) (no bear)
2Sep 1 10/12 0 0 0 0 0 0 0 0 05Sep 2 1/1 0 2/11 0 0 0 0 0 0 06 Sep 3 0 0 ..0 0 0 0 0 0 0 07Sep 4 0 0 0 0 0 0 0 0 0 O'8 Sep 5 2/6 O' 2/6 0 0 0 0 0 0 09Sep 6 2/2 0 2/9 0 0 0 0 0 0 0
10 Sep 7 4/5 0 6/23 0 0 1/3 0 0 1/1 111 Sep 8 1/1 0 0 1/1 0 2/2 0 0 0 012 Sep 9 7/11 0 4/132 1/1 1/1 3/26 0 0 0 0
(,) 13 Sep 10 1/2 0 4/20 0 0 1/50 0 0 0, 0I\) 14 Sep 11 0 0 0 0 0 0 0 0 0 0
15 Sep 12 0 0 0 0 0 0 0 0 0 016 Sep 13 5/5 0 0 0 0 1/25 0 0 0 018 Sep 14 0 0 0 0 0 0 0 0 0 019 Sep 15 4/10 0 2/24 1/1 0 1/1 0 0 0 320Sep 16 5/7 0 0 0 0 1/5 0 0 0 320Sep 17 2/2 0 0 0 0 1/2 0 0 0 622Sep 18 0 0 22/100 0 0 0 0 0 0 623Sep 19 0 0 0 0 0 0 0 0 0 124Sep 20 0 0 0 1/1 0 0 0 0 0 226Sep 21 12/34 0 16/74 0 0 1/4 0 0 0 527 Sep 22 5/7 0 5/91 0 0 0 0 0 0 027 Sep 23 2/2 0 6/19 0 0 2/2 0 0 0 828 Sep 24 0 0 0 0 1/1 4/6 0 0 0 629Sep 25 0 0 1/4 0 0 1/1 0 0 0 630Sep 26 1/1 0 0 0 0 0 0 0 0 4
1 Oct '27 0 0 6/20 1/2 0 3/4 0 0 0 7z oe 28. 1/2 0 2/5 0 0 1/2 0 0 1/3 74 Oct 29 0 0 0 0 0 1/2 0 0 0 5

Table 4Summary of Marine Mammal Sightings, 1 September-9 October 1996, by Survey Flight
(number of sightings/number of animals)(Continued)

survey coverage between 1400W. and 15rW. longitudes (Figs. 11-13), resulted in relatively evendistribution of bowhead whales across the study area, within 45 nm north of the shoreline (Fig. 17). Threeof the 114 whales were identified as calves (Appendix B: Table B-1), resulting in a seasonal-calf ratio(number calves/total whales) of 0.026. Daily sightings are shown on individual maps in Appendix B. A semi-monthly analysis follows.
During the first half of September, 28 sightings were made for a total of 40 bowheads (Table 4), withsightings from 141 °27.9W. to 156°30.1 W. longitudes (Appendix B: Table B-1), based on survey coveragebetween 1400W. and 15rW. longitudes (Fig. 11). The first bowheads in the Alaskan Beaufort Sea were
. sighted on 2 September at 70025.5'N. latitude, 146°47.3W. longitude (Appendix B: Table B-1). Whale podswere concentrated either east of Deadhorse or west of Cape Halkett, within 30 nm north of the shoreline(Fig. 14). Pod sizes ranged from 1 to 4 whales (Appendix B: Table B-1), with a mean of 1.43 (SD = 0)34,n = 28). One bowhead whale calf was observed during this period (Appendix B: Table B-1).
During the second half of September, 36 sightings were made for a total of 68 bowheads (Table 4), withsightings from 141 °15.0W. to 155°44.1 W. longitudes (Appendix B: Table B~1), based.on survey coveragebetween 141 oW. and 156°W. longitudes (Fig. 12). Whale pods were distributed fairly evenly east to westacross the study area, within 45 nm north of the shoreline (Fig. 15). Pod sizes ranged from 1 to 7 whales(Appendix B: Table B-1), with a mean 011.89 (SD = 1.69, n = 36). Two 'bowhead whale calves wereobserved during this period (Appendix B: Table B-1).
From 1 through 9 October, 5 sightings were made for a total of 6 bowheads (Table 4), with sightings from150007.4'W. to 153°44.1'W. longitudes (Appendix B: Table B-1), based on survey coverage between143°W. and 15rw. longitudes (Fig. 13). Whale pods were located in a narrow band between Oliktok Pointand Smith Bay, approximately 25 to 45 nm north of the shoreline (Fig.16). Pod sizes ranged from 1 to 2whales (Appendix B: Table B-1), with a mean of 1.20 (SD = 0.45, n = 5). The last bowhead in the AlaskanBeaufort Sea was sighted on 5 October at 71 °20.2'N. latitude, 152°50.6'W. longitude (Appendix B: TableB-1). No bowhead whale calves were observed during this period (Appendix B: Table B-1).
2. Migration Timing: The day-to-day timing of the bowhead whale migration wascatculated overthe entire study area (Table 5 and Fig. 18) as a daily sighting rate, or sightings per unit effort (SPUE), andan index of relative abundance, or whales per unit effort (WPUE).
35
Of the 69 sightings of bowhead whales, the first bowhead whales were observed on 2 September. The datafor daily sighting rates showed a fairly level distribution over the field season, with a minor peak (mode) of2.10 SPUE on 2 September. The last sighting of a bowhead was made west of the study area on 5 October(Table 5 and Fig. 18).
Of the 114 bowhead whales counted during this period, the data for daily relative abundance (WPUE) showthat the midpoint (median) of the bowhead migration in Blocks 1 through 12 (when 50% of all sighted whaleshad been recorded) occurred on 20 September (Table 5). The peak relative abundance (mode) of 4.78WPUE occurred on 26 September (Table 5 and Fig. 18).
The most prominent differences in pattern between the graph for relative abundance and that for sightingrate occurred on 26 September (Fig. 18),' due to several large pods of. whales observed on that day(Appendix B: Table B-1).
3. Relative Abundance by Survey Blocks: The relative abundance of bowhead whales in eachBeaufort Sea survey block (Fig. 1), in Chukchi Sea survey blocks west of 15rW. longitude, in Canadianwaters east of 1400W. longitude, and in Alaskan waters outside of historically monitored survey blocks, wascalculated in Table 6. Over the field season (1 September-9 October), there were 3 survey blocks in which~15.00 hr of survey effort were made. Of these coastal blocks (Blocks.t , 3, and 4), coastal Block 1 (1.12WPUE) had the greatest relative abundance, followed by Block 4 (0.50 WPUE) and Block 3 (0.31 WPUE).Although less than 15.00 hr of survey effort were made in coastal Blocks 5 and 12, it was notable that 44 ,

i
!
!........... __ ............. .......
i
... ."
-......... [
'"III N 0N ~ "!•• is!
. r.<0"::t ...
0 Ii '"<0 ci
'" I III .1 i~ ii" '" " <Dc:i _ ~ ~ ,g, _i_.i.,,_ ~ .n.n]
31 2 '4 6 8 10' ',2 ',4' 16 ',8' 20 22 24 26 28 '30 '2' '4' '6' '8' '10' ',2' ',4' ',6' "8' '20·
SEPTEMBER OCTOBER
.
~ ~I,M;; ~ 0Ici_C'Il C"\l
1 ••• _0 0~'1, rv r-c c:i_
31 2 4 6
SEPTEMBER OCTOBER
Figure 18. Daily Relative Abundance (WPUE) and Sighting Rate (SPUE) of Bowhead Whales,1 September - 9 October 1996
(Solid circles indicate days when flights were made during which no bowheads were observed.Open circles indicate days when no flight was made.)
36

Table 5Number of Sightings and Total Bowhead Whales Observed per Hour,
1 September-9 october 1996, by Flight Day
Sightings/ Whales/No. of No. of Total Survey Hour Hour
Day Sightings Whales Time (hr) (SPUE) (WPUE)
2 Sep 10 12 4.77 ' 2.10 2.525Sep 1 1 5.47 0.18 0.186 Sep a a 0.00 1 1
7Sep a a 1.40 0.00 0.008 Sep 2 6 2.20 0.91 2.739Sep 2 2 5.62 0.36 0.36
10:Sep 4 5 6.22 0.64 0.8011 Sep . 1 1 4.18 0.24 0.2412 Sep 7 11 5.12 1.37 2.1513 Sep 1 2 5.12 0.20 0.3914 Sep a a 0.70 0.00 0.0015 Sep a a 1.85 0.00 0.0016 Sep 5 5 4.38 1.14 1.1418 Sep a a 0.92 0.00 0.0019 Sep 4 10 4.55 0.88 2.2020 Sep 7 9 4.56 1.54 1.9722 Sep a a 5.28 0.00 0.0023 Sep a a 1.42 0.00 0.0024Sep a a 3.52 0.00 0.0026 Sep 12 34 7.12 1.69 4.7827 Sep 7 9 6.07 1.15 .. 1.4828 Sep a a 4.27 0.00 0.0029Sep a a 5.10 0.00 0.0030 Sep 1 1 2.20 0.45 0.45
1 Oct a a 5.53 0.00 0.002 Oct 1 2 5.48 0.18 0.364 Oct a a 2.82 0.00 0.005 Oct 4 4 4.13 0.97 0.976 Oct a a 5.37 0.00 0.007 Oct a a 3.20 0.00 0.009 Oct a a 4.45 0.00 0.00
TOTAL 69 114 123.00 0.56 0.93
1 Flight aborted due to weather: did not include over-water survey.
37

.----------------------~. -- ---
Table 6Semimonthly Relative Abundance (WPUE) of Bowhead Whales (BH), by Survey Block, Fall 1996
1-15 Sep 16-30 Sep 1-9 Oct 10-31 Oct TotalBlock Hr BH WPUE Hr BH WPUE Hr BH WPUE Hr BH WPUE Hr BH WPUE
1 12.70 17 1.34 14.12 20 1.42 6.14 0 0.00 32.95 37 1.122 2.03 0 0.00 4.50 0 0.00 1.84 0 0.00 8.37 0 0.003 4.91 1 0.20 '4.93 2 0.41 9.76 3 0.31 19.59 6 0.314 5.56 1 0.18 10.15 8 0.79 2.37 0 0.00 18.07 9 0.505 9.25 8 0.86 2.09 5 2.39 1 1 1 11.34 13 1.156 3.12 2 0.64 5.34 0 0.00 2.22 0 0.00 10.68 2 0.197 0.53 0 0.00 0.08 0 0.00 1 1 1 0.62 0 0.008 1 1 1 1 1 1 1 1 1
9 0.08 0 0.00 0.32 0 0.00 0.07 0 0.00 0.47 0 0.0010 0.02 0 0.00· 0.57 0 0.00 0.05 0 0.00 0.63 0 0.0011 0.60 0 0.00 3.95 0 0.00 5.17 3 0.58 9.72 3 0.3112 3.62 11 3.04 3.02 3310.93 4.43 0 0.00 11.07 44 3.97
12N 2 0.22 0 0.00 0.14 0 0.00 0.19 0 0.00 0.55 0 0.00
OtherCanadianAreas
OtherAlaskanAreas 0.19 0 0.00 0.30 0 0.00 0.49 0 0.00
TOTAL 42.63 40 0.94 49.38 68 1.38 32.53 6 0.18 123.00 114 0.93
1 No survey effort.2 Block 12N is between Block 12 and 73 ON. latitude.
38

whales were observed in Block 12 and 13 were observed in Block 5, for a greater relative abundance of 3.97WPUE and 1.15 WPUE, respectively (Table 6).
During the first half of September, there were 4 blocks in which ~4.00 hr of survey effort were made. Ofthese coastal blocks (Blocks 1, 3, 4, and 5), Block 1 (1.34 WPUE) had the greatest relative abundance,followed by Block 5 (0.86 WPUE), Block 3 (0.20 WPUE), and Block 4 (0.18 WPUE). Although less than 4.00hr of survey effort were made in coastal Block 12, it was notable that 11 whales were observed in this block,for a higher relative abundance of 3.04 WPUE. Two bowheads were observed during a total of 6.60 hr ofsurvey effort in the remaining blocks (Blocks 2, 6, 7, 9, 10, and 11) of the primary study area or adjacentwaters (Table 6).
39
During the second half of September, there were 5 blocks in which ~4.00 hr of survey effort were made.Of these coastal or offshore blocks (Blocks 1, 2, 3, 4, and 6), coastal Block 1 (1.42 WPUE) had the greatest
· relative abundance, followed by Block 4 (0.79 WPUE), Block 3 (0.41 WPUE), and Blocks 2 and 6, for which· no whales were observed. Although less than 4.00 hr of survey effort were made in Blocks 5 and 12, it was· notable that 33 whales were observed in coastal Block 12 and 5 whales in coastal Block 5, for a higher
relative abundance of 10.93 WPUE and 2.39 WPUE, respectively. No bowheads were observed during atotal of 5:25 hr of survey effort in the remaining blocks (Blocks 7, 9, 10, and 11) of the primary study areaor adjacent waters (Table 6).
From 1 through 9 October, there were 4 blocks in which ~4.00 hr of survey effort were made. Of thesecoastal or offshore blocks (Blocks 1,3, 11, and 12), coastal Block 11 (0.58 WPUE) had the greatestrelativeabundance, followed by Block 3 (0.31 WPUE) and Blocks 1 and 12, for which no whales were observed.No bowheads were observed during a total of 7.04 hr of survey effort in the remaining blocks (Blocks 2, 4,6, 9, and 10) of the primary study area or adjacent waters (Table 6).
4. Habitat Associations: Of 114 bowhead whales sighted over the field season (1 September-9October), 99 (87%) were in shallow water (0-50 m deep), 15 (13%) were in waters of transitional depth (51-200 m), and none was sighted in deeper water (>200 m) (Table 7). A fuller description of depth associatedwith the bowhead migration appears in the discussion on median-water-depth analysis in Section IV.B.
In addition to general ice coverage for arctic waters (Figs. 3-10), the percentage of ice cover visible from theaircraft at each bowhead sighting (Appendix B: Table B-1) was summarized (Table 8). Over the fieldseason, whales were sighted in a wide range of sea-ice concentrations, wjth17 (15% sea-ice) sighted in 11-through 20-percent seaice, 19(14%) in 6- through 10-percent ice, 16 (14%) in 81- through 90-percent ice,15 (13%) in 31- through 40-percent ice, 12 (11%) in open water (0% sea ice); 12 (11%) 61- through 70-percent ice, 9 (8%) in 41- through 50-percent ice, 6 (5%) in 1- through 5-percent ice, 6 (5%) in 21- through30-percent ice, 4 (3%) in 7h through 80-percent ice, and 1 (1%) in 51- through so-percent ice. Lighterconcentrations (0- through 20: percent ice) predominated during the first half of September, while heavierice concentrations prevailed during the remainder of the field season (Table 8).
5. Behavior, Swim Direction, and Speed: Of 114 bowhead whales observed during Fall 1996, 55(48%) were swimming (Table 9), l.e., moving forward in an apparently deliberate manner, when first sighted.Over the fall season, whale headings were generally toward the western quadrant (proportion = 0.46). Their
; significant (p <0.02) mean heading was 300.39°T (Fig. 19), consistent with a directed migration in rough; parallel to Alaska's Beaufort Sea coastline. Over the field season, 43 (38%) were judged to be swimming. at' medium speed, with 34 (30%) still, 32 (28%) swimming slowly, and 5 (4%) swimming fast. Other
behaviors noted for bowhead whales included 20 (17%) that were milling, 12 (11 %) resting, 9 (8%) diving,9 (8%) tail slapping, 7 (6%) feeding, and 2 (2%) in cow-calf associations (Table 9). All behaviors noted aredefined in Table 2.
During the first half of September, 23 of 40 (58%) bowheads were initially observed swimming (Table 9).Whale headings were generally toward the western quadrant (proportion = 0.37), with the octant of strongestdirectionality (0.31) between west and northwest. Their mean heading was 338.70oT (Fig. 19). Thirteen
.. (33%) whales were judged to be still, with 11 (27%) swimming slowly, 11 (27%) swimming at medium speed,

------------------------------------------------------ .. _--
H-+++-1+++-l9O' 27111-++++-IH-+
n= 39
1-15 Septembern= 16
16-30 Septembern=19
27I1H-f+HI-H""I'" 27111-+++HH, r-H-+++++-Hsil
180'
a= 338.70Z= 2.33
r= 0.38p< 0.10
a= 263.48z= 2.05
r= 0.33p< 0.20
1-9 October
27~
n=4
~+++++H9O'
180' 180'
a= 299.65 r= 0.78z=- 2.45 p> '0.20
a= 300.39 r= 0'.33Z= 4.27 p< 0.02
Figure 19. Semimonthly Summary of Swim Directions for Bowhead Whales, Fall 1996

.' Table?Semimonthly Summary of Bowhead Whales Observed,
by Water Depth at Sighting Location, Fall 1996
,':
Water 1-15 Sep 16-30 Sep 1-9 Oct 10-31 Oct TotalDepth No. (%) No.(%) No. (%) .No, (%) No. (%)
Shallow 29 (72) 66 (97) 4 (67) 99 (87)(0-50 m)
Transitional 11 (28) 2 (3) 2 (33) 15 (13)(51-200 m)
Deep' 0 0 0 0(>200 m)
TOTAL 40 (100) 68 (100) 6 (100) 114 (100)
Table 8Semimonthly Summary of Bowhead Whales Observed,
by Percent Ice Cover Present at Sighting Location, Fall 1996
% Ice 1-15Sep 16-30 Sep 1-9 Oct 10-31 Oct Total'Cover No. (%) No. (%) No. (%) No .. (%) No. (%)
0 12 (30) 0 0 12 (11 )1-5 4 (10) 2 (3) 0 6 (5)6-10 16 (39) 0 0 16 (14)11-20 3 (7) 14 (21 ) 0 17 (15)21-30 1 (3) 5 (7) 0 6 (5)31-40 1 (3) 14 (21 ) 0 15 (13)41-50 2 (5) 6 (9) 1 (17) 9 (8)51-60 0 1 (1) 0 1 (1) ..61-70 0 12 (18) 0 1 12 (11)71-80 0 3 (4) 1 (17) 4 (3)81-90 1 (3) 11 (16) 4 (6p) 16 (14) .91-99 0 0 0 0 \ '.'
TOTAL 40 (100) 68 (100) 6 (100) 114 (100)
1 No survey effort.~"
'"
41

Table 9Semimonthly Summary of Bowhead Whales Observed, by Behavioral Category, Fall 1996
1-15 Sep 16-30 Sep 1-9 Oct 10-31 Oct TotalBehavior No. (%) No. {%) No. (%) No. (%) No. (%)
Cow-Calf 2 (5) ·0 0 2 (2)
Diving 3 (7) 5 (7) 1 (17) 9 (8)
Feeding 1 (3) 6 (9) 0 7 (6)
Milling 6 (15) 14 (21 ) 0 20 (17)
Resting 3 (7) 8 (12) 1 (17) 12 (11 )
Swimming 23 (58) 28 (41 ) 4 (66) 55 (48)
Tail Slapping 2 (5) 7 (10) 0 9 (8)
(not noted) 0 0 0 0
TOTAL 40 (100) 68 (100) 6 (100) 114(100)
Table 10Semimonthly Summary of Bowhead Whales Observed, by Swimming Speed, Fall 1996
Swim 1-15 Sep 16-30 Sep 1-9 Oct 10-31 Oct TotalSpeed No. (%) No. (%) No. (%) No. (%) No. (%)
Still 13 (33) 20 (29) 1 (17) 34 (30)(0 km/hr)
Slow 11 (27) 19 (28) 2 (33) 32 (28)«2 km/hr)
Medium 11 (27) 29 (43) 3 (50) 43 (38)(2-4 km/hr)
Fast 5 (13) 0 0 5 (4)(>4 km/hr)
(not noted) 0 0 0 0
TOTAL 40 (100) 68 (100) 6 (100) 114 (100)
1 No survey effort.
42

and 5 (13%) swimming fast (Table 10). Other behaviors noted for bowhead whales included 6 (15%) thatwere milling, 3 (7%) diving, 3 (7%) resting, 2 (5%) in cow-calf associations, 2 (5%) tail slapping, and 1 (3%)feeding (Table 9).
During the second half of September, 28 of 68 (41 %) bowheads were initially observed swimming (Table9). Whale headings we.re generally toward the western quadrant (proportion = 0.48), with the octant ofstrongest directionality. (0.37) between west and southwest. Their mean heading was 263.48°T (Fig. 19).Twenty-nine (43%) whales were judged to be swimming at medium speed, with 20 (29%) still, and 19 (28%)swimming slowly (Table 1O).-Other behaviors noted for bowhead whales included 14 (21%) that weremilling, 8 (12%) resting, 7 (100/,0)tail slapping, 6 (9%) feeding, and 5 (7%) diving (Table 9).
From 1 through 9 October, 4 of 6 (660/0) bowheads were initially obseryed swimming (Table 9). Whaleheadings were generally toward the western quadrant (proportion = 0.75), with the octant of strongestdirectionality (0.50) between west and northwest. Their mean neading was 299.65°T (Fig. 19). Three (50%)whales were jUdged to be swimming at medium speed, with 2 (33%) swimming slowly and 1 (17%) still.Other behaviors noted for bowhead whales included 1 (17%) that was diving and 1 (17%) resting (Table 9).
43
D. Other Marine Mammal Observations
1. Gray Whale (Eschrichtiusrobustus): No gray whales were sighted during the study.
2. Belukha Whale (Delphinapterus leucas): Although the study area and survey altitude weredesigned to record the fall migration of bowhead whales, belukha whales, which undertake a somewhatparallel migration, were always counted and were considered suitable for selected analyses. Over the Fall1996 field season, 104 sightings were made for a total of 617 belukha whales (Table 4) during 123.00 hrof survey effort (Table 3) and a seasonal relative abundance of 5.02 WPUE. Sightings of belukha whaleswere distributed between 1400W. and 157°W.longitudes, mostly between 30 and 70 nm from shore southof 72°N. latitude (Fig. 20). Sizes of pods (or close aggregations of pods) ranged from 1 to 63 whales, witha mean of 5.93 (SD =9.00, n = 104). Fifty belukhacalves were noted for a calf ratio of 0.08. Belukha whaleswere observed in association with 0- to ss-percent sea ice, with a mean of 58.32-percent ice (SD = 31.76,n = 104). .
During the first half of September, 30 sightings were made for a total of 201 belukha whales (Table 4) during42.63 hr of survey effort (Table 3) and a relative abundance of 4.71 WPUE. The first belukha in the AlaskanBeaufort was sighted at 71 °15.1 'N.latitude, 148°41.6W.longitude on 2 September. Sizes of pods (or closeaggregations of pods) ranged from 1 to 38 whales, with a mean of 6.70 (SD = 9.12, n = 30). Nineteenbelukha calves were noted during this period. Belukha whales were observed in association with 0- to 80-percent sea ice, with a mean of 21.67-percent ice (SD = 24.68, n = 30).
During the second half of September, 52 sightings were made for a total of 325 belukha whales (Table 4)during 49.38 hr of survey effort (Table 3) and a relative abundance of 6.58 WPUE. Sizes of pods (or closeaggregations of pods) ranged from 1 to 63 whales, with a mean of 6.25 (SD = 10.47, n = 52). Twentybelukha calves were noted during this period. Belukha whales were observed in association with 0- to 98-percent sea ice, with a mean of 71.12-percent ice (SD = 20.54, n = 52).
From 1 through 9 October, 22 sightings were made for a total of 91 belukha whales (Table 4) during 30.98hr of survey effort and a relative abundance of 2.94 WPUE. Sizes of pods (or close aggregations of pods)ranged from 1 to 15 whales, with a mean of 4.14 (SD = 3.45, n =22). Eleven belukha calves were notedduring this period. Belukha whales were observed in association with 0- to 97-percent sea ice, with a meanof 78.05-percent ice (SD = 18.65, n = 22). .
3. Unidentified Cetaceans: Over the field season,S incidental sightings were made for a total of6 unidentified cetaceans (Table 4). Sightings were distributed between 144°W. and 155°W. longitudes,south of 72°N. latitude (Fig. 21).

Alaska 69
Beaufort Sea
. HarrisonBay Colville
. Delta Pt.Nuiqsut 70
LEGEND
t; BelukhaWhaleFlaxman
Is.
30 030 Kilometers••••• (approx.)
L...- __ ~ ~
DemarcationPt.
coIS)..•..
I
Figure 20. Mapar Belukha Whale Sightings, Fall 1996

73
Beaufort Sea
72
LEGEND
I----~---- -----I I --,-------,-----\ \
,A' I I \ \/ I I \ \1-- I I \ \/ -r-----"l _---
A /-..... -----1 "\I I L-1 I \ \
__ I \ \I l-1 _-\
, A , -+---~ \
o ,,-' -- \ A \ \
Deadhorse ~ . \Flaxm:n _ /~ Kaktovik
Is. CamdenBay
71
Smith Bay
70
30 0;;;;;
30 KilometersS (approx.)
Alaska
HerschelIs.
0(
~I~\0,\
69
• Unidentified Cetacean
._-+---~+------+--+----- -.~ ;j!j :- --+-----+----+---+-----+-----+--+--
~ ~ ~ ~ ~
Figure 21. Map of Unidentified Cetacean Sightings, Fall 1996

4. Bearded Seal (Erignathus barbatus): Over the field season, 3 incidental sightings were madefor a total of 3 bearded seals (Table 4) (Fig. 22). Bearded seals were sighted on 12 September, 28September, and 7 October (Table 4) within 60 nm north of the shoreline. Two (67%) of the bearded sealswere in open water and one (33%) was on the sea ice when first sighted.
5. Ringed Seal (Phoca hispida): Overthe field season, 26 incidental sightings were made for a totalof 137 ringed seals (Table 4).Sightings were evenly distributed between 143°W. and 155°W. longitudes,within 50 nm north of the shoreline (Fig.23). Ringed seals were sighted from 10 September through 7October (Table 4). One hundred twenty-nine (94%) of the ringed seals were in open water and 8 (6%) wereon the sea ice when first sighted.
6. Pacific Walrus (Odobenus rosmarus): No walruses were sighted during the study.-
7. Unidentified Pinnipeds: No cunidentified pinnipeds were sighted during the study.
8. Polar Bear (Ursus maritimus): Over the field season, 8 incidental sightings were made for a totalof 10 polar bears (Table 4). Three sightings were made within 20 nm northeast of Flaxman Island, 2between Cape Halkett and Smith Bay within 15 nm north of the shoreline, and 3 between Dease Inlet andBarrow within 50 nm north of the shoreline (Fig. 24). One polar bear was sighted on 10 September and 9were sighted from 2 through 9 October (Table 4),-after heavy ice concentrations had covered the study area.All 10 (100%) of the bears were on the sea ice when first sighted.
In addition to the polar bear sightings, 90 sets of polar bear tracks were recorded for which no bear waspresent (Table 4). Sightings were distributed between 142°W. and 15rw. longitudes within 80 nm northof the shoreline (Fig. 25). All but one of the polar bear tracks were sighted from 19 September through 9October (Table 4), as heavy concentrations of sea ice covered the study area (Figs. 7-10).
47

Demarcation HerschelPt. . Is.
«« !Ii~ z.~ \ ~,
\
eoII)~
v N ~II) 0 !iJ~ II) ~ ~ ;~ II) 73~ ~. ~
Beaufort Sea
LEGEND
'/~~~~~ , :•r-----,...--:----~--'-~I-"'-- - --\/ I I ..' .' 1 , . I' \
I I' _. I . 1 . . \I- - , -, 1 _' \ _ \~ r:--~~~_~__~~---~I' L: ~ I . . , \
I - ~ _ 1 .'... I" . \, : l_~ .' 1 __ -\
" ~----+-I - \o ,,"" -- -I \
Deadhorse \
HarrisonBay Colville
Delta PlNuiqsut
• Bearded Seal
_Alaska
30 0 30 Kilometers•••••• (approx.)
+------+ +-__-+--__-+_, -+-__-+__.~----~_---+-~+------"1r------N
~ § ~ ~
Figure 22. Map of Bearded Seal Sightings, Fall 1996
72 ".'
, .~
71
70
69

s.'<t
N 0It) 0 N '<t•.. It) eo <0 ~ '<t •..•.. It) '<t '<t 73•.. •..
Beaufort Sea
,,"'"- - - -r ---- ' - ---.f ~I - - -1-----1;- - - -r~:--\, ~, ~ , I, .1, \
~/;:-----:-,' ",' II' I~r ~,,---,----, ,_---~, ",- -. .-- - - ~ "\
, ", -¢-, t' _ I' , , I-9- ~ ,~ 1 '~' I,
~ ~ -_I I '\~.-' L-i ~, !,~--,<~-, ~ ~ I ~- - - 1-- - - - \
'--,~ ~I' '~I ,I,. -¢-~ " \
\
Y'Smith Bay
" ,
~ , , -
LEGEND
Alaska
~ RingedSeal
30' 0 30 Kilometers•••••• : (approx.}.
L-,~ , _
72
71
70
HerschelIs,'ct
~I~\ 0 .,I
\
69
I 'I , I, ~, '. 'Ii!-
of,
Figure 23. Map of Ringed Seal Sightings, Fall 1996

Demarcation HerschelPt. Is.
<-< ~ 69~
I~~ \0I,
0N '<t
'<t '<t'<t .•....•...
CD10 '.•...
01o
Beaufort Sea
~-*-- ---I r------.------..,-----I-:- \I x I' / I 1 1I I / I 1 \
~----_ / I 1 1"------, ----I
II x x /- L i- - - - -11
1/ -1
-- I 1 1/ L-1t-_---\~----x '1 \
,0 '"'-_;.....-..;;>I,~ x \Deadhorse \
Cape/IHalkeU ~
.-/'
HarrisonBay Colville
Delta Pt.Nuiqsut
LEGEND
Alaska
~ Polar Bear
30 0 30 Kilometers1"""""1 (approx.)
o10.•...
Figure 24. Map of Polar Bear Sightings, Fall 1996
73
71

Beaufort Sea
~-
O'l...•. Smith Bay----
HarrisonBay Colville
Delta
LEGEND
Alaska
.;; Polar Bear Tracks
30 a 30 Kilometers1"""""1 I (approx.)
Demarcation HerschelPt. Is.
c(
~ ~~ Z~Ic:(
\0I
\
co"It•..Figure 25. Map of Polar Bear Tracks, Fall 1996
73
72
71
70
69

IV. DISCUSSION
A. General Comparisons with Previous Surveys (1979-1995)
Most results of the present study are generally within the range of result values from previous MMS-fundedendangered whale monitoring conducted during September and October (1979-1995) in the Beaufort Seausing similar survey methods (Ljungblad et aI., 1987; Moore and Clarke, 1992; Treacy, 1988, 1989, 1990,1991, 1992, 1993, 1994, 1995, 1996). Prior to Fall 1992, surveys in Block 12 were largely conducted froma modified Grumman Goose rather than a Twin Otter aircraft. Results for 1996 that were considered notablerelative to previous values are described below.
The general ice coverage along the northern coast of Alaska during the 1996 navigation season was thetenth-mildest in the Arctic Ocean for the 44 years from 1953 through 1996 (USDOC, NOAA, National IceCenter/USDOD, Navy, Naval Ice Center, 1997).
Cloud cover over most of the study area was considered favorable for surveying in 1996, without recurrentperiods of "down-to-the-deck" fog or sustained high winds and associated high sea states as in manyprevious field seasons.
The 1996 total of 123.00 survey hours was close to the mean of 128.53 hours (SD = 40.37, n = 9) forprevious MMS surveys (1987-1995).
The number of bowhead whales counted (n = 114) during Fall 1996 was the seventh-highest out of the 10MMS project surveys (1987-1996) and was within one SD of the mean for previous years (5< = 245.44, SD= 157.87, n = 9).
For September 1996, the relative abundance of bowhead whales in Block 12 (6.63 WPUE) was the second-highest for the years 1979 through 1996. Values for relative abundance in all other survey blocks duringSeptember or October 1996 were within the range of values shown for the years 1979 through 1995 (Table11).
The total number of belukha whales counted in Ea1l1:996 c(n:=617) was the third-hIghest total mlUmbersincethe project began (~987-1996). The overall relative ,abundance ofbelukhasfor :Fallt99'6{S.12 'WPUE) wasmore than 1 SD :higher than the mean 'of 2:32 'WPllJE {SO = ;2.51., :r.t:=.9) for pr:evious ;project .surveys i('1'987-1995). The numberot :bearded sealssigh'ted in iFall"1'996 f(n=3) was lower than forprevious.surveys ..(;1987-1995). Totals of other marine mammals sighted were within ranges established during previous projectsu rveys in the Beaufort Sea (1987-1995).
B. Median and Mean Water Depth at Bowhead Sightings (1982-1995)
The median water depth at 23 sightings of bowhead whales made on randomized line transects in RegionsI, II, and III (combined) (Fig. 2) during September and October 1996 was 35 m. This areawide median depthappears to be closely related to median areawide depths for most other years (Fig. 26) and falls within therange of values for previous years (range = 18 to 347 m). It is slightly less than the cumulative median depthof 37 m for the years 1982 through 1996 (n = 591). During Fall 1996, the median water depths noted foreach of the 3 bathymetric regions were within the range of values for previous years. The 1996 value forRegion I (42 m) was higher than the cumulative value (24 m) for previous years (1982-1995). The Fall 1996median water depths for Regions II (28 m) and III (44 m) were very close to the cumulative values (31 m and42 m, respectively) for previous years (1982-1995) (Table 12).
To determine whether any of the differences between the median water depth for 1996 and previous years(Table 12) were statistically significant, these values were tested using the Mann Whitney U test (Zar, 1984).The median water depth (all 3 regions combined) for the year 1996 showed a highly significant difference(p <0.005) when compared to medians for the years 1983, 1989, and 1991. Analysis by region showed no"differences that were highly significant between 1996 and other years in Region I (between 150oW. and
53

Figure 26. Median Water Depth (in meters) at Random Sightings of Bowhead Whales, by Year,1982-1996
c 4000.-••••CO•••C).-:EoaCO 300G).c~0r:c••0
..-..- 200E••••••• ,\
.c••••Q.G)C••• 100G)••••CO
3=cCOl-oaG) 0:E
Year (31 Aug-30 Oct)
54

Table 11Bowhead Whale Relative Abundance (WPUE) by Beaufort Sea Survey Block
during September and October; 1979: 1996 '(after Ljungbladet al. [1987]; Moore and Clarke [1992], '
and Treacy [1988, 1989, 1990, 1991, 1992, 1993, 1994, 1995, 1996])
Survey Block Other OtherCanadian Alaskan
Year 1 2 3 4 .5 6 7 8 9 10 11 12 Areas2 Areas3
SEPTEMBER ..
1979 0.08 0.00 0.00 0.09 10.08 0.73 0.00 0.00,
1980 0.38 0.00 0.00 0.47 0.99 0.00 0.00 0.00 0.00 0.00 0.00 1 0.471981 0.22 0.00 0.00 6.13 9.20 0.00 0.00 0.00 0.00 1 0.00 0.32 0.001982 ·6.83 1.35 0.80 0.93 11.30 0.00 ,0 ..00 0.00 1.28 0.00 0.44 48.65 0.00198,3 0.11 0.87 0.61 0.00 0.00 1.51 1.90 0.00 0.36 0.21 0.53 2.28 1 0.001984 0.59 1.05 0.18 2.69 3.19 1.94 0.00 0.00 0.00 0.00 0.00 26.24 17.00 0.001985 0.54 0.00 0.00 2.21 1.74 0.39 0.00 0.00 0.00 0.00 0.00 0.00 6.52 0.001986 0.10 0.00 0.00 0.94 2.36 0.29 0.10 0.00 O.Op 0.00 0.45 0.00 7.98 0.001987 0.74 0.00 0.00 1.32 0.72 0.31 0.00 1 0.00 1 0.00 0.26 0.66 0.331988 0.14 0.00 1 0.35 0.48 0.45 0.00 0.00 1 , 1 0.00 1
1989 2.37 0.33 0.00 6.23 0.71 0.33 1.52 1 0.00 0.00 0.73 1 0.001990 5.54 0.00 0.72 7.61 18.51 3.35 1.72 0.00 0.00 0.00 1 63.64 0.001991 O~OO 0.00 0.00 0.30 0.20 1.88 0.00 0.00 0.00 0.00 0.00 0.00 20.50 0.001992 0.45 0.20 0.12 0.73 0.91 1.75 2.48 0.00 0.00 0.00 0.13 1 0.001993 4.39 0.00 3.03 4.07 2.11 0.00 0.00 0.00 0.00 0.00 0.00 1.93 0.001994 0040 0.00 1.27 1.52 11.55 3.52 0.00 1 t : 0.00 0.00 1 0.001995 7.77 0.00 0.27 10.37 7.40 4.73 1.18 0.00 0.00 0.52 0.15 0.00 0.001996 1.38 0.00 0.30 0.57 1.15 0.24 0.00 0.00 0.00 0.00 6.63 1 0.00
OCTOBER1979 1.58 0.00 3.67 2.35 0.00 '1 0.00 0.70 0.001980 0.10 1.18 0.35 0.29 0.00 0.00 0.00 0.00 0.00 0.00 0.001981 0.89 0.00 0.52 4.22 0.00 0.00 0.00
,0.00 0.00 1 1
1982 0.19 0.00 2.48 0.00 0.70 0.00 1 0.00 0.00 0.00 0.19 1.87 0.46 0.001983 0.00 0.00 0.49 0.00 0.00 0.27 2.17 1 1 0.00 0.00 0.75 1 0.001984 0.29 0.26 1.24 0.00 1.37 0.00
,0.00 3.05 2.37 3.70 0.00
1985 2.26 0.00 0.40 0.00 0.00 0.00 0.00 0.00 0.00 9.00 0.53 0.00 0.001986 1.00 0.38 0.47 0.71
,0.00
, 1 o.oo 0.00 0.00 0.91,
0.001987 0.19 0.00 2.94 0.62 0.32 0.00 0.00 0.00 0.00 0.00 0.00 1.71 0.00 0.001988 0.18 0.26 1.12 0.12 0.14 0.00 0.00
,0.00 1 0.19 1.01 0.00 0.00
1989 1.32 0.00 5.58 0.00 0.00 0.00 0.00 1 0.00 0.00 12.98 1 0.001990 3.00 0.00 2.14 2.17 1 2.86 1 0.00 0.97 0.74 0.001991 0.07 2.23 0.27 1.48 ,4.36 0.00 1.39 0.00 0.00 0.00 0.00 1.04 0.49 0.551992 0.00 0.68 0.81 0.00 0.00 0.00 0.00 0.00 0.00 0.00 0.92 16.35 1 0.001993 0.88 0.00 1.78 2.32~ 2.19 1.24 0.00 0.00 0.00 0.00 0.00 4.40 0.00 0.001994 0.49 0.00 0.13 0.00 0.00 0.00 1 1 1 0.00 0.00 0.22 1 0.001995 0.00 0.00 0.00 1.55 1 0.00 0.00 1 1.05 0.00 133.33 0.361996 0.00 0.00 0.31 0.00 0.00 0.00 0.00 0.58 0.00 1 0.00
1 No survey effort.2 Between 140oW. and 141 oW. longitudes north of 72°N. latitude or east of 140oW. longitude.3 Between 141 oW. and 15JOW. longitudes north of 72°N. latitude.
55

Table 12Central-Tendency Statistics for Water Depth (in meters) at Random Sightingsof Bowhead Whales (September-October), by Year arid Region, 1982-1996
Year Region SI1 Median CI2 Mean SD3 Range
1982 I 8 17 11-457 113.4 176.23 11-457II 30 27 22-38 30.6 9.03 . 16-51III ..§ 40 4 43.4 11.24 29-59
All 3 43 29 22-38 47.5 79.22 11~457
1983 - I 9 69 22-2,323 393.7 740.61 22-2,323II 5 1,289 4 945.0 858.85 53-2,021
III J! 797 49-1,902 969.7 740.33 49-1,902All 3 23 347 49-1,737 739.0 783.00 22-2,323 -.
1984 I 15 42 27-69 53.4 41.44 1.8-178II 9 38 22-82 43.7 .18.73 22-82
III 14 48 22-274 90.4 1'30.05 , 18-485All 3 38 43 27-59 64.7 84.12 18-485
1985 I 3 183 4 219.3 221.74 18-45711 9 31 20~38 30.4 5.00 20-38III ..1 4 4 4 4 645
All 3 13 31 20-183 76.6 122.13 18-457
1986 I 4 18 4 51.3 69.87 13-156II 12 17 - 9-40 60.7 144.79 7-519
III 22 33 22-48 34.0 13.91 11-57All 3 38 26 18-44 44.3 83.03 - 7-519
1987 I 4 20 4 19.2 4.86 .13-2411 9 27 15-38 27.3 7.60 15-38III 20 41 29-55 49.9 41.38 18-219
All 3 33 37 24-44 40.0 34.54 13-219
1988 I 4 35 4 40.5 15.11 29=62II 4 44 4 44.7 13.60 29-62
III ..§ 46 4 90.4 116.40 24-298All 3 13 42 29-62 61.0 72.17 24-298
1989 I 15 18 9-20 16.0 4.58 9-24II 1 4 4 4 4 445
III .a 49 4 49.3 9.50 40-59All 3 19 18 13-40 22.7 14.39 9-59
1990 I 3 31 4 29.3 13.58 15-42II 17 37 29-38 33.6 7.05 15-38
III 68 40 37-48 40.5 10.49 16-60All 3 88 38 37-38 38.8 10.43 15-60
56

Table 12Central-Tendency Statistics for Water Depth (in meters) at Random Sightingsof Bowhead Whales (September-October), by Year and Region, 1982-1996
(Continued)
Year Region SI1 Median CI2 Mean SD3 Range
1991 I 0 4 4 4 4 4
II 7 66 4 126.7 100.04 27-274III ..2 118 4 132.2 92.05 48-232
All 3 13 66 48-238 129.2 92.42 27-274
1992 I 8 40 13-329 70.3 105.24 13-329II 3 46 4 119.0 126.44 46-265
III J! 55 44-57 50.2 8.91 29-57All 3 20 46 37-55 68.6 79.75 13-329
1993 I 12 15 13-18 16.1 2.23 13-20II 24 29 22-38 30.0 9.58 15-53
III 39 44 27-48 44.3 34.24 9-229All 3 75 29 24-38 35.2 27.25 9-229
1994 I 3 13 4 16.3 9.45 9-27II 3 37 4 225.7 335.48 27-613
III 21 40 29-55 41.0 11.87 22-57All 3 27 40 26-55 58.7 111.58 9-613
1995 I 6 131 4 389.2 499.21 7-1,024II 53 26 24-33 27.4 7.40 16-40
III 66 39 26-48 42.0 18.39 9-143All 3 125 35 29-37 52.5 126.73 7-1,024
1996 I 5 42 4 44.2 21.41 13-68II 14 28 24-38 29.8 8.71 13-49
III --1 44 4 43.8 7.54 35-51All 3 23 35 24-49 35.3 13.65 13-68
Cumulative I 99 24 18-37 101.4 280.72 7-2,323(1982-1996) II 200 31 24-38 62.9 196.70 7-2,021
III 292 42 40-46 75.9 205.81 9-1,902All 3 591 37 37-38 75.8 217.25 7-2,323
1 SI = random sightings.2 CI ~ 99-percent confidence interval.3 SD = standard deviation.4 Insufficient sample size.S One datum.
57

153°30'W. longitudes) or in Region III (between 141 oW. and 146°W. longitudes). There was a highlysignificant difference «0.005) between the median depth for 1996 and for 1983 and 1991 in Region II(between 146°W. and 1500W. longitudes) (Table 13).
The median water depth for the year 1987 (37 m) was considered typical in that it was identical to thecumulative median (all 3 regions combined) for the years 1982 through 1996 (Table 12). Of the years whenbowheads tended to migrate in water that was deeper than in 1987, the years 1983, 1991, and 1992 showedhighly significant (p <0.005) differences from the 1987 depth. Conversely, the median depth for the year1989 was very significantly (p <0.005) shallower than for 1987 (Table 13).
A high level of significance (p <0.005) was noted between the 1983 median value (all 3 regions combined= 347 m) and the median value for each other year except 1991 (p <0.05). The highly significant difference(p <0.005) between 1983 and other years was generally reflected in bathymetric Regions II and III (Table13).
A high level of significance (p <0.005) was noted between the 1989 median value (all 3 regions combined= 18 rn) and the median values for other years, except 1986 (p <0.20) and 1993 (p <0.01). In Region I, thislevel of difference (p <0.005) between 1989 and other years was noted for 1983, 1984, 1988, and 1993(Table 13).
Mean water depths were also calculated for Regions I, II, and III. Mean values, although less descriptiveof the apparent "axis" of the migration, were considered more robust for demonstrating significantdifferences between years.
The mean water depth at 23 sightings of bowhead whales made on randomized line transects in RegionsI, II, and III (combined) during September and October 1996 was 35.3 m. This was within the range ofareawide mean depths for the years 1982 through 1995 (previous values ranged from 22.7 to 738.9 m) andwas less than the cumulative mean depth of 75.8 m for the years 1982 through 1996 (n = 591). Likewise,Fall-1996 mean water depths for Regions I (44.2 m), II (29.8 m), and III (43.8 m) were less than thecumulative values for these Regions (101.4 rn, 62.9 m, and 75.9 m, respectively) (Table 12).
Comparison of the means using ANOVA and the Tukey test (Zar, 1984) showed that 1983 was uniqueamong other years in the spatial distribution of the fall bowhead migration. Differences between the meanfor 1983 and all other years (including 1996) were considered very highly significant (p <0.001) in all threeregions combined and in Regions II and III, thus mirroring differences noted between the 1983 median andthe medians for other years. Differences in mean water depths between all other years, including 1996,were not considered statistically significant (Table 14).
The reasons for the offshore (deep-water) migratory route of 1983 and the comparatively shallower routefollowed in other years (Fig. 26) may be attributable to general ice cover (see Sec. IV.D). Differences inhuman activity levels, oceanographic conditions, and the possible indirect effect of heavy ice cover on preyavailability are additional potential factors. Ice cover probably has the greatest potential for interacting withenvironmental conditions that, in turn, may have biological significance to migrating bowhead whales (e.g.,net primary production, availability of leads, water temperature). Median-water-depth data show that thefall migration of bowhead whales occurs in deeper water when general ice cover is more severe.Conversely, bowheads tend to migrate in shallower water during years of lighter ice cover. During 1983,the most severe ice year since 1975 (USDOC, NOAA, National Ice Center/USDOD, Navy, Naval Ice Center,1997), the bowhead migration (all 3 regions combined) was observed in water almost an order of magnitudedeeper than for other years (Table 12).
In general, mean water depths at sightings of bowhead whales were skewed to the deeper (northern) sideof the migration axis (median), with cumulative mean values for each region (1982-1996) approximatelytwice as great (as deep) as the cumulative medians (Table 12). The reason for the differences between themean and median values is unknown but may simply reflect the increasing gradient of the seafloor fartheroffshore.
59

Table 13tnteryearCorretatton (nonparametrie) of the Median Water Depths at Random Bowhead
Whale Sightings (September-October) Using the Mann-Whitney U Test, 1982~1996(Page 1 of 4)
REGION I1982 1983 1984 1985 1986 1987 1986 1989 1990 1991 1992 1993 1994 1995
1983 U'=54.0P <0.10
1984 U'=81.5 U =92.5P< 0.20 P < 0.20
1985 U'= 18.0 U = 14.5 U' =30.5P >0.20 P> 0.20 P > 0.20
1986 U= 16.0 U=31.0 U = 45.0 U = 10.0P> 0.20 p<0.10 P <0.20 P >0.20
1987 U = 16.5 U = 34.5 U = 55.5 U=9.5 U'=8.5p>0.2O P < 0.02 p<O.Ol P > 0.20 p> 0.20
1988 U'= 21.0 U =23.0 U'= 30.5 U =8.0 U'= 12.0 U'= 16.0P >0.20 P > 0.20 P >0.20 P >0.20 P > 0.20 P <0.05
1989 U = 76.5 U = 134.0 U = 216.5 U = 39.0 U = 37.0 U =41.5 U = 60.0P >0.20 P <0.001 P <0.001 p<0.10 p> 0.20 P > 0.20 P <0.001
1990 U= 13.0 U = 20.0 U =31.5 U=7.0 U'=7.0 U'=9.0 U =7.5 U'=35.5p>0.2O p > 0.20 P >0.20 p>0.2O P > 0.20 P >0.20 p>0.2O p<0.2O
1991
1992 U'= 39.5 U = 48.5 U ,,68.0 U= 16.0 U'= 22.5 U'= 26.5 U= 16.5 U'= 106.5 U'= 15.5P > 0.20 p> 0.20 P > 0.20 p> 0.20 p> 0.20 P <0.20 P > 0.20 p<O.OO2 p> 0.20
1993 U =66.0 U = 108.0 U = 176.5 U = 33.0 U = 31.0 U = 34.0 U = 48.0 U = 96.0 U = 26.5 U =84.5P < 0.20 P < 0.001 P <0.001 P < 0.05. P > 0.20 P > 0.20 P <0.002 P > 0.20 P <0.20 p<O.OO5
1994 U = 18.0 U = 26.0 U =41.5 U =8.0 U =8.5 U =7.5 U = 12.0 U = 24.5 U =8.0 U =21.5 U = 23.0p>0.20 P s 0.02 P <0.05 P s 0.20 p>0.2O P > 0.20 P sO.10 P >0.20 P sO.2O p<0.10 p>0.2O
1995 U'=31.5 U = 32.0 U'= 47.5 U'=9.5 U'= 17.0 U'= 17.0 U= 12.0 U'= 68.5 U'= 11.0· U'= 26.0 U'= 57.0 U' = 13.0p> 0.20 P > 0.20 P > 0.20 P > 0.20 P > 0.20 P > 0.20 P >0.20 p<0.10 p> 0.20 P > 0.20 p<0.10 -p > 0,20
1996 U'= 23.0 U = 29.5 U'= 38.0 U= 11.0 U'= 12.5 U'= 16.5 U'= 12.0 U'= 64.0 U'= 10.5 U'=23.0 U'= 49.0 U'= 13.5 U = 17.0p>0.2O p.> 0,20 P > 0.20 p> 0.20 p> 0.20 P <0.20 p> 0.20 P s; 0.02 p>0.2O p>O,2O P sO.05 p<0.2O p> 0.20
61

Table 13Interyear Conelation (nonparametric) of the Median Water Depths at Random Bowhead
Whale Sightings (September-october) Using the Mann-Whitney U Test, 1982·1996(page 2 of 4)
REGION II1982 1983 1984 1985 1986 1987 1988 1989 1990' 1991 1992 1993 1994 1995
1983 U'= 150.0p<O.ool
1984 U'=I93.0 U =42.0p<0.10 P ~0.01
1985 U = 136.0 U =45.0 U=62.0p> 0.20 P ~0.001 p<0.10
1986 U = 254.0 U =58.0 U=86.5 U=76.5p< 0.05 P ~0.002 P <O.OS P < 0.20
1987 U'= 155.0 U =45.0 U=63.5 U=53.0 U'= 70.5p>0.2O P ~0.001 p<0.10 P > 0.20 P >0.20
1988 U·=I03.0 U = 19.0 U'= 20.5 U'=29.0 U·=41.0 U·=33.0P ~0.02 p ~O.OS P >0.20 p<0.2O p .O.OS P ~0.02
1989 U'=29.0 U =5.0 U'=5.5 U'=9,O U'= 11.0 U·=9.0 U =2.0p< 0.20 I p>0.2O P ~0.2O p>0.2O P ~0.2O
,
1990 U'=280.5 U =85.0 U=101,5 U'= 108.5 U'= 146.0 U'=114.0 U=54.0 U=17.0p> 0.20 p<O.ool p<O.20 p<0.10 p<0.10 P ~O.OS p<0.10 P ~0.2O
1991 U'= 195.0 U =26.00 U'=51.0 U'=56.0 U'=74.0 U·=58.5 U'= 22.0 U·=6.0 U'= 104.0P < 0.001 p< 0.20 P ~O.OS p~O.OI p<O.OI P < 0.005 p<O.20 , P <0.005.
1992 U'=88.0 U = 13.0 U' 21.0 U'=27.0 U'= 33.0 U'=27.0 U'=9.0 U'=3.0 U'=51.0 U = 13.0P ~ 0.002 P ~0.2O P>0.2O p~O.OI P <O.OS P ~0.01 p>O,2O t P ~0.002 p>0.2O
1993 U = 380.5 U=119.5 U = 158.5 U=115.0 U'= 196,5 U'= 124.0 U=81.5 U =23.0 U =243.0 U= 154.0 U = 70.0Z=O.35 P <0.001 P <O,OS p>0.2O p<0.10 P >0.20 p<O.OS P ~O,2O p>0.2O p<O.ool p<O.OO5p> 0.20
1994 U'= 63.0 U= 13,0 U'=14.5 U'= 19.0 U'= 29.0 U'=21.0 U=7.0 U=2.0 U'= 28.5 U = 12.5 U=6.0 U'=50.0P >0.20 P ~ 0.20 P >0.20 p>0.2O p<0.2O p>0.2O p>0.2O t p>0.2O p>0.2O p>0.2O p>0.2O
1995 U = 977.0 U = 265.0 U = 382.0 U=301.0 U'= 419.5 U = 251.5 U = 193.5 U =53.0 U = 663.5 U =348.5 U = 159.0 U = 744.0 U = 128.0Z< 1.72 Z= 3.66 Z = 2.86 Z=I.24 Z = 1.71 Z=O.25 Z= 2.72 Z = 1.67 Z=2.91 Z =3.74 Z=2.87 Z=I.18 Z= 1.75p<0.10 P <0.001 P <0.00s P >0.20 p<0.10 p> 0.20 p<O.OI p<0.10 p<O.OO5 p<O.ool P <0.005 p> 0,20 p<0.10
1996 U = 215.5 U =70.0 U =92.5 U = 73.0 U'= 115.5 U'=68.0 U =48.0 U= 13.0 U = 158.0 U =90.5 U = 40.0 U= 168.0 U=31.0 U'=435,5P > 0.20 p<O.ool p<0.10 p>0.2O p<0.2O p >0.20 p<O,OS p>0.2O p<0.2O P <0.002 p ~0.02 p> 0.20 p>0.2O Z=O.99
P >0.20
62

Table 13Interyear Correlation (nonparametric) of the Median Water Depths at Random Bowhead
Whale Sightings (September-October) Using the Mann-Whitney U Test, 1982-1996(Page 3 of 4)
REGION III1982 1983 1984 1985 1986 1987 1988 1989 1990 1991 1992 1993 1994 1995
1983 U'=43.5P < 0.005
1984 U'= 36.5 U = 117.0P >0.20 P <0.001
1985 tr=5.0 U=8.0 U'=11.0,P >0.20 P > 0.20
1986 U = 77.0 U = 195.5 U =216.0 U =22.0P sO.2O P < 0.001 p< 0.05 P sO.10
1987 U = 54.5 U = 173.0 U= 159.0 U=19.0 U'= 284.0p>0.2O P <0.001 P >0.20 P sO.2O p<0.10
1988 U=13.0 U = 43.0 U = 38.0 U =4.0 U'= 70.5 U·=56.0p>0.2O P < 0.005 P >0.20
,P >0.20 P > 0.20
1989 U'= 10.0 U = 25.5 U'=24.5 U =3.0 U·=54.0 U'=41.5 U'= 10.0p>0.2O p<O.02 P > 0.20 1 P <0.10 p>0.2O P >0.20
1990 U = 200.5 U = 596.5 U = 572.5 U =68.0 U'= 946.0 U = 732.0 U = 189.0 U = 154.0Z =0.66 Z= 4.60 Z= 1.18 Z= 1.68 Z=1.85 Z=0.51 Z= 0.40 Z = 1.47P > 0.20 P <0.001 p> 0.20 P <0.10 p<0.10 p > 0.20 P >0.20 P < 0.20
1991 U'= 25.0 U = 47.5 U'= 56.0 U =3.0 U'= 121.0 U'= 100.0 U'= 24.0 U'= 13.0 U'= 354.0psO.l0 P <0.02 p> 0.20 I P <0.001 p<0.02 P <0.20 P > 0.20 Z =2.96
p<O.OO5
1992 U'= 31.0 U = 74.5 U·=74.0 U=9.0 U'= 170.5 U'= 126.0 U'= 31.0 U'=14.5 U'= 477.5 U =34.5p< 0.20 P <0.001 P >0.20 t P < 0.001 P s 0.02 P <0.20 P > 0.20 Z =3.47 p>0.2O
p< 0.001
1993 U=114.5 U = 341.5 U = 338.5 U =37.0 U'= 520.0 U =425.5 U = 104.0 U = 84.5 U = 1,384.0 U=201.5 U = 271.5P > 0.20 P < 0.001 P <0.20 P < 0.20 Z=1.36 Z =0.56 P >.0.20 P > 0.20 Z =0.37 p<O.OO5 P < 0.001
P <0.20 p > 0.20 P > 0.20
1994 U =58.0 U = 182.5 U = 171.0 U =21.0 U'= 298.5 U = 217.5 U = 58.0 U = 44.5 U'= 747.5 U = 106.5 U = 139.00 U'= 437.5p> 0.20 P <0.001 p>0.2O p<0.10 Z=1.63 p> 0.20 P > 0.20 P >0.20 Z =0.32 p<0.02 p<O.OI Z= 0.43
P <0.05 P > 0.20 p> 0.20
1995 U = 189.5 U = 577.5 U =555.5 U =63.0 U'= 898.5 U = 708.5 U =189.5 U = 144.5 U'= 2,249.5 U = 343.0 U =436.5 U'= 1,322.5 U =710.5Z = 0.54 Z = 4.58 Z = 1.18 Z=1.53 Z=1.29 Z = 0.49 Z =0.54 Z= 1.32 Z =0.02 Z= 2.94 Z = 2.27 Z= 0.23 Z=0.17P > 0.20 P <0.001 P > 0.20 p<0.2O P <0.20 P > 0.20 P > 0.20 P <0.20 p> 0.20 p<O.OO5 P <0.05 p> 0.20 p'> 0.20
1996 1;)'= 10.5 U = 34.5 U =29.5 U =4.0 U'=84.0 U'= 42.5 U'= 11.0 U =8.0 U'= 161.0 U =20.0 U = 28.5 U'= 95.0 U'= 45.5 U'= 155.5P >0.20 P <0.02 p> 0.20 1 P <0.20 P > 0.20 p > 0.20 P > 0.20 Z =0.60 P <0.20 p<0.2O p> 0.20 p>0.2O Z =0.58
P > 0.20 P >0.20
63

Table 13Interyear Correlation (nonparametric) of the Median Water Depths at Random Bowhead
Whale Sightings (September-October) Using theMann-Whitney U Test, 1982-1996(page 4 of 4)
ALL THREE REGIONS (COMBINED)1982 1983 1984 1985 1986 1987 1988 1989 1990 1991 1992 1993 1994 1995
1983 U'=882.0Z=5.21p<O.OOI
1964 U'= 1,138.5 U = 717.5Z =3.04 Z=4.17P <0.005 P <0.001
1985 U'= 316.5 U =249.5 U = 297.5Z=0.71 P <0.001 P >0.20P >0.20
1988 U =898.0 U = 766.0 U = 1,043.0 U = 314.0Z =0.76 Z=5.19 Z=3.33 p <0.20p >0.20 p < 0.001 p<O.OOl
1987 U'= 798.5 U =666.5 U =609.5 U = 223.0 U:=760.5Z =0.93 Z =4.77 Z=2.10 P > 0.20 Z= 1.53p >0.20 p <0.001 p<O.05 p<0.2O
1988 U'='414.0 U =245.5 U·=248.0 U'= 104.5 U'= 356.5 U'=291.0Z =2,60 P <0.002 p > 0.20 p>0.2O p<O.02 p<0.10p<O.Ol
1989 U =598.0 U = 417.5 U =617.0 U = 198.5 U =457.0 U = 460.5 U = 214.0Z =2.69 p< 0.001 p<O.OOl P <0.005 p<0.2O P <0.002 P <0.001P <0.005
1990 U'= 2,473.5 U = 1,729.5 U = 1,949.5 U'=682.5 U'=2,227.5 U'= 1,717.5 U = 674.5 U'= 1,353.0Z =2.85 Z =8.10 Z = 1.47 Z = 1.12 Z =2.95 Z=l.54 Z= 1.03 Z=4.21p <0.005 P <0.001 P <0.20 p > 0.20 p<O.OO5 P <0.20 P >0.20 P <0.001
1991 U·=503.0 U = 213.0 U'= 373.5 U'= 134.5 U'=446.0 U'= 377.0 U'= 135.0 U'= 236.0 U'= 999.0Z =4.33 P <0.05 p<O.Ol P <0.02 p<O.OOI P <0.001 p s 0.01 P <0.001 Z=4.33p<O.OOI P < 0.001
1992 U·=663.0 U = 368.5 U·=410.0 U'= 170.5 U'= 578.0 U'=470.5 U'= 150.5 U'= 325.5 U'= 1,185.5 U = 193.5Z = 3.88 p<O.OOI p>0.2O p<0.10 p< 0.001 P < 0.005 p>0.2O p<O.OOI Z= 2.85 P <0.01P <0.001 p< 0.005
1993 U'= 1,614.5 U = 1,545.5 U = 1,981.0 U =568.0 U'= 1,560.5 U = 1,381.5 U =679.5 U'= 1,007.0 U = 4,200.5 U =866.5 U= 1,111.0Z=O.OI Z =5.72 Z =3.38 Z =0.94 Z =0.95 Z =0.96 Z = 2.25 Z =2.77 Z =3.00 Z =4.69 Z = 3.75p > 0.20 P <0.001 P <0.001 P > 0.20 p> 0.20 p >0.20 p <0.05 p<O.Ol p<O.OO5 p <0.001 P < 0.001
1994 U'=754,O U =523.0 U = 594.5 U'= 190.0 U'=682.0 U'= 510.5 U = 205.5 U·=410.0 U'= 1,190.0 U = 293.5 U = 347.0 U'= 1,267.5Z=2.09 Z =4.13 Z=1.08 P > 0.20 Z = 2.24 Z =0.96 P >0.20 P <0.001 Z=O.Ol P < 0.001 P <0.05 Z= 1.93P <0.05 P <0.001 p> 0.20 p<O.05 p>0.2O p>0.2O p<0.10
1995 U'= 2,945.5 U = 2,516.5 U =3,109.0 U =830.5 U'=2,837.0 U =2,117.0 U = 1,101.0 U'= 1,814.5 U =6,708.0 U = 1,432.0 U = 1,801.0 U'= 5,144.5 U = 1,979.5Z =0.94 Z=5.71 Z=2.88 Z=0.13 Z= 1.81 Z =0.23 Z=2.10 Z=3.70 Z = 2.73 Z=4.51 Z=3.16 Z= 1.15 Z = 1.41p> 0.20 p<O.OOI p<O.OO5 p> 0.20 p<0.10 p> 0.20 p<O.05 P < 0.001 p<O.OI p<O.OOI p< 0.002 P > 0.20 P < 0.20
1996 U·=561.5 U = 465.5 U =564.5 U = 153.5 U'=535.5 U'=380.0 U = 201.0 U·=339.0 U =1,213.0 U =266.5 U = 332.0 U'=962.0 U =381.0 U'= 1,479.5Z =0.89 Z = 4.40 Z=1.69 P > 0.20 Z = 1.46 1 P <0.10 P s 0.002 Z=1.46 P <0.001 P < 0.02 Z=O.83 Z = 0.97 Z=O.22p > 0.20 P < 0.001 p<0.10 p<020 P <0.20 p> 0.20 p> 0.20 p>0.2O
1 Insufficient sample size.
64


c. Potential Responses of Bowheads to Survey Aircraft
During the 1996 field season, there were no sightings of bowhead whales for which definite responses tothe survey aircraft were apparent. Althouqhit was not possible to determine if any responses would havebeen a direct result of overflight by survey aircraft, sudden overt changes (e.g., an abrupt dive, coursediversion, or cessation of behavior ongoing) in whale behavior were looked for.
D. Potential Effect of General ice Cover on WPUE (1979-1996)
During September and October (combined) 1996, there were 114 bowhead whales observed during 123.54hr for a relative abundance of 0.93 WPUE in Survey Blocks 1 through 12, with 1.18 WPUE duringSeptember and 0.19 WPUE during October (Table 15). Bowhead relative abundance in 1996 wasconsidered representative of that for more severe ice years, possibly due to a higher proportion of surveyeffort over sea-ice concentrations that were heavier than for the study area as a whole.
The years 1980, 1983, 1988, and 1991 were categorized as having "heavy" ice cover during the navigationseason. These 4 years are ranked as having the severest seasonal ice for the years 1979 through 1995and show distances ranging from 10 to 25 nm between Point Barrow and the five-tenths ice concentrationon 15 September (USDOC, NOAA, National Ice Center/USDOD, Navy, Naval Ice Center, 1997).
The years 1984, ,1985, and 1992, categorized as having "moderate" ice cover during the open-water season,are ranked next in seasonal ice severity for the years 1979 through 1995 and show distances ranging from50 to 75 nm between Point Barrow and the five-tenths ice concentration on 15 September (USDOC, NOAA,National Ice Center/USDOD, Navy, Naval Ice Center, 1997).
The years 1979, 1981, 1982, 1986, 1987, 1989, 1990, 1993, 1994, 1995, and 1996, categorized as having"light" ice cover during the open-water season, are ranked as having the least-severe seasonal ice for theyears 1979 through 1996 and show distances ranging from 50 to 185 nm between Point Barrow and the five-tenths ice concentration on 15 September (USDOC, NOAA, National Ice Center/USDOD, Navy, Naval IceCenter, 1997).
Table 15 shows a low relative abundance of bowhead whales in the primary study area (Survey Blocks 1-12)during September and October (combined) for years of heavy ice cover (0.46 WPUE), a middle-range valuefor moderate ice years (1.55 WPUE), and a high value for light ice years (2.04 WPUE). A Kruskal-Wallissingle-factor analysis of variance by ranks (Zar, 1984) showed that ice-year categories were significantlyrelated (p <0.05) to annual relative abundance.
Although cumulative values for the three ice-year categories (Table 15) and the Kruskal-Wallis test (p :'>
0.010) suggest a relationship to annual relative abundance, it is clear that WPUE value is not totallydependent on general ice coverage. While the mean WPUE for heavy ice years (x = 0.46, SO = 0.15, n =4) appears separable from other ice-year categories, the SO of the mean WPUE for light ice years (5< = 2.20,SO = 1.33, n = 11) overlaps that for moderate ice years (x = 1.53, SO = 0.66, n = 3). Likewise, anonparametric Tukey-type test (Zar, 1984) forcomparing unequal sample sizes showed that while relativeabundance of bowheads in light ice years was significantly different (p <0.05) from that in heavy ice years,neither of these two categories was significantly different from relative abundance in moderate ice years.A separate comparison of ice concentrations at the location of bowhead slqhtinqs (1981-1986) with theobservabiHty of whales showed that sighting distance was significantly affected by local ice cover only in1982 and 1'983 (Ljungblad et aI., 1987).
Even though the study should not be used to estimate total whale population, the relative abundance ofbowhead whales was compared between years to obtain a rough indication of any gross temporal trends.In order to control one particular bias against extreme variation in ice severity between years, the WPUEwas compared during September, October, and both months combined (Table 15) for only those years oflight ice (1979, 1981, 1982, 1986, 1987, 1989, 1990, 1993, 1994, 1995, and 1996). The data showed weaktendencies for bowhead relative abundance to increase from 1979 through 1995, but the correlations were
67

Table 15Relative Abundance (WPUE) of Bowhead Whales within the Primary Study Area
(Survey Blocks 1-12) during September and October',by Year and General Ice Coverage, 1979-1996
September October Total (Sep-Oct)Year Hours BH WPUE Hours BH WPUE 'Hours BH WPUE
1979 51.80 60 1.16 79.99 130 1.63 131.79 190 1.44
19802 76.41 30 0.39 50.72 12 0.24 127.13 42 0.33
1981 70.28 231 3.29 46.00 54 1.17 116.28 285 2.45
1982 77.91 283 3.63 35.19 29 0.82 113.10 312 2.76
19832 101.73 72 0.71 41.48 17 0.41 143.21 89 0.62
19843 73.64 216 2.93 63.49 85 1.34 1,37.13 '301 2.19
19853 67.39 52 0.77 58.22 57 0.98 125.61 109 0.87.
1986 100.21 65 0.65 51.96 35 0.67 152.17 100 0.66
1987 90.07 61 0.68 77.07 76 0.99 167.14 137 0.82
19882 64.96 21 0.32 55.49 19 0.34 120.45 40 0.33
1989 69.84 141 2.02 38.61 149 3.86 108.45 290 2.67
1990 54.85 401 7.31 41.37 77 1.86 96.22 478 4.97
19912 38.36 9 0.23 51.13 40 0.78 89.49. 49 0.55
19923 104.28 63 0.60 90.52 234 2.59 194.80 297 1.52
1993 87.33 ' 217 2.48 77.89 136 1.75 165.22 353 2.14
1994 67.55 183 2.71 53.24 9 0.17 120.79 192 1.59
1995 91.72 413 4.50 19.33 7 0.36 111.05 420 3.78
1996 91.49 108 1.18 32.05 6 0.19 121.96 114 0.93

Table 15Relative Abundance (WPUE) of Bowhead Whales within the Primary Study Area
(Survey Blocks 1-12) during September and October',by Year and General Ice Coverage, 1979-1996
(Continued)
Ice CoverageSeptember
Hours BH WPUEOctober
Hours BH WPUETotal (Sep-Oct)
Hours BH WPUE
HeavyIce Years2(L) 281.46 132 0.47 198.82 88 0.44 480.28 220 0.46
ModerateIce Years3(L) 245.31 331 1.35 212.23 376 1.77 457.54 707 1.55
LightIce Years (L) 853.05 2,163 2.54 552.70 708 1..28 1,404.17 2,871 2.04
1 After Ljungblad et al. (1987), Moore and Clarke (1992), and Treacy (1988, 1989, 1990, 1991, 1992,1993, 1994, 1995, 1996).
2 1980, 1983, 1988, and 1991 were considered years of heavy ice coverage.3 1984, 1985. and 1992 were considered years of moderate ice coverage.
69

not statistically significant. This result is likely influenced by betWeen-year variations in migration timing, thelarge size of the study area, as well as day-to-day variations in ice cover and other environmental conditionsaffecting observer visibility.
Eo Management Use of Real-Time Field Information
The MMS issues various types of permits to industry for gas and oil exploration, including vessel geophysicalpermits for on-water exploration using an array of deep-seismic airguns; vessel geological-geophysicalpermits for shallow-seismic exploration using an airgun; on-ice geophysical permits using VIBROSEIStechnology; both vessel and on-ice geological permits for obtaining core samples; and permits to drill for gasand oil.
In Winter and Spring 1996, there was one over-ice seismic program in the Beaufort Sea in Federal waters.The program took place east of Prudhoe Bay (24 March-17 April) and used vibrators as an energy source.There was also one shallow-coring program in Federal waters in the eastern Beaufort Sea in April. Therewas one marine-seismic program northwest of Prudhoe Bay during the summer of 1996 (24 July-19September).
In general, to prevent potential operational effects on subsistence whaling, any geophysical vesselexplorations permitted during the fall follow stringent restrictions-including a provision to stop seismicoperations when whales are visible from the vessel-as the bowhead whale migration progresses throughthe area of operations. For any explorations that occur during the fall, daily summaries of survey informationare transferred from the field to Anchorage for use by MMS Resource Evaluation and by NMFS inimplementing areawide permit restrictions on high-energy seismic operations during the whale migration.
There were no drilling operations, with associated helicopter and vessel support, in the Beaufort Sea in1996. In general, during any fall drilling operations, daily summaries of field information from this survey,and other arctic surveys being conducted concurrently, are transferred by the MMS Team Leader to MMSField Operations in Anchorage. The MMS and NMFS review daily reports to determine the distributionalpatterns of bowheads in the vicinity of oil and gas industry activities and the timing of the bowhead whalemigration, especially the "end of the migration" past any drill sites.
Project ice data were transmitted daily to the U.S. Navy, Naval Ice Center, for their use in ground-truthingsatellite imagery. In general, sighting data are used by several management groups to monitor the progressof the overall fall migration of bowhead whales across the Alaskan Beaufort Sea and to determine theposition of their overall migratory corridor relative to shore. Data from previous surveys continue to be usedby MMS in writing Environmental Impact Statements (EIS) and Environmental Assessments and ininterpreting the results of site-specific studies.
F. Field Coordinations and Information Support
During the field season, we coordinated with the Alaska Eskimo Whaling Commission (AEWC), Barrow,Alaska; the BP Exploration (Alaska) Inc. (BPXA) Northstar site-specific aerial survey team; WhalersCommunication Center, Deadhorse, Alaska; NMFS, Anchorage, Alaska; and North Slope Borough (NSB),Department of Wildlife Management, Barrow, Alaska. Accompanying the project this year and activelyparticipating in selected survey flights were John GolI, MMS Acting Alaska Region Director (Flights 22 and23); Mary Catherine Ishee, USDOI Solicitor (Flight 16); and George Valiulis, MMS Environmental Specialist(Flight 32).
Selected BWASP information-support activities during the year included (1) providing data summaries tovarious requesting agencies and private-sector organizations, including AEWC, BPXA, and Northstar EISDevelopment Project; (2) providing our Fall-1995 report, along with project descriptions, on the Alaska OCSRegion MMS Internet web site (http://www.mms.gov/omm/alaska); (3) photographing Dinkum Sands (nearDeadhorse, Alaska) for use by the MMS Leasing Activities Section and the U.S. Department of Justice; (4)providing an interview about project activities for a radio station (KBRW) in Barrow, Alaska; (5) authoring
71

an article entitled "MMS Alaska Arctic Environmental Studies: Melding Science and Traditional EcologicalKnowledge for Future Offshore Oil. and Gas Development Decisions" submitted to the Arctic ScienceJournal; (6) providing the text for an article entitled "Global Positioning Technology Helps Track People,Aircraft, and Whales" in USDOI, People, Land, & Water (Vol. 4, No.1); (7) providing a set of previous projectreports to the Seal Conservation Society, Aberdeenshire, United Kingdom, for use in their society's SealReference Database; (8) providing digital data and technical support to a re-analysis by Mr. Jeremy Daviesof the Fall-1993 bowhead whale distribution in the vicinity of the Kuvlum drill site; and (9) serving as Co-Chair (With Dr. Tom Albert, NSB) at an Arctic Seismic Synthesis and Mitigating Measures Workshop, Barrow,Alaska, and presentinq a talk there entitled "The Beaufort Sea Bowhead Whale Migration."
72
V. LITERATURE CITED
Batschelet, E. 1972. Recent Statistical Methods for Orientation Data. In: Animal Orientation andNavigation, S.R Galler, K. Schmidt-Koenig, G.J. Jacobs, and RE. Bellevue, eds. Washington, D.C.:National Aeronautics and Space Administration, pp. 41-61.
Brower, WA, R.G. Baldwin, C.N. Williams, J.L. Wise, and L.D. Leslie. 1988. Climatic Atlas of the OuterContinental Shelf Waters and Coastal Regions of Alaska, Volume III. OCS Study MMS 87-0013. USDOI,MMS, Alaska OCS Region, 524 pp.
Chapman, C.F. 1971. Piloting, Seamanship and Small Boat Handling. New York, NY: Hearst Books, 640pp.
Cochran, W.G. 1963. Sampling Techniques. New York, NY: J. Wiley, 413 pp.
Endangered Species Act of 1973, as amended. 16 USC 1531-1543.
Estes, J.A. and J.R. Gilbert. 1978. Evaluation of an Aerial Survey of. Pacific Walruses (Odobenus rosmarusdivergens). Journal of the Fisheries Research Board of Canada 35:1,130"1,140.
Houghton, J.P., D.A. Segar, and J.E. Zeh. 1984. Beaufort Sea Monitoring Program. In: Proceedings ofa Workshop (September 1983) and Sampling Design Recommendations. Prepared by Dames andMoore, Seattle, WA, for the OCS Environmental Assessment Program, Juneau, AK, 111 pp. .
LaBelle, J.C., J.L. Wise, R.P. Voelker, RH. Schulze, and G.M. Wohl. 1983. Alaska Marine Ice Atlas. ArcticEnvironmental Information and Data Center, University of Alaska, Anchorage, AK, 302 pp,
LGL Ecological Research Associates, Inc. 1987. Importance of the Eastern Alaskan Beaufort Sea toFeeding Bowhead Whales, 1985-86, W.J. Richardson, ed. OCS Study MMS 87-0037. Prepared forUSDOI, MMS, Alaska OCS Region.
Ljungblad, DK, S.E. Moore, J.T. Clarke, and J.C. Bennett. 1987. Distribution, Abundance, Behavior andBioacoustics of Endangered Whales in the Alaskan Beaufort and Eastern Chukchi Seas, 1979-86. OCSStudy MMS 87-0039. Anchorage, AK: USDOI, MMS, Alaska OCS Region, 391 pp.
Marine Mammal Protection Act of 1972. 16 USC 1361-1407.
Moore, S.E. and J.T. Clarke. 1992. Distribution, Abundance and Behavior of Endangered Whales in theAlaskan Chukchi and Western Beaufort Seas, 1991: With a Review 1982-91. OCS Study MMS 92-0029.Anchorage, AK: USDOI, MMS, Alaska OCS Region, 211 pp.
National Environmental Policy Act of 1969. 42 USC 4321-4347.
Norton, D. and G. Weller. 1984. The Beaufort Sea: Background, History, and Perspective. In: TheAlaskan Beaufort Sea, P. Barnes, D. Schell, and E. Reimnitz, eds. Orlando, FL: Academic Press, Inc.,466 pp.
Outer Continental Shelf Lands Act of 1953, as amended in 1978. 43 USC 1331-1356 and 1801-1866.
Treacy, S.D. 1988. Aerial Surveys of Endangered Whales in the Beaufort Sea, Fall 1987. oes Study MMS88-0030. Anchorage, AK: USDOI, MMS, Alaska oes Region, 141 pp. '
Treacy, S.D. 1989. Aerial Surveys of Endangered Whales in the Beaufort Sea, Fall 1988. oes Study MMS89-0033. Anchorage, AK: USDOI, MMS, Alaska oes Region, 101 pp. . '
Treacy, S.D. 1990. Aerial Surveys of Endangered Whales in the BeautortSea, Fall 1989. oes Study MMS90-0047. Anchorage, AK: USDOI, MMS, Alaska OCS Region, 104 pp.
73

Treacy, S.D. 1991. Aerial "Surveys of Endangered Whales in the Beaufort Sea, Fall 1990. OCS Study MMS91-0055. Anchorage, AK: USDOI, MMS, Alaska OCS Region, 107 pp.
Treacy, S.D. 1992. Aerial Surveys of Endangered Whales in the Beaufort Sea, Fall 1991. OCS Study MMS92-0017. Anchorage, AK: USDOI, MMS, Alaska OCS Region, 92 pp.
Treacy, S.D. 1993. Aerial Surveys of Endangered Whales in the Beaufort Sea, Fall 1992. OCS Study MMS93-0023. Anchorage, AK: USDOI, MMS, Alaska OCS Region, 135 pp.
Treacy, S.D. 1994. Aerial Surveys of Endangered Whales in the Beaufort Sea, Fall 1993. OCS Study MMS94-0032. Anchorage, AK: USDOI, MMS, Alaska OCS Region, 132 pp.
Treacy, S.D. 1995. Aerial Surveys of Endangered Whales in the Beaufort Sea, Fall 1994. OCS Study MMS95-0033. Anchorage, AK: USDOI, MMS, Alaska OCS Region, 116 pp.
USDOC, NOAA, NMFS. 1982. Endangered Species Act, Section 7 Consultation - Biological Opinion, Oiland Gas Lease Sale 71 (Diapir Field). 19 May 1982. Washington, D.C.
USDOC, NOAA, NMFS. 1983. Endangered Species Act, Section 7 Consultation - Biological Opinion, Oiland Gas Leasing and Exploration - Diapir Field Lease Offering (Sale 87). 19 December 1983.Washington, D.C.
USDOC, NOAA, NMFS. 1987. Endangered Species Act, Section 7 Consultation - Biological Opinion, Oiland Gas Leasing and Exploration - Beaufort Sea Sale 97. 20 May 1987. Washington, D.C.
USDOC, NOAA, NMFS. 1988. Endangered Species Act, Section 7 Consultation - Biological Opinion, Oiland Gas Leasing and Exploration - Arctic Region. 23 November 1988. Washington, D.C.
USDOC, NOAA, National Geophysical Data Center. 1988. Data Announcement 88-MGG-02, Digital Reliefof the Surface of the Earth, Boulder, CO.
USDOC, NOAA, National Ice Center/USDOD, Navy, Naval Ice Center. 1997. Seasonal Outlook, Sea IceConditions for the Alaskan North Coast, Summer 1997. Washington, D.C., 5 pp.
USDOD, Navy, Naval Hydrographic Office. 1956. Aerial Ice Reconnaissance and Functional Glossary ofIce Terminology. Hydrographic Office Publication No. 609,14 pp.
USDOI, MMS. 1979. State of Alaska, Department of Natural Resources; Federal/State Joint Beaufort SeaOil and Gas Lease Sale BF, November 7, 1979 (44 FR 64752).
USDOI, MMS. 1982. Memorandum from Director, BLM, to Secretary of the Interior, dated 30 April 1982;subject: Decision on the Modification of the Seasonal Drilling Restriction.
USDOI,MMS. 1984. Outer Continental Shelf, Diapir Field, Oil and Gas Lease Sale 87, July 23,1984 (49FR29726).
USDOI, MMS. 1988. Outer Continental Shelf, Beaufort Sea, Oil and Gas Lease Sale 97, February 12,1988(53 FR 4356).
USDOI, MMS. 1991. Outer Continental Shelf Beaufort Sea Oil and Gas Lease Sale 124, May 24, 1991 (56FR 23966). ".
USDOI, MMS. 1995: ProjectManagement Plan, MMS Fall 1995 Bowhead Whale Aerial Survey Project,June 1995. Anchorage, AK: USDOI, MMS, Alaska OCS Region, 17 pp.
Zar, S.H. 1984. Biostatlstical Analysis. Englewood Cliffs, NJ: Prentice Hall, Inc., 620 pp.
74

APPENDIX A
BOWHEAD WHALE DENSITIES

BOWHEAD WHALE DENSITIES
This appendix presents estimated bowhead whale densities in the Beaufort Sea for the period 1 Septemberthrough 9 October 1996. Present survey goals do not include estimation of absolute population abundance;therefore, raw density values found in this report were not adjusted to account for SUbmergence of whales,sighting variability, etc., and are presented only for relative visual comparison with similarly calculated valuesfrom previous survey reports. Also, sample sizes for determining density inindivJdual survey blocks wereconsidered too small to stratify by category (sea state, ice cover, etc.) or to make statistical correlationshaving real biological significance.
METHODS
A computer program-DENSiTY-was used to calculate raw density estimates for survey blocks previouslyshown for the Beaufort Sea (Fig. 1). The program was based on strip-transect methodologies that use onlysightingsmade on random-transect legs (Estes and Gilbert, 1978) and that were within a predetermineddistance from the aircraft (Hayne, 1949). Distance from the transect line was calculated trigonometricallyfrom the altitude of the survey plane at the time of sighting and the clinometer angle recorded for each initialsighting location. Only endangered whale sightings within 1 km of random-transect legs were used to derivedensity estimates. The number of sightings made from project aircraft decreased markedly much beyondthat distance, with 69 percent of sightings from the Twin Otter made within 1 km of the trackline. The basicassumptions for use of this formula, and the degree to which these assumptions were met in the Fall-1996and previous MMS-funded arctic whale surveys, are incorporated by reference (Ljungblad et aI., 1987:Appendix B).
A-1
RESULTS
Densities by survey block were estimated as the number of bowhead whales per 100 km2 (Table A-1).
During the first half of September, there were no Beaufort Sea blocks for which more than 1a percent of thearea was surveyed, and no bowheads were observed within 1 km of the randomly generated transect line(Table A-1 ):.
During the second half of September, over 10 percent of the area was surveyed for Blocks 1, 2, 4, 6, and11. Of these particular blocks, 8 bowhead whales were observed in Block 1 within 1 km of the randomlygenerated transect line, for an estimated density of 0.36 per 100 km2
; 2 whales were observed in Block 4,for an estimated density of 0.10; 1 whale was observed in Block 2, for an estimated density of 0.08; arid nowhales were observed in Blocks 6 and 11, for estimated densities of 0.00. Eleven bowhead whales wereobserved within 1 km of the transect line in other Beaufort Sea blocks during this period (Table A-1).
From 1 through 9 October, over 10 percent of the area was surveyed for Blocks 3, 6, and 11. Of theseparticular blocks, 3 bowhead whales were observed in Block 11 within 1 km of the randomly generatedtransect line, for an estimated density of 0.19 per 100 krn": and no whales were observed in Blocks 3 and6, for estimated densities of 0.00. No bowhead whales were observed within 1 km of thetransect line inother Beaufort Sea blocks during this period (Table A-l). .

Table A-1Semimonthly Estimates of Bowhead Whale Densities, by Survey Block, Fall 1996
(strip width = 2 km)
Block No.(by Semi- Block Transect Percent No. of No. of Densitymonthly Area Distance of Area Transect Percent of Transects Whales (Whales/Period) (krn") (km) Surveyed Time (hr) Total Time Flown Observed 100 km 2)
1-15 Sep
3 11,475 134 2.34 0.63 23.19 2 0 0.005 9,481 421 8.88 1.96 72.45 5 0 0.007 8,10,9 22 0.54 0.11 4.09 1 0 0.00
11 10,358 1 0.03 0.01 0.27 1 0 0.00
16-30 Sep
1 10,222 1,099 . 21.50 5.04 20.06 32 8 0.362 6,672 617 18.50 2.78 11.06 19 1 0.083 11,475 559 9.74 2.45 9.78 10 2 0.184 5,714 958 33.53 4.50 17.94 24 2 0.105 9,481 197 4.16 0.97 3.85 4 1 0.256 8,109 789 19.46 3.69 14.71 15 0 0.009 9,753 1 0.02 0.00 0.02 3 0 0.00
10 10,358 72 1.39 0.32 1.28 2 0 0.0011 10,358 809 15.61 3.64 14.49 12 0 0.0012 11,163 388 6.95 1.70 6.76 6 8 1.03
12N 11,453 1 0.01 0.00 0.01 1 0 0.00
1-9 Oct
1 10,222 309 6.04 1.42 9.03 7 0 0.002 6,672 319 9.57 1.49 9.47 6 0 0.003 11,475 776 13.53 3.66 23.31 14 0 0.004 5,714 274 9.60 1.26 8.01 6 0 0.006 8,109 443 10.93 2.01 12.78 6 0 0.009 9,753 0 0.01 0.00 0.01 1 0 0.00
10 10,358 2 0.05 0.01 0.07 1 0 0.0011 10,358 780 15.06 3.60 22.92 14 3 0.1912 11,163 457 8.19 2.23 14.18 6 0 0.00
12N 11,453 4 0.08 0.02 0.15 1 0 0.00
A-2

LITERATURE CITED
Estes, J.A. and J.R. Gilbert. 1978. Evaluation of an Aerial Survey of Pacific Walruses (Odobenus rosmarusdivergens). Journal of the Fisheries Research Board of Canada 35:1,130-1,140.
Hayne, D.W. 1949. An Examination of the Strip Census Method for Estimating Animal Populations. Journalof Wildlife Management 13:145-157.
Ljungblad, DK, S.E. Moore, J.T. Clarke, and J.C. Bennett. 1987. Distribution, Abundance, Behavior andBioacoustics of Endangered Whales in the Alaskan Beaufort and Eastern Chukchi Seas, 1979-86. OCSStudy MMS 87-0039. NOSC Technical Report 1177 prepared for USDOI, MMS, Alaska OCS Region,391 pp.
A-3

APPENDIX B
DAILY FLIGHT SUMMARIES

CAlLY FLIGHT SUMMARIES·
This appendix consists of maps for Flights 1 through 34 that depict aerial surveys flown over the study areafrom 1 September through 9 October 1996 aboard the Twin Otter aircraft. Daily maps show survey tracksand the initial position of marine mammal sightings.
A comparison of daily flight maps can be made on a visual basis over the period.of the field season toevaluate ongoing patterns of marine mammal distribution and aircraft coverage. Each map shows the flighttrack as a line drawn through position updates recorded on the aircraft computer system. Each animalsighting is marked with a species symbol on the flight-track plot. The symbols used can be keyed out usingthe species legend found on each map; Positional and other data for each sighting of bowhead whales aresummarized in Table B-1. - -
EH

Table B-1Selected Sighting Data for Bowhead Whales Observed, Fall 1996
(Page 1 of 3)
Flight SightingNo. Da Latitude Lon itude Cue Behavior1 2 Sep 70°25.5 146°47.3 body slap 10 271 2 Sep 70°22.8 14r03.2 body rest 240° 10 151 2Sep 70°22.8 147°03.2 body swim 27° 1 151 2 Sep 70°24.5 14r02.4 body feed 340° 1 181 2 Sep 70°25.4 14r04.9 body rest 10 181 2 Sep 70°25.9 14rOO.4 body swim 50° 10 181 2Sep 70°30.2 14r03.5 body mill 5 331 2Sep 70°36.6 147°40.5 body dive 240° 10 291 2Sep 70°35.1 14r39.2 body swim 300° 10 291 2Sep 70°32.9 14r41.9 body swim 10 132 5Sep 70°40.0 146°13.9 body swim 70° 15 40
OJ 5 8Sep 70°24.9 146°47,3 body mill 10 27II\) 5 8Sep 70°30.2 145°04.4 body cow with calf 15 42
6 9Sep 70°23.1 142°45.4 body swim 40 596 9Sep 70°12.1 142°10.4 body swim 210° 30 497 10 Sep 70°12.1 142°01.3 body swim 270° 10 537 10 Sep 70°12.8 142°02.4 body swim 270° 10 537 10 Sep 69°54.9 140°55.5 body swim 300° 10 317 10 Sep 70°19.3 143°08.0 body swim 260° 85 518 11 Sep 71°05.8 153°19.9 body swim 260° 0 139 12 Sep 71°27.7 156°30.1 blow swim 0 739 12 Sep 71°27.7 156°30.1 body swim 300° 0 739 12 Sep 71°30.5 156°13.0 body swim 330° 0 1089 12 Sep 71°25.4 156°11.7 body rest ·0 99 12 Sep 71°28.1 155°46.0 body swim 70° 0 169 12 Sep 71°13.7 154°33.5 splash swim 90° 0 169 12 Sep 71°13.9 154°31.0 body swim 330° 0 16

--~ _._---_. __ . '. -~---------
Table B-1Selected Sighting Data for Bowhead Whales Observed, Fall 1996
(Page 2 of 3)
Flight SightingNo. Da Latitude Lon itude Cue Behavior10 13 Sep 70°11.6 141°27.9 body dive 50 4913 16 Sep 70°12.3 141°44.4 blow swim 50 5513 16 Sep 70°12.4 141°44.6 blow swim 240° 50 5513 16 Sep 70°11.7 141°41.8 body swim 190° 50 4813 16 Sep 70°00.9 141°16.3 splash swim 330° 40 4013 ,16 Sep 70°00.8 141°15.0 body dive 80° 40 4015 19 Sep 70°26.4 14]019.3 body mill 90 1515 19 Sep 70°21.9 143°39.8 body rest 330° 50 .' 3515 19 Sep 70°21.9 143°36.2 body rest 70 3515 19 Sep 70°21.9 143°37.9 body mill 70 3516 20Sep 70°30.5 146°15.9 blow swim 60° 50 ·37
to 16 20Sep 70°30.8 146°18.5 blow swim 340° 70 37Iw 16 20Sep 70°29.9 146°15.9 slick swim 290° 70 37
16 20Sep 70°34.2 146°34.9 body rest . 330° '60 3816 20Sep 70°33.2 146°34.6 body swim 160° 80 3817 20'Sep 70°49.9 148°23.0 blow swim .220° , 80 2417 '20 Sap 70°49.9 148°23.0 blow swim 280° 80 24
·21 26Sep 71°13.6 152°08.0 blow swim 210° 70 .4221 26Sep 71°25.2 155°24.8 blow rest 40° '5 1821 26 Sep 71°26.8 155°39.0 splash slap 120° 20 1821 26'Sep 71°25.9 155°37.9 body feed 20 1821 26 Sep 71°25.7 155°39.3 body swim 200° ,15 1821 ' 26 Sep 71°25.6 155°40.5 body swim 30 15?1 2 26 Sep 71°25.1 155°44.1 blow feed, r 30 2
21 26 sep. 71°24.8, 155°42.5 splash swim1.-
30 15, ---<
21 26 Sep 71°25.1 155°42.9 body swim 30 1521 26 Sep 71°21.8 155°24.0 body _ mill 40 9

Table B-1Selected Sighting Data for Bowhead Whales Observed, Fall 1996
(Page.3 of 3)
Flight Total DepthNo. Da Whales Latitude Lon itude Behavior m21 26 Sep . 3 71°22.8 155°18.6 swim 40 11,21 26Sep 2 71°22.5 155°10.9 swim 1 40 1121 26Sep 1 71°03.8' 154°05.6 rest 270° 1 1522 27Sep 1 70°50.7 148°44.3 rest 60° 85 2622 27Sep 2 70°52.1 149°08.4 dive 330° 85 2422 27 Sep 1 71°03.8 149°52.0 rest 90 2622 27 Sep 2 71°04.4 149°50.7 swim 360° 90 . 2622 27Sep 1 ' 71°03.0 149°51.3 swim 230° 90 2623 27 Sep 1 70°46.4 149°25.7 swim 230° 85 1823 27 Sep 1 71°06.7 150~16.2 dive 200° 90 3826 30Sep 1 70°51.7 14JC16.2 dive 200° 70 49
OJ 28 2 Oct 2 71°16.7 152°02.2 swim 270° 90 29I~ 30 5 Oct 1 71°08.7 150°07.4 rest 60° 85 44
30 ' 5 Oct 1 71°23.5 153°44.1 swim 330° 50 4030 5 Oct 1 71°23.8 153°19.9 dive 260° 85 6830 5 Oct 1 71°20.2 152°50.6 swim 220° 80 60
1 Not recorded.2 Repeat sighting.

. CamdenBay
DemarcationPt.
Alaska ~ 69~::J
+ -I I ~~ ~ ~ !;I!
NIf)
Beaufort Sea
II
r--------------
LEGEND
• Bowhead Whale * Ringed Seal
40 0
t> Belukha Whale () Pacific Walrus
& Unidentified Cetacean • Unident~ied Pinniped
• Bearded Seal ~ Polar Bear
40 Kilometers~!Iiiiiiiiiii~~!!"!I1 (approx.)
L- .__..._
Flight 1: 2 September 1996 Survey Track and Sightings
1 __ 'r- 73
72';
71
70

•••. N~ I/) g ~
+---+-~ . ~ ~. ~--+----+--------fl---+--
t,
72
Beaufort Sea -
~------- . --~I - ---r--~-~~~~-~-- \/ I I I' .\ : \
I I I \ \
Ir-~--~_ -I \ --\
I -----,--I "\ \I \ .
I \ \---~t_----l\ \
\\
71
70
Flight2: 5 September 1996 Survey Track and Sightings

mI....•
+-
72
Beaufort Sea
II
71
69
70
LEGEND
• Bowhead Whale ~ Ringed Seal
'" Belukha Whale. <> Pacific Walrus
.•• Unidentified Cetacean • Unidentified Pinniped
• Bearded Seal ~ Polar Bear
DemarcationPt.
.Alaska40 0
'. U!;
Flight 3: 6 September 1996 Survey Track and Sightings

tDI
00
~.,
CXlLO
'<tN
~ 5fLOLO 0 ~ ~ ~~ LO ~ 73
Beaufort Sea
72,----- -- -- --- - -- ...,I -----,-----,----,-- \
/ I I I 1 \I I I 1 1r-----_~------I _-I _---\I r """-_ I - - r I
I 1_-, I 1I L_I I _---~"\--- _ .l- \
'~ -.' - - -- ,Bay Colville OIi~tOk "; I I \\
Delta Pt. 0~-------- Nuiqsut Deadhorse \
71
LEGEND
• Bowhead Whale ~ Ringed Seal
l; Belukha Whale 0 Pacitic Walrus
.•• Unidentified Cetacean • UnidentWiedPinniped
• Bearded SealAlaska 6940 0
----co -~ --+--+-_._- I I -+- I + ILO
5f~ '<tN
~LO 0
~LOLO ~ ~~ ~
Flight 4: 7 September 1996 Survey Track and Sightings

(DIto
coll).•...
all)
+
Beaufort Sea
72
II
/
Harriso _Bay Colville
Delta
LEGEND
~ Ringed Seal
.~ Pacific Walrus
• Bowhead Whale Camden'Bay6 Belukha Whale
.•• Unidentified Cetacean • Unidentified Pinniped
~ Polar Bear• Bearded Seal
Alaska 6940 0--
"~
l8 '-+----+--- +-:g ----+----+------+;j!; N 0
ll) ll)
----------,+------+----+--+-~-+----+-~~~~
Flight 5: 8 September 1996 Survey Track and Sightings

ttlI....•.o
NIII Q'
III
Beaufort Sea "
II
Smith Bay
72
71
• Bowhead Whale ~ Ringed Seal
LEGEND
Alaska
/!" Belukha Whale 0 Pacitic Walrus
•• Unidentified Cetacean • Unident~ied Pinniped
• Bearded Seal ~ Polar Bear
40 0 40 Kilometers~5iiiiiiiiil""""'~""'! (approx.)---
DemarcationPt.
Flight 6: 9 September 1996 Survey Track and Sightings
HerschelIs.
«~ ~t4 z:::»\~
I
\
70
69

Beaufort Sea
OJI....•.....•.
,---- --- -- --- -- - --- -,r ,----,-----.------,-- \I , I I \
, I , I I I,.------~------I I _---\I ,-.., ---- r
, L _I I I I, - -. I I \.L_\ 1
\\\LEGEND
• Bowhead Whale ~ Ringed Seal
/:; Belukha Whale 0 Pacific WalrusHerschei
Is.c(~s
~ z:J\~I
\
DemarcationPt.••• Unidentified Cetacean • Unident~ied Pinniped
• Bearded Seal ~ Polar Bear
Alaska40 0
Flight 7: 10 September 1996 Survey Track and Sightings
72
:71
69
70

. ,.
Beaufort Sea
I~--II
--'""1----,-----~---I-- \, I I \, I \ \
---~------I . \ ----\,---, -----r-L_' I \1_..., I I \
, L_I ' __ ---,.. ' ---- 1-I I \
~--.;(th \
\
OJI...•.N
HarrisoBay Colville
Delta Pl~--------------, Nuiqsut
LEGEND
• Bowhead Whale ~ Ringed Seal
I:>.Belukha Whale 0 Pacific Walrus
••• Unidentified Cetacean • Unident~ied Pinniped
• Bearded SealAlaska
Flight 8: 11 September 1996 Survey Track and Sightings
72
70
69

OJI,,',....•...
oLO
+--+ +
Beaufort Sea
- -,~-~---r----~~~~-~---\I /. Ii' \
I I \ d .. \
- -:-~- - - - - -I __\ ,-'- --\/-.., --- rL _ I \ \
/ I I ' \.- --.. \I L-L ~t-----1
II ,\'""'- .."....---...d'A \
\70
69
NLO o
LO
Flight 9: 12 September 1996 Survey Track and Sightings

.•••Unidentified Cetacean • Unidenl~ied Pinniped
Alaska 69
NLO
Beaufort Sea
,,-- -- --- -- --,- --- - -- --,----,---~-~--~I-- \I ' , I I \
, , I I Ir - - - ~ - -f- - - - - - --"I J_ ~ __ \,. ,-.., - - - - - r-
L _ 1 I I, 1- -, I I'L_I 1
I\\
72
LEGEND
• Bowhead Whale ~ Ringed Seal
/; Belukha Whale () Pacific Walrus
• Bearded Seal
40 0--Flight 10: 13 September 1996 Survey Track and Sightings

ti:Jo·...•.
0'1
coLO
aLO
+ +-
Beaufort Sea
LEGEND
-- '--. -- --- --- ~ - - -- ...,I ..",.- -,- - -7 -/-r-'- - -,- - \I , I"" \ . \
I , I \ \ ,t~---~_~ II, \~_~-\.I ' ,- -, - - - - - r: ,. ,
, I L -I' I \ \---, \ \ \L-L __ --t---~~l
I \ \"I.... __ -----:;)". \
\70
72
71
• Bowhead Whale ~ Ringed SealFlaxman
Is,t> Belukha Whale ~ Pacitic Walrus
.•• Unidentified Cetacean • Unidentfied Pinnill@'jHerschel
Is,
<~ !i. 69~
I~;:) \0I,
!;I! ~~
• Bearded Seal
Alaska40 0
"'VLO
Flight 11: 14 September 1996 Survey Track and Sightings

r --
69
73 .
Beaufort Sea
I-~-- . --~----- --. -I I ----,-----.----:--1- ,I I , , 1 ,
I , , 1 1f---~--,-l _-I _-- \,-..., ---r-,L-r I, 1 I,
--, 1L-~--:..-...,t----\~~I",,- ,,
72
71
Flight 12: 15 September 1996 Survey Track and Sightings
J. _

----'--,~ '- -------- ----------------------------------------
+
72
Beaufort Sea
,------ ---'/ : -----r-----I---~-- \I , I \ \r-~----~~-----l _-I _---\'I ,-..., -- - - r
L_ I \ \, I 1_-. I ' \, \:,.:...----f -:,
\ " \\\
71
LEGEND
70
--+ffi ~--+"'---+,---,.+_ ':R - ---+-+--'_+----+1_--+_,
'<t NL() L() g ~
• Bowhead Whale ~ Ringed Seal
"" Belukha Whale () Pacific Walrus
40 0 Alaska
DemarcationPt.
~ 69~::;)
I --+--~
; ~ ~~ ~
.•• Unidentified Cetacean • Unidentitied Pinniped
• Bearded Seal
Flight 13: 16 September 1996 Survey Track and Sightings

40 0 Alaska 69
CD, I~co
73
Beaufort Sea
,----- --~, I-----r---~-~~--I-- \, I / I' I, '. \
I / I I,. 1to - '- -, ,'L I I' \ .,. " -'--r.,.-.-----I _---I /- -, , - - - - - r '
L _ I 1 1/1 1 \---, 1/ L_I· ,l'1- ---,'1---- 1 - . \
"-'....-~ \\
71
72
LEGEND
• BowheadWhale ~ Ringed Seal
I:>.BelukhaWhale 0 Pac~icWalrus
••• Unidentifiedcetacean • Unident~iedPinniped
• Bearded Seal
Flight 14: 18 September 1996 Survey Track and Sightings

--~--- ---~------------------~--------------------
73
Beaufort Sea
OJI..•.
co
~------ --~I ----,-------.----,-- .\J I I II \I I I I I . I
t-----_~------I I. _---\I ,- ..., .: - - - - - r-L _ . I I \
. 'I I rI I ~ __ --~
\\\LEGEND
• Bowhead Whale ~ R.inged Seal
/; Belukha Whale () Pacific Walrus
72
71
70
40 0
HerschelIs.
~-< ~~Ii'':)\0
I
I
69
DemarcationPt..•• Unidentified Cetacean • Unidentitled Pinniped
• Bearded Seal 'S<' Polar Bear Alaska
NIS)
Flight 15: 19 September 1996 Survey Track and Sightings

----_. __ ._~_ .._---------------------------
Beaufort Sea
(---~~-- . --~I ---,-----~~--I-- \
J I , I I \I I , I" I I
r~---·~-~----~-l' _---\I ,- -, .,...- - - - 17 ., L _I I I \, - -, I I \
I ----t-----1I I \
Q.£---"--c.jt:::;::::~~' \
\
, ---.. '::--I
Bay Colville OliktokDelta Pl
,--------------, NuiqsutLEGEND
• Bowhead Whale ~ Ringed seal
Alaska
6 Belukha Whale 0 Pacific Walrus
• Unidentified Cetacean • Unidentdied Pinniped
• Bearded Seal
o
72
71
70
HerschelIs.
et!i
I~\0I,
69
Flight 16: 20 September 1996 Survey Track and Sightings
l 1III

--------.,--- -
00I/)
COI/) '<t ~.•.. I/) N 0 NI/)
I/) ~ ~ ~ '<tr
Beaufort Sea
IrI
--- --- -- ~I -----,-----"...----,--- \I I I I ' \II I \ \,------~------I \'----\I I ..., -----t-
L ' I \I I \ \I -I \ ----11----; I
'""'-~~---........ \\
/
HarrisoBay Colville
Delta Pt.Nuiqsut,--------~-----
Alaska
LEGEND FlaxmanIs.• Bowhead Whale 9- Ringed Seal
10, Belukha Whale () Pacific INalrus
• Unidentified Cetacean • Unldentjtied Pinniped
• Bearded Seal ~ Polar Bear
40 0--'--------'------------_.
---- --+-- .-. --+--+----+-- - I'<t NI/) I/) o
I/)
Flight 17: 20 September 1996 Survey Track and Sightings
·72
HerschelIs.
c:(
~I ~,
\(.)I
\
71
70
69

(0ll)•..
;, •..
I73
',- -..;. -..;. ---,, IIIr---I
aiI
~, Smith Bay
LEGEND
• BO'Mlead Whale ~ Ringed Seal
/; Belukha Whale 0 Pacific Walrus
••• Unidentified Cetacean • Unidenl~ied Pinniped
• Bearded Seal
40 0--
Beaufort Sea
72---',----- ....---,-- \I I \ \I 1\ \
~r-;I --c---~----\, \
I I \\I t- --11---- --',
~~,'\"...I ,\
70
71
Alaska
HerschelIs.
c(
~ ~ 69~
I~:;) \0I,
~~; •..o
ll)
Flight 18: 22 September 1996 Survey Track and Sightings

eoIII
coIII
oIII
Beaufort Sea
LEGEND
--- -,---- - - - - r - - - - - -r- - - -,~""':' - -..,\I , I \ \I , I .\ \
r - - - - - -,l--,- - -'- -L ~-- - ~- - --\L _ I .~\
" I I \ \, - -, \
~---t-----l\ \
\\
• BowheadWhale ~ Ringed Seal
FlaxmanIs.
6 BelukhaWhale .0 PacifioW"lrus
.•• UnidentifiedCetacean • Uniden@lld Pinniped
• BeardedSeal '51:'Polar Bear
40
HerschelIs.
.c(
!i, ~,\0,\
-'--~----f----+----+---+-+--1------l~-J.---+:---~-+--'--:·+I·-+-
Alaskao 40 Kilometers
(approx.)
I~
I~
I;o
III.•..
Flight 19: 23 September 1996 Survey Track and Sightings
72
71
70
69

LEGEND
• Bowhead Whale ~ Ringed Seal
70
;..•.. ~.•...
72
Beaufort Sea
II
71
• Bearded Seal
· 40 0
~ Polar Bear
40 Kilometers
(approx.)
CamdenBay
DemarcationPt.
HerschelIs.
0(,
~ ~ 69~
I~;:) 10I,+-
~~
I!. Belukha Whale () Pacific Walrus
•• Unidentified Cetacean • UnidenUied Pinniped
Alaska
L- _
I _.....J-+~. -t---r
;
Flight 20: 24 September 1996 Survey Track and Sightings

---"--~----~
eoIII
COIII
~ ~N0 NIIIIII ~ ~ ~ '<t •..•.. 73
---~--I-----~---I-- \I \ \ \I \ \ \
- __ L 1 \ \r------, _------I-~_ 1----' '"\:I 1_ ..., \. \ \
C~ I \Halkett L -I l
~ -----~----\Harriso_ '~""";~-< I 'Bay Colville \ \
Delta \
\
40 0 40 Kilometers..--. 3 (approx.)
------,.-_._--------------- _._-j
f8 ~----+-'--+-_-..L~ '<t ,..---+---+------I+--r-I ;+_--+---+~-"1~
: ~ &:J g ~ ~
LEGEND
• BowheadWhale ~ Ringed Seal
I;; BelukhaWhale 0 Pacific Walrus
• UnidentifiedCetacean • UnidentrtiedPinniped
• BeardedSeal ~ Polar Bear
Beaufort Sea
72
71
70
FlaxmanIs.
Alaska
HerschelIs.
«~ 69
I ~; .
\0I
\
N ~'<t
I~
Flight 21: 26 September 1996 Survey Track and Sightings

,,--------------------------------------------------~---~
coII).•...
~.•...I
Beaufort Sea
,-------- '--""I ---,-----~~--~-- \- , I I I \ \
, I I I \ \r---- I \ \-- ----I --I -----,--
I \ \---, I \ \
L - L - r--- -1I I \
~.-.-'>(]'~ \
Deadhorse\
Smith Bay
HarrisoBay Colville
~ . Delta PlNuiqsut
Alaska
LEGEND
• Bowt1ead Whale ~ Ringed Seal
t; Belukha Whale () Pacific Walrus'Demarcation Herschel
Pt. Is.ea:
<t ic4l~='\0
I
\
•• Unidentified Cetacean • UnidentWied Pinniped
• Bearded Seal ~ Polar Bear
40 0
NII).•...
Flight 22: 27 September 1996 Survey Track and Sightings
71
70
69

HerschelIs.
.:(
!i 69I~\0I\
~~
;
coII)
73
Beaufort Sea
-- -- -------,-----.---:---, \I \ \
I I \ \~-----~I \ ----\I -, ------r-I L -I I \ \
---, I \ \L-L __ --r----l
I \ \..••••...j..---..;.>t. \
Deadhorse\
III,----
HarrisoBay Colville
Delta Pt.,--------------, Nuiqsut
LEGEND
• Bowhead Whale ~ Ringed Seal
/; Belukha Whale () Pacific Walrus
•• Unidentified Cetacean • Unident~ied Pinniped
• Bearded Seal Alaska
Flight 23: 27 September 1996 Survey Track and Sightings
72
71
70

OJI
N00
Beaufort Sea
'72II
71
/ \I / Ir-- ~ 1---- ---'---\I /-..., --
L_ 1
/ 1- -, I/ L_I
70
69
Flight 24: 28 September 1996 Survey Track and Sightings

roI
'"co
NI/'l
Beaufort Sea
II
Alaska 69
71
70
• BowheadWhale ~ Ringed seal
HerschelIs:" .
4:~ ~en. I ~:),
='\0I
\
LEGEND
/:,. BelukhaWhale 0 Pacific Walrus DemarcationPt..•• UnidentifiedCetacean • Unidentfied Pinniped
• BeardedSeal ~ Polar Bear
40 0 40 Kilometers.......•. =:s (approx.)
~ I + l- i-+- - 'Si!~ ~ ; ~-
--------+--<0 +----+-----+-----.L~ ''''" ....•.-- +-;-~+----+-,--I/'l f(l f5
Flight 25: 29 September 1996 Survey Track and Sightings

Beaufort Sea
,-- -- -- -- --- • < -- ~
~--_ _~_-- iI -r-----~7- I \, I,mI(,.)o
, I I \I " I I It - - - ~ - -~ - __ ---'--'--11 ~ \I ,-.., ,
, L _I 1 I \I 'I \
I L-~~~r----~,] , '\
r~'b..1 \
\LEGEND
Alaska
FlaxmanIs.• Bowhead Whale .Camden
Bay DemarcationPI.
9 Ringed Seal
() Pacific Walrus!:>. Belukha Whale
••• Unidentified Cetacean
• Bearded Seal
40 o
72
71
70
69
Flight 26: 30 September 1996 Survey Track and Sightings

IIII
W...•.
00LO~ ~ a
---+--+---+--+-+--+--.-...-LO--J. __l-+~~~+---+------1I----+--+--r-1
Beaufort Sea
,---,I
--....,-r-----~---~-- \I I \ \I I \ \
--~------I \ ----\,-..., -----, .
JrY~;:+-~_-+---·~.L - I I \ \-..., I \ \
I L-L __ --t-----1I ' \
~~I \\
..•.•.
LEGEND
Alaska
• Bowhead Whale ~ Ringed Seal
!; Belukha Whale ~ Pacific Walrus
.•. Unidenl~ied Cetacean • Unidentitied Pinniped
DemarcationPt.
• Bearded Seal
40 0
NLO
Flight 27: 1 October 1996 Survey Track and Sightings
72
71
70
69

HerschelIs.
«~ ~ 69~
I~~ \0I
\+~
NII)
~.•...
Beaufort Sea
,---,, ; .-,----r-----~---~--- \, I , \, I, ,
--f-------l: _-' _---\,-.., - -...,... t-L _I I· ,
, '-..., I I 'L-L __ --t-----i
I I '~---';<L. \
\
OJI
WI\) Smith Bay
LEGEND
• Bowhead Whale ~ Ringed Seal
t> Belukha Whale 0 Pacific WalrusDemarcation
Pt,
40 0Alaska
.•• Unidentified Cetacean • Unident~ied Pinniped
• Bearded Seal ~ Polar Bear-----------------coII)•...
oII)•...
Flight 28: 2 October 1996 Survey Track and Sightings
71
70

71
Peart!Bay
OJI
WW
70
69
---------_.~
73
Beaufort Sea
---\- \---- ----.- \------,-- I I/ ' I I \ \I, \I I I I __ -r---c.., __~--- L----r-- \'
,-.., I \ \..I , L-1
I \ __ -~I L-~~-r-, '\
I ;\ \
\
71
- ...,
DeadhorseFlaxman
Is.
o69
LEGEND
• BOwhead Whale
t; Belukha Whale
••• Unidentified Cetacean
CamdenBay
~ Ringed Seal
() Pacific Walrus
• Unidentfied Pinniped
DemarcationPt.
• Bearded Seal Alaska
NIIIT""
b 1996 Survey Track and SightingsFlight 29: 4 Octo ..er

Alaska 69
OJI
to)~
oIt)~
.-------t--.+- __+ ----+-+---If--+---I--+--r-
Beaufort Sea .:-
72,---,, --...,---r---~-~---~-- \I I \ \II \ \
-- -~-"- - - --L__- - ~- - ~-\I~J-+----'""!I~." _ I I \ \
I -..., I \ \L_I - --1\----t--· I
~~h \
\
71
LEGEND
• Bowhead Whale ~ ,Ringed Seal
6 Belukha Whale 0 Pacific Walrus
.•• Unidentified Cetacean • UnidenMied Pinniped
• Bearded Seal
40 0---oIt)
Flight 30: 5 October 1996 Survey Track and Sightings

OJI
(,.)
0'1
,----~-------
Smith Bay
Beaufort Sea
II , II I I,.- - - - - -~- - - - --I
I ,-...,,L_1
I, ---,
HarrisoBay Colville
Delta Pt.r-----------~ Nuiqsut
LEGEND
• Bowhead Whale ~ Ringed Seal
t> Belukha Whale ~ Pac~ic Walrus
•. Unidentified Cetacean • Unident~ied Pinniped
• Bearded Seal
40 0
eol()
HerschelIs.
«~ 69
I~
\0I
\I +-
~; IiJ
Alaska
Flight 31: 6 October 1996 Survey Track and Sightings
71
70

HerschelIs.
4:~ 69
I~\0I,
I -~
; ~
oIt)
Beaufort Sea
II
mI
Co)m
,I ,t >>: f-'---
" -'--I ',-...,
, L,
I \ \I \ \I . \
--I \j----r----\\-..., I \ \
L-L __ --t-----11 - \
~\ \\
DeadhorseLEGEND
Alaska
• Bowhead Whale ~ Ringed Seal
o Pacific Walrus
Camden"Bay/; Belukha Whale
'" Unidentified Cetacean • Unidentfied Pinniped
• Bearded Seal
40 0
-+------1.. --L--r--------r-------+------+-_~~~~~-_+_-_+_---+--,;1; N
••• It), •.. o
It)
Flight 32: 7 October 1996 Survey Track and Sightings
70

,---,, --- ----,---,-----~---I-- \, I .\ \, 1 \ \
__ I·· I \ \r------I ----r :: -----,
L _ I \ \, I I· ; \-...., \
L-L -t-----11 I' \
~'---..h. \Deadhorse
\
~. Harriso
Bay ColvilleDelta Pl
----.------- NuiqsutLEGEND
Alaska
• Bowhead Whale * Ringed Seal
t; Belukha Whale () Pacific Walrus
•• Unidentified Cetacean • Unident~ied Pinniped
• Bearded Seal 'S<' Polar Bear
40 0
Flight 33: 7 October 1996 Survey Track and Sightings
'----------------------~--------------------------------------------
72
71
70
69

coI/)
(l)l() v ij!l() N
0 ~l() ~ ~ ~~ I/)
-+---+--+-+--+ ~ ~ ~- I I I
Beaufort Sea".I
OJI
Wco
. . . ,-- ~ ---,~---r-----~~--~--\I 1 \ \I I \. \
------1, . \ ----\I .., -----r-I L_1 I \ \I - --. ,I \ \
L -,L -t-- - - --,I \' \
~---.,;;~ \\LEGEND
• BowheadWhale ~ Ringed seal
tJ. Belukha Whale '0 Pacific Walrus
40 0"Alaska
•• UnidentifiedCetacean • Unident~iedPinniped
• Bearded Seal
oI/)~
Flight 34: 9 October 1996 Survey Track and Sightings
72
71
70
69

•
ACAEWCANOVA
BLMBPXA
CCI
e.g.EISELTESA
FMSFR
GPS
hr
i.e.
km
mMDCMMS
nNOAANOSNOSCNMFSnmNSB
OASOCSOCSLA
P
RDSS
SDSPUE
T
USCUSDOCUSDODUSDOIUTM
WPUE
GLOSSARY OF ABBREVIATIONS, ACRONYMS, AND INITIALISMS
alternating currentAlaska Eskimo Whaling Commissionanalysis of variance
Bureau of Land ManagementBP Exploration (Alaska) Inc.
Celsiusconfidence interval
for exampleEnvironmental Impact Statementemergency locator transmitterEndangered Species Act
Flight Management SystemFederal Register
Global Positioning System
hour
that is
kilometer
meterMobile Datacom CorporationMinerals Management Service
sample sizeNational Oceanic and Atmospheric AdministrationNotice of SaleNaval Ocean Systems CenterNational Marine Fisheries Servicenautical mileNorth Slope Borough
Office of Aircraft ServicesOuter Continental ShelfOuter Continental Shelf Lands Act
probability
Radio Determination Satellite System
standard deviation ..".sightings per unit effort (number of whale sightings counted per hour)
true heading
U.S. CodeU.S. Department of CommerceU.S. Department of DefenseU.S. Department of the InteriorUniversal Transverse Mercator
whales per unit effort (number of whales counted per hour); relative abundance

:'"
The Department of the Interior.Mission
As the Nation's principal conservation agency, the Department of the Interior has responsibility formost of our nationally owned public lands and natural resources. This includes fostering sound useof our land and water resources; protecting our fish, wildlife, and biological diversity; preserving theenvironmental and cultural values of our national parks and historical places;and providing for the enjoyment of life through outdoor recreation. The Department assesses ourenergy and mineral resources and works to ensure that their development is in the best interests ofall our people by encouraging stewardship and citizen participation in their care. The Departmentalso has a major responsibility for American Indian reservation communities and for people who livein island territories under U.S. administration.
The Minerals Management Service Mission
As a bureau of the Department of the Interior, the Minerals Management Service's (MMS) primaryresponsibilities are to manage the mineral resources located on the Nation's Outer Continental Shelf(OCS), collect revenue from the Federal OCS and onshore Federal and Indian lands, and distributethose revenues.
Moreover, in working to meet its responsibilities, the Offshore Minerals Management Programadministers the OCS competitive leasing program and oversees the safe and environmentally soundexploration and production of our Nation's offshore natural gas, oil and other mineral resources. TheMMS Royalty Management Program meets its responsibilities by ensuring the efficient, timely andaccurate collection and disbursement of revenue from mineral leasing and production due to Indiantribes and allottees, States and the U.S. Treasury.
The MMS strives to fulfill its responsibilities through the general guiding principles of: (1) beingresponsive to the public's concerns and interests by maintaining a dialogue with all potentially affectedparties and (2) carrying out its programs with an emphasis on working to enhance the quality of life forall Americans by lending MMS assistance and expertise to economic development and environmentalprotection.